Submitted:
03 April 2024
Posted:
04 April 2024
You are already at the latest version
Abstract
Across decades of contemporary discussion on sustainable development, a core debate has concerned the relationship between the economic, social, and environmental dimensions of sustainability. In recent years, a debate on economic growth versus degrowth has been going on discussing whether economic growth can be sustainable in environmental terms and whether economic degrowth can be sustainable in social terms. This conceptual and theoretical article has used the Sustainability Window, or ‘SuWi’ method, to theoretically determine the sustainable window of economies, as upper and lower bounds of future change in GDP, that could be deemed in line with environmental and social sustainability. All theoretically possible scenario paths of development are considered by combining the economic, environmental, and social dimensions, with the environmental and social productivities of GDP. In moving to sustainability analysis through SuWi it is noted that only four of the logically possible scenario paths could be considered theoretically 'sustainable’, and only if adhering to strict conditions. Two of the hypothesised scenarios involve economic growth and two of economic degrowth. The approach, including calculation formulas, has many potential uses in providing analysis and support to 21st century sustainability policymaking, including the United Nations Sustainable Development Goals.
Keywords:
sustainable development
; Brundtland Commission
; economic growth
; degrowth
; scenarios
1. Introduction
Across forty years of evolution in thinking on sustainable development, the debate on the place of growth has been central [1,2,3]. While economic growth can be linked to improvements in welfare, and poverty alleviation, it is now broadly accepted that it is also a mega-driver of global climate change and ecological breakdown [4,5,6] and drives problems of equity and growing in-country inequality [7,8,9,10]. The question of how to achieve sustainable development in the 21st century continues to be accompanied by disagreement on the role of economic growth, including the growth-degrowth debate [11,12], prospects for green growth [13], limits to growth [14], and questions on the implications of productivity growth [15].
There is a broad scientific literature focusing on economic growth and economic development issues, especially in the field of development studies and research (see e.g., [16,17,18,19,20,21]. Economic growth and economic development are two related but distinct concepts that measure the performance and progress of a country or region. Here referring to this broad scientific discussion, key differences between these two central concepts can be identified: (1) Economic growth refers to the change in the amount of goods and services produced in a given period of time, while economic development refers to the improvement of human well-being of the population in terms of health, politics, social or any other relevant specific socio-cultural areas of social systems. (2) Economic growth is usually measured by real gross domestic product (GDP), which is the value of goods and services produced by the national economy at constant prices (PPP). Many empirical studies rely on this indicator. (3) On the other hand, economic development is often measured by human development (HDI), which is a key statistical indicator that takes into account life expectancy, education level and purchasing power parity income per capita. (4) Economic growth is one of the components of economic development, but it is neither the only nor necessarily the most important one. Nowadays, the happiness of the population can also be measured and given importance. (5) Economic development also requires other socio-cultural factors, such as political stability, rule of law, low level of corruption, environmental protection, equality, human rights and cultural diversity [22,23,24,25].
To sum up, economic growth can in some cases also be an obstacle to economic development, if it causes, for example, environmental degradation, natural resource depletion, inequality increase, social unrest or cultural identity loss. Economic development seeks to find a balance between economic growth and other material substances (see e.g. [26,27,28].
The original idea of sustainable development, proposed by the Brundtland Commission´s report “Our Common Future”, was of three ‘pillars’: economy, environment, and society [29,30]. Scientometric reviews of global research on sustainability and sustainable development reveal that the Brundtland report has been an important and very impactful report for global sustainability research [31,32,33,34]. Several research traditions based on the Brundtland Report research tradition use different indicators to analyse the dimensions of sustainability [35,36,37]. For instance, Holden et al. [35] suggest using four main composite indicators (ecological footprint, Human Development Index (HDI), Gini coefficient, and share of renewable energy) to cover the four dimensions of sustainability: (i) safeguarding long-term ecological sustainability, (ii) satisfying basic human needs, and promoting (iii) intragenerational equity and (iv) intergenerational equity.
Figure 1 illustrates the ubiquitous three intersecting circles of sustainability, and common alternative depictions from Purvis et al. [38]. This article discusses the interpretation of sustainable development over time in terms of economic growth, social development and ecological sustainability.
Sustainability has diverse origins from the 17th century onwards [39], yet the modern concept, that arrived in the mainstream in the 1980s, emerged from The Club of Rome’s ‘Limits to Growth’ [40]. This world systems scenario study was criticised by many economists as the simulation did not include a price mechanism, the primary signalling mechanism for consumer behaviour [41,42,43]. Many economists, political scientists, ecologists, and scientists started thinking about optimal growth paths and how to provide for the growing human population, in a world that had limited empirical analysis of global systems at the time. This branch of literature extended to scarcity, overpopulation, and environmental degradation [27,44,45,46,47,48]. Yet, in line with the Brundtland definition of sustainable development [29], economic growth has continued to persist centrally in debates. A conventional taxonomy of possibilities for growth could be presented as (1) there must be continued economic growth, (2) there cannot be economic growth beyond a certain limit and (3) economic growth must decline, as limits have already been exceeded. While the former assumes that economic growth is necessary for social development, and can be ecologically sustainable, the latter two characterisations broadly conclude that growth is neither necessary for social development, nor can it be environmentally sustainable.
A range of economists and system theory scholars have contributed to these discussions. In the economics literature, the first approach, there must be growth, was articulated in the Brundtland Commission report, and the neoclassical approach to sustainable development was found primarily in the writings of Robert Solow [49] and Joseph Stiglitz [50]. Endogenous growth theory also has a sustainable growth model [51,52], related to Solow-Stiglitz thinking. Herman Daly was critical of this approach, noting that there cannot be economic growth beyond a certain limit, or there cannot be economic growth [53,54,55,56,57,58]. The third approach, economic growth must decline, as limits have already been exceeded, was linked to the de-growth movement led by Joan Martinez-Alier [2,19,43,59,60,61,62,63] and Serge Latouche [64,65]. The work of Nicholas Georgescu-Roegen [66] on entropy and economics is fundamental to this strand, as a key contributor to steady-state and degrowth economics.
In seeking to understand the relationship of growth to pollution, the Environmental Kuznets Curve (EKC) by Grossman and Krueger [67] has been a dominant approach among economists. However, results are dependent on the pollutant, and on other factors, with questions over robustness [68]. In line with recognising the need to explore other drivers, including structural and intensity effects, attention shifted to further disaggregation. The IPAT and Kaya identities have been important in sustainability evaluation by deepening an understanding of the driving forces of environmental problems, including the role of economic growth. The IPAT identity [69,70,71] defines major reasons for the global environmental impact (I): population (P), affluence (A), and technology (T). The Kaya identity identifies the major drives of carbon dioxide emissions, i.e. population, GDP per capita, the energy intensity of the economy, and carbon intensity of the energy mix [72]. Decades of decomposition analysis studies have deepened knowledge of these drivers, including of activity, structure, and intensity effects [73]. These have emphasised how increased affluence has been driving resource consumption and related emissions, and the necessity to decouple the impact of affluence through structural and technological factors. While sustainability analysis can be performed on a single dimension, it has been noted that this approach fails to comprehensively address all three dimensions of sustainability [74,75]. Complex problems, relating to the nexus of unsustainable environmental and socio-economic development, require robust research methods that facilitate holistic analysis. The Sustainability Window analysis proposed by Luukkanen et al. [48,74,76] facilitates such integrated analysis of change in the different sustainability dimensions over time in a coherent, comprehensive, and operationalisable framework. Our research seeks to clarify the problem and theoretical challenge posed by Dutch economist Roefie Hueting [77] regarding conflicting goals in the sustainable development process.
The purpose of this paper is not to present a comprehensive literature review on sustainable development research. We only refer to useful review articles on the issue of sustainable development and sustainability research including critical assessments such as [78,79,80,81,82].
Sustainability Window (SuWi) provides an integrated assessment of complex multi-dimensional sustainability problems, by determining the maximum economic growth -to avoid negative change in the environmental condition of a selected environmental indicator- and the minimum economic growth -to achieve positive social development of a selected social indicator-. These maximum and minimum levels of economic growth define the Sustainability Window and can be specified in either relative or absolute form, depending on necessity. The approach provides a general platform for building sustainability science as an evolving academic discipline, which can point the way to sustainable development paths, by addressing challenges that existing approaches have not yet fully addressed. This can include the UN Sustainable Development Goals (SDGs) and contradictions noted therein concerning economic growth, as emphasised by Hickel [83]. While acknowledging the complexity of theoretical discussion in the article, in conceiving all possible paths, and all theoretically relevant sustainability criteria, in application, the analytical structure of SuWi can support ease of use for analysts and ease of understanding for policymakers. SuWi permits interdisciplinary integrated assessment, and stringent critique of policy and future scenarios and forecasts, once selected environmental and social criteria can be defended.
Cognisant of decades of debate on the role and impact of economic growth, this article seeks to determine the sustainability window, as the theoretical upper and lower bounds of economic growth that could deliver social and environmental sustainability. The article considers all theoretically conceivable combinations in section 2, this allows all logically possible combinations to be identified, also in section 2. From the latter, section 3 identifies those combinations that could be considered socially and environmentally sustainable, from both possible paths and absolute targets. This process of elimination allows the article to focus on the theoretical place of economic growth, in a general theory of sustainable development.
2. Materials and Methods
This Section first describes the conseptualisation of the Sustainability Window (SuWi). The SuWi approach can be utilised for analysing different dimensions of sustainability, both generalised and specific. The 17 dimensions of the UN Sustainable Development Goals could be used in the analysis, if suitable data is available, or it can be limited to a narrower field of study. Often sustainability is analysed in three dimensions, economic, environmental and social, but these dimensions can consist of numerous sub-categories. For the clarity of the analysis, we present the cases here using three dimensions, but the SuWi method itself does not limit the use of different aspects of development. In all cases, environmental and social dimensions are analysed pairwise with GDP and then combined to produce the sustainability window of GDP, to identify minimum and maximum economic growth. The intergenerational equity emphasised by the Brundtland Commission [29] and explicitly suggested as a fourth dimension of sustainability by Holden et al. [35] can be involved by using the dynamic SuWi approach [74,76] which allows the analysis of changes and trends over time – even over generations – in the width of the Sustainability Window and construction of related future scenarios.
The innovation of the SuWi approach is that it provides a means to analyse development in three dimensions simultaneously. In SuWi, quantitative indicators describe the change in these three different dimensions. For the environmental dimension, indicators can be selected that track changes in environmental vectors or the state of the environment. This can include indicators such as greenhouse gas emissions, land-use change, biodiversity, water quality or chemical pollution. The increase in the value of the environmental indicator means that environmental pressure is increasing, indicating an undesirable direction of development. For the social dimension, indicators that track social processes and outcomes can be used, such as education, income, gender equality, social equity, unemployment, health, life expectancy, governance, democracy, food and water availability, or sanitation. An increase in the value of the social indicator means that social welfare is improving, also indicating a desirable direction of development. In SuWi, the economic dimension is typically described by GDP, specifically to understand the implications of economic growth paths. It is widely acknowledged that GDP, as an indicator of economic production, provides a poor proxy for human well-being, or indeed sustainability [3,76,84,85]. However, in this context, using GDP allows economic output to be separated from social and environmental dimensions, toward deliberate analysis and critique of economic growth paths themselves. To determine the ’sustainability window,’ the analysis combines two different two-dimensional frameworks: first, development in environmental stress and economic output, and second, changes in the dimensions of social welfare and economic output. Combining these two frameworks facilitates the description of sustainability amongst all three dimensions. Because there is no general indicator describing environmental stress different indicators could be used for it. Similarly, there is no general indicator for social welfare, and different indicators could be used for it. Several different indicator combinations should be used in the analyses in order to get a multifaceted view of sustainability.
In this article we use the concepts of weak and strong sustainability in the following way: ‘Weak sustainability’ means that the intensity of environmental stress (Environmental stress / GDP) does not increase while ‘Strong sustainability’ means that the environmental stress does not increase.
In this section, strong sustainability concerns an absolute reduction in environmental stress from a base year value, and stasis or an absolute increase in social welfare. The strong sustainability window can then be either economic growth or degrowth, where the maximum economic growth, GDPmax, avoids increasing environmental stress, and the minimum economic growth GDPmin avoids a decrease in social welfare. This section addresses the cases of both economic growth and degrowth to clarify the different possibilities for sustainable development, in the context of economic growth. The rationale is advanced first in a narrative form, and illustrated graphically, to explain the theoretical combination of growth paths with possible levels of environmental stress, and social welfare. To explore the different possible system relationships, of changes in productivity, the narrative discusses changes in environmental stress productivity and of social welfare productivity. Environmental stress productivity is defined as environmental stress divided by GDP, and social welfare productivity as social welfare divided by GDP, both for a given year and a selected environmental or social indicator. While defining absolute or productivity changes necessarily defines the related absolute or productivity indicators, the narrative form moves pairwise through different subsets of absolute and productivity indicators, thus allowing all possible cases to be theoretically explored.
Through the combinations of these theoretical outcomes, all possible scenario paths of development are explored, and this enables the Sustainability Window, or ‘SuWi’, to be determined. To facilitate this theoretical discussion, of all possible combinations, the first part of the results, section 3, considers relative changes in environmental and social welfare outcomes, in the context of economic growth and degrowth. Relative change here means a change from the base year value. However, it is also recognised, that to move from a grounding that could be described as ‘theoretically possible’, to ‘theoretically sustainable’, relative change by improving productivity will often not be sufficient. In many cases, for environmental indicators, such as a change in greenhouse gases, absolute limits and reductions are necessary for sustainability (even though the Paris Agreement states “To limit global warming to 1.5°C, greenhouse gas emissions must peak before 2025 at the latest and decline 43% by 2030” setting a relative target). In other cases, for social welfare, an absolute increase may be required, such as in cases requiring poverty reduction and elimination. To move from relative change to absolute change, in line with a specified target, section 3 combines target levels in the narrative explanation and related graphical presentations. Section 3, therefore contributes to moving from outcomes that are defined more by covering the theoretically possible window -of all possible development paths to the sustainability window of economic growth, as the actual requirements of what could be considered real-world sustainability for change in an economy. Where a ‘development path,’ as a broad multidimensional representation of how a nation or region develops, across multiple drivers [86], is simplified as quantitative economic, environmental and social dimensions, including the macro-environmental and social productivities of systems.
The SuWi approach is first demonstrated with an example case and then widened to include all possible development paths. Figure 2 illustrates an example of development in environmental and economic dimensions. The indicators for economic output (GDP) and environmental stress (Env) are indexed to have a value of 1 in the base year, indicated with point A, and having values GDP0 and Env0, on the x and y-axis. Point A determines the base year environmental stress productivity, defined as the amount of environmental stress produced per unit of economic output, with both measured by indexed indicators, of GDP, with line r1=Env0/GDP0. In this case, an indicative final point of development is denoted by point E, which has the values GDP1 and Env1. The improved environmental stress productivity of GDP is expressed with line r2=Env1/GDP1. (Env1/GDP1 < Env0/GDP0). However, if we assume the criterion for environmental sustainability is that environmental stress should not increase, and ceteris paribus condition for environmental stress productivity r2, then the maximum sustainable economic output, in this case, is indicated by point B and has the value GDPmax. Determining that environmental stress must not increase, where the improvement in environmental stress productivity is limited, demands that sustainable GDP growth is limited.
An example to determine the minimum economic output, concerning social welfare development (Soc), is shown in Figure 3. The indicators for economic output and social welfare are again indexed to have the value 1 in the base year, and have values GDP0 and Soc0, on the x and y-axis. Point A determines the social welfare productivity of GDP, how much social welfare is produced per unit of GDP, with line r1=Soc0/GDP0 which has the same value as in Figure 2 (indexed starting point). A final point of development is indicated with point S, having values GDP1 and Soc1. At this point, the social welfare productivity of GDP is expressed with line r3=Soc1/GDP1. In this case, the criterion for social sustainability is that social welfare should not decrease. Using the ceteris paribus condition for social welfare productivity r3, the minimum sustainable economic output is indicated with point C, having the value GDPmin. The decreasing welfare productivity r3 (Soc1/ GDP1 < Soc0/ GDP0) defines a minimum GDP value, that is higher than the base year value in order not to decrease social welfare, but lower than the actual GDP1 value.
When these cases of environmental and social sustainability are combined, from Figure 2 and Figure 3, we can determine the Sustainability Window with the minimum economic output (to preserve welfare) and maximum (to avoid increasing environmental stress), as illustrated in Figure 4. The maximum sustainable economic output, GDPmax, is defined with the productivity line r2=Env1/GDP1 (environmental stress productivity point E) to be at point B, and the minimum sustainable economic output, GDPmin, is defined with the social welfare productivity line r3=Soc1/GDP1 (defined by point S) to be at the point C. In this case, the real GDP growth is too high (GDP1 is higher than GDPmax), and the sustainability criteria defined by the Sustainability Window (GDPmin < GDP1 < GDPmax) are not satisfied. If welfare is to be maintained, and environmental stress not increased, then the economic Sustainability Window, SuWi, requires an outcome GDPmin < GDP1 < GDPmax.
The illustrated case shows an example where environmental stress is increasing while environmental stress productivity is decreasing and social welfare is increasing with decreasing social welfare productivity. Next, a case of decreasing environmental stress, and stress productivity, is combined with increasing social welfare, increasing GDP, and decreasing social welfare productivity.
Figure 5 illustrates this possible development path where the economic output is growing and the sustainability criteria are fulfilled. The starting point is A with environmental stress Env0 and GDP0 and the final point is E with environmental stress Env1 and GDP1. In this case, the environmental stress is decreasing (Env1 < Env0), and the environmental stress productivity is decreasing (r2 = Env1/ GDP1 < Env0/GDP0) determining the maximum economic output, GDPmax at point B not to increase environmental stress.
Figure 6 illustrates social welfare development in this case. The starting point is A and the final point is S. In this case the social welfare is increasing (Soc1 > Soc0), and social welfare productivity is decreasing (r3 = Soc1/GDP1 < Soc0/GDP0). The productivity line r3 determines the minimum economic output, GDPmin, at point C in order not to decrease social welfare.
The results from Figure 5 and Figure 6 are combined in Figure 7, to illustrate the Sustainability Window. In this case, the maximum economic output, GDPmax is higher than the actual GDP1 and the minimum economic output, GDPmin is lower than GDP1. This means that the development fulfills the sustainability criteria.
The case examples presented above show that with economic growth it is possible to achieve sustainable development, but only under specified conditions. The following Figure 8, Figure 9 and Figure 10 illustrate an economic degrowth case where the economy is decreasing (GDP1 < GDP0). In Figure 8, the starting point is A with environmental stress Env0 and GDP0. The environmental stress decreases to E with the value Env1 (Env1 < Env0). In Figure 8, the environmental stress level Env1 and GDP level GDP1 define the productivity line r2, decreasing environmental stress productivity (Env1/GDP1 < Env0/GDP0), which determines the potential maximum sustainable economic output, GDPmax in relation to environmental stress to be at point B.
In Figure 9, the starting point is A with social welfare at Soc0 and economic output at GDP0. At the final point S, the level of social welfare Soc1 and economic output GDP1 define the productivity line r3, in this case increasing social welfare productivity (Soc1/GDP1 > Soc0/GDP0), which determines the minimum sustainable economic output in relation to social welfare to be at point C.
To produce the sustainability window in an economic degrowth case, Figure 10 combines Figure 8 and Figure 9, as maximum and minimum GDP output, to define the Sustainability Window. In this case, the sustainability criteria are fulfilled since the actual GDP output (degrowth) is within the Sustainability Window (GDPmin < GDP1 < GDPmax). It can be noticed that the potential maximum sustainable economic output GDPmax is higher than the original GDP0 level, but the actual economic level of GDP1 shows a degrowth case.
The analyses of these case examples are widened in the Appendix A to illustrate all possible cases related to changes in environmental stress, environmental stress productivity, social welfare, social welfare productivity, and GDP. Based on the different combinations of these changes a table of all possible development paths, and their sustainability outcomes, are combined in Table 1, presented next in section 3.
3. Results
3.1. Possible Economic Growth Paths and Related Sustainability Outcomes
In this section, we illustrate different possible scenario paths depending on the possible direction, and relative size of changes in the five variables, environmental stress (Env), social welfare (Soc), GDP, and the environmental and social welfare productivities Env/GDP and Soc/GDP. In section 3.2, the Sustainability Window with absolute targets for environmental stress and social welfare is presented. Section 3.1 and 3.2 deal with strong sustainability in terms of absolute changes in the environmental stress and social welfare indicators, but the changes are, however, relative to the base year level which is not sustainable in absolute terms. With the SuWi approach, it is also possible to analyse weak sustainability if environmental stress intensity is used instead of environmental stress as the environmental indicator. For a detailed discussion of weak and strong sustainability, see [87].
Figure 4, Figure 7, and Figure 10 above illustrate that it is possible to have several different options for future development concerning sustainability, depending on changes in the analysed variables environmental stress (Env), social welfare (Soc), economic output (GDP), and the environmental stress productivity (Env/GDP) and social welfare productivity (Soc/GDP). Table 1 illustrates all the possible scenario paths related to the changes in these variables and the resultant sustainability of the development path. Appendix A includes the graphical presentations of the possible development paths indicated in the column “Reference” in Table 1.
Next, all theoretically possible development alternatives are identified for the future, by using the SuWi approach followed by the determination of the alternatives which can fulfil the criteria of both environmental and social sustainability. First, the relevant variables of economic output (GDP), social welfare (Soc), environmental stress (Env), social welfare productivity (Soc/GDP), and environmental stress productivity (Env/GDP) are considered. The value of each variable can change, either increase or decrease over time. In terms of all possible combinations that can be hypothesised, there are 2^5 = 32 different possible combinations of changes, as illustrated in Table 1.
Because the productivity indicators, Soc/GDP and Env/GDP, are not independent but depend on changes in GDP, Soc, and Env, all combinations are not in effect logically possible. For instance, when economic activity (GDP) increases and social welfare (Soc) decreases, then social welfare productivity (Soc/GDP) cannot increase. If GDP increases and environmental stress (Env) decreases, then environmental stress productivity (Env/GDP) cannot increase. Similarly, if GDP decreases and Soc or Env increases, then Soc/GDP or Env/GDP cannot decrease. For this reason, altogether 14 out of the 32 hypothesised combinations are logically impossible. These combinations are marked as “impossible” in Table 1. Among the remaining 18 logically possible combinations, six combinations can have two additional alternatives for the difference between the indexed values of environmental stress and social welfare. This difference, see the column titled Soc – Env in Table 1, is of great importance since it determines whether the Sustainability Window for the economic growth path is positive (GDPmax > GDPmin), or negative (GDPmax < GDPmin).
In Table 1, all 32 combinations of the five variables, the 18 logically possible ones and the 24 different Sustainability Window analyses of the possible scenario paths are presented (see Appendix A for the graphical presentations of the 24 identified scenario paths). The sustainable cases are shown in Figures 11a, b, c and d.
Figures 11a and 11b illustrate cases where the economic output (GDP) grows and Figures 11c and 11d illustrate cases where economic output decreases. In Figure 11a the welfare productivity (Soc1/GDP1 > Soc0/GDP0) increases and in Figure 11b welfare productivity decreases (Soc2/GDP2 < Soc0/GDP0). In both cases, environmental stress productivity decreases (Env1/GDP1 < Env0/GDP0). In Figure 11c social welfare productivity increases (Soc3/GDP3 > Soc0/GDP0) and environmental stress productivity increases, too (Env3/GDP3 < Env0/GDP0). In Figure 11d social welfare productivity increases (Soc4/GDP4 > Soc0/GDP0) and environmental stress productivity decreases (Env4/GDP4 < Env0/GDP0).
The sustainable maximum and minimum economic output can be calculated using the following equations:
from where do we get
and
from where do we get
where Env0 is environmental stress in the base year (measured with suitable indicator and indexed to 1),Env1 is environmental stress in the analysis year, Soc0 is social welfare in the base year (measured with suitable indicator and indexed to 1), Soc1 is social welfare in the analysis year, GDP0 is the economic output in the base year, GDP1 is the economic output in the analysis year, GDPmax is the maximum economic output in order not to increase environmental stress, and GDPmin is the minimum economic output not to decrease social welfare.
These equations are valid for all the cases. A criterion for a sustainable case is:
GDPmin < GDP1 < GDPmax
3.2. Analysis of Sustainability Windows with Absolute Targets
It is widely accepted that in the case of many environmental stress variables, such as greenhouse gas emissions and biodiversity loss, an absolute reduction target must be defined for environmental sustainability. In these cases, rather than requiring no increase in environmental stress, the cases are framed by the requirement to reach absolute reduction targets. This can also be necessary for social welfare, in line with equity. This section considers the Sustainability Window for cases of absolute targets. Figure 12 illustrates a case where there is an absolute target level for environmental stress. The preliminary state of the system is described with indexed levels of environmental stress Env0, social welfare Soc0 and economic output GDP0 at point A. The productivity levels are described as Soc0/GDP0 = Env0/GDP0 (indexed base year values).
If relative criteria for sustainability are used it means that the environmental stress should not increase and the social welfare should not decrease. In this case, social development could arrive at point S1, with social welfare at Soc1, environmental development at E1 with environmental stress at Env0, and economic output at level GDP1. In this case, the Sustainability window would be defined by SuWi1, where the minimum economic output is defined by GDPmin at point Smin (social welfare does not decrease from Soc0) and maximum economic output at point E1 with GDP1 (environmental stress does not increase from Env0). The described development fulfills the relative sustainability criteria.
However, adopting an absolute target for the environmental stress, defined with Envtarget, we have to lower the economic output to reach the point Et when environmental stress productivity is Env1/GDP1 = Envtarget/GDPmax. This defines the maximum economic output GDPmax. In this case, the minimum level of economic output is also determined by the point Smin at the level of GDPmin, where social welfare does not decrease. Now the Sustainability Window is SuWiEt, within which the maximum environmental stress level achieves Envtarget and the minimum social welfare level is Soc0 (at Smin). In this case, the maximum social welfare level is reduced from Soc1 to Soct, due to the environmental target criterion. In this type of development path, for economic output to be sustainable, the maximum economic output must be reduced and social welfare is reduced from Soc1 to Soct
This type of development, with an absolute environmental target, may enable both economic growth and degrowth to be sustainable. The economic degrowth possibility is the result of improved social welfare productivity (Soc1/GDP1 > Soc0/GDP0), illustrated in Figure 13. Here the minimum economic output is defined by GDPmin at point Smin, which is lower than GDP0. The Sustainability Window is determined by Smin (GDPmin) and Et, which defines the maximum GDP output, GDPmax in the same way as in Figure 12
Maximum GDP in the case where we have an environmental target can be calculated
from where we do get
Figure 14 illustrates a case where an absolute social welfare target is applied. The starting point is A, with social welfare at Soc0, Environmental stress at Env0 and economic output at GDP0. The productivity of environmental stress is assumed to decrease to Env1/GDP1 (at point E1) and the social welfare productivity to increase to Soc1/GDP1 (at point S1). Relative environmental sustainability (no increase in environmental stress) limits the maximum economic output to GDPmax at Et1. The absolute social welfare target determines the minimum economic output to be at the level of GDPmin at St, where the social target Soctarget is reached. Now GDPmin and GDPmax define the Sustainability Window.
Minimum GDP in the case, when we have a social welfare target (Figure 14) can be calculated
from where we do get
Beginning with a target for the level of social welfare allows the determination of the minimum economic output for SuWi accordingly, as shown in Figure 15, in different cases of social welfare productivity. The starting point here is again point A with Soc0 as the level of social welfare and the Sustainable welfare target is indicated with Soctarget. At this level, the minimum economic output depends on the social welfare productivity of GDP. The social welfare productivity Soc1/GDP1 defines the lowest minimum sustainable level of GDP to be GDP1. This indicates that the economic degrowth option is possible, even with an increased target level for social welfare, if the social welfare productivity is increasing
With the social welfare productivity level Soc2/GDP2, the minimum sustainable GDP, in relation to the sustainable target level of social welfare, must be higher than the original GDP level. With this type of change in welfare productivity, the economic degrowth option is not sustainable, even though welfare productivity is increasing, but the increased target level of social welfare cannot be reached with degrowth.
In the case of social welfare productivity level Soc3/GDP3, economic output must be higher than GDP3, to fulfil the social sustainability criterion. This shows that if social welfare productivity decreases, economic output has to be higher to reach a sustainable level of social welfare.
Figure 16 illustrates a case where there are targets for both reduced environmental stress and increased social welfare, in an economic degrowth situation. In this case, the environmental stress productivity can even increase (Envtarget/GDP1 > Env0/GDP0) when the social welfare productivity is increasing (Soctarget/GDP1 > Soc0/GDP0).
The efficiency gap can be defined as the lack of improvement in environmental efficiency, or social productivity, to reach a sustainability level. Figure 17 illustrates the case of the efficiency gap, where is assumed that the environmental stress productivity decreases from Env0/GDP0 to the level of Env1/GDP1. This is, however, not enough to reach relative environmental sustainability because the environmental stress is increasing alongside increasing GDP. The environmental stress productivity should be decreased to the level of r2 = Env0/GDP1 in order not to increase environmental stress if the GDP level is GDP1. The efficiency gap, in this case, is r1/r2 and this should be used to guide the policy planning process.
4. Discussion
Across the decades of contemporary thinking on sustainable development, a core debate has concerned whether economic growth can be made environmentally and socially sustainable. In more recent years, this has become a debate about economic growth versus degrowth, whether the former can be environmentally sustainable, and whether the latter can be socially sustainable [12]. This article has used the Sustainability Window, or ‘SuWi’ approach, to theoretically determine the sustainable window of economies, as upper and lower bounds of change in GDP, that could be deemed in line with environmental and social sustainability. All theoretically possible development paths have been considered, by combining first the economic, environmental and social variables, with the environmental and social productivities of GDP. The article demonstrates that of the 32 possible combinations of these five variables, 18 are logically possible.
In moving to sustainability analysis through SuWi it is noted that there are 24 logically possible development paths, and only four (4) of them could be considered sustainable under the assumed sustainability criteria (the value of a selected environmental indicator cannot increase, and the value of a selected social indicator cannot decrease). Two of these involve economic growth and two degrowth. In these cases, the sustainability of outcomes is predicated not just on the definition of sustainability, but on the emergence of specific paths in terms of absolute change in GDP and related productivities Once the environmental and social criteria are set, the development path must emerge according to clearly defined quantitative trends, if the economic outcome is to be defended as theoretically sustainable, from both environmental and social perspectives. In the two sustainable economic growth cases (increasing GDP) the social welfare productivity (Soc/GDP) can decrease, but the Environmental stress productivity (Env/GDP) must decrease in both cases to reach sustainability. In the sustainable degrowth cases (decreasing GDP), the Environmental stress productivity can decrease or increase but the social welfare productivity must increase in both cases to reach sustainability. The analysis illustrates the importance of changes in productivity reflecting both different system structures in addition to efficiency related to technological change. To meet specified sustainability criteria, it is then also theoretically possible to adjust growth rates, for economic growth or degrowth outcomes. Through applying the SuWi analysis, this article can be described as providing a general theory of the place of economic growth in sustainable development, as it can be applied to all possible environmental and social outcomes, all possible paths of economic growth, and all possible combinations of environmental and social productivities of GDP.
In the debate on economic growth, including the classic Simon-Ehrlich wager [88], some have argued that science and technology will enable sustained growth of consumption without harmful growth in the use of natural resources, through doing more with less. Others propose that this is not possible, emphasising absolute limits in the carrying capacity of the earth, concluding that there are limits to either population growth or to material consumption in the rich world, with a necessity to reduce demand and by rapidly scaling up system change alongside technological innovation. The specifics of whether an outcome could be deemed ‘sustainable,’ are dependent on the specific environmental and social themes, and the relevant criteria applied to define sustainability. Using the SuWi analysis, both relative and absolute targets can be considered, in both strong and weak sustainability configurations. The SuWi approach can be used to inform about real development options of nations and societies while noting the specific answers in applied settings will also depend upon the choice of environmental and social indicators, data availability, and the real dynamics of sustainability paths. The SuWi approach could also assist in holistic analysis and planning for the UN SDGs [34], and sustainable development in general, to engage with the critical issues of policy coordination, to analyse synergies and trade-offs, and to assist in understanding policy dialogues about absolute and efficiency targets in evidence-based decision making. As environmental pressures increase, as climate and ecological breakdown resonate alongside the demands of social sustainability, approaches such as SuWi may become indispensable to sustainability science and effective policymaking.
Rather than static ceteris paribus conditions, a SuWi can be performed as a dynamic integrated analysis, using time series rather than beginning and end points [76], which remains a rarity in integrated approaches. The SuWi can be applied to the estimation of an efficiency gap, in the case of absolute environmental or social development targets. This makes the SuWi approach a useful tool for policy analysis to indicate priority areas for improvement in efficiency. When noting the efficiency gap between actual and desired outcomes, a widening or narrowing of the window can give valuable information for policy planning, for guidance on the timing of planned actions, and their extent. The minimum and maximum economic growth rates can be used for the construction of a doughnut model of sustainability [89,90]. In the doughnut model, the different pairs of SuWi indicator analysis results are arranged in a radial diagram where the inner circle illustrates the minimum economic growth to guarantee sustainable social development and the outer circle illustrates the maximum economic growth not to exceed the environmental limits of sustainability. The doughnut model can be used to attain an overall view of multidimensional sustainability, to illustrate the problematic and critical areas of development where special attention is necessary. The dynamic SuWi analysis allows also considering intergenerational equity if time series data for a period long enough is available.
In the analysis of sustainability processes, the complexity of systems cannot be avoided, including cyclic economic growth and associated sustainability challenges, which are implicit in the approach [91]. The SuWi can provide a platform for scenario planning, to evaluate possible, desirable and avoidable future developments. Employing a SuWi in this form could assist in policy planning under conditions of complexity and uncertainty which characterise interdependent policy challenges of sustainability. In addition to considering the impact of economic development, the flexibility of SuWi permits multiple uses of key interest to the empirical analysis of sustainability science, and 21st-century policymaking.
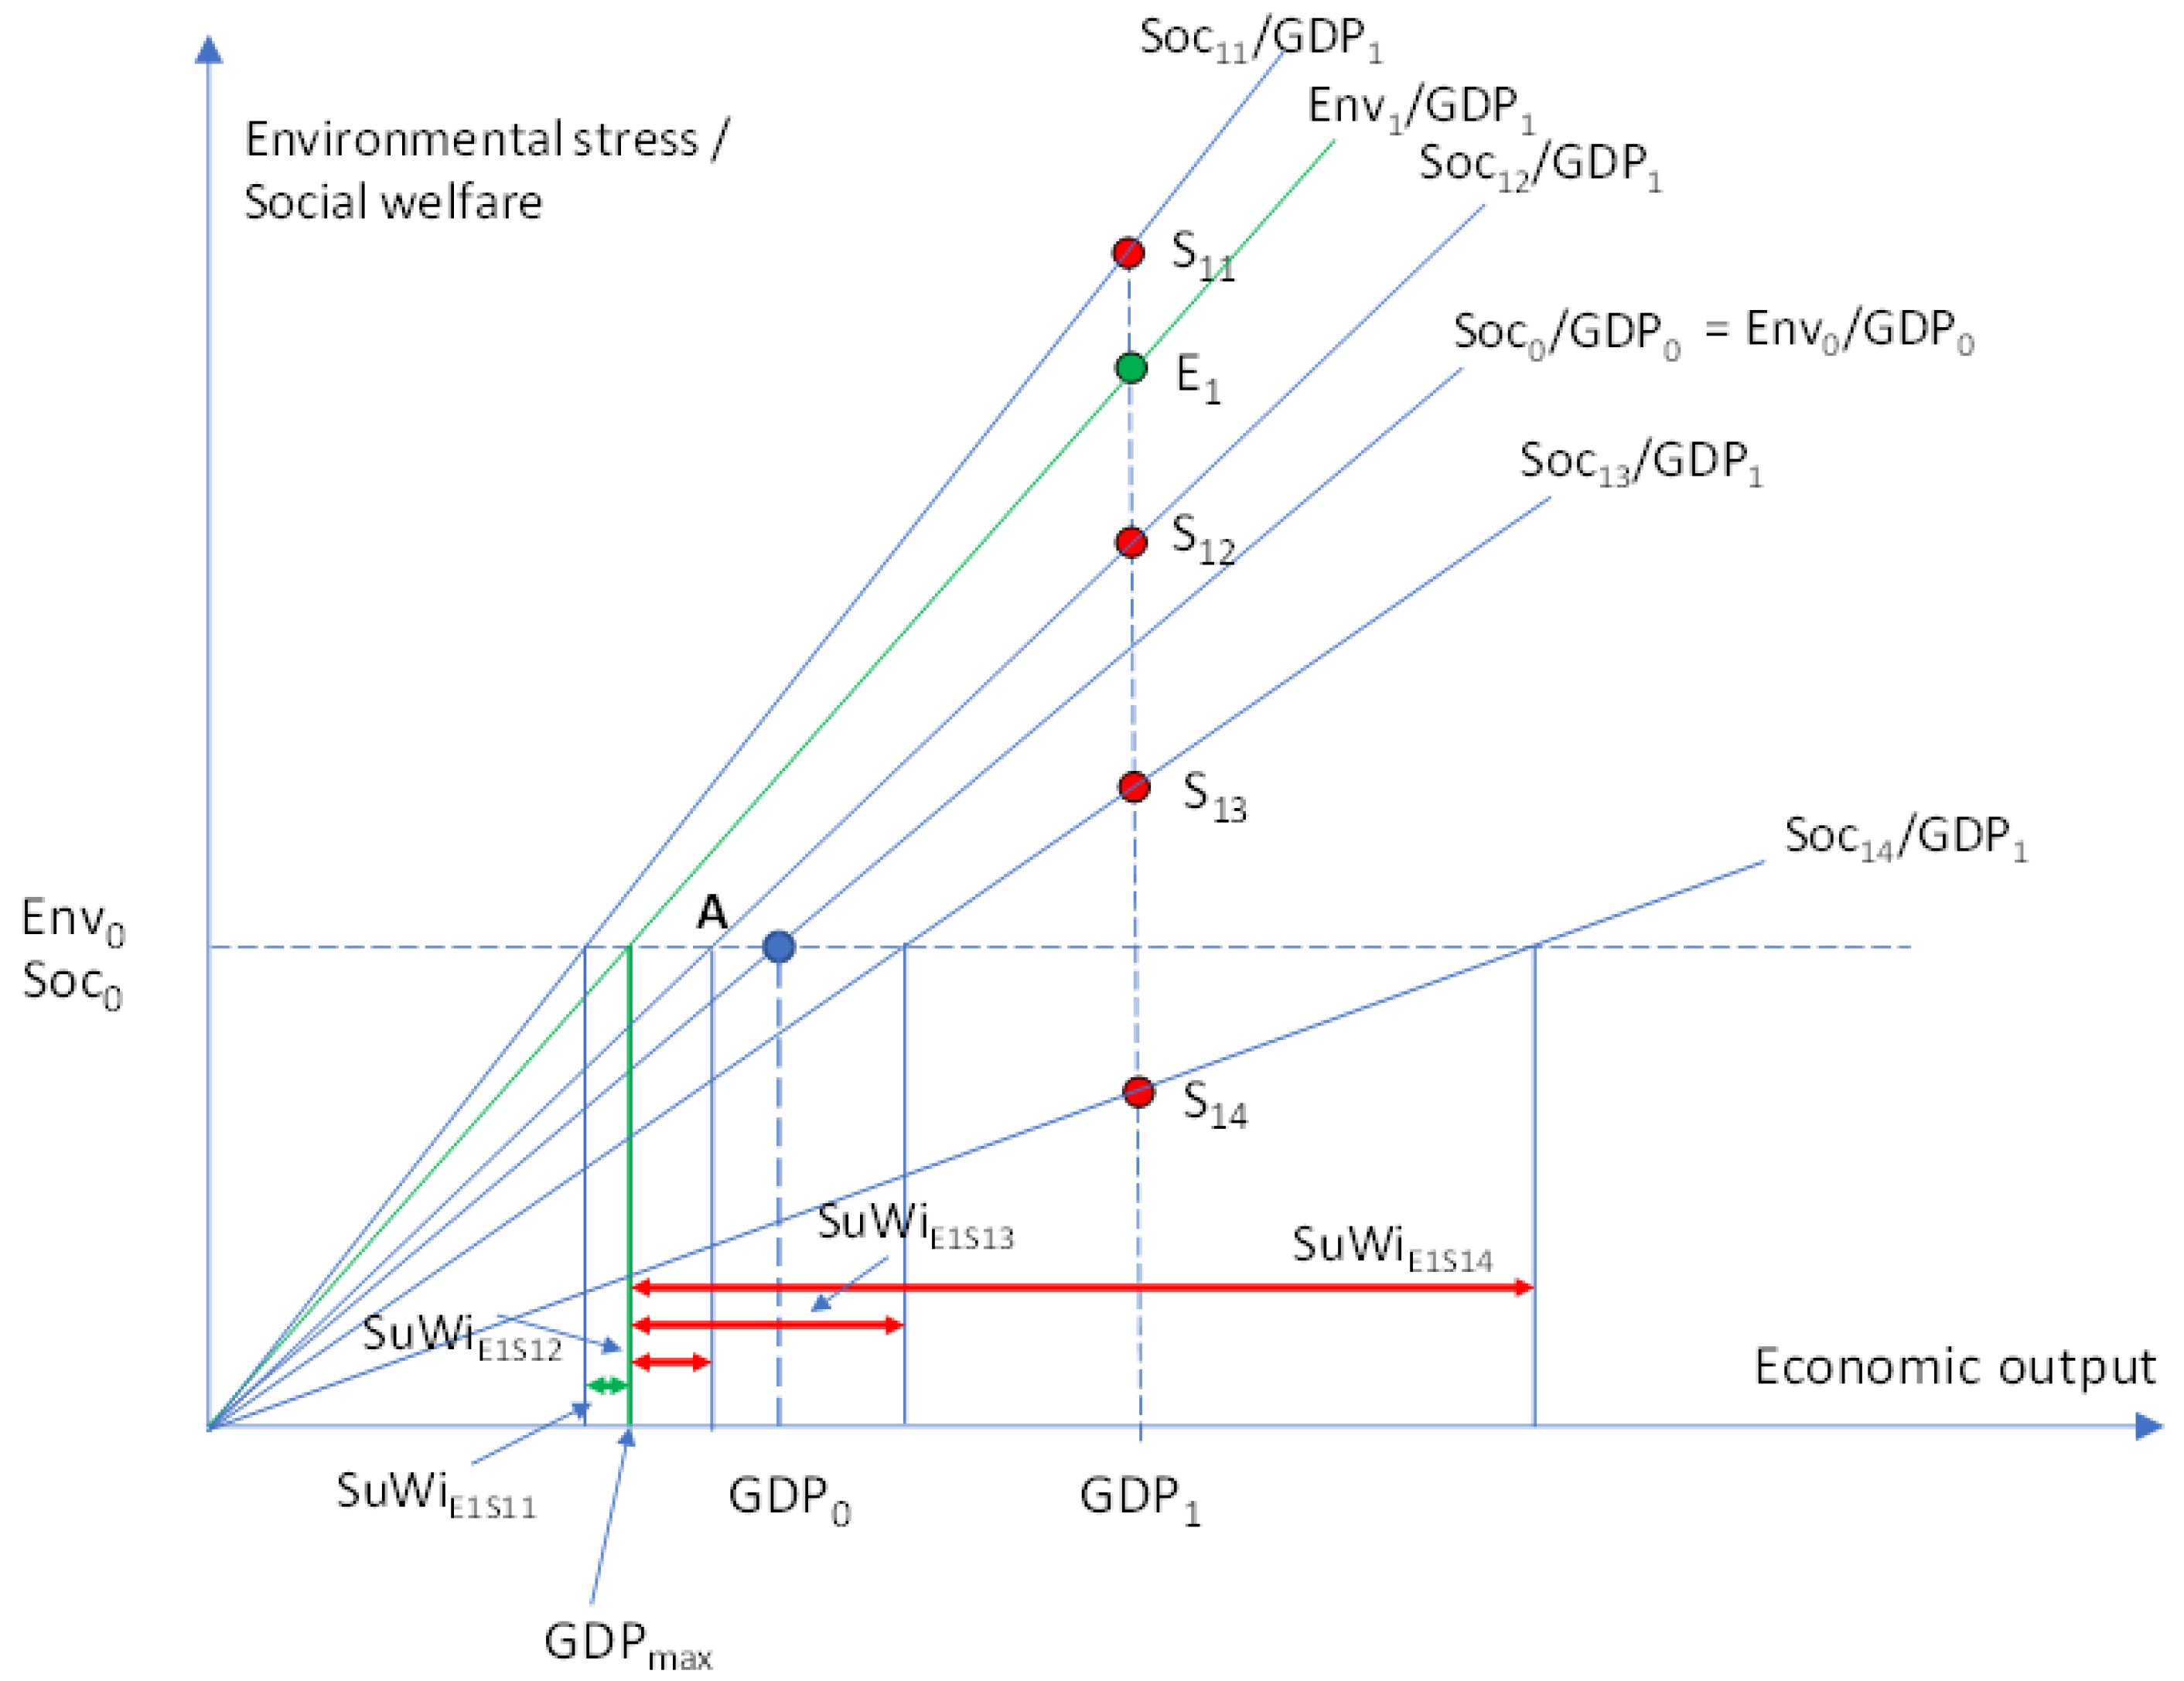
Group 1 (Figure A1).
Environmental stress increases (Env1 > Env0), GDP increases (GDP1 > GDP0), and environmental stress productivity increases (Env1/GDP1 > Env0/GDP0)
Social welfare can have four different options:
-
Soc11 > Soc0 and Soc11 > Env1 and Soc11/GDP1 > Env1/GDP1 and Soc11/GDP1 > Soc0/GDP0In this case, Sustainability Window (SuWiE1S11) is positive but the actual GDP growth is outside SuWi (GDP1 > GDPmax). This case does not fulfill the sustainability criteria.
-
Soc12 > Soc0 and Soc12 < Env1 and Soc12/GDP1 < Env1/GDP1, and Soc12/GDP1 < Soc0/GDP0In this case, Sustainability Window (SuWiE1S12) is negative (GDPmin > GDPmax) and the actual GDP growth is outside SuWi (GDP1 > GDPmax). This case does not fulfill the sustainability criteria.
-
Soc13 > Soc0 and Soc13 < Env1 and Soc13/GDP1 < Env1/GDP1, and Soc13/GDP1 < Soc0/GDP0In this case, Sustainability Window (SuWiE1S13) is negative (GDPmin > GDPmax) and the actual GDP growth is outside SuWi (GDP1 > GDPmax). This case does not fulfill the sustainability criteria.
-
Soc14 < Soc0 and Soc14 < Env1 and Soc14/GDP1 < Env1/GDP1, and Soc14/GDP1 < Soc0/GDP0In this case, Sustainability Window (SuWiE1S14) is negative (GDPmin > GDPmax) even though the actual GDP growth is inside the negative SuWi (GDPmax < GDP1 < GDPmin), This case does not fulfill the sustainability criteria.
Figure A1.
Sustainability Window in all possible cases where GDP, environmental stress (Env) and environmental stress productivity (Env/GDP) increase.
Figure A1.
Sustainability Window in all possible cases where GDP, environmental stress (Env) and environmental stress productivity (Env/GDP) increase.
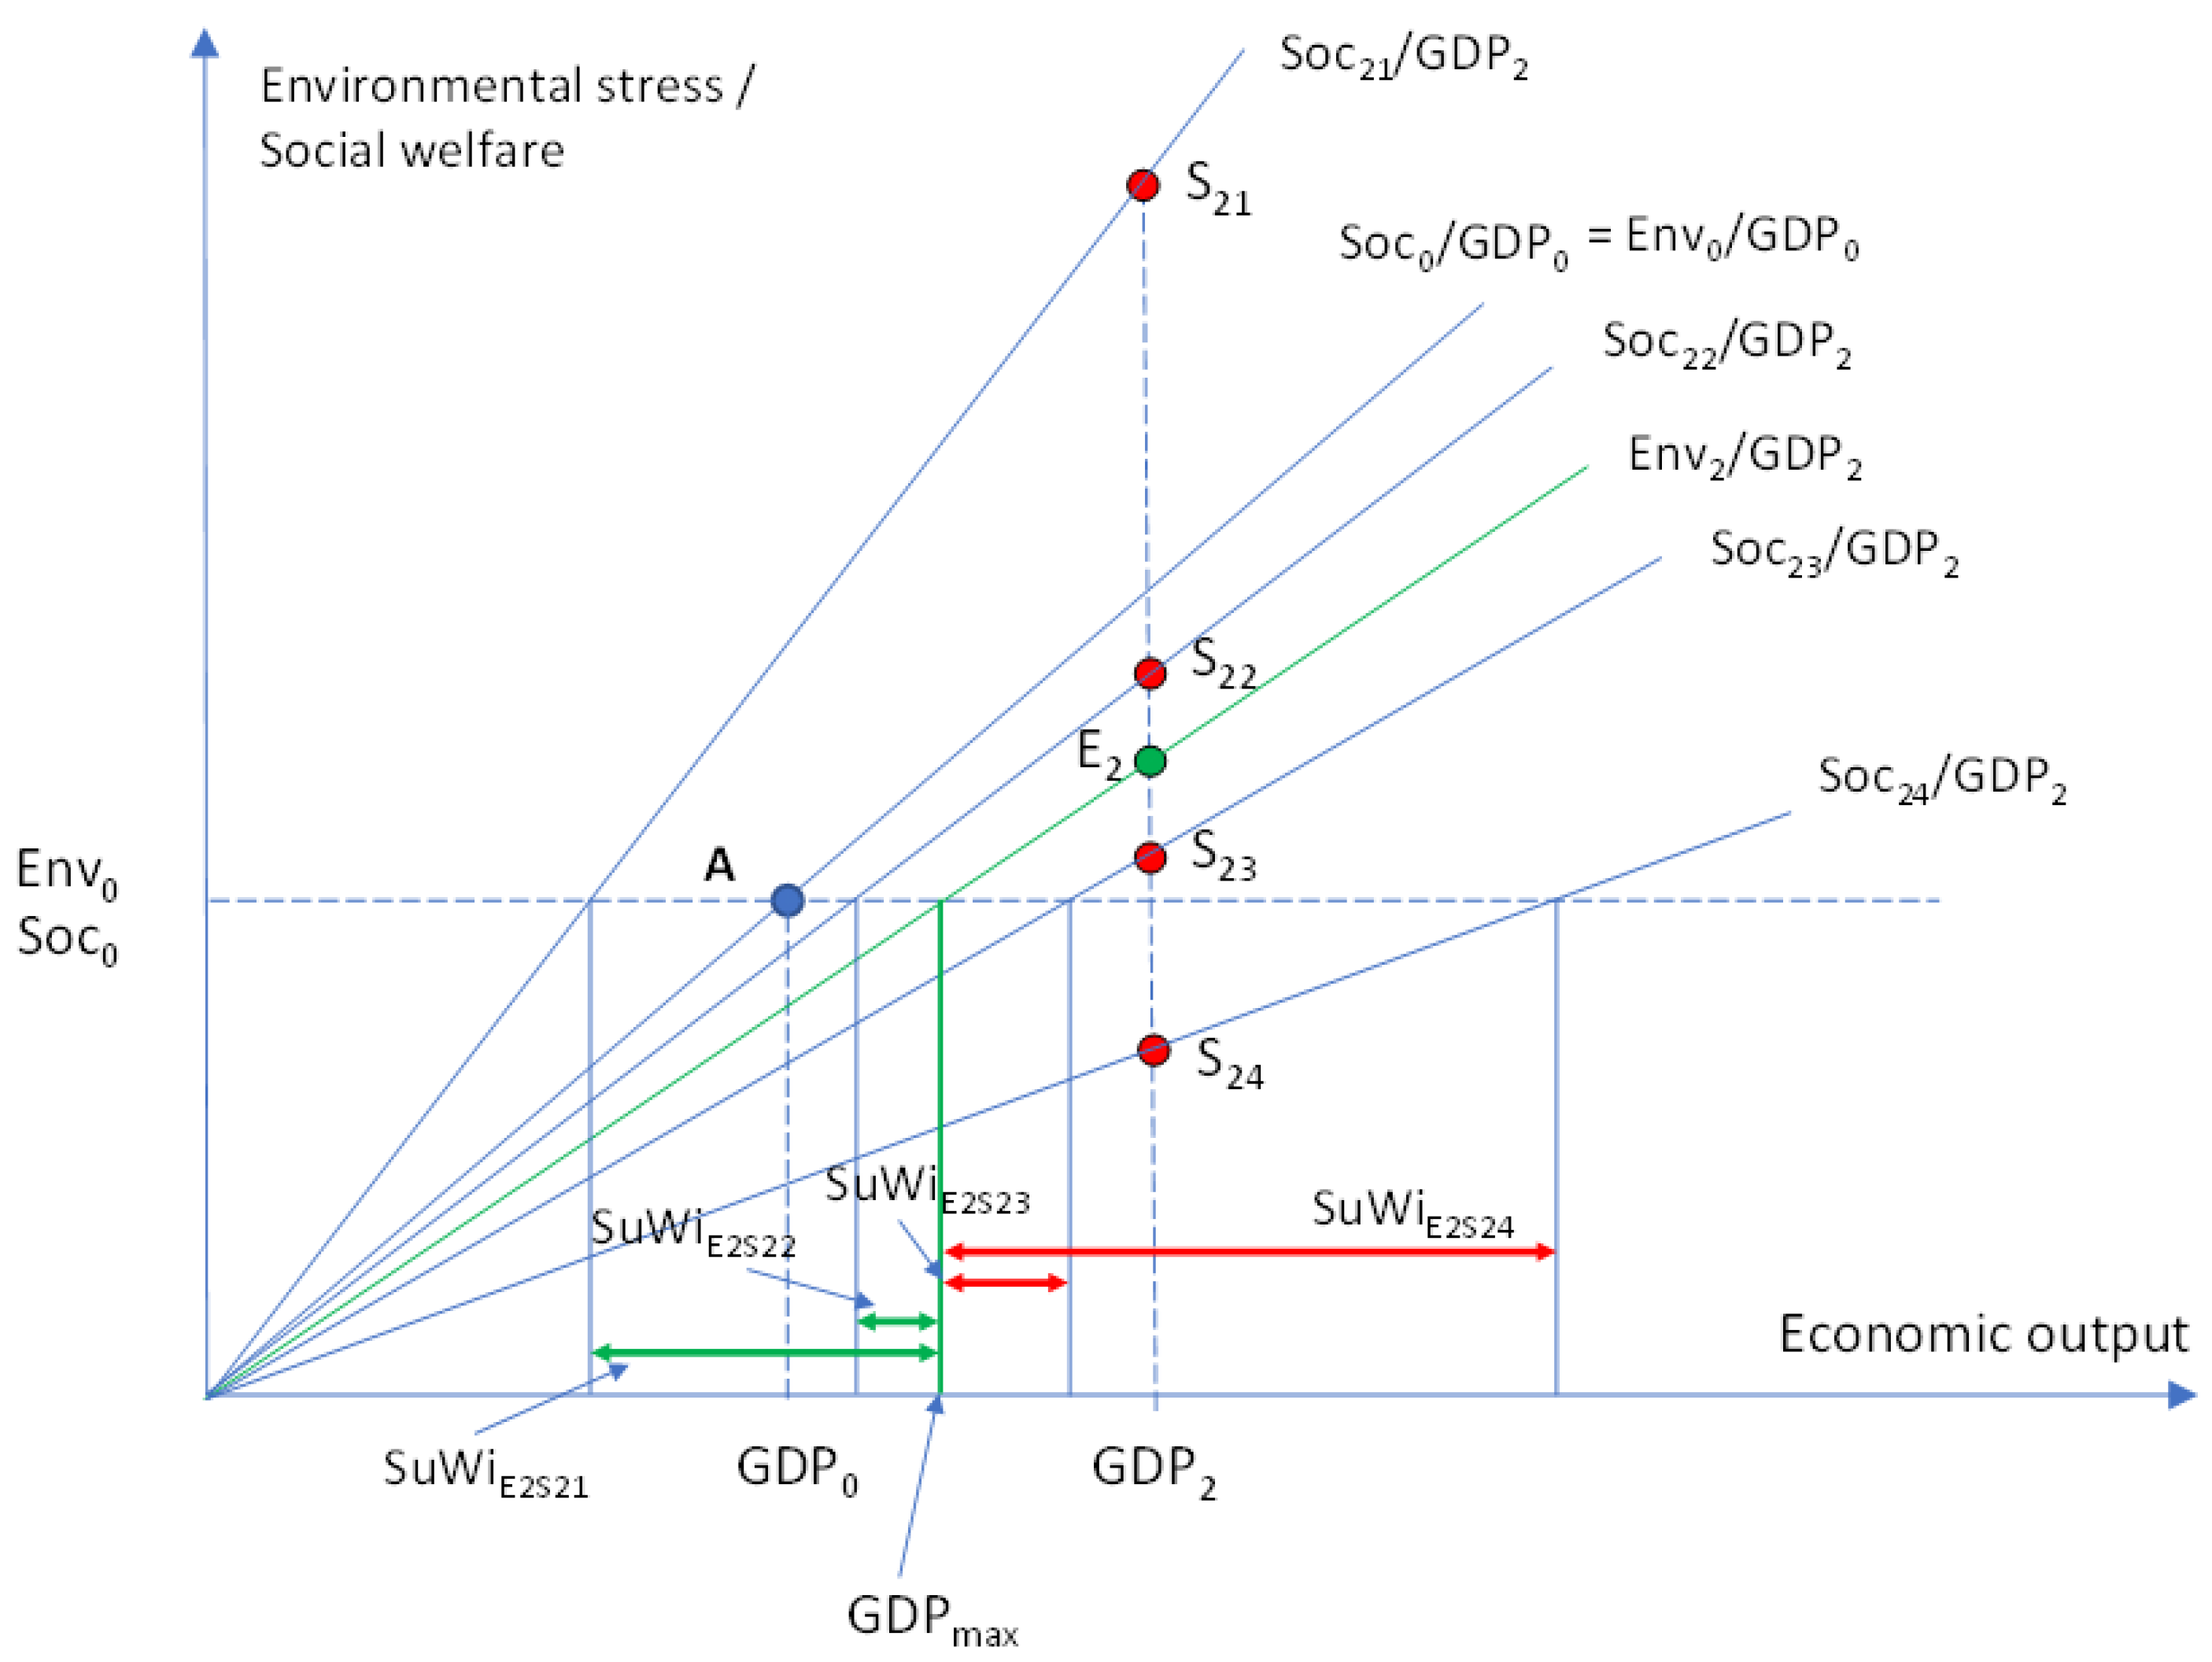
Group 2 (Figure A2).
GDP increases (GDP2 > GDP0), Environmental stress increases (Env2 > Env0), and environmental stress productivity decreases (Env2/GDP2 < Env0/GDP0)
Social welfare can have four different options:
-
Soc21 > Soc0 and Soc21 > Env2 and Soc21/GDP2 > Env2/GDP1 and Soc21/GDP2 > Soc0/GDP0In this case, Sustainability Window (SuWiE2S21) is positive (GDPmin < GDPmax) but the actual GDP growth is outside SuWi (GDP2 > GDPmax). This case does not fulfill the sustainability criteria.
-
Soc22 > Soc0 and Soc22 > Env2 and Soc22/GDP2 > Env2/GDP2, and Soc22/GDP2 > Soc0/GDP0In this case, Sustainability Window (SuWiE2S22) is positive (GDPmin < GDPmax) but the actual GDP growth is outside SuWi (GDP2 > GDPmax). This case does not fulfill the sustainability criteria.
-
Soc23 < Soc0 and Soc23 < Env2 and Soc23/GDP2 < Env2/GDP2, and Soc23/GDP2 < Soc0/GDP0In this case Sustainability Window (SuWiE2S23) is negative (GDPmin > GDPmax) and the actual GDP growth is outside SuWi (GDP2 > GDPmax). This case does not fulfill the sustainability criteria.
-
Soc24 < Soc0 and Soc24 < Env2 and Soc24/GDP2 < Env2/GDP2, and Soc24/GDP2 < Soc0/GDP0In this case Sustainability Window (SuWiE2S24) is negative (GDPmin > GDPmax) even though the actual GDP growth is inside the negative SuWi (GDPmax < GDP2 < GDPmin). This case does not fulfill the sustainability criteria.
Figure A2.
Sustainability Window in all possible cases where GDP and environmental stress (Env) increase and environmental stress productivity (Env/GDP) decreases.
Figure A2.
Sustainability Window in all possible cases where GDP and environmental stress (Env) increase and environmental stress productivity (Env/GDP) decreases.
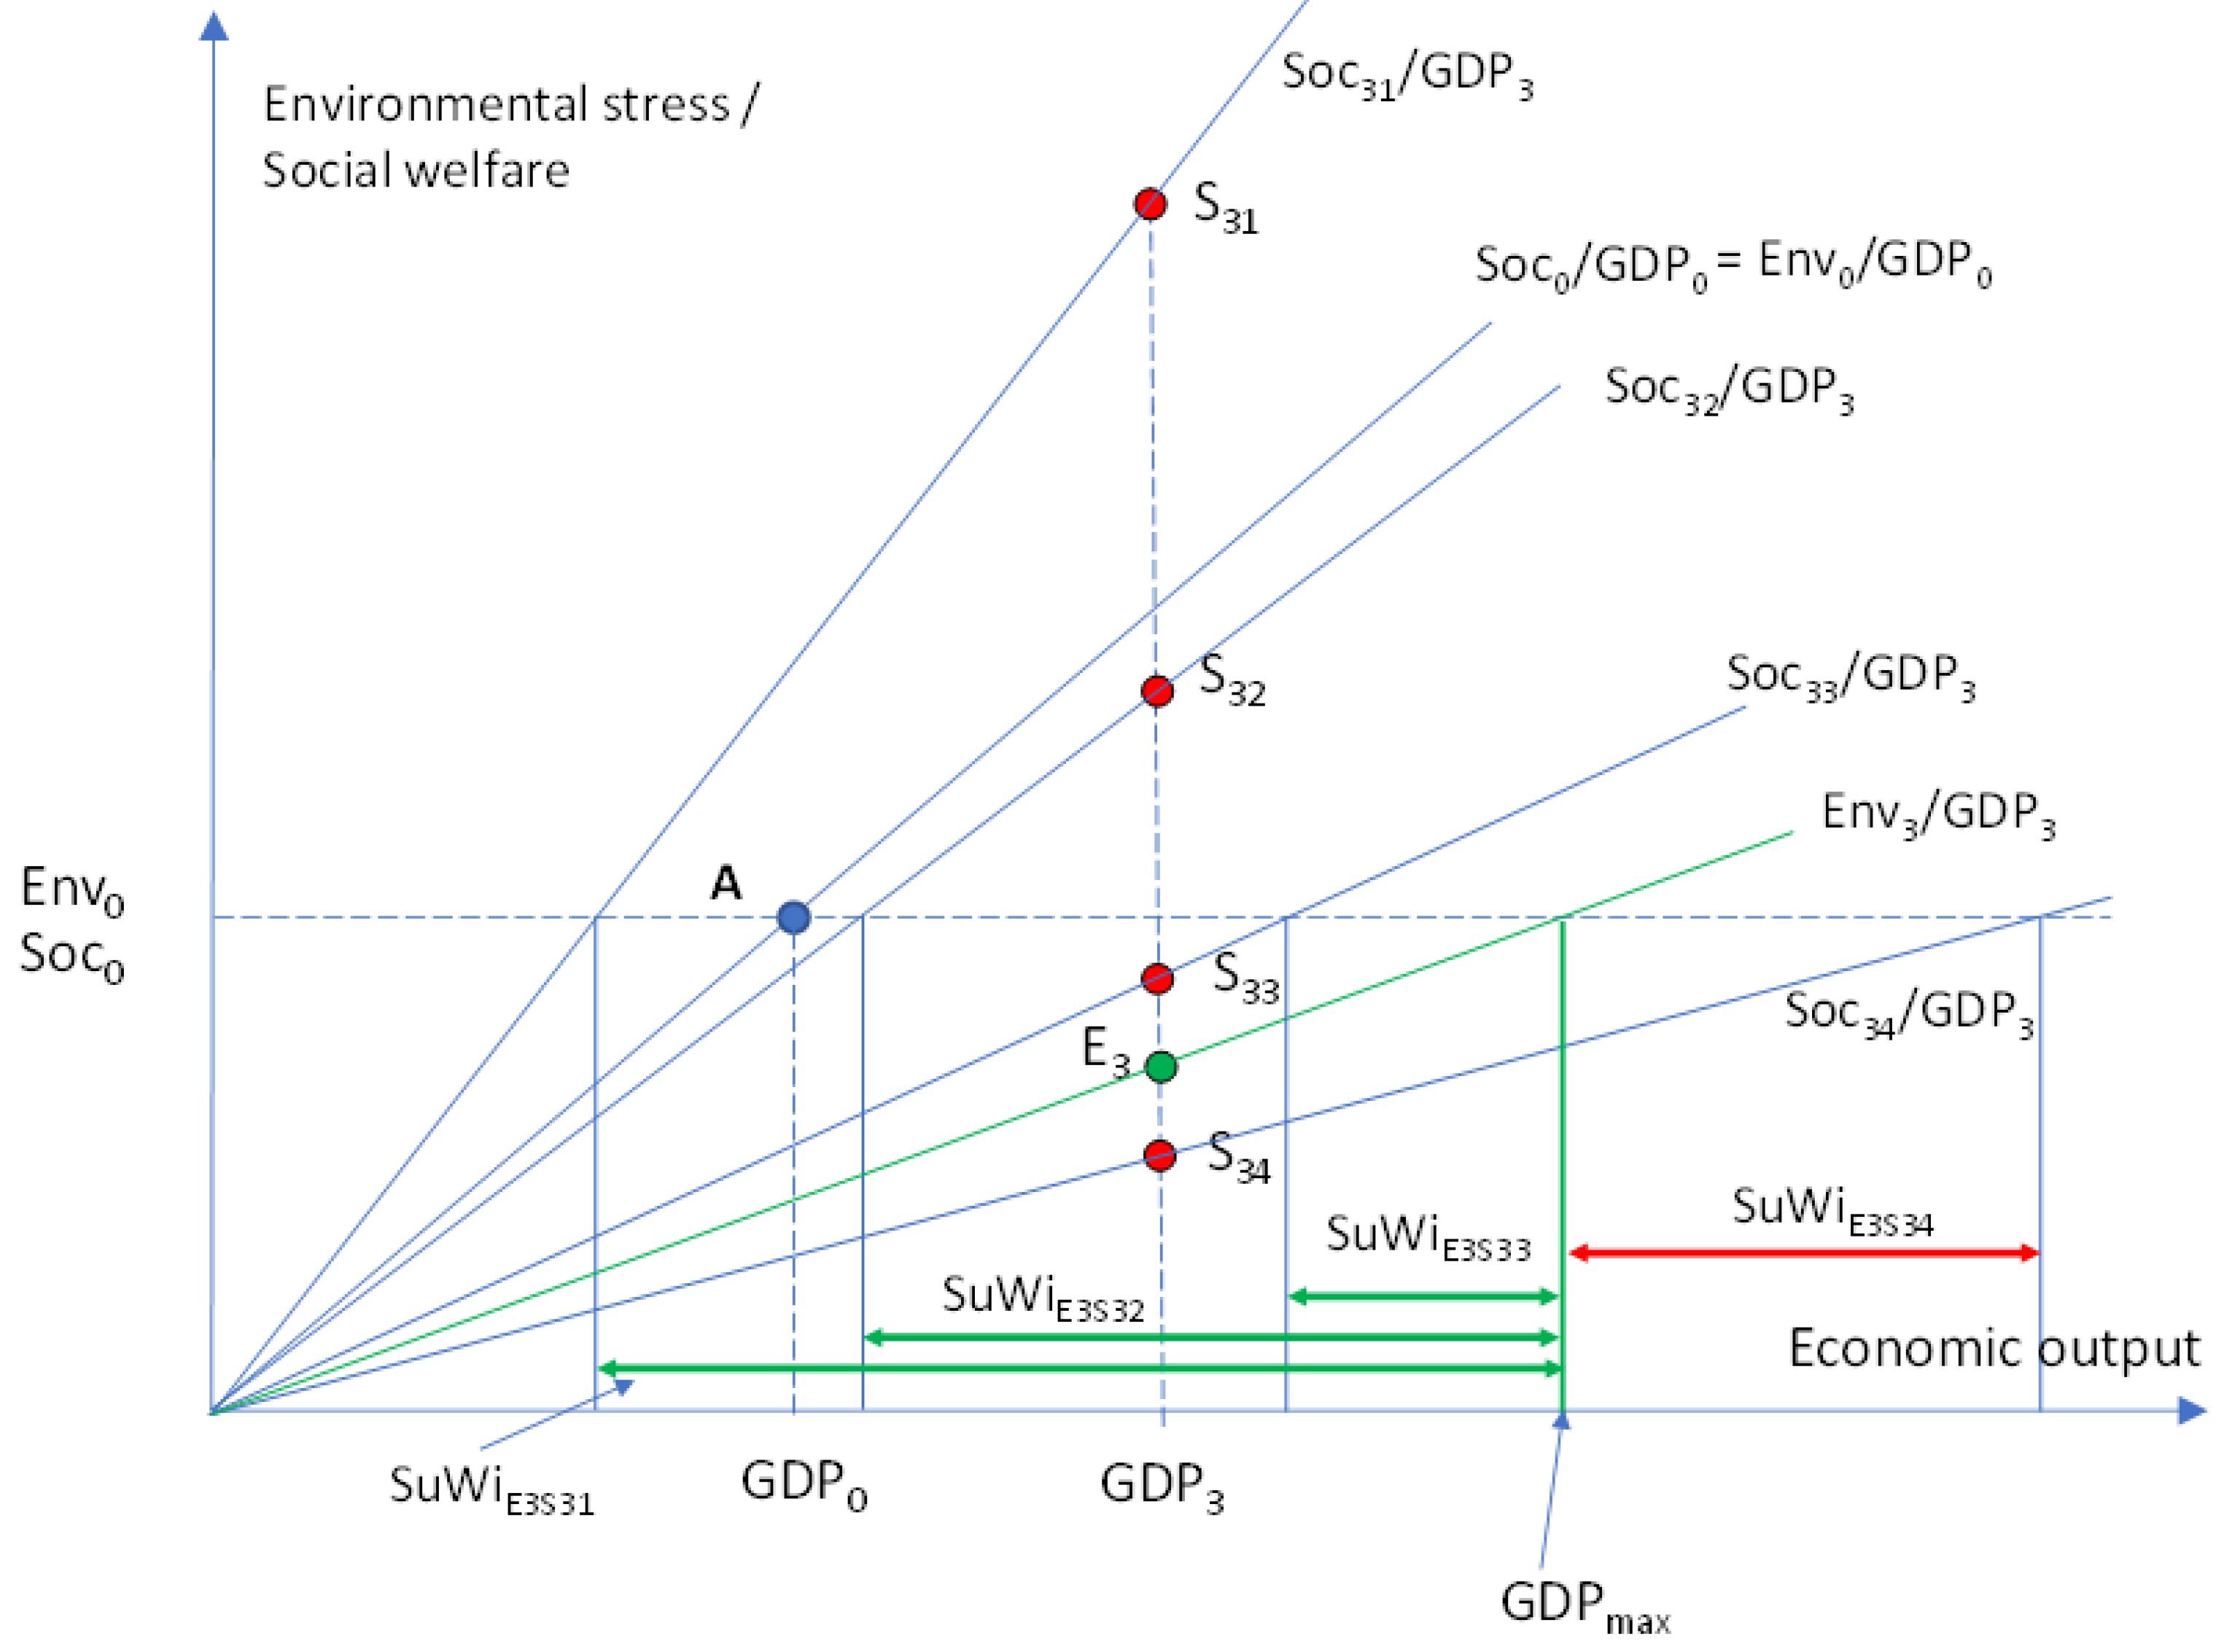
Group 3 (Figure A3).
GDP increases (GDP3 > GDP0), environmental stress decreases (E3 < E0), and environmental stress productivity decreases (Env3/GDP3 < Env0/GDP0)
Social welfare can have four different options:
-
Soc31 > Soc0 and Soc31 > Env3 and Soc31/GDP3 > Env3/GDP3 and Soc31/GDP3 > Soc0/GDP0In this case, Sustainability Window (SuWiE3S31) is positive (GDPmin < GDPmax) and the actual GDP growth is inside SuWi (GDPmin < GDP3 < GDPmax). This case fulfills the sustainability criteria.
-
Soc32 > Soc0 and Soc32 > Env3 and Soc32/GDP3 > Env3/GDP3, and Soc32/GDP3 < Soc0/GDP0In this case, Sustainability Window (SuWiE3S32) is positive (GDPmin < GDPmax) and the actual GDP growth is inside SuWi (GDPmin < GDP3 < GDPmax). This case fulfills the sustainability criteria.
-
Soc33 < Soc0 and Soc33 > Env3 and Soc33/GDP3 > Env3/GDP3, and Soc33/GDP3 < Soc0/GDP0In this case, Sustainability Window (SuWiE3S33) is positive (GDPmin < GDPmax) but the actual GDP growth is outside SuWi (GDP3 > GDPmin). This case does not fulfill the sustainability criteria.
-
Soc34 < Soc0 and Soc34 < Env3 and Soc34/GDP3 < Env3/GDP3, and Soc34/GDP3 < Soc0/GDP0In this case, Sustainability Window (SuWiE3S24) is negative (GDPmin > GDPmax) and the actual GDP growth is outside the negative SuWi (GDP3 < GDPmax < GDPmin), This case does not fulfill the sustainability criteria.
Figure A3.
Sustainability Window in all possible cases where GDP increases and environmental stress (Env) and environmental stress productivity (Env/GDP) decrease.
Figure A3.
Sustainability Window in all possible cases where GDP increases and environmental stress (Env) and environmental stress productivity (Env/GDP) decrease.
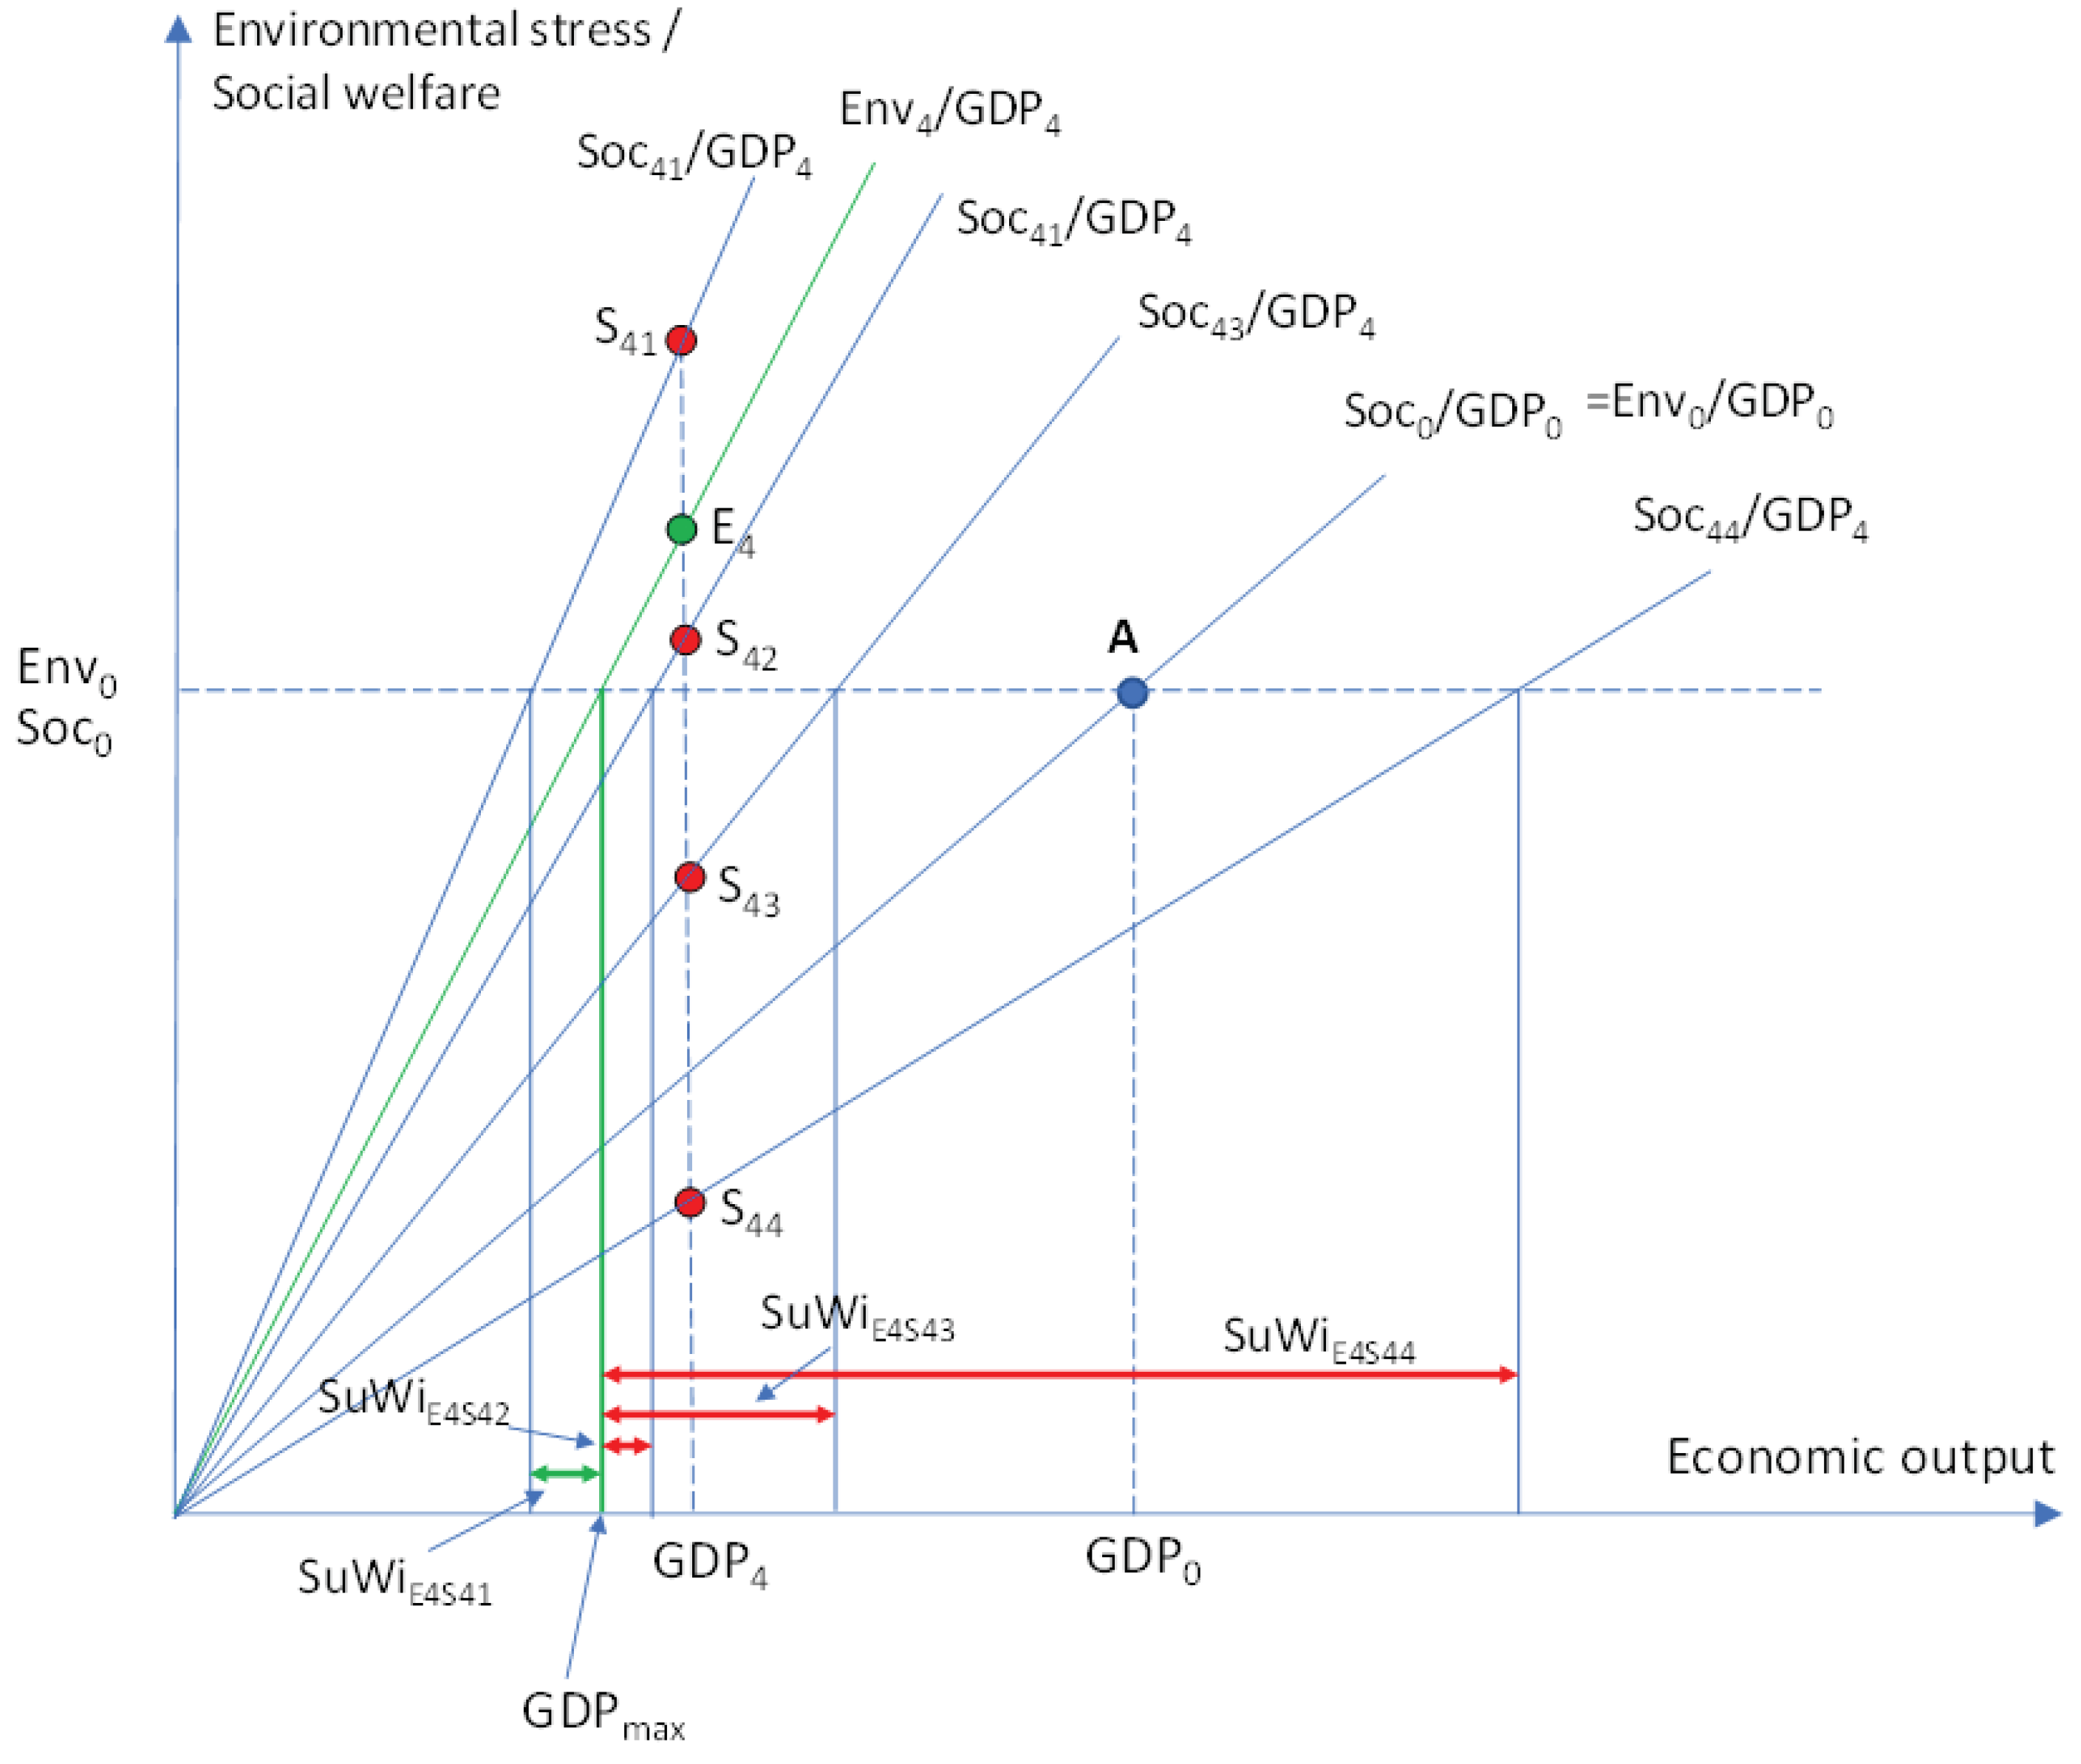
Group 4 (Figure A4)
GDP decreases (GDP4 < GDP0), environmental stress increases (E4 > E0), and environmental stress productivity increases (Env4/GDP4 > Env0/GDP0)
Social welfare can have four different options:
-
Soc41 > Soc0 and Soc41 > Env4 and Soc41/GDP4 > Env4/GDP4 and Soc41/GDP4 > Soc0/GDP0In this case, Sustainability Window (SuWiE4S41) is positive (GDPmin < GDPmax) but the actual GDP growth is outside SuWi (GDPmin < GDP4 > GDPmax). This case does not fulfill the sustainability criteria.
-
Soc42 > Soc0 and Soc42 < Env4 and Soc42/GDP4 < Env4/GDP4, and Soc42/GDP4 > Soc0/GDP0In this case, Sustainability Window (SuWiE4S42) is negative (GDPmin > GDPmax) and the actual GDP growth is outside SuWi (GDPmin < GDP4 > GDPmax). This case does not fulfill the sustainability criteria.
-
Soc43 < Soc0 and Soc43 < Env4 and Soc43/GDP4 < Env4/GDP4, and Soc43/GDP4 > Soc0/GDP0In this case, Sustainability Window (SuWiE4S43) is negative (GDPmin > GDPmax) even though the actual GDP growth is inside the negative SuWi (GDP4 > GDPmax < GDPmin). This case does not fulfill the sustainability criteria.
-
Soc44 < Soc0 and Soc44 < Env4 and Soc44/GDP4 < Env4/GDP4, and Soc44/GDP4 < Soc0/GDP0In this case, Sustainability Window (SuWiE4S44) is negative (GDPmin > GDPmax) and the actual GDP growth is outside the negative SuWi (GDP4 < GDPmax < GDPmin). This case does not fulfill the sustainability criteria.
Figure A4.
Sustainability Window in all possible cases where GDP decreases and environmental stress (Env) and environmental stress productivity (Env/GDP) increase.
Figure A4.
Sustainability Window in all possible cases where GDP decreases and environmental stress (Env) and environmental stress productivity (Env/GDP) increase.
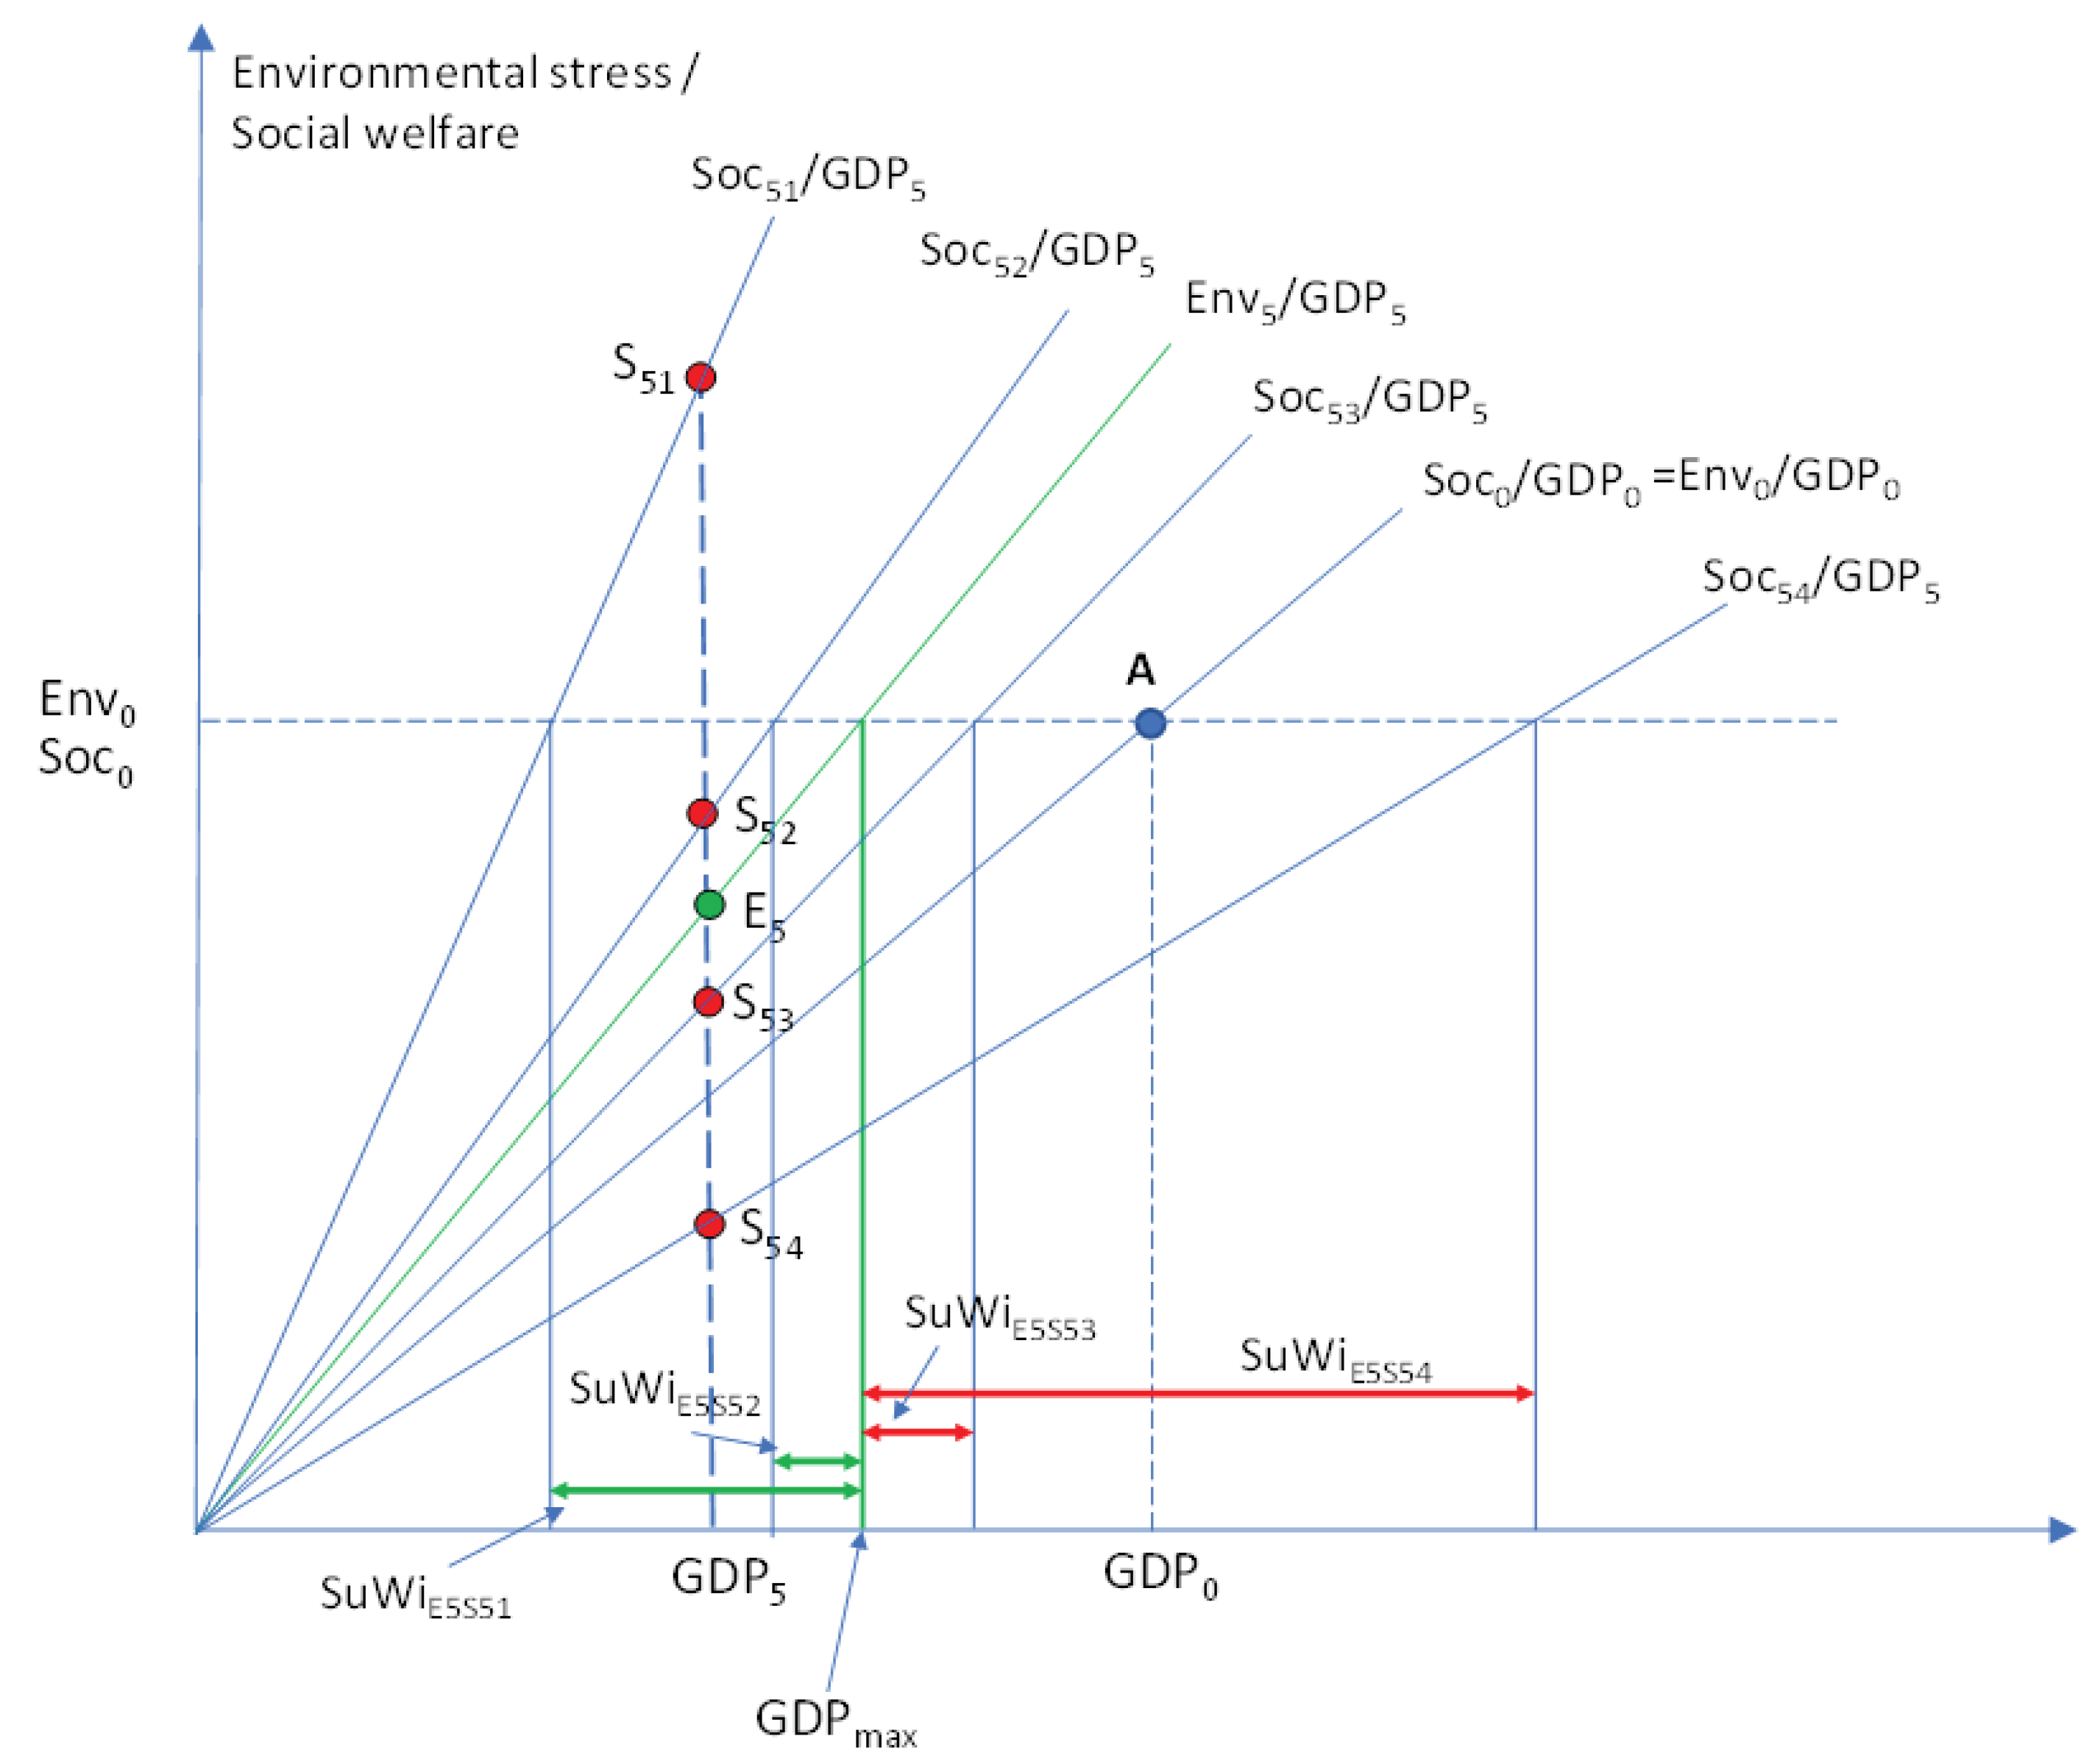
Group 5 (Figure A5)
GDP decreases (GDP5 < GDP0), environmental stress decreases (E5 < E0), and environmental stress productivity increases (Env5/GDP5 > Env0/GDP0)
Social welfare can have four different options:
-
Soc51 > Soc0 and Soc51 > Env5 and Soc51/GDP5 > Env5/GDP5 and Soc51/GDP5 > Soc0/GDP0In this case, Sustainability Window (SuWiE5S51) is positive (GDPmin < GDPmax) and the actual GDP growth is inside SuWi (GDPmin < GDP5 < GDPmax). This case fulfills the sustainability criteria.
-
Soc52 < Soc0 and Soc52 > Env5 and Soc52/GDP5 > Env5/GDP5, and Soc52/GDP5 > Soc0/GDP0In this case, Sustainability Window (SuWiE5S52) is positive (GDPmin < GDPmax) but the actual GDP growth is outside SuWi (GDP5 < GDPmin < GDPmax). This case does not fulfill the sustainability criteria.
-
Soc53 < Soc0 and Soc53 < Env5 and Soc53/GDP5 < Env5/GDP5, and Soc53/GDP5 > Soc0/GDP0In this case, Sustainability Window (SuWiE5S53) is negative (GDPmin > GDPmax) and the actual GDP growth is outside the negative SuWi (GDP5 < GDPmax < GDPmin). This case does not fulfill the sustainability criteria.
-
Soc54 < Soc0 and Soc54 < Env5 and Soc54/GDP5 < Env5/GDP5, and Soc54/GDP5 < Soc0/GDP0In this case, Sustainability Window (SuWiE5S54) is negative (GDPmin > GDPmax) and the actual GDP growth is outside the negative SuWi (GDP5 < GDPmax < GDPmin). This case does not fulfill the sustainability criteria.
Figure A5.
Sustainability Window in all possible cases where GDP and environmental stress (Env) decrease and environmental stress productivity (Env/GDP) increases.
Figure A5.
Sustainability Window in all possible cases where GDP and environmental stress (Env) decrease and environmental stress productivity (Env/GDP) increases.
Group 6 (Figure A6)
GDP decreases (GDP6 < GDP0), environmental stress decreases (Env6 < Env0), and environmental stress productivity decreases (Env6/GDP6 < Env0/GDP0)
Social welfare can have four different options:
-
Soc61 > Soc0 and Soc61 > Env6 and Soc61/GDP6 > Env6/GDP6 and Soc61/GDP6 > Soc0/GDP0In this case, Sustainability Window (SuWiE6S61) is positive (GDPmin < GDPmax) and the actual GDP growth is inside SuWi (GDPmin < GDP6 < GDPmax). This case fulfills the sustainability criteria.
-
Soc62 < Soc0 and Soc62 > Env6 and Soc62/GDP6 > Env6/GDP6, and Soc62/GDP6 > Soc0/GDP0In this case, Sustainability Window (SuWiE6S62) is positive (GDPmin < GDPmax) but the actual GDP growth is outside SuWi (GDP6 < GDPmin < GDPmax). This case does not fulfill the sustainability criteria.
-
Soc63 < Soc0 and Soc63 > Env6 and Soc63/GDP6 > Env6/GDP6, and Soc63/GDP6 < Soc0/GDP0In this case, Sustainability Window (SuWiE6S63) is positive (GDPmin < GDPmax) but the actual GDP growth is outside the SuWi (GDP6 < GDPmin < GDPmax). This case does not fulfill the sustainability criteria.
-
Soc64 < Soc0 and Soc64 < Env6 and Soc64/GDP6 < Env6/GDP6, and Soc64/GDP6 < Soc0/GDP0In this case, Sustainability Window (SuWiE6S64) is negative (GDPmin > GDPmax) and the actual GDP growth is outside the negative SuWi (GDP6 < GDPmax < GDPmin). This case does not fulfill the sustainability criteria.
Figure A6.
Sustainability Window in all possible cases where GDP, environmental stress (Env) and environmental stress productivity (Env/GDP) decrease.
Figure A6.
Sustainability Window in all possible cases where GDP, environmental stress (Env) and environmental stress productivity (Env/GDP) decrease.

Author Contributions
Conceptualization, J.L., J.V., J.K. and T.O.; methodology, J.L., J.V., J.K.; validation, J.L., J.V.; formal analysis, J.L.; investigation, J.L., J.V., J.K. and T.O.; resources, J.L., J.V., J.K. and T.O.; writing—original draft preparation, J.L., J.V., J.K. and T.O.; writing—review and editing, J.L., J.V., J.K. and T.O.; visualization, J.L.; funding acquisition, J.L., J.V., J.K. All authors have read and agreed to the published version of the manuscript.
Funding
This research was funded by The Academy of Finland, grant number 320229.
Conflicts of Interest
The authors declare no conflicts of interest. The funders had no role in the design of the study; in the collection, analyses, or interpretation of data; in the writing of the manuscript; or in the decision to publish the results.
Appendix A
This Appendix includes graphical descriptions of all 24 possible development paths presented in Table 1 in the text, regarding Sustainability Windows of all combinations of Environmental Stress (Env), Social welfare (Soc), Economic development (GDP), environmental stress productivity (Env/GDP), and social welfare productivity (Soc/GDP). The 24 possible development paths are grouped into six graphs (Figure A1, Figure A2, Figure A3, Figure A4, Figure A5 and Figure A6). The grouping is based on possible combinations of changes in GDP and environmental stress productivity (Env/GDP). In each of the Figure A1, Figure A2, Figure A3, Figure A4, Figure A5 and Figure A6, four possible social welfare productivities (Soc/GDP) and related social welfare (Soc) levels are identified.
- The original values of all variables are marked with subscript 0 (GDP0, Env0, Soc0, Env0/GDP0)
- The new GDP, Env, and Env/GDP values have a subscript referring to the number of the group (GDP1–GDP6, Env1–Env6, Env1/GDP1–Env6/GDP6
- The new social welfare values have a subscript referring to the number of the group and the number of the four cases case (Soc11–Soc64), and the related social welfare productivities have corresponding subscripts (Soc11/GDP1–Soc64/GDP6)
- The sustainability Windows are marked with a subscript E referring to the environmental stress of the group (Env1–Env6) and with a subscript S referring to the social welfare case inside each group (Soc11–Soc64), i.e. SuWiE1S11–SuWiE6S64.
References
- Meadows, D.H., Randers, J., and Meadows, D.L. (2004). The Limits to Growth: The 30-Year Update. White River Junction VT: Chelsea Green Publishing Co.
- Kaivo-oja, J., Vehmas, J. and Luukkanen, J. (2014a). A note: De-growth debate and new scientific analysis of economic growth. Journal of Environmental Protection 5(15). [CrossRef]
- O’Mahony, T. (2022). Toward sustainable wellbeing: Advances in contemporary concepts. Frontiers in Sustainability 3, 807984. [CrossRef]
- Krausmann, F., Gingrich, S., Eisenmenger, N., Erb, K. H., Haberl, H., and Fischer-Kowalski, M. (2009). Growth in global materials use, GDP and population during the 20th century. Ecological Economics 68(10), 2696–270. [CrossRef]
- IPCC (2018). Global Warming of 1.5°C. An IPCC Special Report on the impacts of global warming of 1.5°C above pre-industrial levels and related global greenhouse gas emission pathways, in the context of strengthening the global response to the threat of climate change, sustainable development, and efforts to eradicate poverty. Ed. by Masson-Delmotte, V., P. Zhai, H.-O. Pörtner, D. Roberts, J. Skea, P.R. Shukla, A. Pirani, W. Moufouma-Okia, C. Péan, R. Pidcock, S. Connors, J.B.R. Matthews, Y. Chen, X. Zhou, M.I. Gomis, E. Lonnoy, T. Maycock, M. Tignor, and T. Waterfield.
- IPBES (2019). Global assessment report on biodiversity and ecosystem services of the Intergovernmental Science-Policy Platform on Biodiversity and Ecosystem Services (IPBES), eds E. S. Brondizio, J. Settele, S. Díaz, and H. T. Ngo. Bonn: IPBES secretariat.
- Piketty, T., (2014a). Capital in the Twenty-First Century. Harvard University Press.
- Piketty, T. (2014b). About Capital in the 21st Century. American Economic Review 105 (5), 48–53. S2CID 14772228. [CrossRef]
- IPSP (2018). Rethinking Society for the 21st Century: Report of the International Panel on Social Progress (IPSP). Cambridge: Cambridge University Press. [CrossRef]
- Leach, M., Reyers, B., Bai, X., Brondizio, E.S., Cook, C., Díaz, S., Espindola, G., Scobie, M., Stafford-Smith, M., and Subramanian, S.M. (2018). Equity and sustainability in the Anthropocene: A social–ecological systems perspective on their intertwined futures. Global Sustainability 1, E13. [CrossRef]
- Escobar, A., (2015). Degrowth, postdevelopment, and transitions: a preliminary conversation. Sustainability Science 10(3), 451–462. [CrossRef]
- Grubb, M., Okereke, C., Arima, J-, Bosetti, V., Chen, Y., Edmonds, J., Gupta, S., Köberle, A., Kverndokk, S., Malik, A. and Sulistiawati, L. (2022). Introduction and Framing. In Climate Change 2022: Mitigation of Climate Change. Contribution of Working Group III to the Sixth Assessment Report of the Intergovernmental Panel on Climate Change. Cambridge University Press, Cambridge, UK and New York, NY, USA. [CrossRef]
- Ekins, P., (2002). Economic Growth and Environmental Sustainability: The Prospects for Green Growth. Routledge. London and New York.
- Collste, D., Cornell, S., Randers, J., Rockström, J., and Stoknes, P. (2021). Human well-being in the Anthropocene: Limits to growth. Global Sustainability 4, E30. [CrossRef]
- Isham, A., Mair, S., and Jackson, T. (2021). Wellbeing and productivity in advanced economies: Re-examining the link. Ecological Economics 184, 106989. [CrossRef]
- Atkinson, G., Dubourg, R., Hamilton, K., Munasinghe, M., Pearce, D. and Young, C. (1997). Measuring Sustainable Development: Macroeconomics and the Environment, Edward Elgar, Cheltenham.
- Boskin, M.J. (2000). Economic measurement: Progress and challenges. American Economic Review 90/2), 247-252. [CrossRef]
- Dasgupta, P. and Mäler, K.-C. (2000). Net national product, wealth and social well-being, Environment and Development Economics, 5(1-2), 69-93. [CrossRef]
- Kaivo-oja, J., Luukkanen, J. and Malaska, P. (2001). Sustainability evaluation frameworks and alternative analytical scenarios of national economies. Population and Environment. A Journal of Interdisciplinary Studies 23(2), 193–215. [CrossRef]
- Brock, W.A., Taylor, M.S., Aghion, P. and Durlauf, S.N. (2005), Chapter 28 - Economic Growth and the Environment: A Review of Theory and Empirics. Handbook of Economic Growth. Elsevier, 1749-1821. [CrossRef]
- Jorgenson, D.W. and Schreyer, P. (2017). Measuring individual economic well-being and social welfare within the framework of the system of national accounts. Review of Income and Wealth, 63(2), 460-477. [CrossRef]
- Hueting, R. (1980). New Scarcity and Economic Growth. North-Holland, Amsterdam.
- Desai, M. (1994). The measurement problem in economics. Scottish Journal of Political Economy 41(1), 34-42. [CrossRef]
- Hoffrén, J. (2001). Measuring the Eco-efficiency of Welfare Generation in a National Economy. The Case of Finland. Statistics Finland, Research reports 233. Helsinki.
- Fabozzi, F.J., Focardi, S., Ponta, L., Rivoire, M. and Mazza, D. (2022). The economic theory of qualitative green growth. Structural Change and Economic Dynamics, 61, 242-254. [CrossRef]
- Max-Neef, M. (1995). Economic growth and quality of life: A threshold hypothesis. Ecological Economics 15, 115-118. [CrossRef]
- Arrow, K., Bolin, B., Costanza, R., Dasgupta, P., Folkee, C., Holling, C.S., Jansson, B.-O., Levin, S., Mäler, K.-G., Perring, C., and Pimentel, D. (1995). Economic growth, carrying capacity, and the environment. Ecological Economics 15(2), 91–95. [CrossRef]
- Bergh, van den, J. (2010). The GDP paradox. Journal of Economic Psychology, 30. 117-135. [CrossRef]
- WCED (1987). Our Common Future. World Commission on Environment and Development. New York: Oxford University Press, Inc.
- Jamieson, D. (1998). Sustainability and beyond. Ecological Economics 24, 183–192. [CrossRef]
- Schubert, A. and Láng, I. (2005). The Literature Aftermath Of The Brundtland Report ‘Our Common Future’. A Scientometric Study Based On Citations In Science And Social Science Journals. Environment, Development and Sustainability 7, 1–8. [CrossRef]
- Olawumi, T. and Chan, D.W.M. (2018). A scientometric review of global research on sustainability and sustainable development. Journal of Cleaner Production. Journal of Cleaner Production 183, 231–250. [CrossRef]
- De Toledo, R.F., Miranda Junior, H.L., Farias Filho, J.R. and Gomes Costa, H. (2019). A scientometric review of global research on sustainability and project management dataset. Data in Brief 25(3), 104312. [CrossRef]
- Hajan, M. and Kashani, S.J. (2021). Evolution of the concept of sustainability. From Brundtland Report to sustainable development goals. In Hussain, C.M. and Velasco-Muñoz, J.F. (eds), Sustainable Resource Management, Modern Approaches and Contexts. 1–24. Elsevier, Amsterdam/Oxford/ Cambridge, Ma. [CrossRef]
- Holden, E., Linnerud, K. and Banister, D. (2014). Sustainable development: Our Common Future revisited. Global Environmental Change 26, 130–139. [CrossRef]
- Gibbes, C., Hopkins, A.L., Díaz, A.I. and Jimenez-Osornio, J. (2018). Defining and measuring sustainability: a systematic review of studies in rural Latin America and the Caribbean. Environment, Development and Sustainability 22, 447–468. [CrossRef]
- Phillips, J. (2023). Quantifying the levels, nature, and dynamics of sustainability for the UK 2000–2018 from a Brundtland perspective. Environment, Development and Sustainability, online. [CrossRef]
- Purvis, B., Mao, Y. and Robinson, D. (2019). Three pillars of sustainability: in search of conceptual origins. Sustainability Science 14, 681–695. [CrossRef]
- Du Pisani, J.A. (2006). Sustainable development—historical roots of the concept. Environmental Science 3, 83–96. [CrossRef]
- Meadows, D.H., Meadows, D.L., Randers, J.; and Behrens III, W.W. (1972). The Limits to Growth; A Report for the Club of Rome's Project on the Predicament of Mankind. New York: Universe Books.
- Georgescu-Roegen, N., (1986). The entropy law and the economic process in retrospect. Eastern Economic Journal 12(1), pp.3–25.
- Daly, H.E. (1990). Toward some operational principles of sustainable development. Ecological Economics 2, 1–6. [CrossRef]
- Cleveland, C.J. and Ruth, M. (1997). When, where, and by how much do biophysical limits constrain the economic process? A survey of Nicholas Georgescu-Roegen´s contribution to ecological economics? Ecological Economics 22, 203–223. [CrossRef]
- Kaivo-oja, J. (1999). Alternative scenarios of social development: Is analytical sustainability policy analysis possible? How? Sustainable Development 7(3), 140–150. [CrossRef]
- Kaivo-oja, J. (2002). Social and ecological destruction in the first class: A plausible social development scenario. Sustainable Development 10(1), 63–66. [CrossRef]
- Dasgupta, P. (2007). The Idea of Sustainable Development. Sustainability Science 2, 5–11. [CrossRef]
- Bander, J.A. (2007). Viewpoint: Sustainability: Malthus revisited. Canadian Journal of Economics/Revue canadienne d'économique 40(1), 1–38. [CrossRef]
- Luukkanen, J. Kaivo-oja, J., and Vehmas, J. (2022). Comparative analysis of ASEAN countries using Sustainability Window and Doughnut Economy models. OIDA International Journal of Sustainable Development 15(1), 39–56.
- Solow, R.M. (1973). Is the end of the world at hand? Challenge 16 (1): 39–50. [CrossRef]
- Stiglitz, J.E. (1974). Growth with exhaustible natural resources: Efficient and optimal growth paths. The Review of Economic Studies 41: 123–137.
- Barbier, E.B. and Markandya, A. (1990). The conditions for achieving environmentally sustainable development. European Economic Review 34(2-3), 659–669. [CrossRef]
- Peretto, P.F. (2021). Thought scarcity to prosperity: Toward a theory of sustainable growth. Journal of Monetary Economics 117, 243–257. [CrossRef]
- Victor, P.A. (1991). Indicators of sustainable development. Some lessons from capital theory. Ecological Economics 4, 191–213. [CrossRef]
- Costanza, R. and Daly, H.E. (1992). Natural capital and sustainable development. Conservation Biology 6, 37–46. [CrossRef]
- Daly, H.E. (1993). Introduction to essays toward a steady-state economy. In H.E. Daly, K.N. Townsend. Valuing the Earth: Economics, Ecology, Ethics. Cambridge, MA: The MIT Press, 267-274.
- Daly, H.E. (1996). Beyond Growth. Boston: Beacon Press.
- Daly, H.E. (1997). Georgescu-Roegen versus Solow/Stiglitz. Ecological Economics 22, 261–266. [CrossRef]
- Trainer, T. (2020). De-growth: Some suggestions from the simpler way perspective. Ecological Economics 167, 106436. [CrossRef]
- Cleveland, C.J. and Ruth, M. (1997). When, where, and by how much do biophysical limits constrain the economic process? A survey of Nicholas Georgescu-Roegen´s contribution to ecological economics? Ecological Economics 22, 203–223. [CrossRef]
- Martinez-Alier, J. (2009). Socially sustainable economic de-growth. Development and Change 40(6), 1099–1119. [CrossRef]
- Martinez-Alier, J., Pascual, U., Vivien, F-D., and Zaccai, E. (2010). Sustainable de-growth: Mapping the context, criticism and future prospects of an emergent paradigm. Ecological Economics 69(9), 1741–1747. [CrossRef]
- Luukkanen et al., 2014.
- Kaivo-oja, J., Panula-Ontto, J., Vehmas, J., and Luukkanen, J. (2014b). Relationships of the dimensions of sustainability as measured by the sustainable society index framework. International Journal of Sustainable Development & World Ecology 21(1), 39–45. [CrossRef]
- Latouche, S. (2004). Degrowth economics. Why less should be so much more. Le Monde Diplomatique November 2004.
- Fournier, V. (2008). Escaping from the economy: the politics of degrowth. International Journal of Sociology and Social Policy 28(11/12), 528–545.
- Georgescu- Roegen, N. (1975). Energy and economic myth. Southern Economic Journal 41(3), 347–381. [CrossRef]
- Grossman, G. M., and Krueger, A. B. (1991). Environmental impacts of a North American Free Trade Agreement. National Bureau of Economic Research Working Paper 3914, NBER, Cambridge MA.
- Stern, D.I., (2004). The rise and fall of the Environmental Kuznets curve, World Development 32(8), 1419–1439. [CrossRef]
- Commoner, B., 1972. A bulletin dialogue on ‘the closing circle’: response. Bulletin of the Atomic Scientists 28, 42–56.
- Ehrlich, P.R., Holdren, J.P., (1972). A bulletin dialogue on the ‘closing circle’: critique one-dimensional ecology. Bulletin of the Atomic Scientists 28, 16–27.
- Chertow, M.R. (2001). The IPAT Equation and Its Variants. Changing Views of Technology and Environmental Impact. Journal of Industrial Ecology 4(4), 13–29. [CrossRef]
- Kaya, Y., (1990). Impact of carbon dioxide emission control on GNP growth: interpretation of proposed scenarios. In: Paper presented to the IPCC Energy and Industry Subgroup, Response Strategies Working Group. Paris (mimeo).
- Wang, H., Ang, B.W. and Su, B., (2017). Assessing drivers of economy-wide energy use and emissions: IDA versus SDA. Energy Policy 107, 585–599. [CrossRef]
- Luukkanen, J., Kaivo-oja, J., Vähäkari, N., O’Mahony, T., Korkeakoski, M., Panula-Ontto, J.1, Phonhalath, K., Nanthavong, K., Reincke, K., Vehmas, J, and Hogarth, N.J. (2019) Green economic development in Lao PDR: a Sustainability Window analysis of Green Growth Productivity and the Efficiency Gap. Journal of Cleaner Production 211, 818–829. [CrossRef]
- Waas, T., Hugé, J., Block, T., Wright, T., Benitez-Capistros, F. and Verbruggen, A. (2014). Sustainability Assessment and Indicators: Tools in a Decision-Making Strategy for Sustainable Development. Sustainability 6(9), 5512–5534. [CrossRef]
- Luukkanen, J., Kaivo-oja, J., Vehmas, J., Panula-Ontto, J., and Häyhä, L., (2015). Dynamic sustainability. Sustainability window analysis of Chinese poverty-environment nexus development. Sustainability 7(11), 14488–14500. [CrossRef]
- Hueting, R. (1990). The Brundtland Report: A matter of conflicting goals. Ecological Economics 2, 109–117. [CrossRef]
- Lélé, S. (1991). Sustainable development: A critical review. World Development, 19(6), 607–621. [CrossRef]
- Bolis, I., Morioka, S.N. and Sznelwar, L.-I. (2014). When sustainable development risks losing its meaning. Delimiting the concept with a comprehensive literature review and a conceptual model. Journal of Cleaner Production, Vol. 83, 7-20. [CrossRef]
- Bolis, I., Morioka, S.N. and Sznelwar, L.-I. (2017). Are we making decisions in a sustainable way? A comprehensive literature review about rationalities for sustainable development. Journal of Cleaner Production. Vol. 145, 310-322. [CrossRef]
- Gusmão Caiado, R.G., Leal Filho, W. and Ávila, Lucas Veigas (2018). A literature-based review on potentials and constraints in the implementation of the sustainable development goals. Journal of Cleaner Production. Vol. 198, 1276-1288. [CrossRef]
- Mensah, J. (2019). Sustainable development: Meaning, history, principles, pillars, and implications for human action: Literature review. Cogent Social Sciences, Vol. 5, No. 1, 1-21. [CrossRef]
- Hickel, J. (2019). The contradiction of the Sustainable Development Goals: Growth versus ecology on a finite planet. Sustainable Development 27(5), 873–884. [CrossRef]
- Stiglitz, J. E., Sen, A., and Fitoussi, J. P. (2009). Report by the Commission on the Measurement of Economic Performance and Social Progress. Paris: Commission on the Measurement of Economic Performance and Social Progress.
- Fleurbaey, M., (2009). Beyond GDP: the quest for a measure of social welfare. Journal of Economic Literature 47(4), 1029–1075. [CrossRef]
- Sathaye, J., A. Najam, C. Cocklin, T. Heller, F. Lecocq, J. Llanes-Regueiro, J. Pan, G. Petschel-Held , S. Rayner, J. Robinson, R. Schaeffer, Y. Sokona, R. Swart, H. Winkler (2007). Sustainable Development and Mitigation. In Climate Change 2007: Mitigation. Contribution of Working Group III to the Fourth Assessment Report of the Intergovernmental Panel on Climate Change [B. Metz, O.R. Davidson, P.R. Bosch, R. Dave, L.A. Meyer (eds)], Cambridge University Press, Cambridge, United Kingdom and New York, NY, USA.
- Sabin, P., (2013). The Bet: Paul Ehrlich, Julian Simon: Our Gamble over Earth’s Future. Yale University Press. New Haven and London.
- Neumayer, E. (2010). Weak versus Strong Sustainability: Exploring the Limits of Two Opposing Paradigms. Edward Elgar, Cheltenham, UK; Northhampton, MA, 272. [CrossRef]
- uukkanen, J., Vehmas, J., Kaivo-oja, J., (2021). Quantification of doughnut economy with the sustainability window method: Analysis of development in Thailand, Sustainability 13(2), 847. [CrossRef]
- Saunders, A. and Luukkanen, J. (2022). Sustainable development in Cuba assessed with sustainability window and doughnut economy approaches. International Journal of Sustainable Development & World Ecology 29(2), 176–186. [CrossRef]
- Vehmas, J., Kaivo-oja, J. and Luukkanen, J. (2016). Sustainability cycles in China, India, and the world? Eastern European Business and Economics Journal 2(2), 139–164.
Figure 1.
Left: a typical representation of sustainability as three intersecting circles, right: alternative depictions: as literal ‘pillars’ and as concentric circles [38].
Figure 1.
Left: a typical representation of sustainability as three intersecting circles, right: alternative depictions: as literal ‘pillars’ and as concentric circles [38].
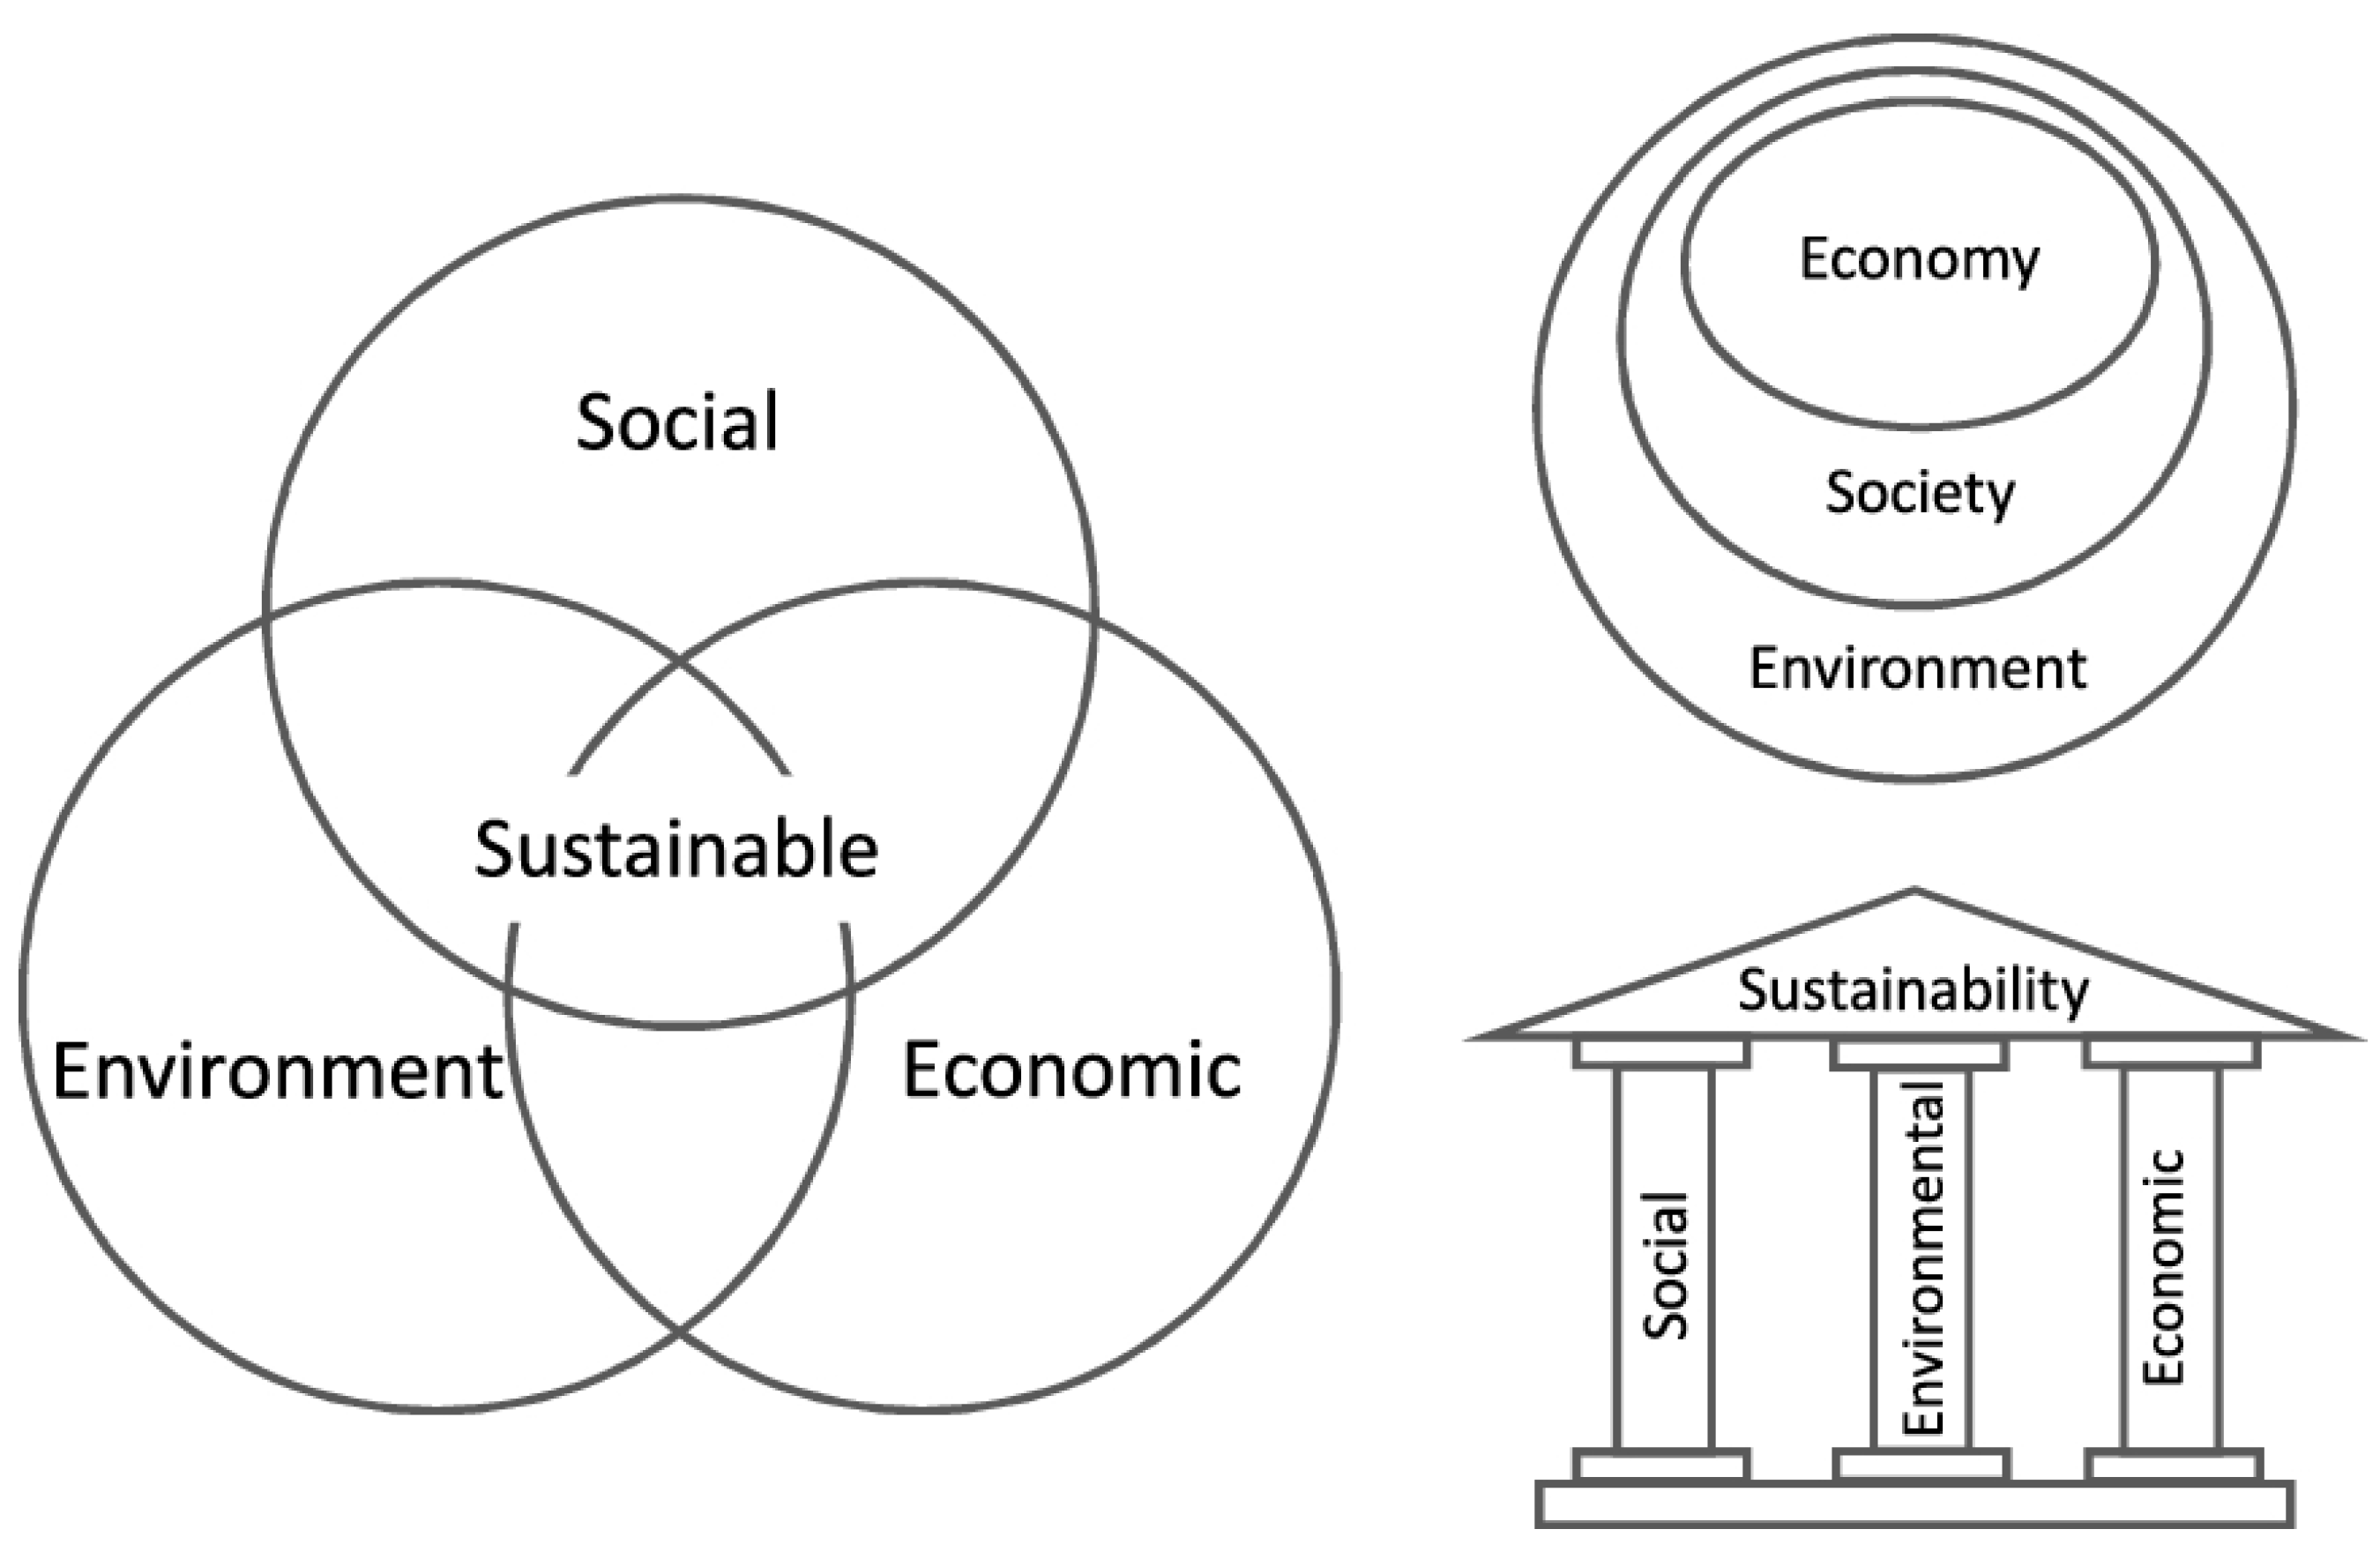
Figure 2.
Determining the maximum economic output related to the production of environmental stress.
Figure 2.
Determining the maximum economic output related to the production of environmental stress.
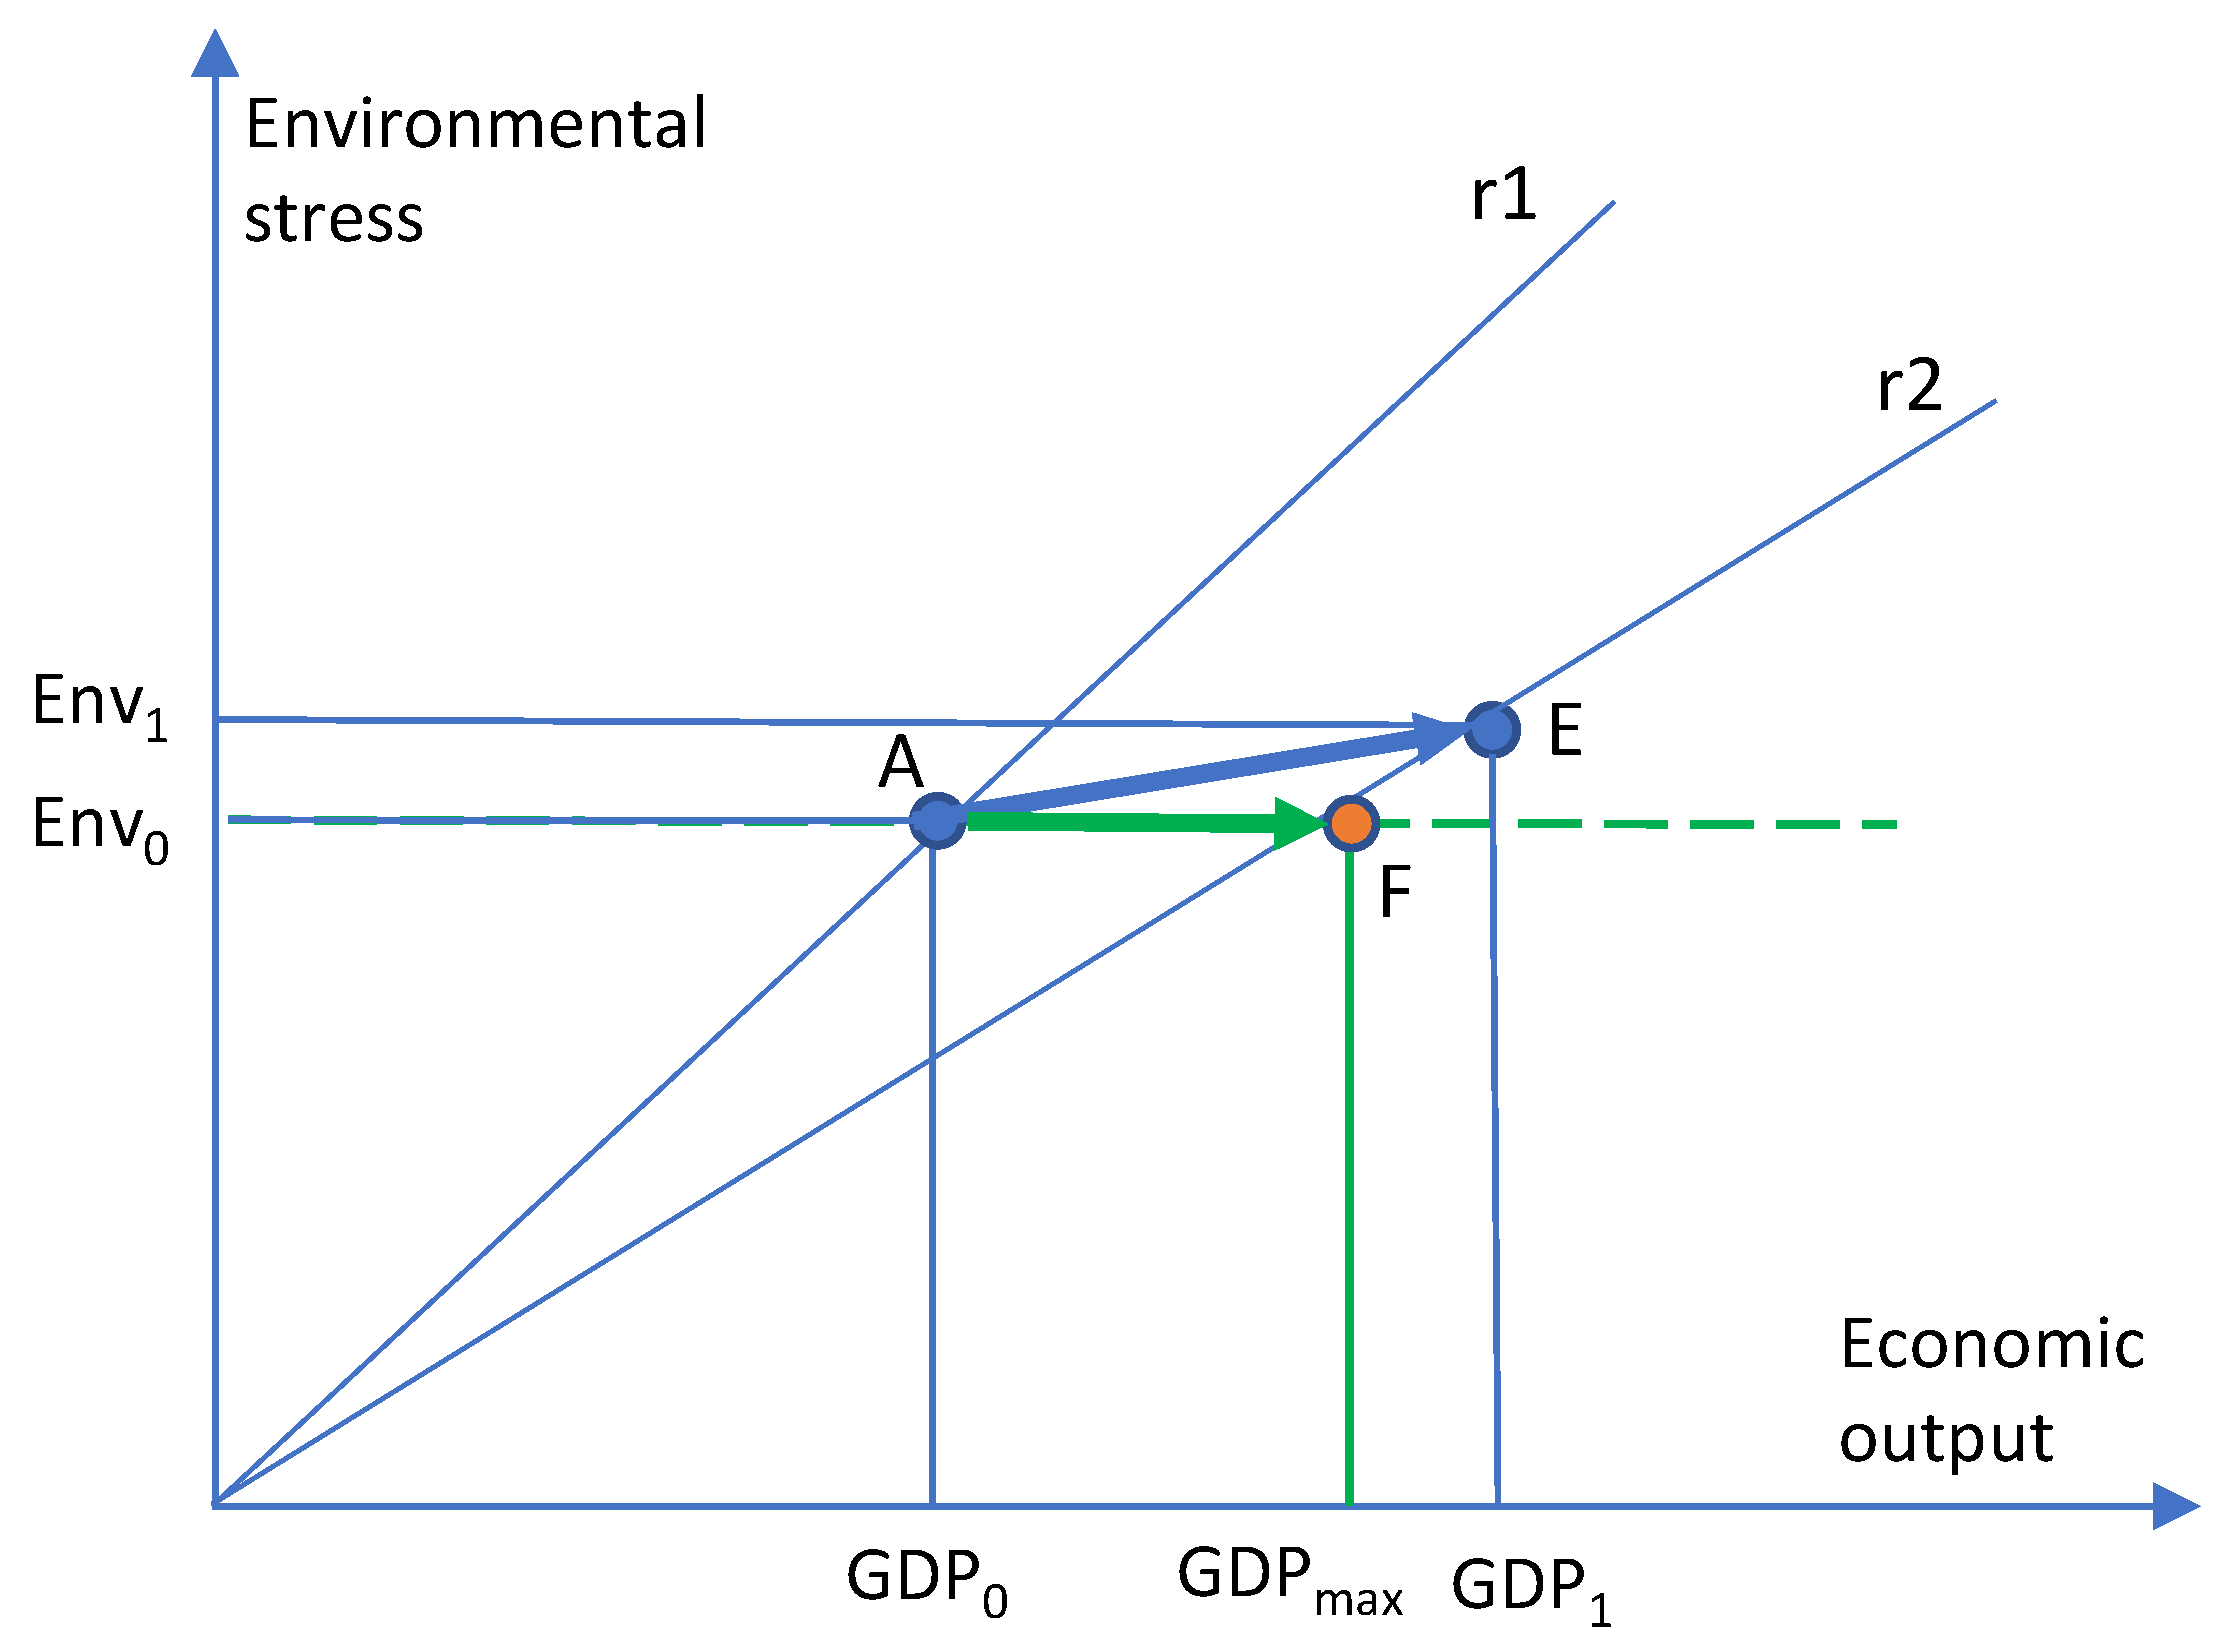
Figure 3.
Determining the minimum economic output not to decrease social welfare-.
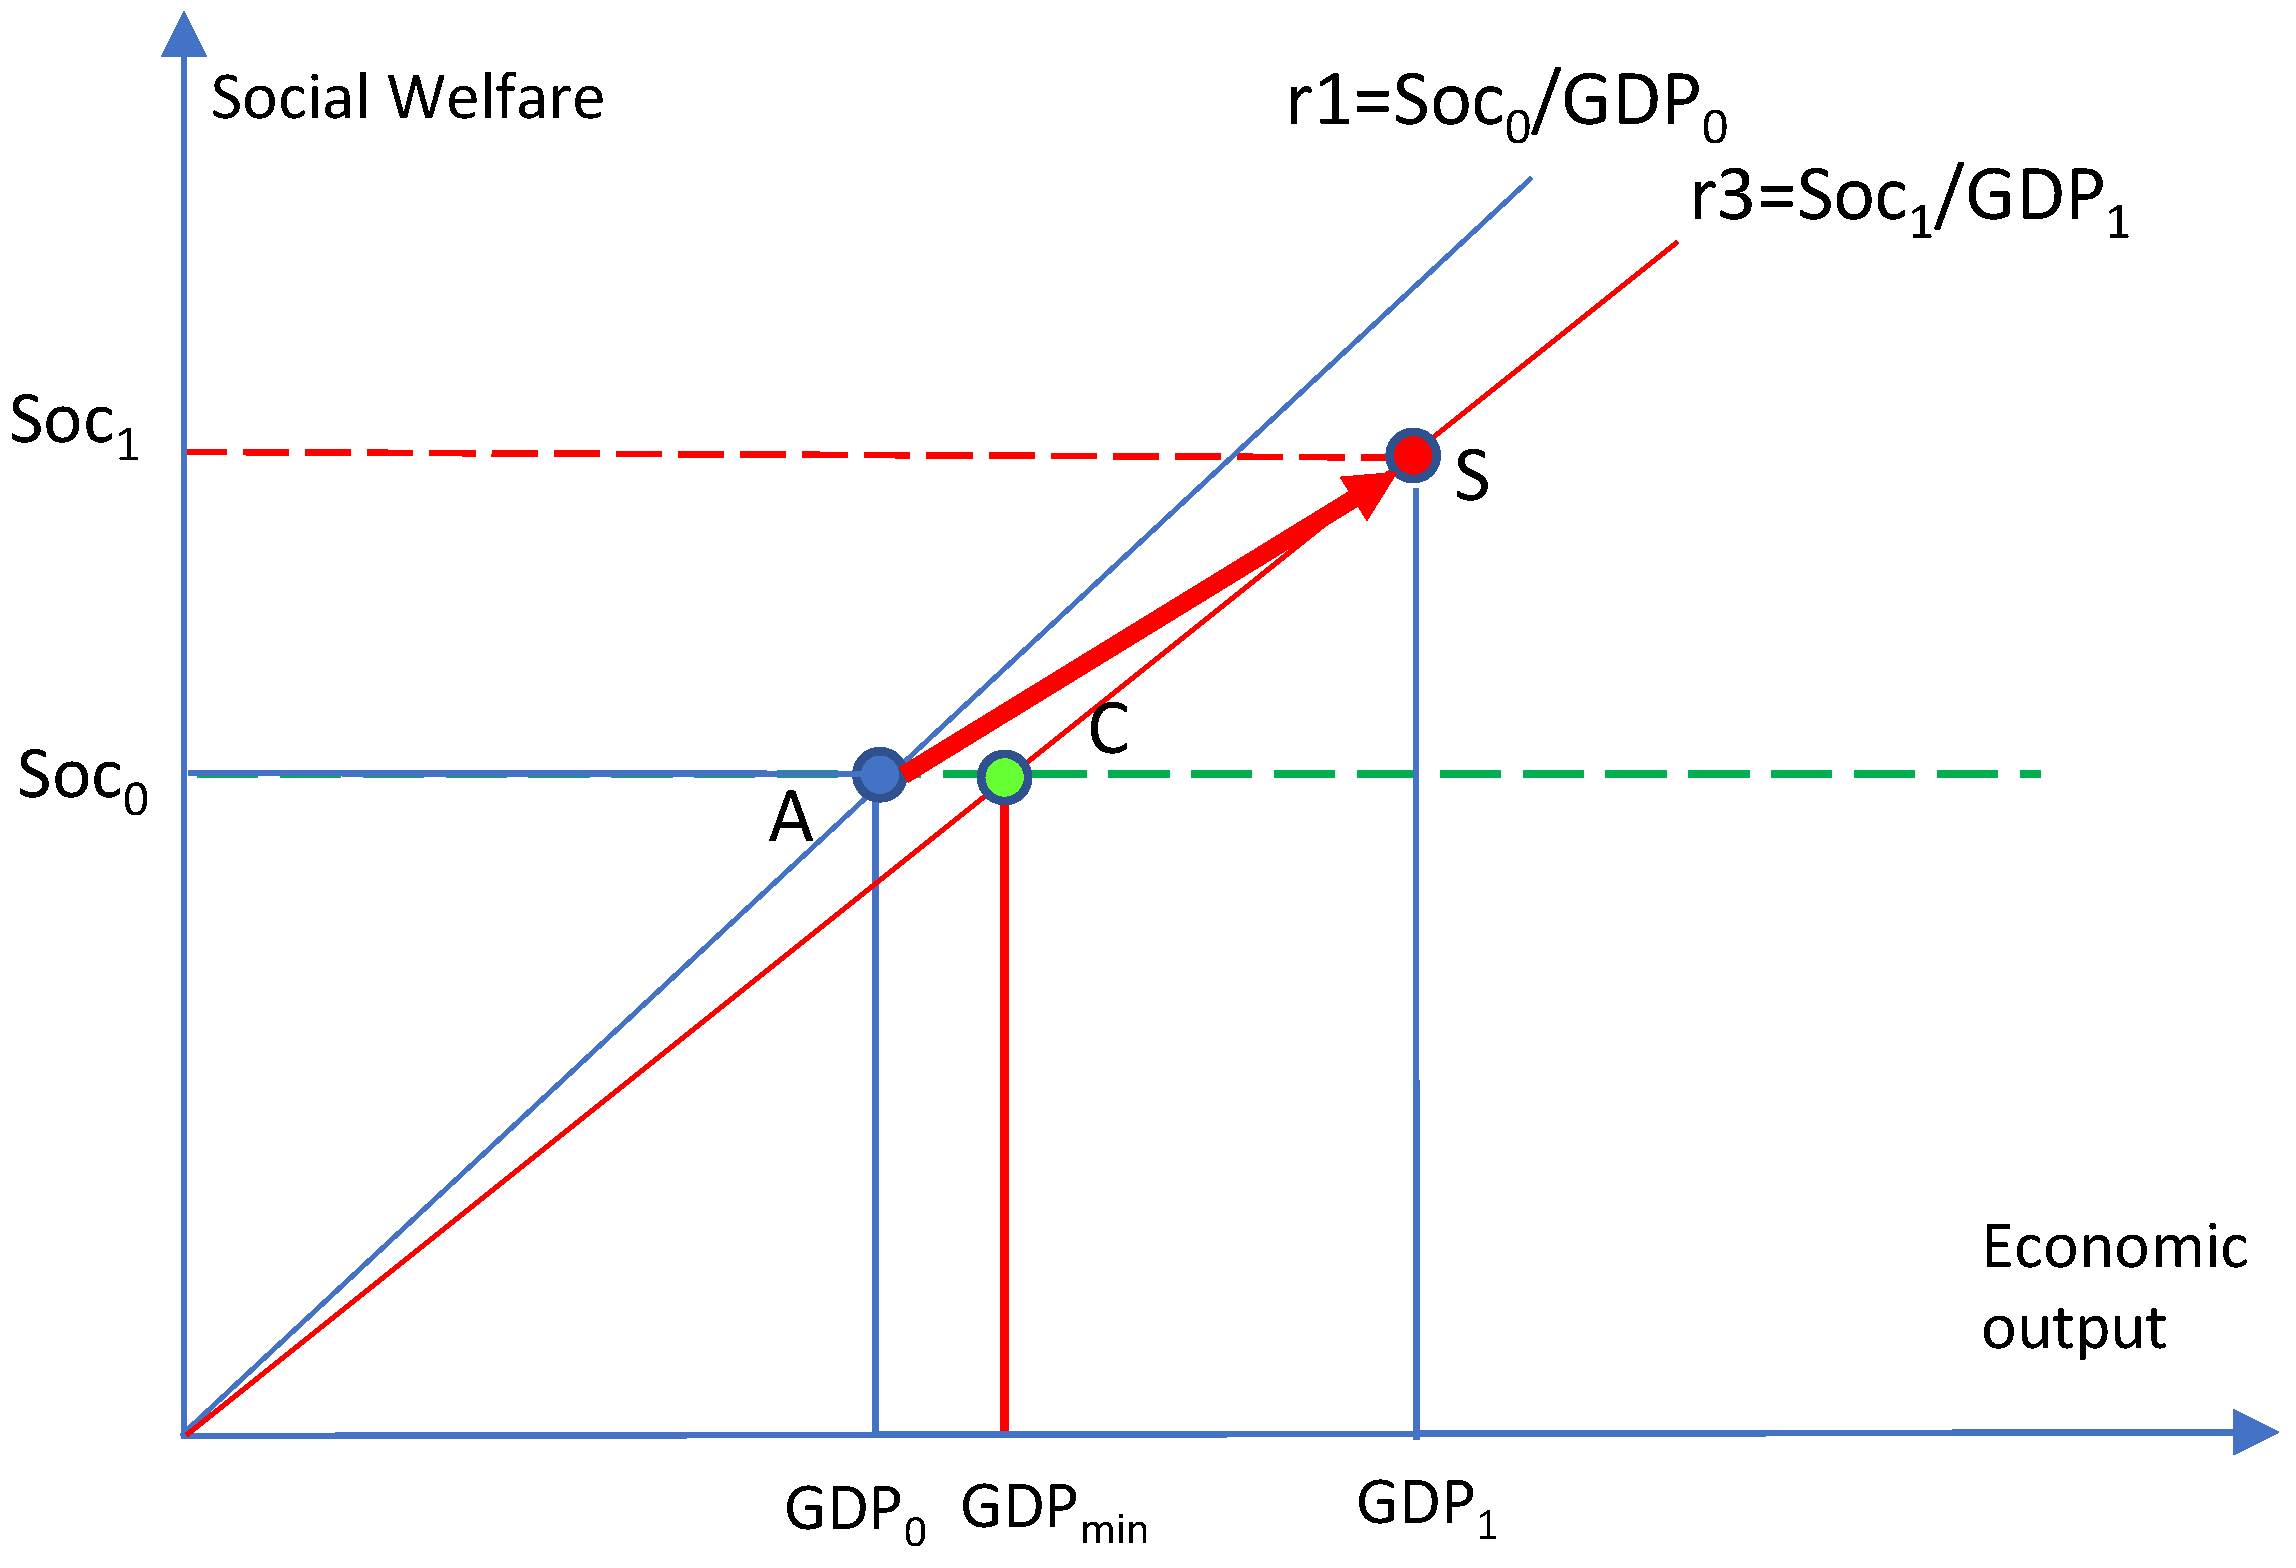
Figure 4.
Determining the Sustainability Window (SuWi) with the minimum (GDPmin) and maximum (GDPmax) economic output.
Figure 4.
Determining the Sustainability Window (SuWi) with the minimum (GDPmin) and maximum (GDPmax) economic output.
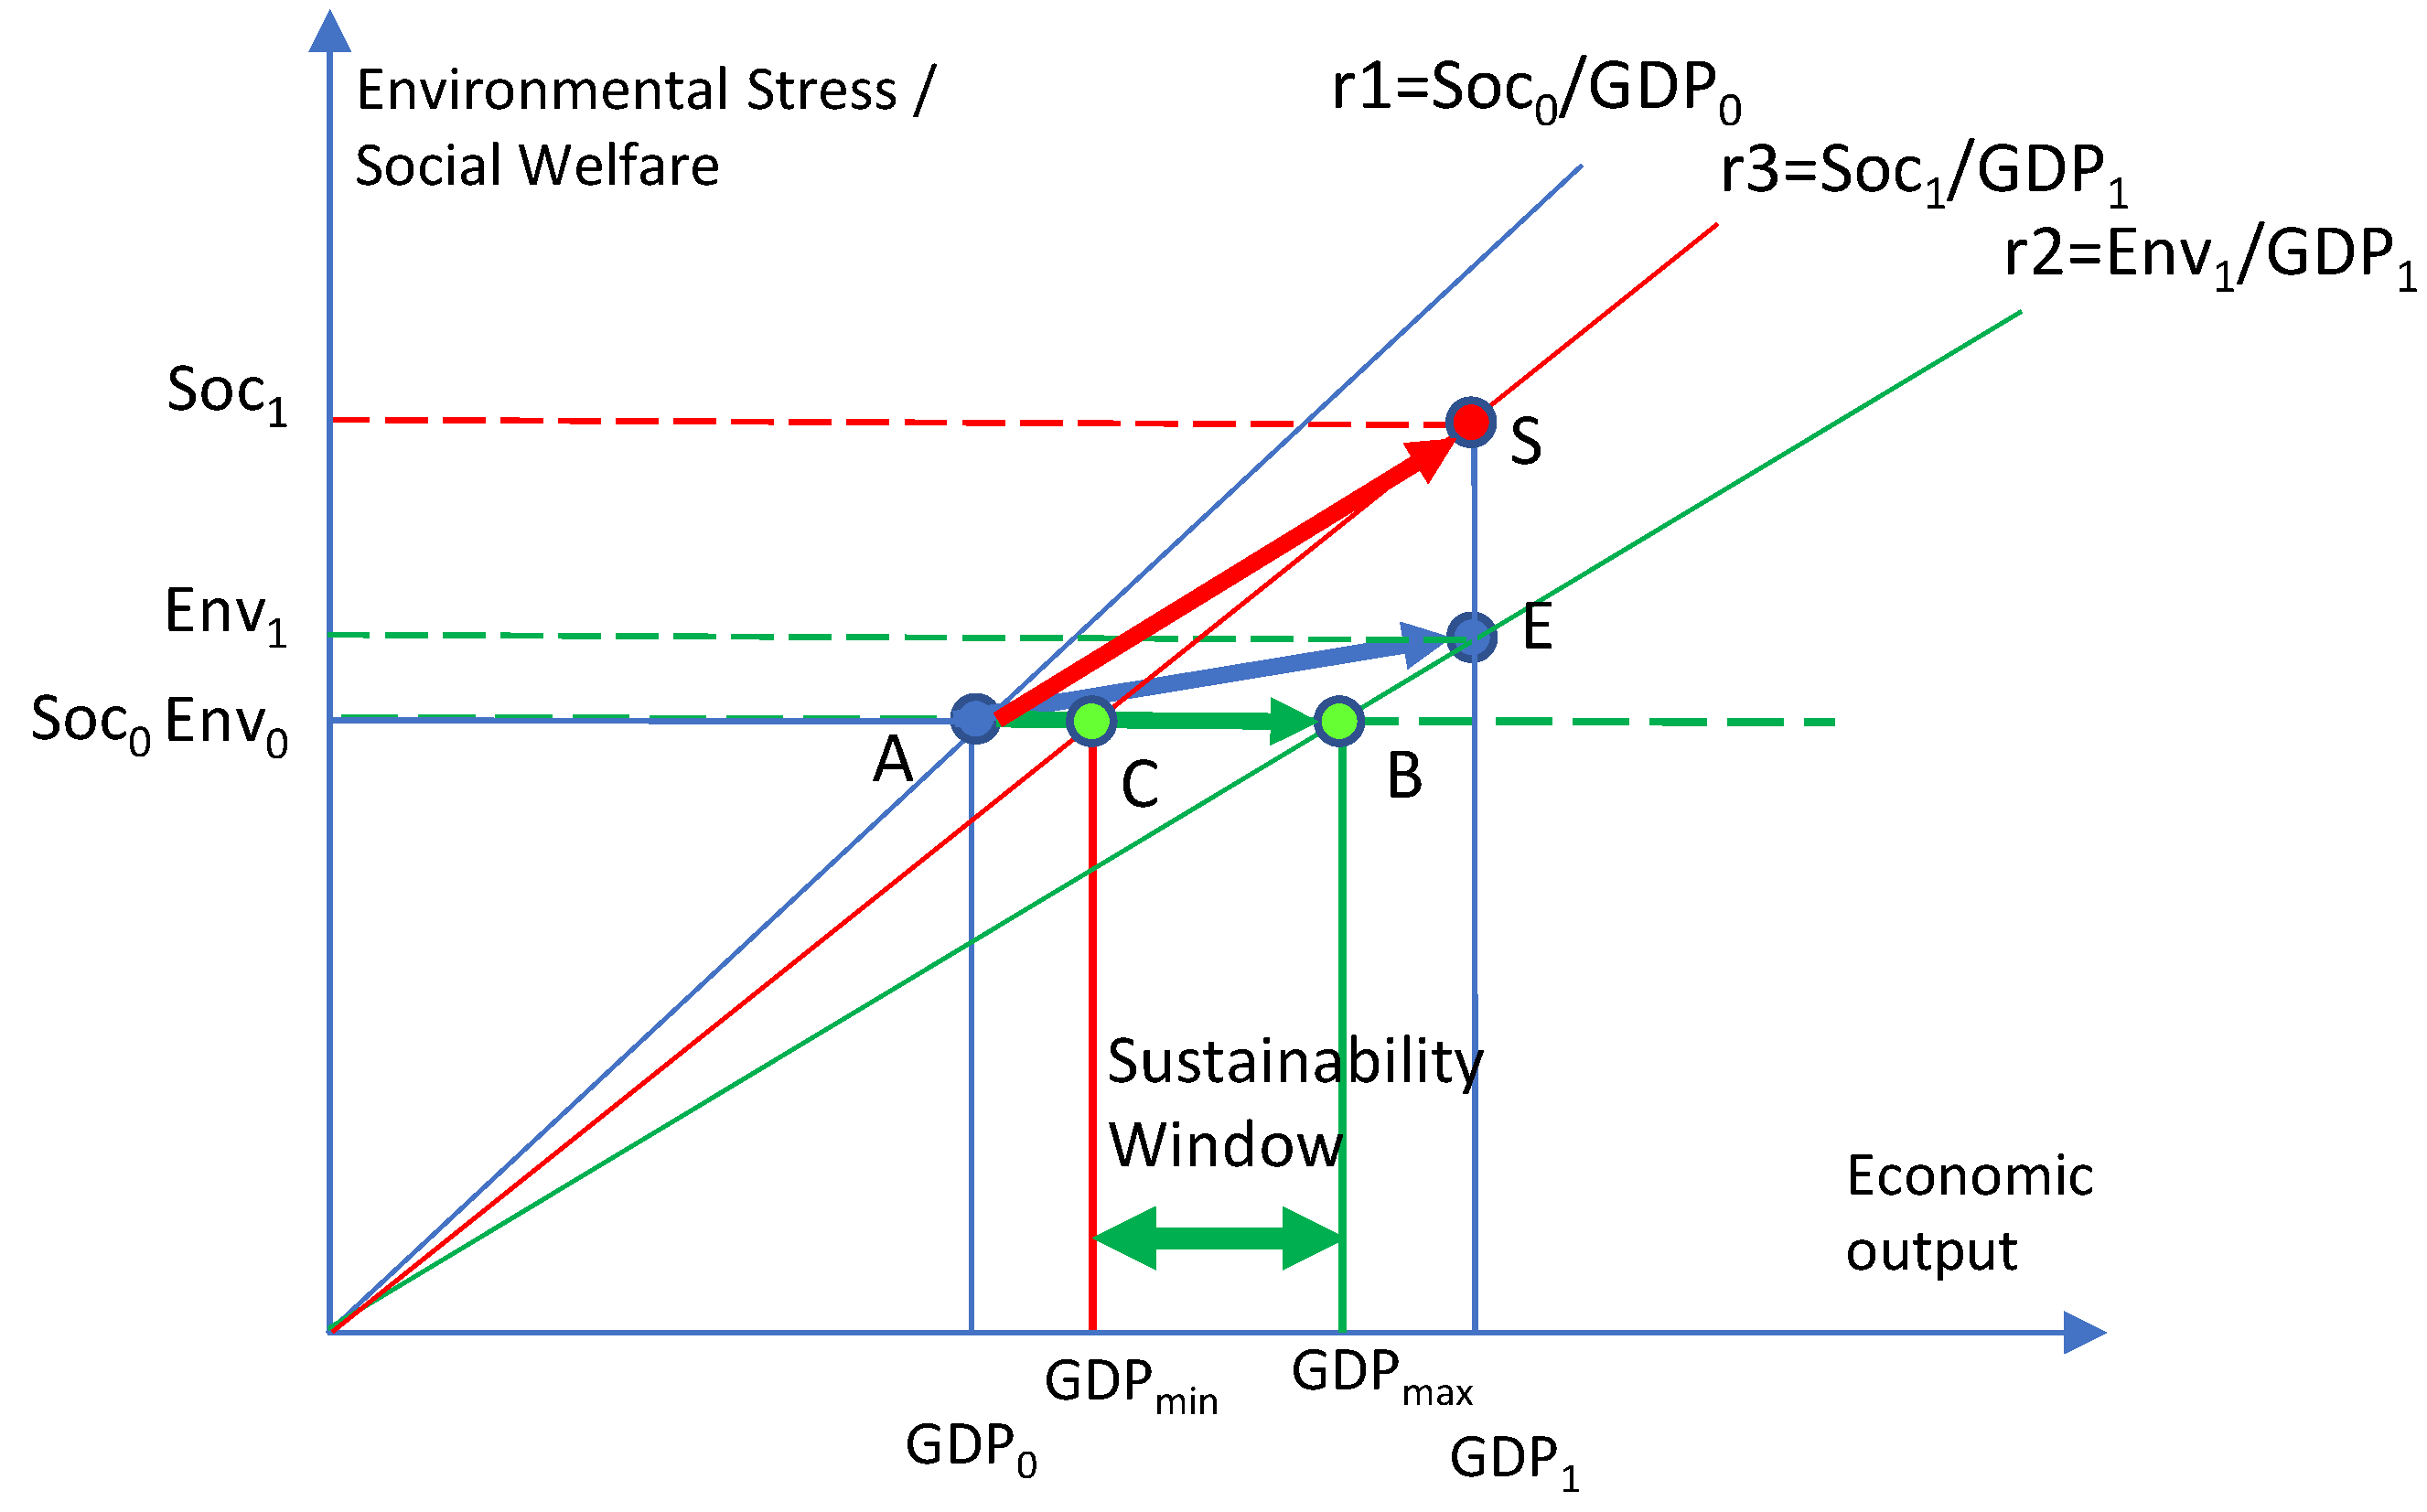
Figure 5.
Determining maximum economic output when environmental stress is decreasing (Env1 < Env0) and environmental stress productivity is decreasing (Env1/GDP1 < Env0/GDP0).
Figure 5.
Determining maximum economic output when environmental stress is decreasing (Env1 < Env0) and environmental stress productivity is decreasing (Env1/GDP1 < Env0/GDP0).
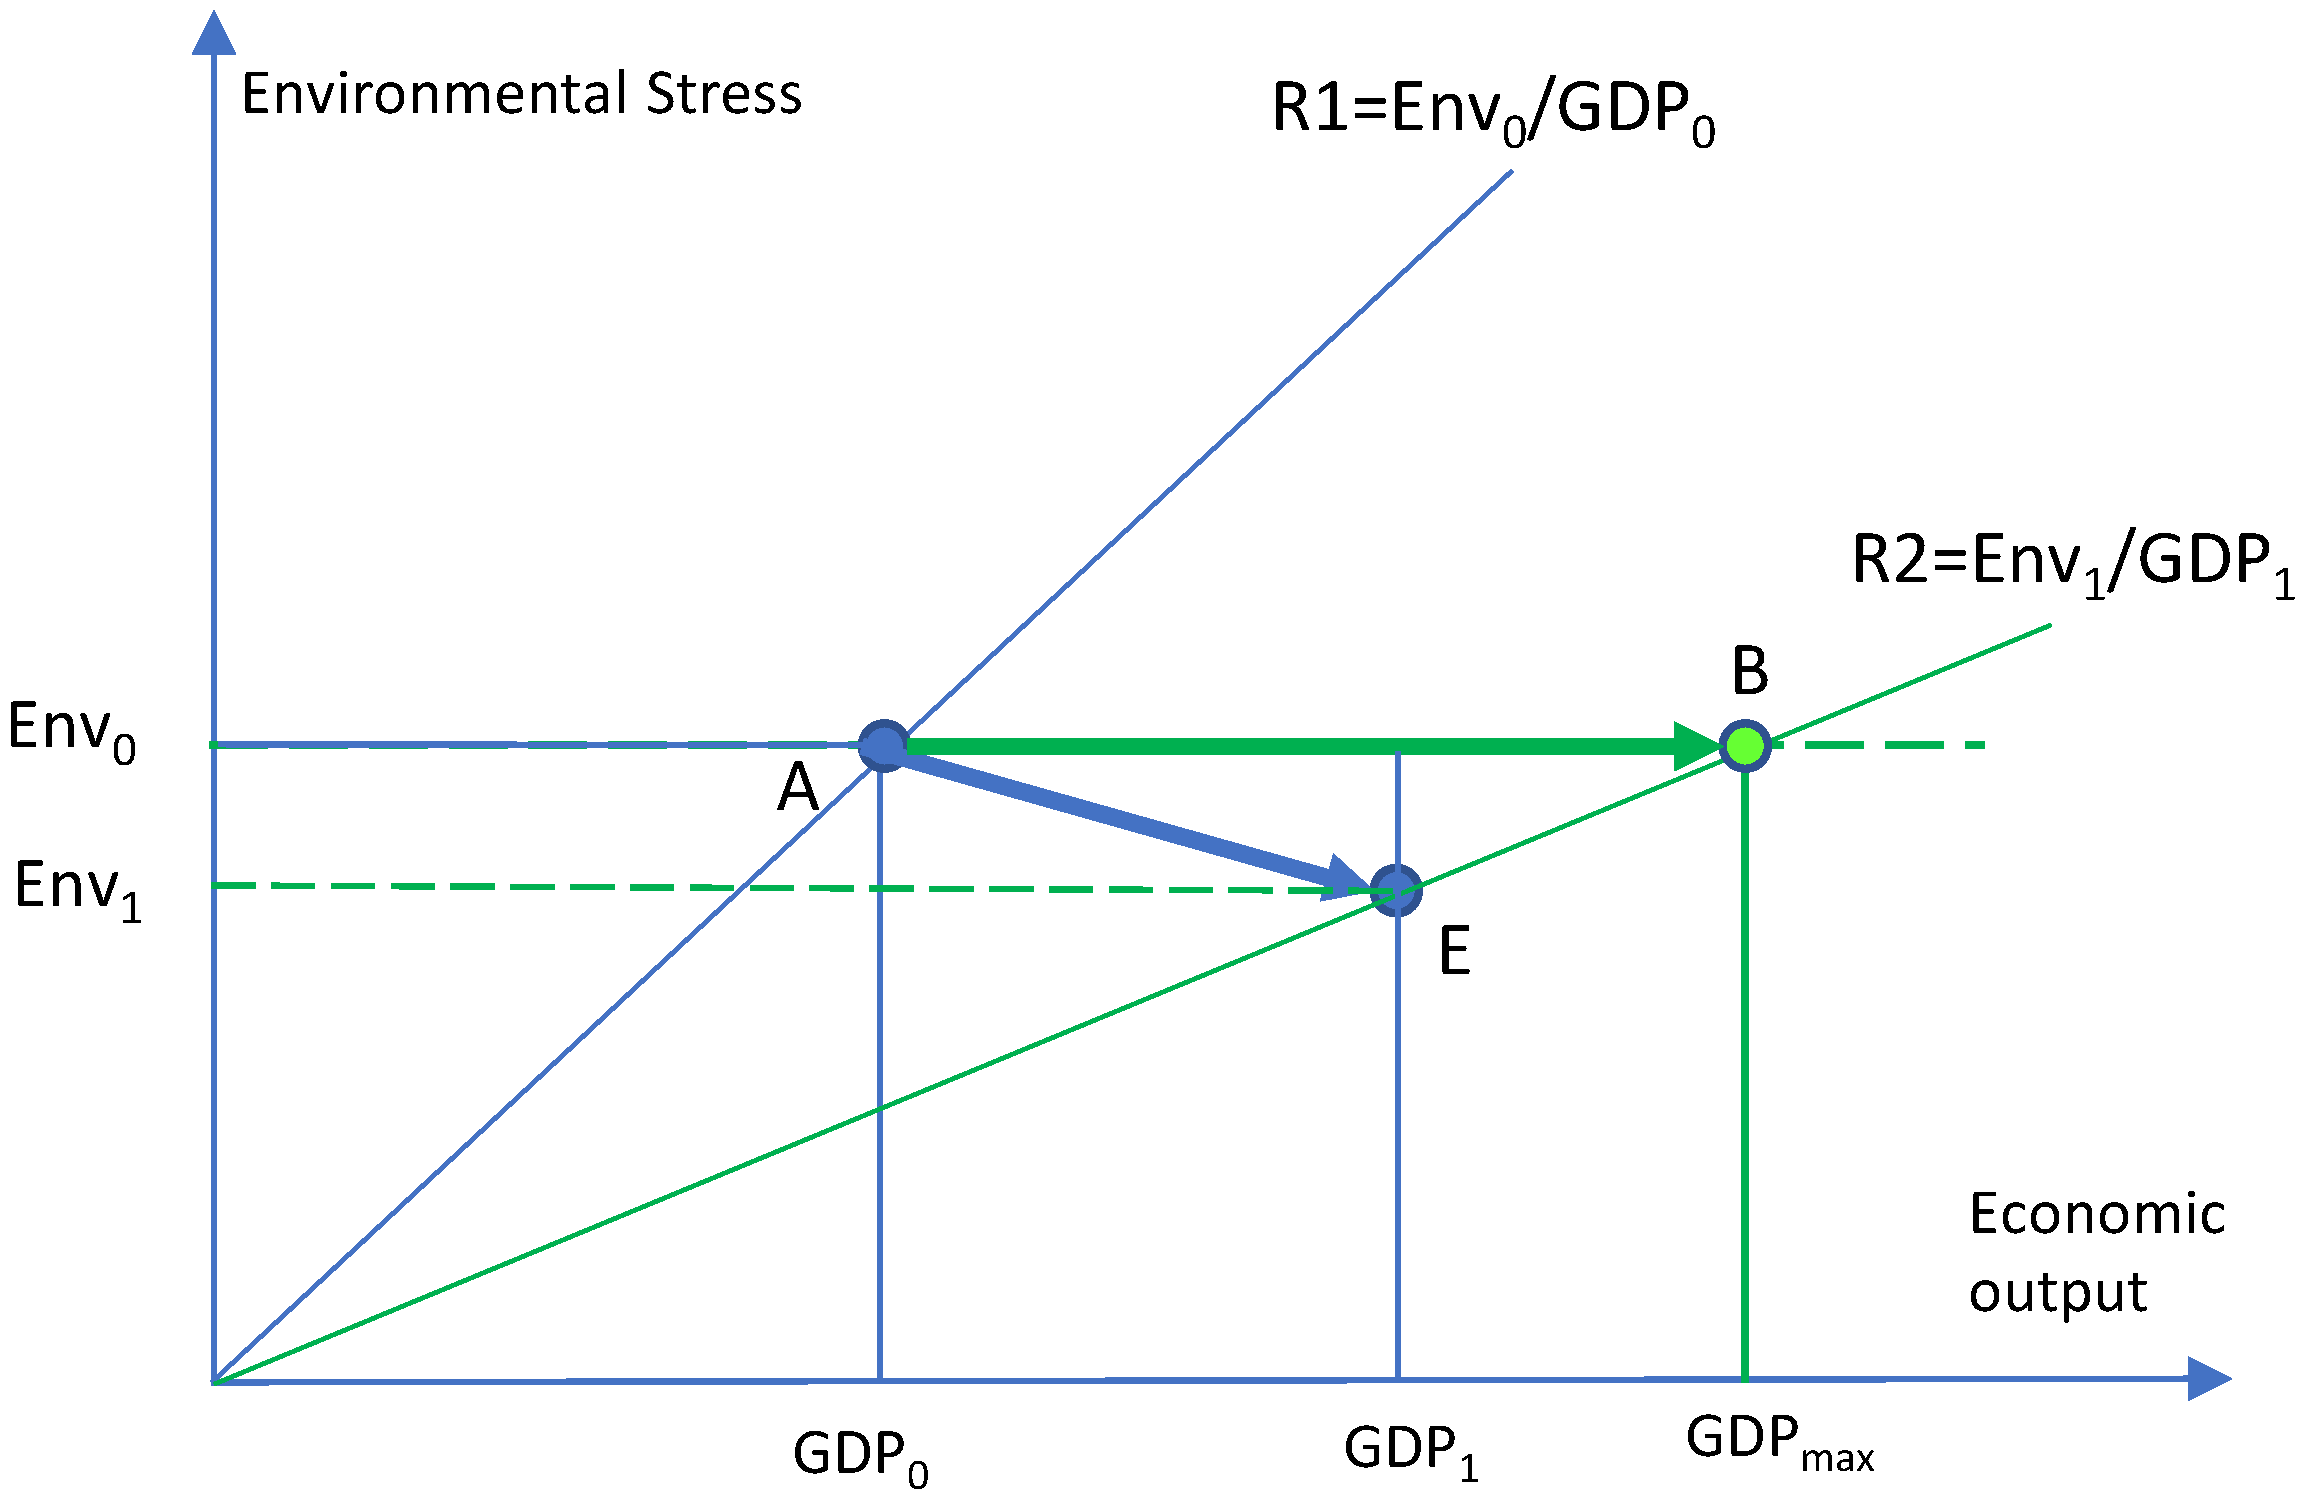
Figure 6.
Determining minimum economic output when social welfare is increasing (Soc1 > Soc0) and social welfare productivity is decreasing (Soc1/GDP1 < Soc0/GDP0).
Figure 6.
Determining minimum economic output when social welfare is increasing (Soc1 > Soc0) and social welfare productivity is decreasing (Soc1/GDP1 < Soc0/GDP0).
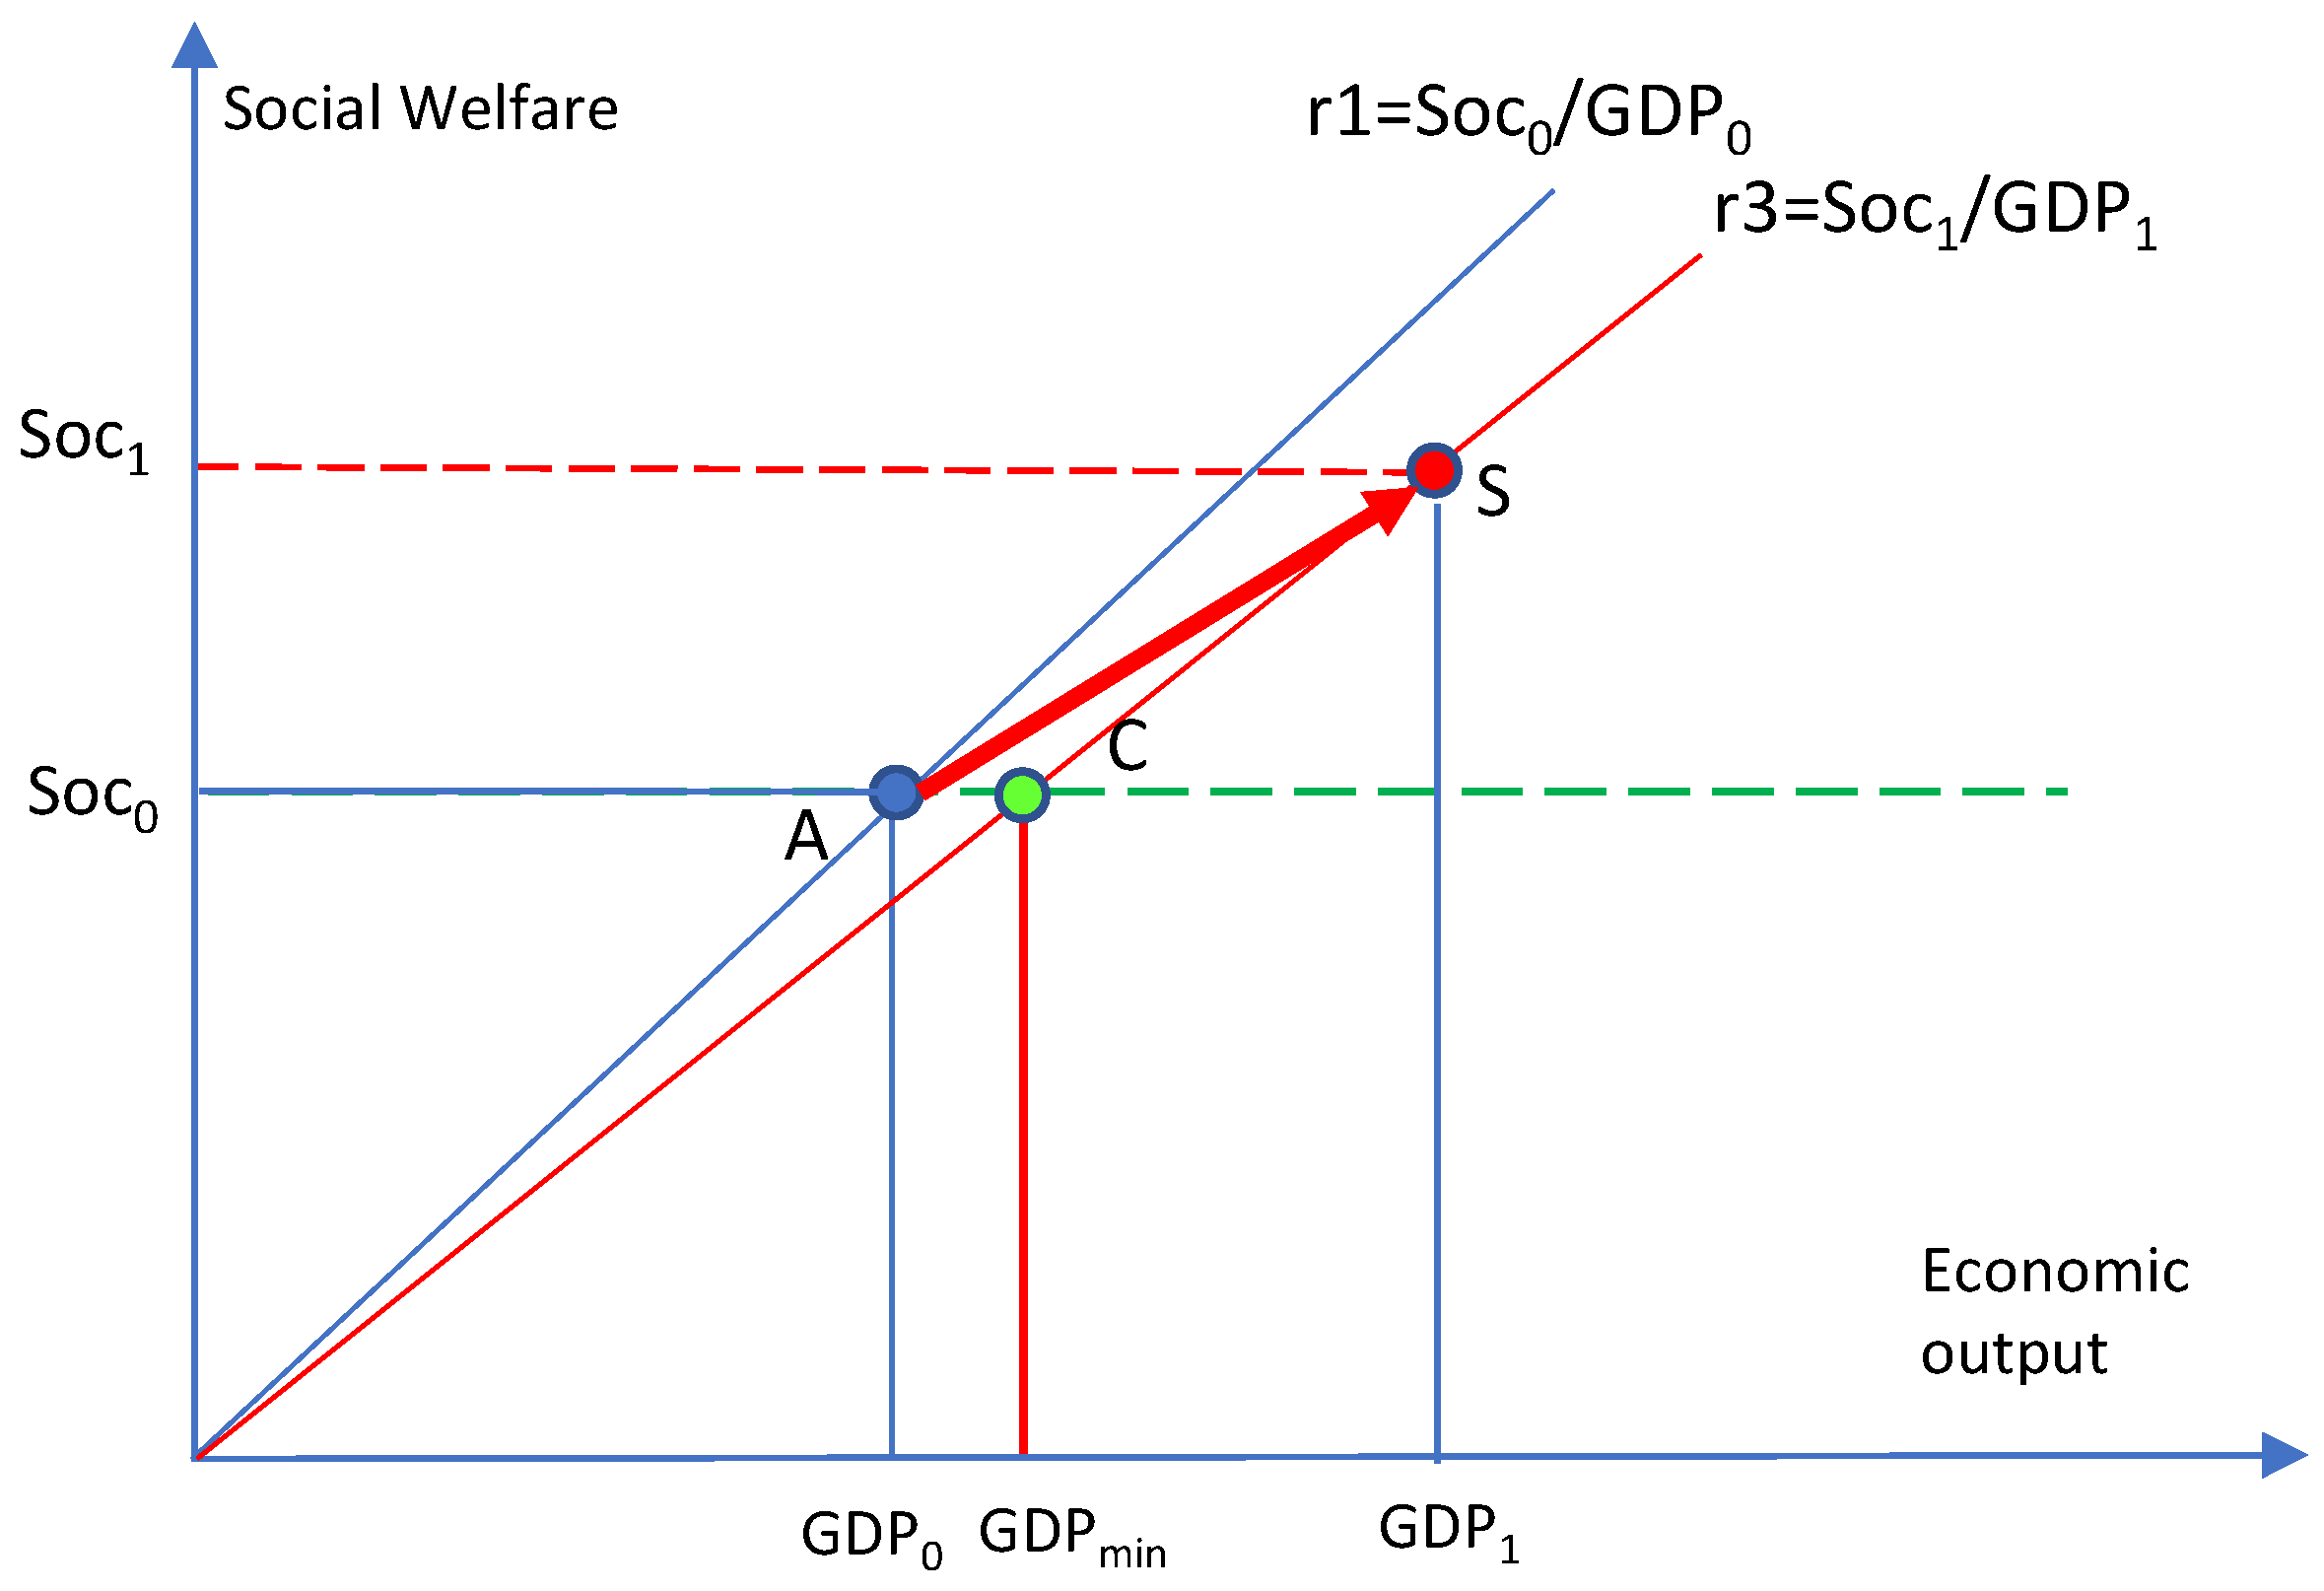
Figure 7.
Determining Sustainability Window in a case where the actual GDP output is within the Sustainability Window (GDPmin < GDP1 < GDPmax).
Figure 7.
Determining Sustainability Window in a case where the actual GDP output is within the Sustainability Window (GDPmin < GDP1 < GDPmax).
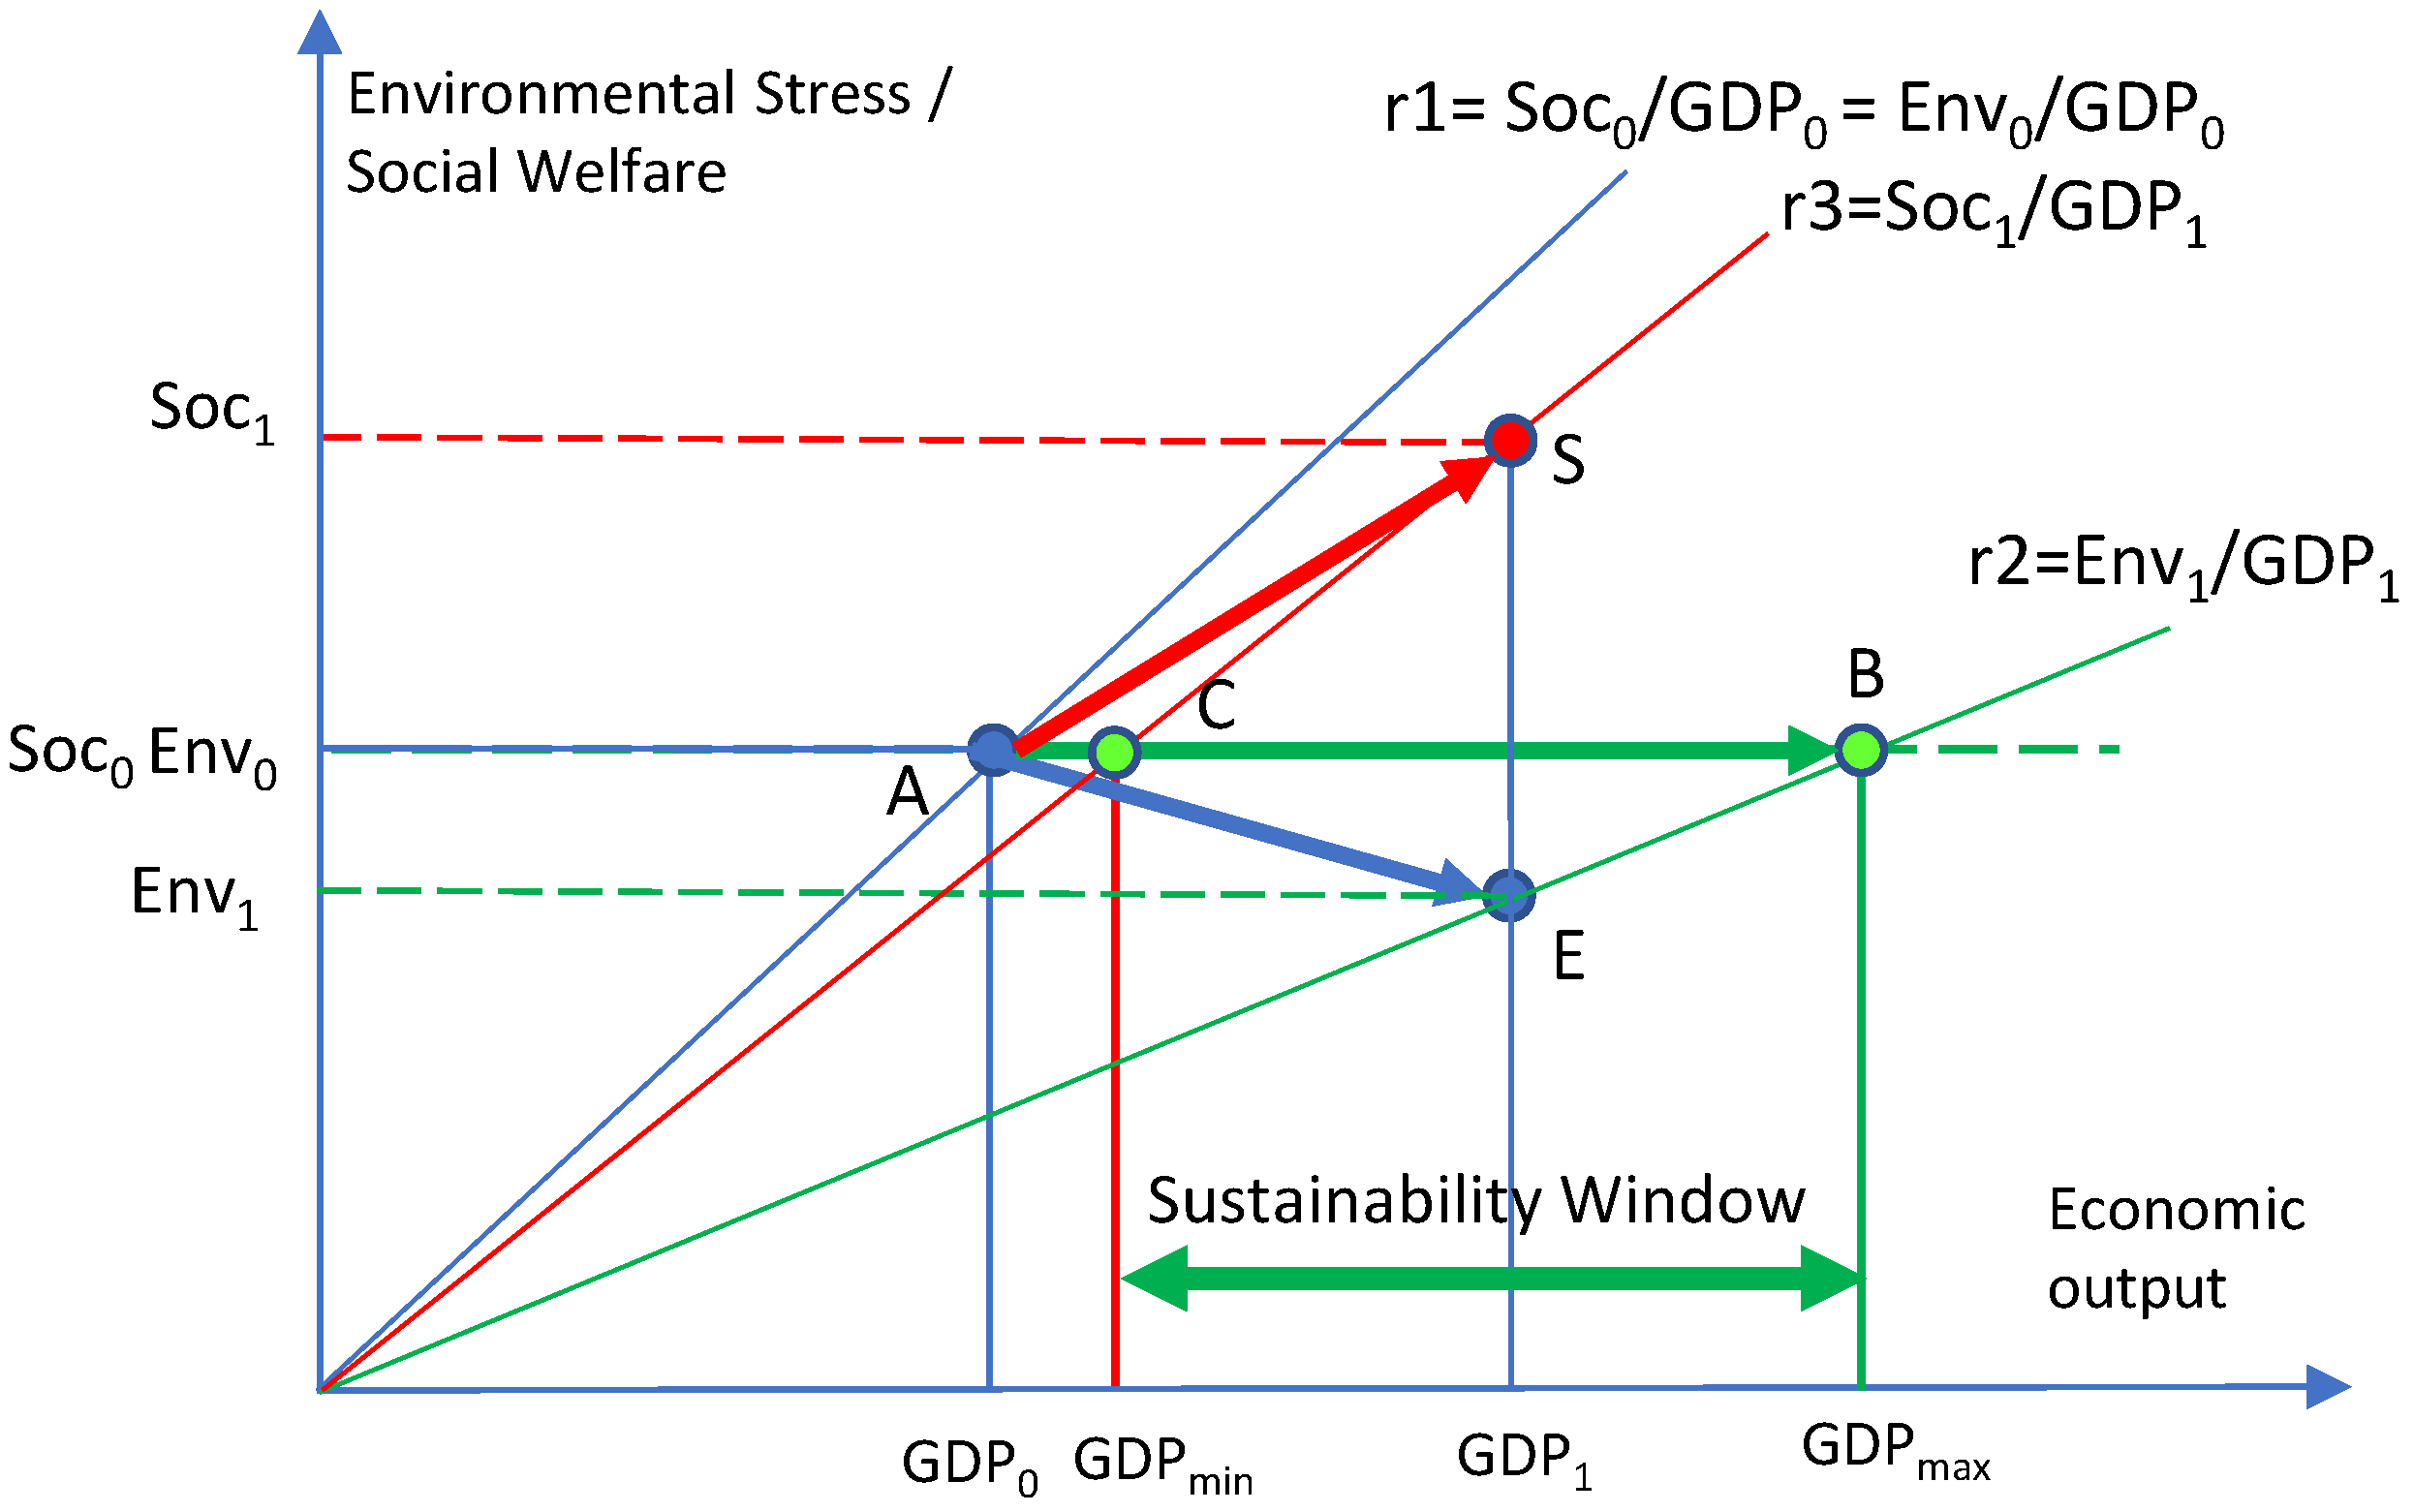
Figure 8.
Determining maximum economic output when the economy is decreasing (GDP1 < GDP0) environmental stress is decreasing (Env1 < Env0) and environmental stress productivity is decreasing (Env1/GDP1 < Env0/GDP0).
Figure 8.
Determining maximum economic output when the economy is decreasing (GDP1 < GDP0) environmental stress is decreasing (Env1 < Env0) and environmental stress productivity is decreasing (Env1/GDP1 < Env0/GDP0).
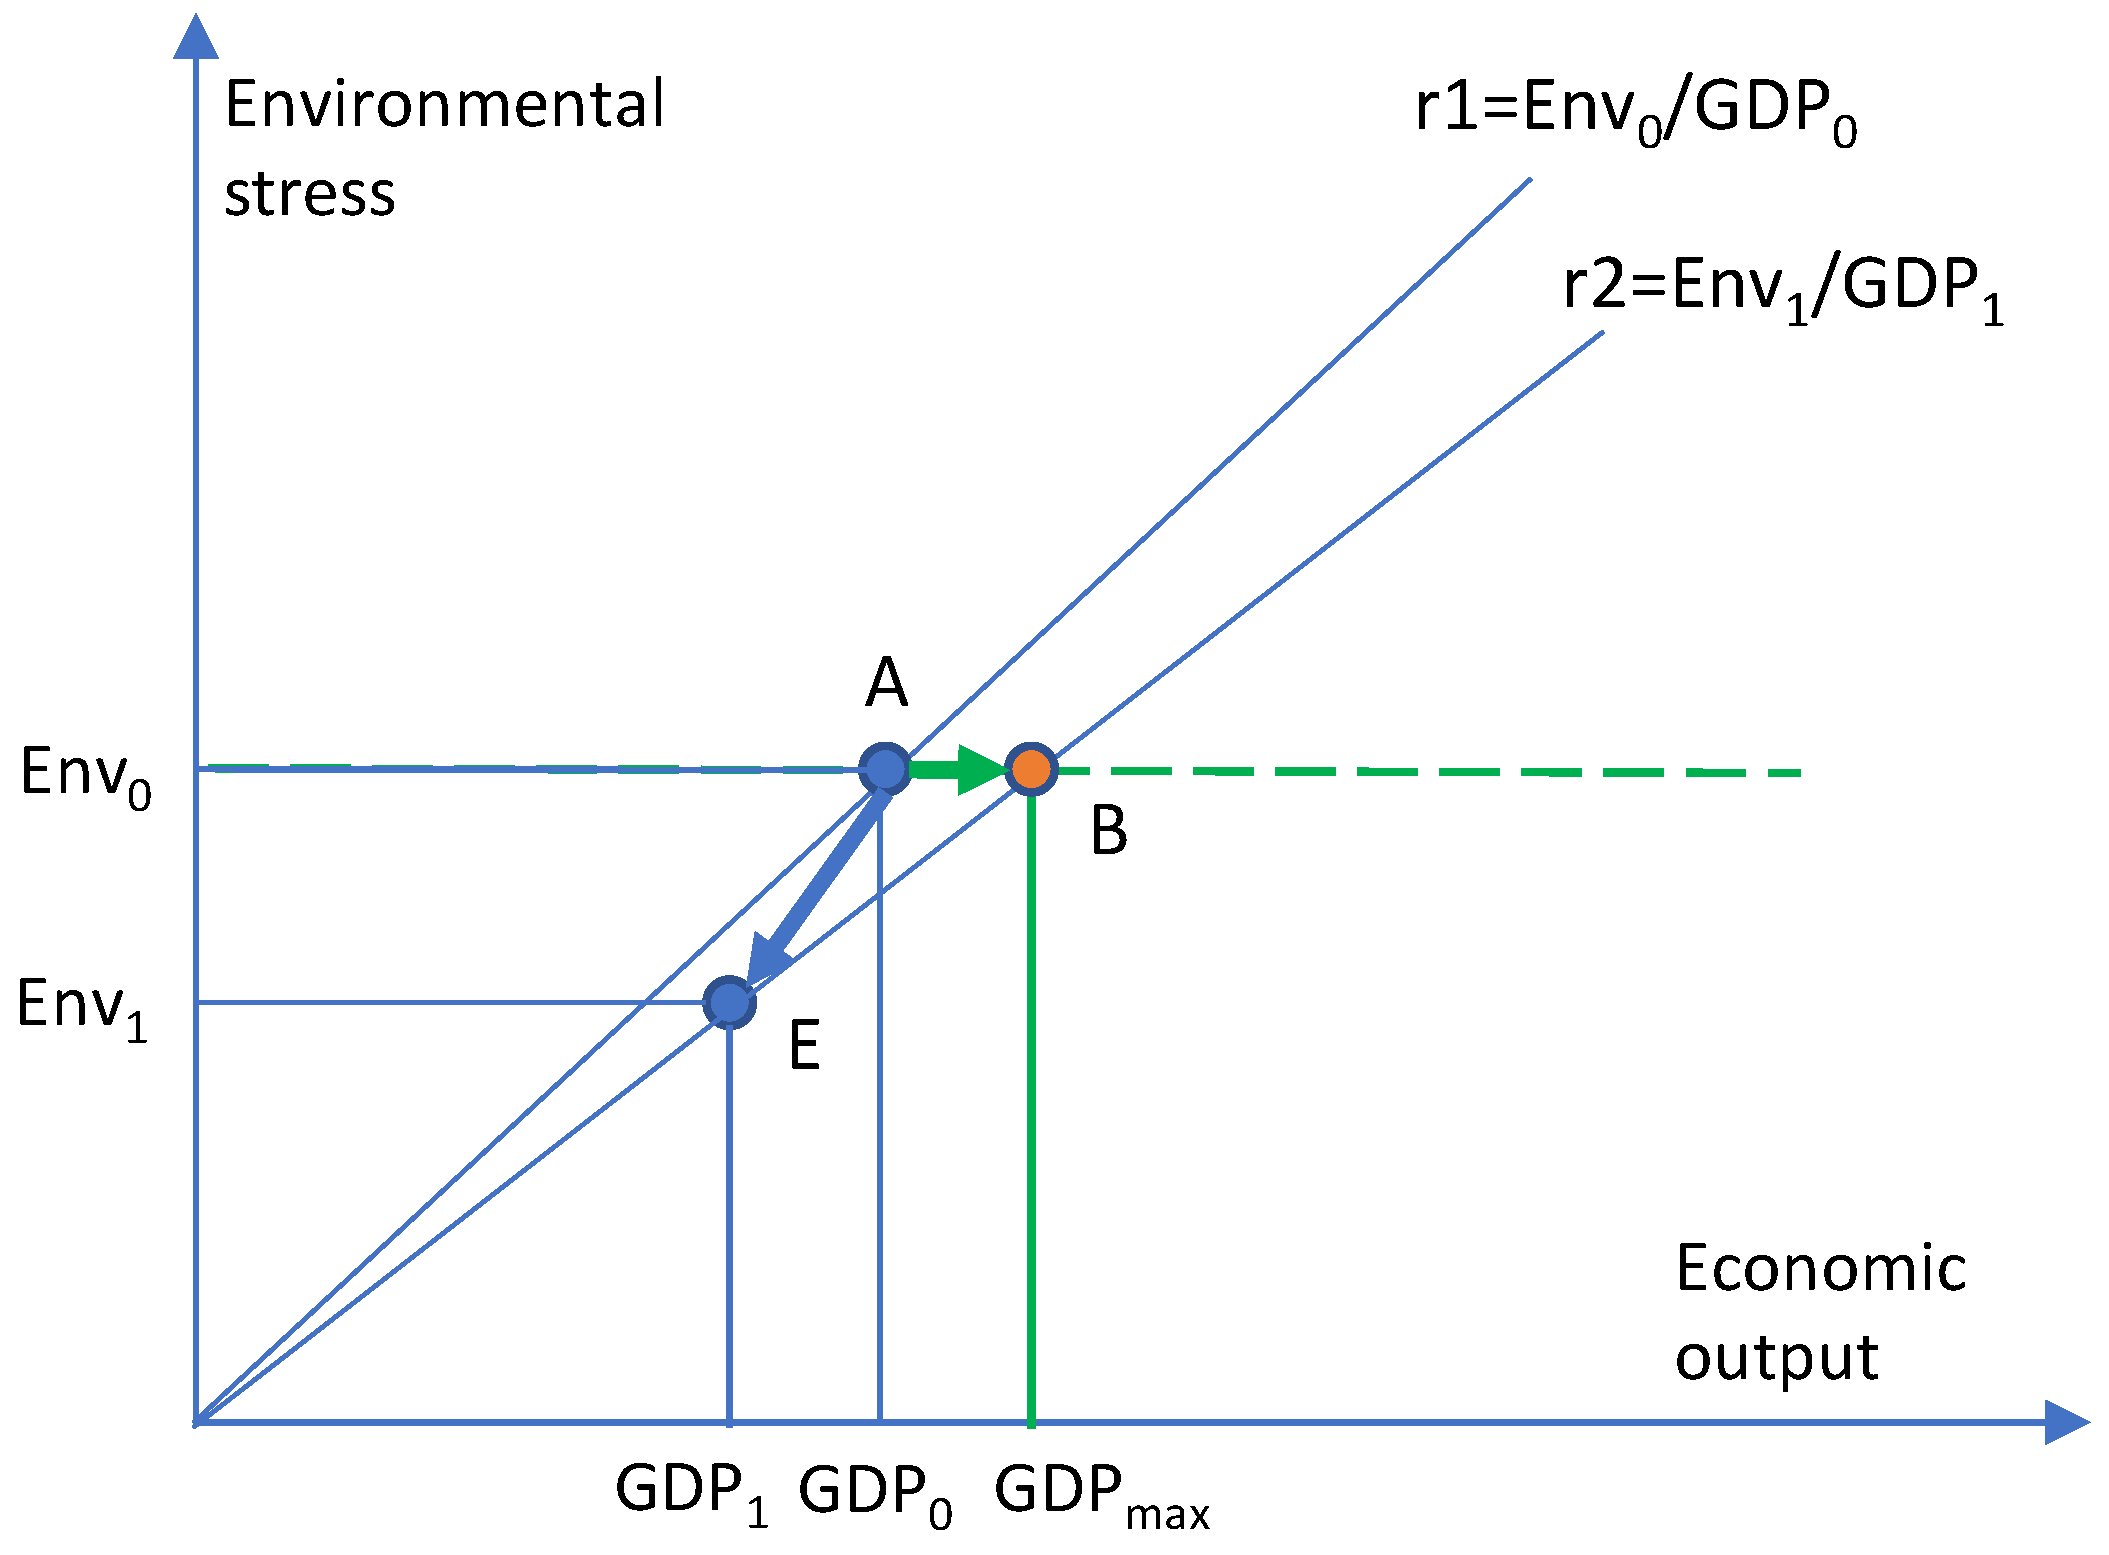
Figure 9.
Determining minimum economic output when the economy is decreasing (GDP1 < GDP0) social welfare is increasing (Soc1 > Soc0) and social welfare productivity is increasing (Soc1/GDP1 > Soc0/GDP0).
Figure 9.
Determining minimum economic output when the economy is decreasing (GDP1 < GDP0) social welfare is increasing (Soc1 > Soc0) and social welfare productivity is increasing (Soc1/GDP1 > Soc0/GDP0).

Figure 10.
Determining Sustainability Window in a case where the actual decreasing GDP output (degrowth) is within the Sustainability Window (GDPmin < GDP1 < GDPmax).
Figure 10.
Determining Sustainability Window in a case where the actual decreasing GDP output (degrowth) is within the Sustainability Window (GDPmin < GDP1 < GDPmax).
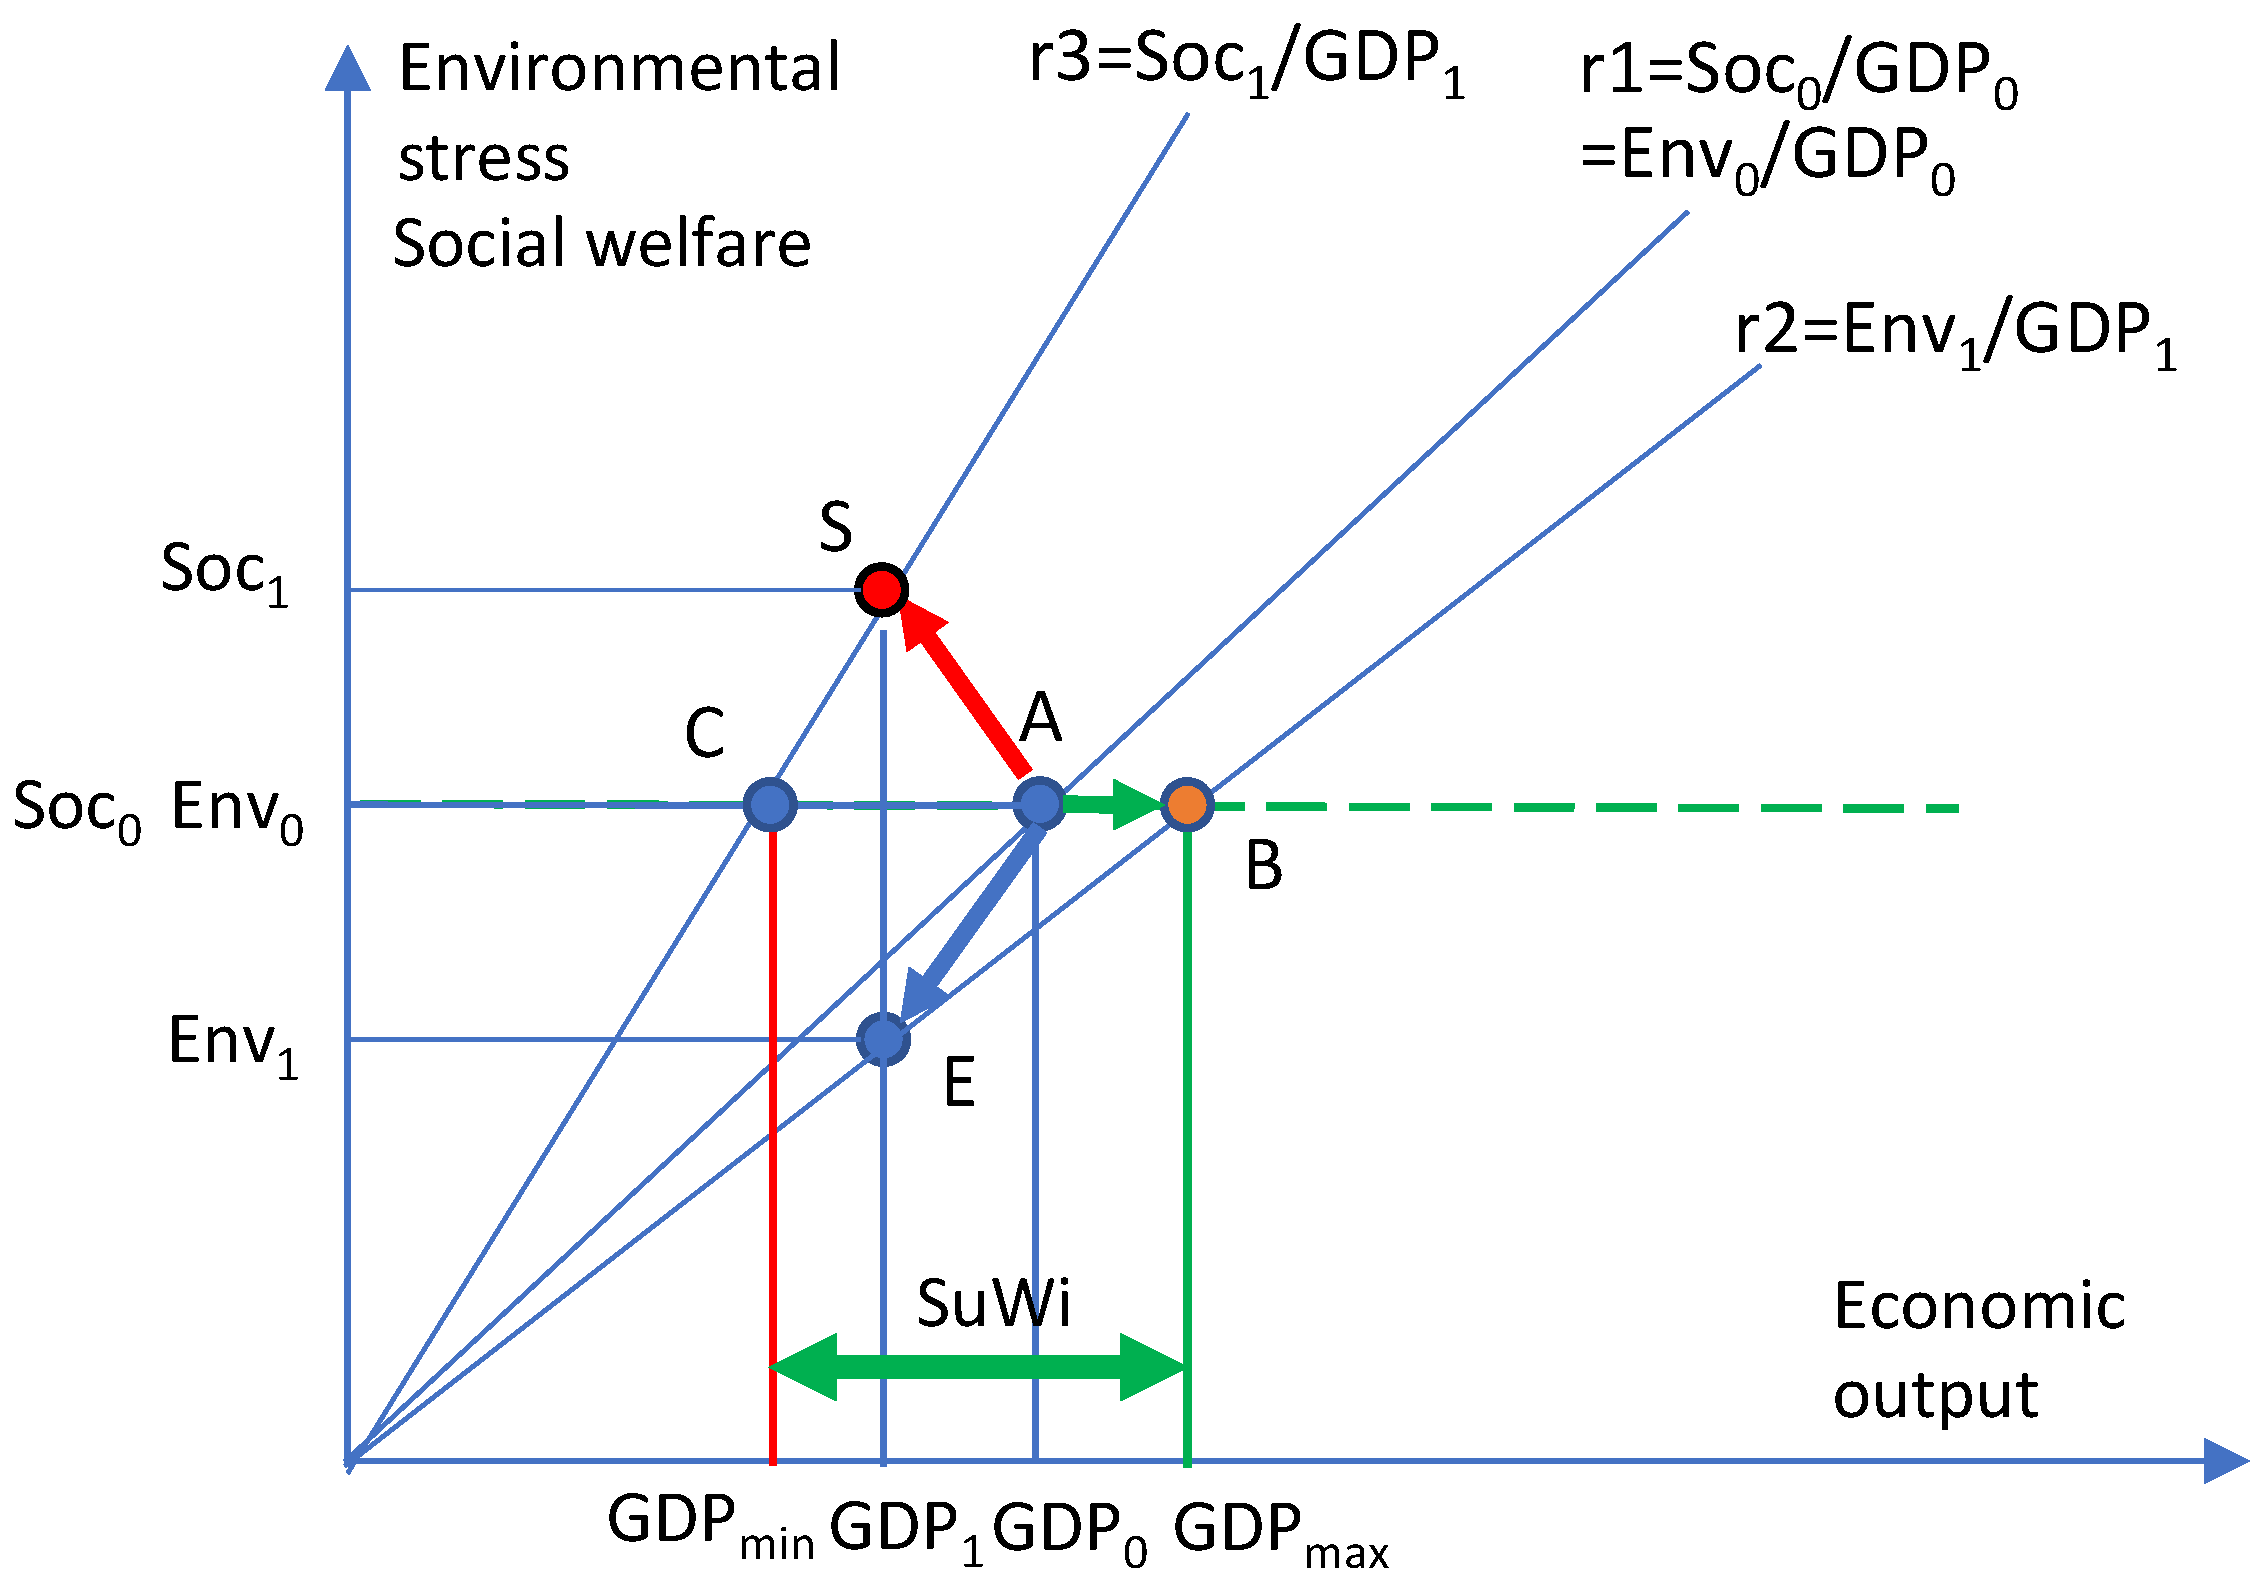
Figure 11.
a, b, c, d. The four sustainable options of change (see combinations 13, 14, 25 and 29, marked with green in Table 1).
Figure 11.
a, b, c, d. The four sustainable options of change (see combinations 13, 14, 25 and 29, marked with green in Table 1).
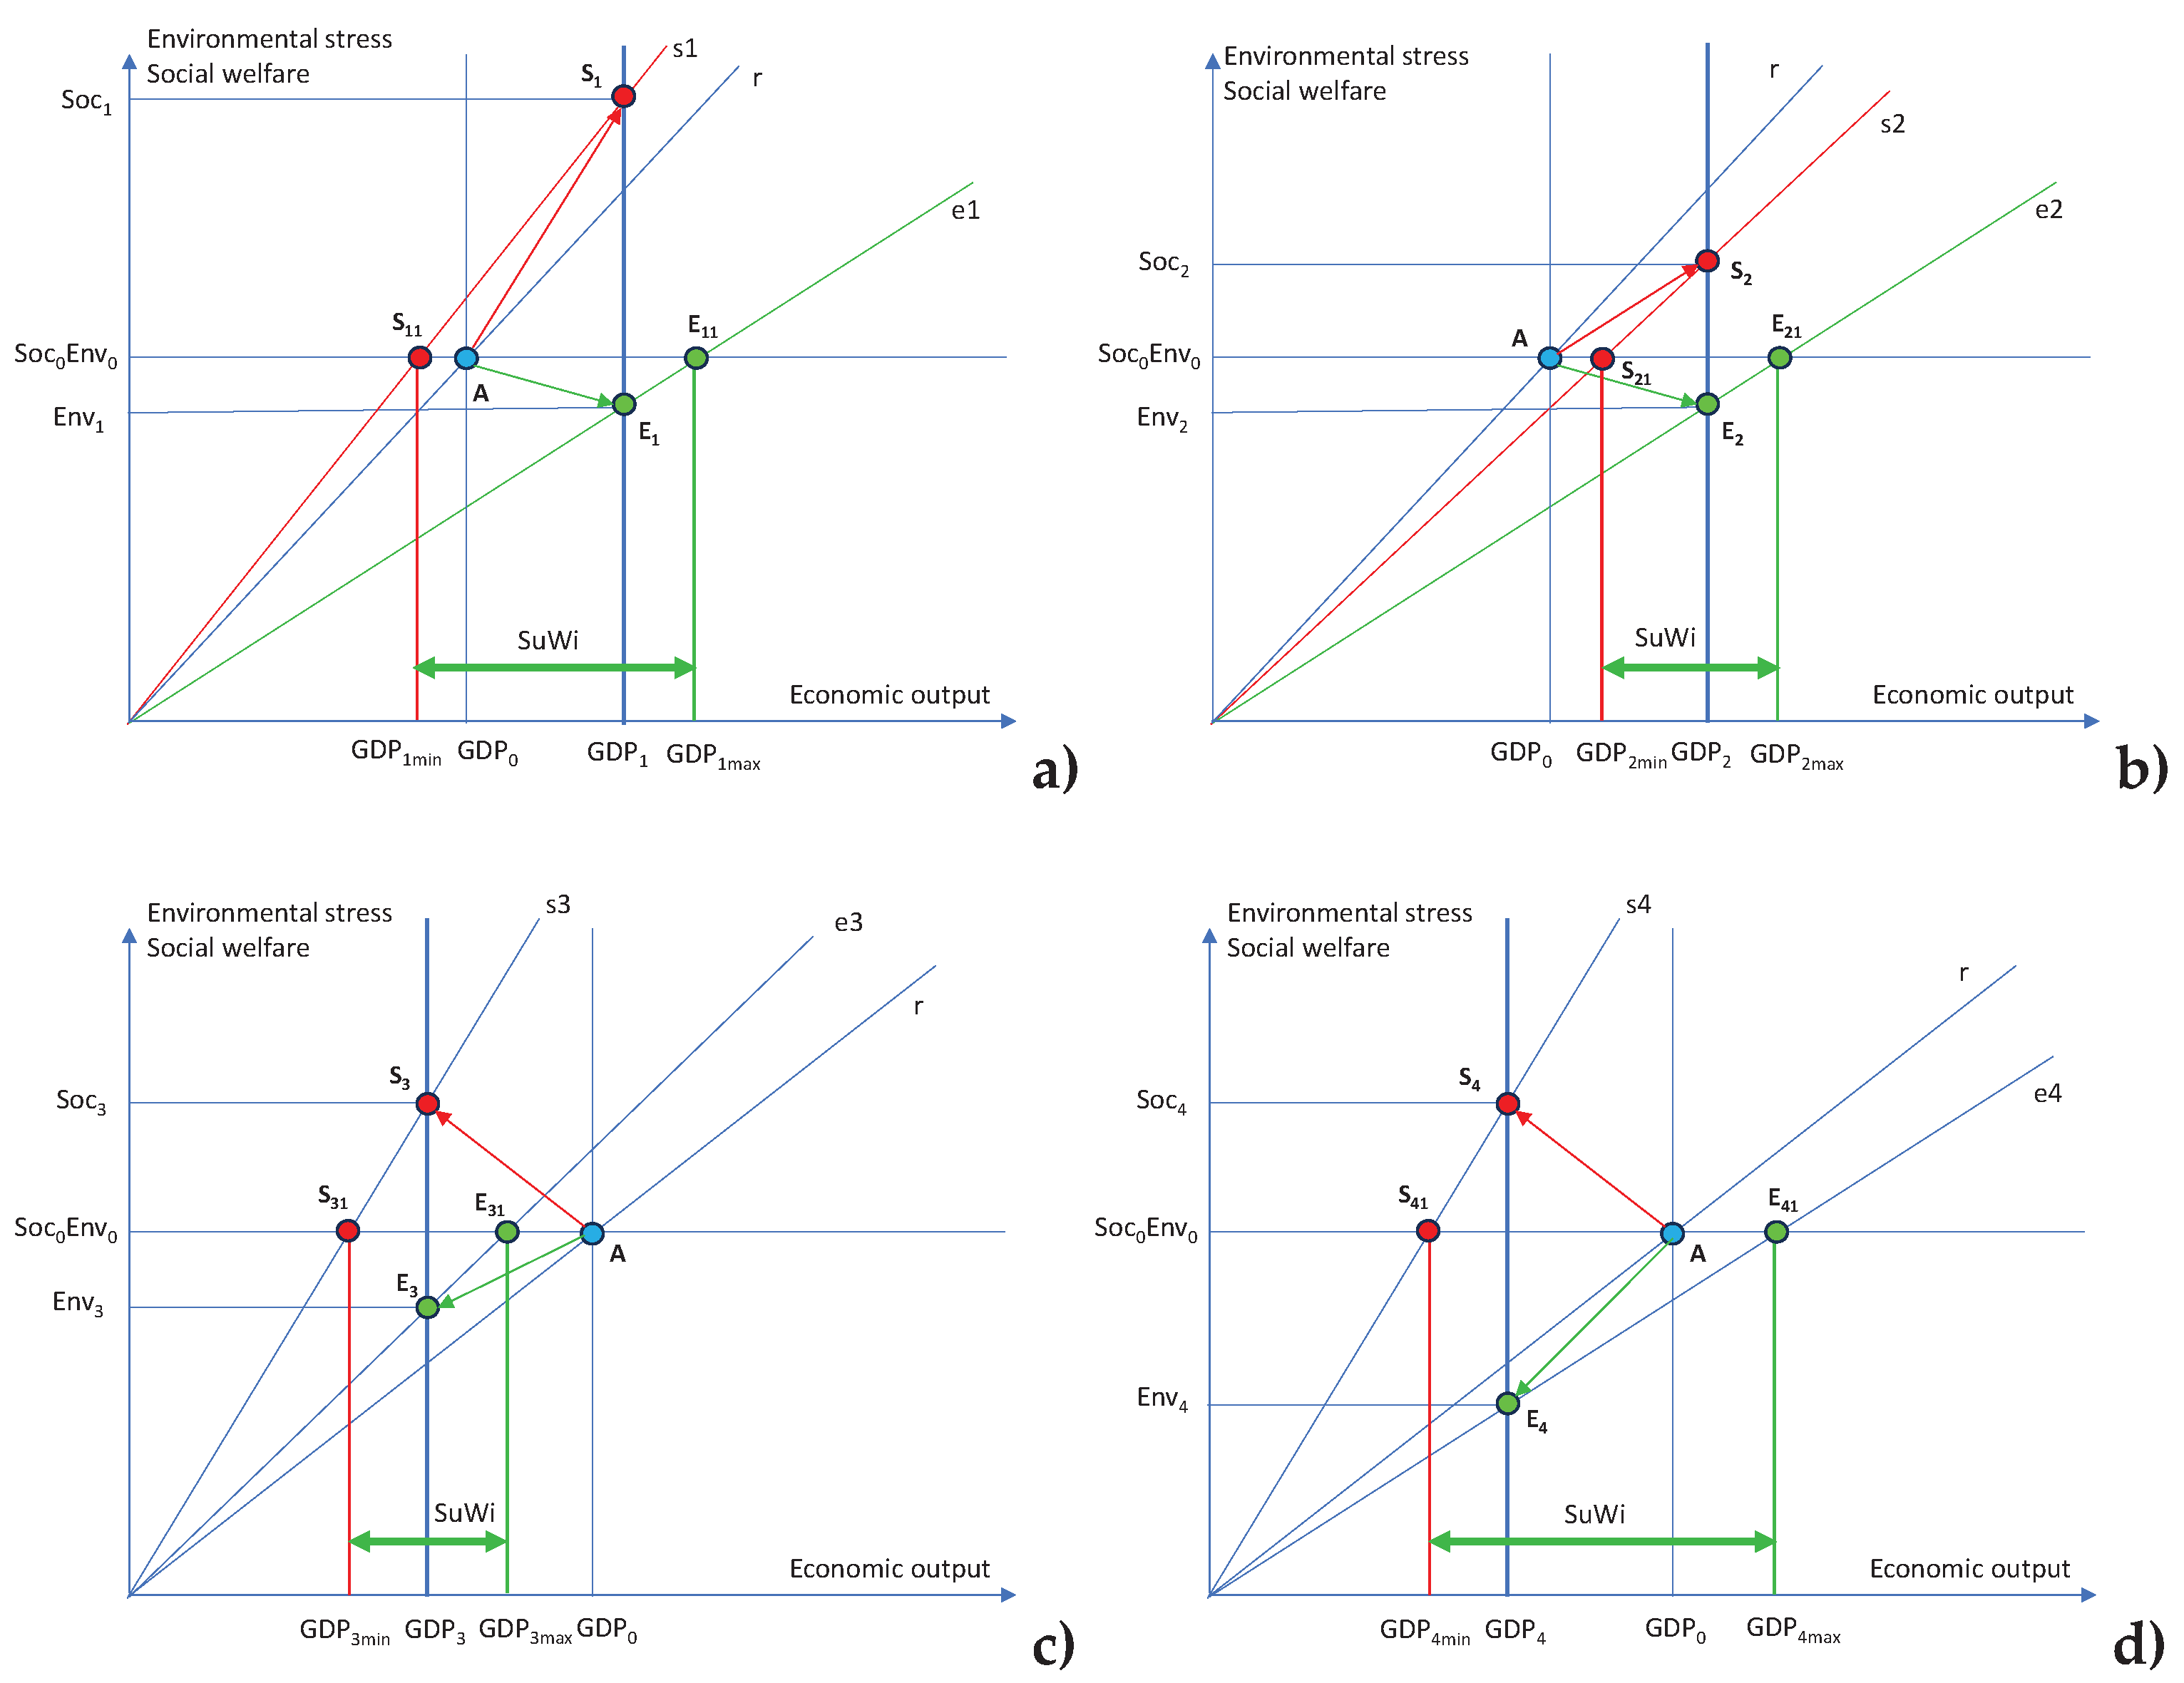
Figure 12.
Sustainability Window in the case of an environmental stress target Envtarget.
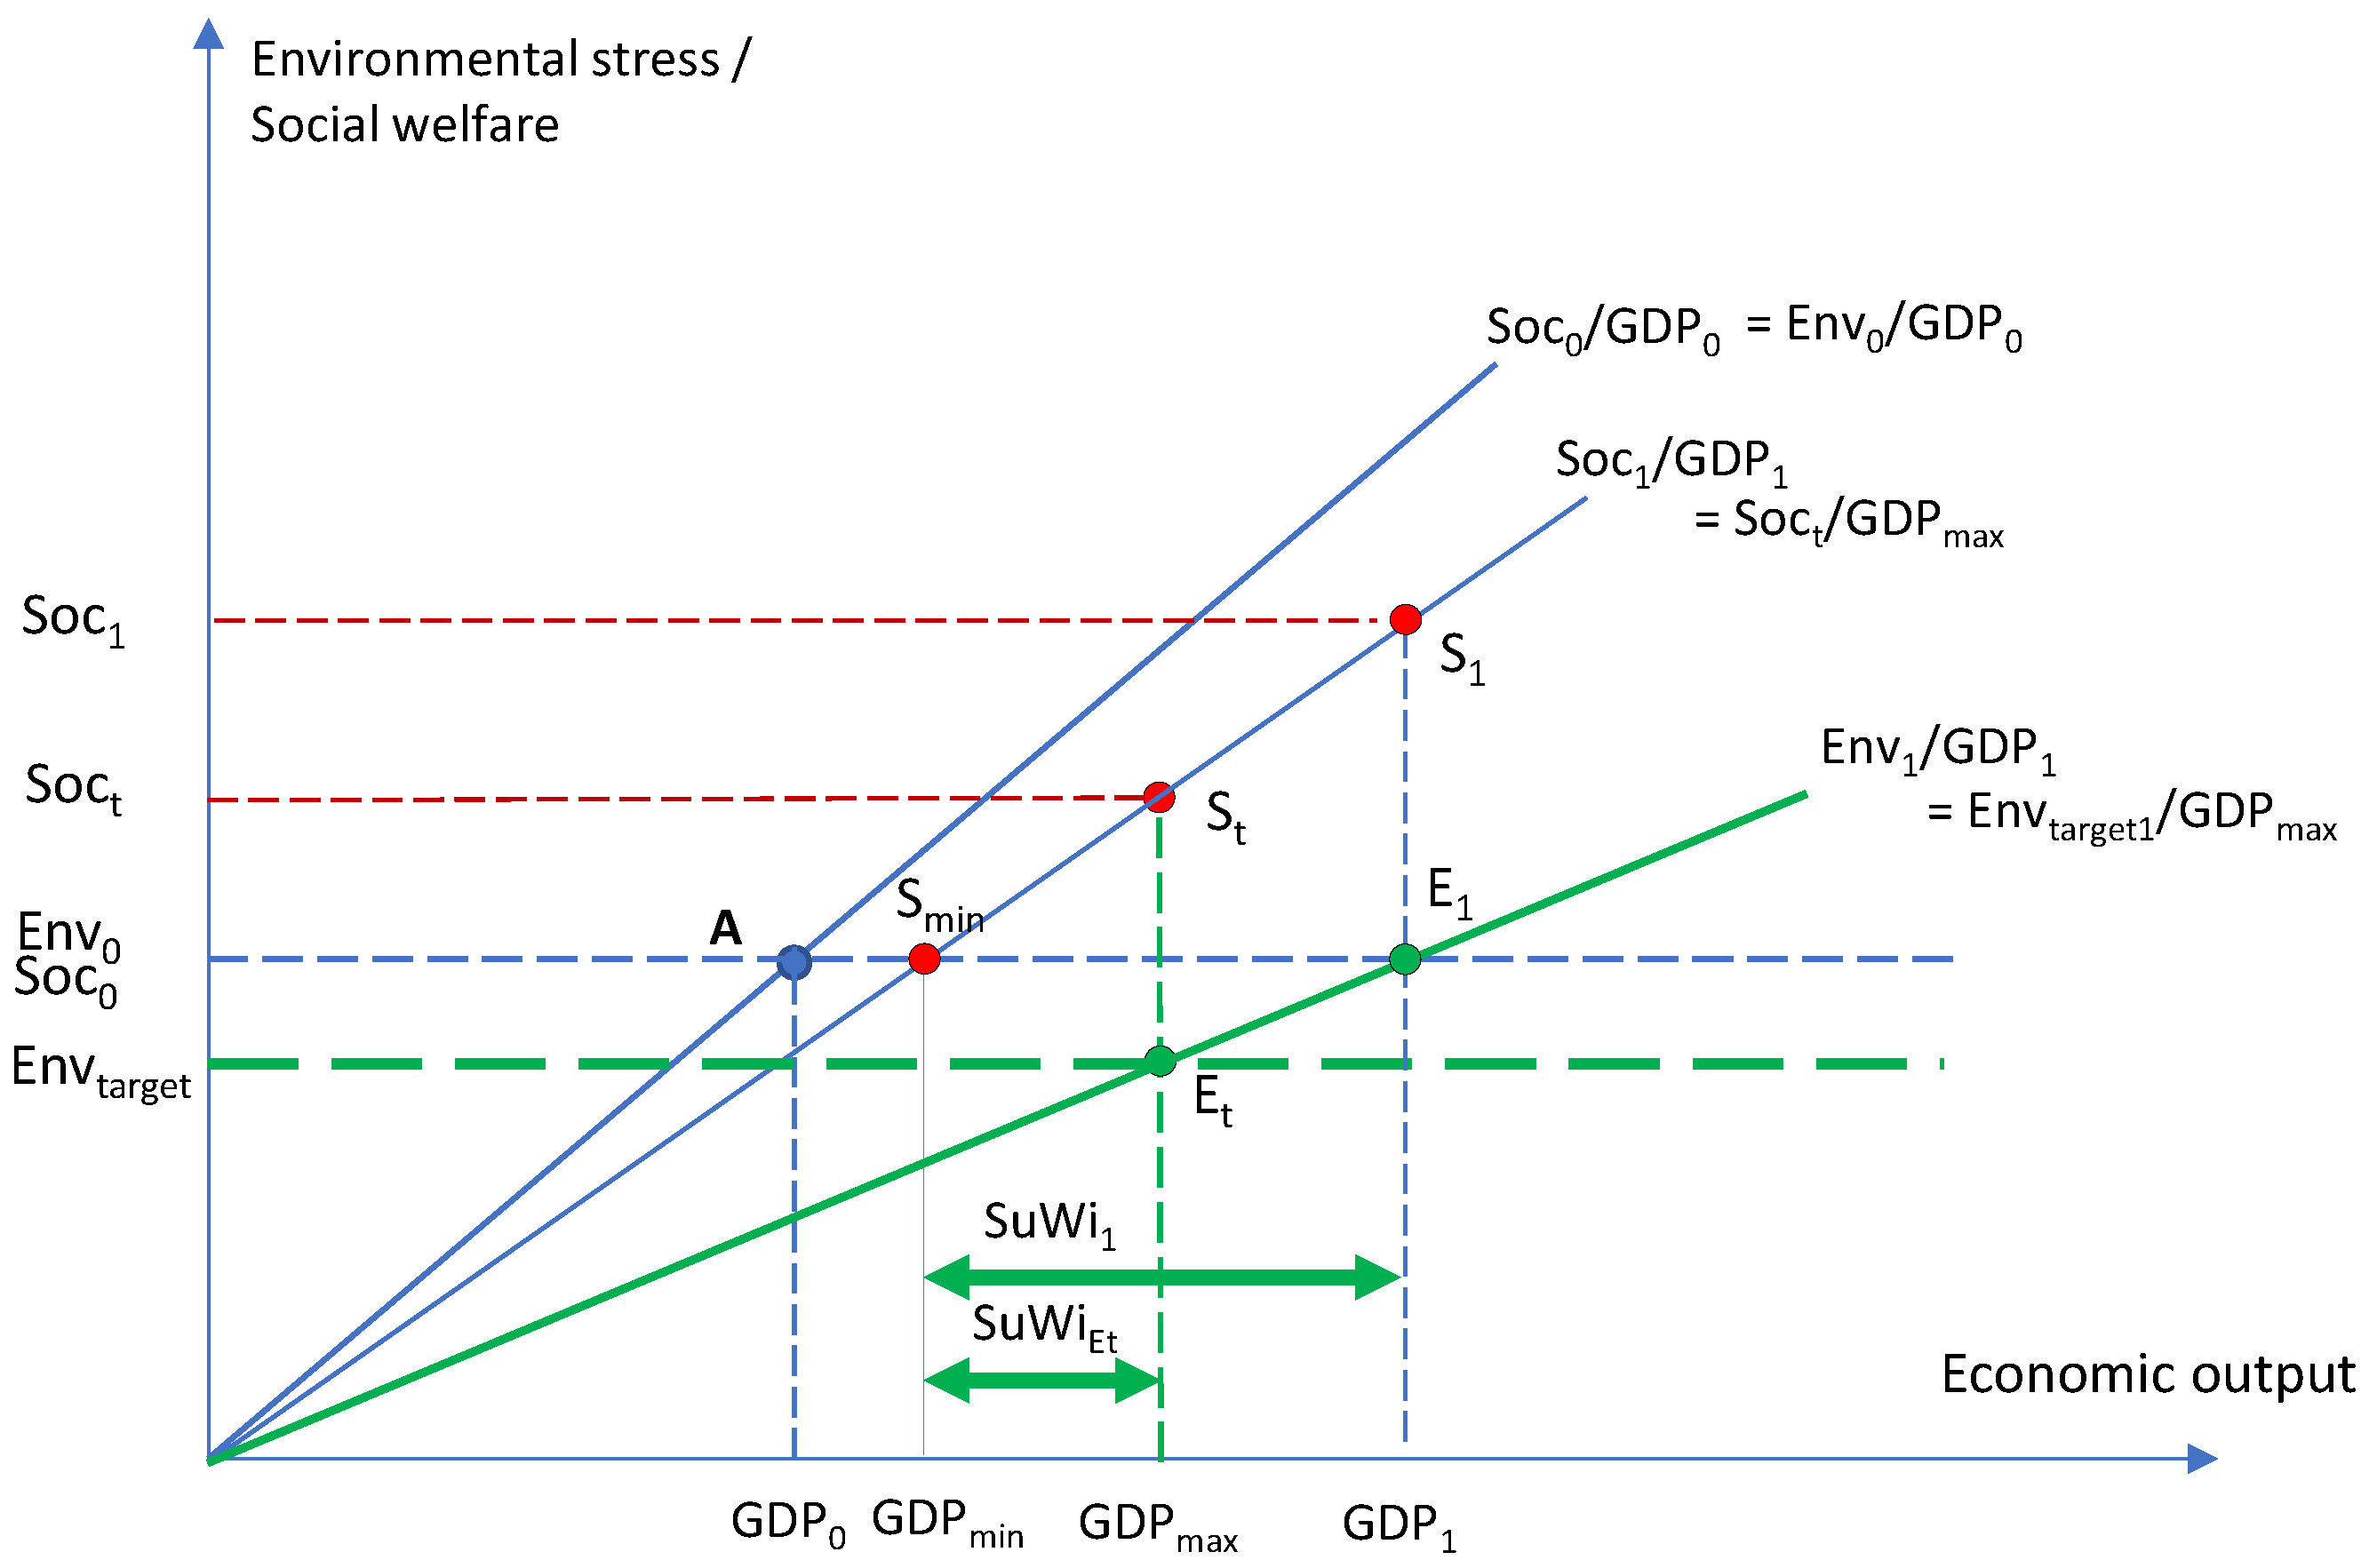
Figure 13.
Sustainability Window in the case where social welfare productivity Soc1/GDP1 increases and enables the reduction of the minimum economic output (degrowth) when the environmental stress target is determined.
Figure 13.
Sustainability Window in the case where social welfare productivity Soc1/GDP1 increases and enables the reduction of the minimum economic output (degrowth) when the environmental stress target is determined.
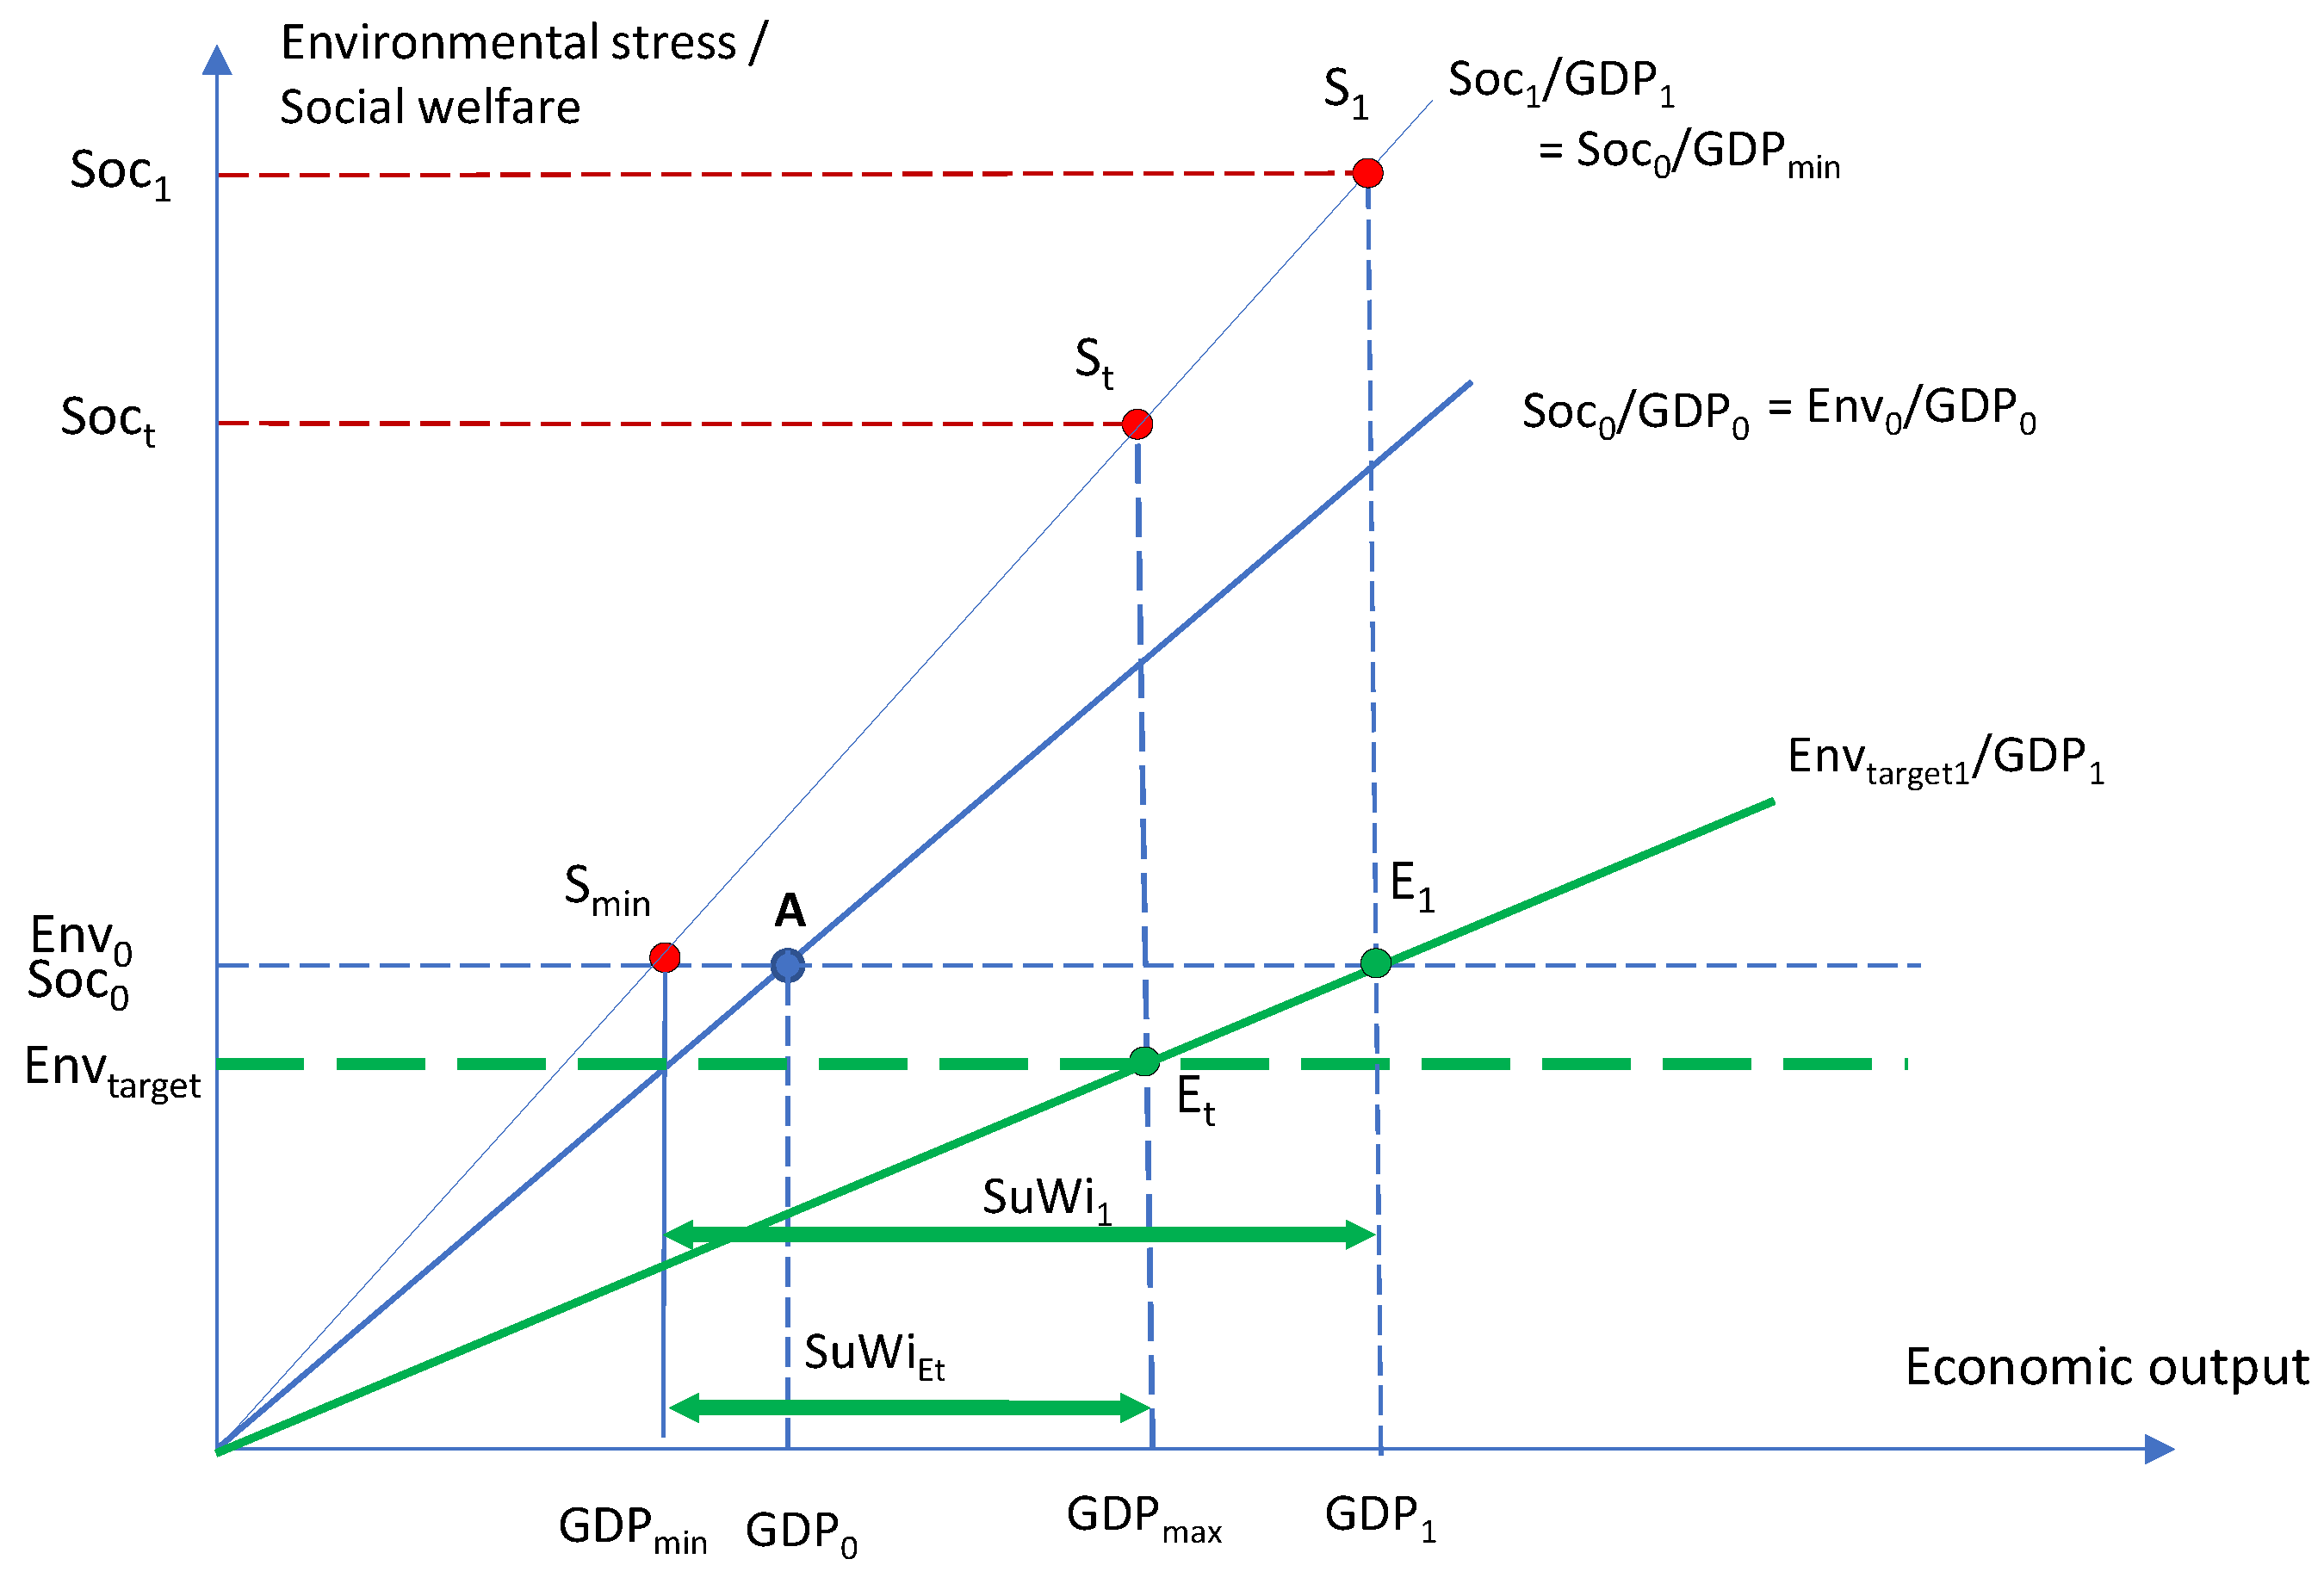
Figure 14.
Sustainability Window in the case where social welfare target is determined.

Figure 15.
Determining minimum economic output for different social welfare productivity levels (Soc/GDP) in the case where the level of social welfare is defined at Soctarget.
Figure 15.
Determining minimum economic output for different social welfare productivity levels (Soc/GDP) in the case where the level of social welfare is defined at Soctarget.
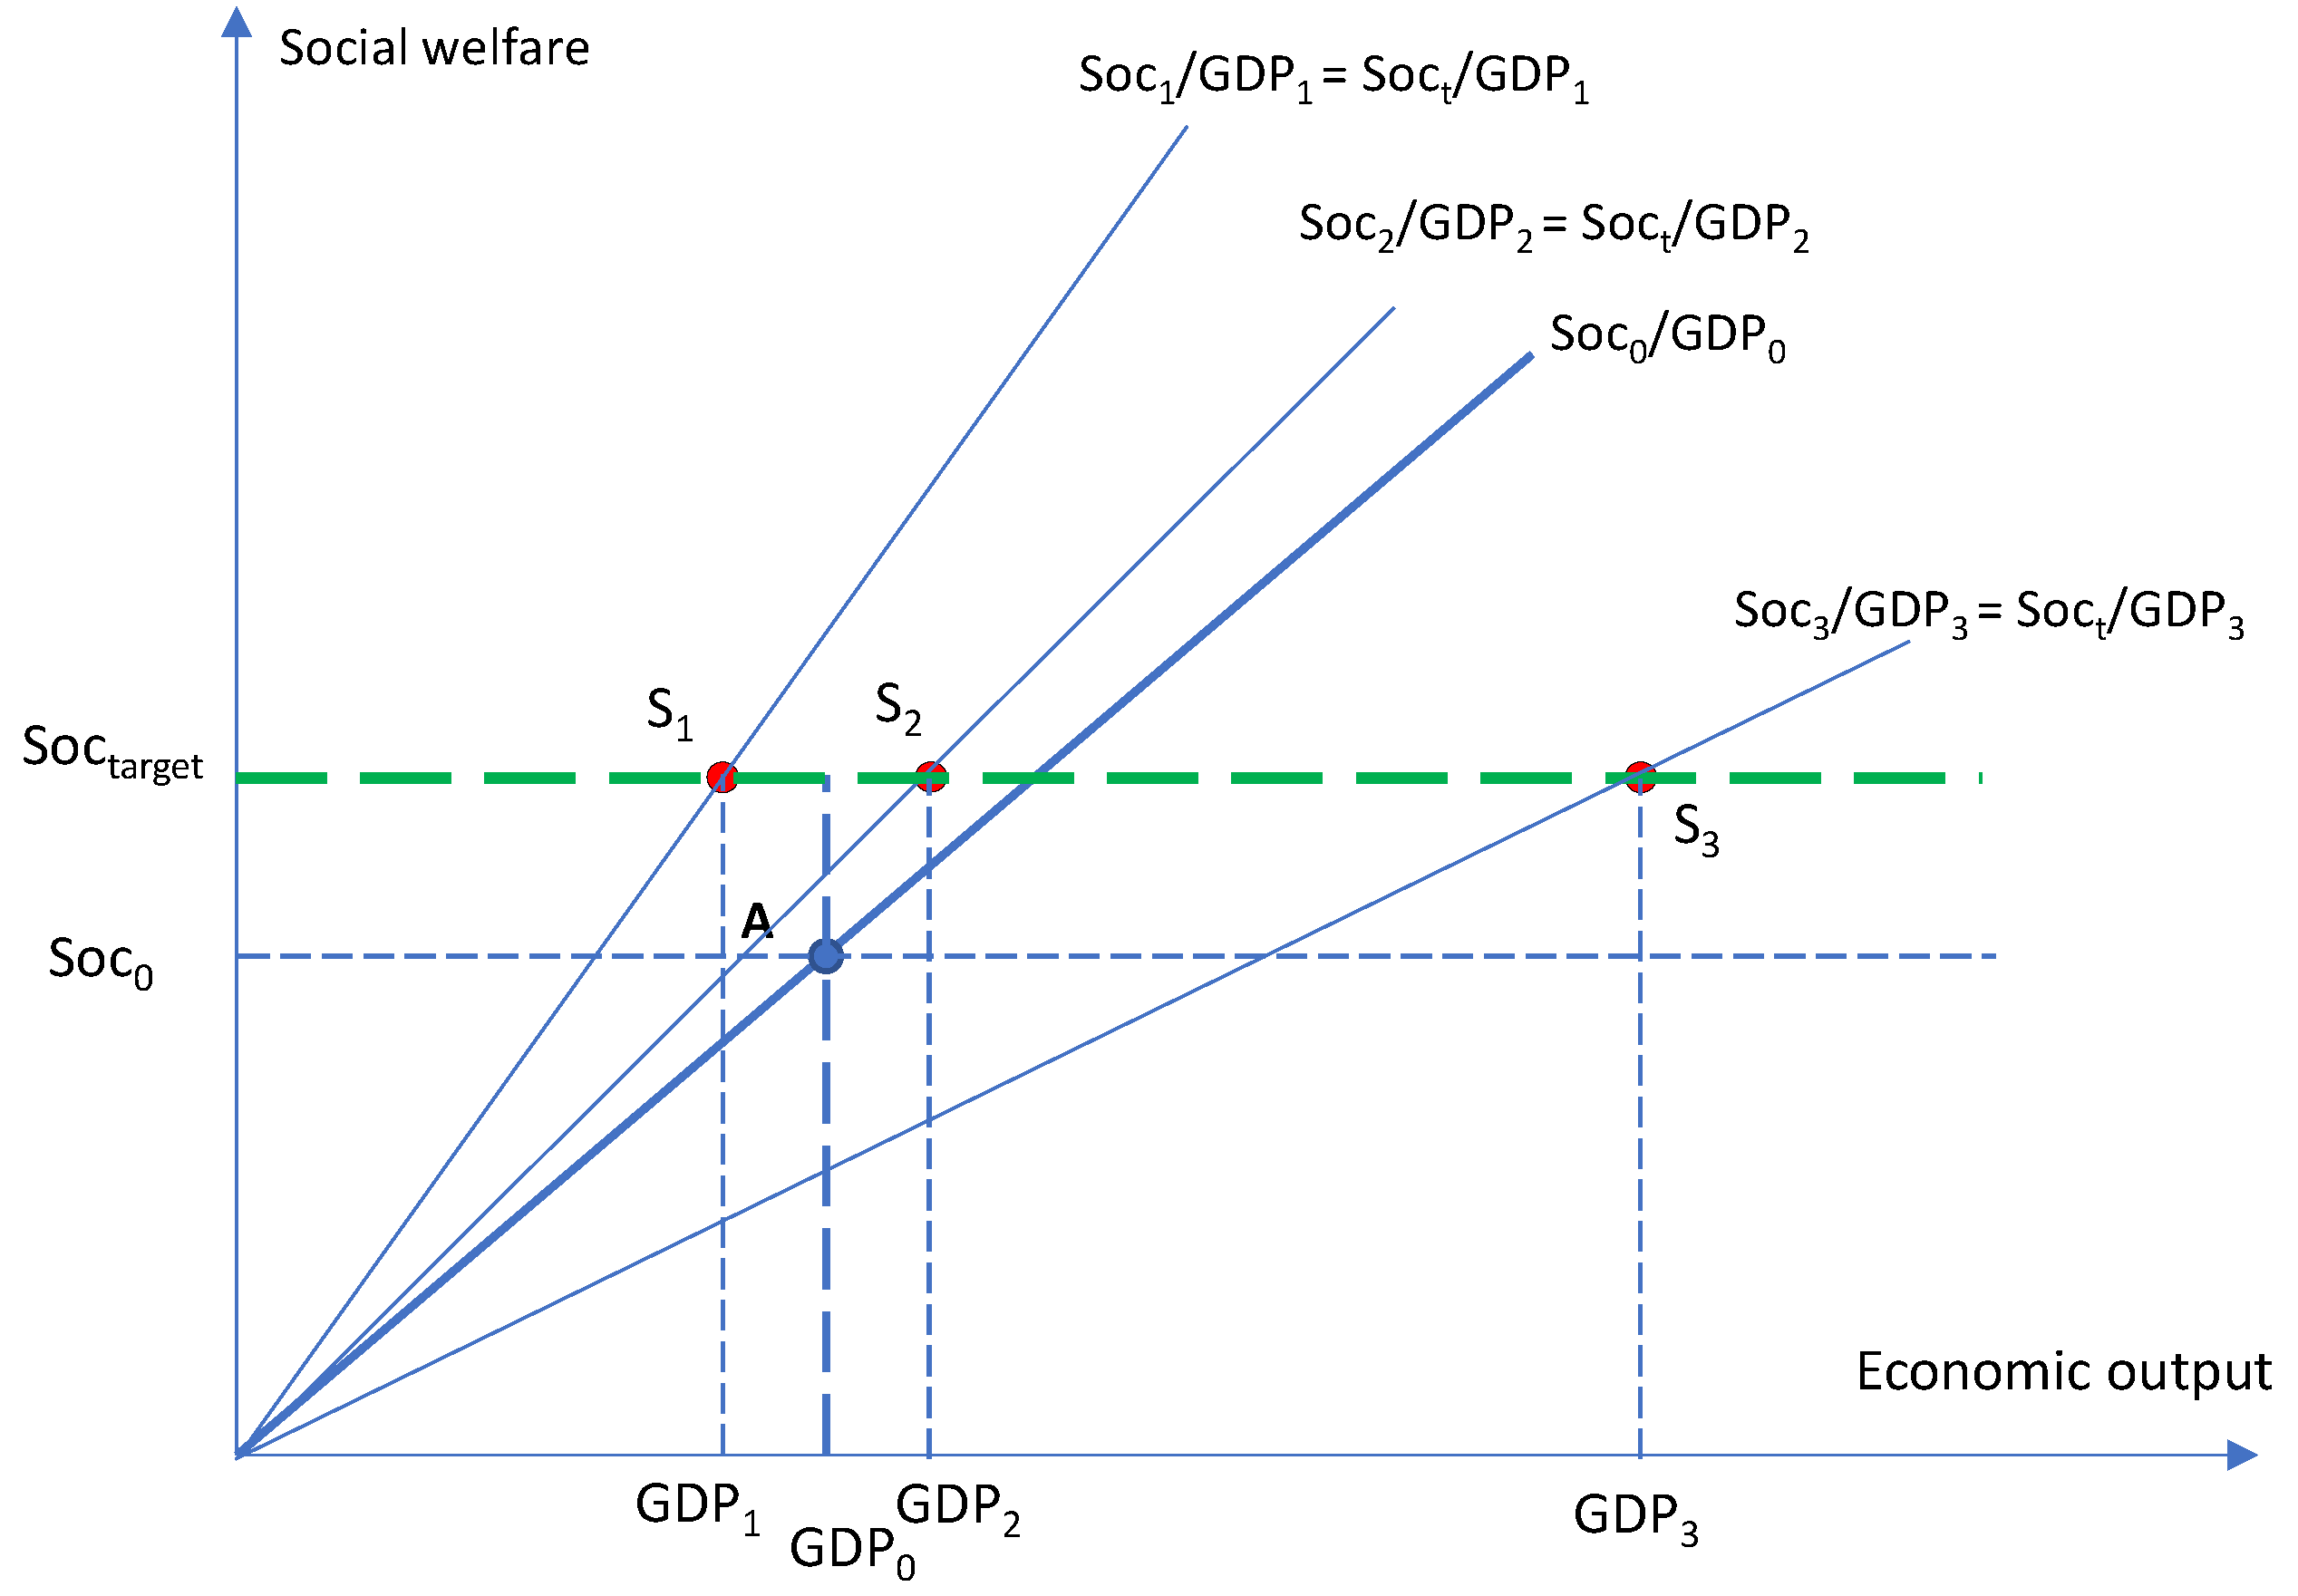
Figure 16.
Economic degrowth case with the environmental and social target.
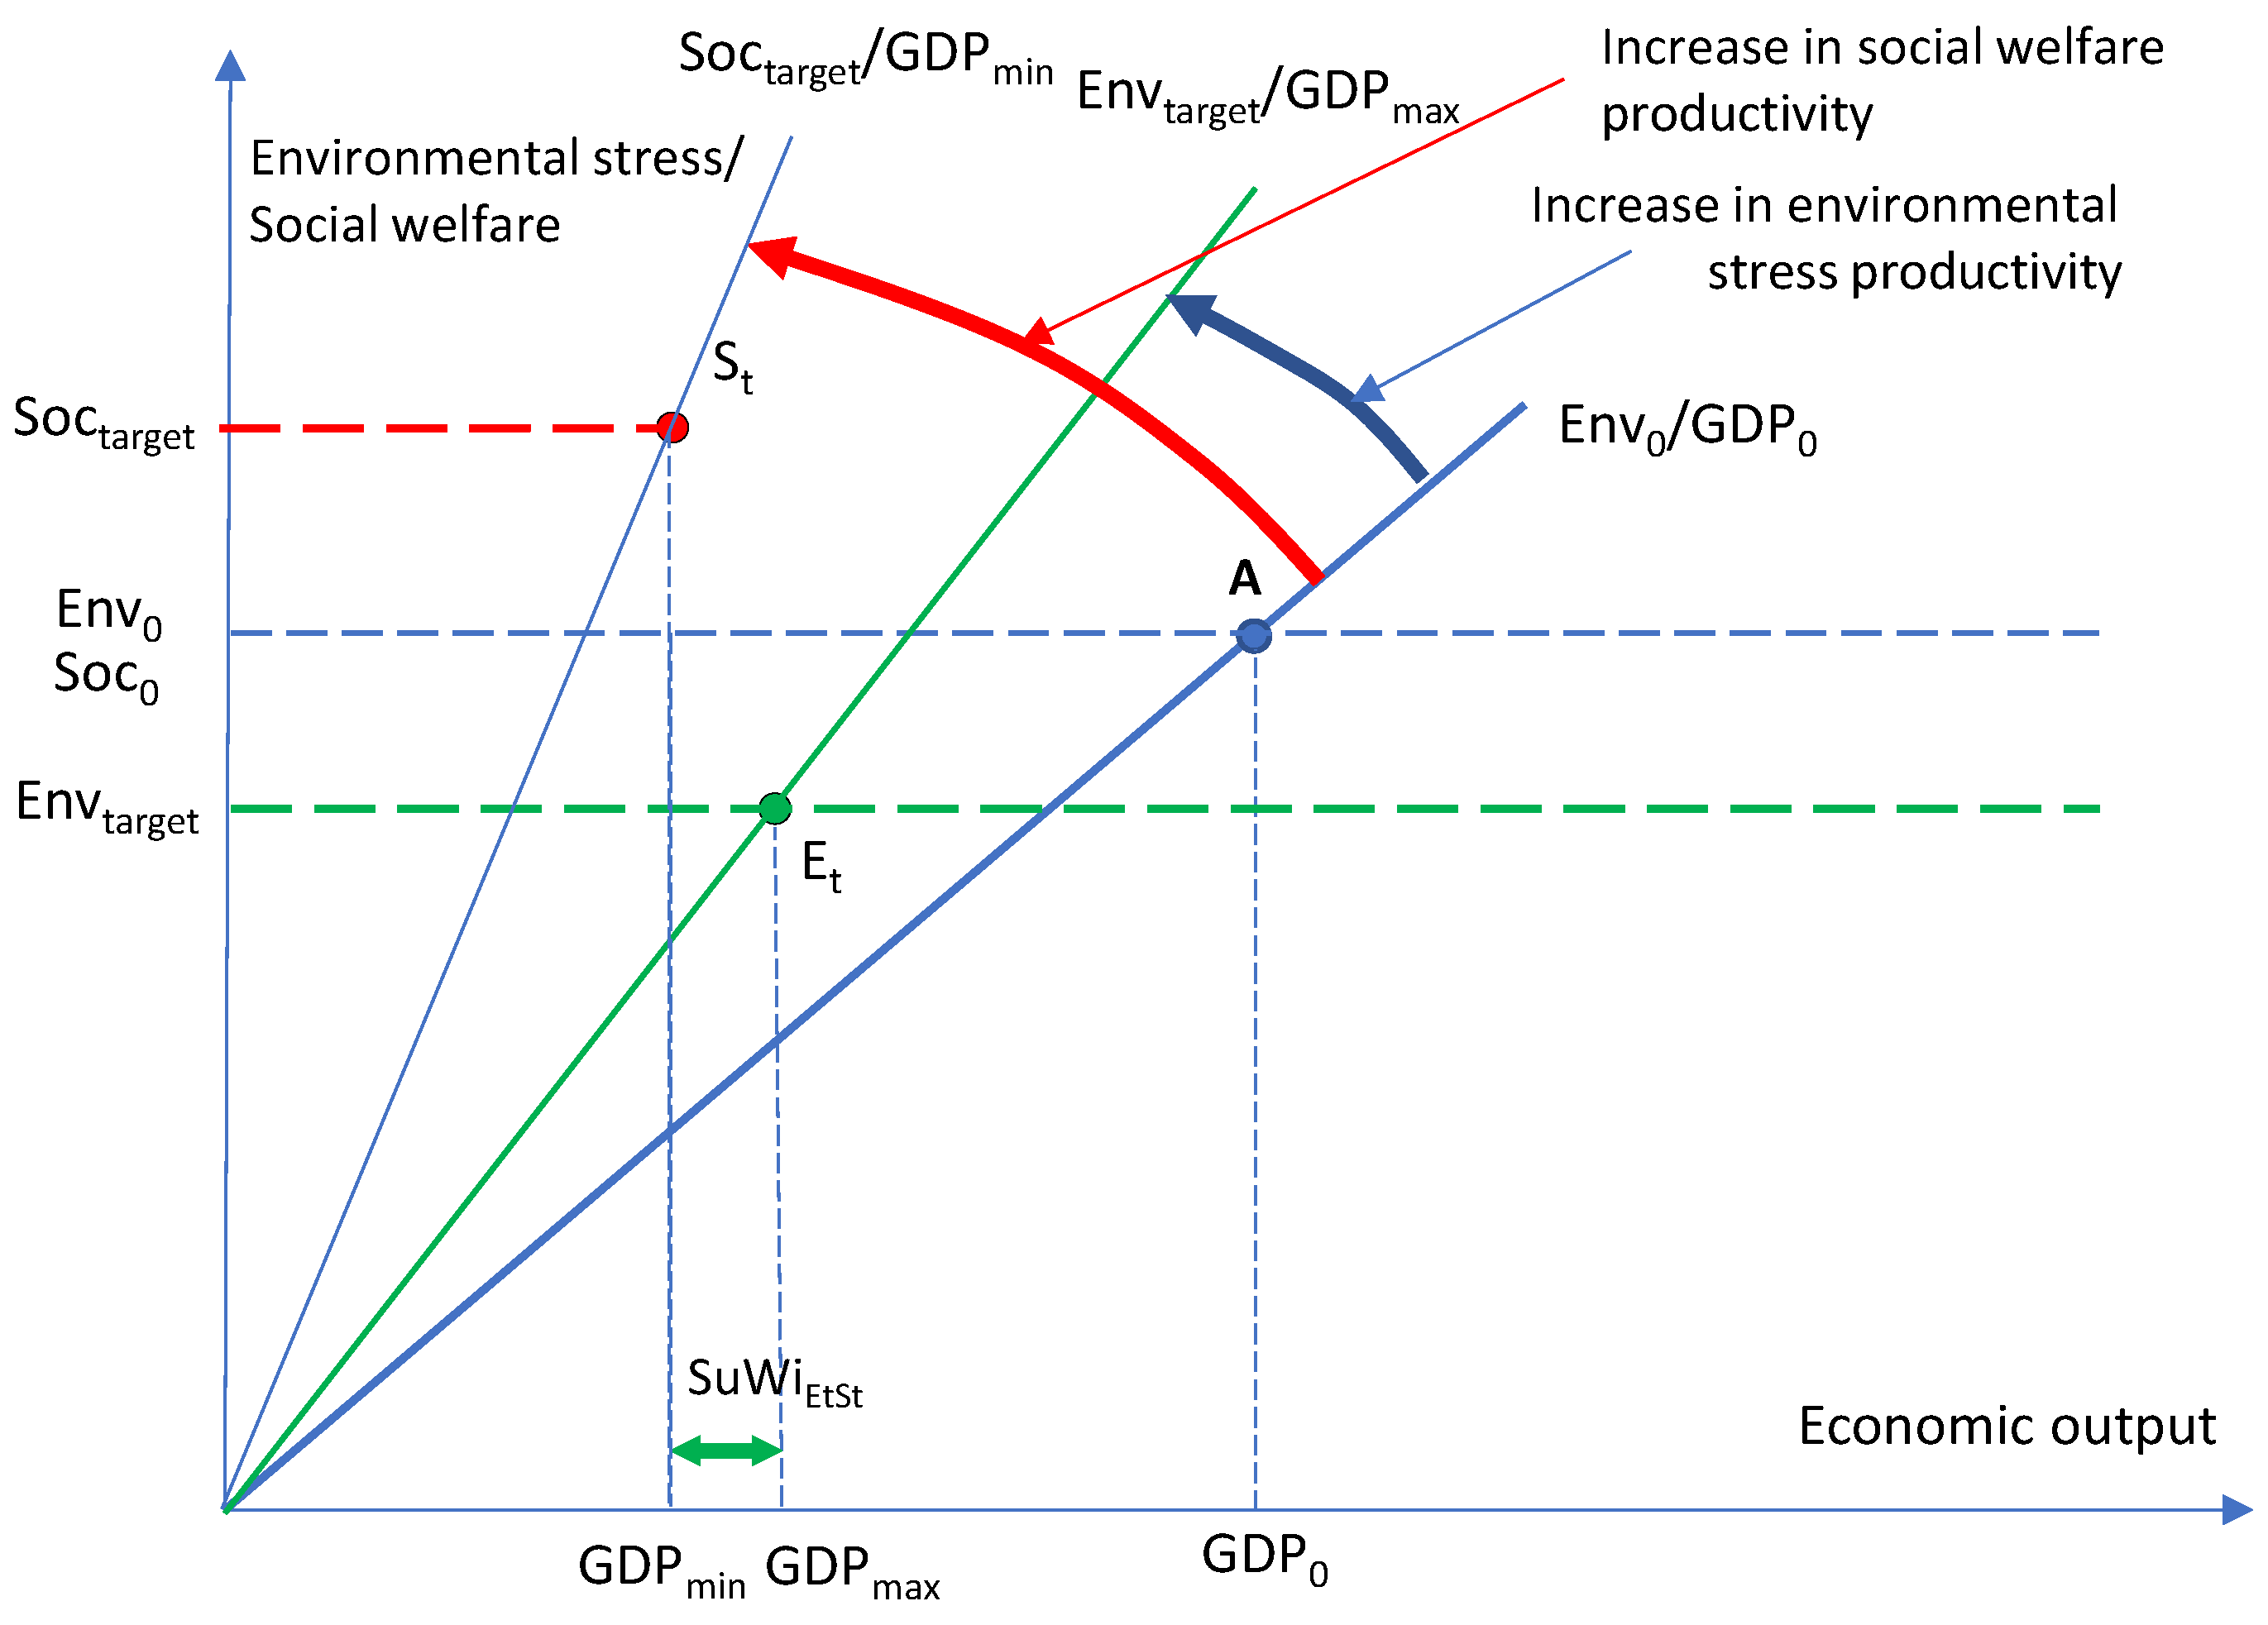
Figure 17.
Illustration of the efficiency gap.
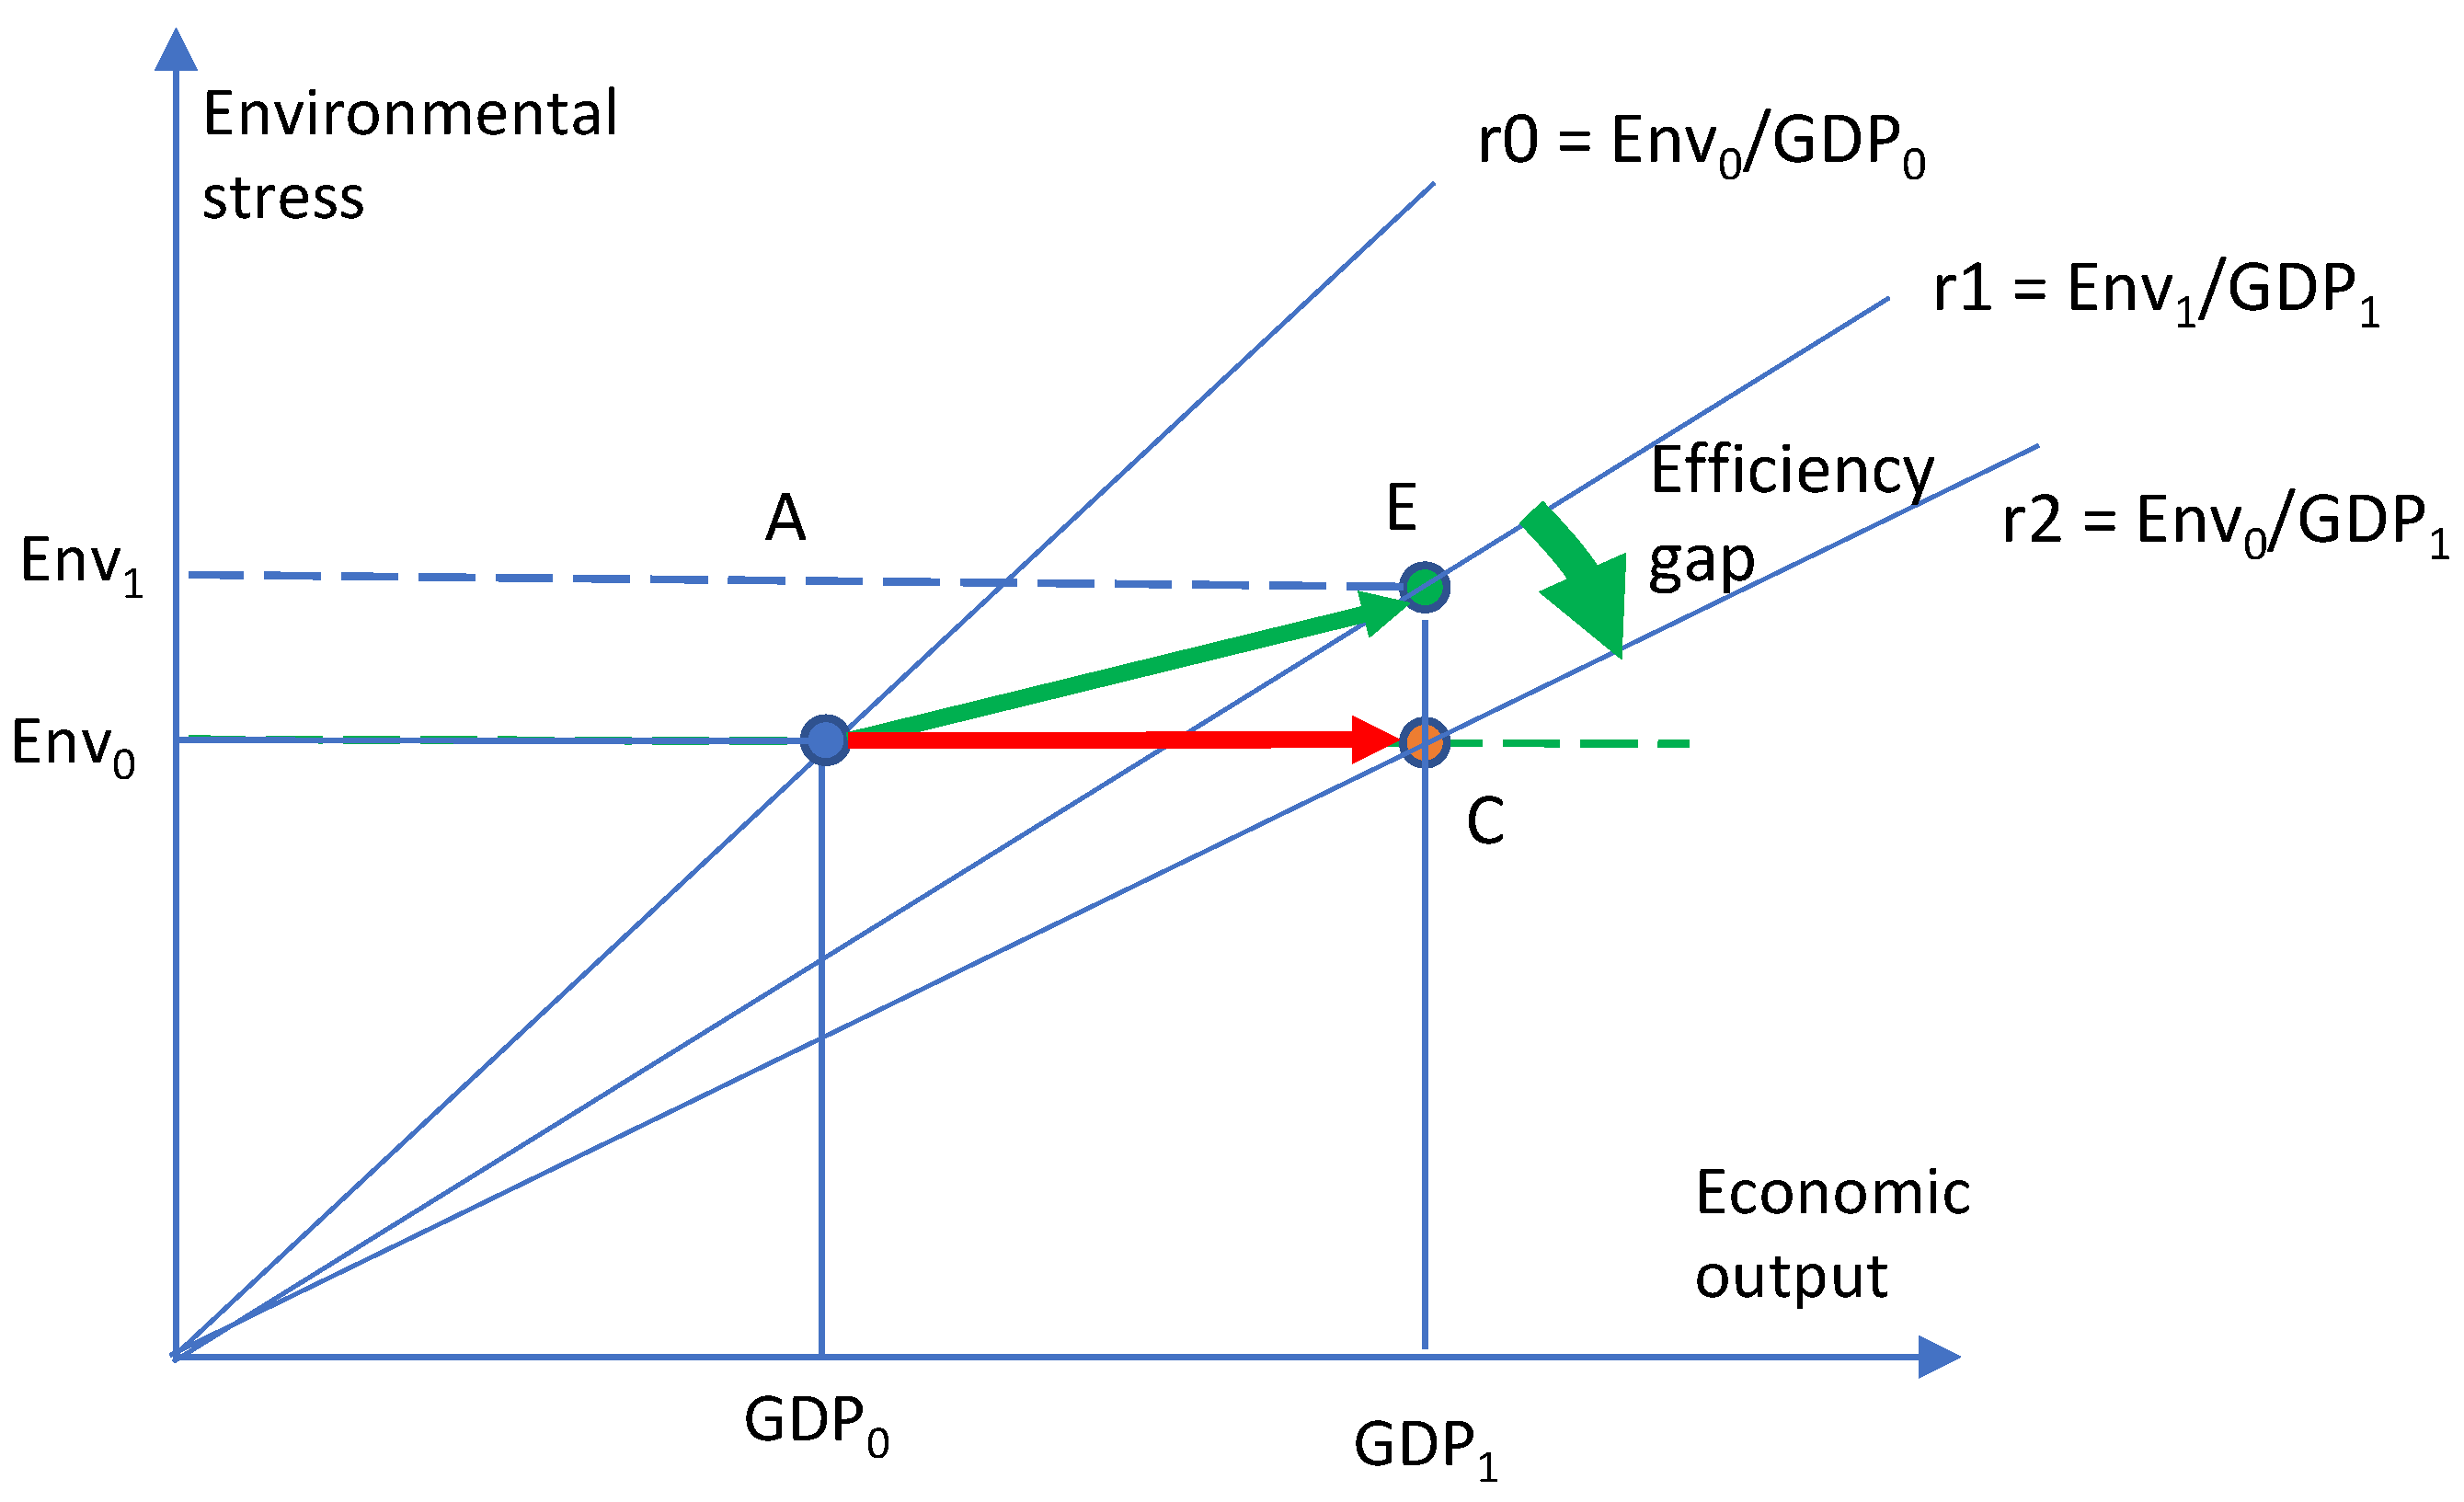

Table 1.
All combinations of GDP, environmental stress, social welfare, and related productivities with Sustainable Window analysis.
Table 1.
All combinations of GDP, environmental stress, social welfare, and related productivities with Sustainable Window analysis.
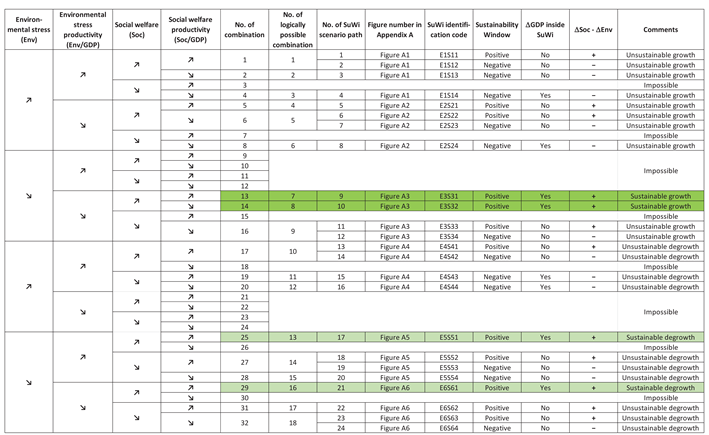
Disclaimer/Publisher’s Note: The statements, opinions and data contained in all publications are solely those of the individual author(s) and contributor(s) and not of MDPI and/or the editor(s). MDPI and/or the editor(s) disclaim responsibility for any injury to people or property resulting from any ideas, methods, instructions or products referred to in the content. |
© 2024 by the authors. Licensee MDPI, Basel, Switzerland. This article is an open access article distributed under the terms and conditions of the Creative Commons Attribution (CC BY) license (http://creativecommons.org/licenses/by/4.0/).
Copyright: This open access article is published under a Creative Commons CC BY 4.0 license, which permit the free download, distribution, and reuse, provided that the author and preprint are cited in any reuse.


