
Submitted:
16 August 2024
Posted:
16 August 2024
You are already at the latest version
Abstract
This work aims to investigate the effect of process temperature and catalyst content by thermochemical degradation of municipal solid waste (MSW) fraction (organic matter + paper + plastic) on the yield of reaction products (bio-oil, biochar, H2O and gas), physi-cochemical properties and chemical composition of bio-oils, as well as on the morphol-ogy and crystalline phases of biochar in laboratory scale. The organic matter, paper and plastic segregated from the gravimetric composition of total waste sample were subject-ed to the pre-treatments of drying, crushing and sieving. Thermal pyrolysis was per-formed at 400, 450 and 475 °C and 1.0 atmosphere, and catalytic pyrolysis at 450°C and 1.0 atmosphere, using 5.0, 10.0 and 15.0% (wt.) of FCC zeolite, bath mode, using a laboratory-scale borosilicate glass reactor. The bio-oil was characterized for acidic val-ue. The chemical functions present in the bio-oil identified by FT-IR and the composi-tion by GC-MS. Biochar was characterized by SEM/EDS and XRD. Thermal pyrolysis of the MSW fraction shows bio-oil yields between 9.44 and 9.24% (wt), aqueous phase yields between 21.93 and 18.78% (wt), solid phase yields between 67.97 and 40.34% (wt) and gas yields between 28.27 and 5.92% (wt). The bio-oil yield decreased with in-creasing process temperature. For the experiments using FCC, the biochar and gas yields slightly increased with increasing FCC content, while that of bio-oil decreased and the H2O phase remained constant. GC-MS of bio-oils identified the presence of hy-drocarbons and oxygenates, as well as nitrogen-containing compounds including am-ides and amines. The acidity of the bio-oil increased with increasing temperature and with the aid of FCC as a catalyst. The presence of hydrocarbons in bio-oil was identified by the addition of FCC catalyst due to the deoxygenation of carboxylic acids, followed by decarboxylation and decarbonylation reactions, producing aliphatic and aromatic hydrocarbons.
Keywords:
MSW
; Organic fractions of MSW
; Thermochemical process
; Characterization of biochar and bio-oil
1. Introduction
The growth in population density, economic development and the increasing availability of products and services have brought with them the constant challenge of dealing with the management and disposal of urban solid waste [1,2]. About 40% of the Municipal Solid Waste (MSW) produced globally is directed to landfills, while approximately 30% is disposed of in open dumps [3]. According to Sustainable Development Goal 11 (SDG 11) [4], proper municipal waste management is critically significant for advancing sustainability and ensuring the preservation of natural resources for future generations [5].
As a result, the proper management of Municipal Solid Waste (MSW) represents a substantial challenge for medium and large cities, as it requires complex considerations related to logistics, safety, environment, and energy aspects to ensure efficient management [6]. The projection is that, by the year 2030, global waste production will reach the mark of 2.59 billion tons [3].
In 2021, the Northern Region of Brazil was responsible for generating approximately 35.8% (about 1.773.927 tons per year) of Municipal Solid Waste (MSW) properly disposed of, while 64.4% (approximately 3.209.013 tons per year) had an inadequate destination [7]. The constant increase on the amount of solid waste entails several problems regarding the transportation, storage, and disposal of these materials, making the efficient management of solid waste challenging [8]. Despite the pressing needs for more sustainable approaches to waste management in order to address the environmental and public health challenges associated with this growing problem [9]. In addition, solid waste (SW) covers several categories, including domestic, industrial, commercial, institutional, hospital, urban, agricultural, process, construction and demolition waste, and sweeping services [10].
Notably, the Sars-covid pandemic has intensified the accumulation of waste, altering the pattern of generation with a significant increase in the production of plastics and household waste [11]. This increase was driven by the growth in demand for food deliveries, resulting in an increase in the use of common plastic waste in packaging, such as polypropylene, low-density polyethylene, high-density polyethylene, polyethylene terephthalate and polystyrene [12].
It is a fact that plastics are present everywhere and have become essential components of contemporary society, due to their characteristics of lightness, ease of molding and affordable cost. This scenario has contributed to a remarkable 20-fold increase in annual plastic production over the past five decades [13]. By the year 2050, it is estimated that this production will consume more than 500 million metric tons of crude oil. Due to the overuse of plastic products and inadequate waste management, about 60% (wt.) of plastic solid waste is disposed of in the environment or destined for landfills [14,15]. In addition, Municipal Solid Waste (MSW) has considerable economic potential, and the efficiency of waste management systems plays a crucial role in determining this potential economic value [16,17]. The heterogeneous nature of solid waste, which often contains elements that are difficult to degrade and treat, presents challenges to assimilation by the environment, resulting in risks to environmental protection and consequences for public health [18]. However, in order for MSW to be properly disposed of and treated, several steps are indispensable, following applicable guidelines through the development of solid waste management and management systems. These phases are essential to ensure that the handling, transportation, treatment, and final disposal of waste occur effectively [19].
Effective implementation of an integrated system for Municipal Solid Waste (MSW) requires an in-depth understanding of the per capita generation and gravimetric composition of this waste. This aspect has been the subject of investigation in recent years by researchers such as [20,21,22]. These studies focus on the sectorization of waste collection routes, gravimetric characterization, and energy valuation of the technological routes of MSW treatment [8].
Carneiro [23], one of the pioneers in exploring the economic potential of MSW generated in the municipalities of Belém, host of COP Conference 30 in 2025, and the municipality of Ananindeua in the state of Pará [22]. Their research allowed the identification of an average change of 13% in the amount of recycled material between 2000 and 2006, influenced by the social profile of the population [20]. These significant contributions provide valuable insights for the development of comprehensive strategies in the integrated management of MSW, considering economic, environmental, and social aspects [24].
In this scenario, it becomes essential to adopt advanced waste management practices to preserve the environment, protect public health, ecosystems, and promote global quality of life in the future [6,17]. In recent decades, advances have been made in sustainable waste management, especially in response to the challenges presented by a circular economy [17,24]. This paradigm involves the application of thermochemical technologies, such as pyrolysis, gasification, or combustion, to reduce, reuse, recycle, and recover waste [25,26]. Among them, municipal solid waste pyrolysis has recently become a hot topic and has gained much more attention as the fundamental and key stage of thermochemical conversion [14].
Pyrolysis is a process of thermal conversion of a material into energy, where in an inert environment, high temperatures are used to produce gaseous products, liquids called bio-oil and solids called biochar [27,28], occurring at temperatures above 400 °C in the absence of oxygen. There are distinct forms of pyrolysis, encompassing 1) slow pyrolysis, 2) fast pyrolysis and 3) ultrafast pyrolysis, also known as flash pyrolysis. These categories encapsulate variations in terms of temperature, heating rate, residence time and the resulting products of each technique [29,30].
Slow pyrolysis occurs with a low heating rate (less than 2 ºC/s), a temperature below 500 ºC, and a long residence time, being used to maximize the production of carbon residue (solid fraction). Rapid pyrolysis, on the other hand, features high heating rates (10 to 200 ºC/s), a short residence time (0.5 to 2 s), and a moderate temperature (around 600 ºC), aiming for maximum liquid fraction production, with vapors quickly cooled for condensation. Flash pyrolysis occurs with even higher heating rates (more than 1000 ºC/s) and extremely short residence times, using very small material particles. In the case of municipal solid waste, flash pyrolysis results in a higher proportion of oil compared to rapid pyrolysis. However, this dynamic changes for plastic waste, where rapid pyrolysis generates a greater amount of gas compared to other products [31,32].
Catalytic pyrolysis is widely used to process mixtures of hydrocarbons, in controlled composition, to obtain fuels or chemical products. Thus, conventional catalytic cracking uses silica-alumina, zeolites, basic catalysts such as Na2CO3 and CaO [33], or FCC catalysts (fluid catalytic cracking). It is important to highlight that catalytic pyrolysis is one of the most important processes in the refining industry, especially when it comes to the process of obtaining a gasoline of better quality and higher octane (through the optimization of aromatic and olefin contents) [34,35].
In recent years, the residual FCC catalyst has been employed in the catalytic pyrolysis of plastics [71–73]. Its moderate acidic resistance has proven effective in minimizing secondary hydrogen transfer reactions, preventing excessive cracking of olefins. Higher levels of acidity have not only increased the conversion and yield of light compounds such as gasoline and petroleum ether, but also the yields of gas and coke [71–73]. Investigating the effect of temperature and the percentage of zeolite-type FCC catalyst on the MSW (Municipal Solid Waste) fraction is crucial for various reasons, including environmental, economic, and technological aspects. Here are some important points: the temperature and the amount of catalyst directly affect the yield and efficiency of converting MSW into valuable products. Determining the optimal conditions can maximize the production of bio-oils. The morphology and crystalline structure of the biochar, as well as the chemical composition and acidity of the bio-oils, are influenced by the pyrolysis conditions. These properties determine the viability of the products for specific applications, such as fuels, chemicals, or adsorbent materials. The use of FCC zeolites can improve the selectivity of the reaction, favoring the formation of desired products and reducing the formation of undesirable compounds. This is essential for producing bio-oils with higher added value and better chemical properties.
To date, no research has investigated the effect of temperature and percentage of FCC zeolite discoveries in the mixture of MSW fractions (organic matter + paper + plastic) and their implications on biochar morphology and crystal structure, as well as on the yield of occurrence products, chemical composition and acidity of bio-oils obtained by pyrolysis and catalytic pyrolysis.
In this context, this work proposes to investigate the thermal and catalytic pyrolysis process using FCC zeolite in mass percentages of 5%, 10% and 15% for MSW fractions (organic matter + paper + plastic). The study will evaluate the quality and yield of the products obtained at temperatures of 400°C, 450°C and 475°C at 1 atm, aiming at obtaining biofuels. Additionally, the liquid organic products (bio-oil) will be analyzed regarding their chemical composition and production yields and the crystallographic and morphological characteristics of the biochars produced will be evaluated.
(Populus nigra x P.
2. Materials and Methods
The methodology applied in the research is illustrated in Figure 1, which summarizes well the methodology of the process, described as a logical sequence of ideas, methods and procedures for sustainable disposal and thermal treatment of Municipal Solid Waste (MSW) to produce biochar and bio-oil from pyrolysis and catalytic pyrolysis on a laboratory scale.
This work uses a methodology similar to Assunção et al. [37], in which the definition of the study area was the municipality of Belém/Pará, in which the provision of solid waste collection services is carried out by the company TERRAPLENA LTDA is responsible for Lot 1, as presented in the Municipal Basic Sanitation Plan of Belém [38]. It is crucial to understand the specific context of basic sanitation conditions in this region, 21 neighborhoods are included in this area that cover a significant part of the city and have the presence of 37 routes, indicating the extent of the coverage of the company TERRAPLENA LTDA in the provision of services related to basic sanitation, such as solid waste collection, water and sewage treatment, among others. This information is valuable for assessing the efficiency and comprehensiveness of sanitation services in the region, as well as for identifying any challenges or areas that need improvement.
In addition, the inclusion of neighborhoods with different socioeconomic characteristics can influence the demands and needs of the population in terms of basic sanitation services. The analysis of this distribution can be useful to guide public policies and investments aimed at improving the living conditions and health of the local population. In order to reduce the size of the sample space for collection, route 1202 was randomly chosen, the internal coding of the route, corresponding to the neighborhoods of Cremação and Guamá. The choice of the respective route as a significant representation for the gravimetric analysis of urban solid waste in Belém is justified on the basis of several important criteria: The stratification of the neighborhoods of Cremação and Guamá into classes D and E, according to the 2010 IBGE definition [10] table 1, suggests that these areas have a predominance of families with lower income, this socioeconomic stratification is relevant to understand how the financial conditions of the population can influence the generation and management of urban solid waste; when considering the average per capita household income of classes D and E in the neighborhoods of Belém, which totals 85.71%, and the population of these classes in the city, which represents 92.01%, the school on route 1202 covers a significant portion of the population that may be more vulnerable to issues related to solid waste; gravimetric analysis of municipal solid waste on route 1202 can provide detailed insights into the generation, composition and distribution patterns of this waste in areas with specific socioeconomic characteristics; The strategic selection of route 1202 allows for a more targeted and efficient approach to data collection, focusing efforts on a representative area, where results can have broader implications for waste management planning in the city.
The Cremação neighborhood is in the developed urban center and its proximity to neighborhoods such as Nazaré, São Brás and Batista Campos indicate significant integration into the urban fabric of Belém. The population of 31,264 inhabitants, with a per capita income of R$ 1,093.9, according to IBGE data from 2010 [10], classifies the neighborhood in economic class D.
These data indicate a specific socioeconomic profile, with a predominance of lower-income families. The presence of fairs, shops, schools, residential buildings, and houses highlights the diversity of activities and services available in the neighborhood. This also suggests a certain economic and social vitality in the region. The information that the neighborhood benefits from solid waste collection carried out on alternate days highlights an important basic sanitation service. The efficiency of this service can have significant impacts on quality of life and the local environment.
The information provided about the Guamá neighborhood offers a comprehensive view of its demographic, economic and urban characteristics. Guamá is highlighted as the most populous neighborhood in Belém, with 94,610 inhabitants in 2010. This expressive number highlights the demographic importance of this region within the municipality. The per capita income of R$525.8 and the economic classification as class E indicate that the neighborhood faces socioeconomic challenges, with a predominance of families with lower incomes. The availability of solid waste collection services, which can be frequent, daily, or alternate, is crucial for adequate waste management in the community. This information is vital to understanding the basic sanitation infrastructure in the region. The description of the diverse area of Guamá, which includes the busy Guamá fair, commercial areas, schools, and the Santa Izabel cemetery, highlights the multiplicity of activities and services available in the neighborhood.
2.1. Gravimetric Composition of Urban Solid Waste
To calculate the volume of samples necessary to determine the gravimetric composition of the total mass of waste collected, the STATIDISK 13.0 software was used, which is a tool commonly used for statistical analysis, including sample size calculations. in experiments.
The capacity of the collection truck was considered as fundamental parameters for the simulation, which is essential for understanding the variability and characteristics of the population. A volume of 15m³ was considered as the population size for each route, as well as a significance level of 5% was adopted in the statistical tests and the confidence level of 95% was chosen, indicating the desired confidence in the results. Finally, the margin of error was set at 10%. Based on the parameters adopted, the simulation resulted in a sample mass of approximately 100 kg [40].
The calculated sample mass is the representative quantity required to perform an accurate and reliable analysis of the gravimetric composition of the waste. The choice of significance level, confidence level and margin of error reflects the concern with the statistical validity of the results Assunção et al. [37] and Pereira et al. [39].
The gravimetric analysis approach considering the separation of solid waste into different fractions is a valuable practice to understand the detailed composition of the waste generated. Fractions identified included: Paper, Cardboard, Tetrapak, Rigid Plastic, Malleable Plastic, Glass, Metal, Organic Matter, Fabrics, Sanitary Waste and Rejects/Others. This approach allows for a more refined and specific analysis compared to a broader characterization. Each fraction can be associated with different sources of waste and has different implications for waste management. The process begins with measuring the total mass of waste, which is crucial to guide the gravimetry process and ensure the representativeness of the sample. The reference to the work of Assunção et al. [37] suggests the use of a specific methodology or protocol for gravimetric characterization.
By characterizing each fraction of waste, it is possible to obtain a more precise view of the proportions of each type of material in the total mass, identifying specific areas of intervention to optimize waste management. This information is valuable for recycling strategies, composting, and other waste treatment and disposal approaches. Furthermore, by detailing specific waste, such as sanitary waste, the analysis can contribute to the development of more targeted solutions, aiming to reduce or adequately treat these specific waste Guérin et al. [41].
Four collections were carried out following the schedule of internal routes of the company TERRAPLENA LTDA on days (Monday, Wednesday, and Friday) and time (morning), in the month of October 2021. The sampling process was carried out in accordance with Solid Waste Sampling [42]. The process described for monitoring the route of the Urban Solid Waste (RSU) compactor truck from the company TERRAPLENA LTDA involved a well-structured methodological approach. Here are some notable points: following the route with a support vehicle is an efficient practice to ensure that the compactor truck follows the planned route and to facilitate data collection along the way, use of a GPS device Garmin Montana 600 for georeferencing is an effective tool for accurately mapping collection locations. The photographic record complements this information, providing visual documentation of the sampling points (Figure 2).
The samples were collected in plastic bags with a capacity of 200 kg, at random points along the route of the solid waste compactor truck, which sought to demonstrate careful planning to obtain representative data on the composition of household waste. Sampling at random points is an important practice to avoid bias in collection by ensuring that data will reflect a variety of conditions along the route. Prioritizing residential locations is an effective approach to obtain a more comprehensive range of household waste. This is crucial for understanding disposal practices and informing waste management in these contexts Botti et al. [43].
The material was then transported to the Sludge and Composting experiment area at UFPA (100 m²), which is flat and free from moisture. The waste was weighed and deposited on a surface waterproofed by tarpaulins (6 x 6 m). Finally, the MSW was segregated/classified manually into fractions of Paper, Cardboard, Tetrapak, Rigid Plastic, Malleable Plastic, Glass, Metal, Organic Matter, Fabrics, Sanitary Waste and Rejects/Others and weighed on a digital scale (Welmy, São Paulo -Brazil, Model: W200/50).
2. Sample Pretreatment and Laboratory Determinations
As the MSW had a moisture content, due to its inadequate disposal, since they were poorly packaged and exposed to the environment, it was necessary to carry out the drying process, to separate water from the moisture in the material, due to the Moisture content is unfavorable to the Pyrolysis process. The organic fraction was subjected to the drying process in a thermal oven with air recirculation and analog temperature control Model De Leo Ltda, 127 v, at 105ºC for a period of 24 hours. After the thermal drying process, the MSW was crushed into 10 kg of dry organic fraction and 1 kg of paper with the aid of a TRAPP TRF 600 model knife mill and were mixed with 1 kg of various types of plastics (PET, PP and HDPE) that were cut into smaller fractions. In the process, a sieve with an opening diameter of 0.8 mm was used and for the others, a 5 mm sieve was used, and after crushing the material was weighed on a scale model WELMY CLASS 3 W200/S max 200 kg min 1 .0kg. The sieving of crushed MSW was carried out using a PRODUTEST Telastem sieves for analyzes LTDA sifting system. Then the pre-treated material (organic fraction) was placed in a freezer at a temperature of 0°C to avoid physicochemical and microbiological degradation.
2.1. Experimental Procedure
2.4.1. Pyrolysis Process Experimental Apparatus
The laboratory-scale Pyrolysis unit consists of a cylindrical-shaped borosilicate reactor with a volumetric capacity of approximately 200 ml. The reactor was inserted into a cylindrical furnace with a collar-type ceramic resistance, with a power of 800 W, which was connected to the digital temperature and heating rate controller (THERMA, Model TH90DP202-000), which had a K-type temperature sensor (Ecil, Model: QK. 2), as described in detail else-where Assunção et al. [37]; De Castro et al. [44]. Figure 3 and Figure 4 exemplify the description of the Pyrolysis laboratory unit.
2.4.2. Experimental procedures
In the laboratory scale investigation, thermal and catalytic pyrolysis experiments were carried out to verify the influence of catalyst percentage variations on the yields and characteristics of the products obtained, at temperatures of 400°C, 450°C and 475°C. , aiming to evaluate the influence of process parameters, yield and characteristics of the products obtained, all carried out at a heating rate of 10° C/min.
Table 2 shows the experimental conditions used in the pyrolysis processes of urban solid waste (organic fraction + paper + plastic), in the absence and presence of an FCC catalyst.
The experiments were carried out, in semi-continuous mode, at a temperature of 475 °C at 1.0 atm, and the percentages of 5, 10 and 15% of the FCC catalyst in order to evaluate the influence of this difference in final process temperature on the yield of the products obtained and the physical-chemical characteristics of the liquid product obtained (bio-oil). The masses of the MSW fractions (organic + paper + plastic) for each experiment were initially weighed on a semi-analytical balance (QUIMIS, Q – 500L210C), with this quantity being around 40 g.
They were then deposited in the 200 mL borosilicate glass reactor. With this, the reactor was inserted into the jacketed cylindrical furnace, and with the help of the control system (temperature controller) the reaction time, heating rate and final process temperature (set-point) were programmed, starting from of Equation 3, that is, for each pre-defined temperature, different process times were obtained. Given the established parameters, a time of 10 minutes was programmed to maintain constant each final operating temperature. The experimental apparatus was assembled by connecting the cooling condenser to the reactor, where the refrigerant fluid was at 20 °C. Thus, at room temperature (25 °C), the slow Pyrolysis process began at a heating rate of 10ºC/min to monitor and collect operational process parameters such as: temperature rise (heating ramp); time and temperature of product formation.
2.5. Physicochemical and Chemical Composition of Bio-Oil
2.5.1. Physicochemical Characterization of Bio-Oil and Aqueous Phase
2.5.2. Chemical Composition of Bio-Oil and Aqueous Phase
The chemical composition of bio-oil and aqueous phase were determined by GC-MS and the equipment and procedure described in details by Almeida et al. [45], Castro et al. [44]. The concentrations were expressed in area, as no internal standard was injected for comparison the peak areas. In addition, a qualitative analysis of the bio-oil was performed by FT-IR. Almeida et al. [45], Castro et al. [44].
2.6. Characterization of Biochar
2.6.1. SEM and EDS Analysis
The morphological characterization of biochars obtained by thermal and catalytic pyrolysis (5.0, 10.0 and 15.0% (by mass) FCC) of organic matter + paper + plastic was carried out by scanning electron microscopy using a microscope (Tescan GmbH , Czech). Republic, Model: Vega 3). The samples were covered with a thin layer of gold using a Sputter Coater (Leica Biosystems, Germany, Model: Balzers SCD 050). Elemental analysis and mapping were performed by energy dispersive X-ray spectroscopy (Oxford instruments, UK, model: X-MAX-80).
2.6.2. X ray Diffraction Analysis (XRD)
The crystallographic characterization of biochars obtained by thermal and catalytic pyrolysis with 5.0, 10.0 and 15.0% (by mass) of FCC) of organic matter + paper + plastic was carried out by X-ray diffraction with a PANalytical Empyrean diffractometer with a ceramic ray tube X and cobalt anode (Kα1 = 1.78901 Å), long fine focus, Fe Kβ filter and PIXCEL3D-Medpix3 1 × 1 detector operating in scan mode. The following analysis conditions were used: voltage of 40 kV, current of 35 mA, step size of 0.0263° in 2θ, 2θ scan range of 3.0072° to 94.9979°, scan speed of 30 .6 s/step, 1/4° slit angle, 1/2° anti-scattering slit and 10 mm beam mask. The phases were identified using the PANalytical X'Pert High Score software version 3.0., SANTOS et al. [46].
2.7. Yields of Bench-Scale Thermal and Catalytic Pyrolysis Experiments
The yield of condensable liquid products, oily, aqueous and other phases, as well as the carbonaceous materials formed, cokes, from each experiment carried out on a laboratory scale, were calculated in terms of the percentage of their mass in relation to the mass initial sample inserted into the reactor (RSU, RSU +catalyst). The yield of non-condensable gas phases was determined by difference, considering a total yield of 100%. The yields of the products obtained were determined by Equations 1,2 and 3.
Process performance was evaluated by calculating the bio-oil, solid (biochar) and gas yields defined by equations (1) and (2), and the gas yield by difference, using equation (3).
3. Results
3.2. Characterization of Biochar
3.2.1. SEM Analysis
To carry out the scanning electron microscopy analysis, it was necessary to coat the samples with gold. Figure 5 presents the magnifications in magnitude of [3.0 kx] x and [6.0kx] x [10 kx] of the biochars from the experiments carried out by thermal pyrolysis at 400°C (a), 450°C (b) and 475° C (w).
Biochar is mainly composed of CO, while the inorganic portion mainly contains minerals such as Ca, Mg, K, P, and inorganic carbonates, depending on the feedstock Trazzi et al. [50]. The surface morphology of biochar after the MSW pyrolysis process is reported in Figure 5, in which the scanning electron microscopy (SEM) image obtained using a backscattered electron detector is shown. Both images show a carbonized surface (black color) and compartments (white color) of different sizes scattered over the surface, as reported by Assunção et al. [37], being like the SEM images of CaCO3 (calcite) reported by Cabrera-Penna et. al. [51], Hassani et. al. [55] and SEM images of biochar obtained by MSW pyrolysis reported by Gopu et. al. [52]. The biochar particles from MSW were irregular in shape and size.
For the microscopy of the catalytic pyrolysis experiments, the images were similar, only the microscopy of the biochar from the MSW fraction (organic matter + paper + plastic) at 450°C with 5%, 10% and 15% (by mass) of FCC, respectively, at 1.0 atmosphere-ferrous, on a laboratory scale, are presented (Figure 6, Figure 7 and Figure 8). The micrographs of the biochar were coated with gold and presented magnifications of [3.0 kx], [6.0 kx] and [10 kx].
The size of the catalyst pores has a great influence on the reaction activity, as it affects the mass exchange of reactants and the yield. The larger the zeolite pore size, the greater the mass exchange and the easier the diffusion of larger molecules Rezaei et al. [49]. In both micrographs in images 6, 7 and 8, an opening of the pores can be seen as the catalyst content increases; in general, its surface appears smooth, although some areas are bumpy (Figure 8). After the addition of FCC zeolite, the pore structure of the biochar was more complex: the pore structure was dominated by megalopores with evidence of pore collapse for some pores, and its arrangement was very irregular. It showed many small particles on the inner and outer surfaces of the pore structure, making the surface of the sample rough.
3.2.2. EDS Analysis
The results of the elemental analysis performed by energy dispersive X-ray spectroscopy at one point for biochars obtained by pyrolysis of the fraction (organic matter + paper+plastic) of MSW at 450 °C, 1.0 atmosphere and by catalytic pyrolysis (organic matter + paper + plastic) of MSW at 450 °C, 1.0 atmosphere, with 10.0% (by mass) FCC as catalyst, on a laboratory scale, are illustrated in Table 3.
Generally, biochars from municipal solid waste are mainly composed of CO, while the inorganic portion mainly contains minerals such as Ca, K, P and inorganic carbonates depending on the raw material Trazzi et al., [2018]. It is worth noting that the biochars in this study predominantly contain C, Ca, Cl, K and O. The biochars in this study presented a high content of C (70.6% by mass) for the experiment with FCC and O (22.3% by mass) for thermal pyrolysis. The high level of carbonization in MSW-derived biochars makes them rich in carbon, which makes them resistant to degradation in the environment Li and Chen, [57]. This recalcitrance of MSW-derived biochars can help combat the increase in carbon emissions from soils when these materials are used for carbon sequestration Lefebvre et al., [56].
While there was a decrease for Ca (2.1% by mass) and Na (1.7% by mass), and a small increase in the percentage for Cl (3.5% by mass) and K (2.8% by mass), mass) with the addition of the FCC catalyst. Therefore, the pyrolysis of MSW led to the phase separation of the salts from the carbonaceous part. This separation may be a result of the evaporation of water from MSW during pyrolysis, which led to the crystallization of cubic NaCl crystals on the surface of the biochar. Similar results were also observed in the case of thermal pyrolysis of MSW and MSW using zeolite as catalyst in the studies by Raček et al [58].
3.2.3. XRD ANALYSIS
The XRD analysis of biochar obtained by pyrolysis of the fraction (organic matter + paper+plastic) of MSW at 400 °C, 450 °C and 475 °C, 1.0 atmosphere are illustrated in Figure 9. The phases identified in different amounts for all samples are described as follow: graphite (main peak at 0.335 nm, 30.9° 2θ CoKα), which is very close to quartz (main peak at 0.334 nm, 31.0° 2θ CoKα), besides sylvite (main peak at 0.315 nm, 32.9° 2θ CoKα), calcite (main peak at 0.303 nm, 34.3° 2θ CoKα) and halite (main peak at 0.283 nm, 36.8° 2θ CoKα). The presence of quartz (SiO2) is probably due to the presence of small sand particles inside the MSW. Organic carbon is mainly in the amorphous phase, which is the majority phase typical of this type of material.
The XRD analysis of biochar obtained by catalytic pyrolysis of the fraction (organic matter + paper + plastic) of MSW at 450 °C, 1.0 atmosphere, with 5, 10 and 15% (by mass) of FCC are illustrated in Figure 10. The phases identified in these products were the same as those identified in products without zeolitic catalyst (Figure 10), except for the appearance of faujasite zeolite with a main peak in the low angle region (1.43 nm, 7.1° 2θ CoKα) detected in samples with 10 and 15% zeolite mass. The 5% mass is very diluted in the amorphous phase, leaving the signal below the detection limit. An important observation is the decrease in the halite phase (NaCl), a result that corroborates the result of chemical analysis (Table 3), where a decrease in Na was detected with the addition of the FCC catalyst. The symbol ‘*’ indicates the quartz peak with strong preferential orientation effect, due to micro preparation. This causes a decrease on the carbonization degree, that is, the carbon content in biochar, being according to the findings reported by Kumagai et. al. [53].
3.4. Pyrolysis of MHSW Fraction (Organic Matter + Paper+Plastic) in Fixed Bed Reactor
3.4.1. Process Conditions, Mass Balances, and Yields of Reaction Products
3.4.1.1. Influence of Pyrolysis Temperature
Thermal pyrolysis (thermal cracking) (performed without a catalyst) was used as a reference in this study.Figure 11 and Table 4 illustrate the mass yields in products obtained (liq-uids, solids, H2O, and gas) with the MSW fractions (organic matter+paper+plastic) with final temperatures of 400, 450, and 475 ° C, 1.0 atmosphere, on laboratory scale, with heating rates at 10 °C/min. The thermal pyrolysis of MSW aimed to obtain mixtures of hydrocarbons and other compounds with potential for use as fuel, with an emphasis on obtaining products similar to gasoline and diesel oil.
The bio-oil yield was the highest at the temperature of 450 °C, going from 9.34% (wt.) to 9.44% (wt.) with the increase in final temperature from 400°C to 450°C. It can be observed that the variation in final temperatures did not show significant influence in the experiments to obtain bio-oil. According to Mothé and Azevedo [59], it is necessary to vary the heating rate, as it directly influences the temperature at which degradation begins. This can be understood by analyzing that for degradation to occur, the vapor pressure of the sample must overcome the ambient pressure and the released gases must diffuse freely throughout the environment. In other words, at lower rates there is greater uniformity of the temperature in the material and the heat transfer between the molecules also ends up being more balanced, causing more regular volatilization and greater liquid formation. For thermal pyrolysis, slow pyrolysis is beneficial for oil formation and hinders gas formation. This phenomenon is different from the observed trend of biomass with respect to the warming rate Aboelela et al. [61].
The biochar yields varied inversely to the condensed product yields, with the highest yield being 65.97% (wt.) at a temperature of 400°C. The aqueous fraction varied between 18.78% (wt.) and 22.15% (wt.) at 400°C and 475°C, respectively. While the gaseous fraction obtained had its highest percentage at 475°C with 28.97% (wt.). The results for byproducts obtained through pyrolysis are in line with studies reported in the literature for MSW pyrolysis [47,48,62,63,64]
In all studies reviewed, an increase in bio-oil yield was observed within the temperature range between 450°C and 600°C. However, this yield tends to decrease after exceeding 600°C. On the other hand, the bio-char yield shows an inverse pattern, decreasing in the range of 400°C to 600°C after reaching a peak, while the gas yield shows a continuous increase over the entire mentioned temperature range.
In a specific study conducted by Buah et al. 2007 [48], focused on the pyrolysis of municipal solid waste (MSW), it was reported that the yield of bio-char reaches its maximum at 400°C, and then declines after exceeding this point. On the other hand, bio-oil yield increases at higher temperatures, reaching its maximum at 700°C. Once again, the gas yield continues to increase consistently, remaining in line with the general yield standards of reaction products in relation to temperature, as evidenced in Figure 15 of the study, also reported by Assunção et al. 2021 [37].
3.4.1.2. Influence of the FCC catalyst on the pyrolysis process
Catalytic pyrolysis (thermal-catalytic cracking) was used as a reference in this study. Figure 12 and Table 5 illustrate the mass yields in products obtained (liquids, solids, H2O, and gas) with the MSW fractions (organic matter + paper + plastic) with final temperatures at 450°C, 1.0 atmosphere, with the percentages of 5%, 10% and 15% of commercial catalyst (in mass) from FCC, on a laboratory scale, with heating rates at 10 °C/min. Remembering that the FCC catalyst has an acidic character (Bronsted acidity predominantly).
The bio-oil yield was the highest at 10% FCC (by mass), it went from 3.83% (wt.) to 4.83% (wt.) with the percentage increasing from 5% to 10% (in large scale). In general, there was no significant increase in bio-oil production, according to Wang et al [47] in their studies of MSW pyrolysis using the FCC catalyst in the process, for catalytic pyrolysis, oil yields are decreased markedly, and the gas yield is increased significantly. In their results for catalytic pyrolysis using PET and LDPE, bio-oil yields were reduced by 12.7 mass % and 13.3 mass % for slow and fast pyrolysis, respectively, compared to no pyrolysis catalytic.
It can also be seen that there was a decrease in the production of the aqueous phase and biochar, going from 22.49% [wt.] to 13.47% [wt.] and 48.08% [wt.] to 36.70 % [wt.], at a percentage of 10% and 15% [wt.] and 5% and 15% [wt.], respectively of FCC. The increase in the amount of catalyst led to a significant increase in the amount of gas generated, reaching a value of 54% [wt.] gas with 15% FCC catalyst. This fact can be explained by the greater activity of this catalyst in both primary and secondary cracking reactions [64].
3.4.2. Physicochemical and Compositional Characterization of Bio-Oil
3.4.2.1. Acidity of Bio-Oil
Table 6 shows the effect of temperature on the acidity of bio-oil by pyrolysis of the MSW fraction (organic matter + paper + plastic) at 400, 450 and 475 °C, 1.0 atm, on a laboratory scale. The acidity of the bio-oil increased with increasing process temperature, while that of the aqueous phase decreased. The acidity of the bio-oil obtained at 475 °C, 1.0 atm, on a laboratory scale is close to that of the bio-oil (126.80 ± 1.0 mg KOH/g) obtained by pyrolysis of waste cooking oil at 550 °C, 1.0 atm, on laboratory scale Trabelsi et al. [60]. This strong indicated acidity of bio-oil is explained by its high levels of carboxylic acids and constitutes a disadvantage that limits its direct use as fuel in the transport sector. It can cause corrosion problems in the mechanical components of engines. To avoid these problems caused by the high acidity of bio-oils, the use of catalytic cracking is recommended Trabelsi et al. [60].
Table 7 shows the effect of FCC content on the acidity of bio-oil by catalytic pyrolysis (thermal-catalytic cracking) of the RSU fraction (organic matter + paper + plastic) at 450 °C, 1.0 atm, with 5 0, 10.0 and 15.0% (in mass), on a laboratory scale.
According to [66] solid acid catalysts play a significant role in catalytic pyrolysis by affecting the distribution of functional groups in bio-oil. Factors such as channel structure, pore size and acidity play a crucial role in regulating catalytic reactions in zeolite catalysts. Functional groups, such as sugars, acids, aldehydes, ketones, furans, and alcohols, resulting from the decomposition of biomass, have a high diffusion capacity in the zeolite channels. They are involved in several reactions that lead to the release of oxygen, culminating in the formation of aromatic hydrocarbons and deposition of coke.
The acidity of the catalytic pyrolysis bio-oil increased and remained constant in all percentages used with the FCC catalyst, in addition, the pH value of the catalytic pyrolysis bio-oil is much higher than that of bio -oil from a thermal process because of the elimination of acid groups by decarboxylation over solid acid catalysts [66,67].
3.4.2.2. FT-IR of Bio-Oil
The qualitative analysis by FT-IR of the chemical functions presents in bio-oils obtained by thermal pyrolysis of the MSW fraction (organic matter + paper + plastic) at 400, 450 and 475 °C, 1.0 atm, on a laboratory scale, are illustrated in Figure 13, Figure 14 and Figure 15. It is worth noting that all analyzed samples present vibrations in their spectra typical of unsaturated hydrocarbons. Bands related to the CH2 group were observed at 1376 cm-1. The bands at 2924-2855 cm-1 refer to asymmetric and symmetric stretching of this same group, and 1602-1603 cm-1 indicates an angular deformation. The band at 1455 cm-1 can be attributed to sections of the CH2 bond, in this region the peaks at 1710 cm-1 indicate the presence of ketones, all spectra present bands of angular deformation outside the plane of the C-H bond close to 908 cm-1. The stretching of the C-O bond of phenol was assigned to be 1277 cm-1. At 1680 - 1820 cm -1, which corresponds to the axial deformation vibration of carbonyl (C=O).
Qualitative analysis by FT-IR of the chemical functions present in bio-oils obtained by catalytic pyrolysis of the MSW fraction (organic matter + paper + plastic) at 450 °C, 1.0 atm, 5.0, 10.0 and 15, 0% (by mass) FCC, on a laboratory scale, is illustrated in Figure 16, Figure 17 and Figure 18.
The bands 1680 to 1688 cm-1 received spectra in the C = O stretching band. The bands close to 2853 to 2916 cm-1 refer to the aliphatic axial deformations of the C-H bonds of the methylene (CH2) and methyl (CH3) groups. An axial C=C vibration can be observed at 1642 cm-1. The peaks at 1682 cm-1 and 1285 cm-1 are attributed to the O and C–O double bond; at 730-731 cm-1 it presented a medium deformation; at 1275 cm-1 it suggests containing NO2 groups and, probably, some aliphatic part, in agreement with a similar analysis of bio-oils by FT-IR reported by [47,68,69].
3.4.2.3. Chemical Composition of Bio-Oil
Table 13 and Figure 19 illustrate the effect of temperature on the content of hydrocarbons and oxygenates in bio-oil obtained by pyrolysis of the MSW fraction (organic matter + paper + plastic) at 400, 450 and 475 °C, 1.0 atmosphere , on a laboratory scale. The chemical functions (alcohols, carboxylic, oxygenated and nitrogenous acids), sum of peak areas, CAS numbers and retention times of all molecules identified in the bio-oil by GC-MS, are illustrated in Supplementary Tables S1ߝS3 . The concentration of oxygenates in bio-oil has a maximum value at 400 °C and for nitrogenates it has a maximum value of 475 °C. This agrees with the acidity of bio-oils illustrated in Table 6, where the bio-oil obtained by thermal pyrolysis of the MSW fraction (organic matter + paper+plastic) at 400 °C, 1.0 atm, presents its lower acidity value. The results are in line with [70], who in their thermal co-pyrolysis studies using a mixture of biomass and low-density polyethylene obtained significant amounts of the different families of oxygenated compounds present, while almost no hydrocarbons were detected in the bio-oil thermal.
Figure 20 and Tables S4–S6 show the effect of the FCC-to-MSW fraction ratio on the hydrocarbon and oxygenated content in the bio-oil obtained by catalytic pyrolysis of the MSW fraction (organic matter + paper + plastic) at 475 °C, 1 .0 atm, 5.0, 10.0 and 15.0% (by mass) FCC, on laboratory scale. Chemical functions (alkanes, alkenes, alkynes, aromatics, esters, carboxylic acids, phenols, aldehydes, alcohols, amines, amides, nitrogenates and ketones), sum of peak areas, CAS numbers and retention times of all molecules identified in bio-oil by GC-MS are illustrated in Supplementary Tables S4–S6. The concentration of hydrocarbons in bio-oil decreases with an increase in the proportion of the FCC-to-RSU fraction, while that of oxygenates increases. The bio-oil compositions described in Tables S1-S6 are in accordance with those described in the literature for bio-oils obtained by pyrolysis of MSW [21,31,32,37,44,47].
The occurrence of nitrogen-containing compounds is probably due to the presence of nitrogen in MSW determined by elemental analysis as reported by AlDayyat et. Al. [20], and by Ghavanati et. Al. [67]. Regarding the influence of the catalyst content on the chemical composition, Figure 24 illustrates that increasing the catalyst content causes a decrease in the concentration of hydrocarbons and an increase in the concentration of oxygenates.
5. Conclusions
The scanning electron microscopy (SEM) images of the biochars produced by pyrolysis show the formation of porous structures, confirming that pyrolysis drastically altered the morphological structure of the MSW fraction (composed of organic matter, paper, and plastic). This alteration favors the use of this biochar in contaminant adsorption processes, making it effective in removing pollutants, heavy metals, and organic compounds from wastewater. X-ray diffraction (XRD) analysis of the biochars obtained from thermal and catalytic pyrolysis identified the presence of crystalline phases such as quartz, graphite, sylvite, calcite, halite, and faujasite – NaY.
Thermal pyrolysis produces a bio-oil yield between 9.24% and 9.44% by mass. The bio-oil yield increases with pyrolysis temperature. In catalytic pyrolysis, the yields of biochar and gas slightly increase with FCC content, while the bio-oil yield decreases, and the water phase remains constant. The FCC catalyst tends to generate more gas at the expense of wax and oils due to its acidity. A lower concentration and fraction of oxygen were observed in the oils from catalytic pyrolysis of both samples, indicating the desoxygenation capacity of the residual FCC catalyst. The acidity of the bio-oil increases with higher process temperatures and with the addition of FCC as a catalyst. The concentration of hydrocarbons in the bio-oil increases with the proportion of FCC-MSW fraction, due to catalytic desoxygenation of fatty acid molecules through decarboxylation/decarbonylation, resulting in the production of aliphatic and aromatic hydrocarbons. The FCC catalyst also promotes the formation of fewer aliphatic and more alkanes and aromatics, due to its strong aromatization capacity and hydrogen transfer.
Supplementary Materials
The following supporting information can be downloaded at the website of this paper posted on Preprints.org, Table S1: Classes of compounds, summation of peak areas, CAS number, and retention times of chemical compounds identified by GC-MS in bio-oil by pyrolysis of (organic matter + paper+ plastic) fraction from MHSW at 400 °C, 1.0 atm, in laboratory scale. Table S2: Classes of compounds, summation of peak areas, CAS number, and retention times of chemical compounds identified by CG-MS in bio-oil by pyrolysis of (organic matter + paper +plastic) fraction from MHSW at 450 °C, 1.0 atm, in laboratory scale. Table S3: Classes of compounds, summation of peak areas, CAS number, and retention times of chemical compounds identified by CG-MS in bio-oil by pyrolysis of (organic matter + paper+plastic) fraction from MHSW at 475 °C, 1.0 atm, in laboratory scale. Table S4: Classes of compounds, summation of peak areas, CAS number, and retention times of chemical compounds identified by CG-MS in bio-oil by thermal catalytic cracking of (organic matter + paper+plastic) fraction from MHSW at 475 °C, 1.0 atm, 5.0% (wt.) of FCC, in laboratory scale. Table S5: Classes of compounds, summation of peak areas, CAS number, and retention times of chemical compounds identified by CG-MS in bio-oil by thermal catalytic cracking of (organic matter + paper + plastic) fraction from MHSW at 475 °C, 1.0 atm, 10.0% (wt.) of FCC, in laboratory scale. Table S6: Classes of compounds, summation of peak areas, CAS number, and retention times of chemical compounds identified by CG-MS in bio-oil by thermal catalytic cracking of (organic matter + paper +plastic) fraction from MHSW at 475 °C, 1.0 atm, 15.0% (wt.) of FCC, in laboratory scale.
Author Contributions
The individual contributions of all the co-authors are provided as follows: H.R.B. contributed with formal analysis and writing original draft preparation, investigation and methodology, F.P.d.C.A. and D.O.P. contributed with formal analysis, investigation and methodology, O.A.C. contributed with formal analysis, investigation and methodology, J.F.H.F. and L.H.R.G. contributed with formal analysis, investigation and methodology, S.P.A.d.P contributed with investigation and methodology, M.C.S. contributed with investigation and methodology, I.W.d.S.B. contributed with investigation and methodology, D.A.R.d.C. contributed with investigation and methodology, N.M.M. contributed with formal analysis, investigation and methodology, J.A.R.P. contributed with conceptualization and resources, M.C.M contributed with resources and chemical analysis, S.D.Jr. contributed with chemical analysis, A.O.M. contributed with chemical analysis and formal analysis, L.E.P.B. with co-supervision, and resources, and N.T.M. contributed with supervision, conceptualization, and data curation. All authors have read and agreed to the published version of the manuscript.
Institutional Review Board Statement
Not applicable.
Informed Consent Statement
Not applicable.
Acknowledgments
I would like to acknowledge and dedicate this research in memory to Hélio da Silva Almeida, he used to work at the Faculty of Sanitary and Environmental Engineering/UFPa, and passed away on 13 March 2021. His contagious joy, dedication, intelligence, honesty, seriousness, and kindness will always be remembered in our hearts.
Conflicts of Interest
The authors declare no conflict of interest.
References
- S. Nanda, F. Berruti Thermochemical conversion of plastic waste to fuels: a review. Environ. Chem. Lett., 19 (2021), pp. 123-148. [CrossRef]
- M. Gholizadeh, C. Li, S. Zhang, Y. Wang, N. Shengli, Y. Li, X. Hu. Progress of the development of reactors for pyrolysis of municipal waste. Sustain. Energy Fuels, 4 (2020), pp. 5885–5915; doi:doi.org/10.1039/D0SE01122C;
- S. Kaza, L. Yao, P. Bhada-Tata, V.F. Woerden What a Waste 2.0: A Global Snapshot of Solid Waste Management to 2050. World Bank (2018).
- PROGRAMA DAS NAÇÕES UNIDAS PARA O DESENVOLVIMENTO (PNUD). Acompanhando a agenda 2030 para o desenvolvimento sustentável: subsídios iniciais do Sistema Nações Unidas no Brasil sobre a identificação de indicadores nacionais referentes aos objetivos de desenvolvimento sustentável/ Programa das Nações Unidas para o Desenvolvimento. Brasília: PNUD, 2015. Disponível em. Available online: http://www.br.undp.org/content/brazil/pt/home/library/ods/acompanhando-a-agenda2030.html (accessed on 10 March 2018).
- S. Alam, K.S. Rahman, M. Rokonuzzaman, P.A. Salam, M.S. Miah, N. Das, S. Chowdhury, S. Channumsin, S. Sreesawet, M. Channumsin. Selection of Waste to Energy Technologies for Municipal Solid Waste Management—Towards Achieving Sustainable Development Goals. Sustainability, 14 (19) (2022), p. 11913. [CrossRef]
- M. Struk, M. Boďa. Factors influencing performance in municipal solid waste management - a case study of Czech municipalities. Waste Manag., 139 (2022), pp. 227-249. [CrossRef]
- ASSOCIAÇÃO BRASILEIRA DE EMPRESAS DE LIMPEZA PÚBLICA E RESÍDUOS ESPECIAIS – ABRELPE. Panorama 2022. São Paulo: ABRELPE, 2023.
- SILVA, Diego Rodrigues Borges da; COSTA FILHO, Itair da Silva; SOUZA, Waryson Carlos Silva de; SANTOS, Filippe Vilhena dos; MACHADO, Paulo Christian de Freitas; BRANDÃO, Isaque Wilkson de Sousa; PEREIRA, Filipe Castro; ASSUNÇÃO, Maurilo André da Cunha; SILVA, Rafael Haruo Yoshida; RUSSO, Mario Augusto Tavares; MENDONÇA, Neyson Martins. Aspectos Quantitativos e Qualitativos de Resíduos Sólidos Urbanos nos Municípios de Ananindeua, Belém e Marituba. In: PEREIRA, Christiane; FRICKE, Klaus (coord.). Cooperação Intersetorial e Inovação: ferramentas para a gestão sustentável de resíduos sólidos. Braunschweig: Technische Universität Braunschweig, 2022.
- Aman Kumar, Ekta Singh, Rahul Mishra, Shang Lien Lo, Sunil Kumar. Global trends in municipal solid waste treatment technologies through the lens of sustainable energy development opportunity. Energy. Volume 275,2023, 127471. ISSN 0360-5442. [CrossRef]
- BRASIL. Lei nº 12.305, de 02 de agosto de 2010 - Instituí a Política Nacional de Resíduos Sólidos. Brasília, 2010.
- Rodrigo Custodio Urban, Liane Yuri Kondo Nakada. COVID-19 pandemic: Solid waste and environmental impacts in Brazil. Science of The Total Environment. Volume 755, Part 1. 2021,142471,ISSN 0048-9697. [CrossRef]
- Ram Kumar Ganguly, Susanta Kumar Chakraborty, Plastic waste management during and post Covid19 pandemic: Challenges and strategies towards circular economy,Heliyon, Volume 10, Issue 4, 2024, e25613, ISSN 2405-8440. [CrossRef]
- Leilei Dai, Nan Zhou, Yuancai Lv, Yanling Cheng, Yunpu Wang, Yuhuan Liu, Kirk Cobb, Paul Chen, Hanwu Lei, Roger Ruan. Pyrolysis technology for plastic waste recycling: A state-of-the-art review. Progress in Energy and Combustion Science, Volume 93, 2022,101021, ISSN 0360-1285. [CrossRef]
- Nawaz, P. Kumar. Optimization of process parameters of Lagerstroemia speciosa seed hull pyrolysis using a combined approach of Response Surface Methodology (RSM) and Artificial Neural Network (ANN) for renewable fuel production. Bioresour. Technol. Reports., 18 (2022). [CrossRef]
- Ahmad Nawaz, Shaikh Abdur Razzak. Co-pyrolysis of biomass and different plastic waste to reduce hazardous waste and subsequent production of energy products: A review on advancement, synergies, and future prospects. Renewable Energy. Volume 224, 2024, 120103, ISSN 0960-1481. [CrossRef]
- Yi Mei Zhang, Guo He Huang, Li He. An inexact reverse logistics model for municipal solid waste management systems. Journal of Environmental Management, Volume 92, Issue 3, 2011, Pages 522-530, ISSN 0301-4797. [CrossRef]
- Perla Calil Pongeluppe Wadhy Rebehy, Alexandre Pereira Salgado Junior, Aldo Roberto Ometto, Diego de Freitas Espinoza, Efigenia Rossi, Juliana Chiaretti Novi. Municipal solid waste management (MSWM) in Brazil: Drivers and best practices towards to circular economy based on European Union and BSI. Journal of Cleaner Production. Volume 401, 2023, 136591, ISSN 0959-6526. [CrossRef]
- Ferreira, C.; Costa, E.; de Castro, D.; Pereira, M.; Mâncio, A.; Santos, M.; Lhamas, D.; da Mota, S.; Leão, A.; Duvoisin, S., Jr.; et al. Deacidification of organic liquid products by fractional distillation in laboratory and pilot scales. J. Anal. Appl. Pyrolysis 2017,127, 468–489. [CrossRef]
- Hussein I. Abdel-Shafy, Mona S.M. Mansour, Solid waste issue: Sources, composition, disposal, recycling, and valorization. Egyptian Journal of Petroleum. Volume 27, Issue 4. 2018. Pages 1275-1290, ISSN 1110-0621. [CrossRef]
- Silva, Rodrigo Cândido Passos da; COSTA, Amanda Rodrigues Santos; Eldeir, Soraya Giovanetti; Jucá, José Fernando Thomé. Setorização de rotas de coleta de resíduos sólidos domiciliares por técnicas multivariadas: estudo de caso da cidade do Recife, Brasil. Engenharia Sanitária e Ambiental, v. 25, n. 6, p. 821-832, 2020. [CrossRef]
- LENZ, S.; BÖHM, K.; OTTNER, R.; HUBER-HUMER, M. (2016) Determination of leachate compounds relevant for landfill aftercare using FT-IR spectroscopy. Waste Management, v. 55, p. 321-329. [CrossRef]
- Alsayed Alsobky, Mostafa Ahmed, Sherien Al Agroudy, Khaled El Araby. A smart framework for municipal solid waste collection management: A case study in Greater Cairo Region. Ain Shams Engineering Journal. Volume 14, Issue 6. 2023. 102183. ISSN 2090-4479. [CrossRef]
- Carneiro, Paulo Fernando Norat. Caracterização e avaliação da potencialidade econômica da coleta seletiva e reciclagem dos resíduos sólidos domiciliares gerados nos municípios de Belém e Ananindeua - PA. 2006. Dissertação (Mestrado em Engenharia Civil) – Programa de Pós-Graduação em Engenharia Civil (PPGEC), Instituto de Tecnologia (ITEC), Centro Tecnológico, Universidade Federal do Pará, Belém, 2006. Disponível em: http://www.repositorio.ufpa.br:8080/jspui/handle/2011/1899.
- Frishammar, J., & Parida, V. (2019). Circular Business Model Transformation: A Roadmap for Incumbent Firms. California Management Review, 61(2), 5-29. [CrossRef]
- Muhammad Shahbaz, Tareq Al-Ansari, Abrar Inayat, Muddasser Inayat, Chapter 15 - Technical readiness level of biohydrogen production process and its value chain, Editor(s): Suzana Yusup, Nor Adilla Rashidi,Value-Chain of Biofuels,Elsevier,2022,Pages 335-355,ISBN 9780128243886. [CrossRef]
- Naqvi SR, Tariq R, Shahbaz M, Naqvi M, Aslam M, Khan Z, et al. Recent developments on sewage sludge pyrolysis and its kinetics: resources recovery, thermogravimetric platforms, and innovative prospects. Comput Chem Eng 2021; 150:107325. 1.
- A.K. Mostafazadeh, O. Solomatnikova, P. Drogui, R.D. Tyagi. A review of recent research and developments in fast pyrolysis and bio-oil upgrading. Biomass Conversion Biorefinery, 8 (2018), pp. 739-773. [CrossRef]
- S. Papari, K. Hawboldt. A review on the pyrolysis of woody biomass to bio-oil: focus on kinetic models. Renew Sustain Energy Rev, 52 (2015), pp. 1580-1595. [CrossRef]
- Lehmann, J.; Joseph, S. Biochar for environmental management. Editora Earthscan. USA. (2009). 2009.
- Rezende, E. I. P. Preparação e caracterização química e espectroscópica de “biochar” por pirólise de biomassa em baixa temperatura. 149 f. – Tese - Universidade Federal do Paraná, Setor de Ciências Exatas, Programa de Pós-Graduação em Química. Curitiba-PR, 2013.
- K. Yadav, S. Jagadevan. Influence of process parameters on synthesis of biochar by pyrolysis of biomass: an alternative source of energy. Recent advances in pyrolysis. IntechOpen (2019).
- Suresh, A., Alagusundaram, A., Kumar, P.S. et al. Microwave pyrolysis of coal, biomass and plastic waste: a review. Environ Chem Lett 19, 3609–3629 (2021). [CrossRef]
- Da Silva, Rodrigo Cândido Passos da; COSTA, Amanda Rodrigues Santos; ELDEIR, Soraya Giovanetti; JUCÁ, José Fernando Thomé. Setorização de rotas de coleta de resíduos sólidos domiciliares por técnicas multivariadas: estudo de caso da cidade do Recife, Brasil. Engenharia Sanitária e Ambiental, v. 25, n. 6, p. 821-832, 2020. [CrossRef]
- D.P. Serrano, J. Aguado, J.M. Escola, E. Garagorri, J.M. Rodrı́guez, L. Morselli, G. Palazzi, R. Orsi, Feedstock recycling of agriculture plastic film wastes by catalytic cracking. Applied Catalysis B: Environmental, Volume 49, Issue 4, 2004, Pages 257-265, ISSN 0926-3373. [CrossRef]
- RIBEIRO, A. M.; MACHADO JÚNIOR, H. F.; COSTA, D. A. MAIA, J. E. P. S., FERREIRA, J. C. N. Craqueamento catalítico de polímeros utilizando catalisadores comerciais de FCC para produção de frações combustíveis. Revista Universidade Rural: Série de Ciências Exatas e da Terra. Seropédica, RJ: EDUR, v.23, n. 1-2, p. 120-128- jan.- dez., 2004.
- Legado da COP-30 para Belém vai transformar a vida da população e beneficiar a cidade. Agência Belém, 2023. Disponível em: Agência Belém (agenciabelem.com.br). Acesso em: 10, novembro de 2023.
- Assunção, F.P.d.C.; Pereira, D.O.; Silva, J.C.C.d.; Ferreira, J.F.H.; Bezerra, K.C.A.; Bernar, L.P.; Ferreira, C.C.; Costa, A.F.d.F.; Pereira, L.M.; Paz, S.P.A.d.; et al. A Systematic Approach to Thermochemical Treatment of Municipal Household Solid Waste into Valuable Products: Analysis of Routes, Gravimetric Analysis, Pre-Treatment of Solid Mixtures, Thermochemical Processes, and Characterization of Bio-Oils and Bio-Adsorbents. Energies 2022, 15, 7971. [CrossRef]
- BELÉM. Lei Municipal nº 9.656, de 30 de dezembro de 2020. Institui a Política Municipal de Saneamento Básico do Município de Belém, o Plano Municipal de Saneamento Básico (PMSB), e o Plano de Gestão Integrada de Resíduos Sólidos (PGIRS), em atenção ao disposto no Art. 9º da Lei Federal nº 11.445/2007, com as atualizações trazidas pela Lei nº 14.026/2020, o Novo Marco do Saneamento Básico, e dá outras providências. Belém, PA, 30 dez. 2020.
- Pereira, D.O.; da Costa Assunção, F.P.; da Silva, J.C.C.; Ferreira, J.F.H.; Ferreira, R.B.P.; Lola, Á.L.; do Nascimento, Í.C.P.; Chaves, J.P.; do Nascimento, M.S.C.; da Silva Gouvêa, T.; et al. Prediction of Leachate Characteristics via an Analysis of the Solubilized Extract of the Organic Fraction of Domestic Solid Waste from the Municipality of Belém, PA. Sustainability. 2023, 15, 15456. [CrossRef]
- Fesseha, S.N.; Bin, F. The Assessment of Solid Waste Products Management in Ethiopians Municipal Urban Areas. Int. J. Soc. Sci. Manag. 2015, 2, 165–179. [CrossRef]
- Julie Élize Guérin, Maxime Charles Paré, Sylvain Lavoie, Nancy Bourgeois. The importance of characterizing residual household waste at the local level: A case study of Saguenay, Quebec (Canada). Waste Management,Volume 77, 2018, Pages 341-349, ISSN 0956-053X. [CrossRef]
- ANBT. NBR 10.004/2004; Resíduos Sólidos—Classificação. Associação Brasileira De Normas Técnicas: Rio de Janeiro, Brasil, 2004.
- Lucia Botti, Daria Battini, Fabio Sgarbossa, Cristina Mora, Door-to-door waste collection: Analysis and recommendations for improving ergonomics in an Italian case study, Waste Management, Volume 109, 2020, Pages 149-160, ISSN 0956-053X. [CrossRef]
- De Castro, D.A.R. Processo de Produção de Bio-Óleo e Bio-Adsorventes via Pirólise das Sementes do Açaí (Euterpe oleraceae, Mart). Ph.D. Thesis, PRODERNA, UFPa, Belém, Brazil, 2019.
- Almeida, H.D.S.; Corrêa, O.; Ferreira, C.; Ribeiro, H.; de Castro, D.; Pereira, M.; Mâncio, A.D.A.; Santos, M.; da Mota, S.; Souza, J.D.S.; et al. Diesel-like hydrocarbon fuels by catalytic cracking of fat, oils, and grease (FOG) from grease traps. J. Energy Inst. 2016, 90, 337–354. [CrossRef]
- Lesley Santos, Rômulo Angélica, Simone Paz. Investigation of mineral commodity residues based on alkalinity, solubility and other physicochemical aspects aiming the management of amazonian acidic soils. Journal of Environmental Management,Volume 335, 2023, 117558, ISSN 0301-4797. [CrossRef]
- Peng cheng Wang, Lei Qiao, Wei Wang, Jie Yu. Catalytic pyrolysis of waste composite plastics with waste FCC catalyst. Journal of the Energy Institute. Volume 110, 2023, 101338, ISSN 1743-9671. [CrossRef]
- BUAH, W.K.; CUNLIFFE, A.M.; WILLIAMS, P.T. Characterization of products from the pyrolysis of municipal solid waste. Process safety and Environmental Protection, v. 85 (B5), p. 450-457, 2007.
- Jakub Raček, Tomáš Chorazy, Marco Carnevale Miino, Martina Vršanská, Martin Brtnický, Ludmila Mravcová, Jiří Kučerík, Petr Hlavínek. Biochar production from the pyrolysis of food waste: Characterization and implications for its use. Sustainable Chemistry and Pharmacy, Volume 37, 2024, 101387, ISSN 2352-5541. [CrossRef]
- Trazzi, P. A., Higa, A. R., Dieckow, J., Mangrich, A. S., & Higa, R. C. V. (2018). BIOCARVÃO: REALIDADE E POTENCIAL DE USO NO MEIO FLORESTAL. Ciência Florestal, 28(2), 875–887. [CrossRef]
- Cabrera-Penna, M.; Rodríguez-Páez, J. Calcium oxyhydroxide (CaO/Ca(OH)2 ) nanoparticles: Synthesis, characterization and evaluation of their capacity to degrade glyphosate-based herbicides (GBH). Adv. Powder Technol. 2020, 32, 237–25. [Google Scholar] [CrossRef]
- Gopu, C.; Gao, L.; Volpe, M.; Fiori, L.; Goldfarb, J.L. Valorizing municipal solid waste: Waste to energy and activated carbons for water treatment via pyrolysis. J. Anal. Appl. Pyrolysis 2018, 133, 48–58. [Google Scholar] [CrossRef]
- Kumagai, S.; Grause, G.; Kameda, T.; Yoshioka, T. Recovery of benzene-rich oil from the degradation of metal- and metal oxide-containing poly(ethylene terephthalate) composites. J. Mater. Cycles Waste Manag. 2013, 16, 282–290. [Google Scholar] [CrossRef]
- Ghanavati, H.; Nahvi, I.; Karimi, K. Organic fraction of municipal solid waste as a suitable feedstock for the production of lipid by oleaginous yeast Cryptococcus aerius. Waste Manag. 2015, 38, 141–148. [Google Scholar] [CrossRef] [PubMed]
- Hassani, E.; Feyzbar-Khalkhali-Nejad, F.; Rashti, A.; Oh, T.-S. Carbonation, Regeneration, and Cycle Stability of the Mechanically Activated Ca(OH)2 Sorbents for CO2 Capture: An In Situ X ray Diffraction Study. Ind. Eng. Chem. Res. 2020, 59, 11402–11411. [Google Scholar] [CrossRef]
- D. Lefebvre, A. Williams, J. Meersmans, G. Kirk, S. Sohi, P. Goglio, P. Smith. Modelling the potential for soil carbon sequestration using biochar from sugarcane residues in Brazil. Sci. Rep., 10 (2020), p. 19479. [CrossRef]
- Simeng Li, Gang Chen. Thermogravimetric, thermochemical, and infrared spectral characterization of feedstocks and biochar derived at different pyrolysis temperatures. Waste Management,Volume 78, 2018, Pages 198-207, ISSN 0956-053X. [CrossRef]
- Jakub Raček, Tomáš Chorazy, Marco Carnevale Miino, Martina Vršanská, Martin Brtnický, Ludmila Mravcová, Jiří Kučerík, Petr Hlavínek. Biochar production from the pyrolysis of food waste: Characterization and implications for its use. Sustainable Chemistry and Pharmacy,Volume 37, 2024, 101387, ISSN 2352-5541. [CrossRef]
- MOTHÉ, C.; AZEVEDO, A. D. Análise térmica de materiais. Rio de Janeiro: Artilber, 2010.
- Ben Hassen Trabelsi A, Zaafouri K, Baghdadi W, Naoui S, Ouerghi A. Second generation biofuels production from waste cooking oil via pyrolysis process. Renew Energy 2018;126:888–96. [CrossRef]
- Aboelela, D.; Saleh, H.; Attia, A.M.; Elhenawy, Y.; Majozi, T.; Bassyouni, M. Recent Advances in Biomass Pyrolysis Processes for Bioenergy Production: Optimization of Operating Conditions. Sustainability 2023, 15, 11238. [Google Scholar] [CrossRef]
- Ranjeet Kumar Mishra, Syeda Minnat Chistie, Sneha Ullhas Naika, Kaustubha Mohanty, Catalytic pyrolysis of biomass over zeolites for bio-oil and chemical production: A review on their structure, porosity and acidity co-relation, Bioresource Technology, Volume 366, 2022, 128189, ISSN 0960-8524. [CrossRef]
- Phan, A.N.; Ryu, C.; Sharifi, V.N.; Swithenbank, J. Characterisation of slow pyrolysis products from segregated wastes for energy production. J. Anal. Appl. Pyrolysis 2008, 81, 65–71. [Google Scholar] [CrossRef]
- Bin Yang, Y.; Phan, A.N.; Ryu, C.; Sharifi, V.; Swithenbank, J. Mathematical modelling of slow pyrolysis of segregated solid wastes in a packed-bed pyrolyser. Fuel 2006, 86, 169–180. [Google Scholar] [CrossRef]
- Guimarães, S.F. Craqueamento e hidrocraqueamento catalítico de óleo de soja sobre catalisadores ácidos e básicos para obtenção de biocombustíveis. Ph.D. Thesis, Programa de Pós-graduação em Química, UFBa, Salvador, Brazil, 2019. [Google Scholar]
- Ronghou Liu, Manobendro Sarker, Md. Maksudur Rahman, Chong Li, Meiyun Chai, Nishu, Raphaëlle Cotillon, Norman R. Scott. Multi-scale complexities of solid acid catalysts in the catalytic fast pyrolysis of biomass for bio-oil production – A review, Progress in Energy and Combustion Science, Volume 80, 2020,100852, ISSN 0360-1285. [CrossRef]
- Pooya Lahijani, Maedeh Mohammadi, Abdul Rahman Mohamed, Farzad Ismail, Keat Teong Lee, Ghazaleh Amini,Upgrading biomass-derived pyrolysis bio-oil to bio-jet fuel through catalytic cracking and hydrodeoxygenation: A review of recent progress, Energy Conversion and Management, Volume 268, 2022, 115956, ISSN 0196-8904. [CrossRef]
- Ijaz Hussain, Saheed A Ganiyu, Hassan Alasiri, Khalid Alhooshani. A state-of-the-art review on waste plastics-derived aviation fuel: Unveiling the heterogeneous catalytic systems and techno-economy feasibility of catalytic pyrolysis. 2022. [CrossRef]
- J.V Gulmine, P.R Janissek, H.M Heise, L Akcelrud, Polyethylene characterization by FTIR, Polymer Testing, Volume 21, Issue 5, 2002, Pages 557-563, ISSN 0142-9418. [CrossRef]
- MORAIS, Ellen Kadja Lima - Co-Pirólise Catalítica de Resíduo de Polietileno e Biomassa De Eucalipto Para Obtenção de Bio-Óleo. Tese de Doutorado, UFRN. Programa de Pós-Graduação em Ciência e Engenharia de Petróleo. Natal –RN, Brasil, 2018.
- M. Olazar, et al., Influence of FCC catalyst steaming on HDPE pyrolysis product distribution, J. Anal. Appl. Pyrol. 85 (1) (2009) 359–365.
- Gorka, et al., Polyethylene Cracking on a Spent FCC Catalyst in a Conical Spouted Bed, Industrial & Engineering Chemistry Research, 2012.
- E. Rodríguez, et al., Effect of the FCC equilibrium catalyst properties and of the cracking temperature on the production of fuel from HDPE pyrolysis waxes, Energy Fuels 33 (6) (2019).
Figure 1.
General flowchart of the methodological procedure adopted by collecting, segregating and pre-treating MSW and thermal processing of pre-treated (organic matter + paper + plastic) at 400, 450 and 475 °C, 1.0 atm, 0.0.5.0, 10.0 and 15.0% (by mass) of FCC, on a laboratory scale, adapted from Assunção et al. [37].
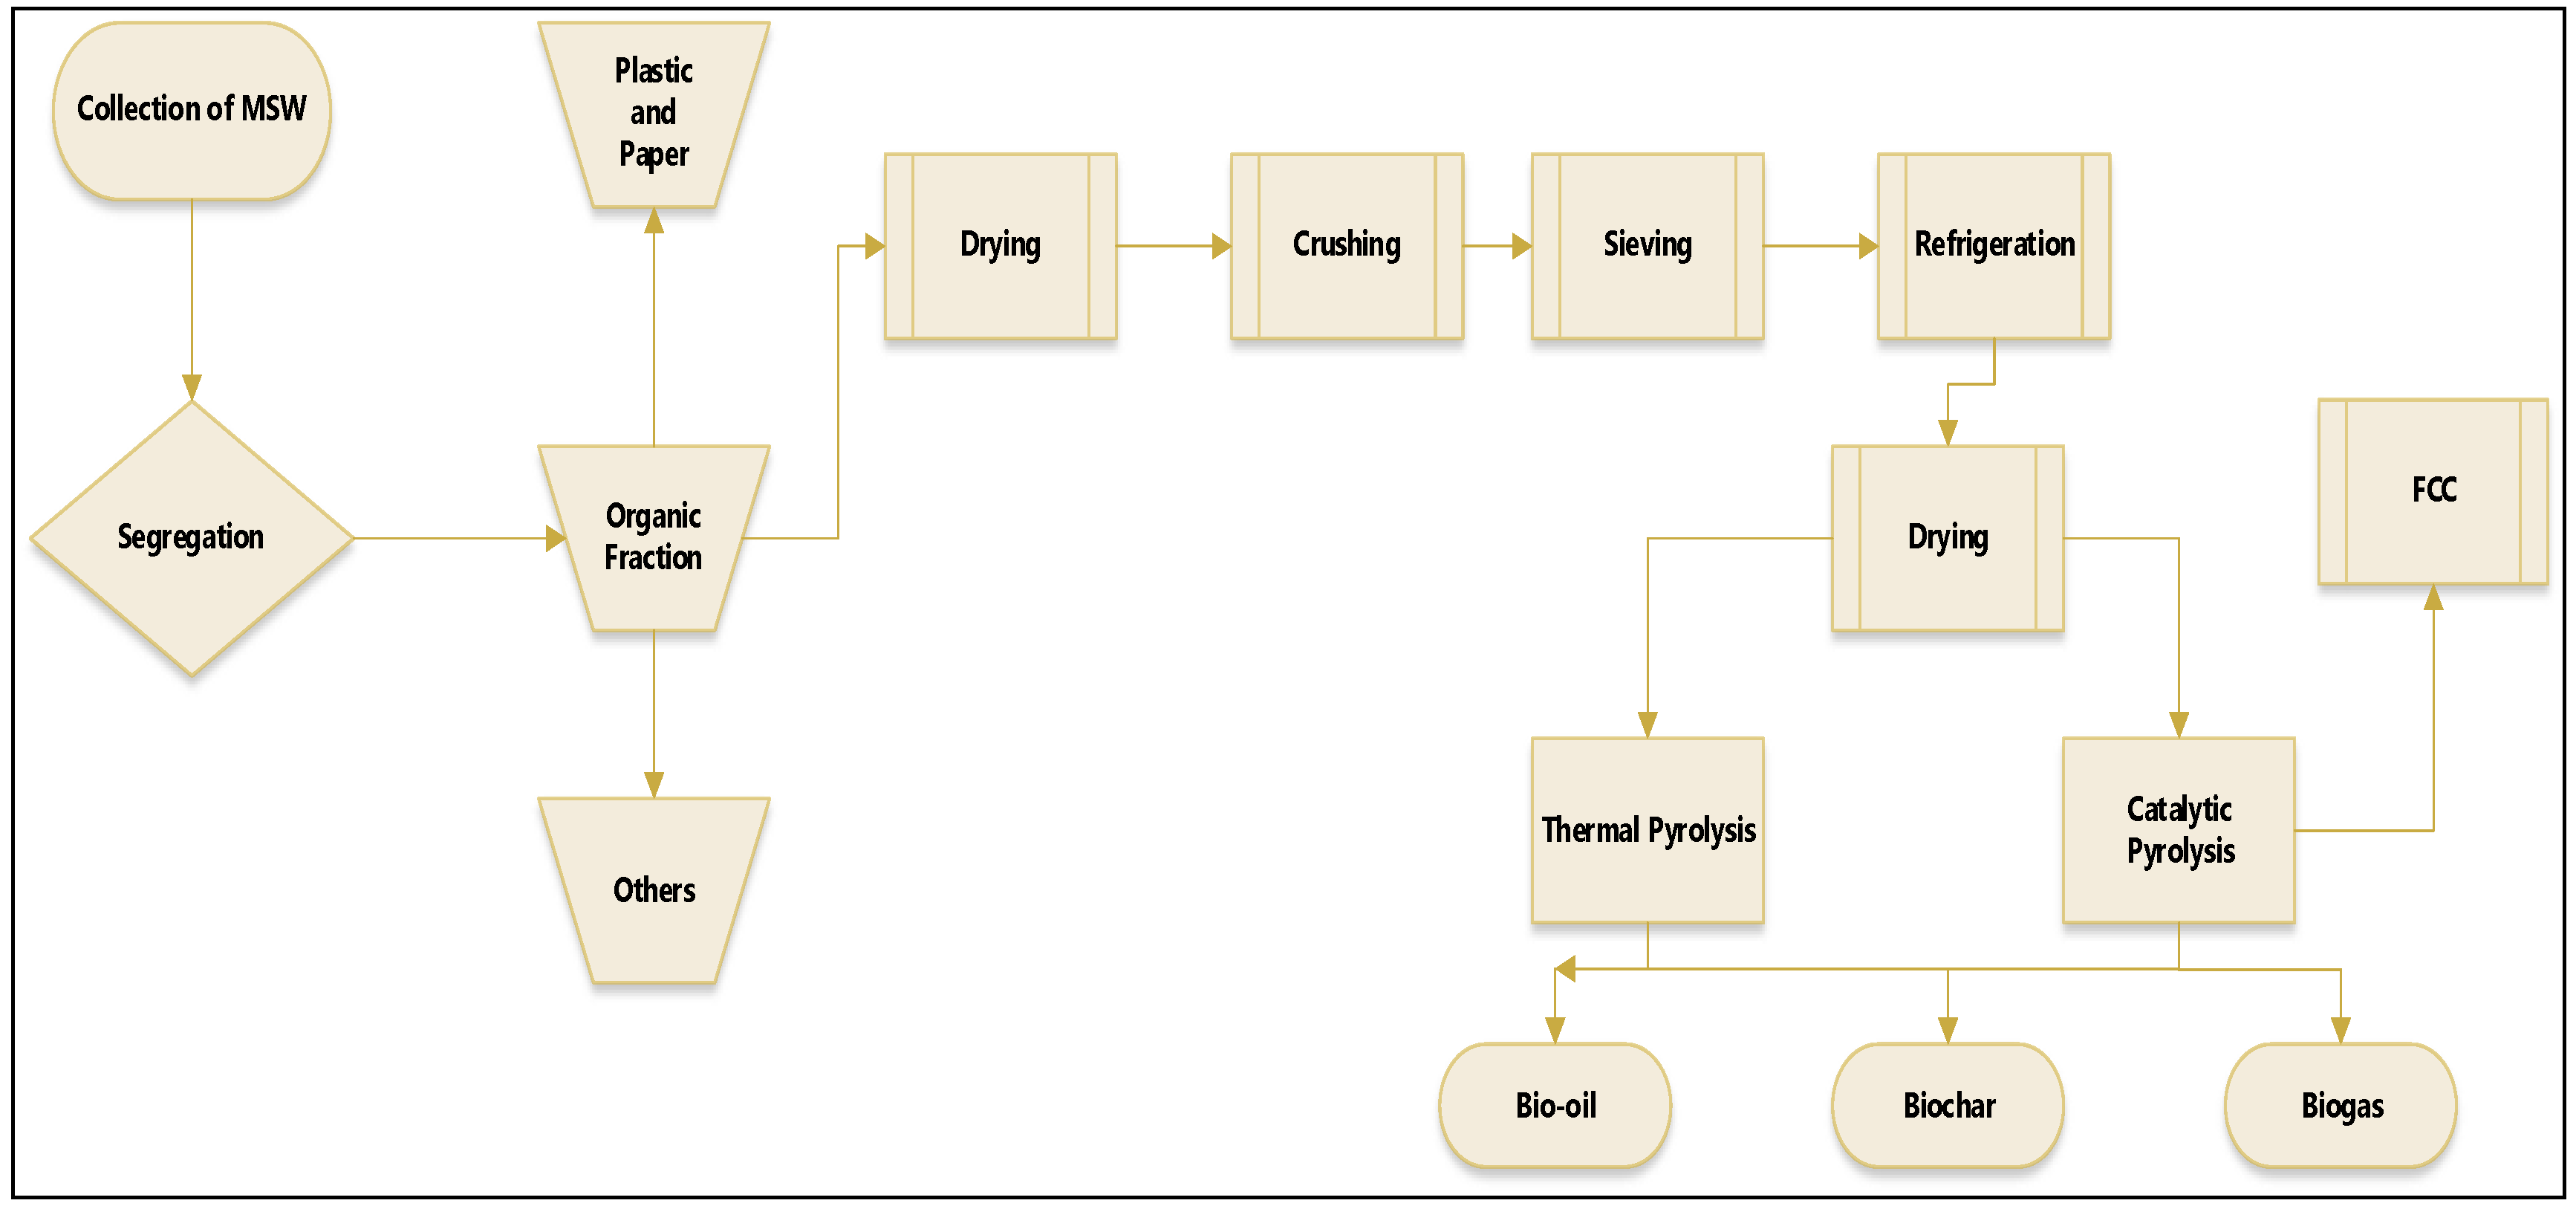
Figure 2.
Door-to-door collection points for Urban Solid Waste in the Cremação and Guamá neighborhoods of the city of Belém-PA.
Figure 2.
Door-to-door collection points for Urban Solid Waste in the Cremação and Guamá neighborhoods of the city of Belém-PA.
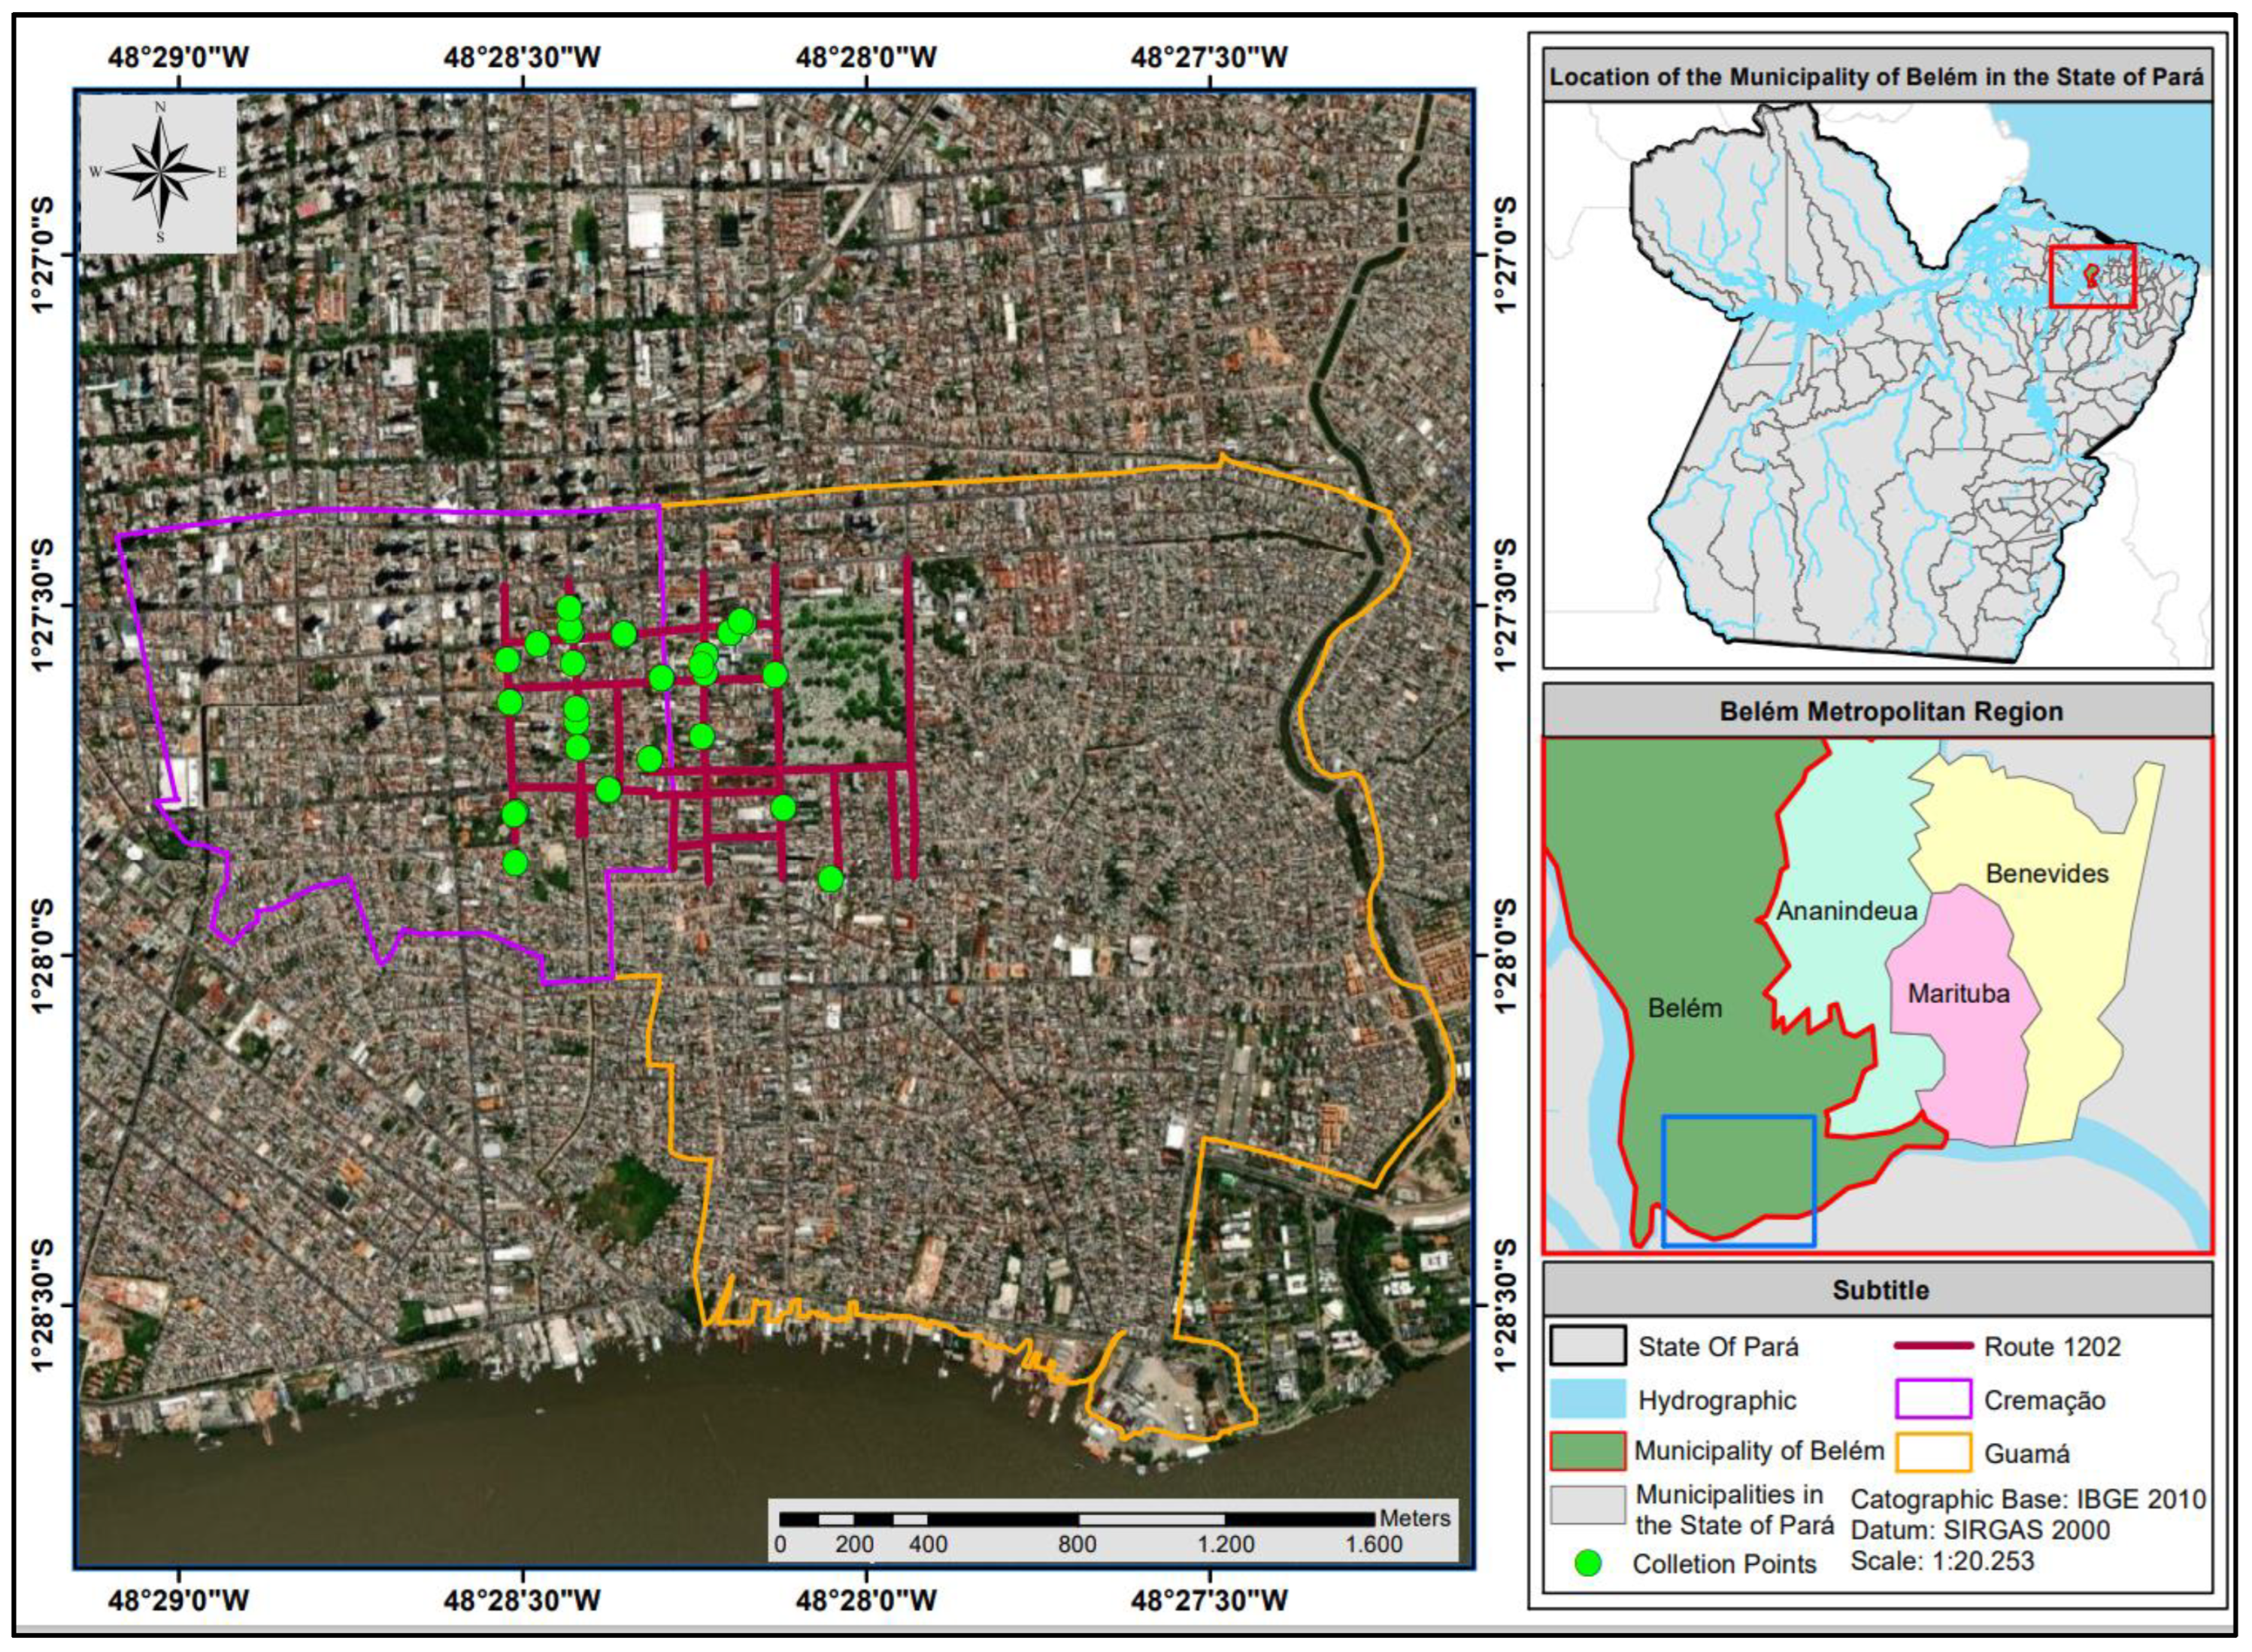
Figure 3.
Schema of laboratory scale borosilicate glass reactor.
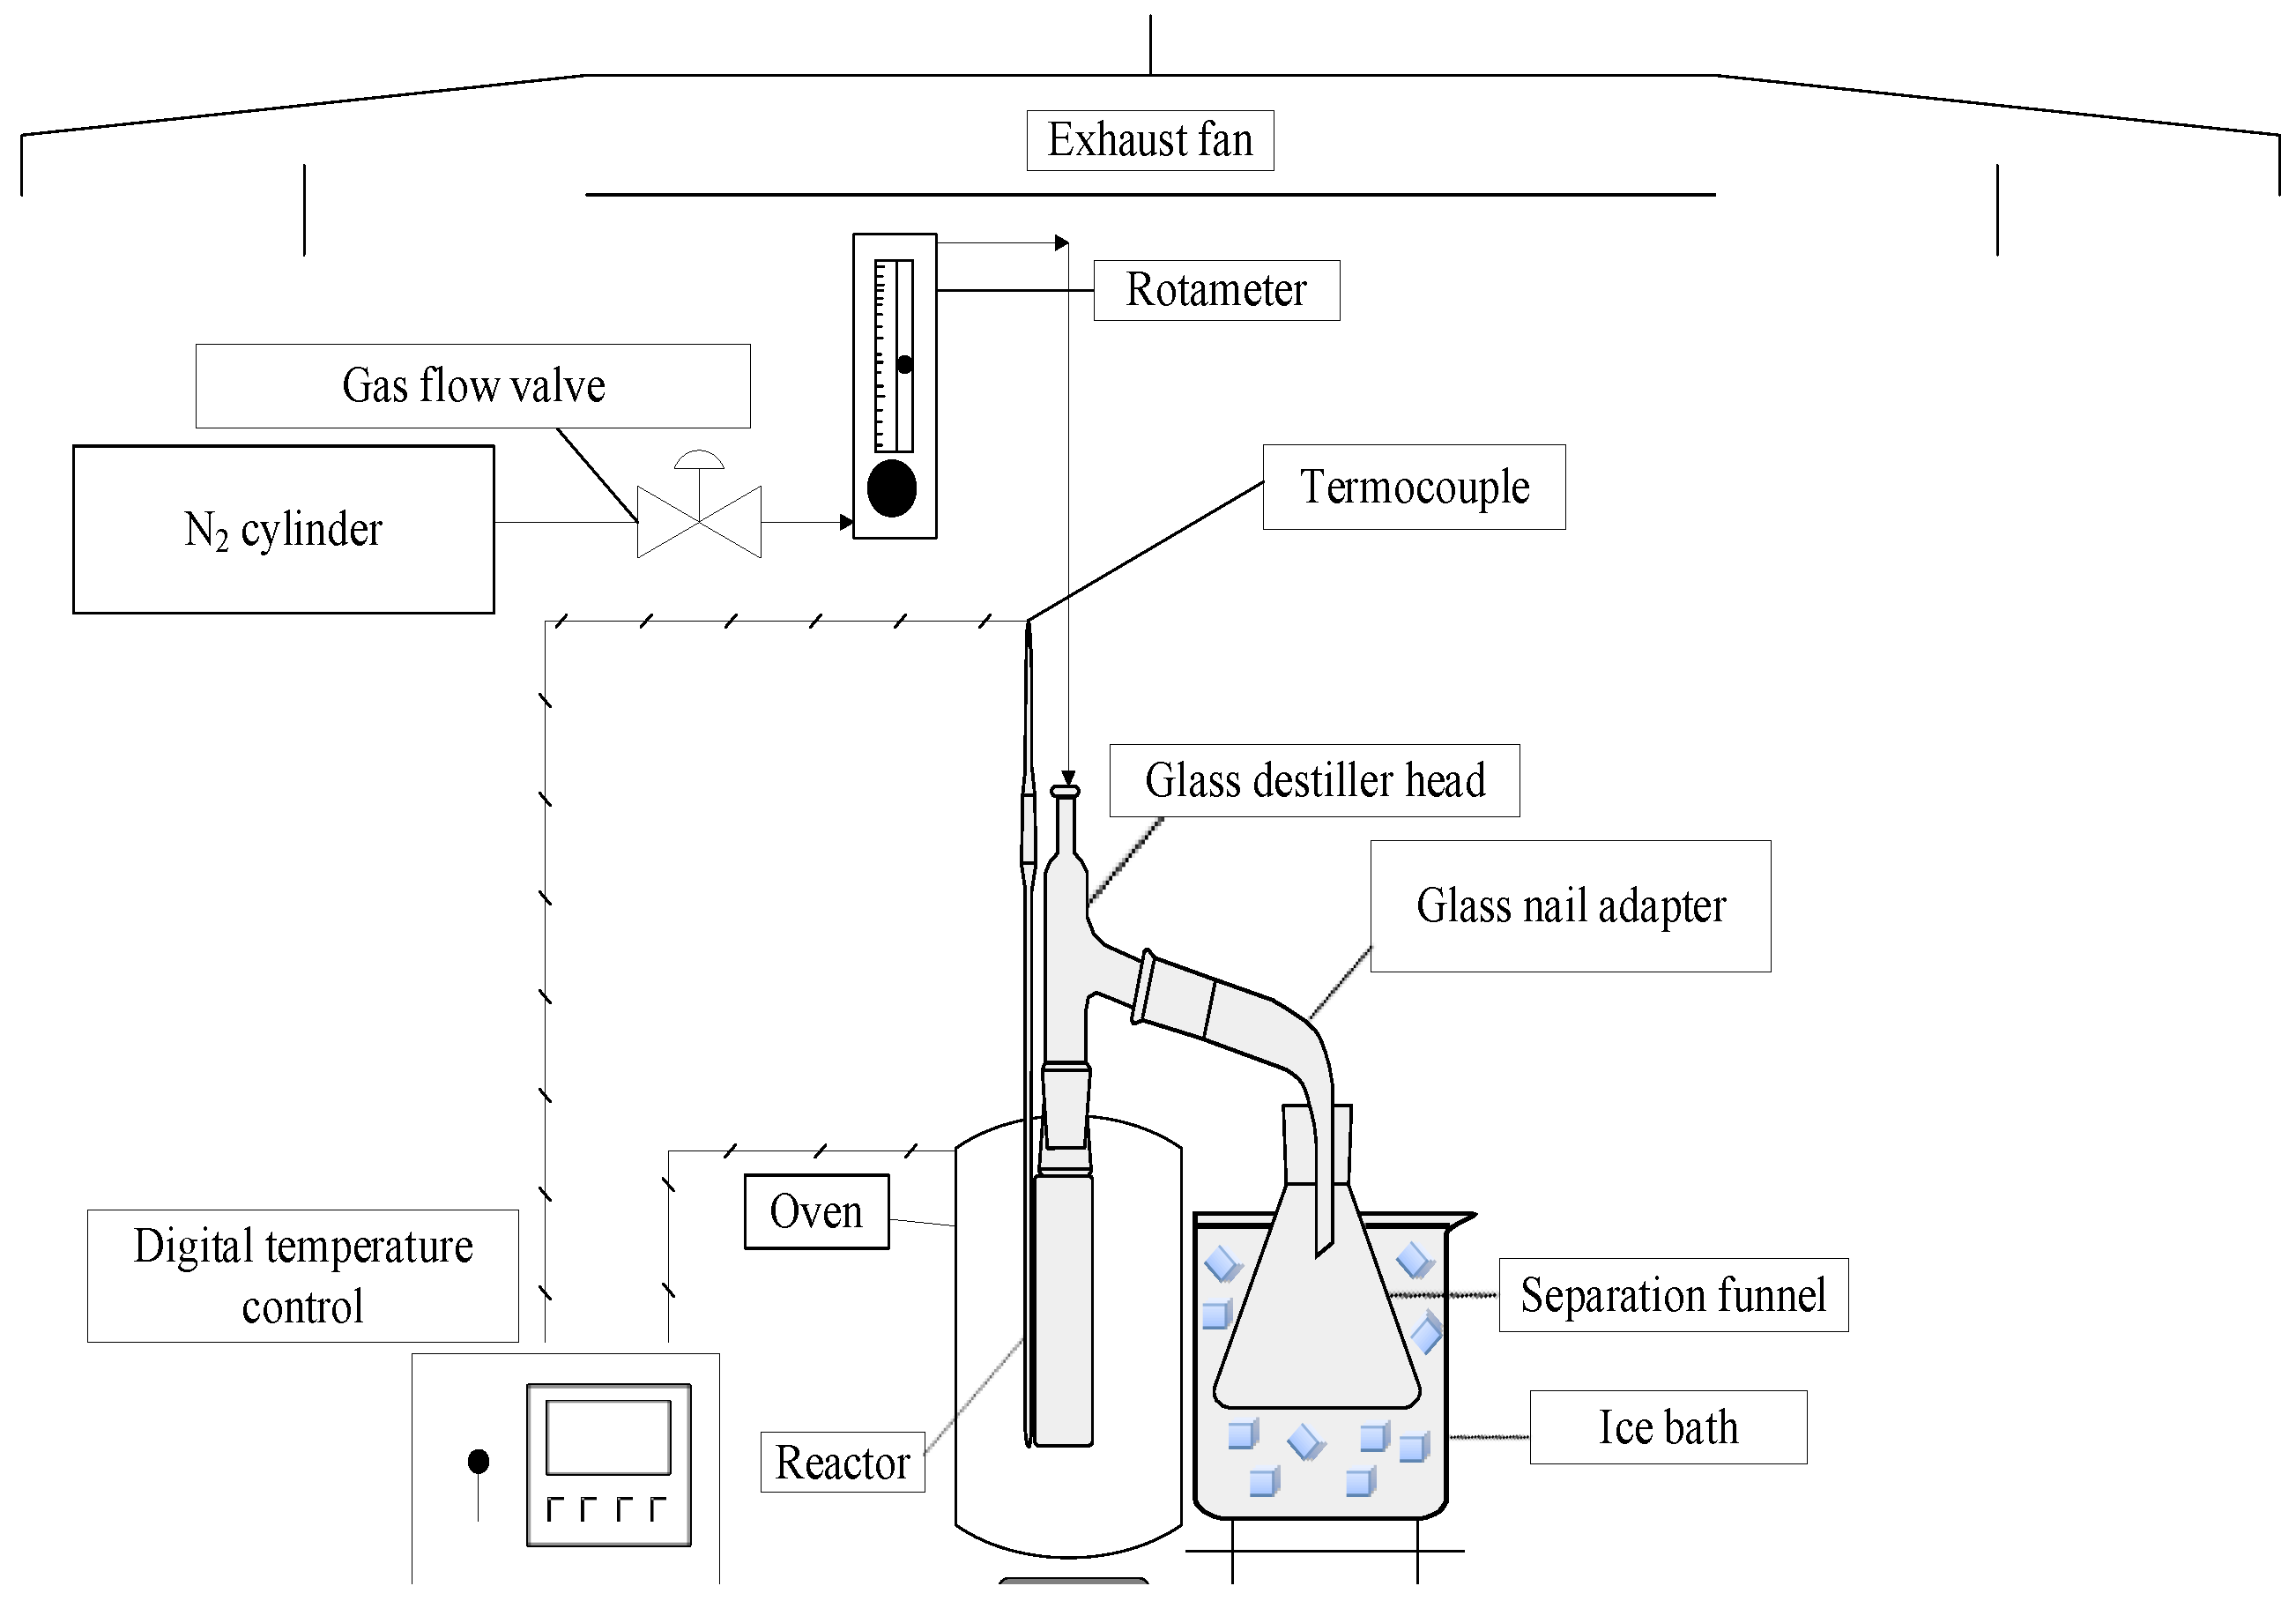
Figure 4.
Experimental apparatus (glass reactor in laboratory scale).
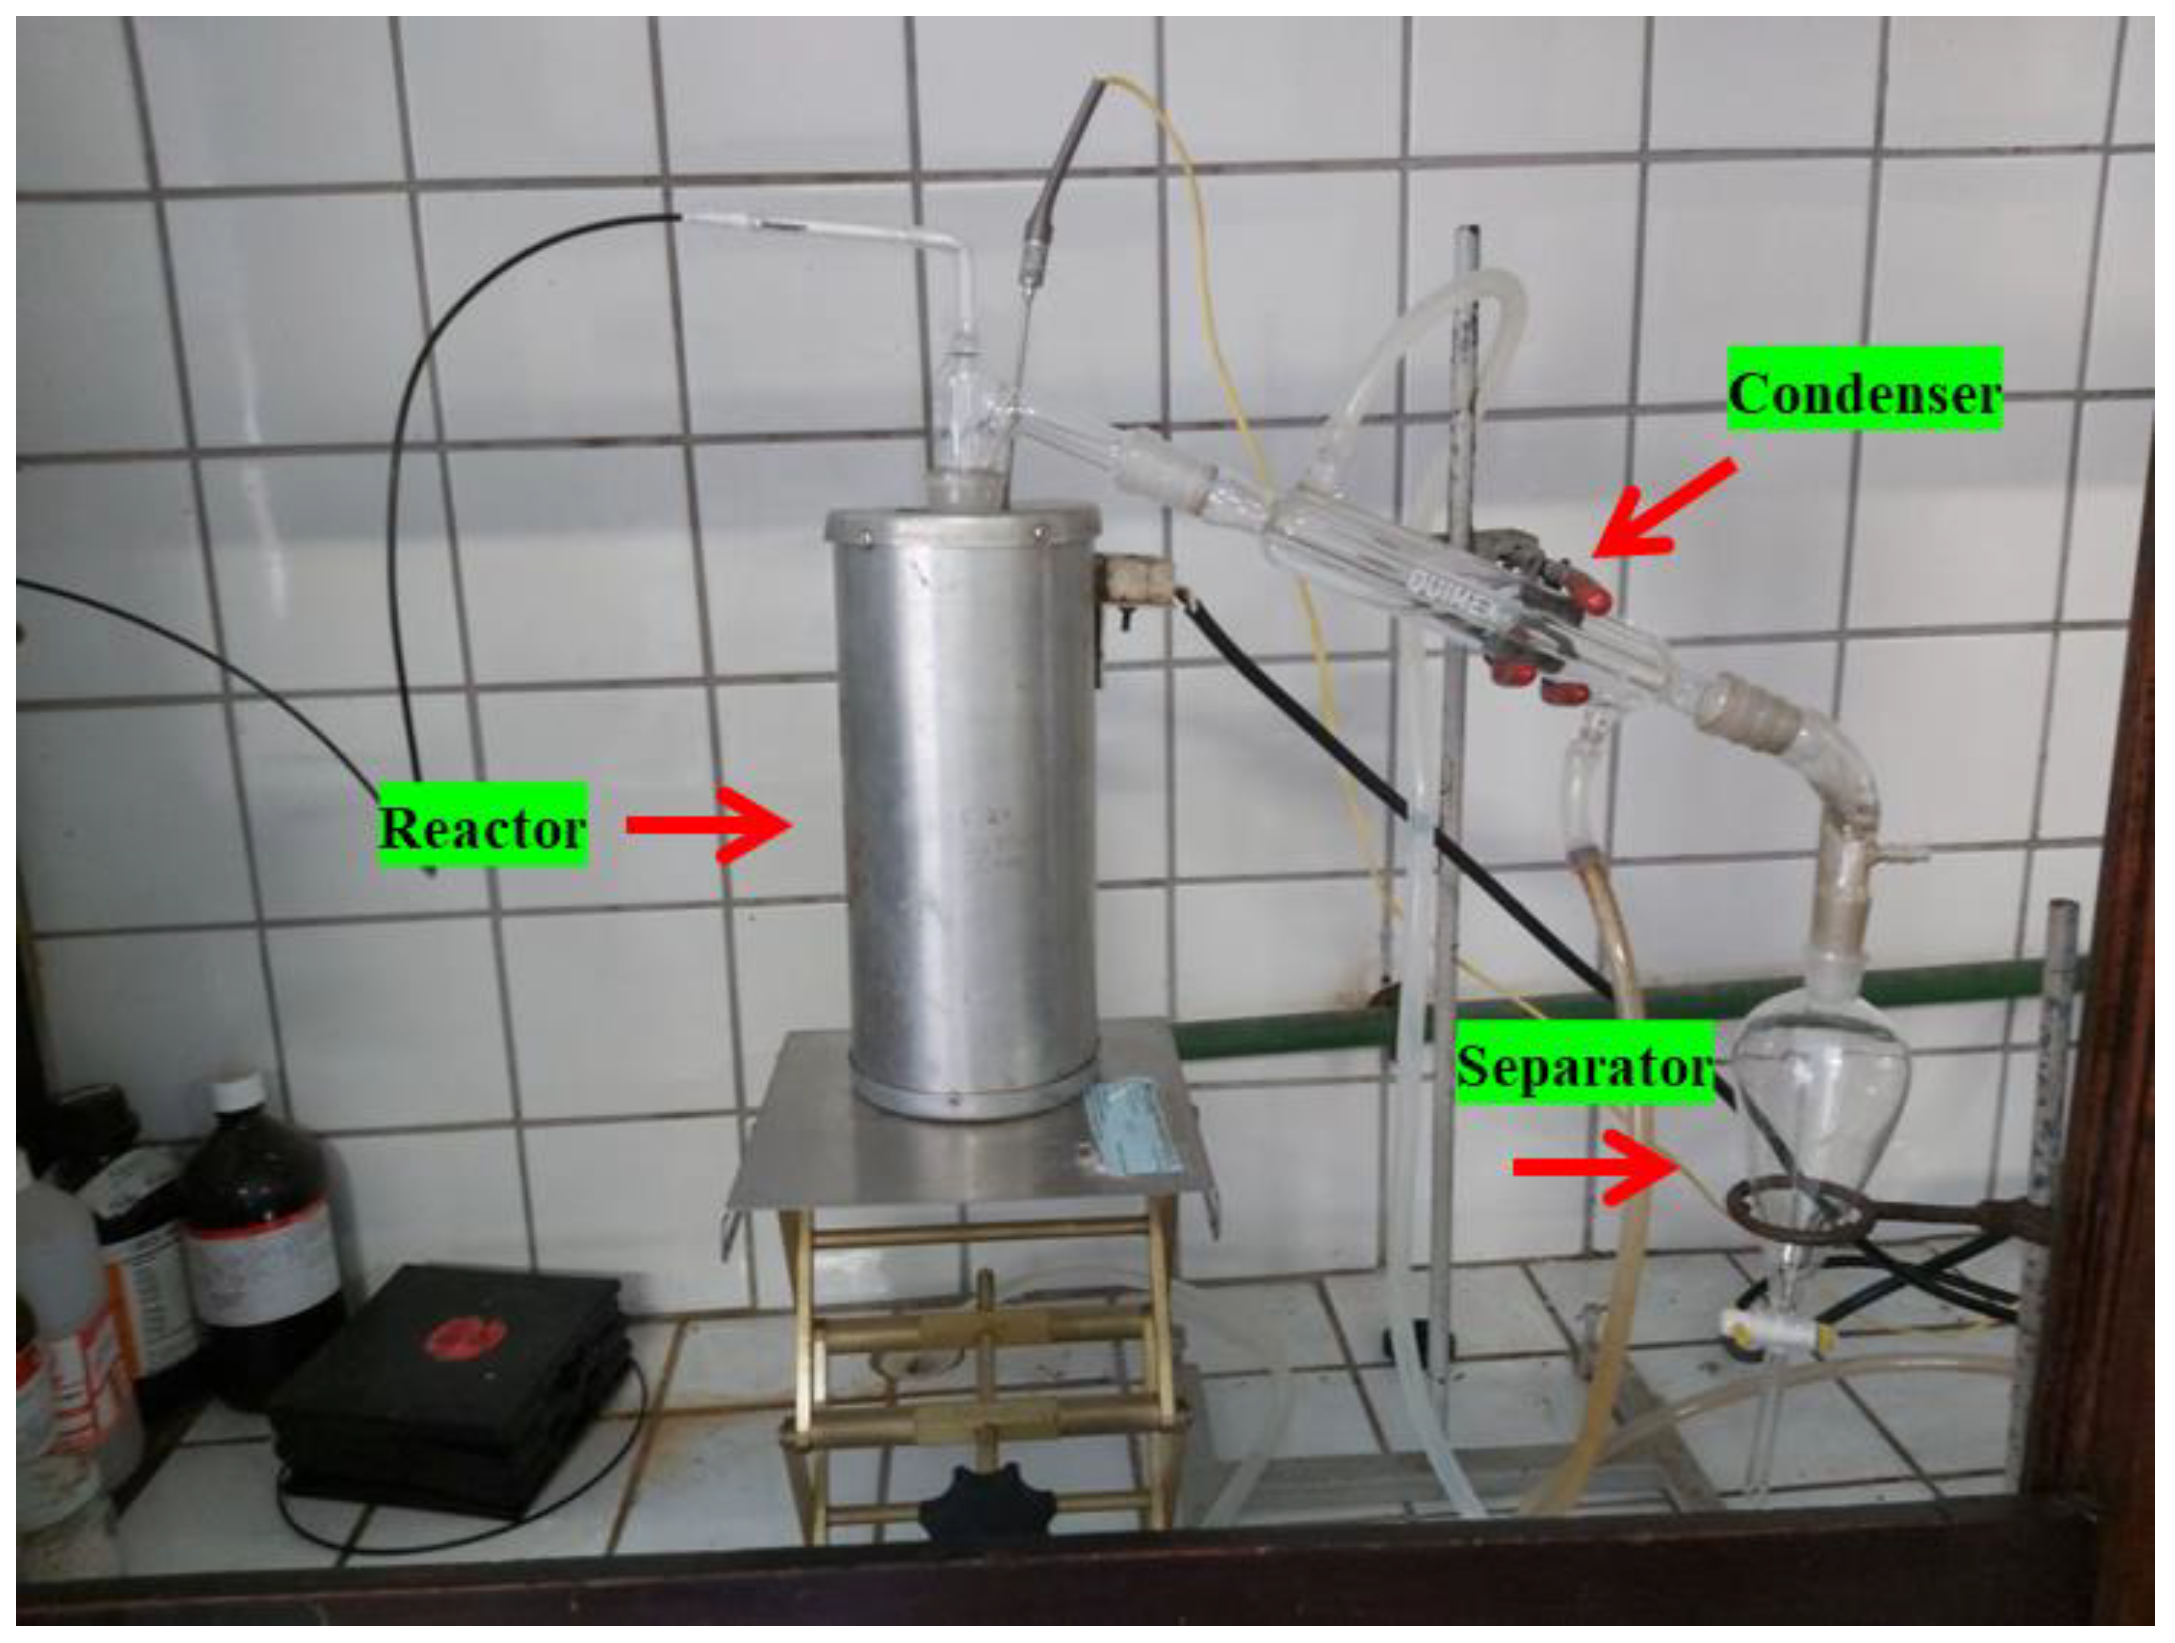
Figure 5.
SEM of biochar obtained by thermal pyrolysis of the fraction (organic matter + paper + plastic) of MSW at 400°C (a), 450°C (b) and 475°C (c), 1.0 atmosphere [MAG : 10.00 kx].
Figure 5.
SEM of biochar obtained by thermal pyrolysis of the fraction (organic matter + paper + plastic) of MSW at 400°C (a), 450°C (b) and 475°C (c), 1.0 atmosphere [MAG : 10.00 kx].
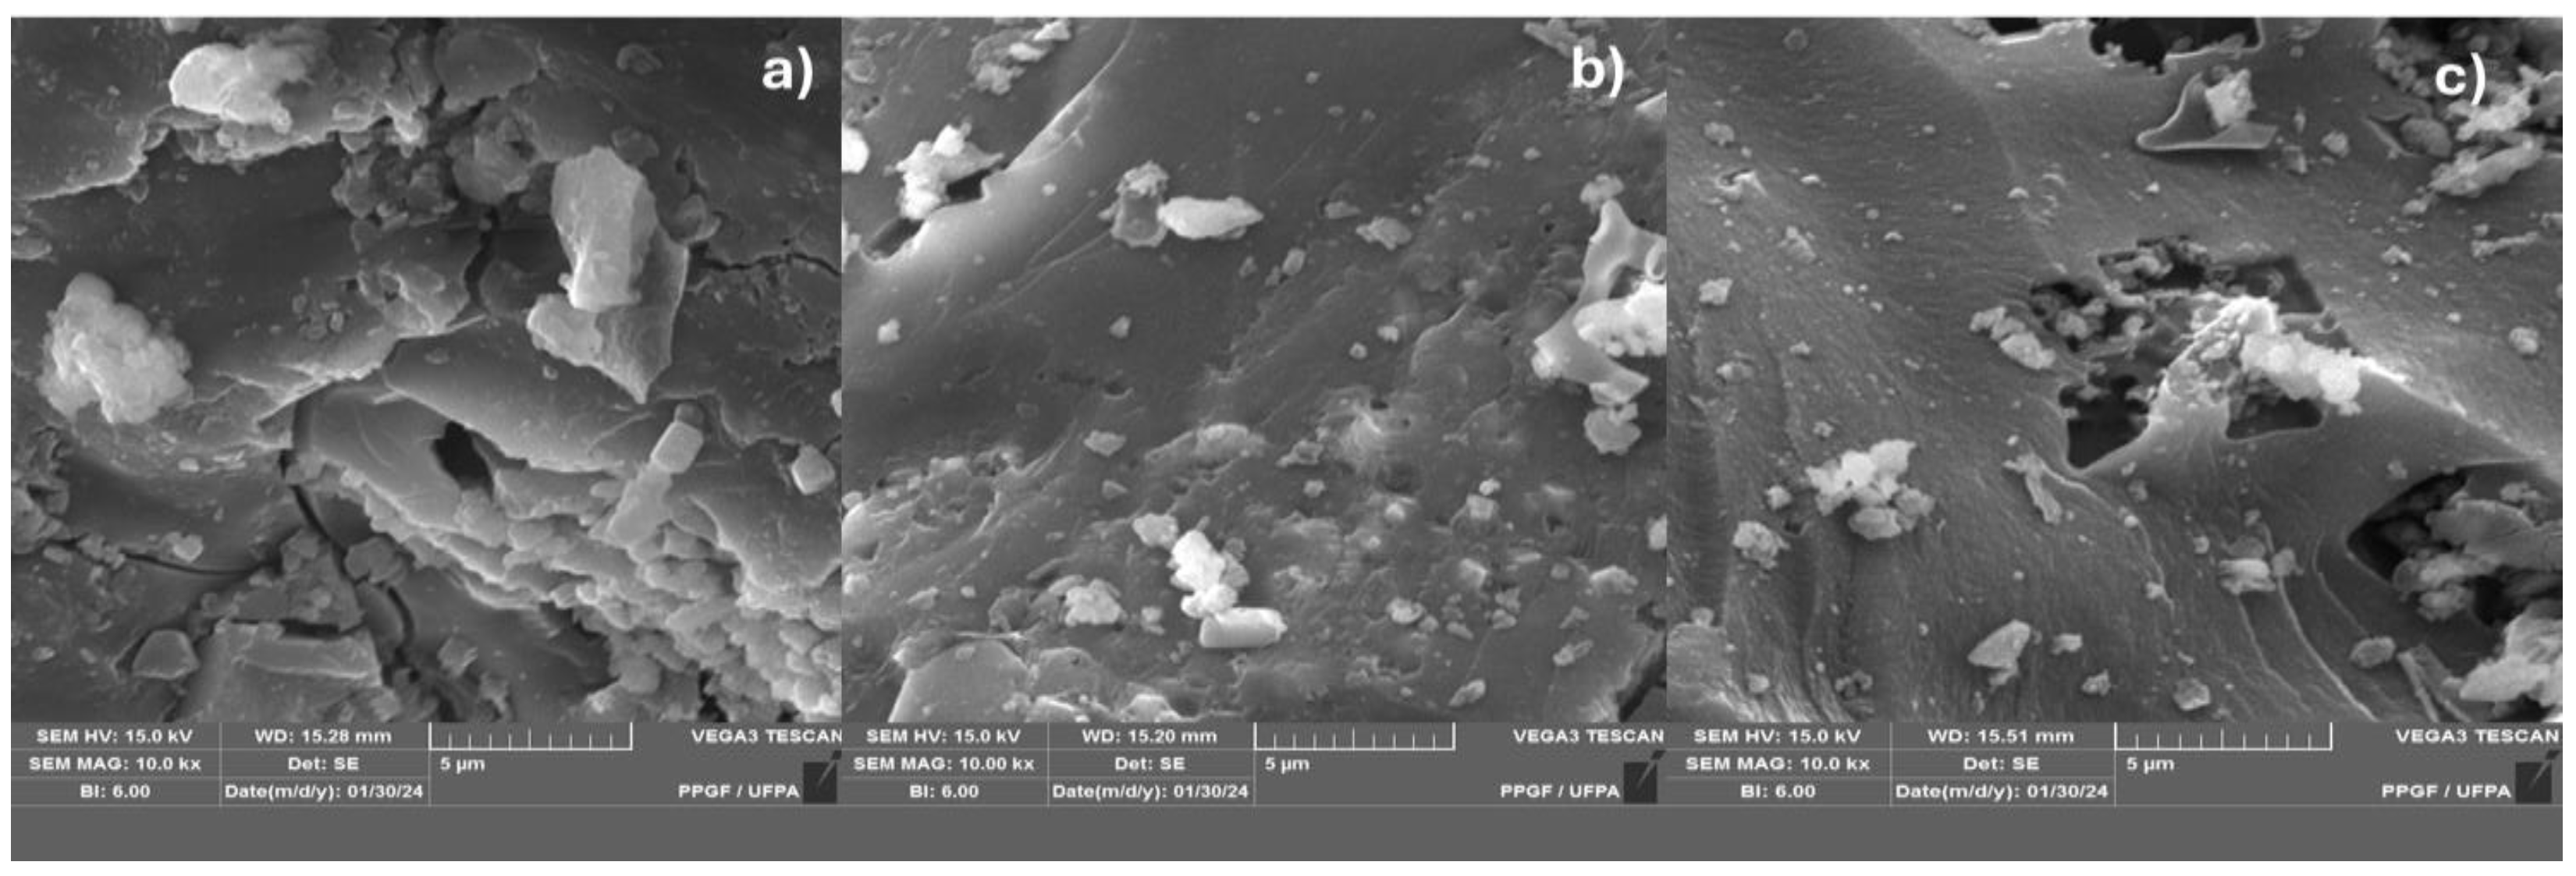
Figure 6.
SEM from biochar obtained by catalytic pyrolysis of the fraction (organic matter + paper + plastic) of MSW at 450°C 5.0% (wt.) FCC 1.0 atmosphere; with [MAG: 3.00 kx x (a); 6.0 kx (b); 10 kx (c)].
Figure 6.
SEM from biochar obtained by catalytic pyrolysis of the fraction (organic matter + paper + plastic) of MSW at 450°C 5.0% (wt.) FCC 1.0 atmosphere; with [MAG: 3.00 kx x (a); 6.0 kx (b); 10 kx (c)].
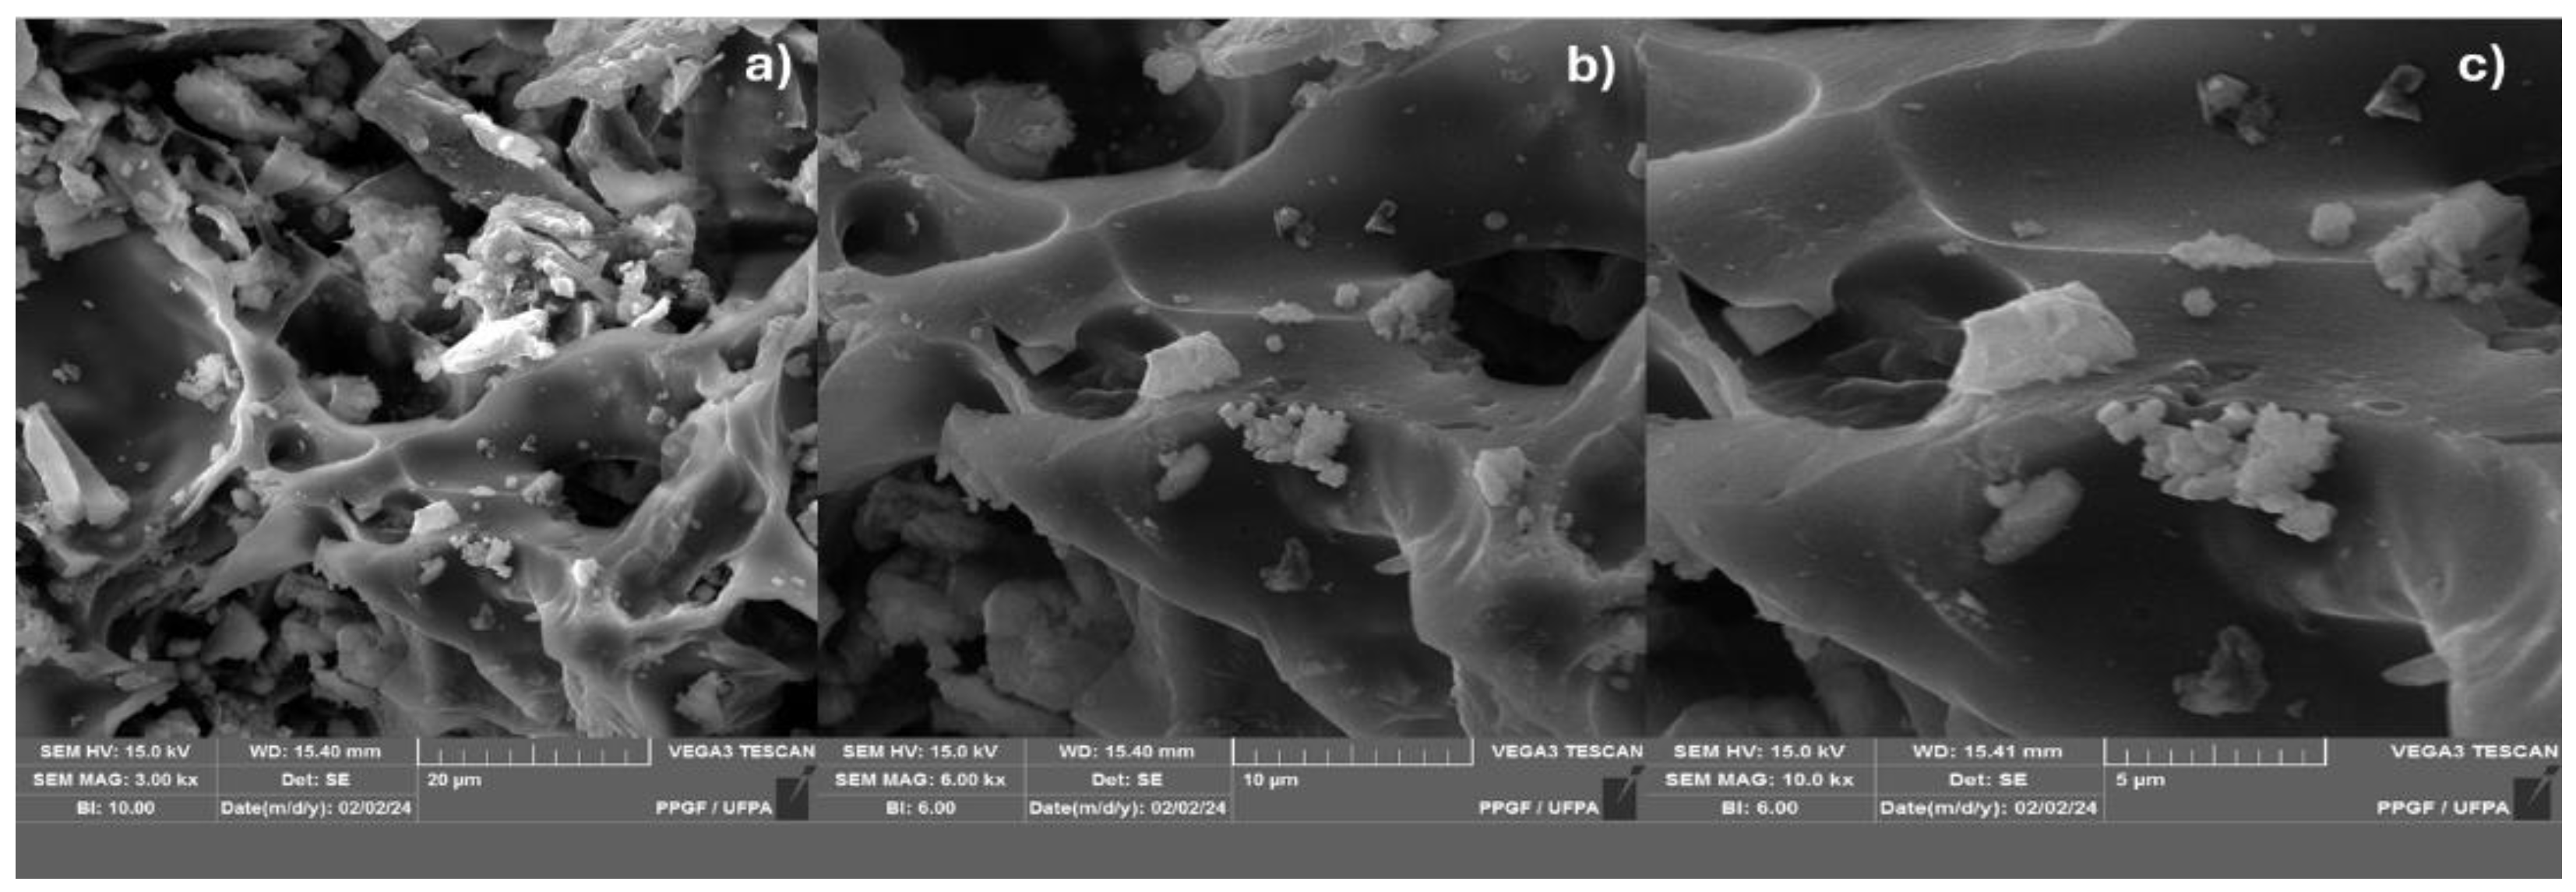
Figure 7.
SEM of biochar obtained by thermal pyrolysis of the fraction (organic matter + paper + plastic) of MSW at 450°C 10.0% (wt.) FCC 1.0 atmosphere; with [MAG: 3.00 kx x (a); 6.0 kx (b); 10 kx (c)].
Figure 7.
SEM of biochar obtained by thermal pyrolysis of the fraction (organic matter + paper + plastic) of MSW at 450°C 10.0% (wt.) FCC 1.0 atmosphere; with [MAG: 3.00 kx x (a); 6.0 kx (b); 10 kx (c)].
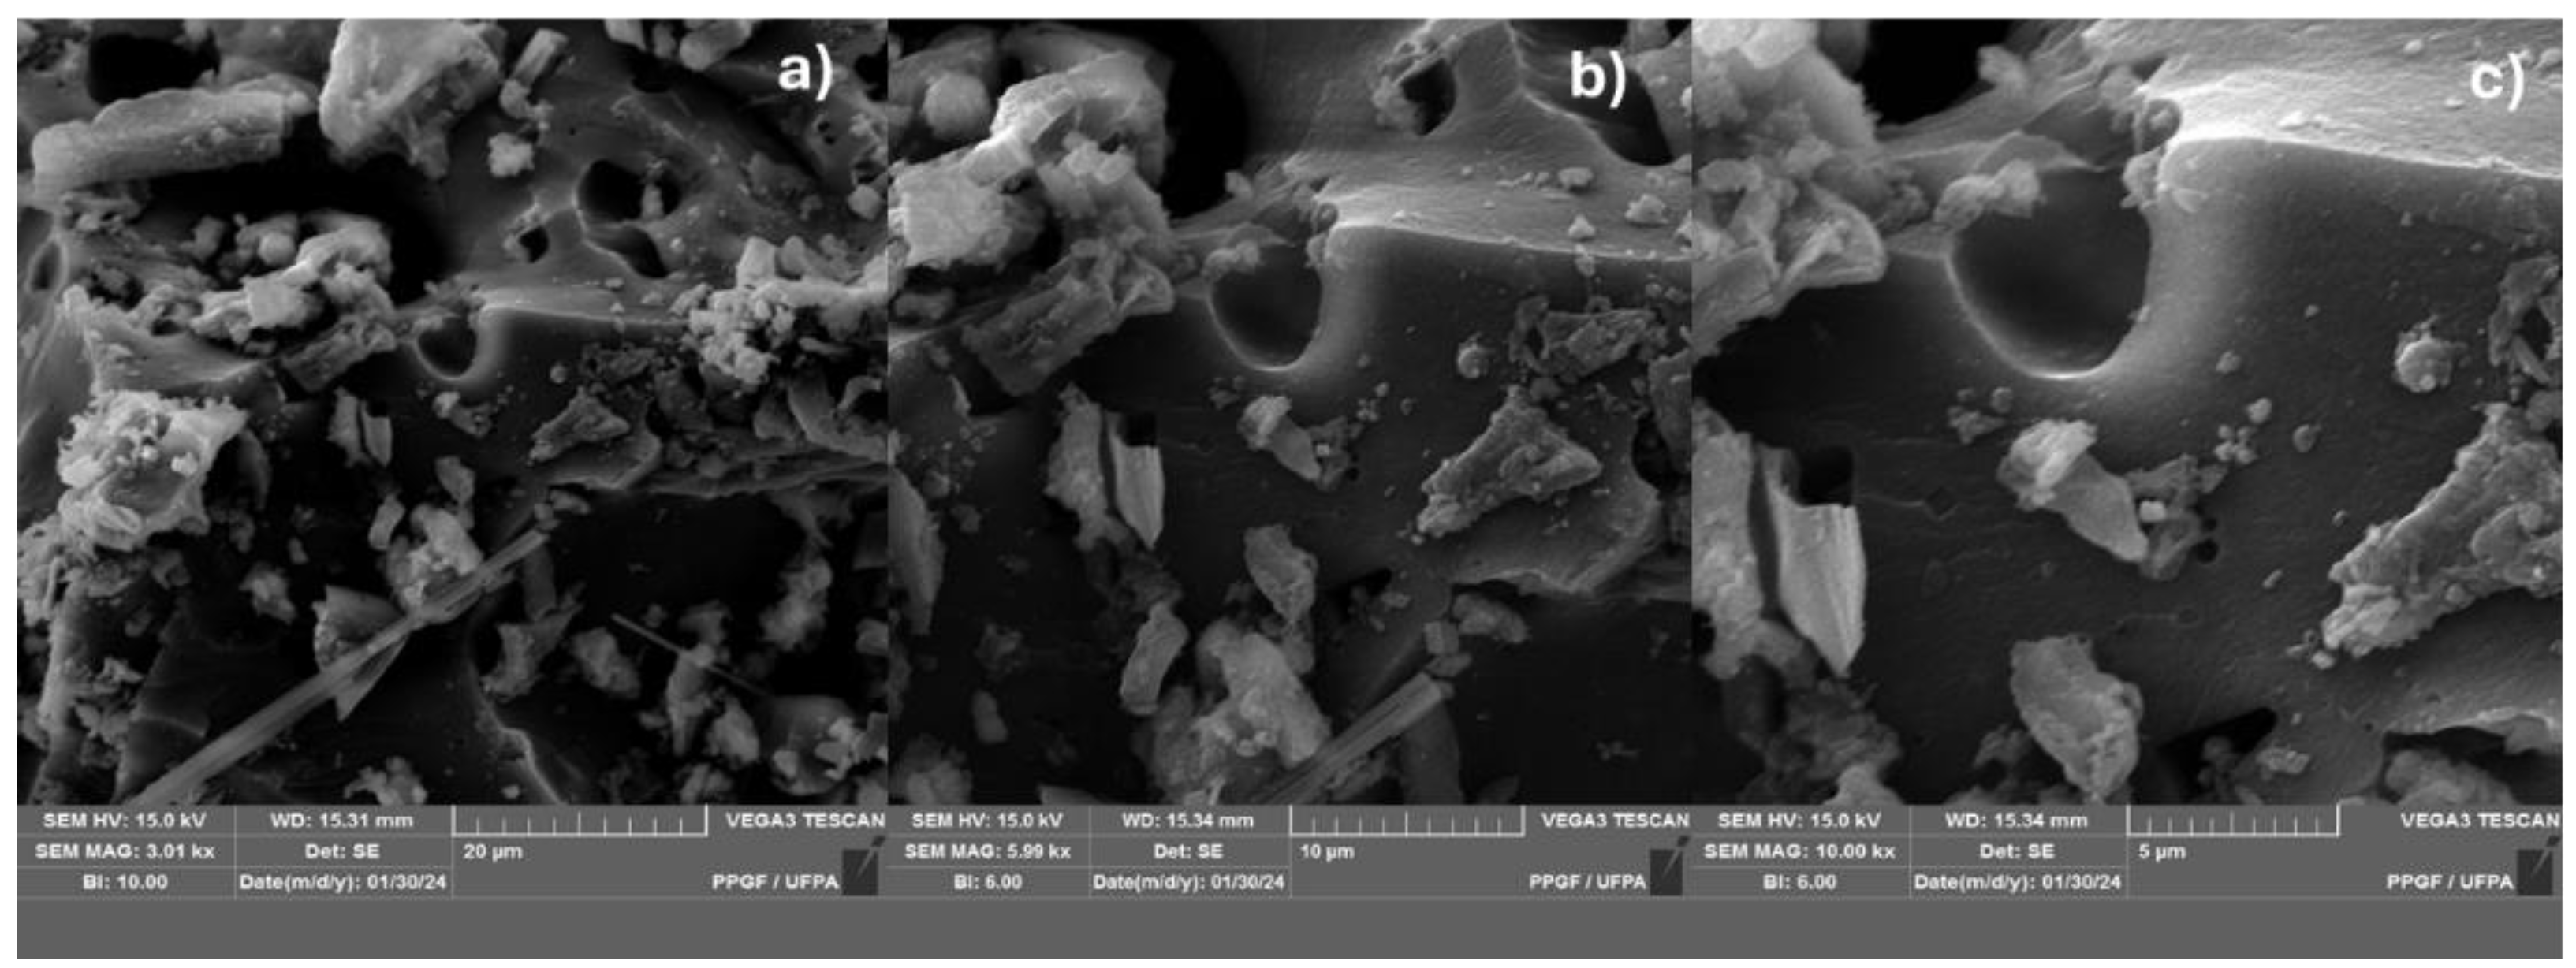
Figure 8.
MEV from biochar obtained by thermal pyrolysis of the fraction (organic matter + paper + plastic) of MSW at 450°C 15.0% (wt.) FCC 1.0 atmosphere; with [MAG: 3.00 kx x (a); 6.0 kx (b); 10 kx (c)].
Figure 8.
MEV from biochar obtained by thermal pyrolysis of the fraction (organic matter + paper + plastic) of MSW at 450°C 15.0% (wt.) FCC 1.0 atmosphere; with [MAG: 3.00 kx x (a); 6.0 kx (b); 10 kx (c)].
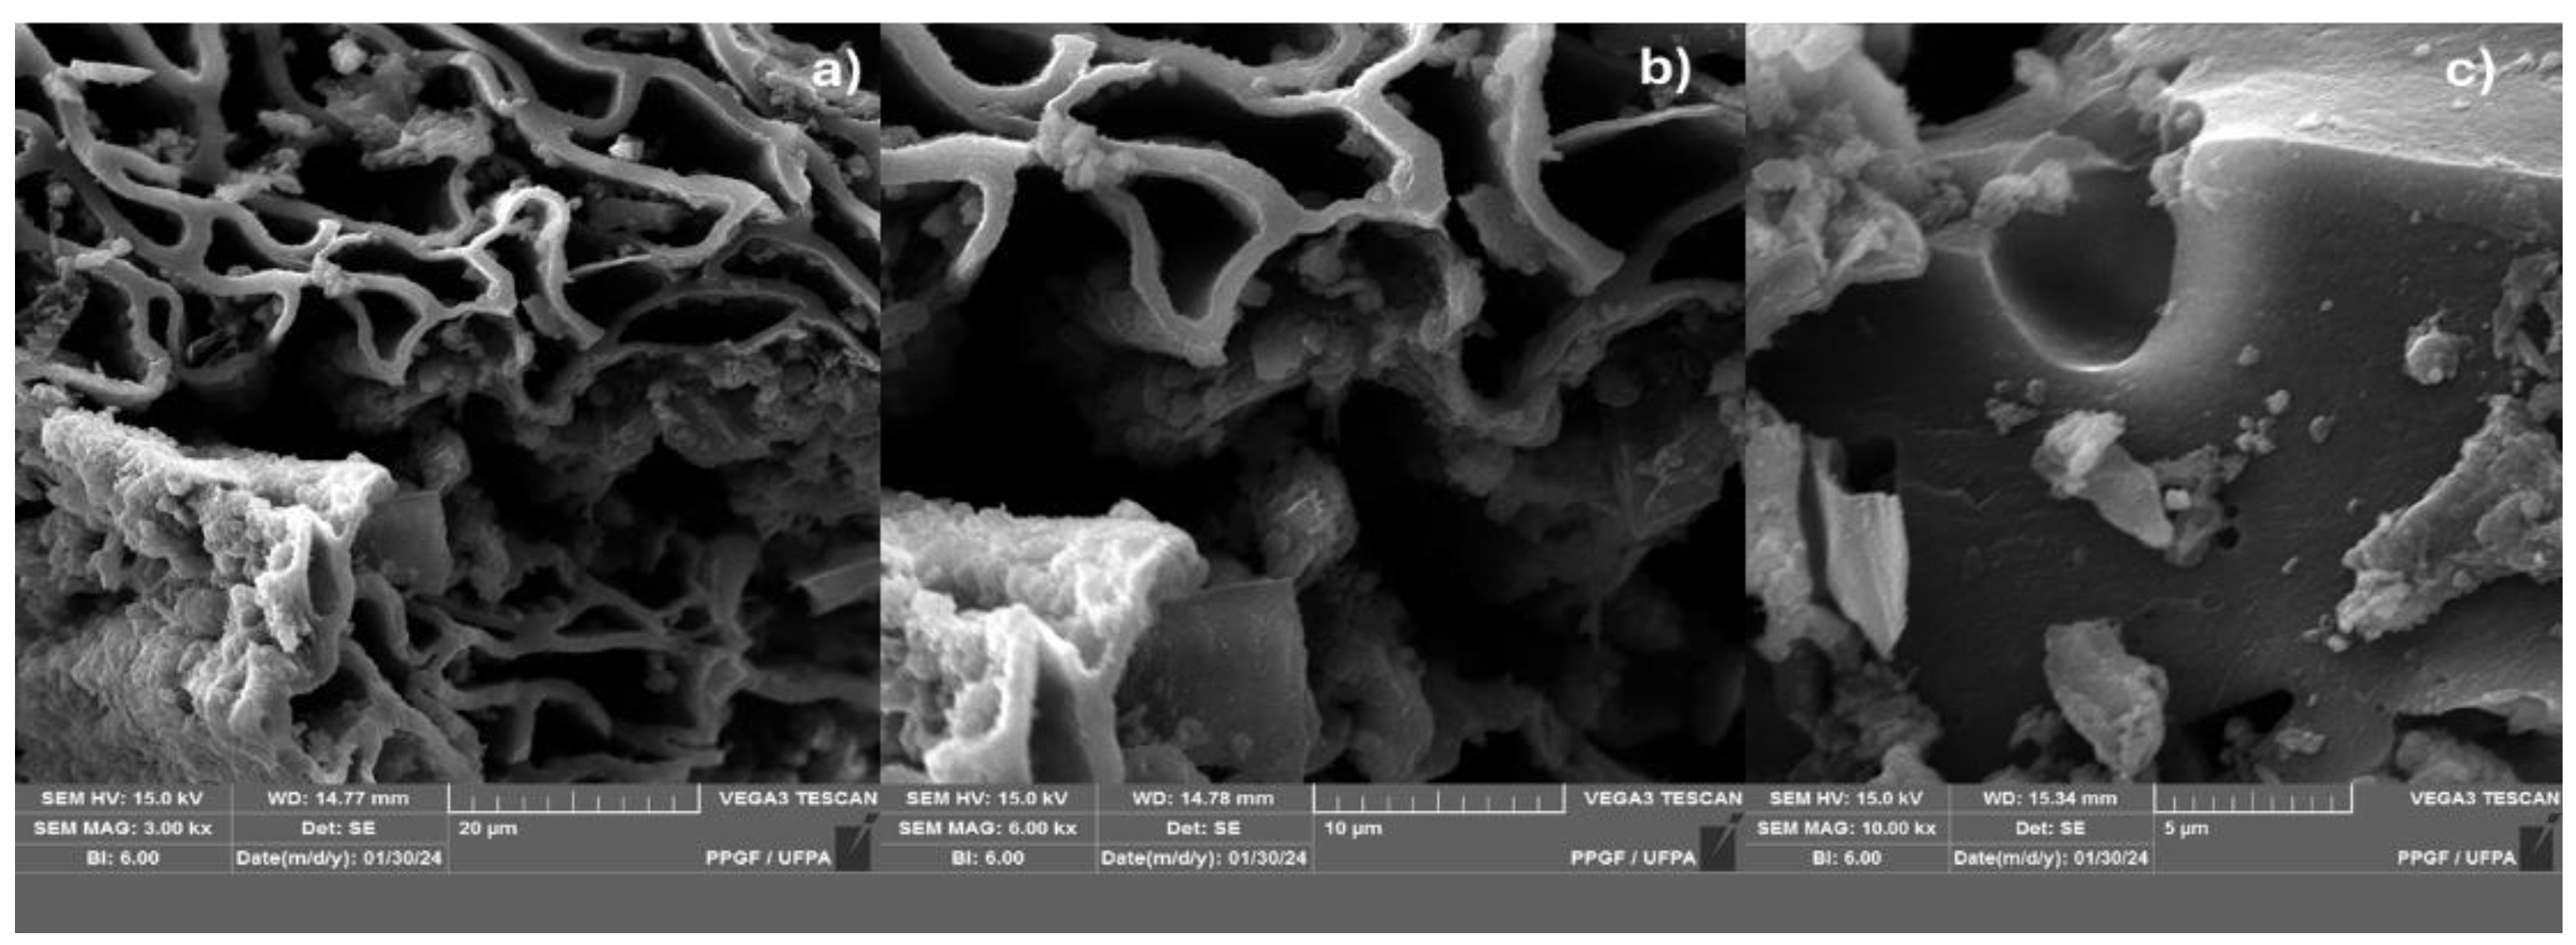
Figure 9.
XRD of solid phase products from the pyrolysis of the MSW fraction (organic matter + paper + plastic) at 400°C, 450°C, and 475°C and 1.0 atmosphere, using a 125 mL borosilicate glass reactor, on a laboratory scale.
Figure 9.
XRD of solid phase products from the pyrolysis of the MSW fraction (organic matter + paper + plastic) at 400°C, 450°C, and 475°C and 1.0 atmosphere, using a 125 mL borosilicate glass reactor, on a laboratory scale.
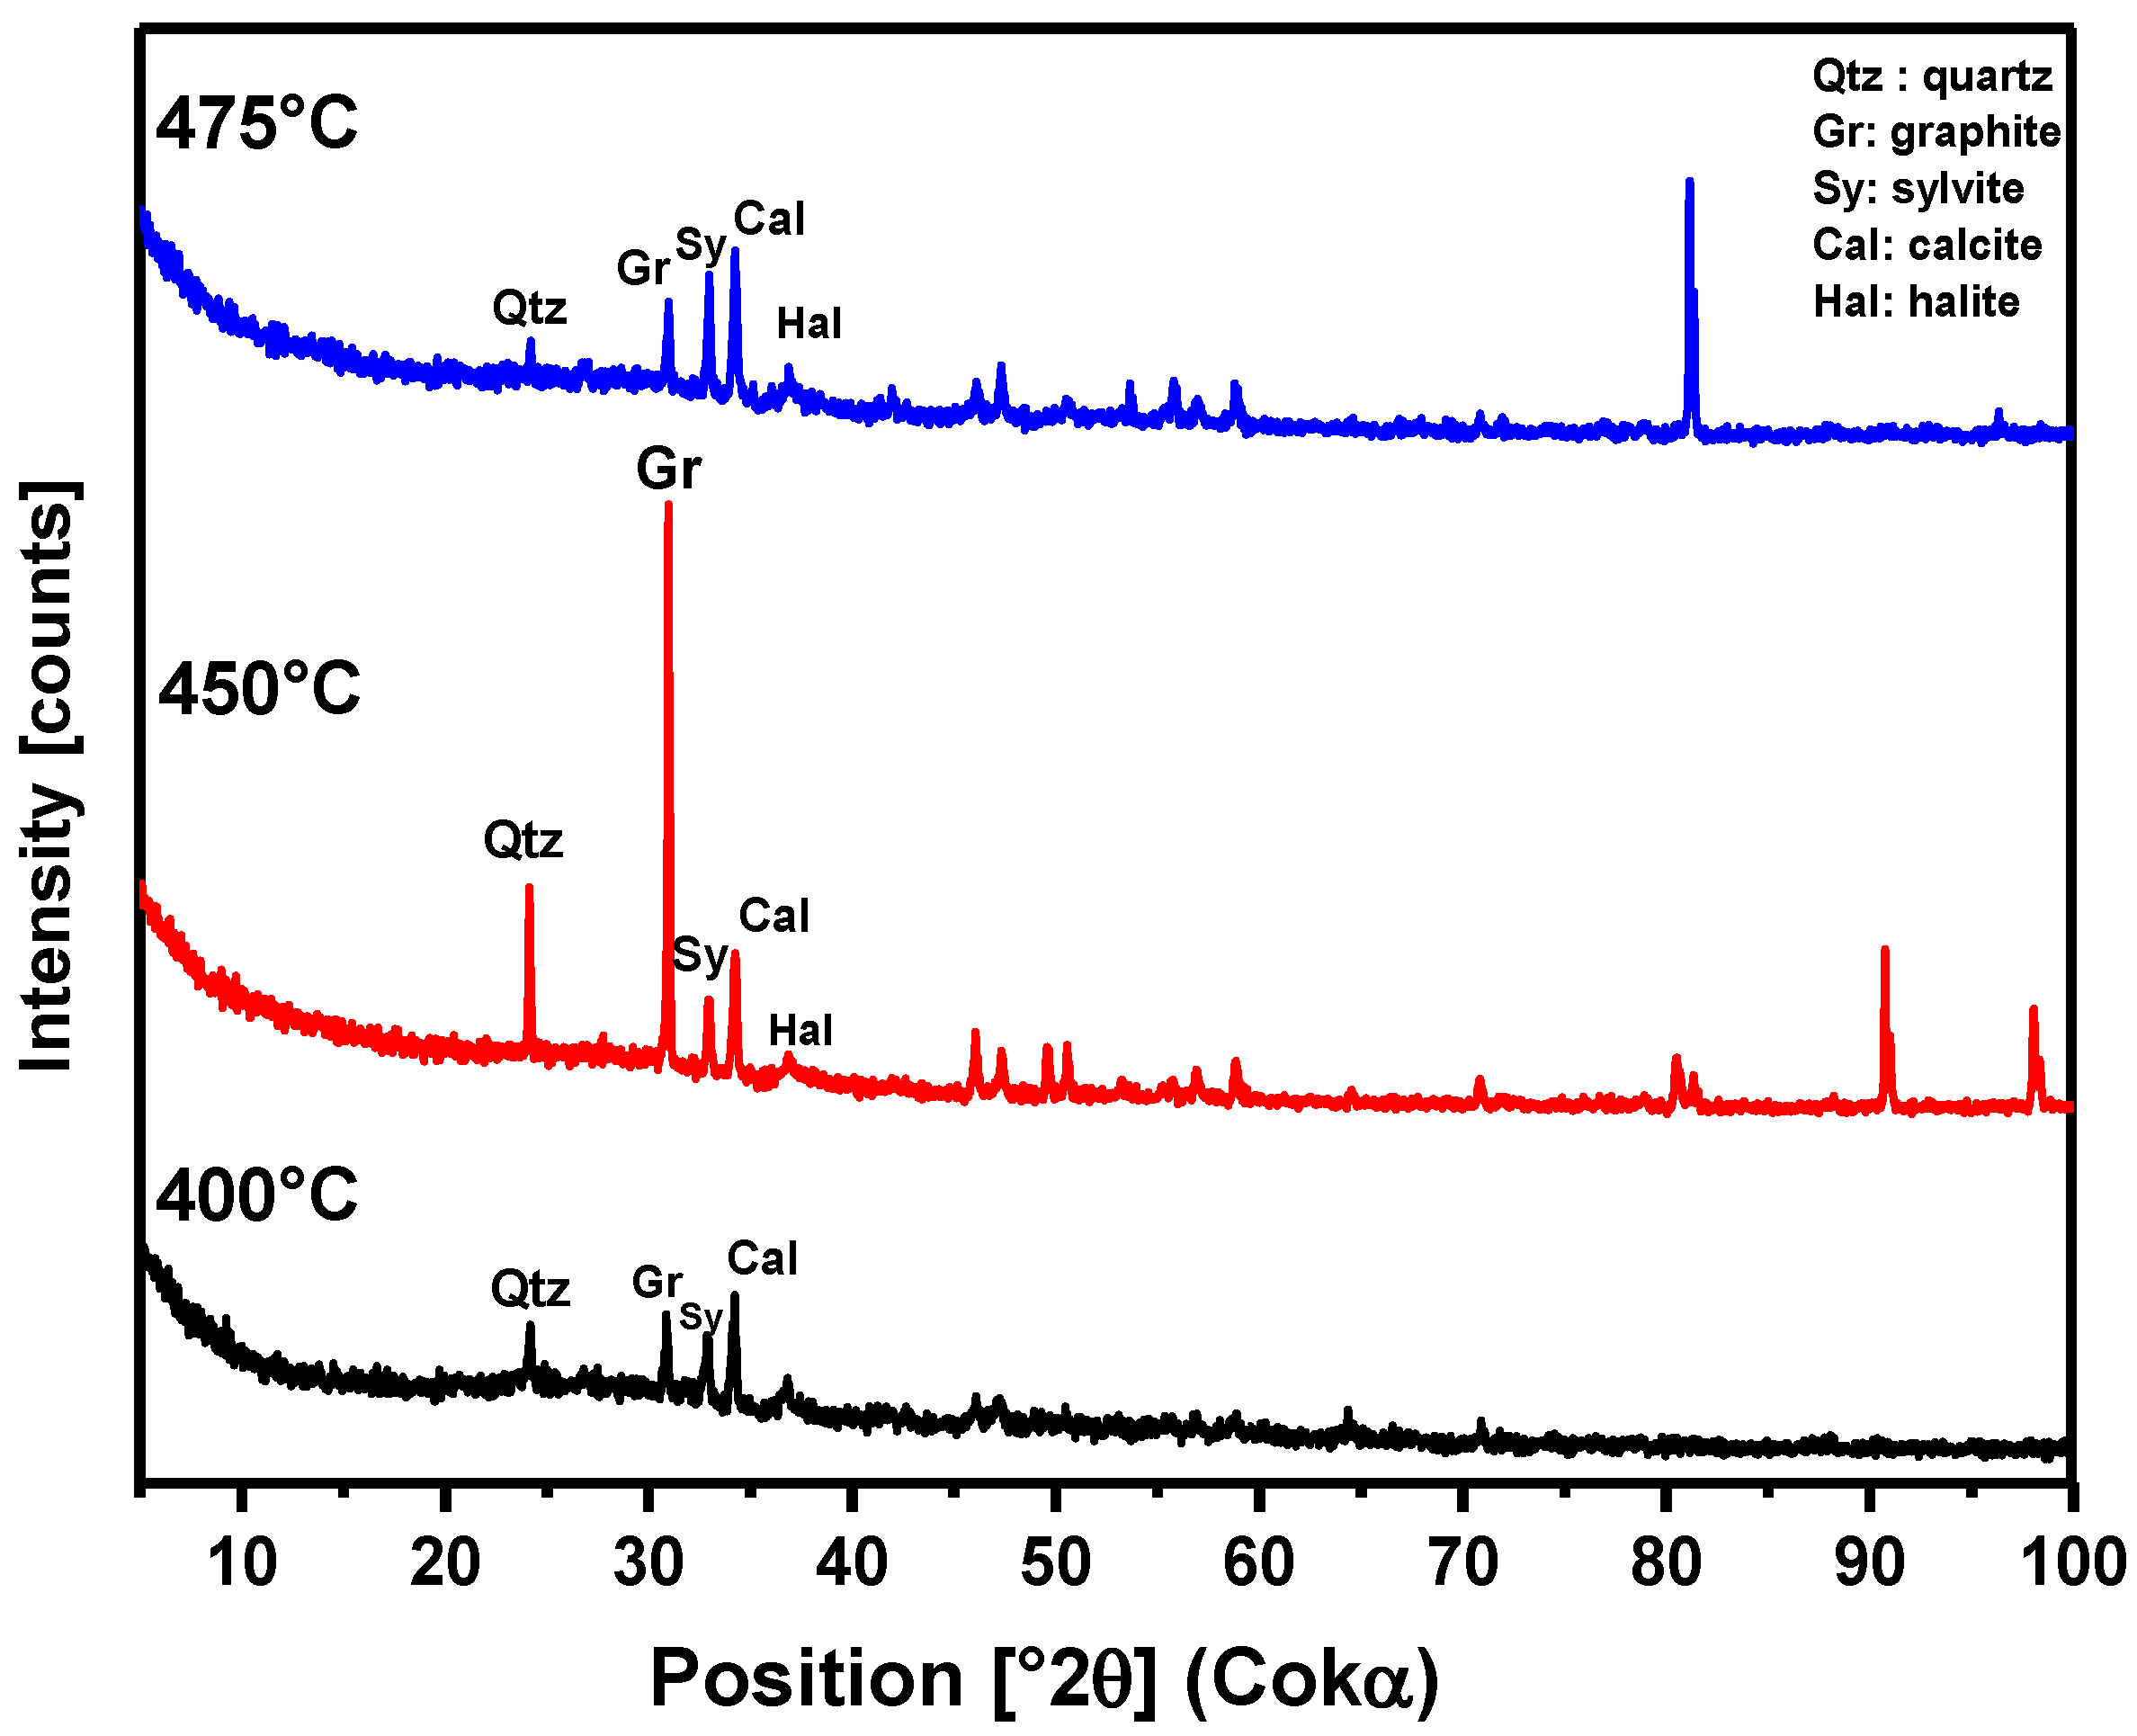
Figure 10.
XRD of solid phase products from the pyrolysis of the MSW fraction (organic matter + paper + plastic) at 450°C and 1.0 atmosphere, with 5%, 10%, and 15% (by mass) of FCC, using a 125 mL borosilicate glass reactor, on a laboratory scale.
Figure 10.
XRD of solid phase products from the pyrolysis of the MSW fraction (organic matter + paper + plastic) at 450°C and 1.0 atmosphere, with 5%, 10%, and 15% (by mass) of FCC, using a 125 mL borosilicate glass reactor, on a laboratory scale.
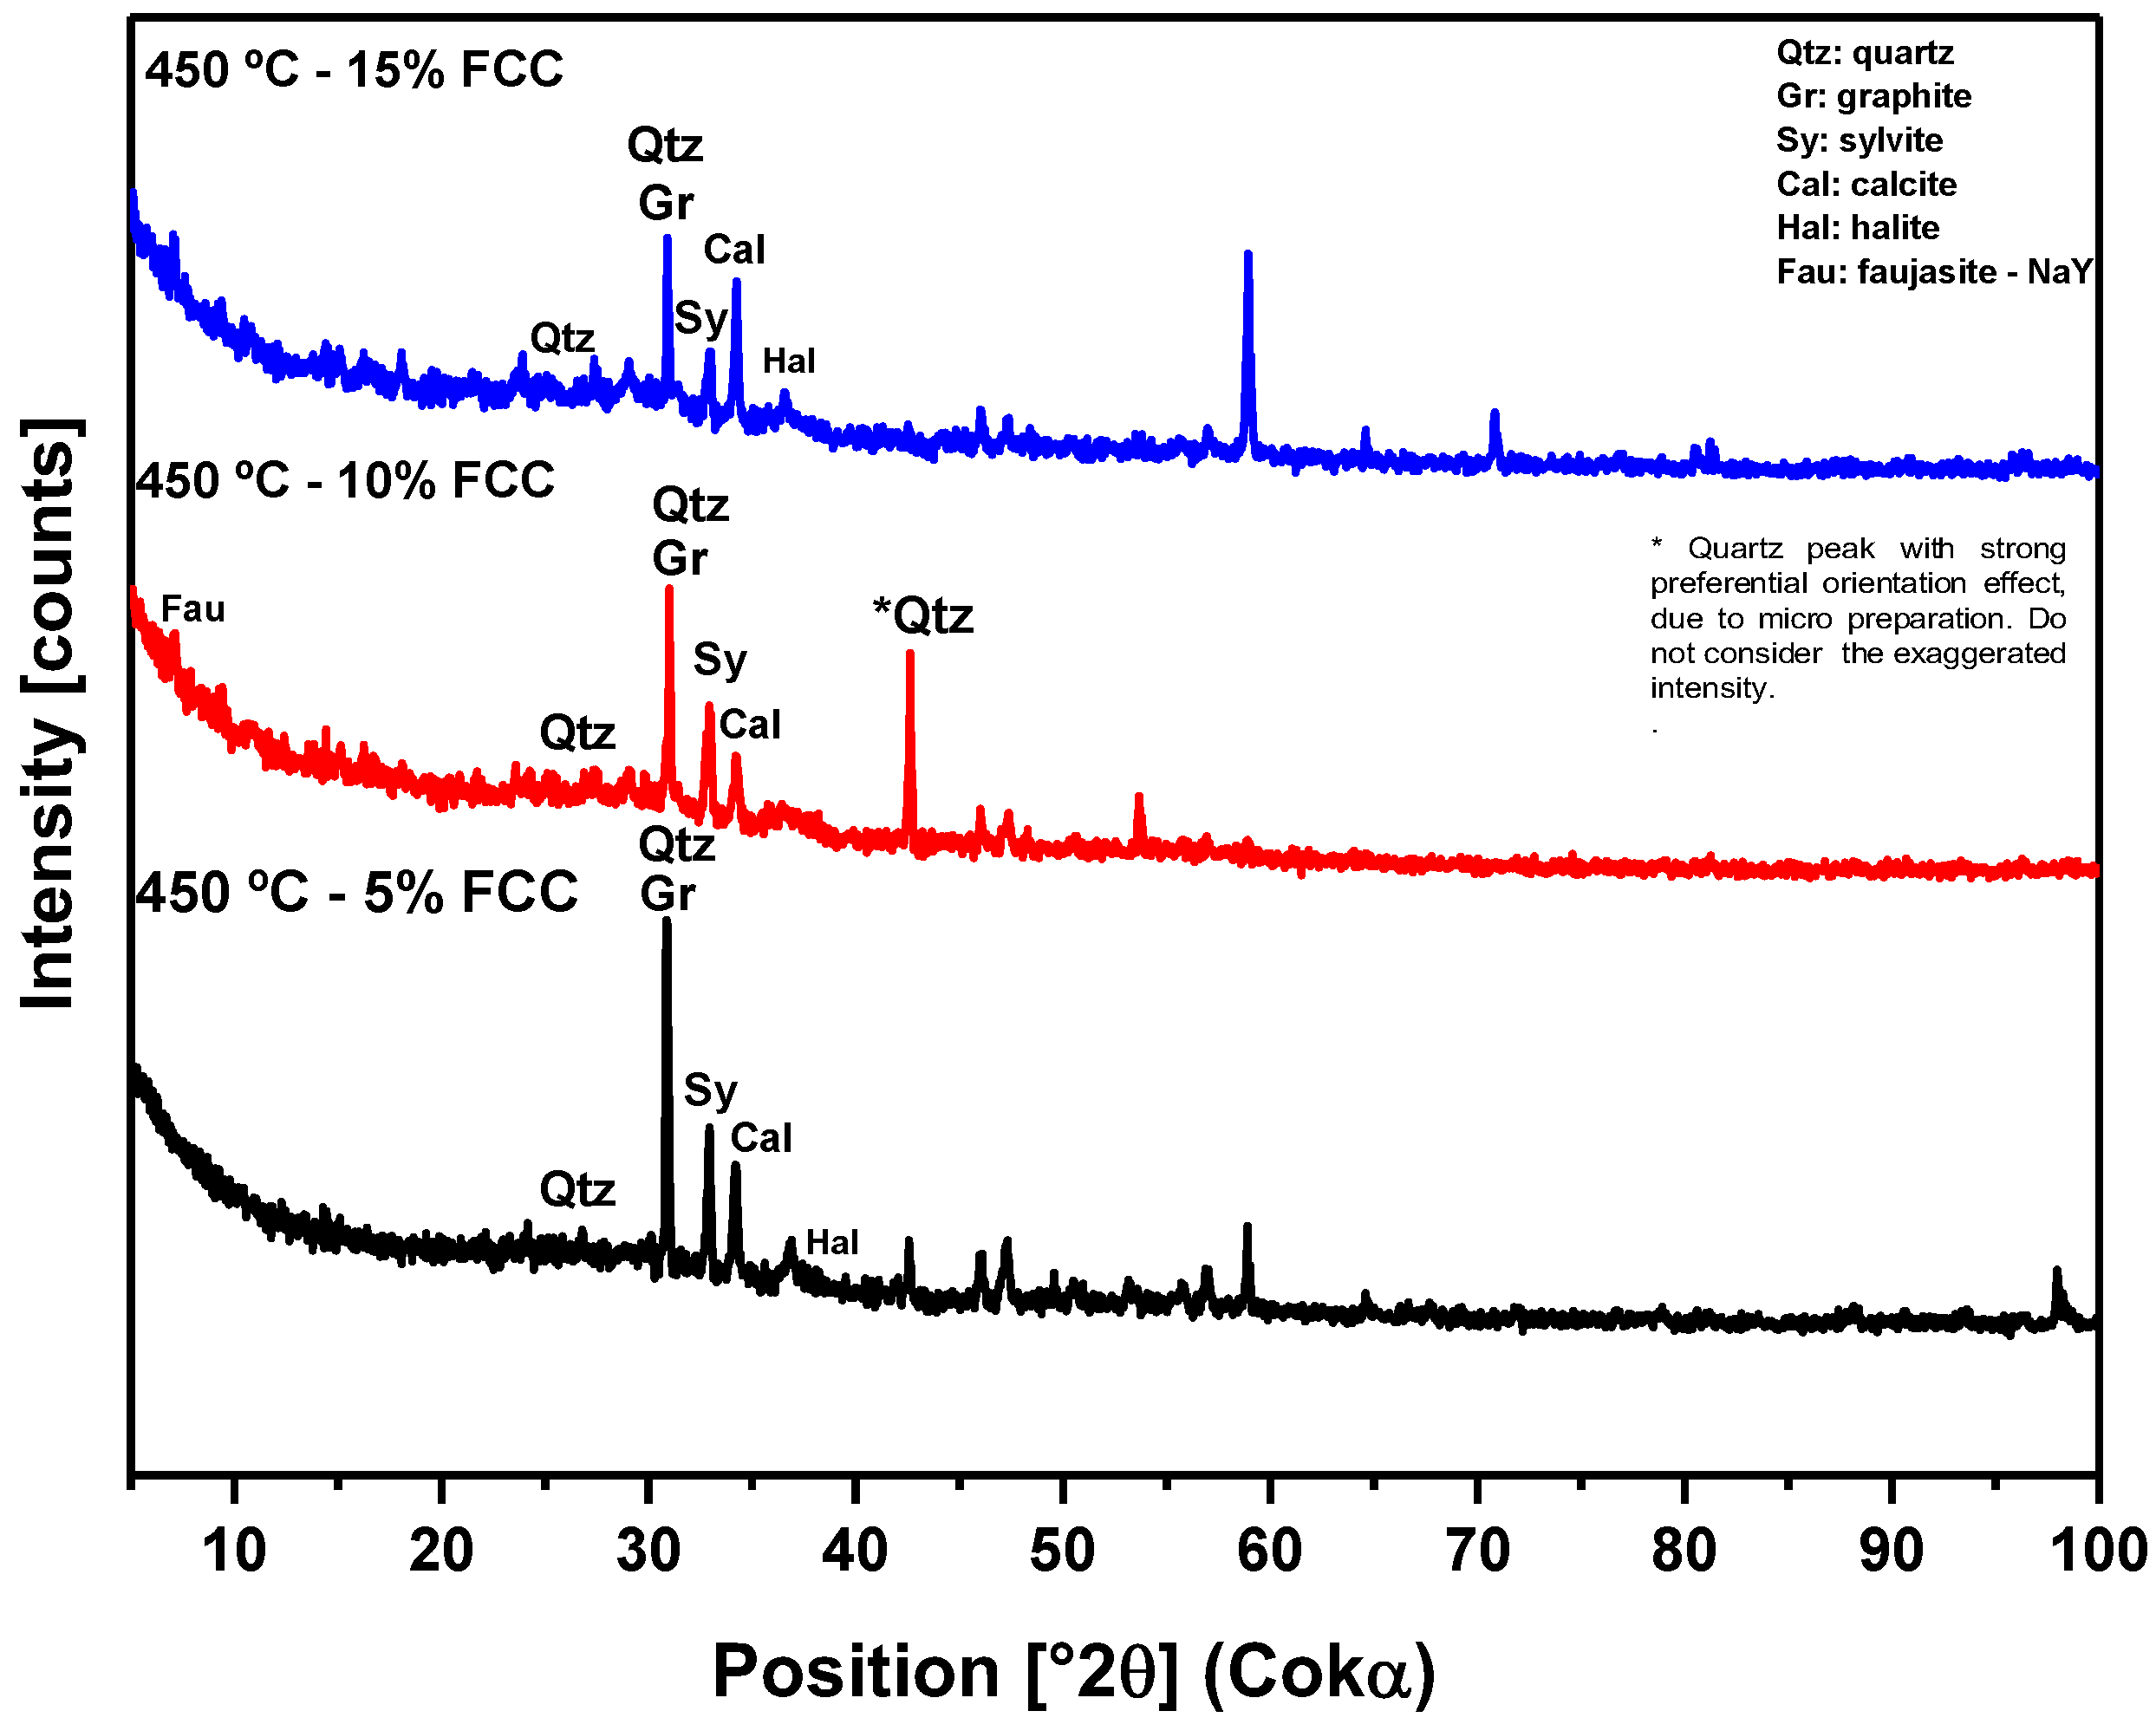
Figure 11.
Effect of pyrolysis temperature on the yields of reaction products (bio-oil, aqueous phase, bio-coal and gas) by pyrolysis of the MSW fraction (organic matter + paper + plastic) at 400, 450 and 475 °C, 1 ,0 atmosphere, on a laboratory scale.
Figure 11.
Effect of pyrolysis temperature on the yields of reaction products (bio-oil, aqueous phase, bio-coal and gas) by pyrolysis of the MSW fraction (organic matter + paper + plastic) at 400, 450 and 475 °C, 1 ,0 atmosphere, on a laboratory scale.
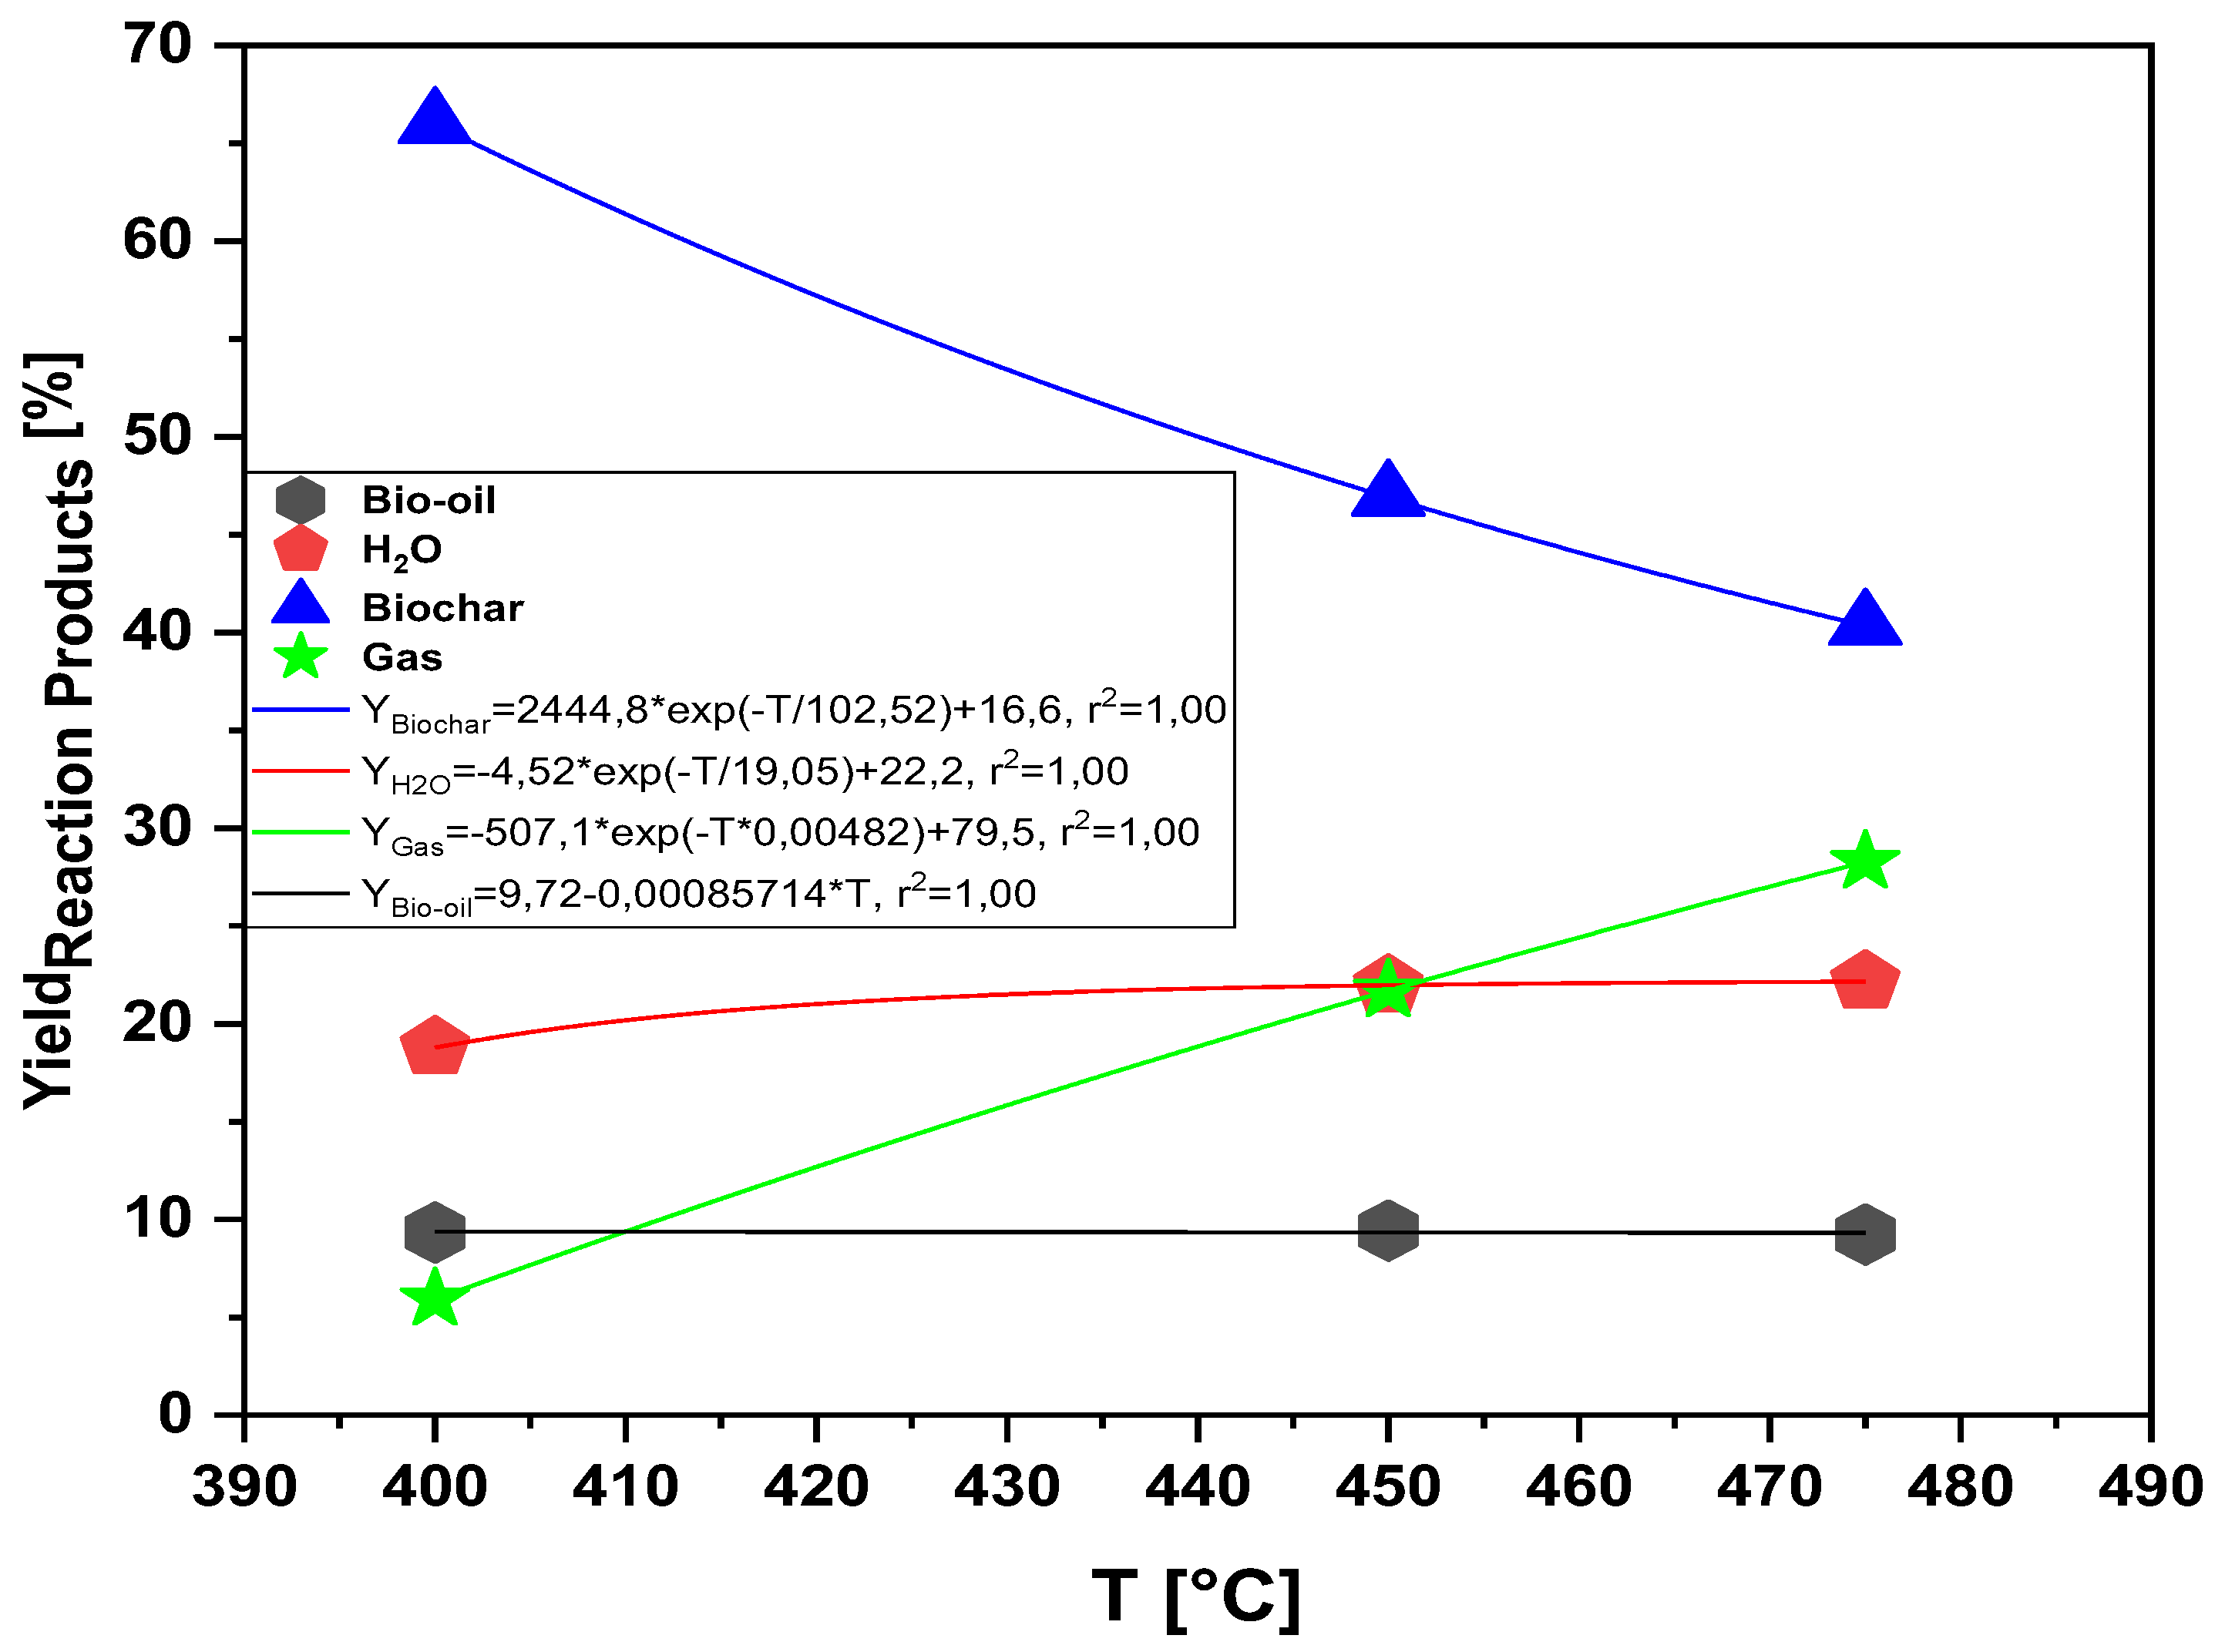
Figure 12.
Effect of FCC-to-MHSW ratio on the yield of bio-oil, biochar, aqueous, and gas phases by thermal catalytic cracking of MSW fraction (organic matter + paper +plastic) at 450 °C, 1.0 atm, 5.0, 10.0, and 15.0% (wt.) FCC, in laboratory scale.
Figure 12.
Effect of FCC-to-MHSW ratio on the yield of bio-oil, biochar, aqueous, and gas phases by thermal catalytic cracking of MSW fraction (organic matter + paper +plastic) at 450 °C, 1.0 atm, 5.0, 10.0, and 15.0% (wt.) FCC, in laboratory scale.
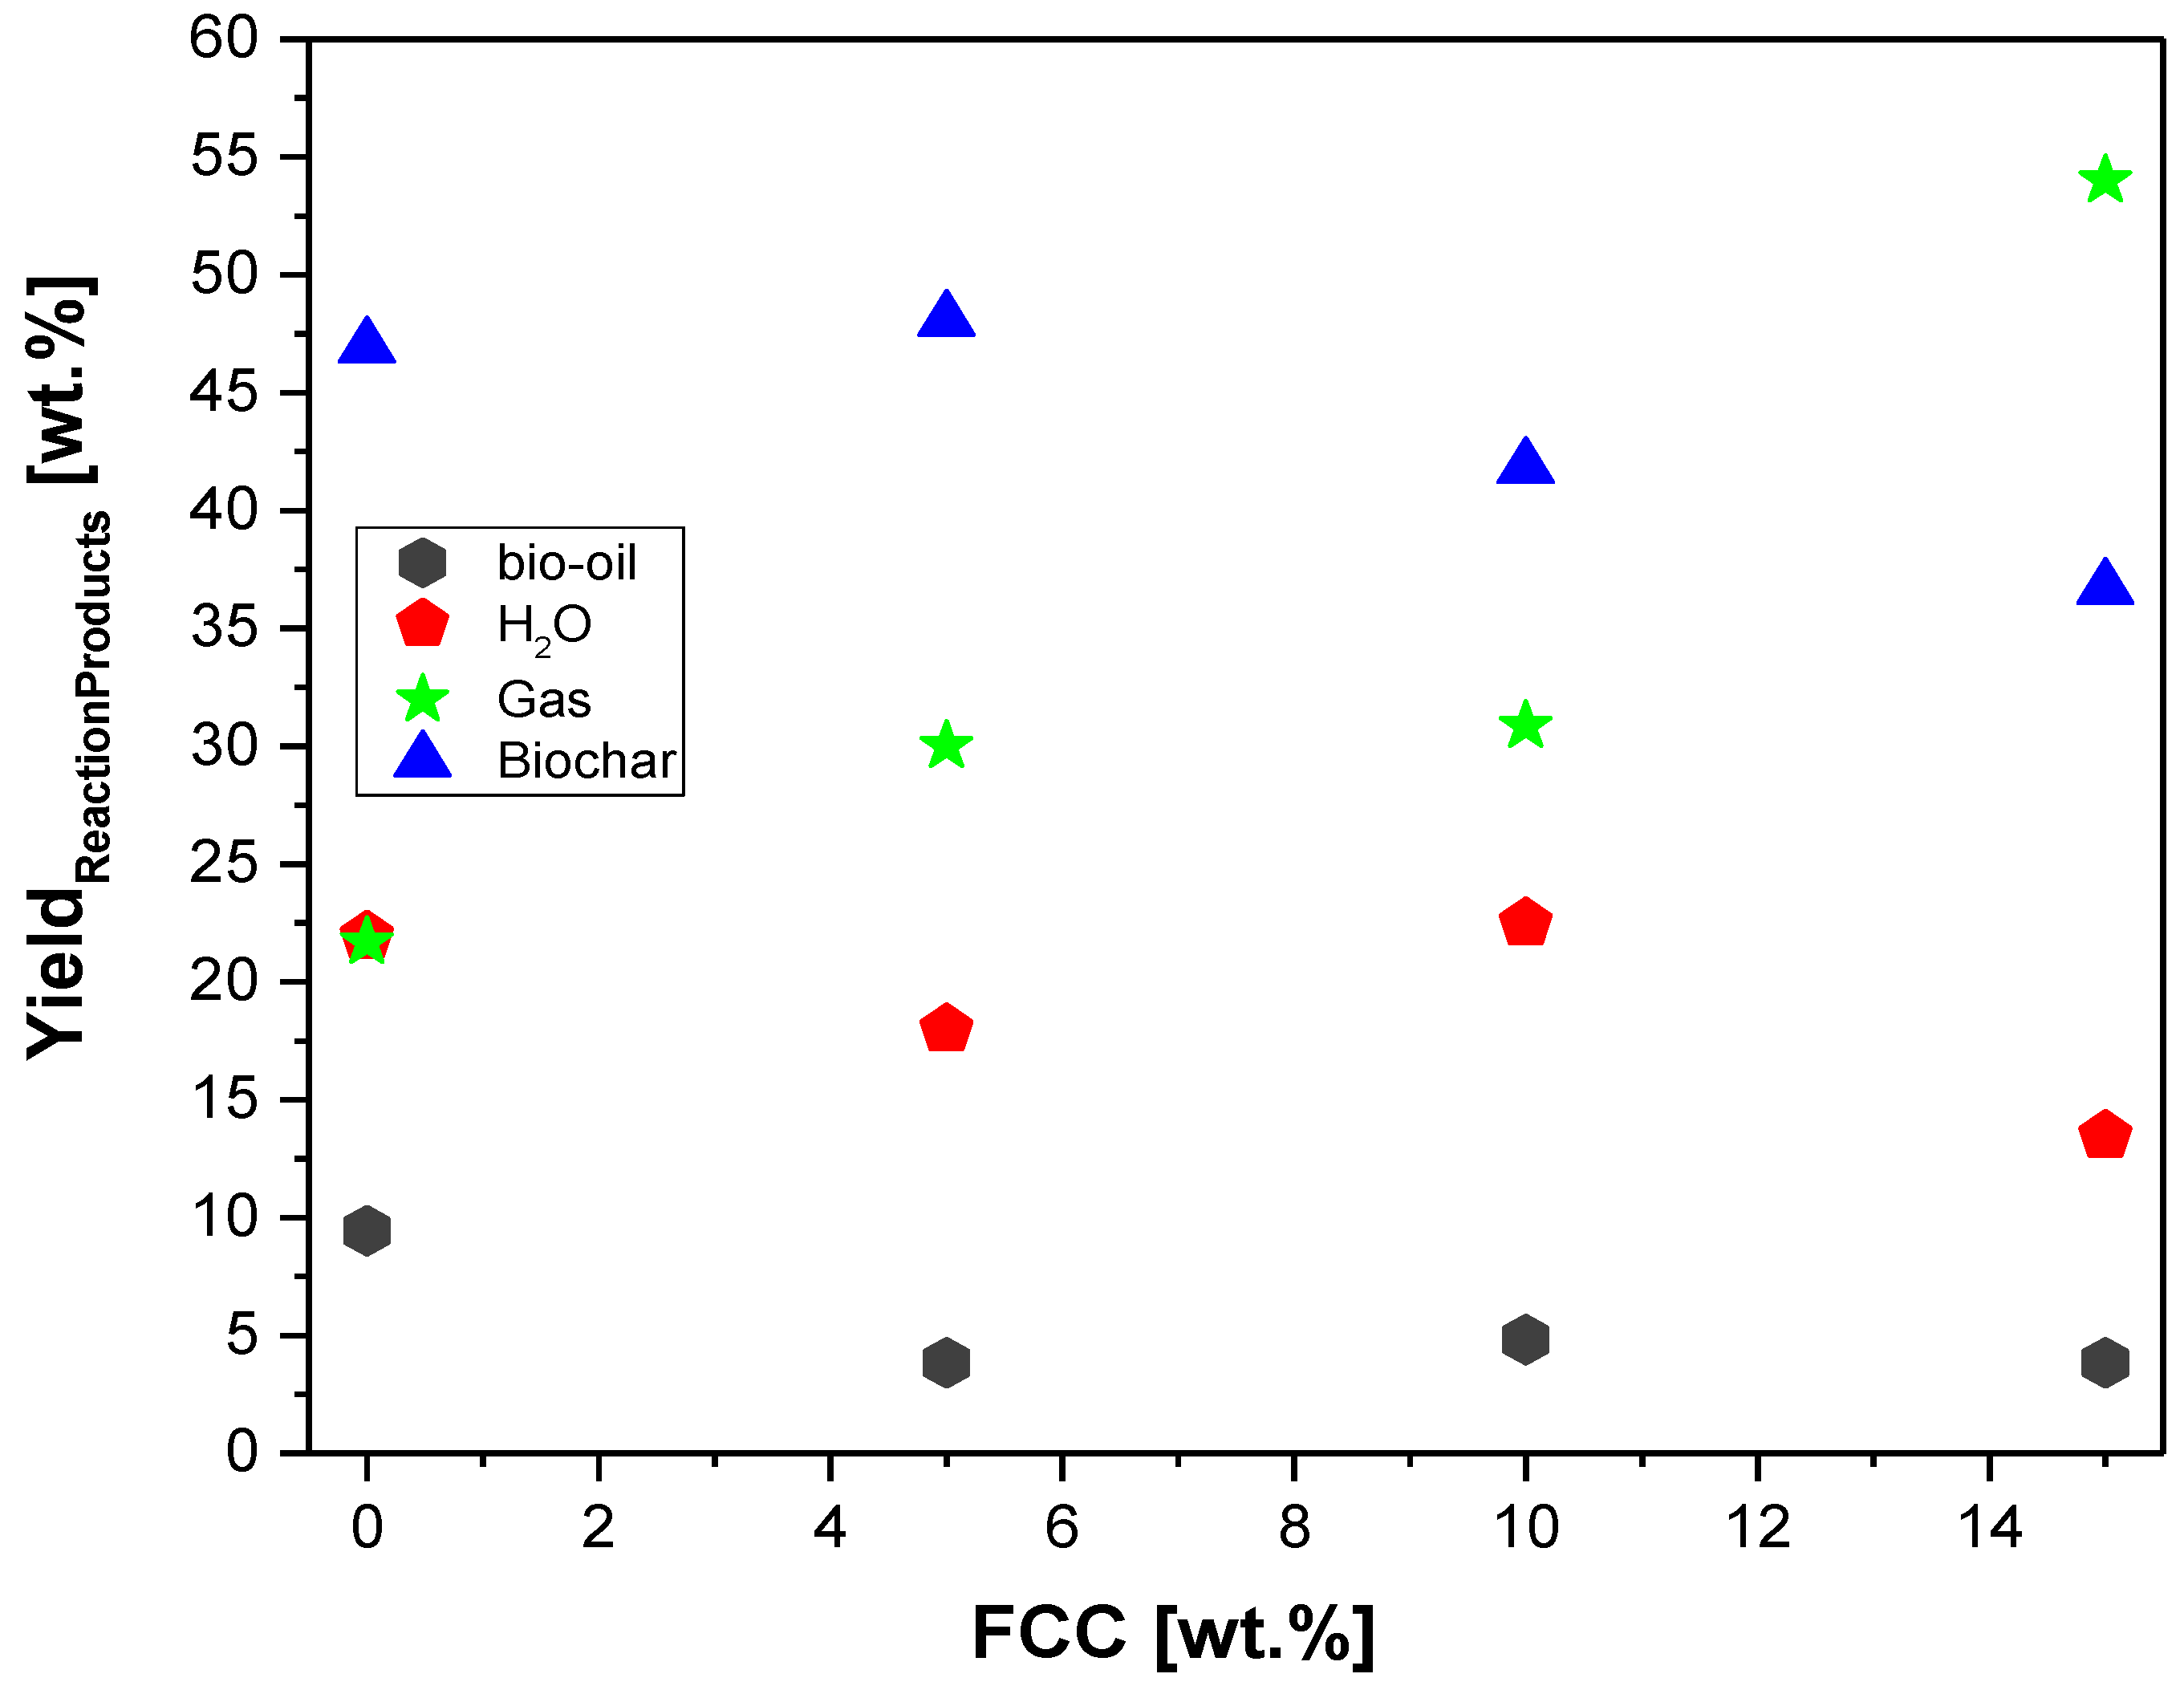
Figure 13.
FT-IR of bio-oil obtained by pyrolysis of MSW fraction (organic matter + paper+plastic) at 400°C, 1.0 atmosphere, in laboratory scale.
Figure 13.
FT-IR of bio-oil obtained by pyrolysis of MSW fraction (organic matter + paper+plastic) at 400°C, 1.0 atmosphere, in laboratory scale.
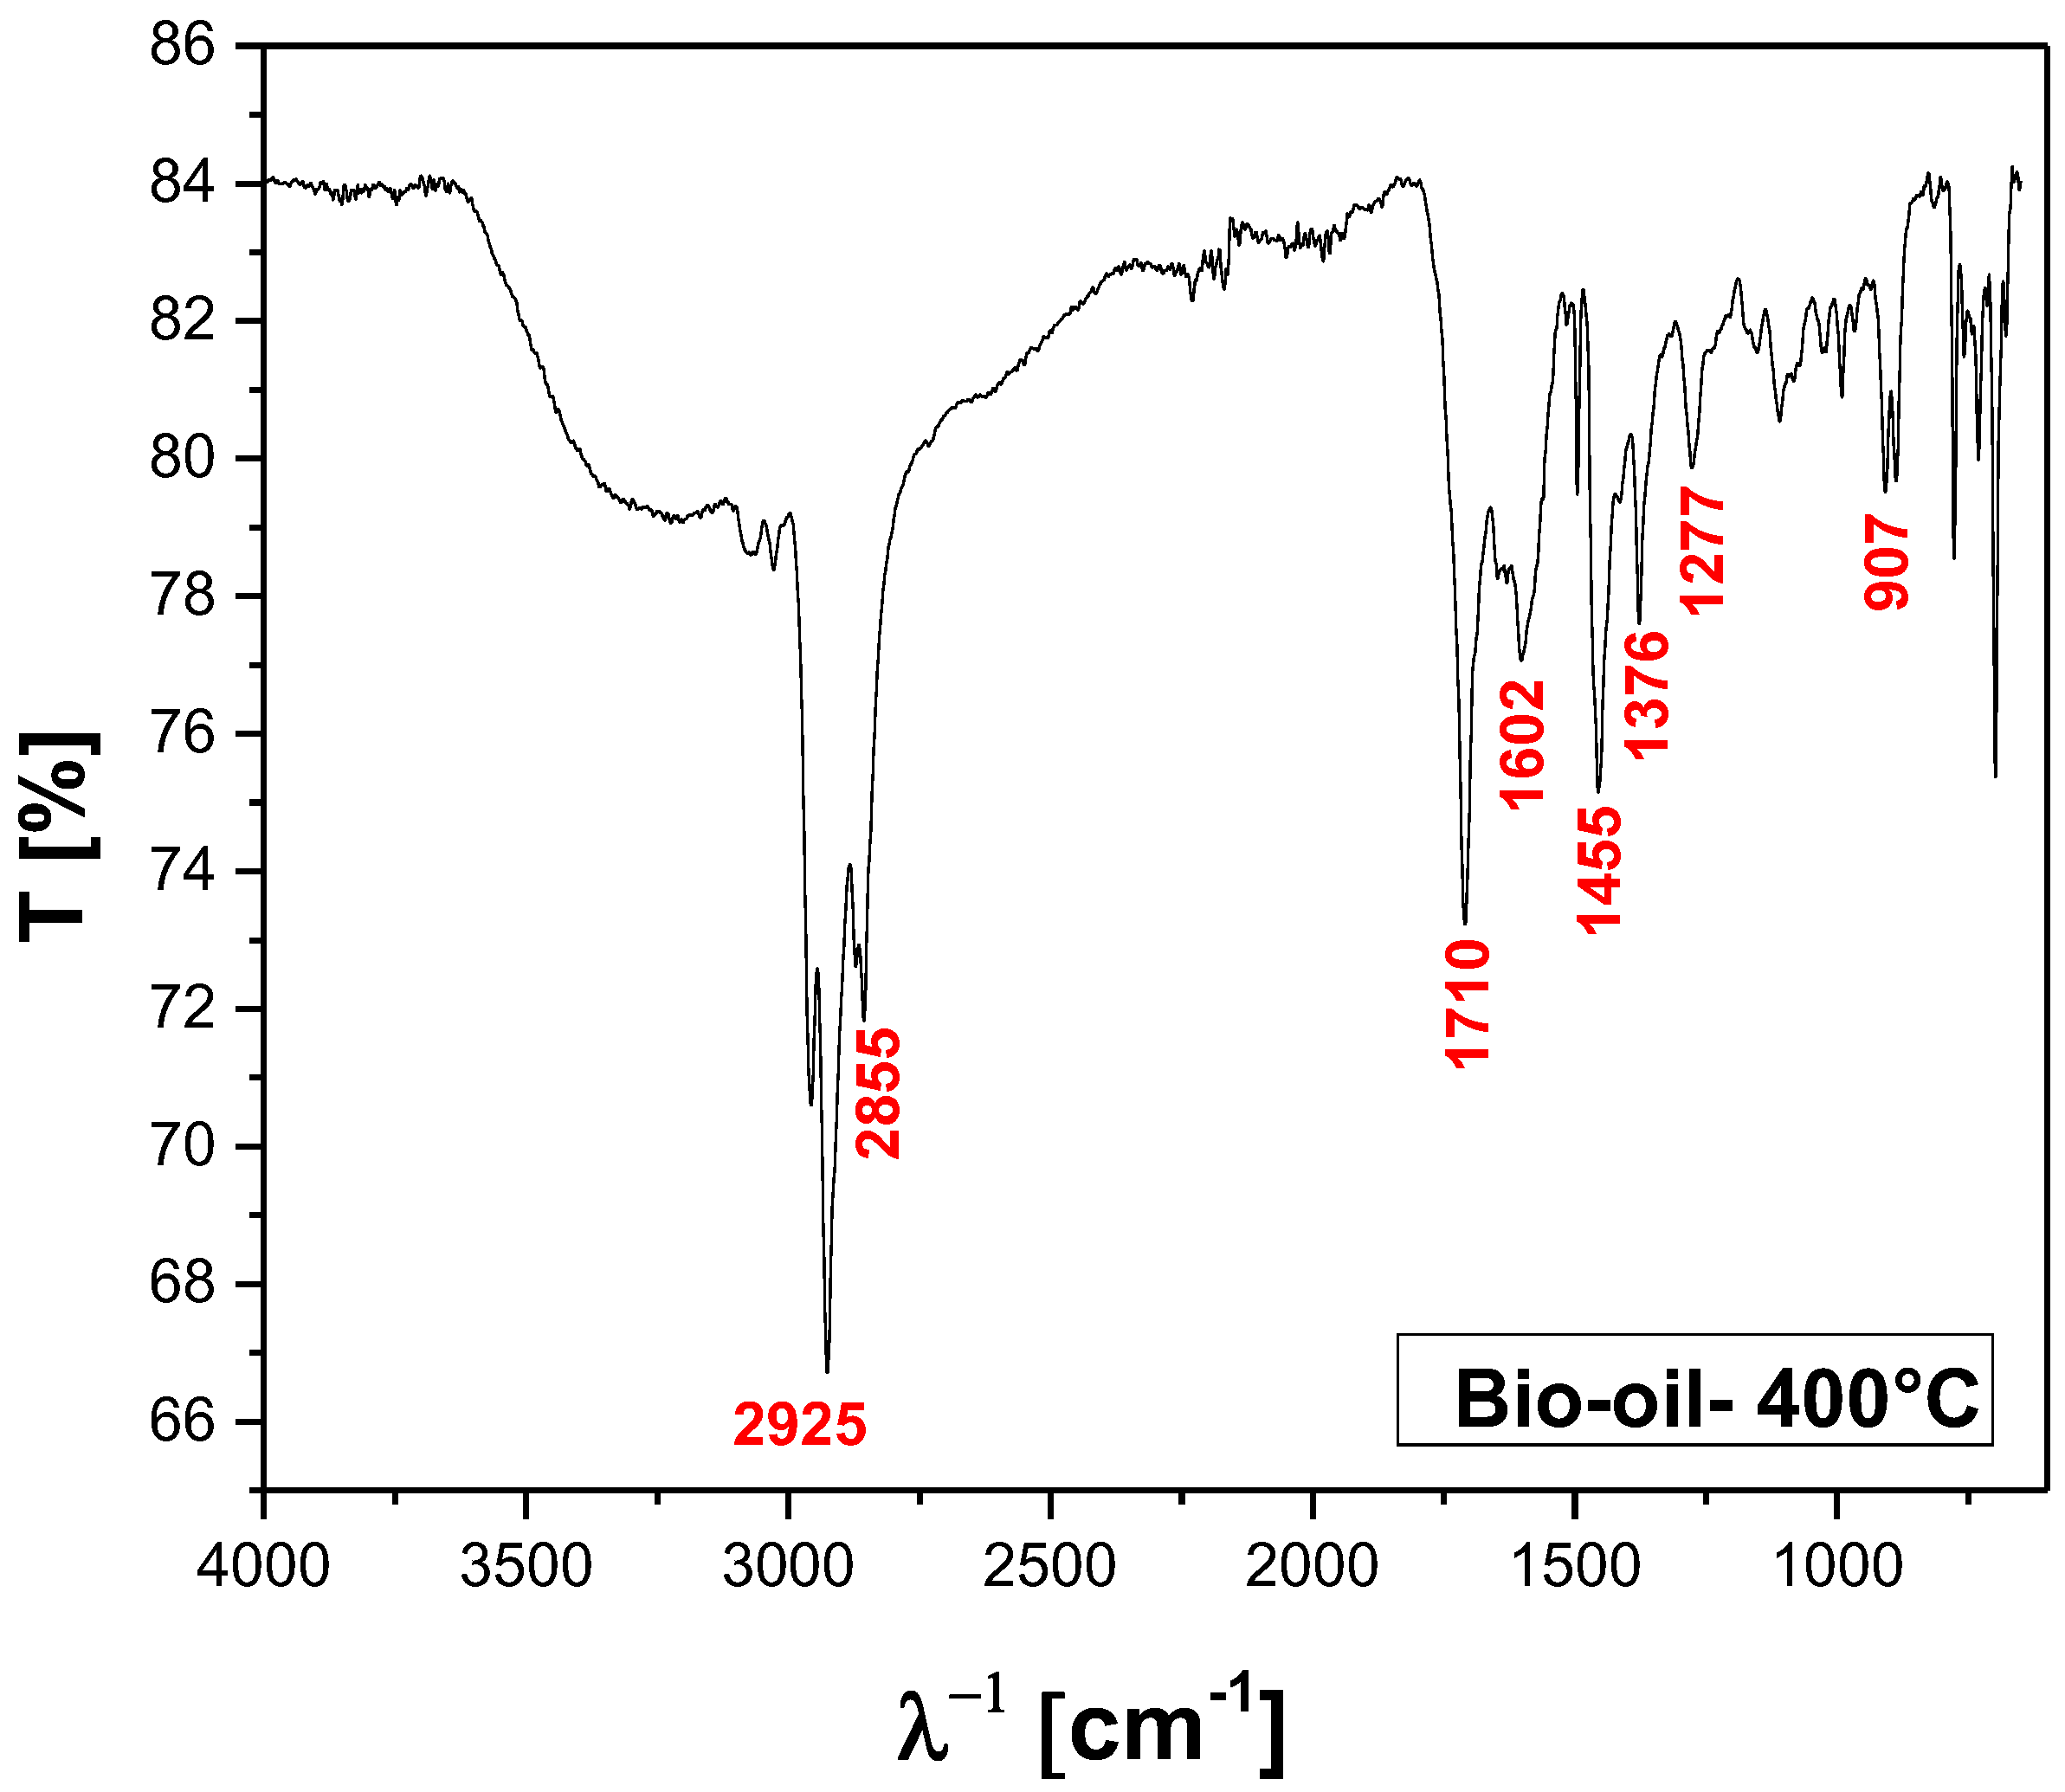
Figure 14.
FT-IR of bio-oil obtained by pyrolysis of MSW fraction (organic matter + paper+plastic) at 450 °C, 1.0 atmosphere, in laboratory scale.
Figure 14.
FT-IR of bio-oil obtained by pyrolysis of MSW fraction (organic matter + paper+plastic) at 450 °C, 1.0 atmosphere, in laboratory scale.
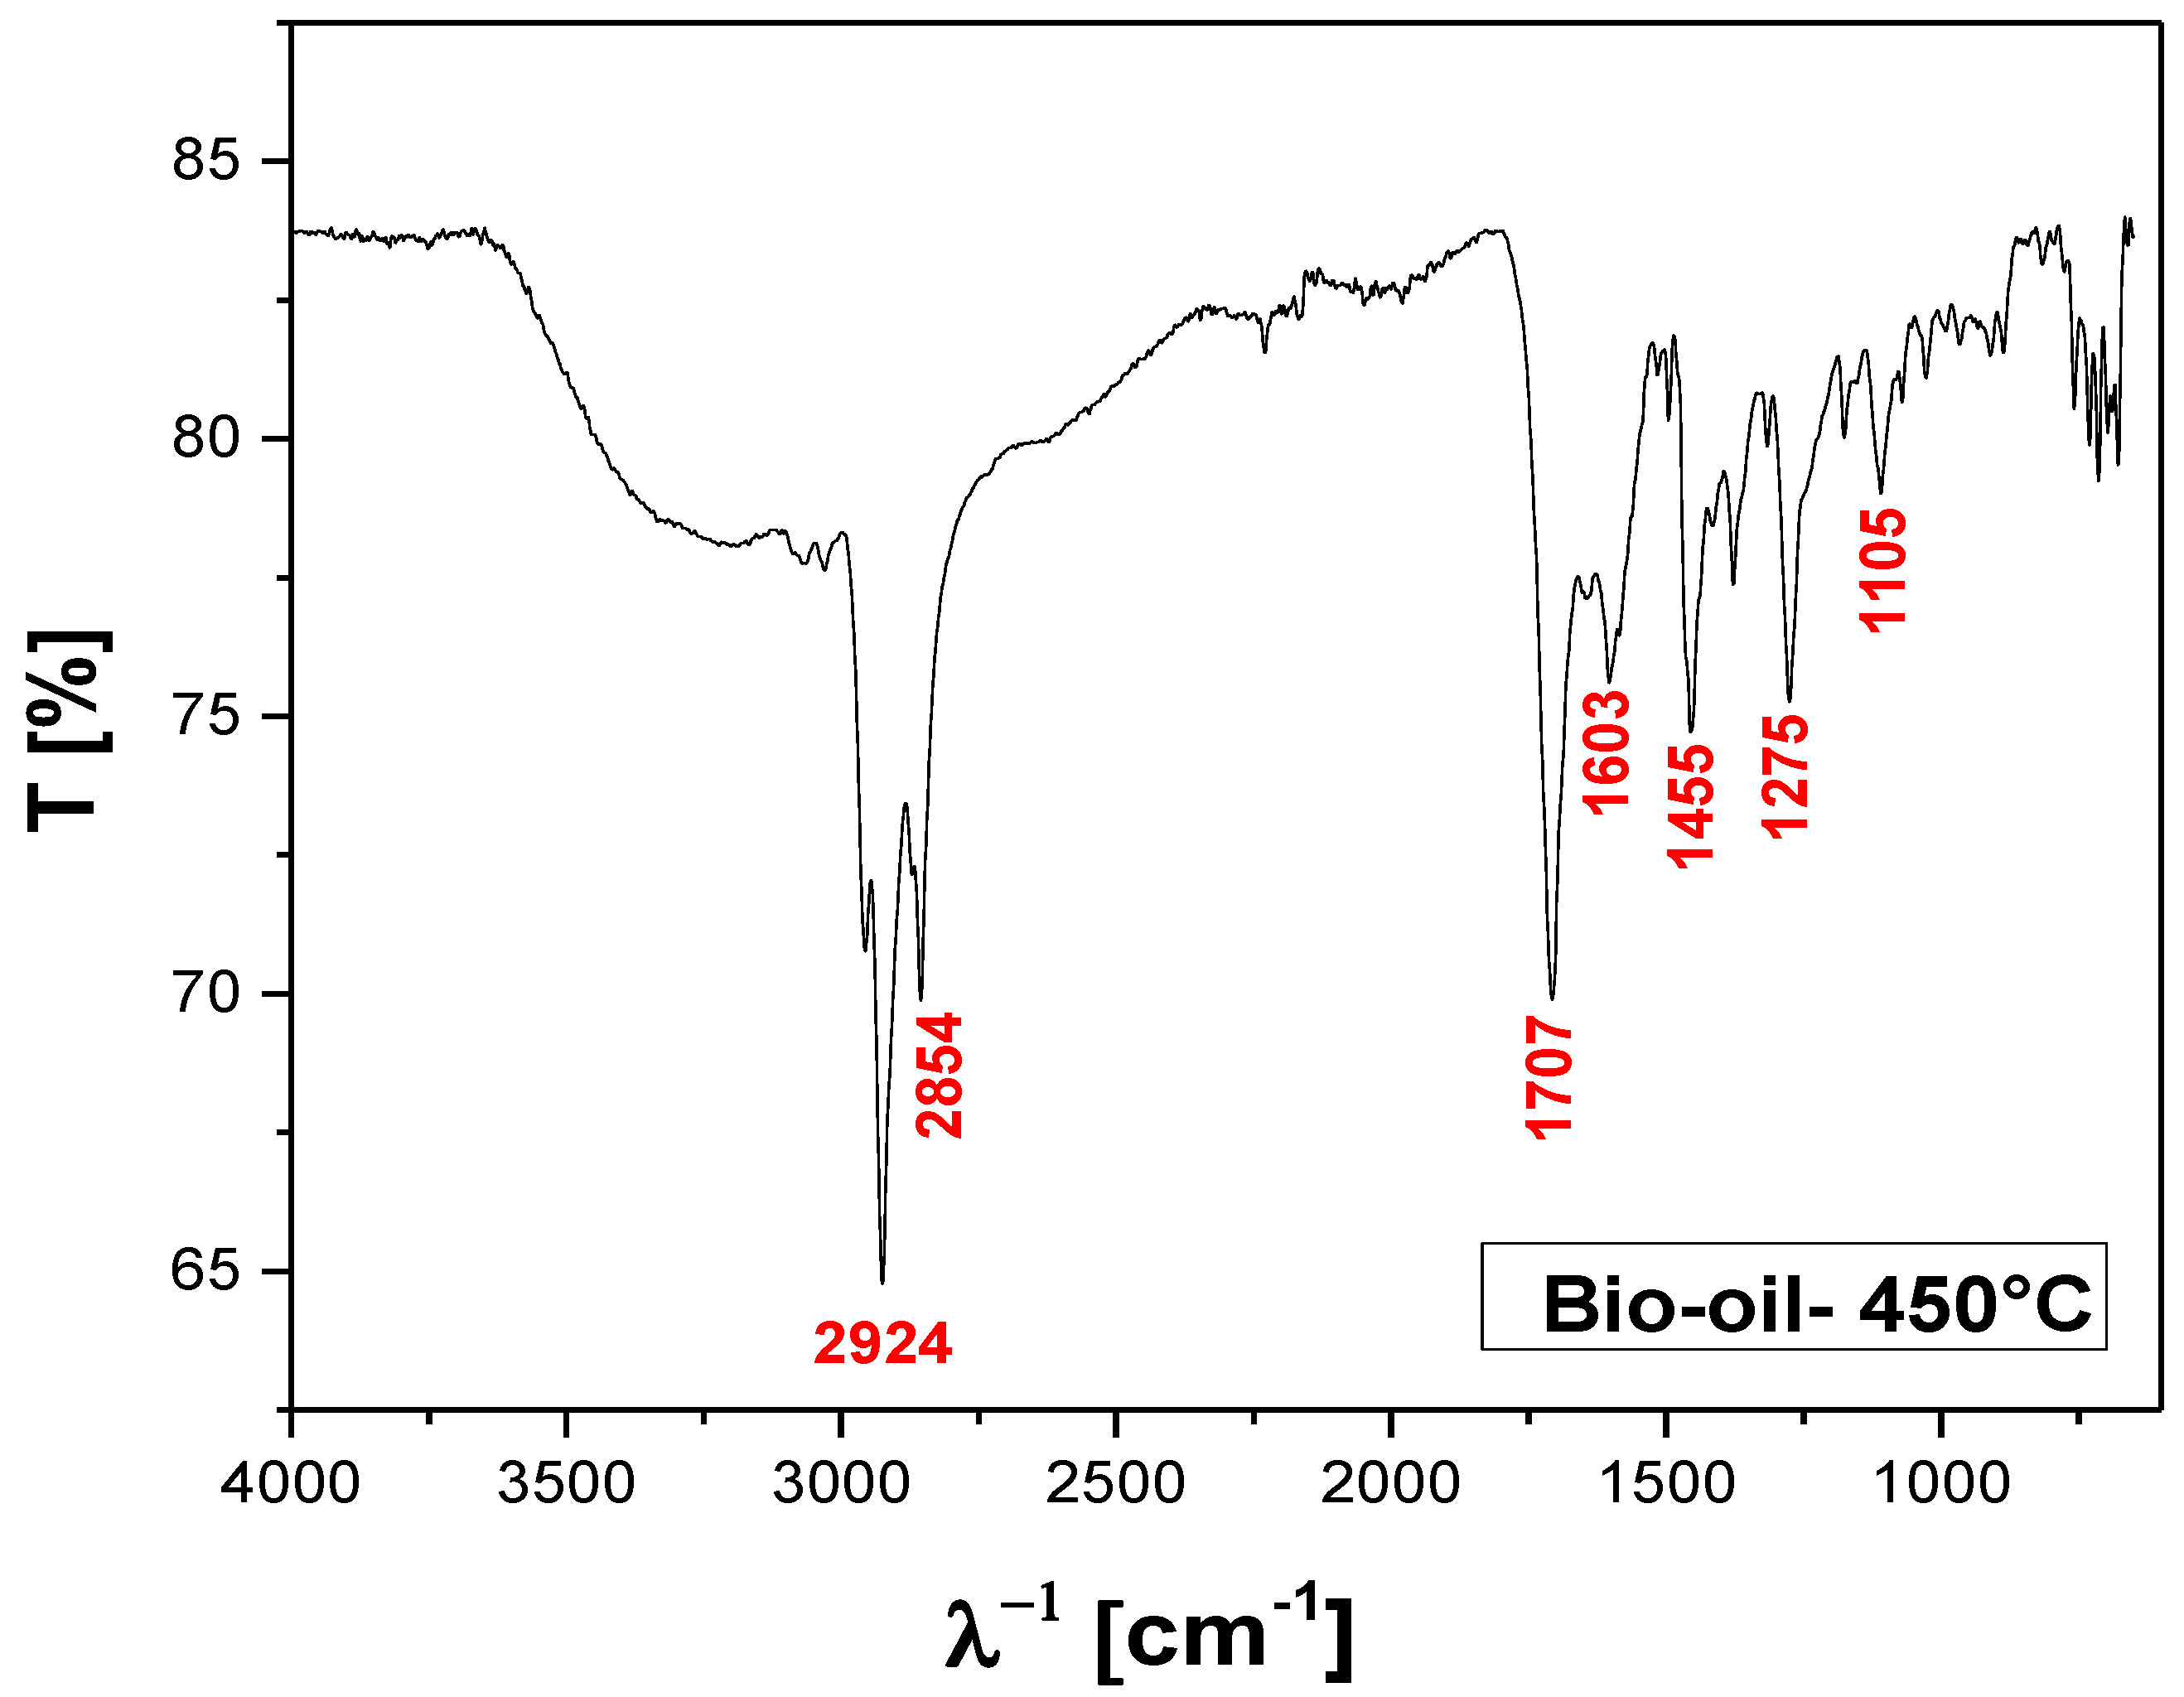
Figure 15.
FT-IR of bio-oil obtained by pyrolysis of MSW fraction (organic matter + paper+plastic) at 475 °C, 1.0 atmosphere, in laboratory scale.
Figure 15.
FT-IR of bio-oil obtained by pyrolysis of MSW fraction (organic matter + paper+plastic) at 475 °C, 1.0 atmosphere, in laboratory scale.
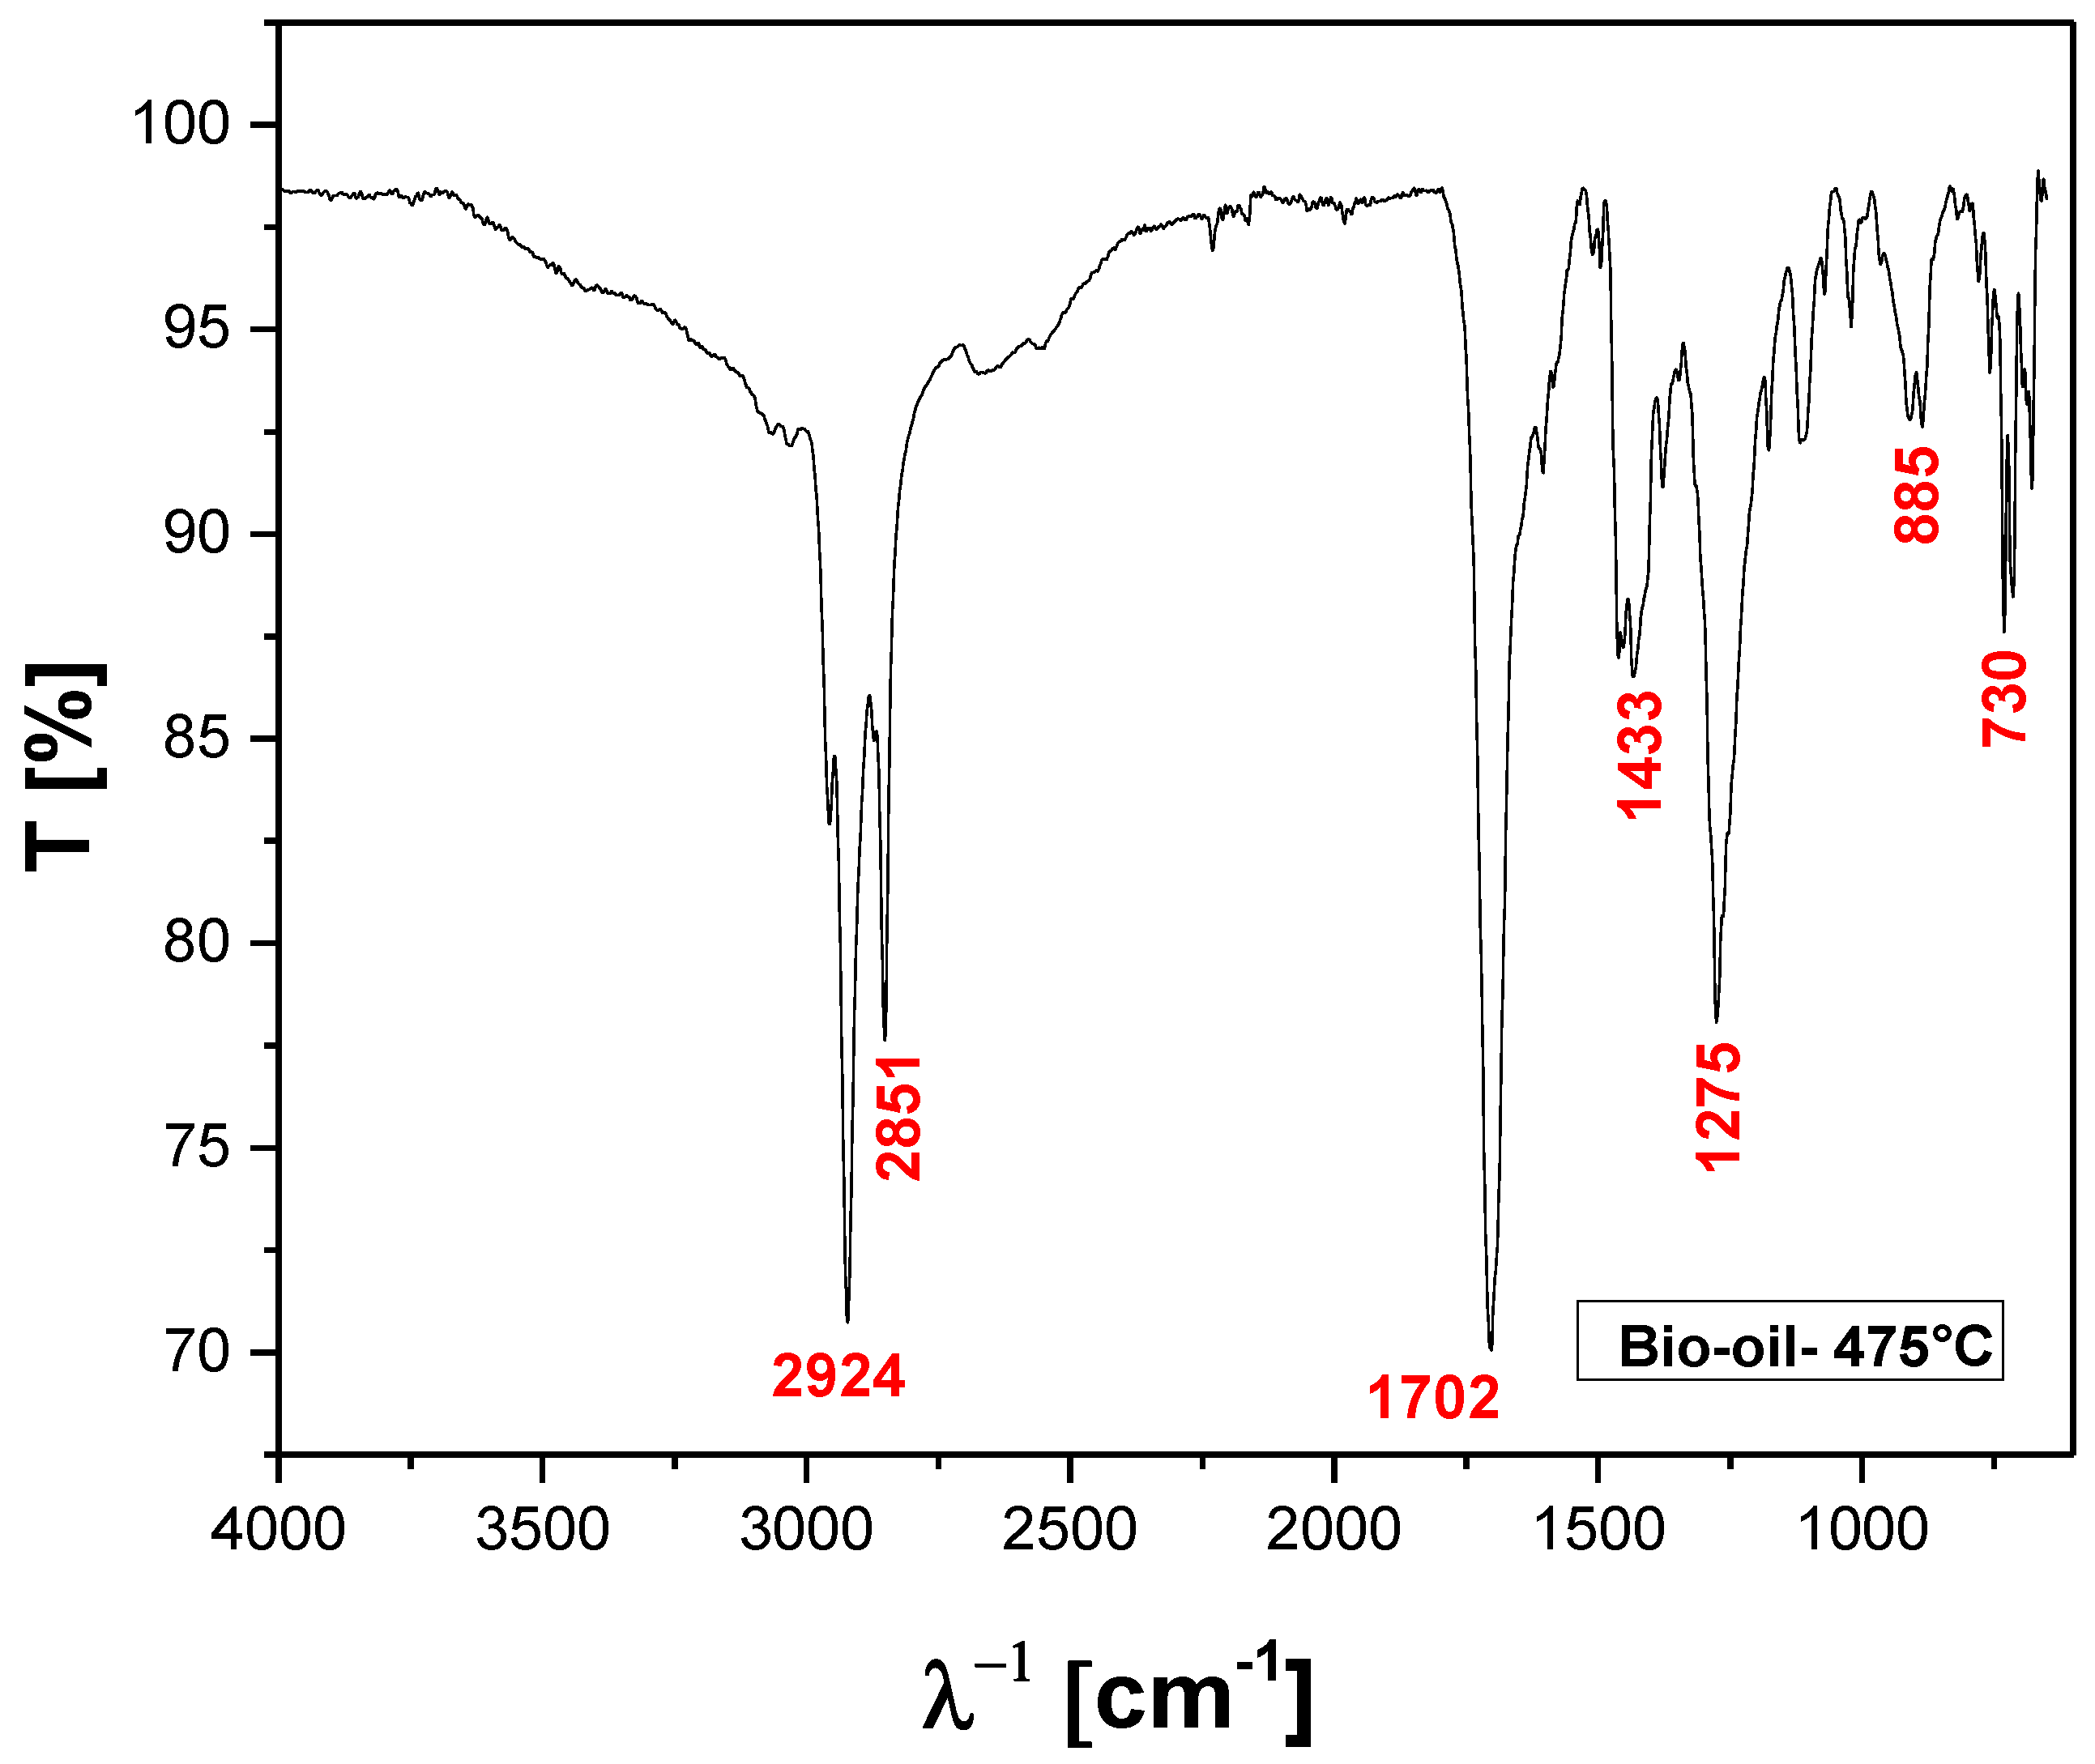
Figure 16.
FT-IR of bio-oil obtained by catalytic cracking of MHSW fraction (organic matter + paper+plastic) at 450°C, 1.0 atm, 5.0 % (wt.) FCC, in laboratory scale.
Figure 16.
FT-IR of bio-oil obtained by catalytic cracking of MHSW fraction (organic matter + paper+plastic) at 450°C, 1.0 atm, 5.0 % (wt.) FCC, in laboratory scale.
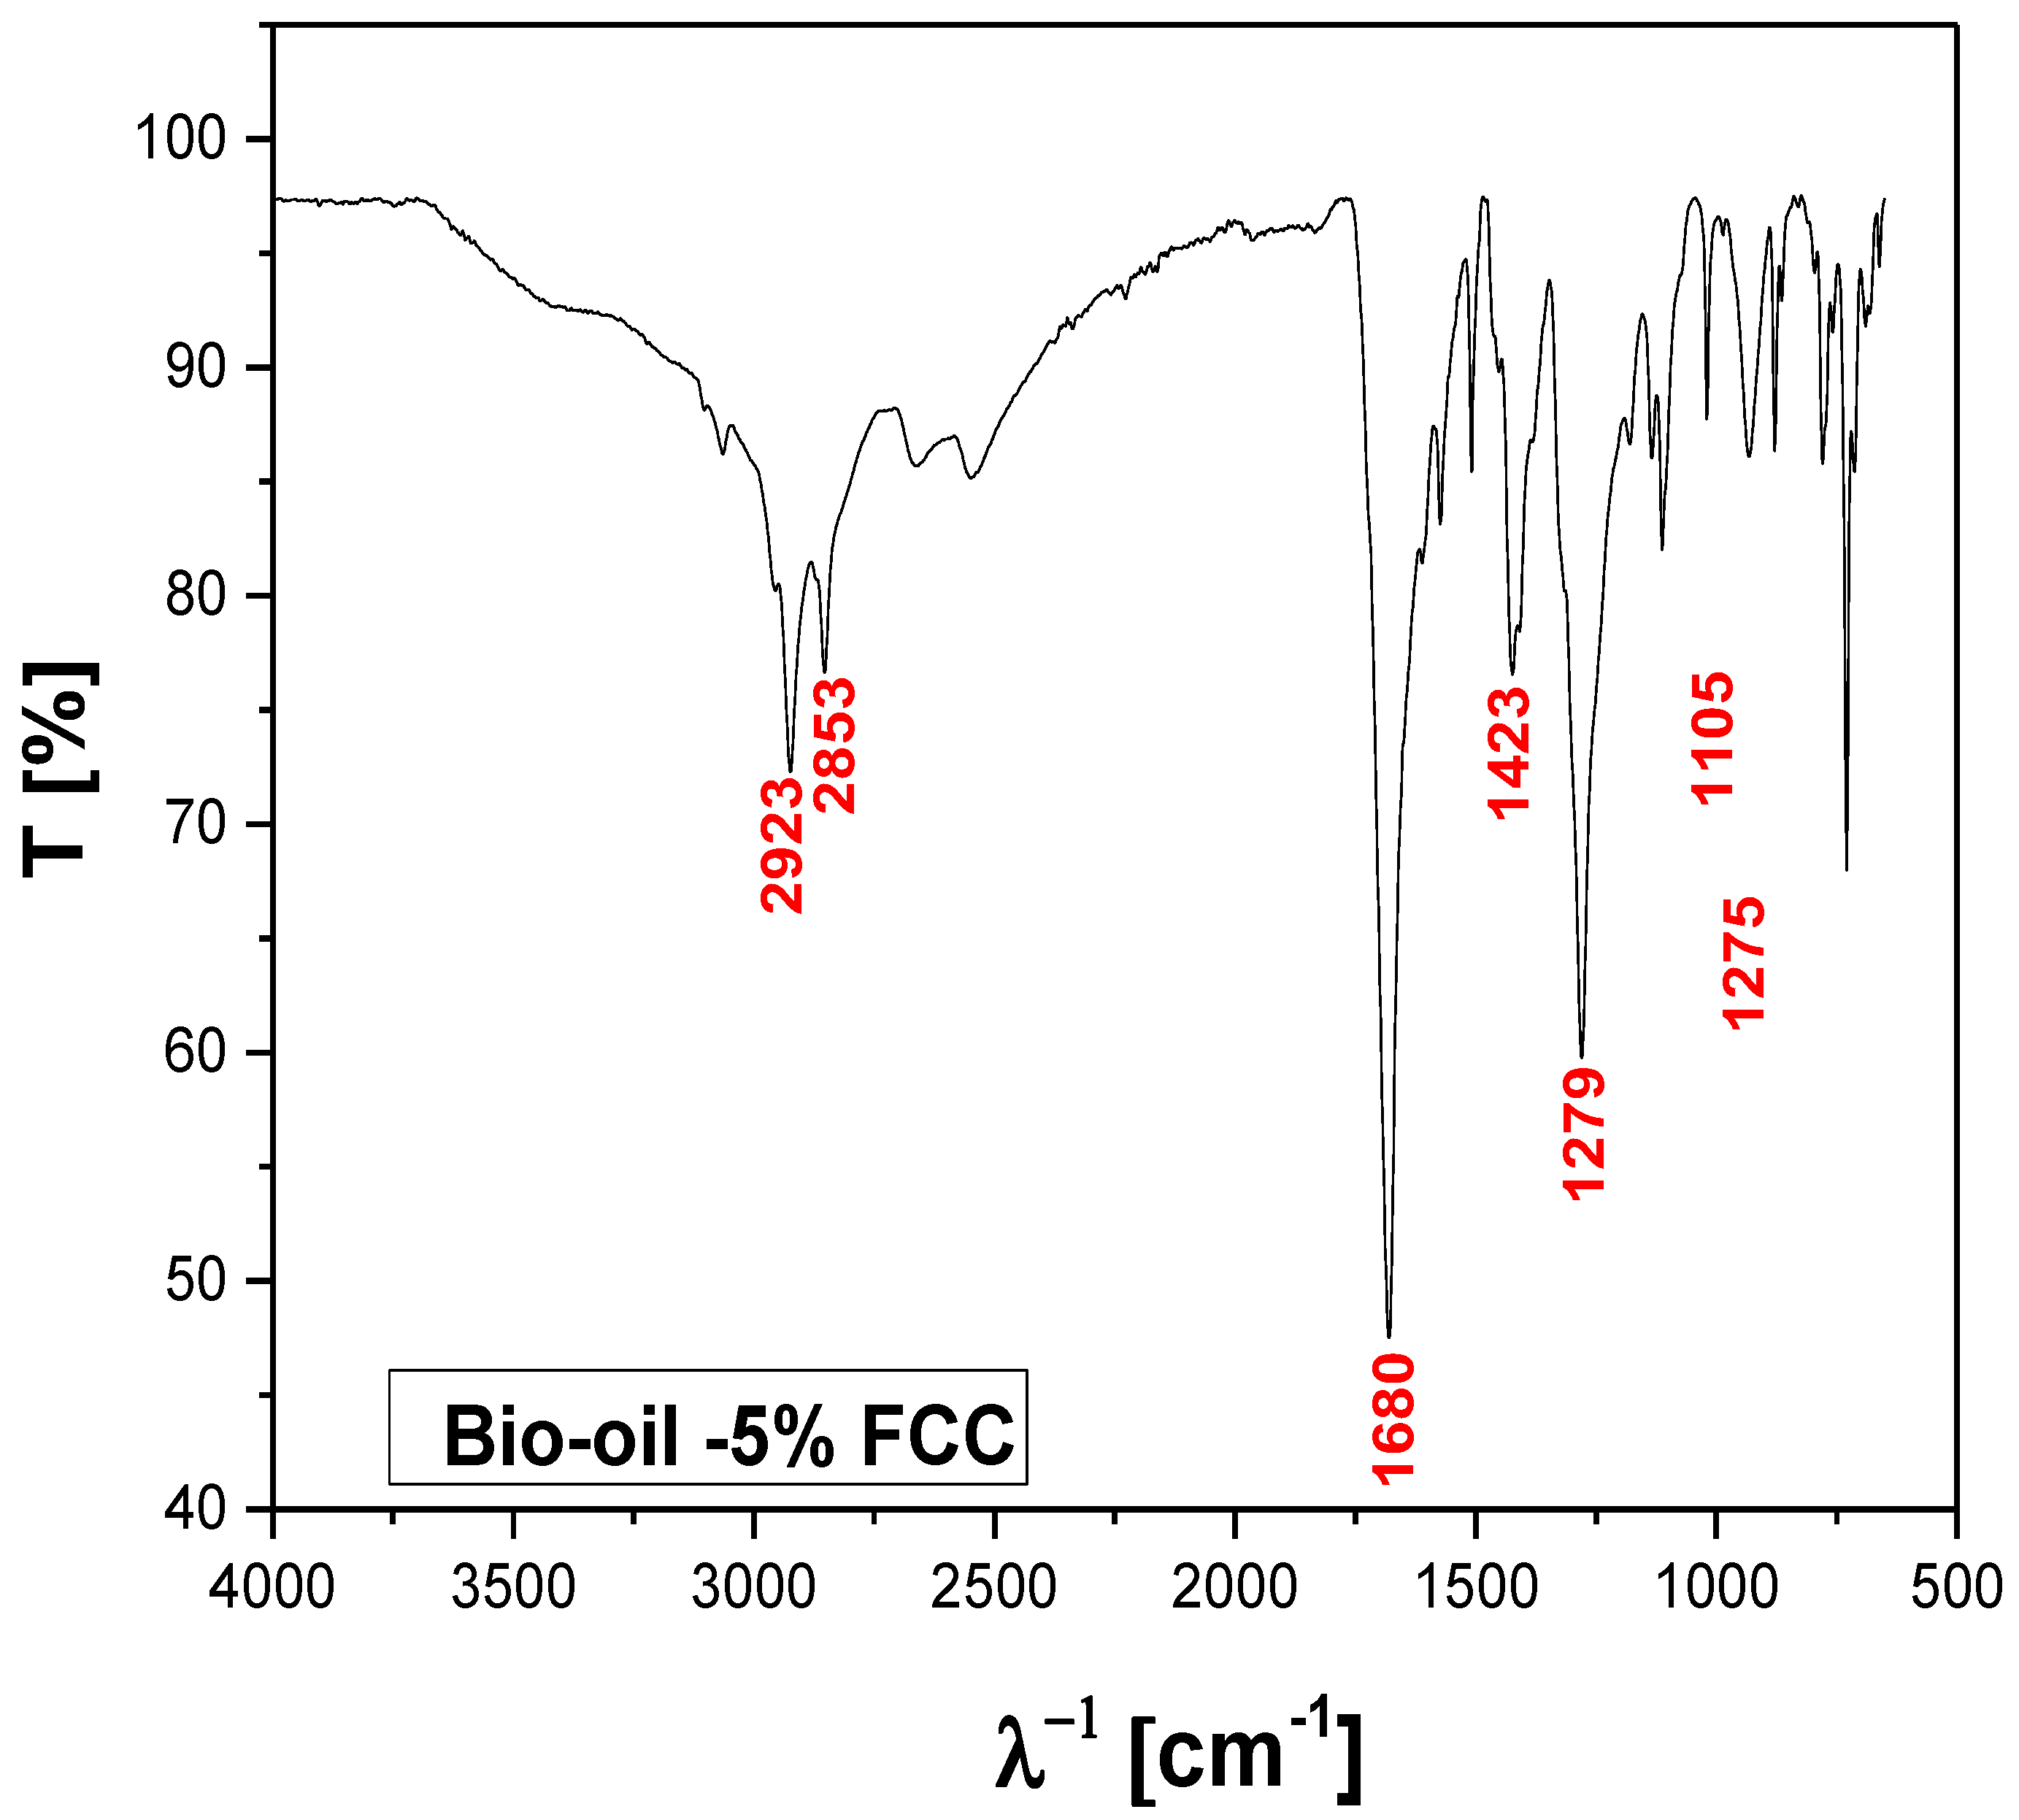
Figure 17.
FT-IR of bio-oil obtained by catalytic cracking of MHSW fraction (organic matter + paper+plastic) at 450°C, 1.0 atm, 10.0% (wt.) FCC, in laboratory scale.
Figure 17.
FT-IR of bio-oil obtained by catalytic cracking of MHSW fraction (organic matter + paper+plastic) at 450°C, 1.0 atm, 10.0% (wt.) FCC, in laboratory scale.
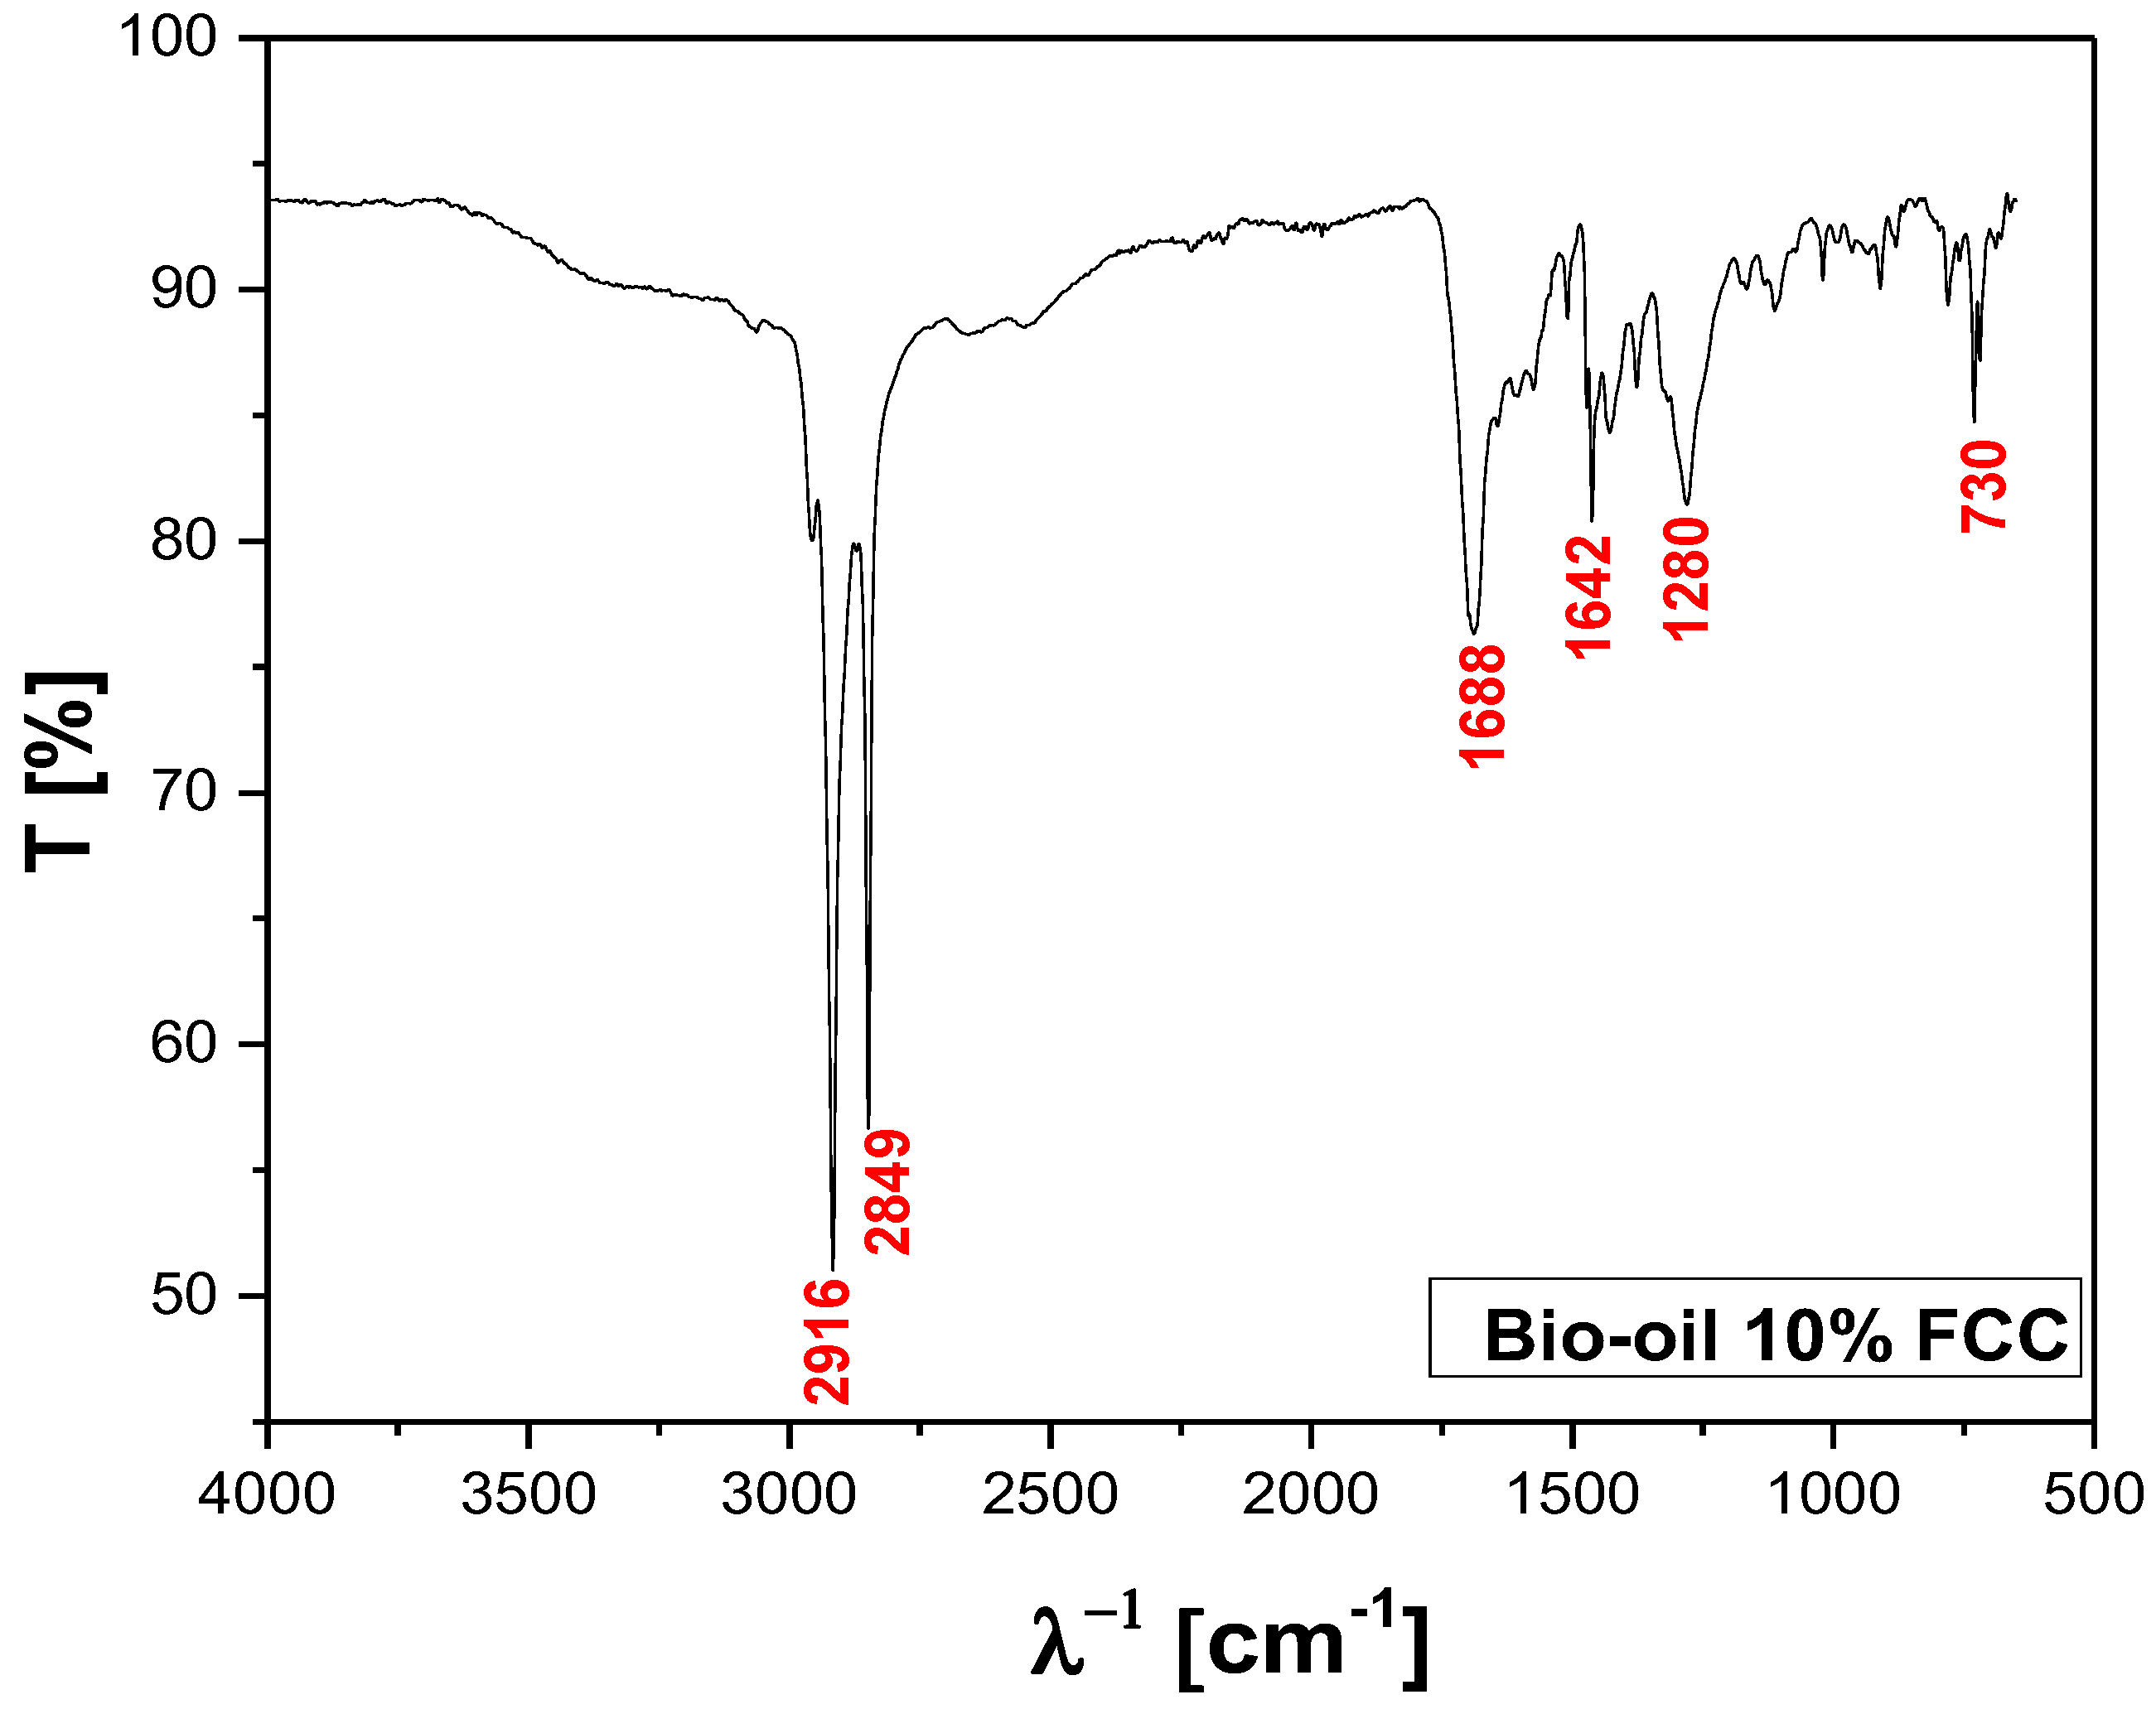
Figure 18.
FT-IR of bio-oil obtained by catalytic cracking of MHSW fraction (organic matter + paper+plastic) at 450°C, 1.0 atm, 15.0% (wt.) FCC, in laboratory scale.
Figure 18.
FT-IR of bio-oil obtained by catalytic cracking of MHSW fraction (organic matter + paper+plastic) at 450°C, 1.0 atm, 15.0% (wt.) FCC, in laboratory scale.
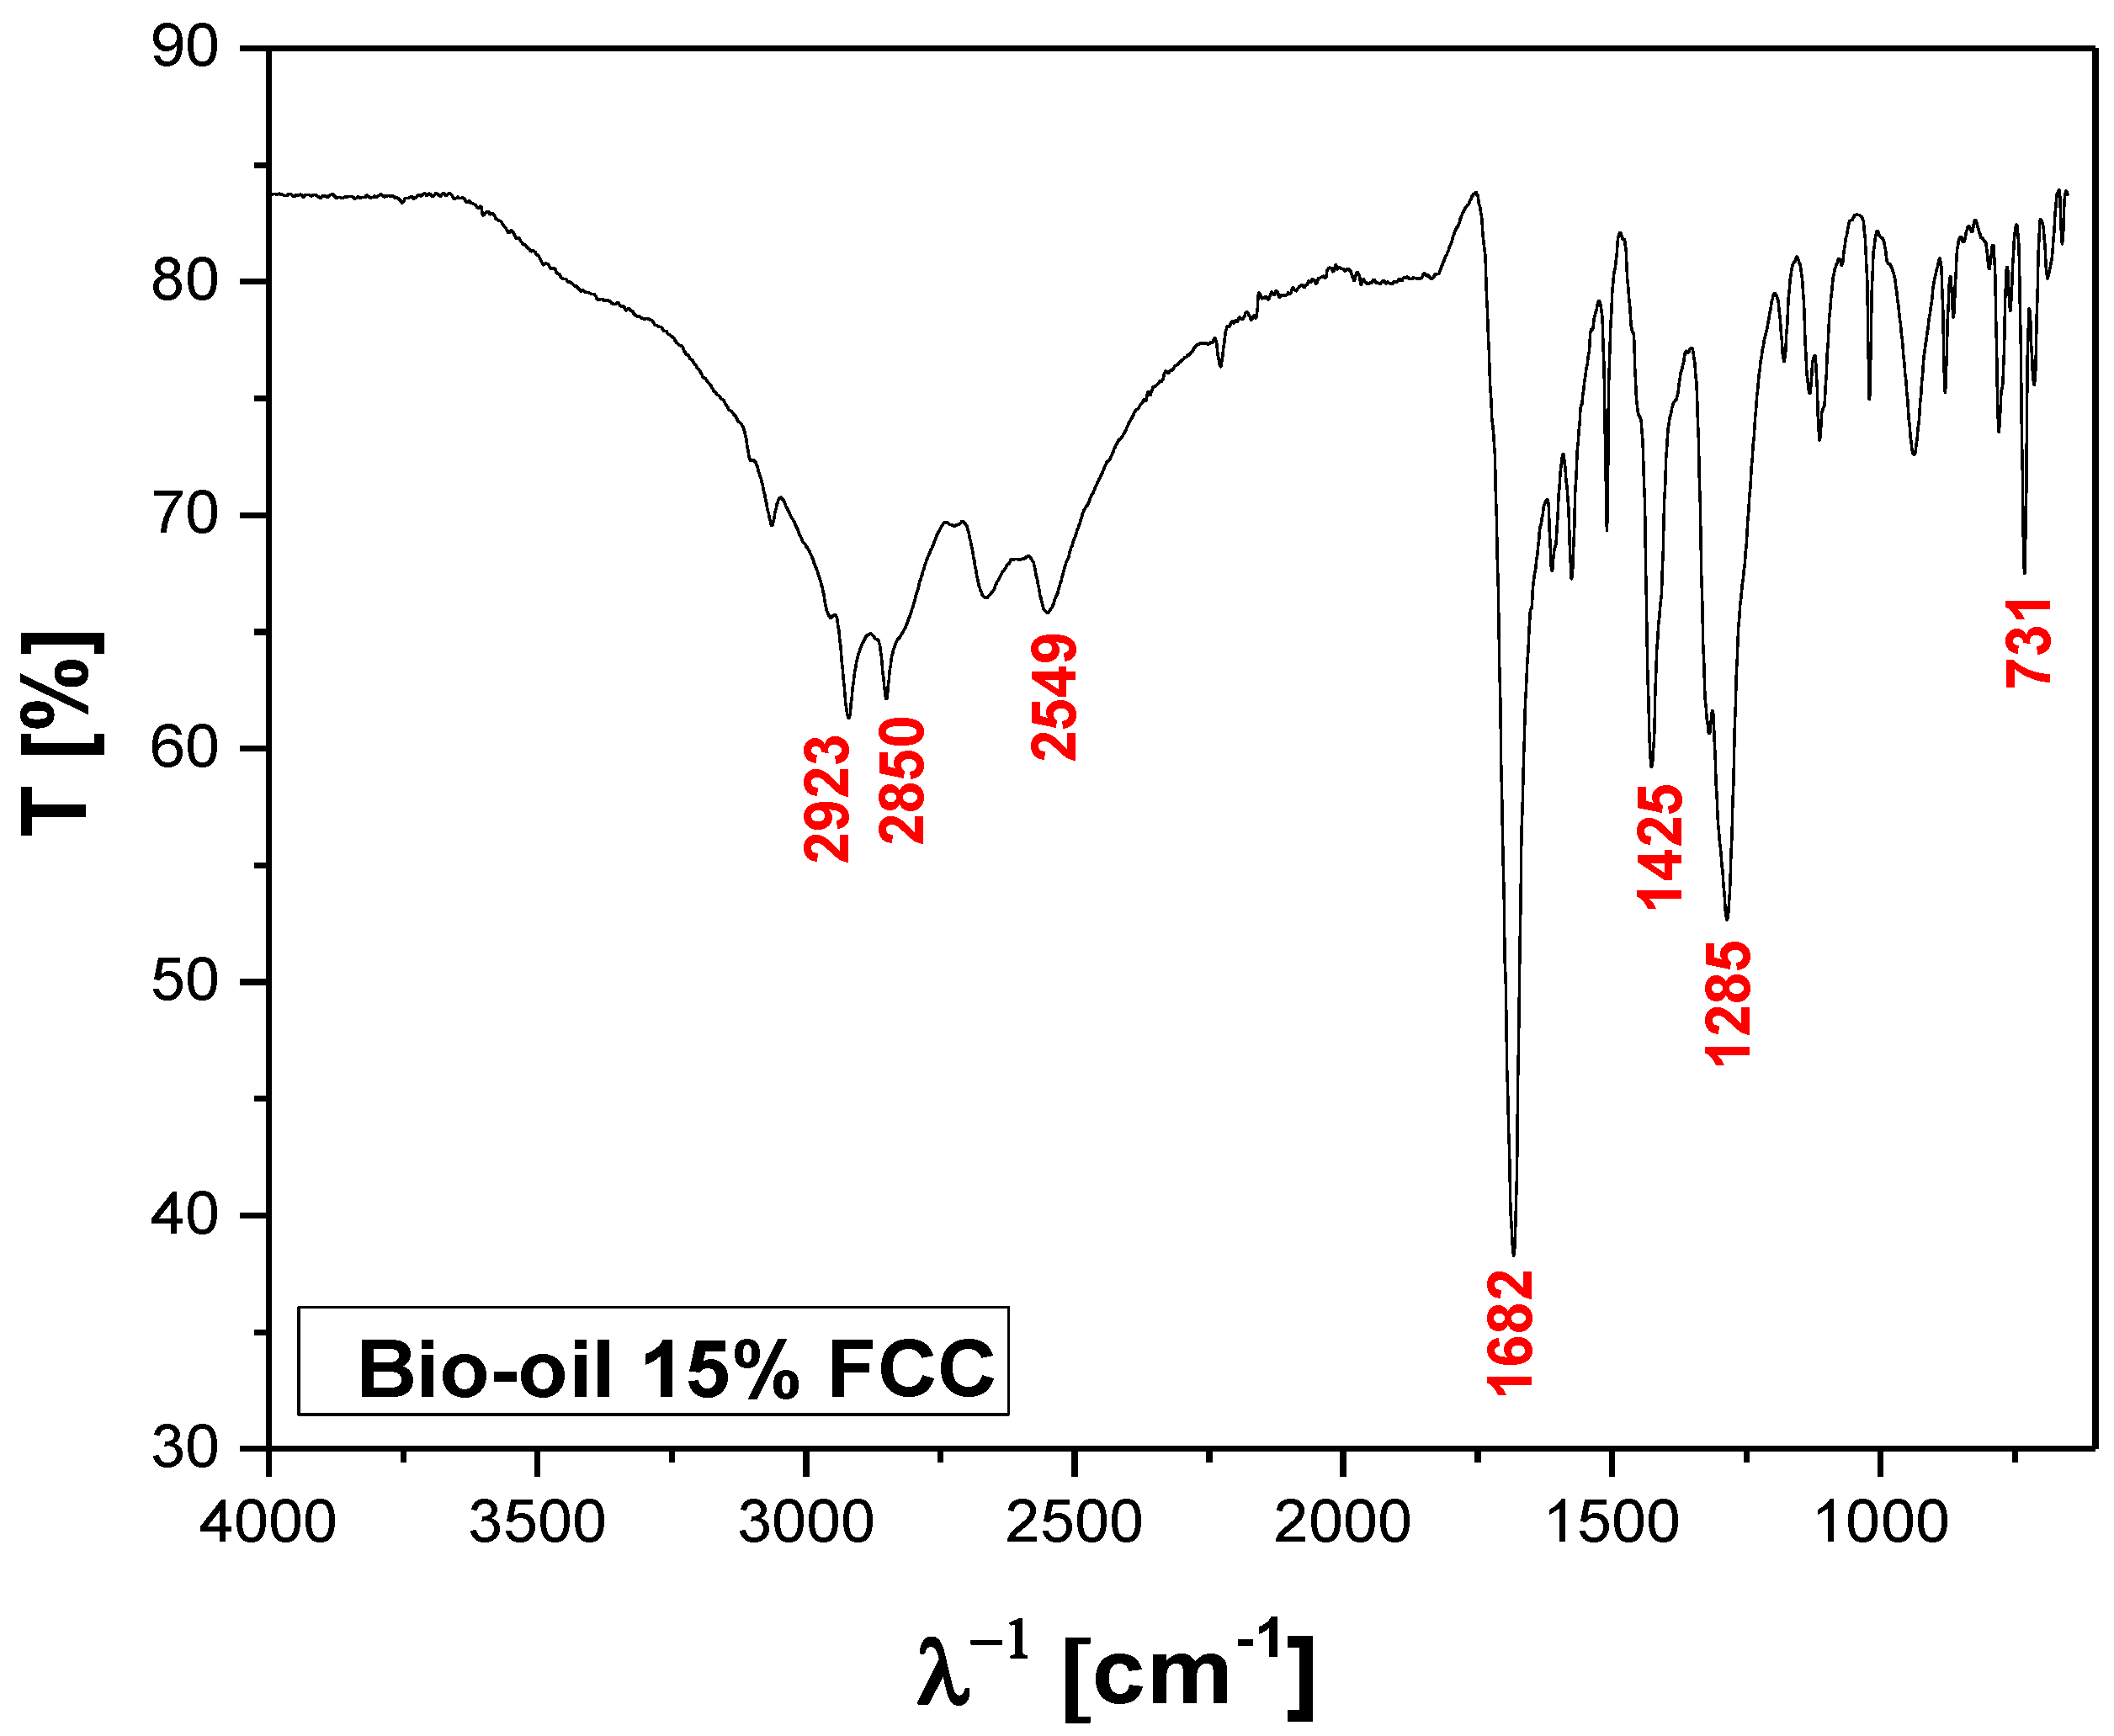
Figure 19.
Effect of temperature on the chemical composition, expressed in oxygenates and nitrogenates, of bio-oils obtained by pyrolysis of the MSW fraction (organic matter + paper + plastic) at 400, 450 and 475 °C, 1.0 atm, on a laboratory scale.
Figure 19.
Effect of temperature on the chemical composition, expressed in oxygenates and nitrogenates, of bio-oils obtained by pyrolysis of the MSW fraction (organic matter + paper + plastic) at 400, 450 and 475 °C, 1.0 atm, on a laboratory scale.
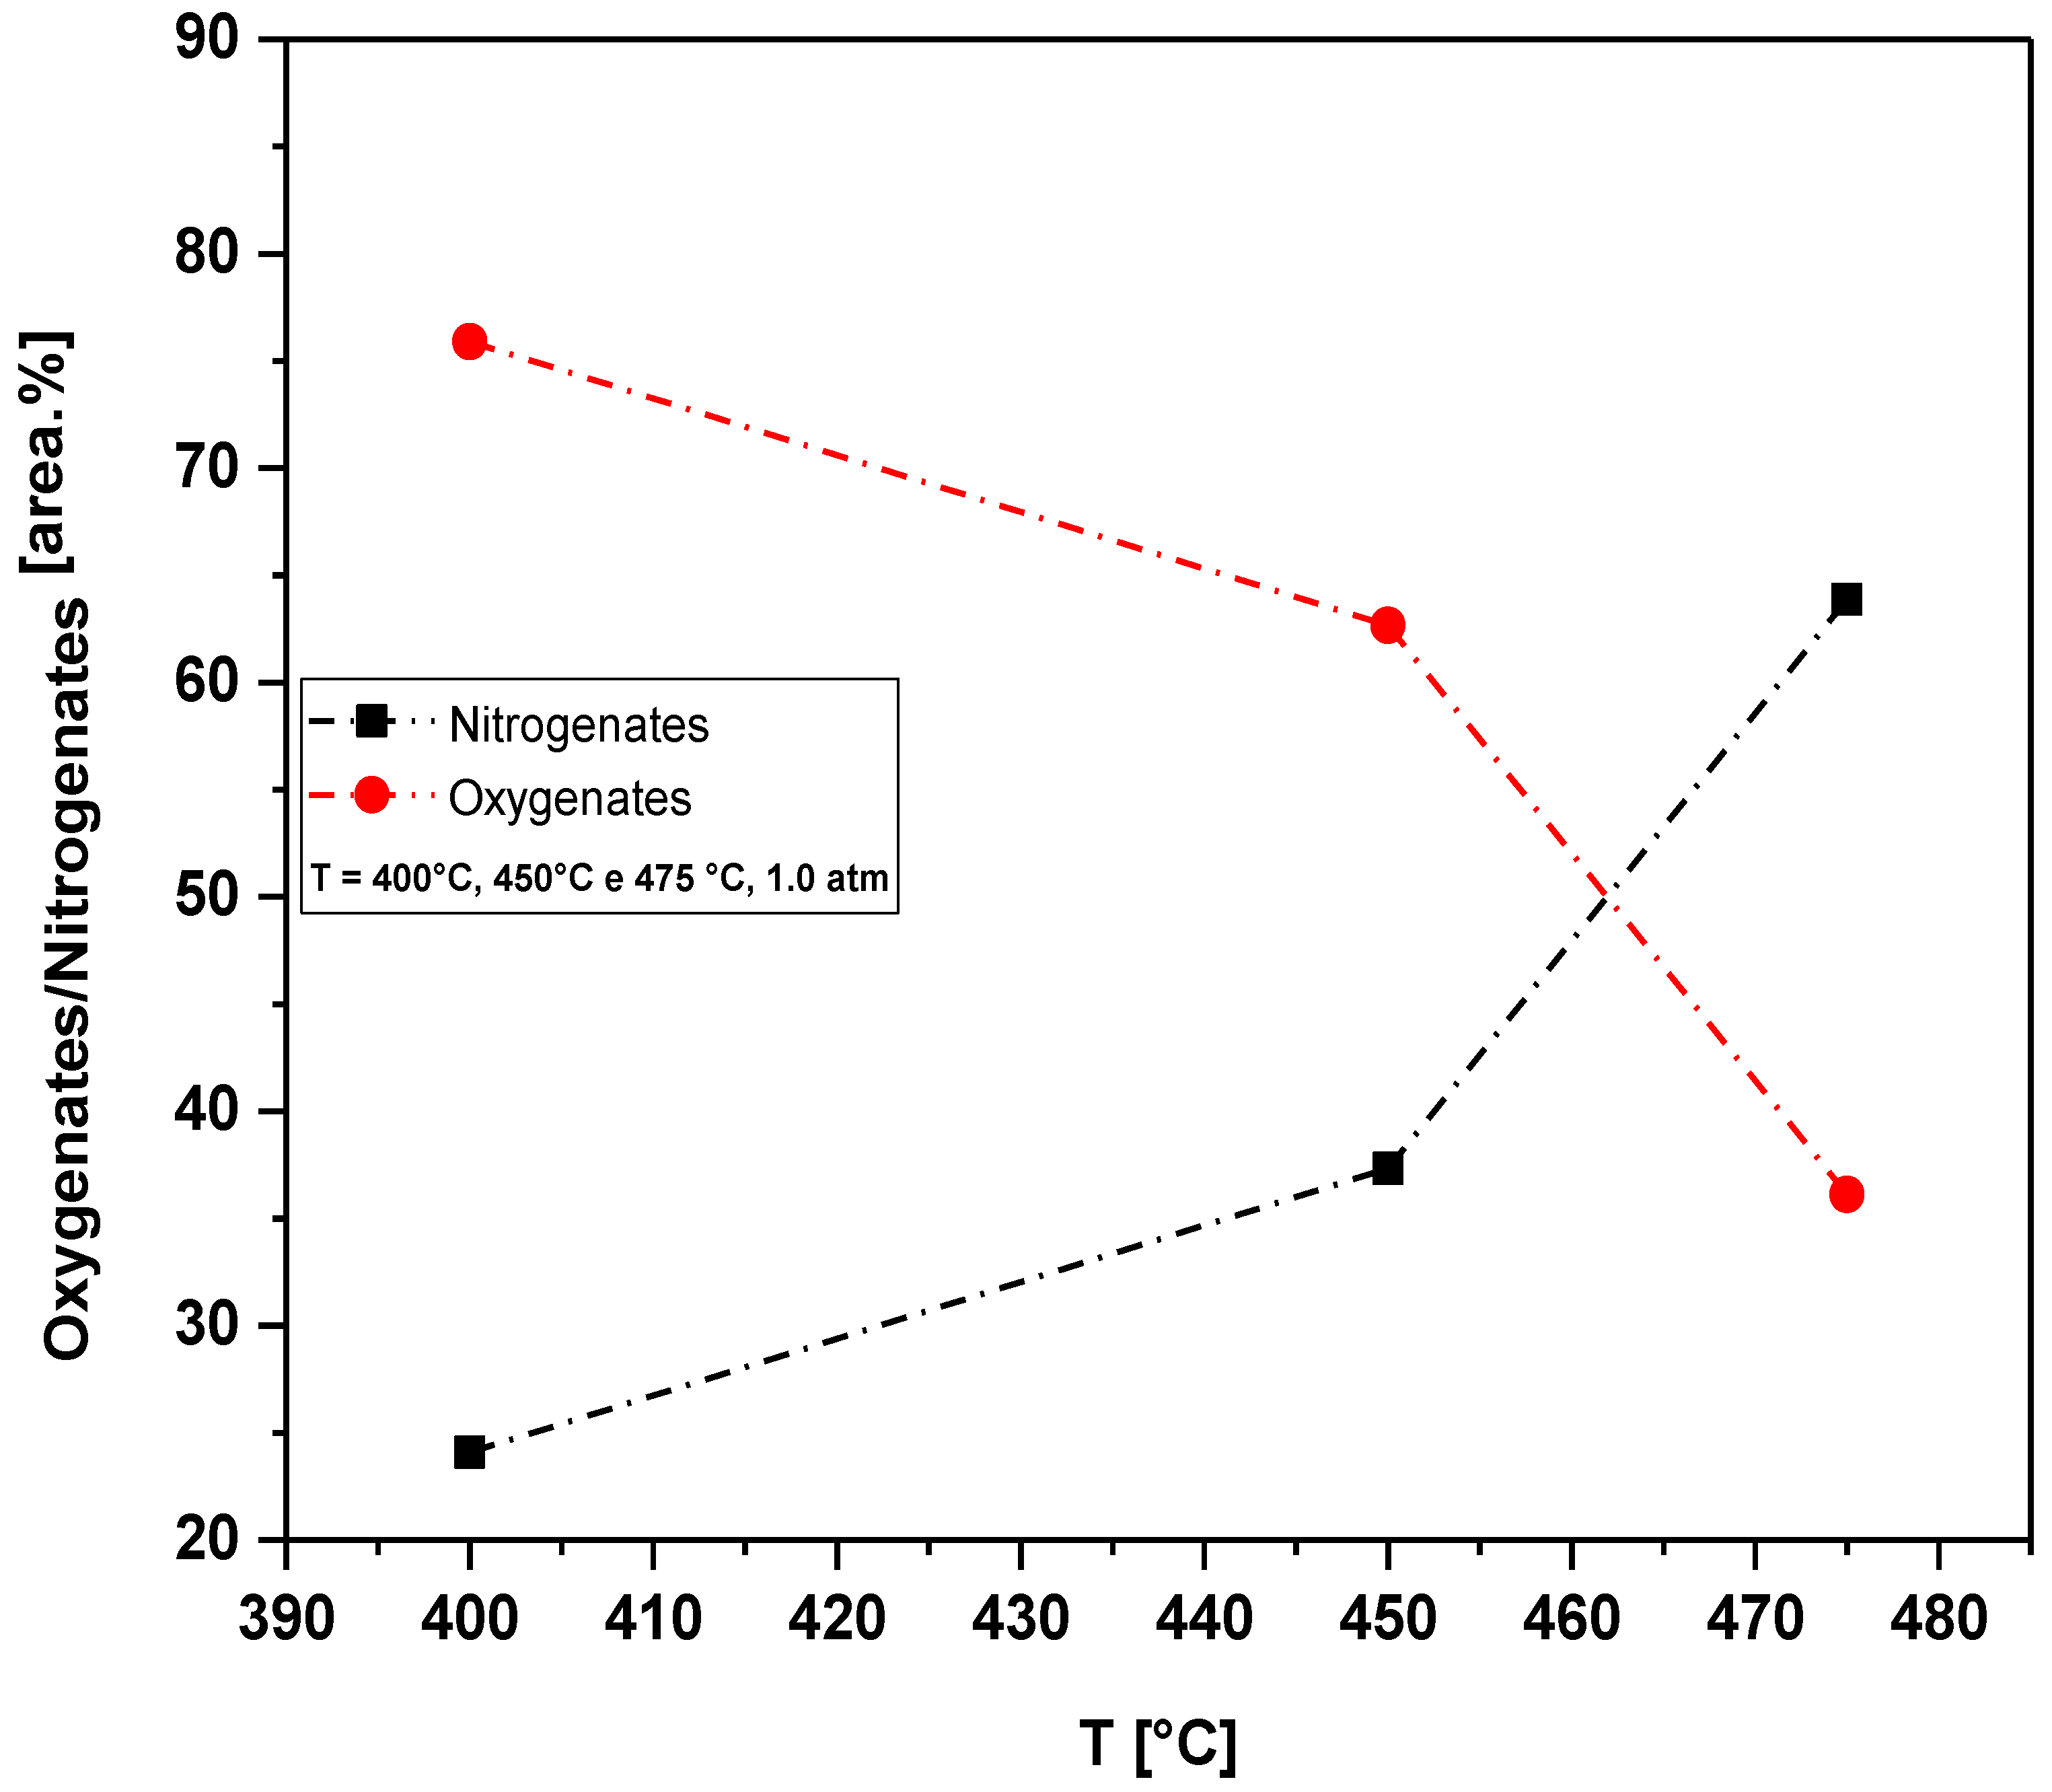
Figure 20.
Effect of the FCC/RSU ratio on the content of oxygenates, hydrocarbons and nitrogen in bio-oil obtained by catalytic pyrolysis of the MSW fraction (organic matter + paper + plastic) at 450 °C, 1.0 atm, 5.0, 10.0 and 15.0% (by mass) of FCC, on a laboratory scale.
Figure 20.
Effect of the FCC/RSU ratio on the content of oxygenates, hydrocarbons and nitrogen in bio-oil obtained by catalytic pyrolysis of the MSW fraction (organic matter + paper + plastic) at 450 °C, 1.0 atm, 5.0, 10.0 and 15.0% (by mass) of FCC, on a laboratory scale.
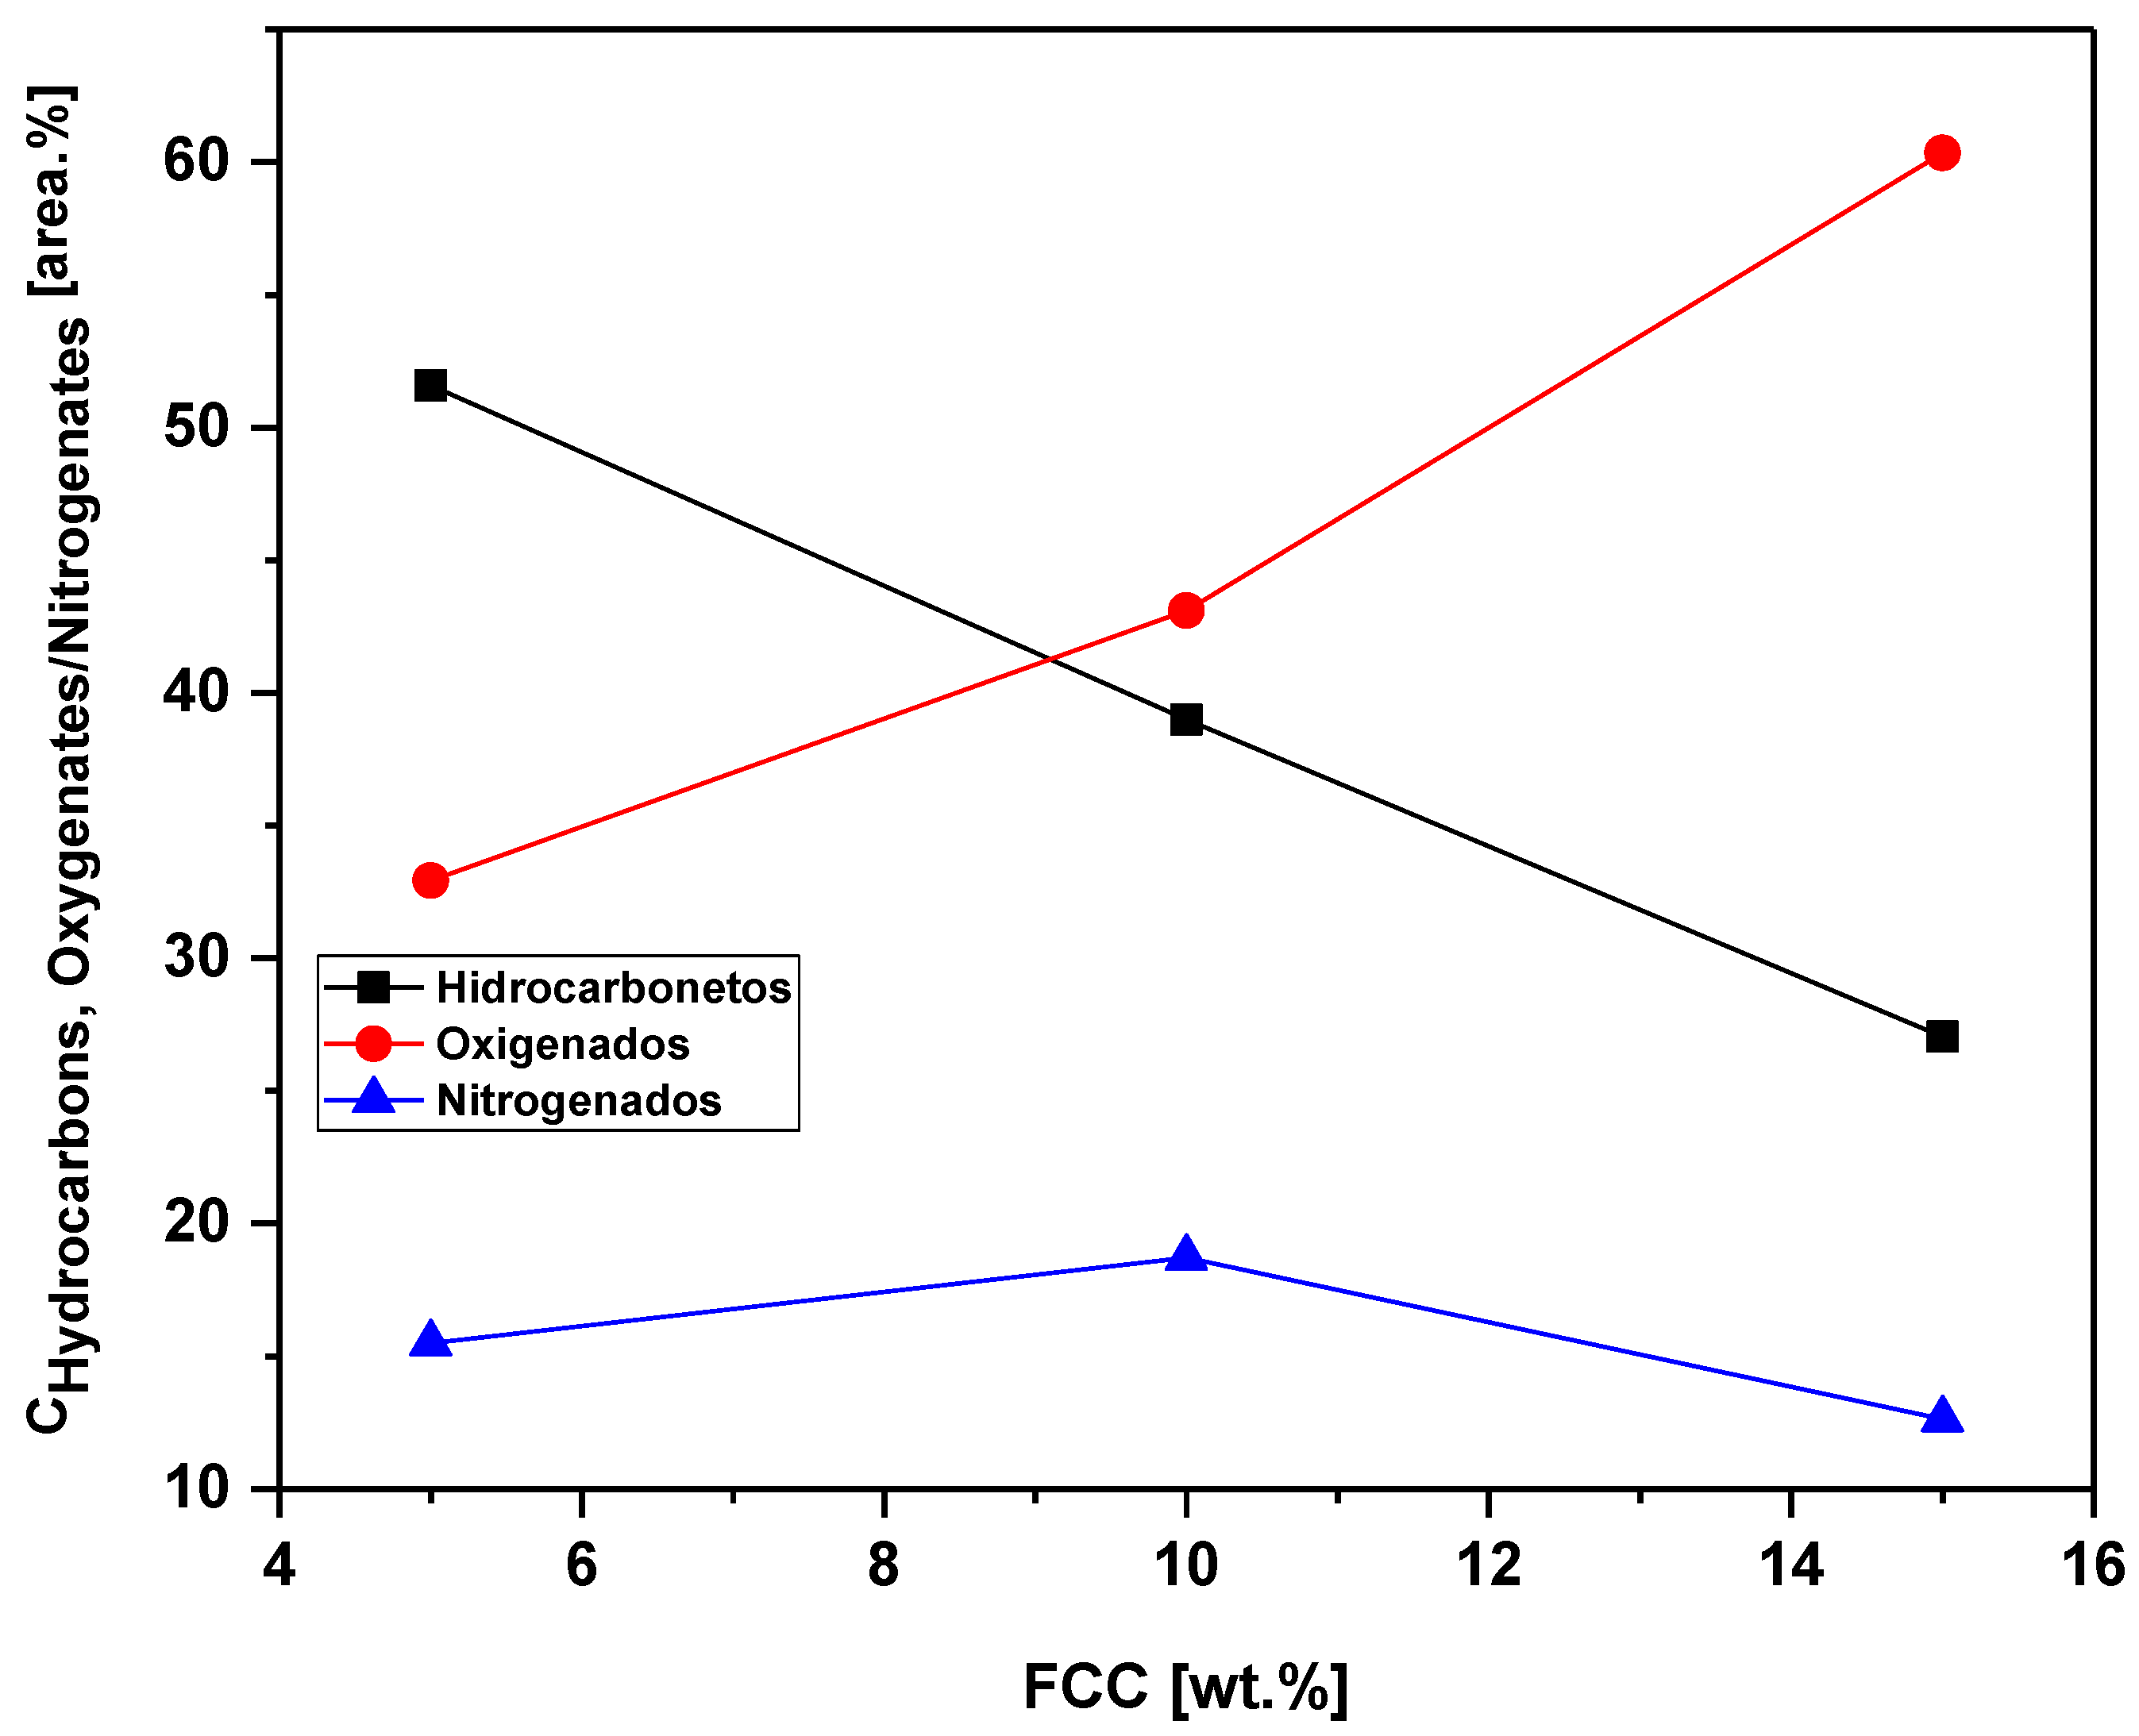

Table 1.
Socio-economic classification in the municipality of Belém-Pará-Brazil based on minimum salary [10].
Table 1.
Socio-economic classification in the municipality of Belém-Pará-Brazil based on minimum salary [10].
| Socio-economic Classification | |
| Classes | Family Income (Minimum/Basic Salary) |
| A | over 20 salaries |
| B | from 10 to 20 salaries |
| C | from 10 to 20 salaries |
| D | from 10 to 20 salaries |
| E | up to 02 salaries |
Table 2.
Laboratory-scale pyrolysis experiments.
| Experiments | Feedstock | FCC catalyst mass (%) | Temperature (°C) | Time toRetention (min.) |
| 1 | F.O + Paper +Plastic | 0 | 400 | 1h 30 |
| 2 | F. O+ Paper+ Plastic | 0 | 450 | 1h 30 |
| 3 | F.O.+ Paper+ Plastic | 0 | 475 | 1h 30 |
| 4 | F.O.+ Paper+Plastic | 5 | 450 | 1h 30 |
| 5 | F.O.+ Paper +Plastic | 10 | 450 | 1h 30 |
| 6 | F.O.+ Paper+ Plastic | 15 | 450 | 1h 30 |
Legend*: F.O.: organic fraction.
Table 3.
Percentages by mass and atomic mass of biochars obtained by pyrolysis of the fraction (organic matter + paper+plastic) of MSW at 450 °C, 1.0 atmosphere and by catalytic pyrolysis of the fraction (organic matter + paper+plastic) of MSW at 450°C, 1.0 atmosphere, with 10.0% (by mass) FCC as catalyst, on laboratory scale.
| Catalyst | ||||
| ChemicalElements | Biochar, Pyrolysis at 450 °C | Biochar, Catalytic cracking with 10% (wt.) FCC | ||
| Mass[wt.%] | SD | Mass[wt.%] | SD | |
| C | 63.1 | 0.1 | 70.6 | 0.1 |
| Ca | 6.8 | 0.0 | 2.1 | 0.0 |
| Cl | 1.5 | 0.0 | 3.5 | 0.0 |
| K | 2.0 | 0.0 | 2.8 | 0.0 |
| O | 22.3 | 0.1 | 17.3 | 0.1 |
| Na | 1.9 | 0.0 | 1.7 | 0.0 |
| Fe | 0.5 | 0.0 | 0.2 | 0.0 |
| Mg | 0.4 | 0.0 | 0.4 | 0.0 |
| Si | 0.5 | 0.0 | 0.9 | 0.0 |
| Al | 0.3 | 0.0 | 0.4 | 0.0 |
| P | 0.5 | 0.0 | - | - |
| Ti | - | - | 0.1 | 0.0 |
SD= Standard Deviation.
Table 4.
Process parameters, mass balances, and yields of reaction products (liquids, solids, H2O, and gas) by pyrolysis of MHSW fraction (organic matter + paper+ plastic) at 400, 450, and 475 °C, 1.0 atmosphere, in laboratory scale.
Table 4.
Process parameters, mass balances, and yields of reaction products (liquids, solids, H2O, and gas) by pyrolysis of MHSW fraction (organic matter + paper+ plastic) at 400, 450, and 475 °C, 1.0 atmosphere, in laboratory scale.
| Process parameters | Thermal Experiments | ||
| 400 [ºC] | 450 [ºC] | 475 [ºC] | |
| Mass of urban solid wastes (organic matter + paper + plastic) [g] | 50.01 | 50.02 | 50.02 |
| Cracking time [min] | 90 | 100 | 110 |
| Initial cracking temperature [°C] | 327 | 332 | 334 |
| Mass of solids (coke) [g] | 32.99 | 23.48 | 20.18 |
| Mass of bio-oil [g] | 4.67 | 4.72 | 4.62 |
| Mass of H2O [g] | 9.39 | 10.97 | 11.08 |
| Mass of gas [g] | 5.92 | 10.85 | 14.12 |
| Yield of bio-oil [%] | 9.34 | 9.44 | 9.24 |
| Yield of H2O [%] | 18.78 | 21.93 | 22.15 |
| Yield of solids [%] | 65.97 | 46.94 | 40.34 |
| Yield of gas [%] | 5.92 | 21.69 | 28.27 |
Table 5.
Process parameters, mass balances, and yields of reaction products (liquids, solids, H2O, and gas) by pyrolysis and catalytic cracking of urban solid wastes (organic matter + paper + plastic) at 450 °C, 1.0 atm, 5.0, 10.0, and 15.0% (wt.) of FCC, in laboratory scale.
Table 5.
Process parameters, mass balances, and yields of reaction products (liquids, solids, H2O, and gas) by pyrolysis and catalytic cracking of urban solid wastes (organic matter + paper + plastic) at 450 °C, 1.0 atm, 5.0, 10.0, and 15.0% (wt.) of FCC, in laboratory scale.
| Process parameters | 450 [°C] | |||
| 0.0(wt.) | 5.0 (wt.) | 10.0(wt.) | 15.0(wt.) | |
| Mass of urban solid wastes (organic matter + paper + plastic) [g] | 50.02 | 31.52 | 33.02 | 34.51 |
| Mass of FCC [g] | 0.0 | 1.51 | 3.01 | 4.51 |
| Cracking time [min] | 100 | 90 | 90 | 90 |
| Initial cracking temperature [°C] | 332 | 278 | 267 | 265 |
| Mechanical system stirring speed [rpm] | 0 | 0 | 0 | 0 |
| Mass of solids (coke) [g] | 23.48 | 14.43 | 12.55 | 11.01 |
| Mass of bio-oil [g] | 4.72 | 1.15 | 1.45 | 1.15 |
| Mass of H2O [g] | 10.97 | 5.40 | 6.75 | 4.04 |
| Mass of gas [g] | 10.85 | 9.01 | 9.26 | 13.80 |
| Yield of bio-oil [%] | 9.44 | 3.83 | 4.83 | 3.83 |
| Yield of H2O [%] | 21.93 | 17.99 | 22.49 | 13.47 |
| Yield of solids [%] | 46.94 | 48.08 | 41.82 | 36.70 |
| Yield of gas [%] | 21.69 | 30.01 | 30.86 | 54.00 |
Table 6.
Effect of temperature on the acid index of bio-oils and aqueous phase by pyrolysis of MHSW fraction (organic matter + paper+plastic) at 400, 450, and 475 °C, 1.0 atm, in laboratory scale.
Table 6.
Effect of temperature on the acid index of bio-oils and aqueous phase by pyrolysis of MHSW fraction (organic matter + paper+plastic) at 400, 450, and 475 °C, 1.0 atm, in laboratory scale.
| Physicochemical Property | Temperature | ||
|---|---|---|---|
| Acid Index | 400 °C | 450 °C | 475 °C |
| I.ABio-Oil [mg KOH/g] | 61.86 | 73.71 | 96.08 |
| I.AAqueous Phase [mg KOH/g] | 74.83 | 56.96 | 45.25 |
Table 7.
Effect of FCC content on the acid index of bio-oils and aqueous phase by catalytic cracking of MHSW fraction (organic matter + paper+plastic) at 450 °C, 1.0 atm, 5.0, 10.0, and 15.0% (wt.) FCC, in laboratory scale.
Table 7.
Effect of FCC content on the acid index of bio-oils and aqueous phase by catalytic cracking of MHSW fraction (organic matter + paper+plastic) at 450 °C, 1.0 atm, 5.0, 10.0, and 15.0% (wt.) FCC, in laboratory scale.
| Physicochemical Property | 450 °C | ||
| FCC | |||
| Acid Index | 5.0% (wt.) | 10.0% (wt.) | 15.0% (wt.) |
| I.ABio-Oil [mg KOH/g] | 75.60 | 86.90 | 81.25 |
| I.AAqueous Phase [mg KOH/g] | 55.83 | 64.31 | 72.40 |
Table 13.
Effect of temperature on the chemical composition, expressed in oxygenates/nitrogens, of bio-oils obtained by pyrolysis of the MSW fraction (organic matter + paper+plastic) at 400, 450 and 475 °C, 1.0 atm, on a laboratory scale.
Table 13.
Effect of temperature on the chemical composition, expressed in oxygenates/nitrogens, of bio-oils obtained by pyrolysis of the MSW fraction (organic matter + paper+plastic) at 400, 450 and 475 °C, 1.0 atm, on a laboratory scale.
| Temperature [°C] | Concentration [%area.] | |
|---|---|---|
| Oxygenates | Nitrogenates | |
| 400 | 75.89 | 24.11 |
| 450 | 62.67 | 37.33 |
| 475 | 36.12 | 63.88 |
Disclaimer/Publisher’s Note: The statements, opinions and data contained in all publications are solely those of the individual author(s) and contributor(s) and not of MDPI and/or the editor(s). MDPI and/or the editor(s) disclaim responsibility for any injury to people or property resulting from any ideas, methods, instructions or products referred to in the content. |
© 2024 by the authors. Licensee MDPI, Basel, Switzerland. This article is an open access article distributed under the terms and conditions of the Creative Commons Attribution (CC BY) license (http://creativecommons.org/licenses/by/4.0/).
Copyright: This open access article is published under a Creative Commons CC BY 4.0 license, which permit the free download, distribution, and reuse, provided that the author and preprint are cited in any reuse.


