Submitted:
30 March 2024
Posted:
01 April 2024
You are already at the latest version
Abstract
Auxins are chemical compounds of wide interest, mostly due to their role in plant metabolism and development. Since the latter half of the XX century, synthetic auxins have been used as herbicides, presenting notable advantages, such as low toxicity in humans. As of today, extensive descriptions of syntetic and natural auxins have been made; yet studies centered on the molecular recognition process of auxins are scarce. Herein, we present a comprehensive in silico characterization of auxin receptor TIR1, using structure based methods to aid de novo design of putative ligands. In addition, we conducted binding site characterization using cosolvent molecular dynamics and enhanced sampling simulations with reference ligands. We also present a database of putative auxins and decoy compounds which can aid further studies focusing on synthetic auxin design. To the best of our knowledge, this study is the first of its kind focusing on TIR1.
Keywords:
Herbicides
; auxins
; molecular dynamics
; machine learning
1. Introduction
Agricultural production is fundamental from an economic and nutritional standpoint. It has been estimated that from 1961 to 2020, food production from agricultural sources has increased significantly, with current per capita values rounding almost 3200 kcal/day, at the end of the supply chain [1]. Yet, the annual State of Food Security and Nutrition in the World (SOFI) report published by the Food and Agriculture Organization (FAO) showed that more than 700 million people faced hunger in 2022 [2]. Thus, there is a pressing need to improve food security, which translates to the assurement of higher crop yields.
Some of the main problems that pose a significant challenge to safe, productive and sustainable agricultural practices are the herbicide resistance and toxicity. Firstly, there have been several documented cases of resistances of weeds to several chemical groups worldwide since the discovery of herbicide resistance in common groundsel (Senecio vulgaris) to triazine herbicides in 1968 [3,4]. Nowadays, herbicide resistance is globally widespread, affecting 96 crops across 72 countries. This phenomenon has been documented in 513 distinct instances, involving 267 weed species that have developed resilience against herbicides [5]. Secondly, despite the generally low mammalian toxicity of many newly developed herbicides, growing experimental evidence indicates that exposure to these chemicals can have detrimental effects on the development and/or reproduction of various mammalian species. Notably, 2,4-D (2,4-Dichlorophenoxyacetic acid) and its combination with 2,4,5-T (2,4,5-Trichlorophenoxyacetic acid) have been associated with reproductive issues and malformations in humans [6].
Auxins can be regarded as phytohormones, metabolically derived from L-Tryptophan, responsible for plant growth and development [7]. With Indole-3-acetic acid (IAA) being the most well-known example of such compounds, often deemed as the “master hormone” in plants [8]. Since the 1940s, synthetic derivatives from IAA have been developed and tested, with notable examples being naphthalene acids (1-naphthalene acetic acid); phenoxycarboxylic acids (MCPA, 2,4-D); benzoic acids (dicamba); pyridinecarboxylic acids (e.g., picloram), and quinolinecarboxylic acids (quinmerac, quinclorac); all of which showed strong responses in plants, inducing damage at high concentrations while eliciting higher stability when compared to IAA [9]. Auxin compounds reached peak commercial success as herbicides, just in 2000, synthetic auxins accounted for roughly 1.3 billion USD, approximately 9% of total sales that year [10].
The intricate auxin signaling pathway is orchestrated by at least three protein families: transport inhibitor response/auxin signaling F-box (TIR1/AFB) proteins, auxin/indole-3-acetic acid (Aux/IAA) transcriptional repressors, and auxin response factor (ARF) transcription factors (Yu 2013). At the heart of this signaling cascade lies the TIR1 which is part of a small family of F-box proteins comprising five additional AFB proteins (AFB1-AFB5). These six proteins collectively function as auxin receptors [11]. Auxin transport occurs within and between cells via PIN, ABCB, and AUX/LAX transporters. Then interacts with the SCFTIR1/AFB complex, which upon creation of the SCF-auxin-Aux/IAA complex, triggers the ubiquitination of Aux/IAA transcriptional repressors, leading to the activation of auxin response genes [12]. Therefore, auxin exerts its regulatory influence by directly binding to TIR1, promoting the interaction between SCFTIR1/AFB and Aux/IAAs. This interaction doesn't induce any conformational changes; instead, auxin acts as a molecular glue, facilitating the formation of a binding pocket for the Aux/IAA protein within the TIR1 structure [13].
Herein, we present an in silico profiling of TIR1 binding, coupled with a pipeline for de novo design based on machine learning. We hope this study serves as an initial step towards further optimization in synthetic auxin design, as these molecules can provide additional tools not just as herbicides, but as molecular guidelines for engineering of plant growth and development [14] .
2. Materials and Methods
2.1. De Novo Design of Putative Auxins and Molecular Decoys
The crystal structure of the TIR1/SCP complex of Arabidopsis thaliana was obtained from the Protein Data Bank. The PDBID 2P1P was selected as its values for resolution, R-free and R-work are very good, also it is co-crystallized with IAA. The protein was then preprocessed with PDBFixer to add hydrogens, IAA and the co-factor were removed prior to modelling.
The program OpenGrowth [15] was used for de novo generation of molecules within the binding site for IAA. As OpenGrowth uses Openbabel as backend for compound minimization and atom typing the version 2.4.1 was manually compiled. Parameters for OpenGrowth were implemented as described in Table S1 in the Supplementary Information. Minimization was carried out using the MMFF94 force field and the SMoG2016 scoring function was used for ligand ranking. In the end, more than 1200 ligands were generated with these settings. A heuristic threshold of -8.0 kcal/mol was applied to select candidates for virtual screening.
To establish a set of non-binders, molecular decoys were obtained with Deepcoy [16]; these were generated to match DUD-E descriptors in a 150:1 decoy-to-reference ratio following selection of top decoys using the provided DeepCoy scripts.
As proof of concept, two sets of molecular descriptors were obtained: Lipinski space, composed by molecular weight (MW), topological polar surface area (TPSA), cLogP, rotable bonds, number of H-bond acceptors, and donors. A second set was selected from the molecular descriptors available in Mordred [17]. Feature selection was first performed by discarding those with zero variance and with less than three different values (semi constant variables). Highly correlated descriptors were also excluded, i.e., those with a Kendall correlation coefficient higher than 0.9; the final set contained 395 of the original 1613 variables. Then a subset of features was selected using the Boruta algorithm [18], these are listed in Table S2*, in the Supporting information. Finally, these chemical spaces were visualized via principal component analysis (PCA) and t-SNE using DataWarrior [19].
2.2. Machine Learning
To evaluate the overall pertinence of the generated compounds, we trained different classifiers as proof of concept. These included logistic regression (LR), supporting vector machines (SVC), random forest (RF), and extreme gradient boosting classifiers (xgboost classifier; XGBC). The comparison was performed with Scikit-learn (v.1.2.2) [20] and XGboost [21] Python modules. Each model was trained and validated by ten-fold cross-validation, grid search optimization was used to tune their respective hyperparameters [22]. Each compound was represented as a concatenated vector of molecular descriptors selected with Boruta; then a second iteration was made adding topological information: extended connectivity fingerprints (ECFP4), WHIM and GETAWAY descriptors, calculated with RDKit (v.2022.9.5) [23]. Given the numerical features differences, each representation was standardized, subtracting the mean and scaling to unit variance using Scikit-learn.
Classification performance was evaluated with several measures, including: validation curves, learning curves, ROC curves, Matthews correlation coefficient and detection error trade-off curves.
2.3. Molecular Modelling of Auxins
To better understand molecular recognition by TIR1, we conducted a comprehensive characterization with structure-based methodologies, including mixed-solvent molecular dynamics, conventional molecular dynamics and enhanced sampling with coarse metadynamics. Detailed information is provided in the following subsections.
2.3.1. Mixed Solvent Molecular Dynamics
In order to gain additional information on the plasticity and overall presence of hotspots, within TIR1, molecular dynamics with mixed solvents was used. For this, the MXMD script [24] was modified to include the probes included in Scheme 1.
A modified version of the Ghanakota et al. protocol was used [25]; briefly, the protocol involves the creation of replica systems with a volume/volume concentration of 95/5% (water/probe). MXMD uses pre-equilibrated boxes of the selected cosolvent probe which is then incorporated in a cubic box of water buffering the whole system by 15 Å. These systems were then submitted to default relaxation protocol and 15 ns of equilibration time. Production times were set to 20 ns, as it provides a good compromise between sampling and computing time [26]. Each MXMD run consisted of 15 simulations; three for each probe, accounting for an overall sampling of 300 ns. MXMD simulations were carried out with PDBIDs 2P1M, 2P1P and 2P1N; which are TIR1 structure without ligands, just IHP cofactor, bound to IAA and bound to 2,4-D; respectively.
Hotspots were then evaluated by the following score:
Where Zxyz is the occupancy of functional groups of the probes, converted to Z-scores using the following equation:
2.3.2. Assessment of Pocket Solvation and Its Role in Auxin Recognition
Molecular recognition is often grounded on the “desolvation paradigm”, which considers that water molecules need to be displaced by ligands during binding events [27]. Only recently, this notion has been challenged, with the discovery of protein families such as bromodomains, which possess a tightly bound water network, serving as enthalpy control for ligand binding [28]. Plus, it has been shown that robust description of binding modes is more consistent when ligands are properly solvated [29,30].
Thus, we conducted a series of simulations under different starting conditions, using the following PDBIs 2P1N, 2P1O, 2P1P and 2P1Q. Structures were prepared with pdbfixer in order to add missing atoms and/or residues, and then submitted to the protein preparation wizard in Maestro. Hydrogen bonds were optimized using PropKa, finally two replicas of complexes were obtained: one preserving water molecules in the vicinity of co-crystal ligands and one without them. These structures were then submitted to the System Builder utility to buffer them in orthorhombic boxes of TIP3P water and NaCl at 0.15 M.
TIR1-ligand complexes were then submitted to molecular dynamics simulations using Desmond (v.6.1) [31]. Systems were parametrized with the OPLS_2005 force field, simulation, integration was carried out with the RESPA algorithm using an inner timestep of 4 fs and 8 fs for far timestep. Hydrogen mass repartition scheme was implemented to allow the increase in timesteps [32]. The prepared system was relaxed using Desmond’s default protocol which includes Brownian dynamics and an equilibration period to attain NVT and NPT conditions. Target values were 300 K for temperature and 1 atm for pressure. Following system relaxation the complex was equilibrated for 50 ns under the NPT ensemble, using MTTK barostat and Nosé-Hoover chain thermostat. Production runs of 500 ns for both replicas were obtained and analyzed for protein-ligand contacts, RMSD, RMSF and interaction transition networks.
Finally, we tested pocket solvation using grand-canonical Monte Carlo (GCMC), as it is a well-established method to achieve reasonable results [33,34,35,36]. As proof of concept, we selected the IAA/Tryptophan pair, each complex prepared as described above. Solvation protocol made use of the GCMC plugin in Desmond, defining the MC region in a buffer of 6 Å around ligands; solvent parameters were default values for TIP3P water, similar to those described elsewhere [37].
Simulations were carried out in five stages, beginning with GCMC/MD with restraints on heavy atoms. Consisting in 10 000 MC moves per cycle and a total of 500 ps of MD. This stage was followed by GCMC/MD with 100,000 moves per cycle, 1 ns of MD and no restraints. Systems were then relaxed with small runs of Brownian dynamics and Langevin dynamics for equilibration of volume and pressure; integration timestep was kept at 2fs and 4fs using the RESPA integrator. An additional equilibration of 10 ns using MTTK barostat and Nosé-Hoover thermostat was carried out, this step also used hydrogen mass repartition to increase timestep to 4fs and 8fs. Finally, production runs of 500 ns were made for each ligand keeping conditions from the previous stage.
2.3.3. Molecular Dynamics
We devised a series of comparisons between known ligands and chemically related “decoys''. Selected compounds included: IAA/Tryptophan; α-naphthylacetic acid/β-naphthylacetic acid; Diclophenac/Rinskor and Fluroxypyr/Quinclorac. By decoy, we intended to have a low affinity/non-binder for TIR1, based on experimental data [38,39]. As a first step, compounds were docked to PDBID 2P1P using PLANTS software, as it is a well-established method with high accuracy and consistency in the identification of putative binding modes [40,41,42,43]. Ligands were prepared using SPORES [44], to obtain proper input for PLANTS. The binding site was defined in a sphere with a radius of 15 Å, centered with IAA’s crystallographic coordinates. Additional parameters were kept at default values.
The protocol was the same as the generated compounds. The top ranking pose was selected for molecular dynamics simulation. Trajectory analysis was done under MDTraj (v.1.98) [45]. TIR1-auxin contacts were used to define the microstates to construct the networks. Interaction fractions were obtained with Maestro utilities and concurrence maps were calculated using ContactMap explorer (v.0.7.0) [46].
2.3.4. Coarse Metadynamics
To evaluate the metastability of binders and decoys, well-tempered metadynamics was used. This is a common method used to assess binding mode stability and overall affinity [47,48,49,50,51]. Simulation parameters were kept the same as from classical simulations. Collective variables (CVs) are selected degrees of freedom which are related to the desired reaction coordinate; in this case CVs were defined using distances between centers of mass, for the protein residues 435-437 and ligand’s heavy atoms; second CV was WHIM’s second principal moment for ligand’s heavy atoms. Gaussian height was set to 0.08 kcal/mol, with a width of 0.25 Å. The bias factor was set to 5.0 and Gaussians were deposited every 250 steps.
Additionally, we probed the role of the so-called engagement niche, a region composed by residues K410, S440, G441, A464, P465 [52]. For this case, compounds were docked at a centroid of these residues in PDBID 2P1M, CVs were kept the same. Both metadynamics simulations had production times of 50 ns.
3. Results & Discussion
3.1. De novo Design of Putative Auxins and Decoys
Using principal component analysis, we made a projection of the chemical spaces described in the methods section, loading values can be found in Table S3, in the supporting information. Figure 1 shows the chemical space delimited by the selected descriptors with Boruta. It can be seen that there is good superposition between generated binders and decoys in both principal component analysis (PCA) and t-distributed stochastic neighbor embedding (t-SNE). This suggests that classes may not be linearly separable, a similar behaviour is seen for the Lipinksi space (Figure S1). Such a trait is positive, as it shows that decoys are indeed robust due to sharing similar physicochemical spaces, which in turn may lead to effective discrimination of its latent space with a good value as screening tools.
Plus, this lack of clear separation underscores the challenge of distinguishing these classes. As it has been shown that overreliance on molecular properties can lead to negative effects such as molecular inflation [53,54].
With this, we concluded that a good baseline was established and proceeded to test the pertinence of these compounds using machine learning algorithms.
3.2. Machine Learning
Classification and prediction of biological activity based on latent spaces has been attempted since early quantitative structure activity relationships (QSAR). Still, after several decades and unexpected results it became clear that QSAR are hardly linear in nature [55] with the added complexity of highly similar compounds with highly variable biological activity; an issue now defined as activity cliffs [56] or even activity ridges, when said concept is found consistently in certain scaffolds and not just compounds [57].
With the rise of the Rule of Five [58], the existence of latent spaces for drug discovery gained traction once more. As of today, the notion of a druglikeness profile has been challenged [59]. Herein, we do not intend to find a set of empirical rules to characterize putative auxins, but rather a good starting point for chemical space exploration and expansion. We aim to provide a setting stone of sorts, to aid rational design of auxins and related agents.
To this end, we used the generated compounds to train commonly reported classifiers, in order to verify chemical space coverage and the overall significance of structural information within our data set. For classification problems several methods are used in conjunction to evaluate the accuracy and consistency of predictions. Hereunder we selected a combination of four measurements that convey a general picture of both data and model’s performance:
a) Validations curves: As these help to visualize the trend of variance and suggest the presence of bias; either underfitting or overfitting.
b) Learning curves: Which convey information on the learning rate as a function of n in data; i.e., if the provided examples are enough for effective classification or if the addition of data can benefit scoring.
c) ROC curve & Matthews correlation coefficient (MCC): These provide a general description of the predictive power and can be linked to the confusion matrix. The inclusion of both is complementary, as MCC can take values between -1 and 1, it is possible to assess if a model is indeed providing a significant difference when applied or if its success relies more on chance. Even when the area under the curve of the ROC plot would suggest otherwise.
d) Detection error trade-off: Similar to the ROC curve, this metric gives information on the success of classification tasks. During classification, there is always a trade-off between the rate of falsely classified values; therefore this plot conveys the trend of said trade-off; an ideal classifier would keep a low rate of either false positives and negatives, resulting in a curve downward and to the left, an inverse of sorts to an expected ROC curve.
The plots for the first three metrics for all classifiers can be found in the supplementary information (Figures S2-S9). ROC curve and Error trade-off for the models with the best parameters are shown in Figure 2.
As expected, models trained solely with physicochemical data showed low performance. Based on area under ROC curves, algorithms based on linear methods performed worst. Plus, it is quite significant that classifiers were barely superior to random chance. When analyzing the detection error trade-off, it also gives an almost linear trend. This suggests that any improvement in the discrimination of either false positives or negatives inherently results in an increase of misclassification of the other. This underscores that proper discerning between auxins and non-binders is no easy task, even random forest and supporting vector classifier had poor performance, which are often regarded as robust, for chemical information applications due to their non-linear approach [60,61,62,63,64]. In addition, these classifiers showed a strong tendency to overfitting (Figures S4 and S6 in the supporting information).
Even if these results seem negative, such is not the case, as this verifies that molecular decoys are robust indeed. A common use case of molecular decoys is for structure-based design; i.e., decoys should be molecules that share chemical space with actives, with little to none pharmacophoric similarity. The quest for such compounds resulted in the construction of datasets such as DEKOIS [65] or most notably DUDE-Z [66]. Only recently, use cases have been extended to ligand-based methods and scoring function construction [67,68]. Hence, for our case at the very least, we have confirmed that decoys do share the chemical space from selected descriptors, but also a very representative one for small molecules (Ro5 space or Lipinski space).
To confirm the second half of the provided definition, topological and structural features shall be more conclusive in this classification test. Indeed addition of these proved very significant, as the area under ROC curves increased roughly by 0.2 in all cases. Random forest classifier had the lowest AUC value, consistent with its MCC and error trade-off. Following this logic, it would seem that logistic regression was the top performer; yet, its MCC was 0.53. For this test non-linear methods were more consistent and performed well, at first glance SVC would seem the superior choice; then again when comparing MCC values suggests that XGBC would be preferred.
Generally speaking, our goal was achieved, as the generated compounds do serve as a reasonable sample for further analysis,while conveying enough information on true binders. Still, there is no denying that the rate of false negatives remains quite high even at notable trade-off values and thus major incidence of false positives. To some extent, this result was to be expected, as no computational method is completely accurate and reliable on its own. From here, we analyze the results of structure-based methods to provide further information on what characterizes a true binder of TIR1.
3.3. Molecular Modelling of Auxins
3.3.1. Mixed Solvents Molecular Dynamics
Structural alignment suggests little variation between conformations of TIR1; nonetheless, in a dynamic context substantial differences may arise [69,70]. Hence, to attain a comprehensive description and knowledge on these factors, we conducted molecular dynamics with mixed solvents. During drug discovery campaigns, molecular design can follow a fragment-based approach. A coarse description of the technique is that protein structures are crystallized iteratively, in the presence of probe scaffolds or leads. Thus, creating an empirical mapping on which fragments bind more effectively and where does this occur [71].
A computational equivalent of this can be found in molecular dynamics with mixed solvents, where a rather discrete amount of polar solvent molecules is introduced to the simulation cell. Following an equilibration period, the probe molecules will interact with the protein, and therefore occupancy of these can be evaluated and further compared. A notable advantage of the computational variation is that calculation of occupancy can be made from different probes from independent simulations. Which in turn increases descriptive power and can be used to delimit allosteric or even cryptic pockets within proteins [72].
We conducted 45 independent simulations accounting for 900 ns; using three main conformations of the auxin binding pocket. Figure 3 shows the computed surfaces from this sampling. It can be seen that the auxin binding pocket had the highest scoring, indeed. However, significant changes in the neighboring region to the engagement niche. Additional changes included the orientation of F79, 82 and 380.
In general, the conformational variations in TIR1 pocket changed the shape of the druggable regions. Overall, the ring shape is suggestive of the known mechanism of auxins, as these stabilize the protein-protein interface. Considering that said shape is notable in 2P1N, its worth considering the link between ligand polarity and pocket dynamics. As for individual probes, for 2P1M the probes with major occupancy were N-methylacetamide and acetohydroxamic acid. In contrast, 2P1P and 2P1N showed a major occupancy of druglike-probes, particularly imidazole.
3.3.2. Assessment of Pocket Solvation and Its Role in Auxin Recognition
As stated in the methods section, only recently the role of pocket solvation has been critically assessed within the context of small molecule binding. Based on crystallographic structures it does seem that TIR1 has several water molecules that could participate in auxin binding [73]. To determine the contribution to recognition and binding we compared protein-ligand interaction under different starting conditions of solvation (Figure 4).
Notable differences arise when comparing interaction profiles, major changes are the contact with R436, which is mostly driven by water bridges; suggesting a change in ligand orientation and directionality. Similarly, it seems that water interactions are significant within the engagement niche. H78 also shows subtle differences, it is difficult to assess if these are the result of solvation or merely the nature of numerical simulation. Another subtle effect is the change of hydrophobic contacts to stacking interactions, it can be argued that due to the lipophilicity of auxins these are prone to the latter. However, considering the cases of NAA and 2,4-D (2P1O and 2P1N, respectively) interaction distribution and persistence did change significantly due to the solvation environment. Figures S11 and S12 show some examples of this (vide infra).
For further proof, we constructed transition networks based on protein-ligand interactions. Briefly, the networks encode microstate information which can be related to metastability and with enough data it can confer kinetic information [74]. Thus, it is very important to delimit which information is used to describe said microstates; hence, an additional criterion was introduced, networks were constructed with and without the inclusion of water bridges in their definition. Figure 5 shows the obtained transition networks, overall it can be seen that just as previously suggested, the inclusion of water-ligand interactions has a significant impact. metastability was present in all three simulations with crystal waters; yet, this trait is further accentuated by the introduction of water bridges to microstate definition. Such behaviour is more noticeable in the synthetic auxins, which provides further support to the previous argument on the role of ligand polarity.
In stark contrast, networks without preservation of crystal water were highly variable. For the case of IAA (2P1Q) are reversal pattern is observed, as it shows some degree of metastability and a densely populated network. NAA on the other hand showed highly transient interactions, some states are indeed revisited but no apparent clustering arises under these conditions. Omission of water bridges does result in a more complex network but the transient nature of contacts persists. Finally, for 2,4-D metastability is clearly shown, suggesting a local minima or basin. Overall the inclusion of water mediated interactions did improve the representation and gave a more robust description of basins and metastability.
It can be argued that such observations are to be expected due to the complex nature of binding and the balance of enthalpic and entropic contributions. Nonetheless, our aim is not to strictly evaluate the role of water interactions, but their general contribution to discern between binders and non-binders. To this end, we conducted GCMC/MD simulations with IAA and TRP. For these simulations PDBID 2P1P was used, comparison was between a common MD protocol and GCMC/MD, using similar analyses described above. Figure 6 shows protein-ligand interactions retrieved from IAA and TRP. It can be seen that for the most part the GCMC/MD protocol was successful in establishing a water network were the main bridge between ligand and R436 is present. This is a very positive result as it highlights the robustness of the method and its placement of solvent molecules.
On the other hand, the interaction profile remains consistent and similar to those in the previous simulations. Providing further proof on the significance of water bridges in microstate definition. For IAA perhaps a notable change is the dominant stacking interaction with F79, instead of a hydrophobic contact. Due to this, we made a structural alignment and binding site superposition of TIR1 crystal structures; i.e., PDBIDs 2P1M, 2P1P, 2P1Q, 2P1O and 2P1N. Results of this alignment are shown on Table 1.
Based on these alignments, F79 and 82 are consistently flexible between structures. A notably higher deviation is shown precisely between 2P1P and 2P1Q; which possibly accounts for this transition between hydrophobic and stacking interactions. This together with the observed changes in molecular dynamics with mixed solvents, reinforce the importance of stacking interactions within the binding pocket.
Other residues showing changes between TIR1 conformations are H78, L439 and A464. With the latter being more displaced when 2,4-D is bound to TIR1. This trait is noteworthy as A464 belongs to the engagement niche. Perhaps the observed variation for L439 can also be linked to the presence of water bridges. Unfortunately, this was only observed for IAA so a clear reason remains elusive. Nevertheless, this may be due to the presence of nitrogen in the indole scaffold, a feature absent in other binders under study. Still previous studies have suggested that the presence of this heteroatom is paramount, for potency and overall affinity of IAA [75].
In contrast, one of the most consistent residues was R436; which in turn suggests that the water bridge between it and auxins can be regarded as “canonical” and not anecdotal behaviour. Plus, considering the complete absence of said bridge in conventional protocols is very interesting. A similar case was obtained in 2P1O where the bridge was not formed under standard conditions. Of note, simulations of both 2P1Q and 2P1N were able to form this interaction. The fact these subtle variations within the binding site of TIR1 introduce such divergent results is remarkable. Also, this stands as a cautionary tale for the well known limitations of structure base methods, while highlighting that structure selection is no trivial matter [76,77]. Thus, it seems that 2P1P is prone to the loss of ligand-solvent interactions; whereas 2P1Q and 2P1N may yield more reliable and consistent results. For further assessment, we analyzed root mean square fluctuation of auxins in these sets of simulations (Figs S10-S13).
Considering IAA and TRP in 2P1P, RMSF plots indicate higher fluctuation when water molecules are correctly placed in the pocket. Under standard protocol, the fluctuations are significantly suppressed, more so for IAA’s case. For both ligands, higher fluctuation was observed in the nitrogen’s side of the scaffold. This is worth mentioning as this part of the molecule faces in the vicinity of F79. When comparing to NAA and 2,4-D interesting patterns were found, for the former the fluctuation profile was very consistent, with respect to its fit in the binding site. The main difference being found on the carboxylic acid moiety, which may be explained by the loss of the water bridge with R436. For 2,4-D, fluctuation profile changes but in contrast to IAA, TRP and NAA, higher values were observed under standard conditions. Due to this, and considering that atoms showing this behaviour were both chlorines and the carbon atoms of this side of the phenyl ring; this is yet another case where the solvation environment is the main driving force.
As for ligand’s fit, fluctuation was very consistent and almost unaffected. In all cases the highest value was found in the charged oxygen, for TRP this is to be expected due to the amino group. Beyond that, only 2,4-D showed differences in fluctuation for this atom between protocols.
3.3.3. Molecular Dynamics
Considering prior results, we used an integrative approach for the analyses of known binders and non-binders. In an attempt to facilitate the correct assessment of binding; we propose the use of protein-ligand interaction fractions; concurrence maps, transition networks and ligand-protein interactions simultaneously. Perhaps it would seem that this combination conveys redundant information. Still, let us present two cases as proof: diclofenac (DCF) and quinclorac (QCL). Both are arylic carboxilic acids, with quinclorac being an auxin herbicide; however the molecular target of quinclorac is not TIR1, but rather F-box protein ABP5 [38].
DCF is an non-steroidal anti inflammatory agent (NSAID) and thus, not an auxin per se; but it has been shown that exposure to this drug can cause effects similar to those of IAA [39]. Figure 7 present the consensus analyses of molecular dynamics simulation of DCF after docking in TIR1. Indeed, it can be seen that the interaction profile is similar to that of synthetic auxins; however, there is no ionic nor stacking interactions with H78. This may be attributed to the ring’s orientation due to hindrance of the chlorine atoms. Another significant observation is the diminished presence of the water bridge with R436.
When analyzing contact concurrence and interaction network, these suggest that DCF remains in the general vicinity of the main pocket. This, plus the observed basins and metastability can be taken as an indication of true binding. Nevertheless, the diminished contact with the water bridge was also observed in the ligand-protein contacts.
These observations provide a strong case in favor of the proposed protocol, still a criterion related to binding affinity is needed to assess the relative potency of a given ligand.
On the other hand QCL has no experimental affinity for TIR1. Figure 8 shows the results of the consensus analyses from MD. Based on the interaction profile, all contacts are significantly weaker for quinclorac. Moreover, the water bridge with R436 is non-existent; perhaps it is due to this that the interaction network shows a highly transient behaviour. No basins were observed and this is consistent with the concurrence plot. It suggests that quinclorac remains near hydrophobic residues; i.e., F82 and 380. Due to its planarity the presence of stacking interactions with these resides may be enough to stabilize QCL in the pocket. Beyond that, any significant contact is barely present; the main anchor seemed to be R489, as confirmed by ligand-protein interactions. Yet, this interaction seems to be lost in favor of hydrogen bonding with H78.
Additional analyses for other auxins can be found in the supplementary material, Figures S14-S19. Akin to simulations in section 3.3.2, IAA showed a highly stable binding. Stacking interactions with F82 and 380 were observed. Transition network showed only one highly populated basin, with significant metastability. Of note, is the persistence of the water bridge with R436. Interestingly, as shown in the previous section TRP also showed a highly populated basin; still, the interaction profile was inconsistent with that of auxins, just as QCL. Moreover, it must be stated that based on concurrences and ligand protein interactions, TRP showed a very stable binding mode. Even after 500 ns this non-binder was able to remain in the pocket. This may be attributed to the main anchors being present for this ligand, with a strong presence of thr R436 bridge. This also goes to show that even within “long” simulations non-binders can be falsely identified as candidates due to pharmacophore similarity. Just like DCF this is yet another case where affinity would provide a decisive criterion for assessment and pruning.
As for NAA, both isomers had similar concurrence maps and ligand-protein interactions. Despite this, the interaction profile of the α-napthyl acetic acid showed stacking interactions with H78, F79 & 82; traits absent for the β isomer. The main difference however, was found in transition networks. With the one of NAA showing a clear basin with significant metastability. Whereas 2-NAA showed a network more in line to the one observed for QCL. Experimental evidence confirms that indeed, NAA has the higher potency.
Finally, we discuss the results for fluroxypyr (FXY) and rinskor (RSK); both auxin herbicides belonging to the picolinate subclass [78]. Similar to QCL, these show preference to ABF proteins; still fluroxypyr is able to bind significantly to TIR1. Interestingly, FXY seems to be a binder whose main anchors are H78 and R489. Moreover, this arginine exhibits an analogue behaviour to that of R436. This, added to its general positioning, makes us hypothesize that auxin orientation initiates with K410 just outside the engagement niche; with R489 serving as the pulling mechanism toward the auxin site. A premise supported by the transition network, where some minor basins seemed to be found with shared microstates. Based on the interaction profile and the presence of additional water bridges, this can be the origin of said transitions. Concurrence plot also seems to favor this, since FXY stays in the general vicinity of H78 during the simulation; making close contact with D487 only during the last segment of the run.
As for RSK, the interaction profile was dominated by hydrophobic and stacking interactions. Notably, water bridges were also present, again with R489. A crucial detail however, is that RSK only showed inverse binding; i.e, a general orientation toward the engagement niche and R489 and the phenyl rings in the vicinity of H78. Uzunova et al., found similar arrangements for TRP using tomographic docking [52]. Perhaps this can be attributed to the absence of the carboxylic acid moiety, esterified in RSK. Of note, both RSK and related picolinate Arylex are readily metabolized to carboxylates, it has been suggested that their high potency is due to this activation step [79]. In our case, the preservation of the ester was deliberate; precisely to test the interaction profile and prior observations. Transition network shows a putative basin with transient behaviour; still as the simulation continues the microstates are novel and the basin no longer explored. In this regard the concurrence map suggests that overall RSK remains very stable during most of the run. Therefore, this is yet another case where water bridges may be the reason behind this pattern.
3.3.4. Coarse Metadynamics
Finally, we conducted a series of coarse metadynamics simulations in order to have an additional criterion for cases where consensus analyses could prove ambiguous. Briefly, metadynamics belongs to enhanced sampling methods, for this case a bias is introduced as specific degrees of freedom (CVs) which are subject to Gaussian potentials. These potentials help to fill the minima defined by CVs; in the context of small molecule binding a coarse approach has been proposed elsewhere [48]. While it is true that metadynamics has been successfully applied to determine binding mode stability, a major challenge is CV selection.
Herein, we used distance between centers of mass as it has proven to be a very robust choice in previous studies. Now, for ligand’s degrees of freedom, we settled on the WHIM descriptor. Due to its conceptualization and the overall positive results found during machine learning. Hence, WHIM’s second principal moment of the ligands was used. Commonly, metadynamics simulations are made from docking poses; thus, in order to test the engagement niche we carried out docking in the vicinity of this region and used metadynamics to “force” the ligands towards the binding pocket. Figure 9 shows free energy surfaces (FES) for DCF.
This compound only showed one basin in each metadynamics run. Distance and affinity values for these basins were close. Nonetheless, when binding poses within the basins were selected an interesting picture emerged (Figure 10). When DCF starts within the pocket and is pulled outward; it gets stuck in the vicinity of F351 and R489. In contrast, when DCF starts from the engagement niche, it is able to enter the auxin pocket and adopts a canonical orientation toward H78, F82 and 380; an indicative of true binding. It is true that in both arrangements the DCF is enclosed by several water molecules; still this could be due to the noisy behaviour of short metadynamics. Now, taking all prior results and the computed affinity value (~ -19 kcal/mol) confirms the role of DCF as a true binder. Nevertheless, the significance of this value remains relative to that of other auxins calculated with the same protocol, discussed below.
Recovered FES for QCL are shown in Figure 11, for this compound, a clear unbinding event took place. Additionally, this was the only basin found, when visual inspection of the binding mode was done (Figure 12) QCL is outside the neighboring region of the engagement niche. Contrary to DCF, the synthetic auxin was not able to effectively bind to any region during its exit. When QCL starts from the engagement niche, based on COM distance values it would seem that binding did occur. Again, when the basin is inspected it would seem that a true binding was indeed achieved, as QCL is interacting with H78; however, this is only via hydrogen bonding, there is no interaction with F79, 82 or 380 nor any contact or presence of any arginine residue. Even if the suggested affinity seems rather high (-32 kcal/mol) this binding mode is not characteristic of any auxin under study. Also, this value can be the result of low sampling of the observed basin. As stated, even affinity estimates from metadynamics are qualitative in nature, more so when short runs are produced, given enough time this value is likely to diminish towards a more representative one.
Now for the additional auxins and non-binders; their FES diagrams and representative binding poses from basins can be found in the supplementary information (Figures S20-S31). Herein we just provide some details and highlights, but we think that results are self-explanatory. IAA, serves to establish a baseline for affinity values. Akin to experimental reports, it showed the highest value of all true binders (-24 kcal/mol) when initiating from within the binding pocket. Followed closely by NAA isomers (-22 kcal/mol), also consistent with experimental affinity which is usually one order of magnitude below IAA [14,38,80]. For these cases metadynamics could not distinguish between isomers just with affinity estimates; nonetheless, only NAA showed true binding modes in both metadynamics runs.
TRP was correctly classified as a non-binder, even when a quasi-canonical arrangement was found; the affinity estimate was very low (-16 kcal/mol). RSK showed even lower values (-14 kcal/mol), notably this was consistent between runs, and also its tendency for remaining inversely placed within the pocket.
The case for FXY is a rather interesting one, as an unbinding event occurred and it remained tightly bound to the engagement niche surface. Given the previous results we cannot provide an explanation for this discrepancy. Indeed, this case presses for further study while also highlighting the need for additional experimental information.
4. Conclusions
Herbicide development is an endeavor of high interest, from both an economical and chemical standpoint. Currently, there are worldwide efforts to replace commonly used agents such as glyphosate or 2,4-D. Herein, we presented a computational characterization of TIR1, one of the molecular targets associated with auxin pathways. With the aid of structure based methods we analyzed a series of compounds in silico, we found that water plays an important role in binding and were able to characterize significant protein-ligand interactions.
Using de novo design, we proposed a library of putative binders and molecular decoys. Chemical space showed a good superposition between them, a trait further supported by machine learning results. Herein, non-linear methods were more consistent and performed reasonably, while conveying enough information on true binders.However,current results also showed that current data makes correct classification of false negatives difficult. This behaviour was recurrent in this and other studies.
Hence, we conducted structure-based characterization of the TIR1 pocket. In order to determine major traits that could provide a robust protocol for true binder assessment. We found that inclusion of water mediated interactions gave a more robust description of local minima and metastability. Also, we found a persistent water bridge between ligands and R436; which to the best of our knowledge has not been described as significant.
We also probed the engagement niche, confirming its role in molecular recognition and the overall plasticity of the auxin binding pocket. Changes in ligand polarity make a significant impact on pocket dynamics and the orientation of hydrophobic residues involved in stacking interactions.
Using coarse metadynamics, we were able to further assess the affinity of known auxins and TIR1. Overall, the collective variables used in this study provide a robust description of ligand degrees of freedom and provide yet another criterion for virtual screening campaigns.
We are confident that the database and proposed analyses in this work provide a valuable starting point for further developments such as molecular generators or virtual screening campaigns.
Supplementary Materials
The following supporting information can be downloaded at the website of this paper posted on Preprints.org.
Author Contributions
Conceptualization, F.D.P.M.; methodology, F.D.P.M. and J.M.C; software, F.D.P.M and K.M.M.; validation, F.D.P.M; formal analysis, F.D.P.M. and J.M.C; investigation, F.D.P.M. and J.M.C.; resources, K.M.M..; data curation, F.D.P.M and J.M.C.; writing—original draft preparation, F.D.P.M. and J.M.C; writing—review and editing, F.D.P.M., J.M.C and K.M.M.; supervision, K.M.M.; project administration, K.M.M.; funding acquisition, K.M.M. All authors have read and agreed to the published version of the manuscript.
Funding
This research was funded by CONAHCyT project 251726.
Data Availability Statement
The data are contained in this article and the Supplementary Materials.
Acknowledgments
F.D.P.-M. also thanks CONAHCyT for a postdoctoral fellowship, No. 31146; granted to the project FORDECYT-PRONACES, No. 1561802.
Conflicts of Interest
The authors declare no conflict of interest. The funder had no role in the design of the study; in the collection, analyses, or interpretation of data; in the writing of the manuscript; or in the decision to publish the results.
References
- H. Ritchie, P. Rosado, and M. Roser, “Agricultural Production,” Our World in Data, Jan. 2023, Accessed: Mar. 17, 2024. [Online]. Available: https://ourworldindata.org/agricultural-production.
- “2.1 Food security indicators – latest updates and progress towards ending hunger and ensuring food security.” Accessed: Mar. 17, 2024. [Online]. Available: https://www.fao.org/3/cc0639en/online/sofi-2022/food-security-nutrition-indicators.html.
- P. Carvalho-Moore, G. Rangani, J. Heiser, D. Findley, S.J. Bowe, and N. Roma-Burgos, “PPO2 Mutations in Amaranthus palmeri: Implications on Cross-Resistance,” Agriculture, vol. 11, no. 8, Art. no. 8, Aug. 2021. [CrossRef]
- D. L. Shaner, “Lessons Learned From the History of Herbicide Resistance,” Weed Science, vol. 62, no. 2, pp. 427–431, Jun. 2014. [CrossRef]
- Heap, The International Survey of Herbicide Resistant Weeds. Accessed: Feb. 01, 2024. [Online]. Available: http://www.weedscience.com/Home.aspx.
- P. K. Gupta, “Chapter 37 - Herbicides and Fungicides,” in Reproductive and Developmental Toxicology (Second Edition), R.C. Gupta, Ed., Academic Press, 2017, pp. 657–679. [CrossRef]
- D. Panchal, J. D. Panchal, J. Mistry, and D. Amin, “Auxin,” in Practical Handbook on Agricultural Microbiology, N. Amaresan, P. Patel, and D. Amin, Eds., New York, NY: Springer US, 2022, pp. 251–255. [CrossRef]
- W. D. Teale, I.A. W. D. Teale, I.A. Paponov, and K. Palme, “Auxin in action: signalling, transport and the control of plant growth and development,” Nat Rev Mol Cell Biol, vol. 7, no. 11, pp. 847–859, Nov. 2006. [CrossRef]
- K. Hayashi et al., “Rational Design of an Auxin Antagonist of the SCFTIR1 Auxin Receptor Complex,” ACS Chem. Biol., vol. 7, no. 3, pp. 590–598, Mar. 2012. [CrossRef]
- K. Grossmann, “Mediation of Herbicide Effects by Hormone Interactions,” J Plant Growth Regul, vol. 22, no. 1, pp. 109–122, Mar. 2003. [CrossRef]
- N. Dharmasiri, “Auxin signaling and regulated protein degradation,” Trends in Plant Science, vol. 9, no. 6, pp. 302–308, Jun. 2004. [CrossRef]
- R. Wang and M. Estelle, “Diversity and specificity: auxin perception and signaling through the TIR1/AFB pathway,” Current Opinion in Plant Biology, vol. 21, pp. 51–58, Oct. 2014. [CrossRef]
- E. Todd et al., “Synthetic auxin herbicides: finding the lock and key to weed resistance,” Plant Science, vol. 300, p. 110631, Nov. 2020. [CrossRef]
- Q. Ma, P. Q. Ma, P. Grones, and S. Robert, “Auxin signaling: a big question to be addressed by small molecules,” Journal of Experimental Botany, vol. 69, no. 2, pp. 313–328, Jan. 2018. [CrossRef]
- N. Chéron, N. N. Chéron, N. Jasty, and E. I. Shakhnovich, “OpenGrowth: An Automated and Rational Algorithm for Finding New Protein Ligands,” Journal of Medicinal Chemistry, vol. 59, no. 9, pp. 4171–4188, 2016. [CrossRef]
- F. Imrie, A.R. F. Imrie, A.R. Bradley, and C. M. Deane, “Generating property-matched decoy molecules using deep learning,” Bioinformatics, vol. 37, no. 15, pp. 2134–2141, Aug. 2021. [CrossRef]
- H. Moriwaki, Y.-S. H. Moriwaki, Y.-S. Tian, N. Kawashita, and T. Takagi, “Mordred: a molecular descriptor calculator,” Journal of Cheminformatics, vol. 10, no. 1, p. 4, Feb. 2018. [CrossRef]
- M. B. Kursa and W. R. Rudnicki, “Feature selection with the Boruta package,” Journal of statistical software, vol. 36, pp. 1–13, 2010.
- T. Sander, J. T. Sander, J. Freyss, M. von Korff, and C. Rufener, “DataWarrior: An Open-Source Program For Chemistry Aware Data Visualization And Analysis,” J. Chem. Inf. Model., vol. 55, no. 2, pp. 460–473, Feb. 2015. [CrossRef]
- F. Pedregosa et al., “Scikit-learn: Machine learning in Python,” Journal of machine learning research, vol. 12, no. Oct, pp. 2825–2830, 2011.
- T. Chen and C. Guestrin, “XGBoost: A Scalable Tree Boosting System,” in Proceedings of the 22nd ACM SIGKDD International Conference on Knowledge Discovery and Data Mining, in KDD ’16. New York, NY, USA: ACM, 2016, pp. 785–794. [CrossRef]
- F. D. Prieto-Martínez, E. F. D. Prieto-Martínez, E. Fernández-de Gortari, J.L. Medina-Franco, and L. M. Espinoza-Fonseca, “An in silico pipeline for the discovery of multitarget ligands: A case study for epi-polypharmacology based on DNMT1/HDAC2 inhibition,” Artif Intell Life Sci, vol. 1, p. 100008, Dec. 2021. [CrossRef]
- G. Landrum et al., “rdkit/rdkit: 2024_03_1 (Q1 2024) Release Beta.” Zenodo, Mar. 19, 2024. [CrossRef]
- H. Feng, Y. Zhang, P.H. Bos, J.M. Chambers, M.M. Dupont, and B. R. Stockwell, “K-RasG12D Has a Potential Allosteric Small Molecule Binding Site,” Biochemistry, vol. 58, no. 21, pp. 2542–2554, May 2019. [CrossRef]
- P. Ghanakota and H. A. Carlson, “Driving Structure-Based Drug Discovery through Cosolvent Molecular Dynamics: Miniperspective,” J. Med. Chem., vol. 59, no. 23, pp. 10383–10399, Dec. 2016. [CrossRef]
- F. J. Barrera-Téllez, F.D. Prieto-Martínez, A. Hernández-Campos, K. Martínez-Mayorga, and R. Castillo-Bocanegra, “In Silico Exploration of the Trypanothione Reductase (TryR) of L. mexicana,” International Journal of Molecular Sciences, vol. 24, no. 22, Art. no. 22, Jan. 2023. [CrossRef]
- J. E. Ladbury, “Just add water! The effect of water on the specificity of protein-ligand binding sites and its potential application to drug design,” Chemistry & Biology, vol. 3, no. 12, pp. 973–980, 1996. [CrossRef]
- W. R. Shadrick et al., “Exploiting a water network to achieve enthalpy-driven, bromodomain-selective BET inhibitors,” Bioorganic and Medicinal Chemistry, vol. 26, no. 1, pp. 25–36, 2018. [CrossRef]
- Y. Ge, D.C. Wych, M.L. Samways, M.E. Wall, J.W. Essex, and D. L. Mobley, “Enhancing Sampling of Water Rehydration on Ligand Binding: A Comparison of Techniques,” J. Chem. Theory Comput., vol. 18, no. 3, pp. 1359–1381, Mar. 2022. [CrossRef]
- D. Lukauskis, M.L. Samways, S. Aureli, B.P. Cossins, R.D. Taylor, and F. L. Gervasio, “Open Binding Pose Metadynamics: An Effective Approach for the Ranking of Protein–Ligand Binding Poses,” J. Chem. Inf. Model., vol. 62, no. 23, pp. 6209–6216, Dec. 2022. [CrossRef]
- K. Bowers et al., “Scalable Algorithms for Molecular Dynamics Simulations on Commodity Clusters,” in ACM/IEEE SC 2006 Conference (SC’06), 2006. [CrossRef]
- C. Predescu, M. Bergdorf, and D. E. Shaw, “Midtown splines: An optimal charge assignment for electrostatics calculations,” The Journal of Chemical Physics, vol. 153, no. 22, p. 224117, Dec. 2020. [CrossRef]
- M. Aldeghi, G.A. Ross, M.J. Bodkin, J.W. Essex, S. Knapp, and P. C. Biggin, “Large-scale analysis of water stability in bromodomain binding pockets with grand canonical Monte Carlo,” Communications Chemistry, vol. 1, no. 1, p. 19, 2018. [CrossRef]
- De Ruiter and, C. Oostenbrink, “Free energy calculations of protein-ligand interactions,” Current Opinion in Chemical Biology, vol. 15, no. 4, pp. 547–552, 2011. [CrossRef]
- M. L. Samways, H.E. Bruce Macdonald, and J. W. Essex, “grand: A Python Module for Grand Canonical Water Sampling in OpenMM,” Journal of chemical information and modeling, vol. 60, no. 10, pp. 4436–4441, 2020. [CrossRef]
- E. Nittinger, F. Flachsenberg, S. Bietz, G. Lange, R. Klein, and M. Rarey, “Placement of Water Molecules in Protein Structures: From Large-Scale Evaluations to Single-Case Examples,” Journal of Chemical Information and Modeling, vol. 58, no. 8, pp. 1625–1637, 2018. [CrossRef]
- L. El Khoury et al., “Comparison of affinity ranking using AutoDock-GPU and MM-GBSA scores for BACE-1 inhibitors in the D3R Grand Challenge 4,” J Comput Aided Mol Des, vol. 33, no. 12, pp. 1011–1020, Dec. 2019. [CrossRef]
- S. Lee et al., “Defining Binding Efficiency and Specificity of Auxins for SCFTIR1/AFB-Aux/IAA Co-receptor Complex Formation,” ACS Chem. Biol., vol. 9, no. 3, pp. 673–682, Mar. 2014. [CrossRef]
- M. Cho and K. Kim, “Diclofenac modified the root system architecture of Arabidopsis via interfering with the hormonal activities of auxin,” Journal of Hazardous Materials, vol. 413, p. 125402, Jul. 2021. [CrossRef]
- Korb, S. Bowden, T. Olsson, D. Frenkel, J. Liebeschuetz, and J. Cole, “Ensemble docking revisited,” Journal of Cheminformatics, vol. 2, no. Suppl 1, p. P25, 2010. [CrossRef]
- Korb, T. Stützle, and T. E. Exner, “Empirical scoring functions for advanced Protein-Ligand docking with PLANTS,” Journal of Chemical Information and Modeling, vol. 49, no. 1, pp. 84–96, Jan. 2009. [CrossRef]
- X. Ren et al., “Novel Consensus Docking Strategy to Improve Ligand Pose Prediction,” J. Chem. Inf. Model., vol. 58, no. 8, pp. 1662–1668, Aug. 2018. [CrossRef]
- S. T. Kurkinen, S. Lätti, O.T. Pentikäinen, and P. A. Postila, “Getting Docking into Shape Using Negative Image-Based Rescoring,” J. Chem. Inf. Model., vol. 59, no. 8, pp. 3584–3599, Aug. 2019. [CrossRef]
- T. ten Brink and T. E. Exner, “Influence of Protonation, Tautomeric, and Stereoisomeric States on Protein−Ligand Docking Results,” J. Chem. Inf. Model., vol. 49, no. 6, pp. 1535–1546, Jun. 2009. [CrossRef]
- R. T. McGibbon et al., “mdtraj/mdtraj: MDTraj 1.9.” Zenodo, Sep. 04, 2017. [CrossRef]
- D. W. H. Swenson, S. Roet, and N. Faruk, “dwhswenson/contact_map: contact_map 0.7.0.” Zenodo, Oct. 28, 2020. [CrossRef]
- G. Bussi and A. Laio, “Using metadynamics to explore complex free-energy landscapes,” Nat Rev Phys, vol. 2, no. 4, pp. 200–212, Apr. 2020. [CrossRef]
- M. Masetti, A. Cavalli, M. Recanatini, and F. L. Gervasio, “Exploring Complex Protein−Ligand Recognition Mechanisms with Coarse Metadynamics,” J. Phys. Chem. B, vol. 113, no. 14, pp. 4807–4816, Apr. 2009. [CrossRef]
- D. Provasi, “Ligand-Binding Calculations with Metadynamics,” in Biomolecular Simulations: Methods and Protocols, M. Bonomi and C. Camilloni, Eds., New York, NY: Springer, 2019, pp. 233–253. [CrossRef]
- S. Raniolo and V. Limongelli, “Ligand binding free-energy calculations with funnel metadynamics,” Nat Protoc, vol. 15, no. 9, pp. 2837–2866, Sep. 2020. [CrossRef]
- J. Wang, A. Ishchenko, W. Zhang, A. Razavi, and D. Langley, “A highly accurate metadynamics-based Dissociation Free Energy method to calculate protein–protein and protein–ligand binding potencies,” Sci Rep, vol. 12, no. 1, p. 2024, Feb. 2022. [CrossRef]
- V. V. Uzunova, M. Quareshy, C.I. del Genio, and R. M. Napier, “Tomographic docking suggests the mechanism of auxin receptor TIR1 selectivity,” Open Biology, vol. 6, no. 10, p. 160139, Oct. 2016. [CrossRef]
- P. D. Leeson, “Molecular inflation, attrition and the rule of five,” Advanced Drug Delivery Reviews, vol. 101, pp. 22–33, 2015. [CrossRef]
- L. Hopkins, G.M. Keserü, P.D. Leeson, D.C. Rees, and C. H. Reynolds, “The role of ligand efficiency metrics in drug discovery,” Nature Reviews Drug Discovery, vol. 13, no. 2, pp. 105–121, Jan. 2014. [CrossRef]
- G. M. Maggiora, “On Outliers and Activity CliffsWhy QSAR Often Disappoints,” J. Chem. Inf. Model., vol. 46, no. 4, pp. 1535–1535, Jul. 2006. [CrossRef]
- D. Stumpfe, H. Hu, and J. Bajorath, “Evolving Concept of Activity Cliffs,” ACS Omega, vol. 4, no. 11, pp. 14360–14368, Sep. 2019. [CrossRef]
- D. Stumpfe, H. Hu, and J. Bajorath, “Advances in exploring activity cliffs,” J Comput Aided Mol Des, vol. 34, no. 9, pp. 929–942, 2020. [CrossRef]
- C. A. Lipinski, F. Lombardo, B.W. Dominy, and P. J. Feeney, “Experimental and computational approaches to estimate solubility and permeability in drug discovery and development settings1,” Advanced Drug Delivery Reviews, vol. 46, no. 1, pp. 3–26, Mar. 2001. [CrossRef]
- M. D. Shultz, “Two Decades under the Influence of the Rule of Five and the Changing Properties of Approved Oral Drugs,” J. Med. Chem., vol. 62, no. 4, pp. 1701–1714, Feb. 2019. [CrossRef]
- K. A. Giblin, S.J. Hughes, H. Boyd, P. Hansson, and A. Bender, “Prospectively Validated Proteochemometric Models for the Prediction of Small-Molecule Binding to Bromodomain Proteins,” J. Chem. Inf. Model., vol. 58, no. 9, pp. 1870–1888, Sep. 2018. [CrossRef]
- R. E. Skyner, J.L. McDonagh, C.R. Groom, T. van Mourik, and J. B. O. Mitchell, “A review of methods for the calculation of solution free energies and the modelling of systems in solution,” Phys. Chem. Chem. Phys., vol. 17, no. 9, pp. 6174–6191, Feb. 2015. [CrossRef]
- M. Deshpande, M. Kuramochi, and G. Karypis, “Data Mining Algorithms for Virtual Screening of Bioactive Compounds,” in Data Mining in Biomedicine, P.M. Pardalos, V.L. Boginski, and A. Vazacopoulos, Eds., Boston, MA: Springer US, 2007, pp. 59–90. [CrossRef]
- N. Lima, E.A. Philot, G.H.G. Trossini, L.P.B. Scott, V.G. Maltarollo, and K. M. Honorio, “Use of machine learning approaches for novel drug discovery,” Expert Opinion on Drug Discovery, vol. 11, no. 3, pp. 225–239, Mar. 2016. [CrossRef]
- G. Patlewicz, J.F. Wambaugh, S.P. Felter, T.W. Simon, and R. A. Becker, “Utilizing Threshold of Toxicological Concern (TTC) with high throughput exposure predictions (HTE) as a risk-based prioritization approach for thousands of chemicals,” Computational Toxicology, vol. 7, pp. 58–67, Aug. 2018. [CrossRef]
- S. M. Vogel, M.R. Bauer, and F. M. Boeckler, “DEKOIS: Demanding Evaluation Kits for Objective in Silico Screening — A Versatile Tool for Benchmarking Docking Programs and Scoring Functions,” J. Chem. Inf. Model., vol. 51, no. 10, pp. 2650–2665, Oct. 2011. [CrossRef]
- R. M. Stein et al., “Property-Unmatched Decoys in Docking Benchmarks,” J. Chem. Inf. Model., vol. 61, no. 2, pp. 699–714, Feb. 2021. [CrossRef]
- G.-B. Li, L.-L. Yang, W.-J. Wang, L.-L. Li, and S.-Y. Yang, “ID-Score: A New Empirical Scoring Function Based on a Comprehensive Set of Descriptors Related to Protein–Ligand Interactions,” J. Chem. Inf. Model., vol. 53, no. 3, pp. 592–600, Mar. 2013. [CrossRef]
- J. Lu, X. Hou, C. Wang, and Y. Zhang, “Incorporating Explicit Water Molecules and Ligand Conformation Stability in Machine-Learning Scoring Functions,” J. Chem. Inf. Model., vol. 59, no. 11, pp. 4540–4549, Nov. 2019. [CrossRef]
- D. L. Mobley and K. A. Dill, “Binding of Small-Molecule Ligands to Proteins: ‘What You See’ Is Not Always ‘What You Get,’” Structure, vol. 17, no. 4, pp. 489–498, Apr. 2009. [CrossRef]
- K. Liu and H. Kokubo, “Exploring the Stability of Ligand Binding Modes to Proteins by Molecular Dynamics Simulations: A Cross-docking Study,” Journal of Chemical Information and Modeling, vol. 57, no. 10, pp. 2514–2522, 2017. [CrossRef]
- R. Brenke et al., “Fragment-based identification of druggable ‘hot spots’ of proteins using Fourier domain correlation techniques,” Bioinformatics, vol. 25, no. 5, pp. 621–627, Mar. 2009. [CrossRef]
- P. Ghanakota, H. Van Vlijmen, W. Sherman, and T. Beuming, “Large-Scale Validation of Mixed-Solvent Simulations to Assess Hotspots at Protein–Protein Interaction Interfaces,” J. Chem. Inf. Model., vol. 58, no. 4, pp. 784–793, Apr. 2018. [CrossRef]
- X. Tan et al., “Mechanism of auxin perception by the TIR1 ubiquitin ligase,” Nature, vol. 446, no. 7136, pp. 640–645, Apr. 2007. [CrossRef]
- T. D. Swinburne and D. J. Wales, “Defining, Calculating, and Converging Observables of a Kinetic Transition Network,” J. Chem. Theory Comput., vol. 16, no. 4, pp. 2661–2679, Apr. 2020. [CrossRef]
- K. Mockaitis and M. Estelle, “Auxin receptors and plant development: a new signaling paradigm,” Annu Rev Cell Dev Biol, vol. 24, pp. 55–80, 2008. [CrossRef]
- G. A. Ross, G.M. Morris, and P. C. Biggin, “One Size Does Not Fit All: The Limits of Structure-Based Models in Drug Discovery,” J Chem Theory Comput, vol. 9, no. 9, pp. 4266–4274, Sep. 2013. [CrossRef]
- Anighoro and, J. Bajorath, “Three-Dimensional Similarity in Molecular Docking: Prioritizing Ligand Poses on the Basis of Experimental Binding Modes,” Journal of Chemical Information and Modeling, vol. 56, no. 3, pp. 580–587, Mar. 2016. [CrossRef]
- M. Quareshy, J. Prusinska, J. Li, and R. Napier, “A cheminformatics review of auxins as herbicides,” J Exp Bot, vol. 69, no. 2, pp. 265–275, Jan. 2018. [CrossRef]
- J. B. Epp et al., “The discovery of ArylexTM active and RinskorTM active: Two novel auxin herbicides,” Bioorganic & Medicinal Chemistry, vol. 24, no. 3, pp. 362–371, Feb. 2016. [CrossRef]
- J. Prusinska, V. Uzunova, P. Schmitzer, M. Weimer, J. Bell, and R. M. Napier, “The differential binding and biological efficacy of auxin herbicides,” Pest Management Science, vol. 79, no. 4, pp. 1305–1315, 2023. [CrossRef]
Scheme 1.
Chemical structures of the selected probes for hotspot identification.
Figure 1.
Chemical spaces of the generated compounds; using descriptors selected with Boruta.
Figure 2.
Performance assessment of the trained classifiers; using only physicochemical descriptors (top); using physicochemical and structural descriptors (bottom).
Figure 2.
Performance assessment of the trained classifiers; using only physicochemical descriptors (top); using physicochemical and structural descriptors (bottom).
Figure 3.
Probe occupancy surfaces recovered by molecular dynamics with mixed solvents using PBDIDs 2P1M (a); 2P1P (b) and 2P1N (c). Pockets with top three scoring are shown in green, blue and yellow; respectively.
Figure 3.
Probe occupancy surfaces recovered by molecular dynamics with mixed solvents using PBDIDs 2P1M (a); 2P1P (b) and 2P1N (c). Pockets with top three scoring are shown in green, blue and yellow; respectively.
Figure 4.
Comparison of protein-ligand interactions for the auxin/TIR1 complexes (PDBIDs 2P1Q, 2P1O & 2P1N). Top row shows results from simulations preserving crystal water molecules, bottom row shows results discarding said waters.
Figure 4.
Comparison of protein-ligand interactions for the auxin/TIR1 complexes (PDBIDs 2P1Q, 2P1O & 2P1N). Top row shows results from simulations preserving crystal water molecules, bottom row shows results discarding said waters.
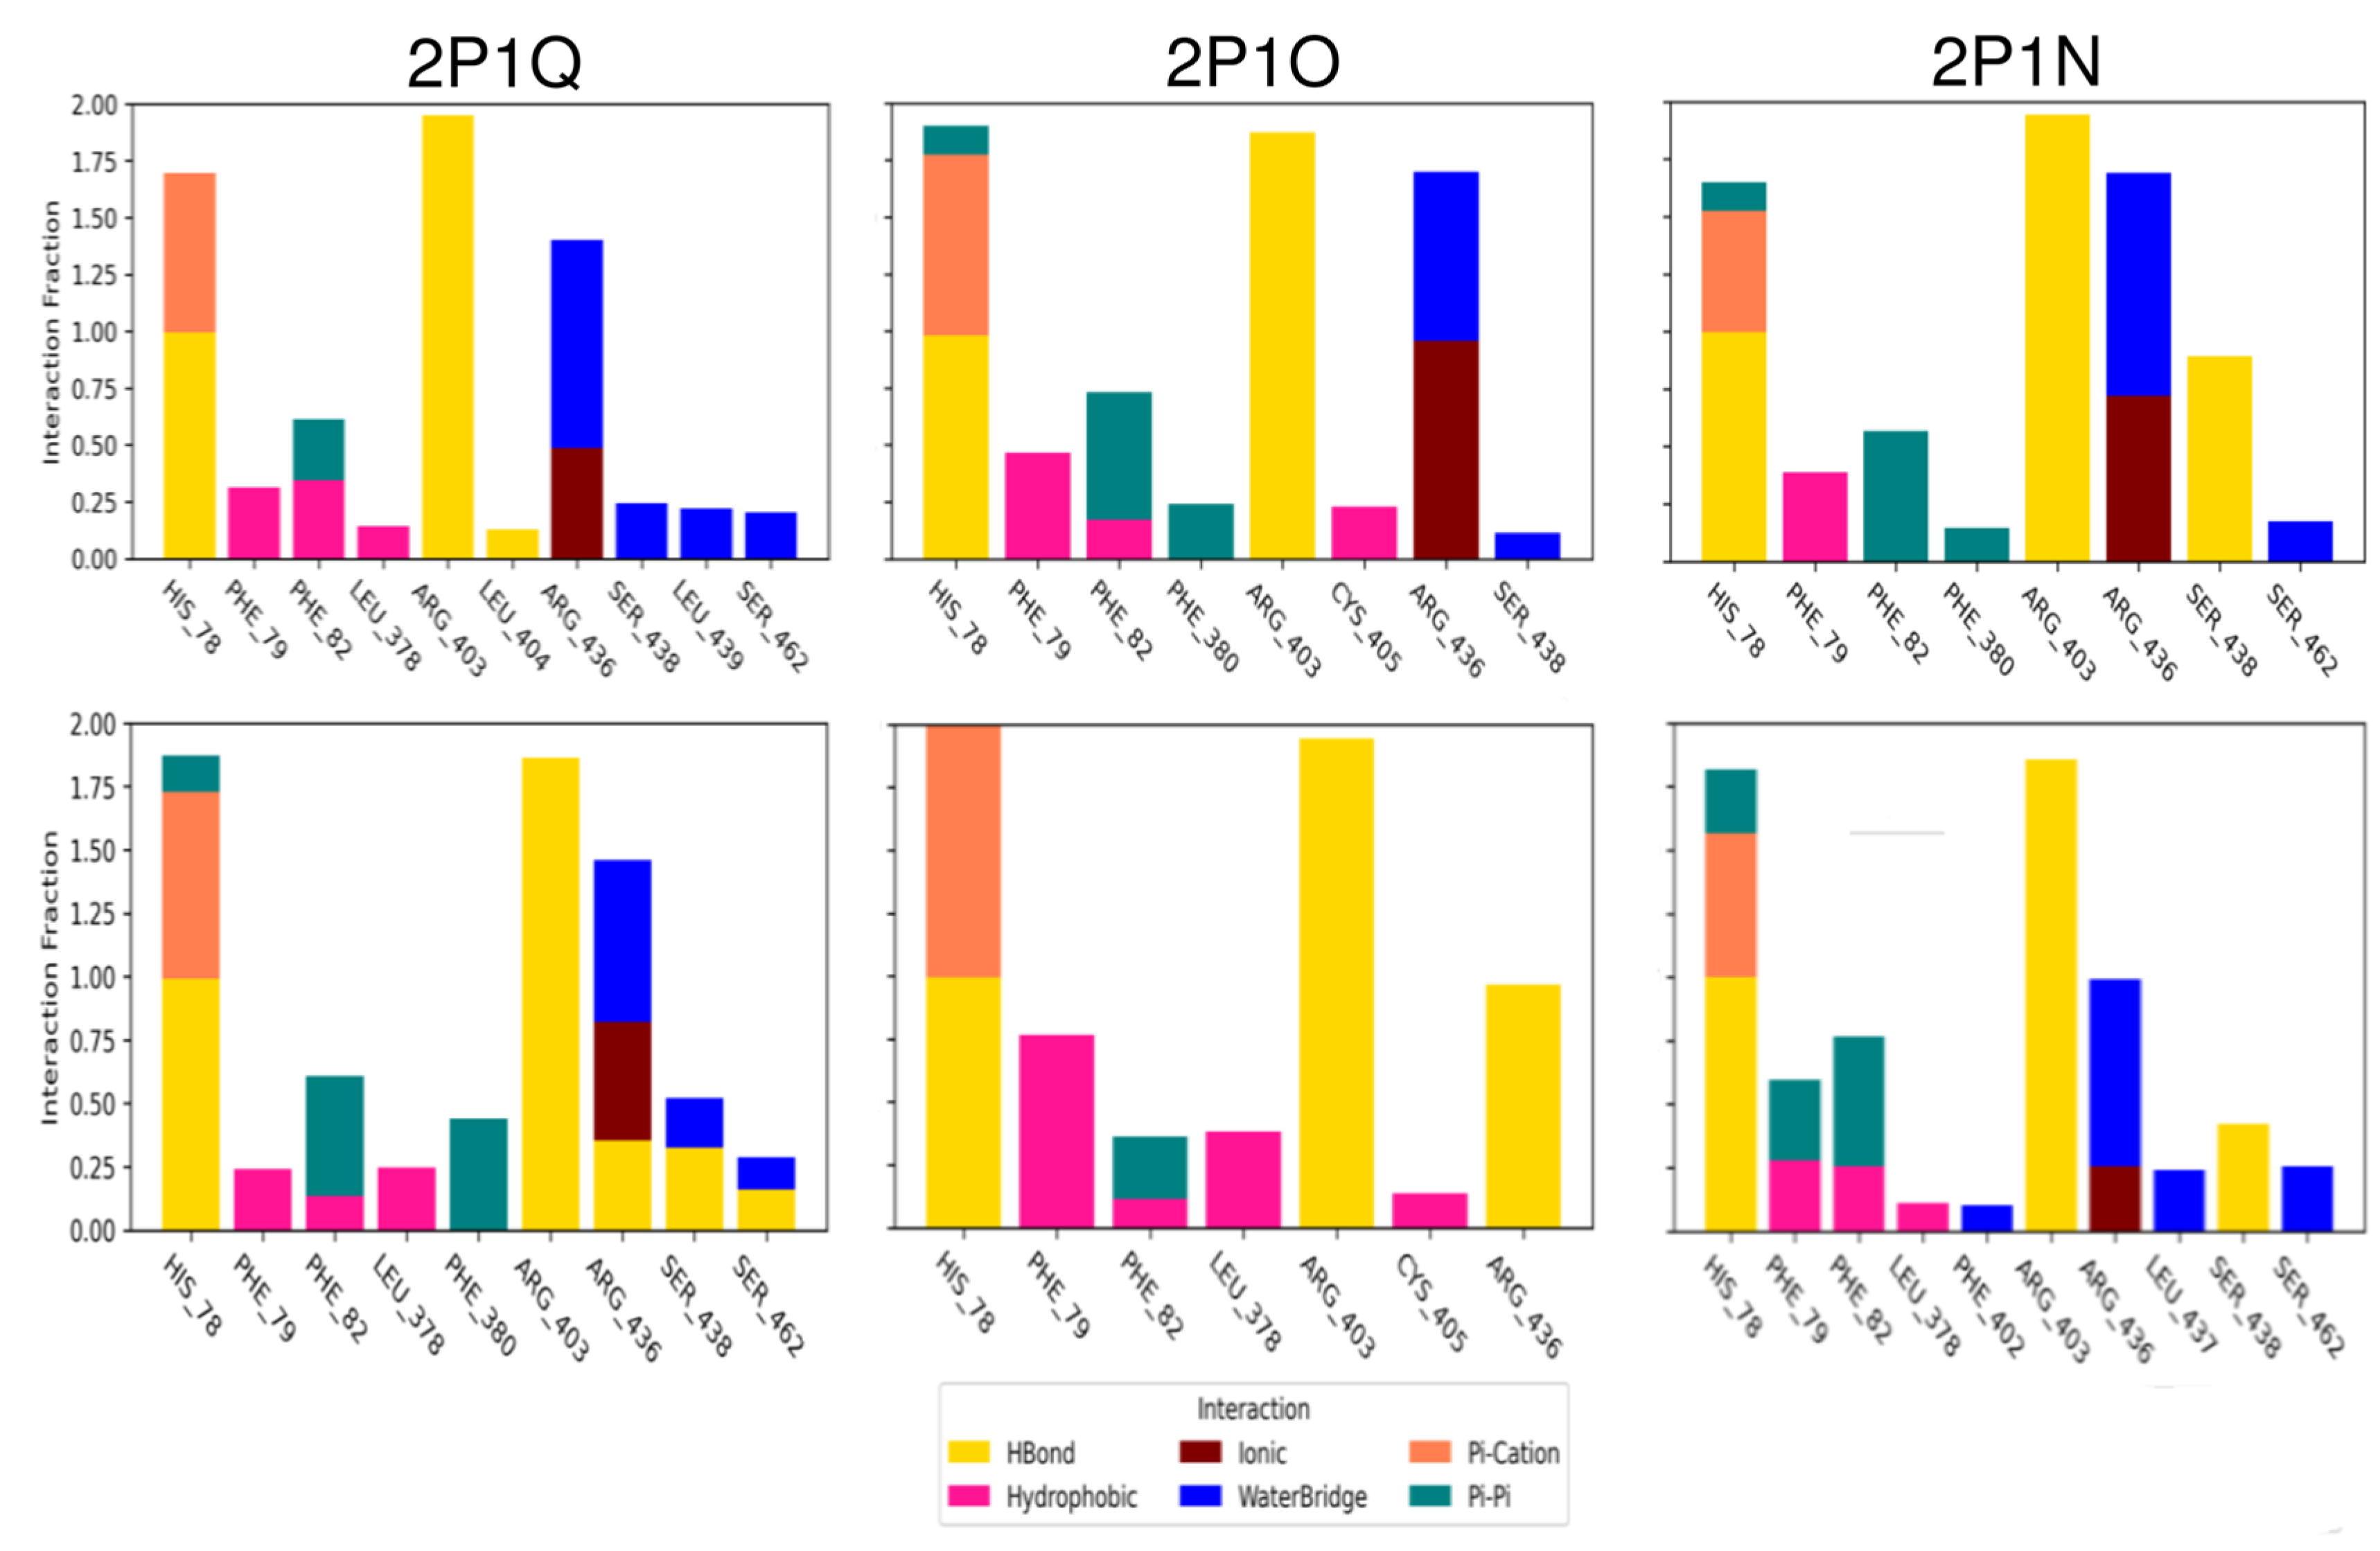
Figure 5.
Transitions networks built from protein-ligand interactions. Top row shows results from simulations preserving crystal water molecules, bottom row shows results discarding said waters. For further comparison, networks were built accounting for water bridges (left) and without them (right).
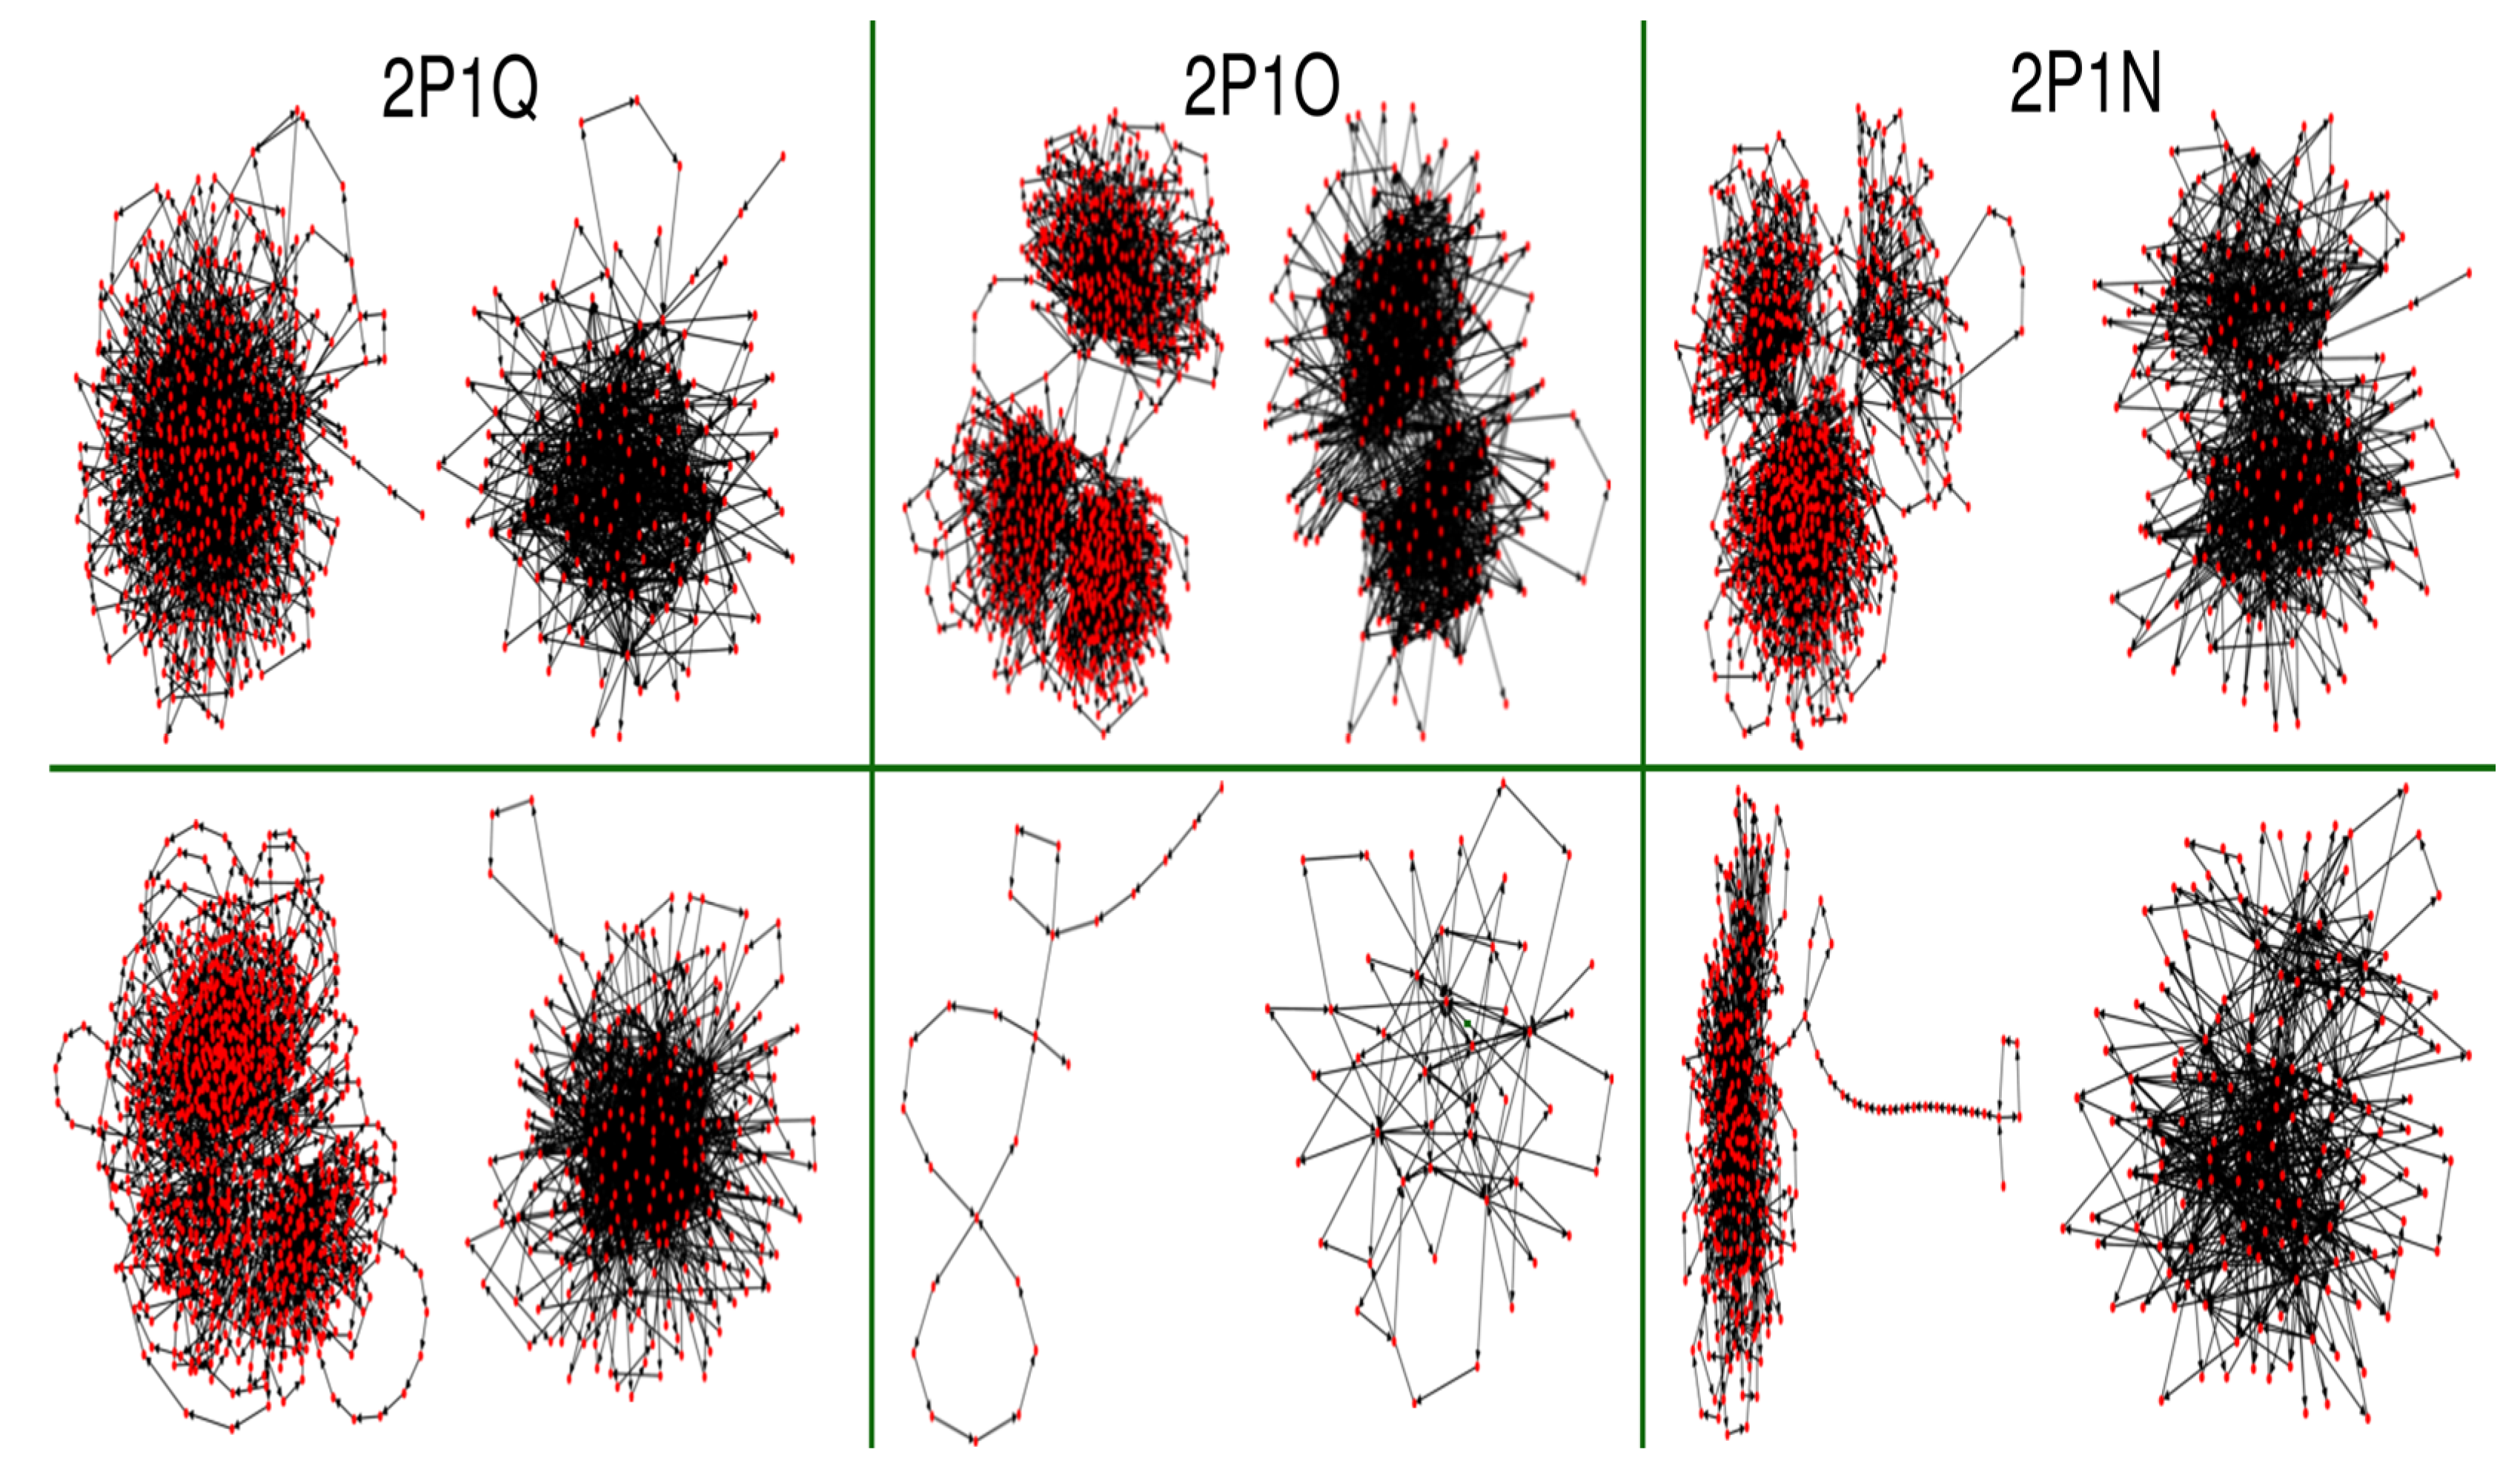
Figure 6.
Transitions networks built from protein-ligand interactions. Top row shows results from simulations preserving crystal water molecules, bottom row shows results discarding said waters. For further comparison, networks were built accounting for water bridges (left) and without them (right).
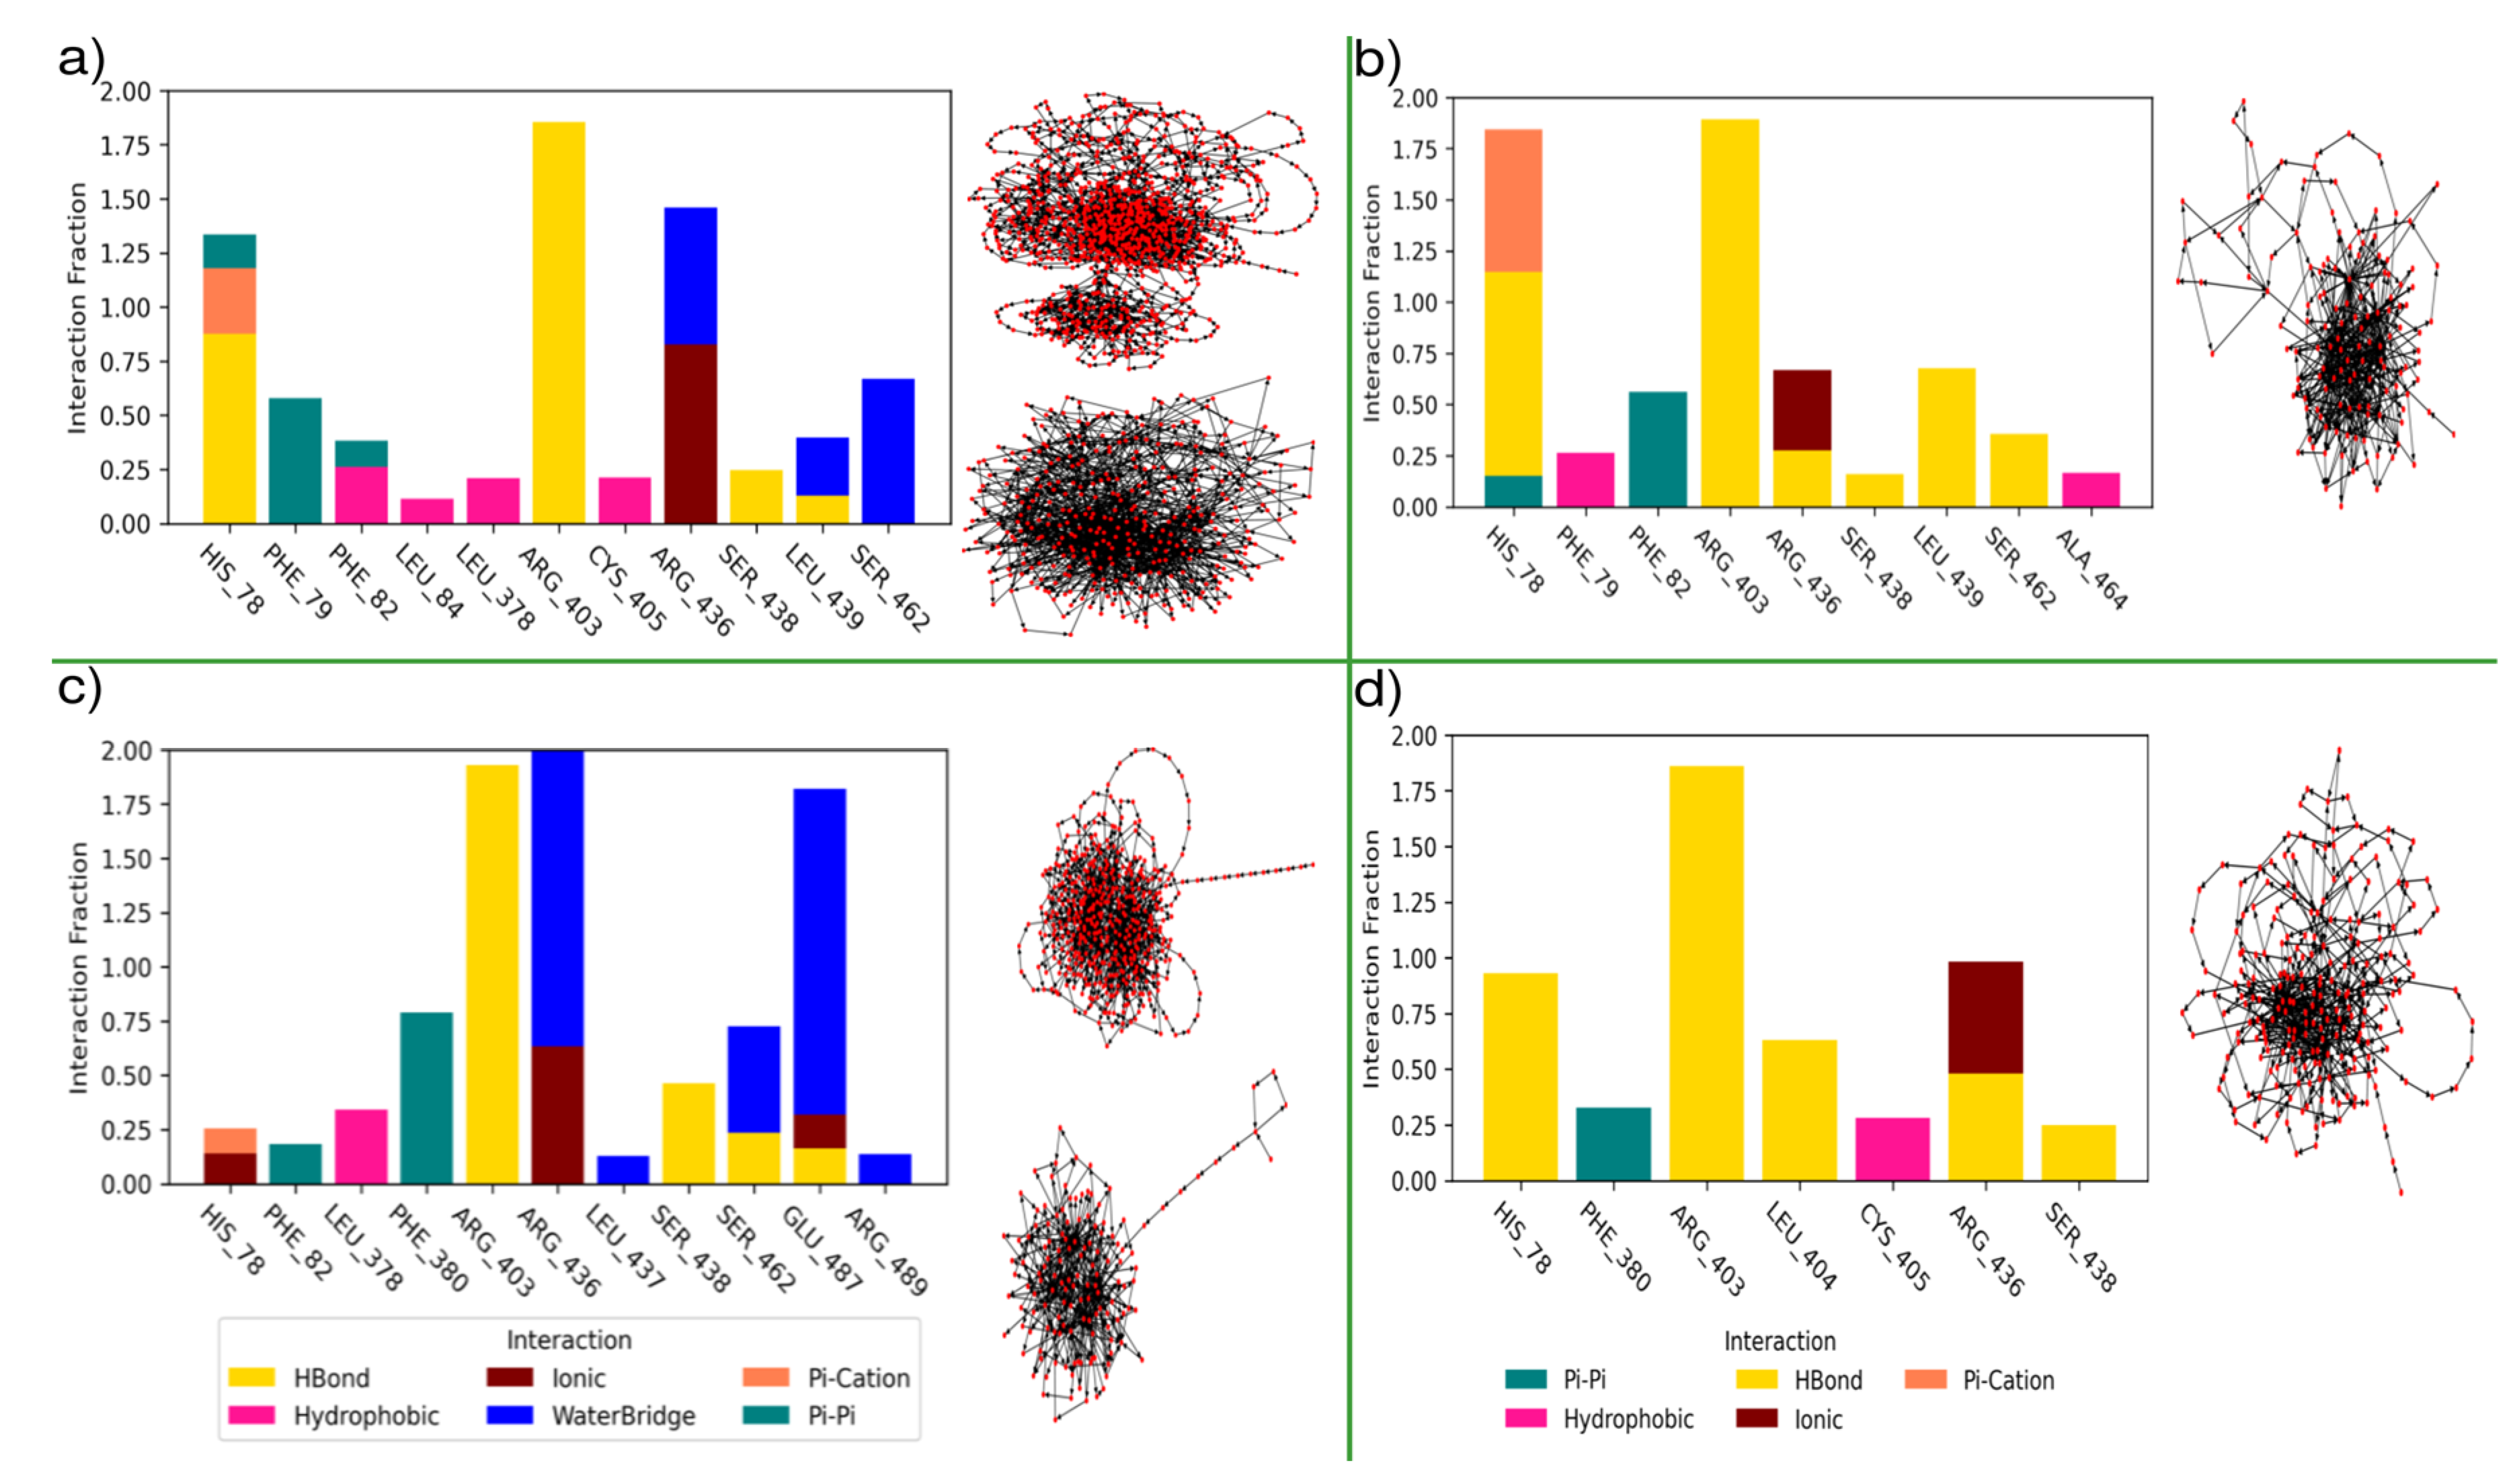
Figure 7.
Consensus analysis of MD simulation of diclofenac (DCF); a) Protein-ligand interaction fraction; b) Concurrence of contacts; c) Transition network for protein-ligand interactions; d) Ligand-protein interaction.
Figure 7.
Consensus analysis of MD simulation of diclofenac (DCF); a) Protein-ligand interaction fraction; b) Concurrence of contacts; c) Transition network for protein-ligand interactions; d) Ligand-protein interaction.
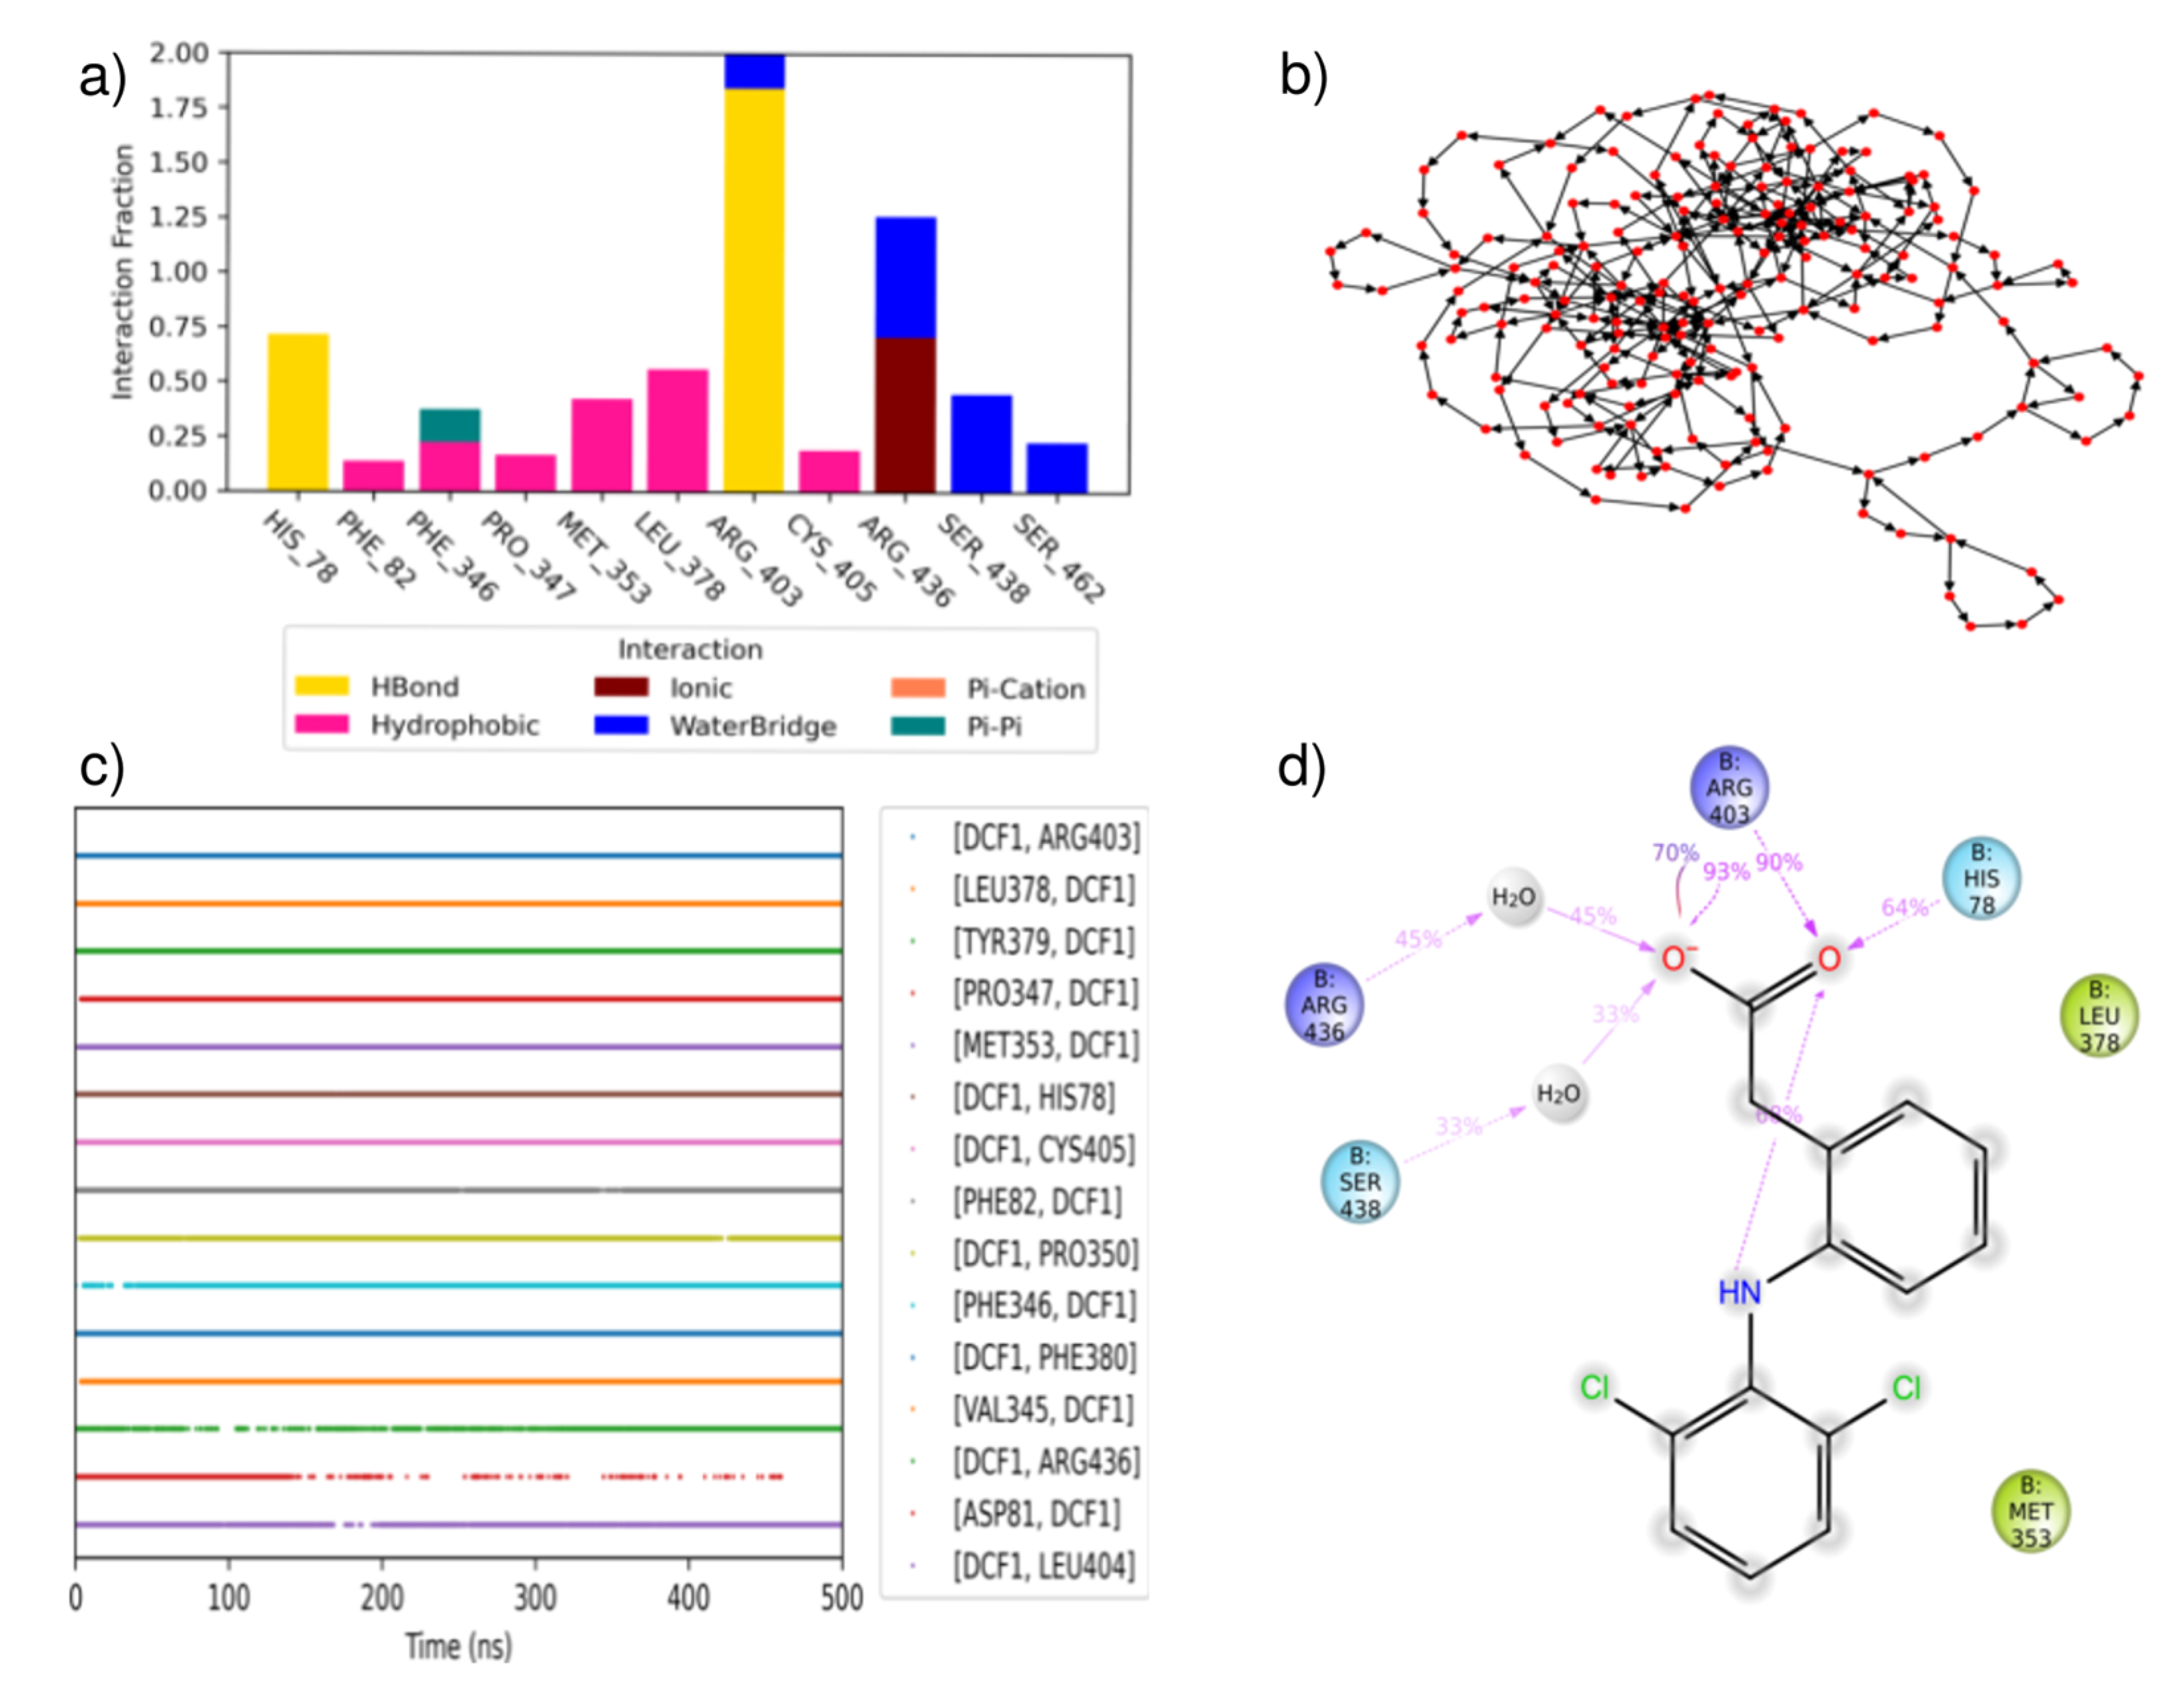
Figure 8.
Consensus analysis of MD simulation of quinclorac (QCL); a) Protein-ligand interaction fraction; b) Concurrence of contacts; c) Transition network for protein-ligand interactions; d) Ligand-protein interaction.
Figure 8.
Consensus analysis of MD simulation of quinclorac (QCL); a) Protein-ligand interaction fraction; b) Concurrence of contacts; c) Transition network for protein-ligand interactions; d) Ligand-protein interaction.
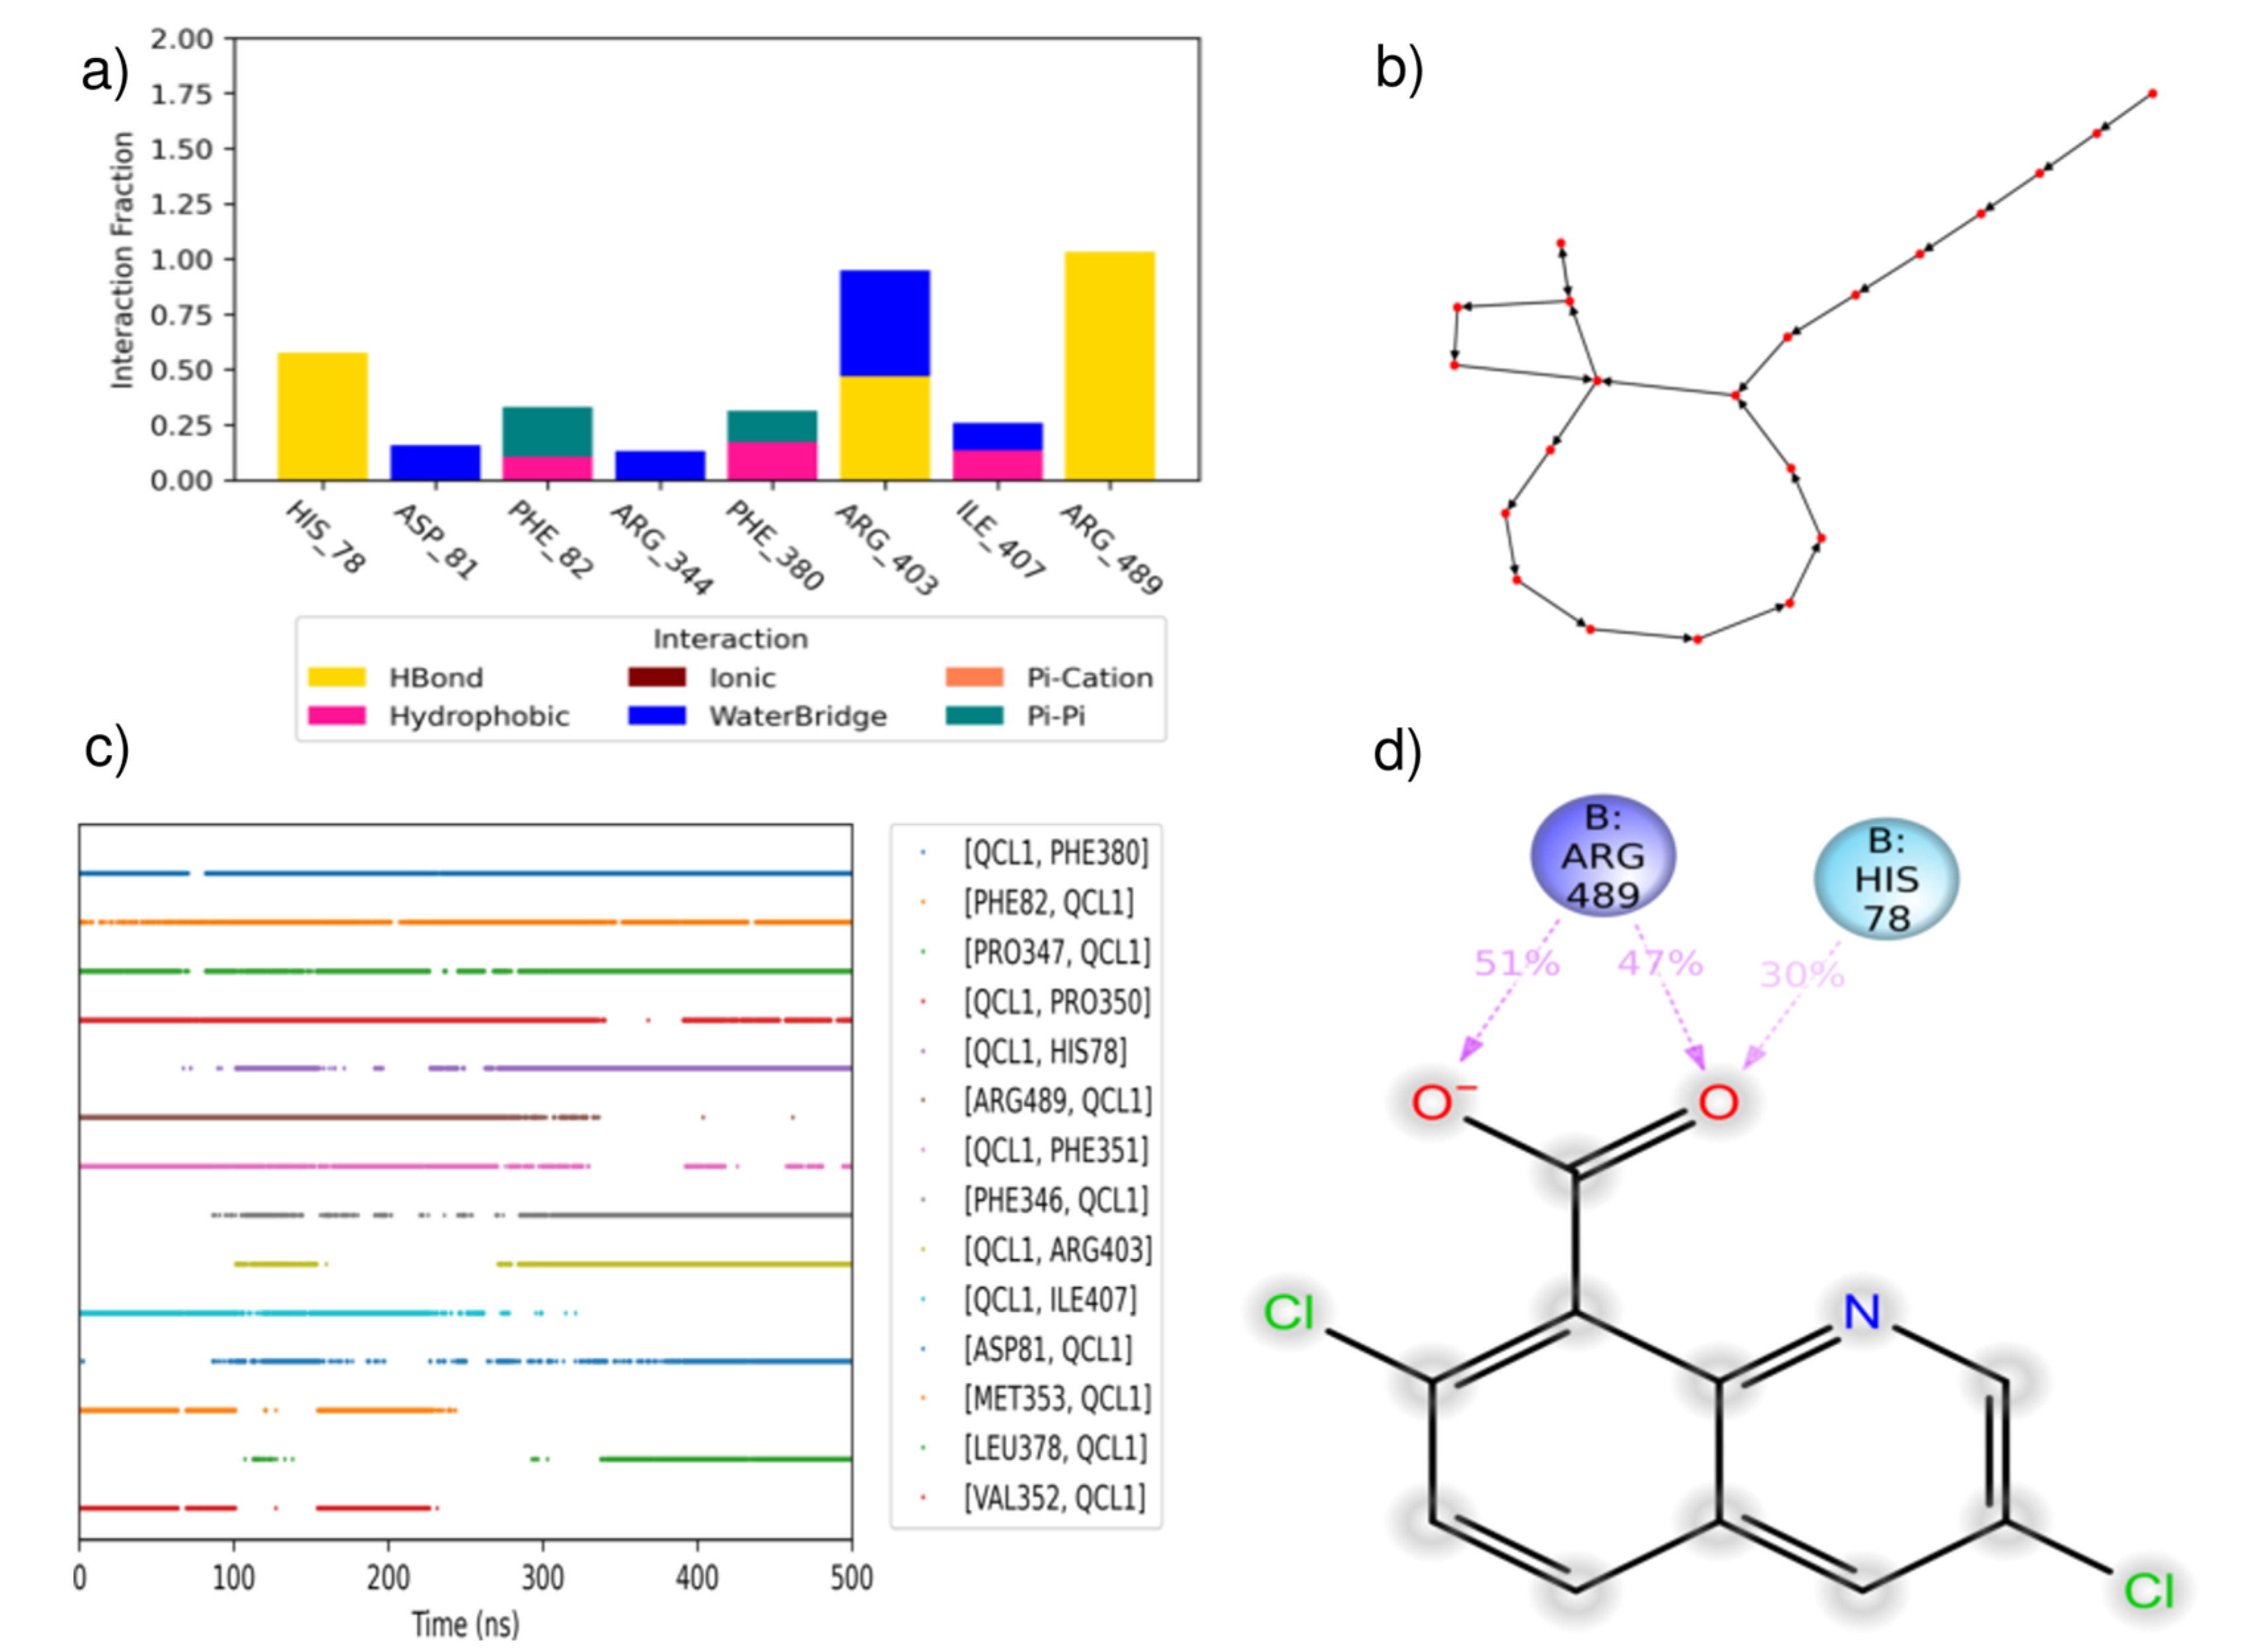
Figure 9.
Free energy surfaces computed from well-tempered metadynamics for the DCF-TIR1 complexes. With ligand positioned within the binding site (top) and positioned within the engagement niche (bottom).
Figure 9.
Free energy surfaces computed from well-tempered metadynamics for the DCF-TIR1 complexes. With ligand positioned within the binding site (top) and positioned within the engagement niche (bottom).
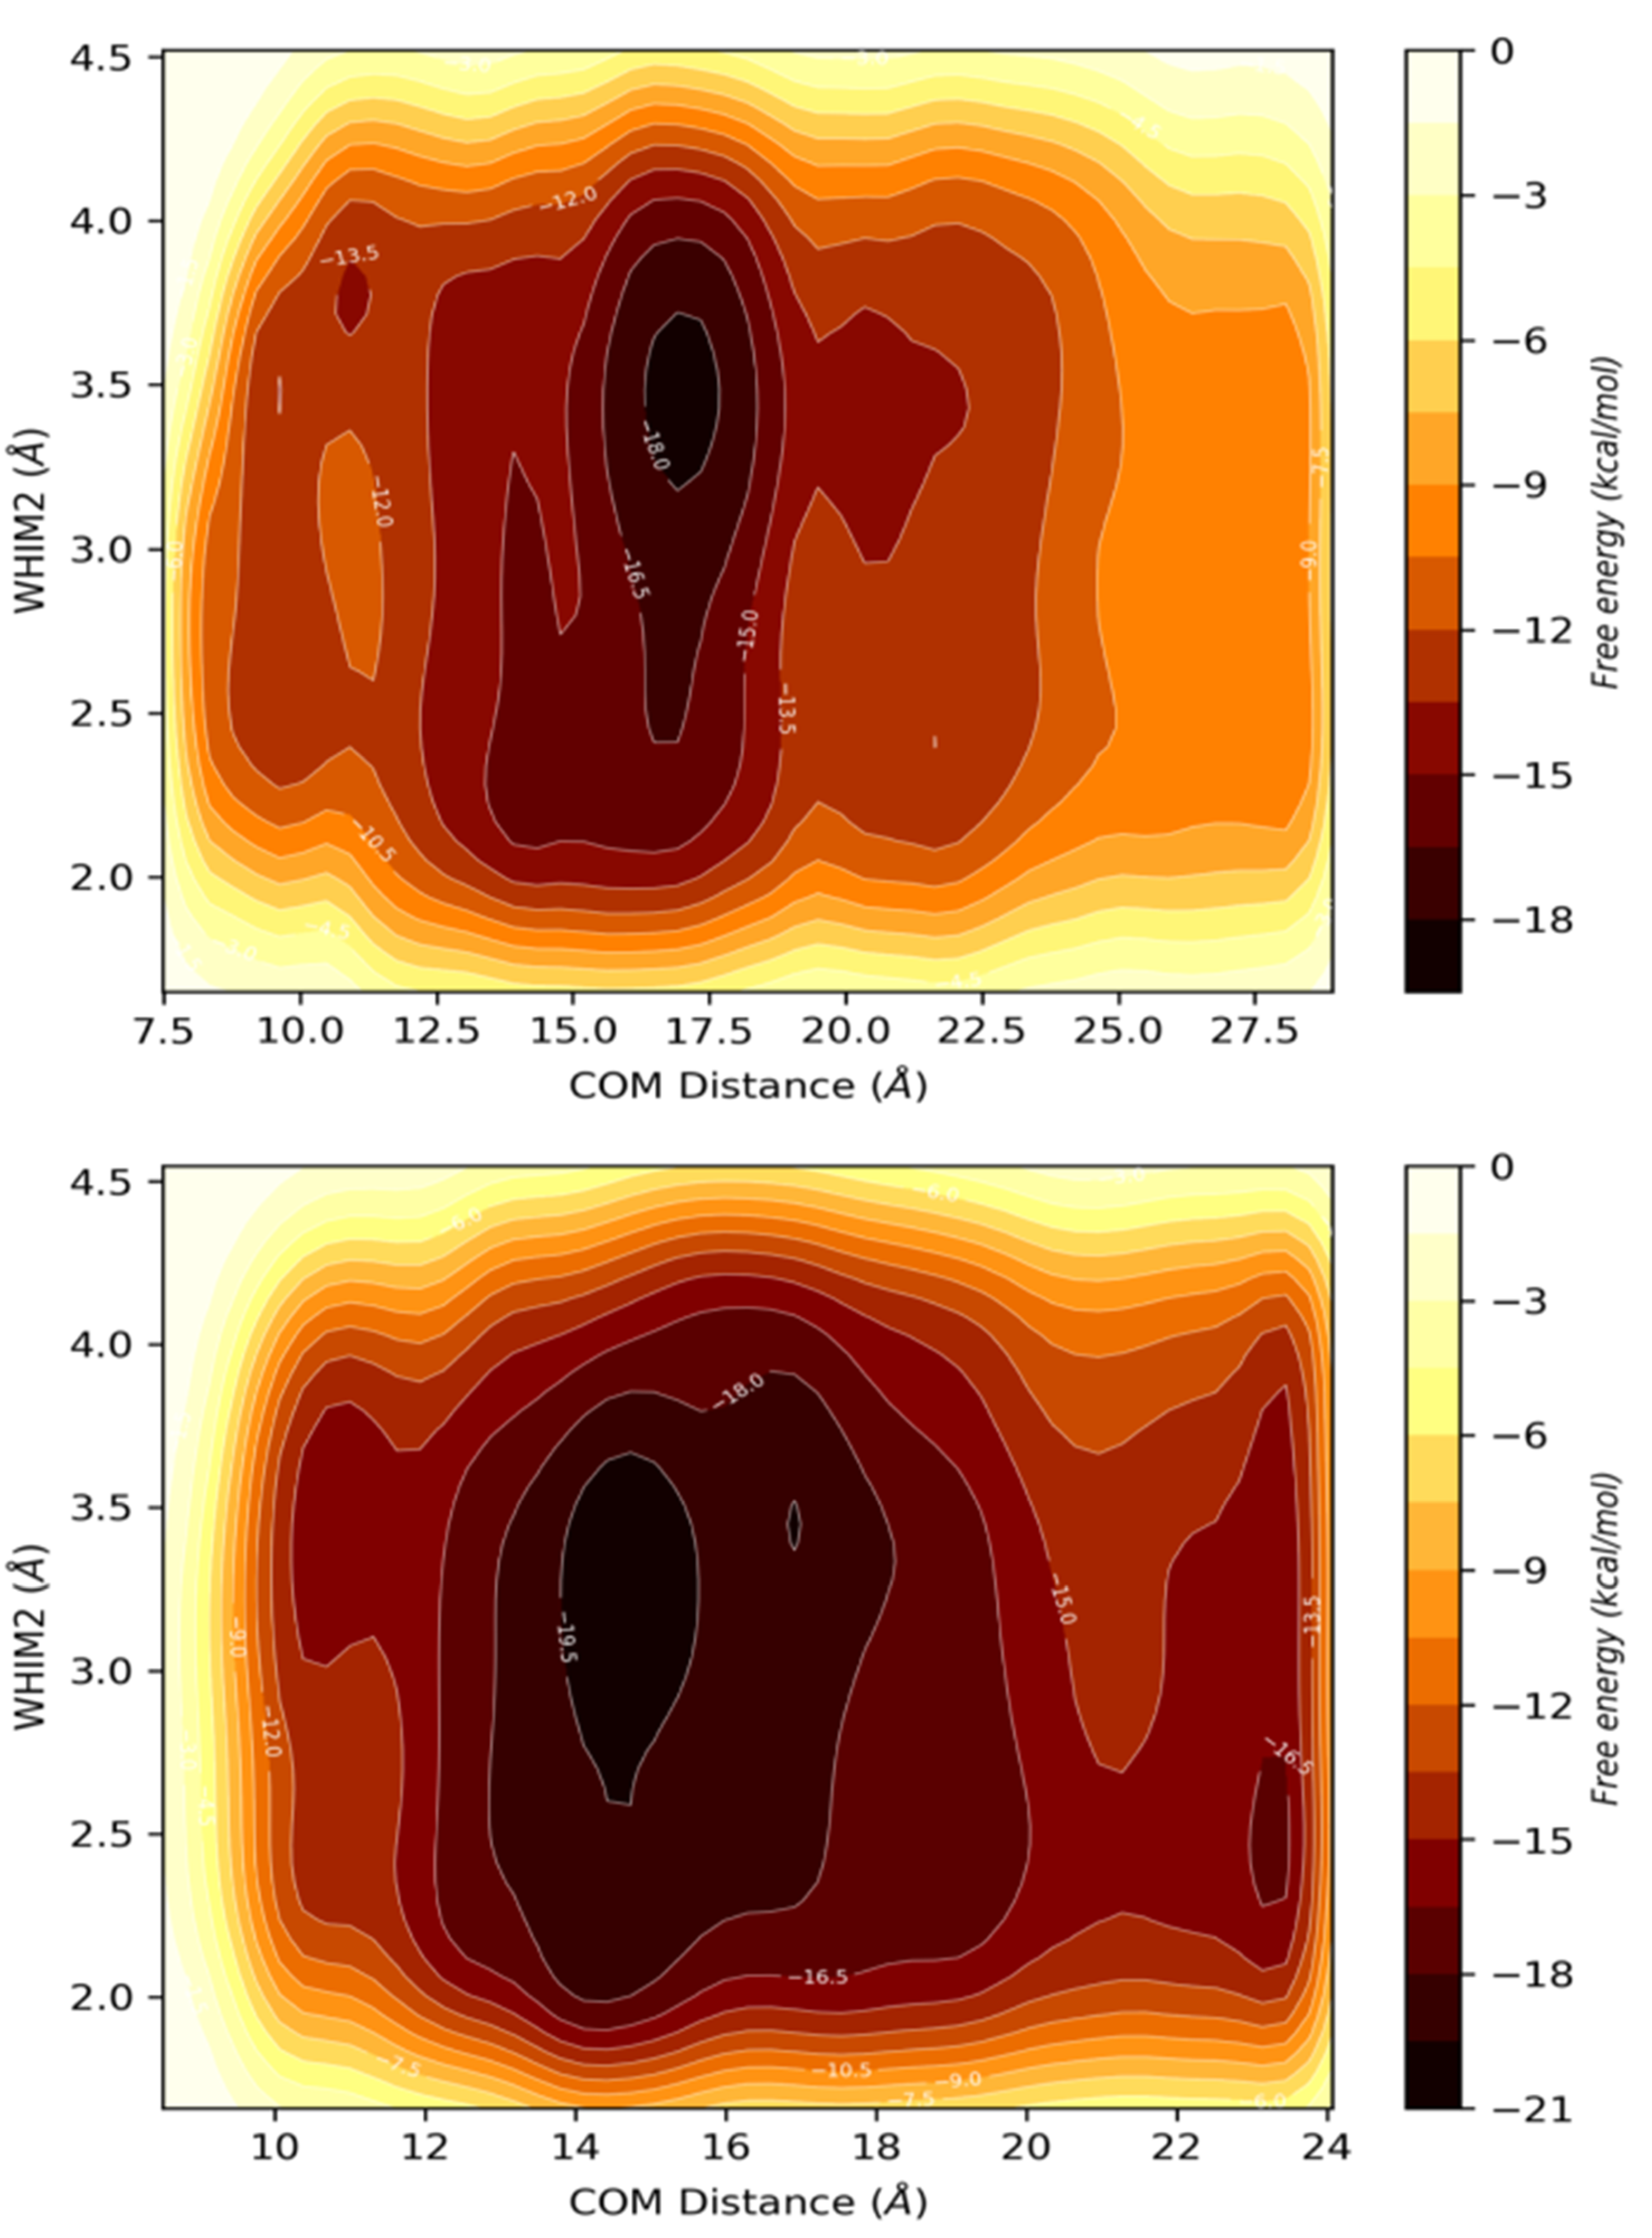
Figure 10.
Representative DCF conformations found at basins from metadynamics runs. With ligand positioned within the binding site (a) and positioned within the engagement niche (b).
Figure 10.
Representative DCF conformations found at basins from metadynamics runs. With ligand positioned within the binding site (a) and positioned within the engagement niche (b).
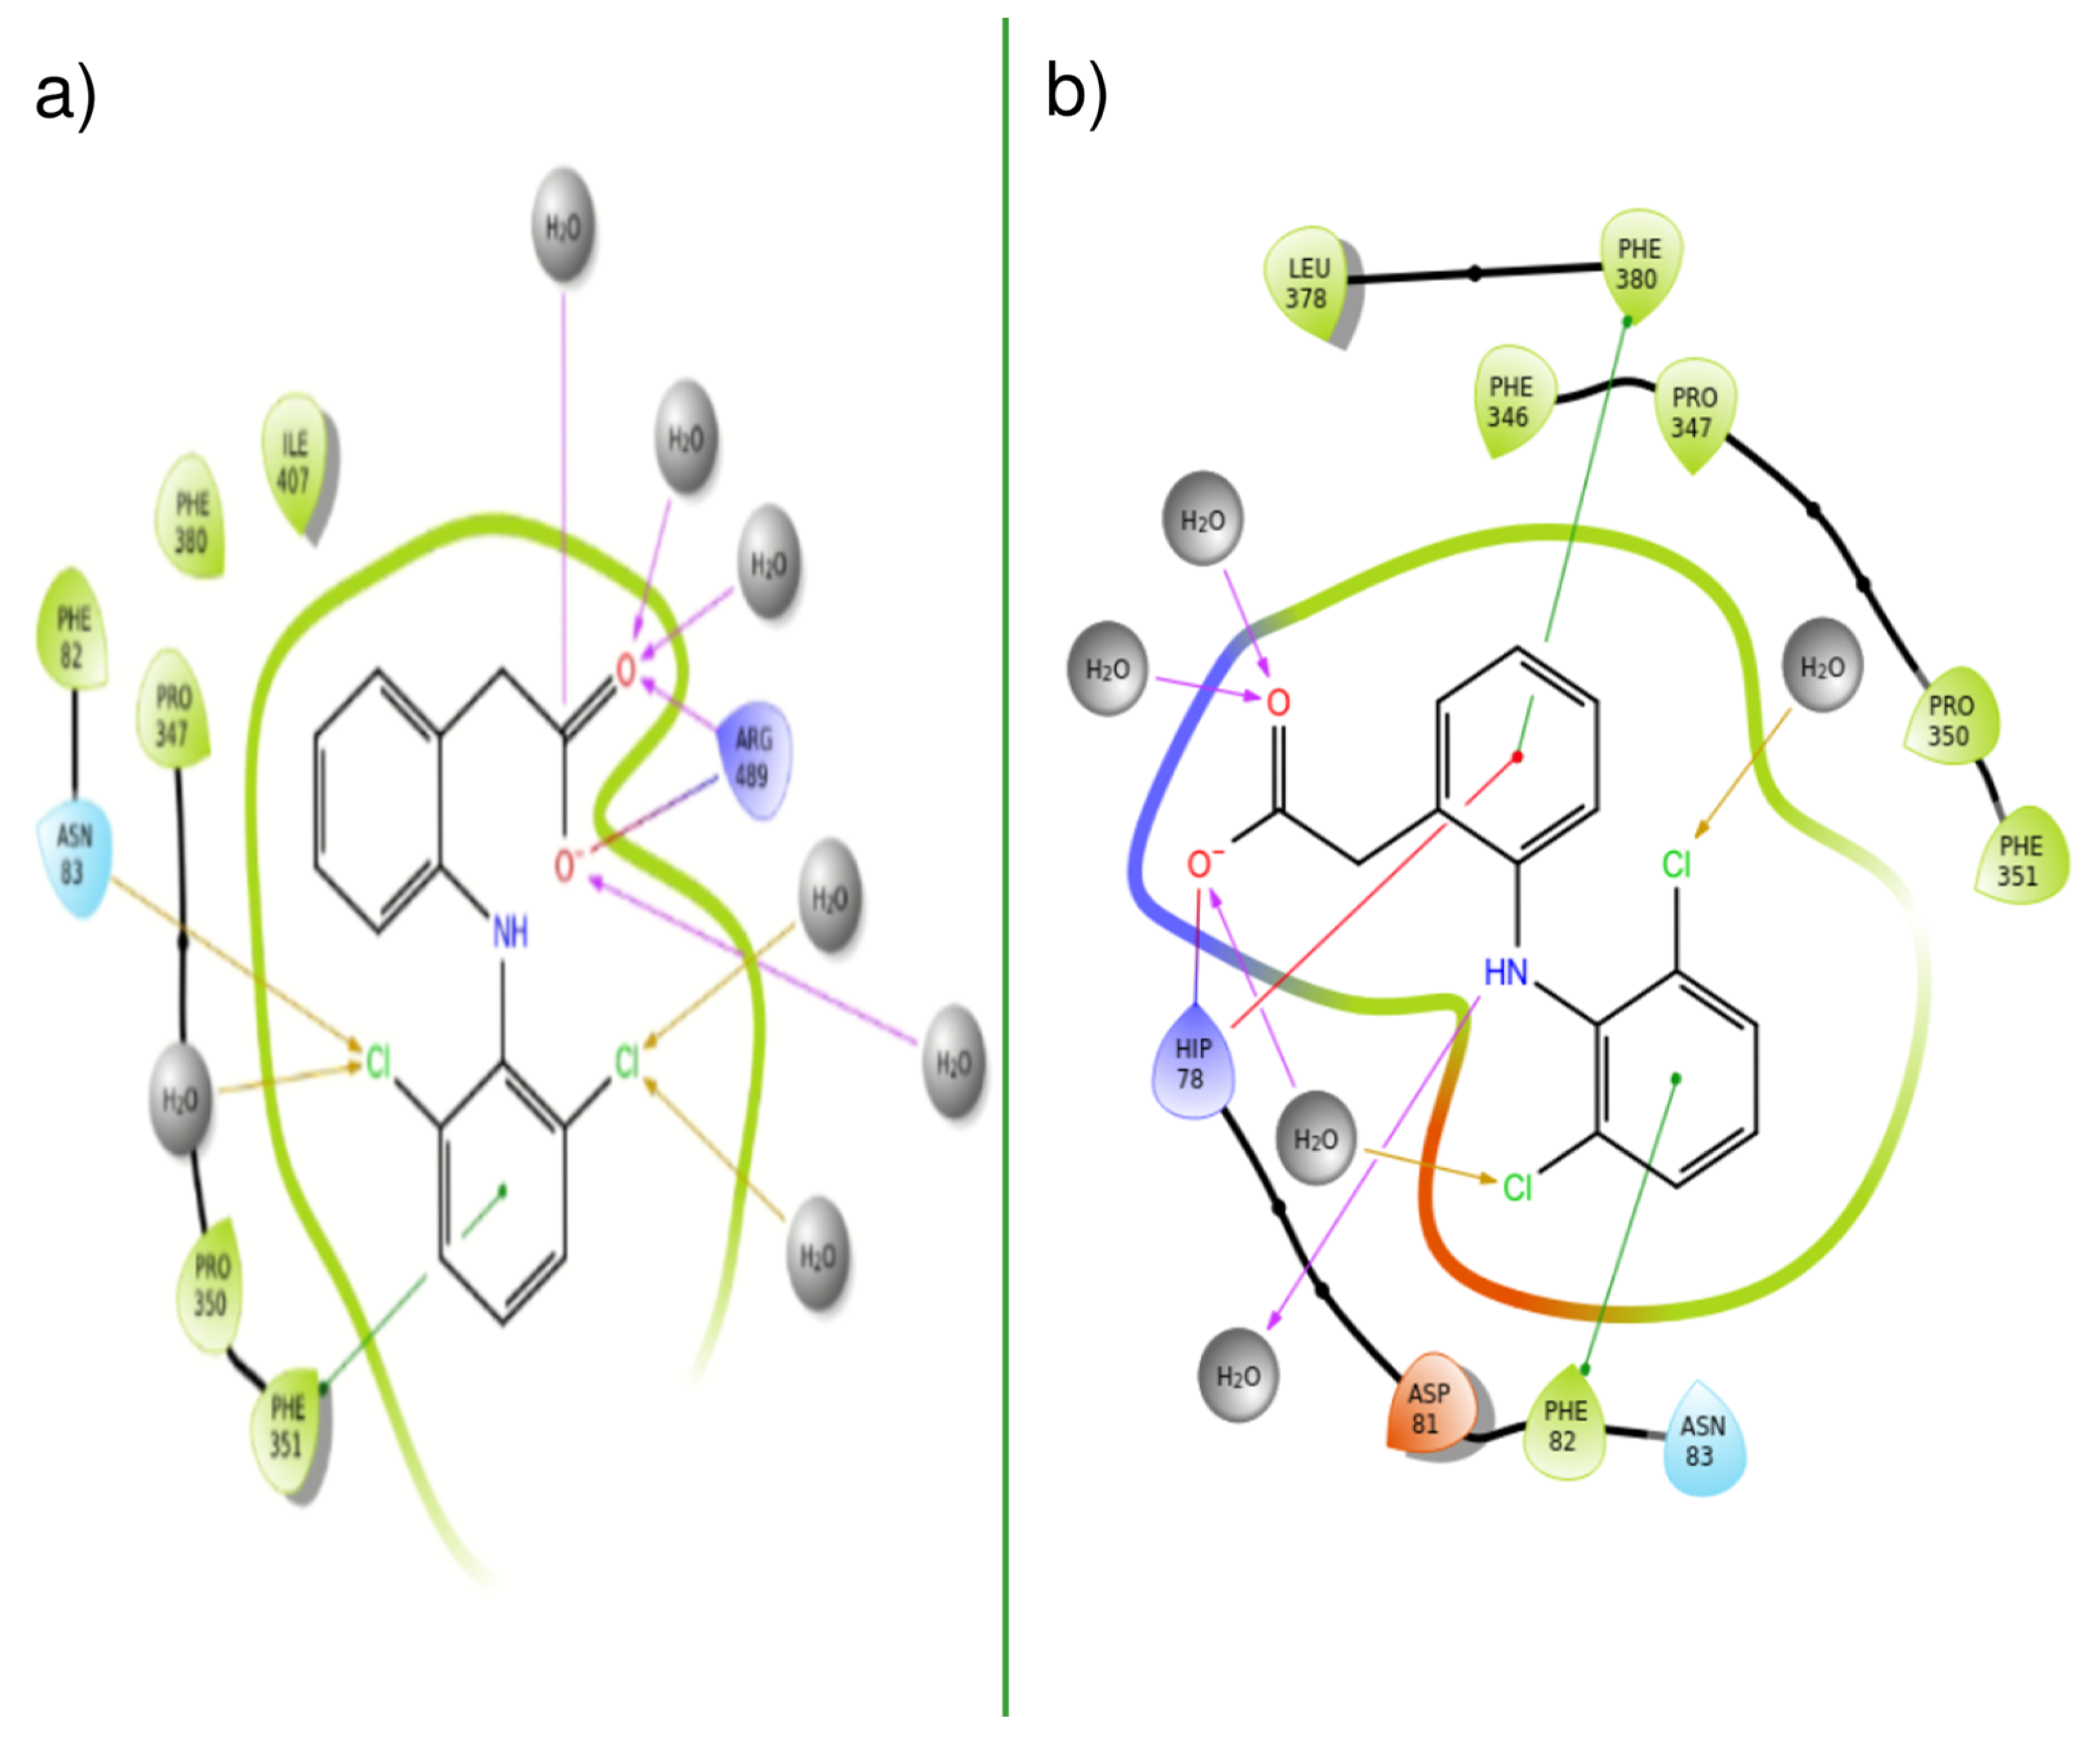
Figure 11.
Free energy surfaces computed from well-tempered metadynamics for the QCL-TIR1 complexes. With ligand positioned within the binding site (top) and positioned within the engagement niche (bottom).
Figure 11.
Free energy surfaces computed from well-tempered metadynamics for the QCL-TIR1 complexes. With ligand positioned within the binding site (top) and positioned within the engagement niche (bottom).
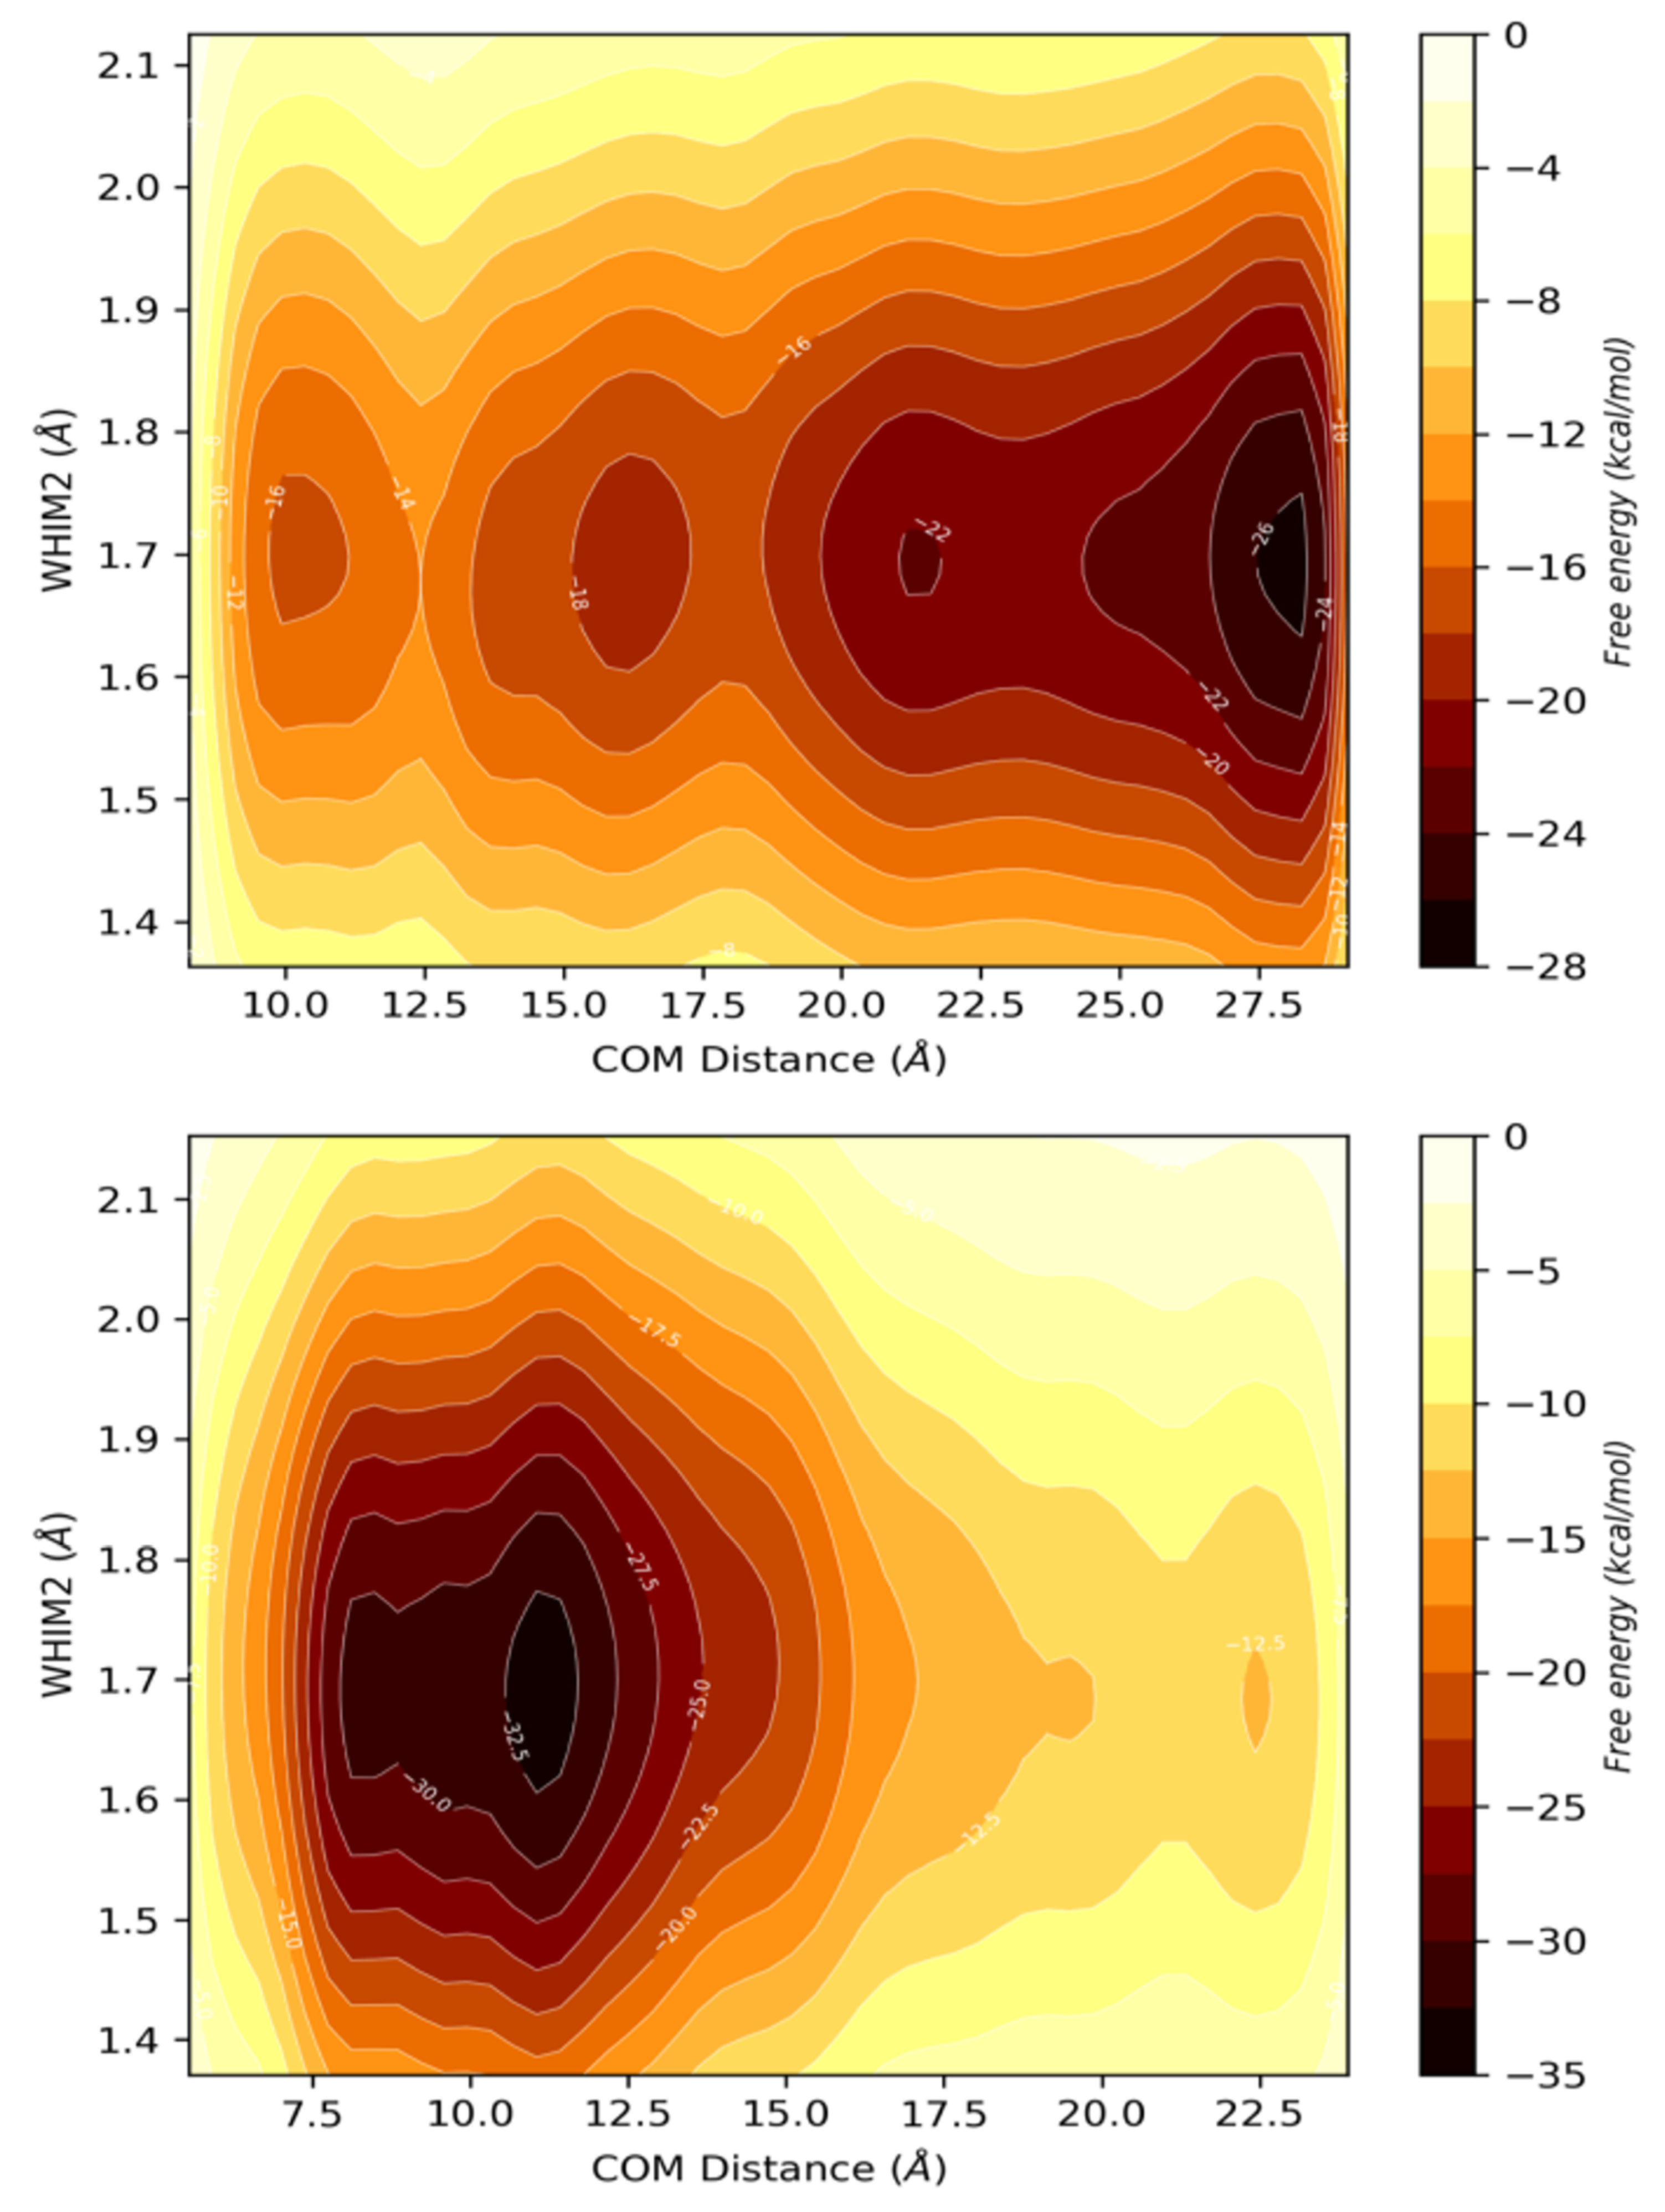
Figure 12.
Representative QCL conformations found at basins from metadynamics runs. With ligand positioned within the binding site (a) and positioned within the engagement niche (b).
Figure 12.
Representative QCL conformations found at basins from metadynamics runs. With ligand positioned within the binding site (a) and positioned within the engagement niche (b).
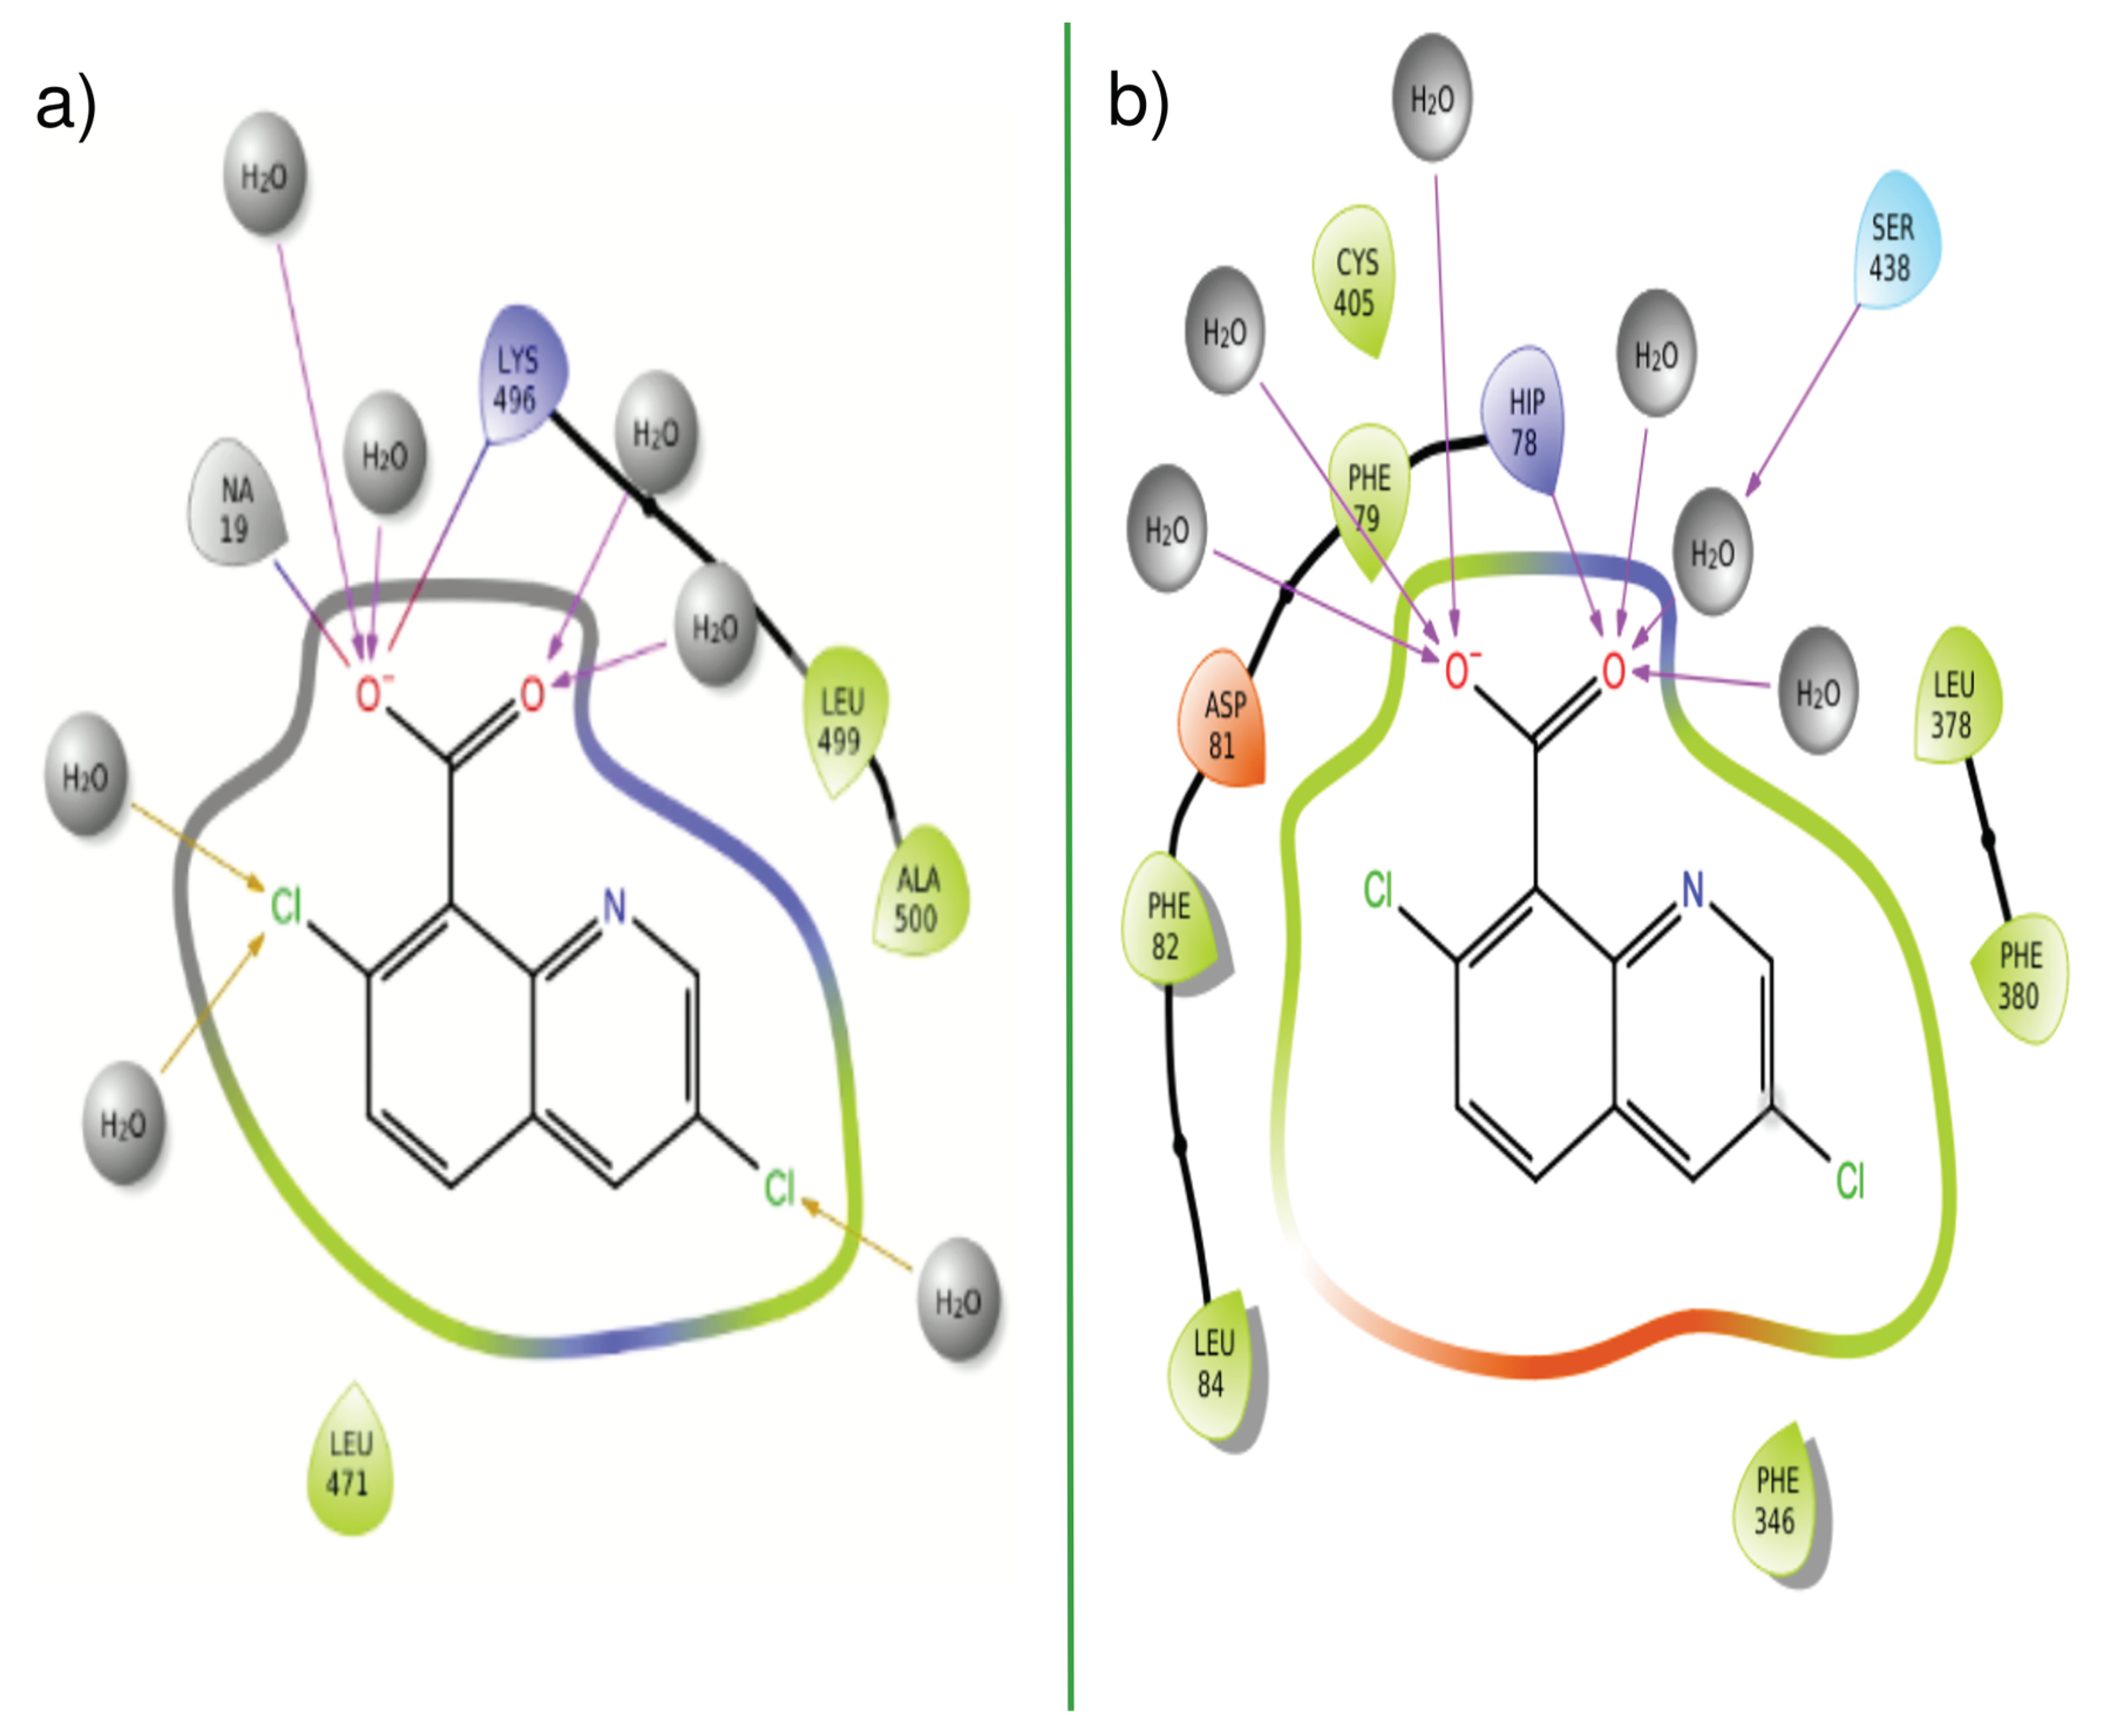

Table 1.
Root mean squared deviation values from structural alignment of TIR1 structures. Binding site residues with above average deviations are shown.
Table 1.
Root mean squared deviation values from structural alignment of TIR1 structures. Binding site residues with above average deviations are shown.
| PDBID | 2P1M | 2P1P | 2P1Q | 2P1O | 2P1N |
|---|---|---|---|---|---|
| 2P1M | (RMSD 0.16 Å) H78 - 0.32 F79 - 0.18 D81 - 0.31 F82 - 0.19 C405 - 0.27 S438 - 0.19 L439 - 0.22 S440 - 0.19 S462 - 0.18 |
(RMSD 0.22 Å) H78 - 0.3 F79 - 0.3 D81 - 0.58 F82 - 0.45 C405 - 0.27 R435 - 0.23 S438 - 0.23 L439 - 0.3 R489 - 0.22 |
(RMSD 0.27 Å) H78 - 0.36 D81 - 0.59 F82 - 0.52 C405 - 0.29 L439 - 0.87 |
(RMSD 0.33 Å) H78 - 0.41 F79 - 0.38 D81 - 0.55 F82 - 0.35 C405 - 0.54 L439 - 0.85 V463 - 0.49 A464 - 0.58 R489 - 0.33 |
|
| 2P1P | (RMSD 0.16 Å) F79 - 0.18 D81 - 0.28 F82 - 0.52 L439 - 0.2 A464 - 0.2 R484 - 0.22 |
(RMSD 0.22 Å) D81 - 0.29 F82 - 0.6 A464 - 0.22 |
(RMSD 0.26 Å) F79 - 0.26 D81 - 0.29 F82 - 0.45 C405 - 0.37 R435 - 0.27 L439 - 0.66 V463 - 0.37 A464 - 0.54 |
||
| 2P1Q | (RMSD 0.14 Å) F49 - 0.15 L439 - 0.62 S440 - 0.16 |
(RMSD 0.22 Å) H78 - 0.28 C405 - 0.29 R435 - 0.35 L439 - 0.62 V463 - 0.42 A464 - 0.4 |
|||
| 2P1O | (RMSD 0.19 Å) H78 - 0.3 F82 - 0.22 C405 - 0.31 R435 - 0.28 V463 - 0.43 A464 - 0.42 |
Disclaimer/Publisher’s Note: The statements, opinions and data contained in all publications are solely those of the individual author(s) and contributor(s) and not of MDPI and/or the editor(s). MDPI and/or the editor(s) disclaim responsibility for any injury to people or property resulting from any ideas, methods, instructions or products referred to in the content. |
© 2024 by the authors. Licensee MDPI, Basel, Switzerland. This article is an open access article distributed under the terms and conditions of the Creative Commons Attribution (CC BY) license (http://creativecommons.org/licenses/by/4.0/).
Copyright: This open access article is published under a Creative Commons CC BY 4.0 license, which permit the free download, distribution, and reuse, provided that the author and preprint are cited in any reuse.


