
Submitted:
31 March 2024
Posted:
01 April 2024
You are already at the latest version
Abstract
This study aims to enhance multimodal transportation systems by mitigating CO2 emissions and enhancing operational efficiency. It introduces a novel centralized cargo concentration approach tailored for regions facing geographical challenges. The method proposes for direct transportation of cargo from its loading origin to export ports, bypassing intermediate hubs. The mathematical model determines the most efficient means of transport for each route, factoring in variables like distance, volume, and cargo type. Research results indicate that, in scenarios with a high concentration of cargo, multiple hubs may not be necessary, which could streamline transportation and logistics operations. Modal preferences vary based on regional dynamics and cargo characteristics, with rail and sea transport emerging as preferable options under specific circumstances, surpassing the efficacy of road transport. The proposed model showcases reductions in both logistics costs and CO2 emissions compared to road-centric scenarios. It underscores the strategic integration of diverse transportation modes as pivotal for enhancing efficiency and sustainability. This study furnishes a framework adaptable to optimizing multimodal transportation systems in regions sharing similar geographical and logistical attributes.
Keywords:
Hub and spoke
; National logistic
; Multimodal system
; Emissions reduction
1. Introduction
Addressing emissions in the transportation sector stands as an essential, with optimizing its structure emerging as a pivotal strategy toward. According to the International Energy Agency, in 2018, emissions from transportation constituted a 25% of global emissions [1]. Without effective interventions, projections suggest this figure could escalate to 30% by 2030 and 50% by 2050 [2]. Notably, despite road transport representing over 70% of total transportation, its carbon intensity exceeds that of rail transport by fourfold and that of inland waterway transport by tenfold [2].
In the domain of multimodal port transportation, the strategic placement of hubs emerges as a critical factor for cargo consolidation, thereby optimizing both time and operating costs and contributing significantly to the reduction of CO2 emissions. This approach not only fortifies linkages between importing/exporting entities and port terminals, thereby bolstering their competitiveness and customer satisfaction[3], but also plays a pivotal role in crafting efficient supply chain networks and multimodal transportation systems. These networks, modeled on a hub-and-spoke paradigm, centralize operations and facilitate transshipment, consolidation, and sorting of cargo [4], achieving economies of scale and optimizing variable transportation costs. Such optimization improves shipping capabilities concerning weight, volume, accessibility, and transit times [5]. Moreover, this structured approach fosters cargo mobility, slashes greenhouse gas emissions, and augments efficiency in long-haul transportation, amplifying the advantages of local transportation [5,6,7].
The embrace of multimodal transportation hinges on several factors, including geographical attributes, allocation of public funds, and effective coordination among ports. This decision necessitates a comprehensive evaluation of the pros and cons inherent in each transportation mode[8]. Despite entailing substantial upfront investments, the multimodal system stands out for its operational efficiency and reduced environmental impact, outstripping the advantages of solely land-based transportation. This preference is substantiated by its capability to curtail greenhouse gas emissions and preserve road infrastructure, due to the alleviated burden on truck traffic [9].
The allocation and distribution of cargo in mathematical models have been widely studied in the literature. These models encompass location and routing schemes crucial for optimizing transport in multimodal ports. Notably, the Vehicle Routing Problem (VRP) and its variants, such as the Capacitated Vehicle Routing Problem (CVRP), have been extensively studied [10].The CVRP involves a fleet of homogeneous vehicles with limited capacity, while an extension, the Vehicle Routing Problem with Time Windows (VRPTW), focuses on deliveries within predefined time windows[11]. Unlike the Traveling Salesman Problem (TSP), where a single vehicle visits all points in the network, in the VRP, each vehicle serves a specific subset of points, adding complexity to the problem[12]. The VRP is a common application in distributing goods and end products from factories to multiple customers, utilizing a fleet of vehicles without intermediate storage[13]. However, integrating intermediate warehouses into logistics network design, known as the Capacitated Locations Routing Problem (CLRP), can significantly enhance efficiency[14]. The CLRP, combining the Facility Location Problem (FLP) with the VRP[15], presents a complex logistical challenge in supply chain management, involving the selection of distribution centers, customer assignment, and determining optimal delivery sequences to minimize total costs, including distribution and depot location[16].
In the field of route optimization in port contexts, various methods have been deployed to enhance operational efficiency. Deep reinforcement learning has been utilized to minimize empty truck trips, while genetic algorithms and greedy-type heuristics have aided in reducing bottlenecks and pollutant emissions[17,18]. Additionally, the amalgamation of Monte Carlo simulation with linear programming has proven effective in curtailing carbon footprint[19,20].
1.1. Contribucion
In this paper, a new approach called "multimodal approach under central freight concentration" is introduced, which redefines and customizes traditional multimodal transportation strategies. This model, based on [13], is applied in the unique geographical context of Chile, a country with a longitudinal length of 4,270 km and a width variation between 445 and 90 km.
The significance of this model arises from the pronounced concentration of cargo within the central zone of Chile, encompassing the capital and its proximate regions within a 120 km radius. Conventional hub model or concentration nodes, as per [21], prove ineffective given this geographical layout. Consequently, an alternative is proposed that advocates direct transport of cargo from its origin to the ports of export, effectively bypassing the need for intermediate hubs.
The main contribution of this research is that, in scenarios where a high concentration of cargo is observed in a specific node, it is not essential to implement multiple hubs for cargo concentration, which could significantly optimize the transportation and logistics process.
1.2. Motivation
In the global context, the importance of multimodal transportation is emphasized by a study conducted by the European Union, projecting a potential reduction of up to 40% in greenhouse gas emissions by 2030 compared to 1990 [22].
Additionally, [8] underscores the significance of multimodal transportation, delineating its three integral segments: collection, main transportation, and distribution within logistics frameworks. Concurrently, [23] delves into the intricacies of the agricultural logistics chain in China, revealing that road congestion contributes to a carbon emission surge of over 20%, thus advocating for route optimization for cold chain containers to mitigate such adverse impacts.
The present study centers on optimizing transportation routes within Chilean ports, aligning with strategic objectives outlined by the Chilean government. This strategic approach aims to strengthen national export and import logistics chains by 2030, highlighting the necessity of adapting to global sustainability trends while tackling existing challenges within freight transportation. Notably, in 2021, logistics costs in Chile constituted 18% of GDP, a figure markedly higher than the OECD average of 9% [24].In response to this scenario, the Chilean government’s Budget Directorate has been promoting innovation in research and development to enhance the country’s productivity, competitiveness, and diversification of production [25]. Furthermore, the Chilean Economic Development Agency identified deficiencies in the intermodal network as early as 2017, thereby driving initiatives aimed at fostering smarter port infrastructure development [26].
The aim is to answer key questions:
- How to optimize the route in a freight transport network with limitations of port and multimodal transport?
- How to improve the efficiency of truck routes in ports to reduce CO2 emissions and transportation times?
- What is the optimal geographical location for a container consolidation center in a port network?
This study provides a methodological framework to answer the research questions posed, focusing on the adaptation of existing transportation models to the particularities and specific needs of Chile.
This research is structured into several sections: Section 1 introduces the context, contribution, and motivation of the study. Section 2 covers the theoretical background, providing a description of the transportation network in Chile and an exhaustive literature review. Section 3 details the materials and methods used. Section 4 is dedicated to the practical application development of the study. Finally, Section 5 and Section 6 present the results, discuss the findings, and provide the conclusions of the research.
2. Background
2.1. Description of System
Chile’s transportation network is a linchpin of its open economy, constituting 11.7% of GDP in 2022, encompassing roads, railways, and coastal shipping. In 2023, cargo distribution comprised solid bulk (47%), liquid bulk (22%), general cargo containers (24%), refrigerated cargo (4.4%), and other types (2.6%) CAMPORT2024. These goods traverse a comprehensive network of land, rail, and maritime infrastructure to reach public and private ports, which collectively manage 96.4% of the country’s imports and exports CAMPORT2024. Despite its pivotal role, multimodal transportation remains underdeveloped compared to individual modes.
Chile boasts 3,570 kilometers of paved dual-carriageway roads and a total road network spanning 28,700 kilometers, with 15,441 kilometers being asphalted [27]. Additionally, its national road infrastructure extends to 88,510 kilometers [27]. The railway infrastructure, predominantly linking central zones with maritime ports, plays a pivotal role in facilitating the transportation of a wide array of cargo.
Regarding port infrastructure, Chile harbors 56 ports, comprising 10 state-owned public ports, 14 privately-owned public ports, and 32 private ports. Among them, the ports of Valparaíso, featuring 8 docking sites across 5 docks, and San Antonio, with 3 docks and 8 docking sites, hold prominence in this study [28]. Seven out of the ten state-owned port companies operate under active concession contracts [29].
The country’s domestic transportation primarily relies on road, rail, and coastal shipping, with 88% of tonnage destined for international trade and 12% for the domestic market [30]. Containerized cargo is distributed as follows: 42.7% in imports, 45.1% in exports, 8.6% in transit, and 3.4% in coastal shipping, mobilizing 12% of domestic trade in containers [31]. Major cargo types include solid waste, cellulose, copper concentrate, general cargo containers, metallic copper, and agricultural products, among others, transported from production and distribution centers to port facilities.
2.2. Related Works
To understand how to model routes in freight transport networks considering port and multimodal limitations, optimize the location of distribution centers with a space-time approach, and comprehend the challenges and decisions related to reducing pollutant emissions and logistic inefficiencies, an exhaustive literature review was conducted using the Web of Science and SCOPUS databases. The query used was: (TS=(("Freight transport" or "Logistics planning" or "Route optimization" or "Freight consolidation") and ("Multimodal" or "transport optimization" or "Transport network") and ("port")). The resulting research from the search was qualitatively analyzed, selecting those presented in Table 1.
Table 1 illustrates the main applications of multimodal transportation in the transportation and port industry, revealing a variety of employed mathematical models. However, these models focus on specific aspects and do not address the vehicle routing problem, such as the Vehicle Routing Problem (VRP), its variants like the Capacitated Vehicle Routing Problem (CVRP) [10], or the hub and spoke model, utilized in this study [13,21].
Unlike these methodologies that tackle specific aspects of the problem, this article proposes a comprehensive model for the operation of the entire system. The objective is to minimize the total cost and reduce the ton-kilometers transported, thus contributing to the decrease in pollutant emissions.
3. Optimization Modeling
3.1. Model Assumptions
In this study, classical optimization was employed due to its ability to generate interpretable and transparent solutions, which is suitable in scenarios with limited data where machine learning methods are not applicable due to the lack of high-quality data. Classical optimization, efficient due to its simplicity and lower demand for computational resources, proves to be particularly effective compared to techniques such as deep learning in contexts with clear deterministic rules, providing analytical solutions without the need for large volumes of information.
A mathematical model is used to determine the distribution of loads and warehouses, identifying concentration and distribution nodes, as shown in the conceptual diagram of the multimodal system in Figure 2.
The model consists of various entities representing its indexes:
-
Zones of origin of the load (index i):
- -
- Metropolitan Region, Santiago (i=1),
- -
- Valparaíso Region, Valparaíso (i=2),
- -
- O’Higgins Region, Rancagua (i=3),
- -
- Maule Region, Talca (i=4),
- -
- Bío Bío Region, Concepción (i=5),
- -
- Temuco Region, Temuco (i=6),
- -
- Los Lagos Region, Puerto Montt (i=7),
- -
- General Carlos Ibáñez del Campo Region of Aysén, Coyhaique (i=8),
- -
- Magallanes and Antarctica Chilen Region, Punta Arenas (i=9)
- -
- Los Lagos Region, Valdivia (i=10)
-
Port cargo destination zones (index j):
- -
- San antonio (j=1),
- -
- Valparaíso (j=2)
-
Consolidation node installation zones (index k):
- -
- Metropolitana Region, Santiago (k=1),
- -
- Valparaíso Region, Valparaíso (k=2),
- -
- O’Higgins Region, Rancagua (k=3),
- -
- Maule Region, Talca (k=4),
- -
- Bío Bío Region, Concepción (k=5),
- -
- Temuco Region, Temuco (k=6),
- -
- Los Lagos Region, Puerto Montt (k=7),
- -
- General Carlos Ibáñez del Campo Region of Aysén, Coyhaique Region(k=8),
- -
- Magallanes and Antarctica Chilen Region, Punta Arenas (k=9)
- -
- Los Lagos Region, Valdivia (k=10)
-
Distribution node zones (index m)
- -
- San Antonio (m=1),
- -
- Zeal Zone of Valparaíso (m=2),
- -
- Midpoint between San Antonio and Valparaíso (m=3),
- -
- Calera (m=4)
-
Modes of transport (index r):
- -
- Road (r=1),
- -
- Train (r=2),
- -
- Ship (r=3)
-
Type of product (index p):
- -
- General cargo (p=1),
- -
- Refrigerated cargo (p=2),
- -
- Liquid cargo (p=3),
- -
- Bulk cargo (p=4)
3.2. Objective Function
The objective function integrates six terms: The first two penalize the cost of opening and operating a distribution and cargo consolidation center for 20 years. The remaining four, linked to potential solutions of the problem, incorporate binary variables (with a value of 1 if the solution is employed and 0 otherwise). For example, the third term, multiplied by the binary variable , represents a solution that excludes distribution and consolidation nodes. The fourth term represents the interaction between a distribution center at node k and a consolidation center at node m, multiplied by the binary variable . The fifth term refers to the solution that consolidates at a single node, k, represented by . Finally, the sixth term implies a unique solution with a consolidation center at node m, represented by the variable .
Subject to:
Constraint 2.1 limits the choice to a single solution among the four possible ones, represented by the variables . Constraint 2.2 ensures the connection from the source node i to the consolidation node k only if the latter is operational. Constraint 2.3 establishes transit from consolidation node k to destination node j only if k is operational. Constraint 2.4 ensures the connection of node k to m only when consolidation node k is operational. Constraint 2.5 guarantees transit from node k to node m only when the latter is operational. Constraint 2.6 ensures the existence of at most one distribution center. Constraint 2.7 limits the number of consolidation centers to one. Constraint 2.8 ensures that cargo transportation proceeds directly from the source node i to a final destination j, or through consolidation nodes k or m. Constraint 2.9 establishes that direct cargo transportation from i to j is feasible only if binary variable is one; otherwise, this route is discarded. Constraint 2.10 guarantees that cargo transportation from source node i to consolidation node k is only feasible if binary variable is one; otherwise, this transportation is unviable. Constraints 2.11 and 2.12 specify that cargo can only be transported directly from k to destination node j and distribution node m, respectively, under the same condition of being one. Constraint 2.13 determines that cargo transportation from node k to distribution node m is only allowed if is one, prohibiting it otherwise. Constraint 2.14 ensures direct cargo transportation from node m to destination node j only when binary variable is one. Constraint 2.15 ensures a similar condition for transportation from node i to distribution node m. If it is not one, the corresponding transportation is not allowed.
The proposed model, based on the Hub and Spoke strategy and without a predefined value of p, overcomes the limitations of a fixed number of hubs, providing flexibility in the allocation of stations for cargo consolidation or deconsolidation. This adaptability is evidenced in Figure 2, where two optional hubs are highlighted, whose selection depends on factors such as cargo, costs, and distances. Given Chile’s elongated geography, it is suggested to locate these hubs in strategic regions: one in the central-south and another in a central area close to the main ports.
4. Optimization Data for the Chilean Multimodal System
4.1. Freight Transport Data: Distances and Volumes
4.2. Costs of Different Means of Transportation
Table 9 summarizes the variable costs of railway transportation for both cargo and containers in the south of Chile. Additionally, Table 10 and Table 11 present the unit costs of road and maritime transportation, respectively, based on the type of cargo. A fixed exchange rate of 700 CLP per dollar [48] is applied.
4.3. Warehousing Costs
5. Results
The results presented in Table 13 are derived from the data contained in Table 5 to Table 12 and are based on the proposed mathematical model, consisting in a non-linear integer binary programming. This model employs 2,369 binary variables and 6,932 constraints, implemented in GAMS [51] and solved using SCIP version 3.1 [52] in the same environment, through a specific MIQCP routine of SCIP.
The results indicate that, for the metropolitan region, the transport of cargo by rail to both ports is the most appropriate. In regions five and six, bulk cargo shipping via train is advised, while road transport proves more efficient for other cargo types. Conversely, in the seventh region, maritime transport to both ports is preferred for most cargo types, with the exception of bulk cargoes destined for San Antonio, which are better served by road.
For the eighth region, maritime transportation is favored, while regions nine through fourteen demonstrate enhanced efficiency through a blend of maritime and land transport. Notably, the model eschews cargo consolidation or distribution centers due to the substantial volume of cargo (39.4%) originating from the metropolitan region, situated further north. Establishing centers there would entail redundant movements and an additional estimated cost of 19 million per center.
Over a 20-year span, the solution without centers incurred costs of 2.626 billion, representing only 30% compared to the 8.642 billion from an exclusively road transport model. Furthermore, this multimodal strategy led to a notable reduction in CO2 emissions, totaling 12,794 tons compared to the 66,190 tons generated by the current model, reflecting a decrease of 19.3%. It’s important to note that this analysis factored in a 30-kilometer increase in road transportation for all regions from their respective capitals.
6. Discussion and Conclusions
6.1. Optimization Model
The classical "hub and spoke" model is applied to logistic networks through hubs that function as multimodal warehouses. In the study of the model applied to Chile, the optimal solution dispenses with these hubs, favoring a hub-less exchange approach. This mathematical model, which distinguished between concentrating and deconcentrating hubs, opted for a multimodal strategy with multiple modes of transportation. This decision is justified by Chile’s elongated geography and the clustering of cargo generators near Santiago, the capital[53].
The application of this research addresses an adaptation of the hub and spoke model to the specific context of a country with territorial concentration in cargo generation and distribution. The general version of the model, in its p-hub version, selects an optimal quantity of hubs[54]. However, given the country’s particular geographical characteristics, the possibility of establishing a maximum of two hubs was considered: one in the south to concentrate cargo and another in the central zone, near the ports, for unloading. Contrary to this hypothesis, the optimal results of the model suggest dispensing with these hubs, favoring direct transportation of cargo from generation points to ports. This approach not only optimizes logistics but also significantly contributes to reducing greenhouse gas emissions.
6.2. Multimodal System
This study emphasizes the need to optimize road transportation in Chile, especially in the central and southern regions of the country, and contrasts its advantages and limitations with those of railway and maritime transportation. It is highlighted that, although the railway is efficient for large volumes and long distances, and maritime transport excels in certain conditions, each mode has specific characteristics and costs that influence logistics efficiency [55].
The State Railways Company (EFE) plays a key role in logistics, connecting productive regions with ports, but faces challenges such as the lack of direct connections in some areas. Railway transport is highlighted for its sustainability, especially when using renewable energies, offering an alternative with lower environmental impact compared to road transport [56]. However, limited flexibility and the need for truck transshipment, which increases loading and unloading costs, mark disadvantages compared to the versatility of road transport.
In terms of operational efficiency and CO2 emissions, railway transport, powered by unconventional renewable energies (ERNC), emerges as a significantly cleaner option compared to the emissions capacity of the truck fleet [57].
In conclusion, the optimization of transportation in Chile requires a strategic integration of road, railway, and maritime modes, aiming to maximize efficiency, sustainability, and emissions reduction in freight transportation.
6.3. Future Research
Exploring the impact of integrating emerging technologies, such as automation and digitization, on the efficiency of multimodal transportation is essential. In the future, it will be possible to assess the viability of replicating the model in regions with similar geographical and logistical characteristics, adapting solutions to different national or international contexts. Additionally, investigating the role of public-private cooperation in the development and implementation of these transportation solutions, analyzing their long-term socioeconomic and environmental impact, is crucial. In this context, considering a new routing model and possible consolidation, integrating it with neighboring countries in the multinational project "bioceanic corridor," involving Argentina, Brazil, Chile, and Paraguay, is proposed[58].
In a forthcoming study, the impact of increased volume in Chile’s ports and cities could be evaluated, considering both economic benefits and potential port overloads. It is essential to analyze the current infrastructure’s capacity to efficiently manage the anticipated increase in international cargo, using a routing model with limited capacity that considers customs restrictions and points of loading.
Author Contributions
Conceptualization Ivan Derpich (ID) and Fabricio Moreno (FM) ; methodology, Claudia Duran (CD) and Christian Fernandez (CF); software, Raul Carrasco (RC) and Leonardo Espinoza (LE); validation, ID and FM; formal analysis, CD and CF; investigation, ID, CD, RC and LE; resources, ID and FM ; data curation, CD and CF; writing—original draft preparation, CD, ID and RC; funding acquisition, CD and CF All authors have read and agreed to the published version of this manuscript.
Funding
This research and the APC were funded by "Facultad de Ingeniería de la Universidad de Santiago de Chile (USACH), Chile”.
Institutional Review Board Statement
Not applicable.
Informed Consent Statement
Not applicable.
Data Availability Statement
Not applicable.
Acknowledgments
This research was funded by the following ANID grants by the Regional Cooperation Program STIC-AmSud AMSUD220026
Conflicts of Interest
The authors declare no conflict of interest
Abbreviations
The following abbreviations are used in this manuscript:
| MDPI | Multidisciplinary Digital Publishing Institute |
| DOAJ | Directory of open access journals |
| TLA | Three letter acronym |
| LD | Linear dichroism |
References
- Idowu, S.; Schmidpeter, R.; Capaldi, N.; Zu, L.; Del Baldo, M.; Abreu, R. (Eds.) CO2 Emissions in 2022; Springer: Cham, 2023; pp. 600–600. [Google Scholar] [CrossRef]
- Li, H.; Wang, Y. Hierarchical Multimodal Hub Location Problem with Carbon Emissions. Sustainability 2023, 15, 1945. [Google Scholar] [CrossRef]
- Islam, D.M.Z.; Dinwoodie, J.; Roe, M. Promoting development through multimodal freight transport in Bangladesh. TRANSPORT REVIEWS 2006, 26, 571–591. [Google Scholar] [CrossRef]
- Li, S.; Zu, Y.; Fang, H.; Liu, L.; Fan, T. Design Optimization of a HAZMAT Multimodal Hub-and-Spoke Network with Detour. International Journal of Environmental Research and Public Health 2021, 18, 12470. [Google Scholar] [CrossRef] [PubMed]
- Yin, C.Z.; Ke, Y.D.; Chen, J.H.; Liu, M. Interrelations between sea hub ports and inland hinterlands: Perspectives of multimodal freight transport organization and low carbon emissions. OCEAN & COASTAL MANAGEMENT 2021, 214. [Google Scholar] [CrossRef]
- Zheng, Y.; Ji, Y.; Shen, Y.; Liu, B.; Du, Y. Hub location problem considering spoke links with incentive-dependent capacities. Computers & Operations Research 2022, 148, 105959. [Google Scholar] [CrossRef]
- of Ministers of Transport, E.C. Transport Policy and Global Warming; University of Michigan, 1993; p. 241.
- Elbert, R.; Müller, J.P.; Rentschler, J. Tactical network planning and design in multimodal transportation – A systematic literature review. Research in Transportation Business & Management 2020, 35, 100462. [Google Scholar] [CrossRef]
- Taran, I.; Olzhabayeva, R.; Oliskevych, M.; Danchuk, V. Structural Optimization of Multimodal Routes for Cargo Delivery. Archives of Transport 2023, 67, 49–70. [Google Scholar] [CrossRef]
- Desrochers, M.; Lenstra, J.K.; Savelsbergh, M.W.P. A classification scheme for vehicle routing and scheduling problems. European Journal of Operational Research 1990, 46, 322–332. [Google Scholar] [CrossRef]
- Ghoseiri, K.; Ghannadpour, S.F. Multi-objective vehicle routing problem with time windows using goal programming and genetic algorithm. Applied Soft Computing 2010, 10, 1096–1107. [Google Scholar] [CrossRef]
- Khoufi, I.; Laouiti, A.; Adjih, C. A Survey of Recent Extended Variants of the Traveling Salesman and Vehicle Routing Problems for Unmanned Aerial Vehicles. Drones 2019, 3, 66. [Google Scholar] [CrossRef]
- O’Kelly, M.E.; Campbell, J.F.; de Camargo, R.S.; de Miranda Jr, G. Multiple Allocation Hub Location Model with Fixed Arc Costs. Geographical Analysis 2015, 47, 73–96. [Google Scholar] [CrossRef]
- Zhang, H.; Liu, F.; Ma, L.; Zhang, Z. A Hybrid Heuristic Based on a Particle Swarm Algorithm to Solve the Capacitated Location-Routing Problem With Fuzzy Demands. IEEE Access 2020, 8, 153671–153691. [Google Scholar] [CrossRef]
- Hu, Y.; Zhang, K.; Yang, J.; Wu, Y. Application of Hierarchical Facility Location-Routing Problem with Optimization of an Underground Logistic System: A Case Study in China. Mathematical Problems in Engineering 2018, 2018, 7235048. [Google Scholar] [CrossRef]
- Zare Mehrjerdi, Y.; Nadizadeh, A. Using greedy clustering method to solve capacitated location-routing problem with fuzzy demands. European Journal of Operational Research 2013, 229, 75–84. [Google Scholar] [CrossRef]
- Adi, T.N.; Bae, H.; Iskandar, Y.A. Interterminal Truck Routing Optimization Using Cooperative Multiagent Deep Reinforcement Learning. Processes 2021, 9. [Google Scholar] [CrossRef]
- Evangelista, D.G.D.; Vicerra, R.R.P.; Bandala, A.A. Approximate Optimization Model on Routing Sequence of Cargo Truck Operations through Manila Truck Routes using Genetic Algorithm. 2020 IEEE 12th International Conference on Humanoid, Nanotechnology, Information Technology, Communication and Control, Environment, and Management (HNICEM); IEEE: Manila, Philippines, 2020; pp. 1–5. [Google Scholar] [CrossRef]
- Heilig, L.; Lalla-Ruiz, E.; Voss, S. Multi-objective inter-terminal truck routing. Transportation Research Part E-Logistics and Transportation Review 2017, 106, 178–202. [Google Scholar] [CrossRef]
- Karakas, S.; Kirmizi, M.; Kocaoglu, B. Yard block assignment, internal truck operations, and berth allocation in container terminals: introducing carbon-footprint minimisation objectives. Maritime Economics & Logistics 2021, 23, 750–771. [Google Scholar] [CrossRef]
- O’Kelly, M.E. The Location of Interacting Hub Facilities. Transportation Science 1986, 20, 92–106. [Google Scholar] [CrossRef]
- Delbeke, J.; Vis, P. (Eds.) EU Climate Policy Explained; Routledge: New York, NY, USA, 2015; p. 152. [Google Scholar]
- Liu, S. Multimodal Transportation Route Optimization of Cold Chain Container in Time-Varying Network Considering Carbon Emissions. Sustainability 2023, 15, 4435. [Google Scholar] [CrossRef]
- The World Bank. Data: Logistics performance index: Overall (1=low to 5=high). https://data.worldbank.org/indicator/LP.LPI.OVRL.XQ, 2023.
- Dirección de Presupuestos: Ministerio de Hacienda. Indicadores de Desempeño 2023: Proyecto de Ley de Presupuestos 2023. Technical report, Ministerio de Economía, Fomento y Turismo: Corporación de Fomento de la Producción, Santiago, Chile, 2022.
- Corporación de Fomento de la Producción. Programas estratégicos integrados, 2024.
- Subdirección de Desarrollo. Red Vial Nacional: Dimensionamiento y Características. Technical report, Dirección de Vialidad, MOP, Santiago, Chile, 2023.
- Programa de Desarrollo Logístico - Subsecretaría de Transportes.; Ministerio de Transportes y Telecomunicaciones.; Ministerio de Economía, Fomento y Turismo. Política Nacional Logística-Portuaria: Consolidado de diagnósticos y propuestas. Technical report, Programa de Desarrollo Logístico - Subsecretaría de Transportes, Santiago, Chile, 2023.
- SEP. Informe Financiero a marzo 2023. Technical report, Ministerio de Economía, Fomento y Turismo, Gobierno de Chile, Santiago, Chile, 2023.
- CORFO. Información complementaria: Desafíos de innovación e I+D empresarial para sectores estratégicos de alto impacto. Technical report, CORFO, Gobierno de Chile, Santiago, Chile, 2017.
- Subsecretaria de Relaciones Económicas Internacionales de Chile. Comercio exterior de Chile crece 21% y supera los USD104.000 millones en el 2022, 2022.
- Behdani, B.; Fan, Y.; Wiegmans, B.; Zuidwijk, R. Multimodal schedule design for synchromodal freight transport systems. EUROPEAN JOURNAL OF TRANSPORT AND INFRASTRUCTURE RESEARCH 2016, 16, 424–444. [Google Scholar] [CrossRef]
- Zhang, M.; Pel, A.J. Synchromodal hinterland freight transport: Model study for the port of Rotterdam. JOURNAL OF TRANSPORT GEOGRAPHY 2016, 52, 1–10. [Google Scholar] [CrossRef]
- Okyere, S.; Yang, J.Q.; Adams, C.A. Optimizing the Sustainable Multimodal Freight Transport and Logistics System Based on the Genetic Algorithm. SUSTAINABILITY 2022, 14. [Google Scholar] [CrossRef]
- Kotikov, J. Geographic information system modelling of freight transport and logistics in Saint Petersburg, Russia. PROCEEDINGS OF THE INSTITUTION OF CIVIL ENGINEERS-CIVIL ENGINEERING 2015, 168, 31–38. [Google Scholar] [CrossRef]
- Batarliene, N.; Sakalys, R. Mathematical Model for Cargo Allocation Problem in Synchromodal Transportation. SYMMETRY-BASEL 2021, 13. [Google Scholar] [CrossRef]
- Chang, Z.; Weng, J.X.; Qi, Z.; Yang, D. Assess economic and environmental trade-off for inland port location. INTERNATIONAL JOURNAL OF SHIPPING AND TRANSPORT LOGISTICS 2019, 11, 243–261. [Google Scholar] [CrossRef]
- Zhang, J.R.; Zhang, S.J.; Wang, Y.J.; Bao, S.H.; Yang, D.Y.; Xu, H.L.; Wu, R.; Wang, R.J.; Yan, M.; Wu, Y.; Hao, J.M. Air quality improvement via modal shift: Assessment of rail-water-port integrated system planning in Shenzhen, China. SCIENCE OF THE TOTAL ENVIRONMENT 2021, 791. [Google Scholar] [CrossRef] [PubMed]
- Zhang, W.P.; Wu, X.H.; Guo, J. CO2 Emission Efficiency Analysis of Rail-Water Intermodal Transport: A Novel Network DEA Model. JOURNAL OF MARINE SCIENCE AND ENGINEERING 2022, 10. [Google Scholar] [CrossRef]
- Kim, N.S.; Janic, M.; van Wee, B. Trade-Off Between Carbon Dioxide Emissions and Logistics Costs Based on Multiobjective Optimization. TRANSPORTATION RESEARCH RECORD 2009, 107–116. [Google Scholar] [CrossRef]
- Yin, C.Z.; Lu, Y.; Xu, X.F.; Tao, X.Z. Railway freight subsidy mechanism based on multimodal transportation. TRANSPORTATION LETTERS-THE INTERNATIONAL JOURNAL OF TRANSPORTATION RESEARCH 2021, 13, 716–727. [Google Scholar] [CrossRef]
- Rodrigues, V.S.; Pettit, S.; Harris, I.; Beresford, A.; Piecyk, M.; Yang, Z.; Ng, A. UK supply chain carbon mitigation strategies using alternative ports and multimodal freight transport operations. TRANSPORTATION RESEARCH PART E-LOGISTICS AND TRANSPORTATION REVIEW 2015, 78, 40–56. [Google Scholar] [CrossRef]
- Santos, T.A.; dos Santos, G.L.; Martins, P.; Soares, C.G. A methodology for short-sea-shipping service design within intermodal transport chains. MARITIME ECONOMICS & LOGISTICS 2022, 24, 138–167. [Google Scholar] [CrossRef]
- Yamaguchi, T.; Shibasaki, R.; Samizo, H.; Ushirooka, H. Impact on Myanmar’s Logistics Flow of the East-West and Southern Corridor Development of the Greater Mekong Subregion-A Global Logistics Intermodal Network Simulation. SUSTAINABILITY 2021, 13. [Google Scholar] [CrossRef]
- Gumuskaya, V.; van Jaarsveld, W.; Dijkman, R.; Grefen, P.; Veenstra, A. Dynamic barge planning with stochastic container arrivals. TRANSPORTATION RESEARCH PART E-LOGISTICS AND TRANSPORTATION REVIEW 2020, 144. [Google Scholar] [CrossRef]
- Iannone, F. The private and social cost efficiency of port hinterland container distribution through a regional logistics system. TRANSPORTATION RESEARCH PART A-POLICY AND PRACTICE 2012, 46, 1424–1448. [Google Scholar] [CrossRef]
- Dirección Nacional de Aduanas. Base de datos Operaciones de Ingreso, 2023.
- Steer. Actualización de Modelo de Costos de Transporte de Carga para el Análisis de Costos Logísticos, del Observatorio Logístico. Technical report, Subsecretaría de Transportes, Santiago, Chile, 2020.
- Cámara de Comercio de Santiago. Costos de transporte de importaciones profundizó su caída en el primer trimestre, 2023.
- Puertos & Logistica. Memoria anual 2017 Puertos & Logistica. Technical report, Puertos & Logistica, Santiago, Chile, 2017.
- GAMS Development Corp. The General Algebraic Modeling Language, version GAMS 46.3.0, 2024.
- Zuse Institute Berlin. SCIP: Solving Constraint Integer Programs, version 9.0.0, 2024.
- O’Kelly, M.E.; Miller, H.J. The hub network design problem: A review and synthesis. Journal of Transport Geography 1994, 2, 31–40. [Google Scholar] [CrossRef]
- Ernst, A.T.; Krishnamoorthy, M. Efficient algorithms for the uncapacitated single allocation p-hub median problem. Location Science 1996, 4, 139–154. [Google Scholar] [CrossRef]
- F & K Consultores. Análisis de precios del transporte ferroviario en algunas de las cadenas logísticas contenidas en el Plan de Impulso a la Carga Ferroviaria (Picaf), en vías de propiedad de la Empresa de los Ferrocarriles del Estado., 2015.
- Janic, M.; Vleugel, J. Estimating potential reductions in externalities from rail–road substitution in Trans-European freight transport corridors. Transportation Research Part D: Transport and Environment 2012, 17, 154–160. [Google Scholar] [CrossRef]
- Ministerio de Transportes y Telecomunicaciones.; Subsecretaria de Transportes. Plan de impulso a la carga ferroviaria; Vol. 3B, Ministerio de Transportes y Telecomunicaciones, 2014; p. 43.
- Mallat Garcés, G. Chile y los corredores bioceánicos - Santo Tomás en Línea, 2023.
Figure 1.
Types of cargo from origin to port.
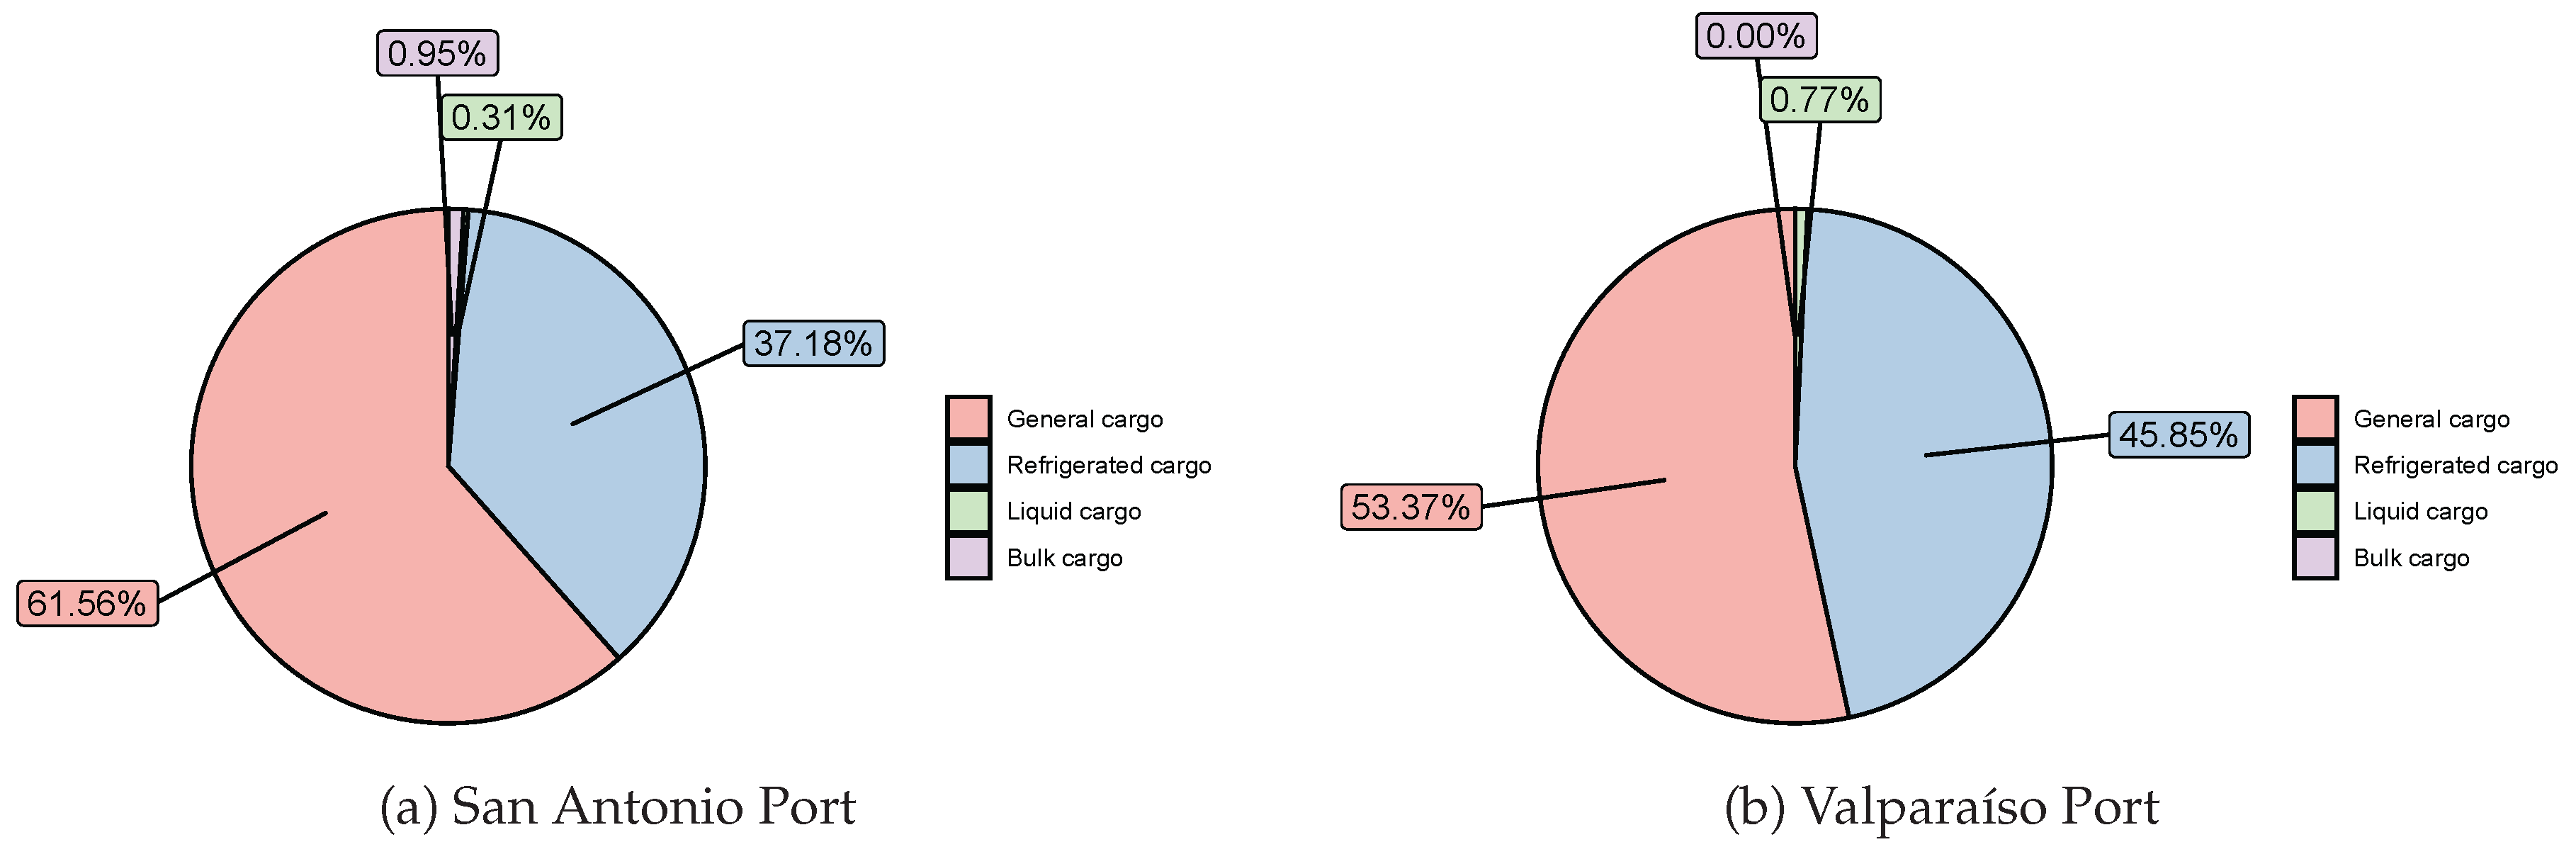
Figure 2.
Conceptual diagram multimodal system.
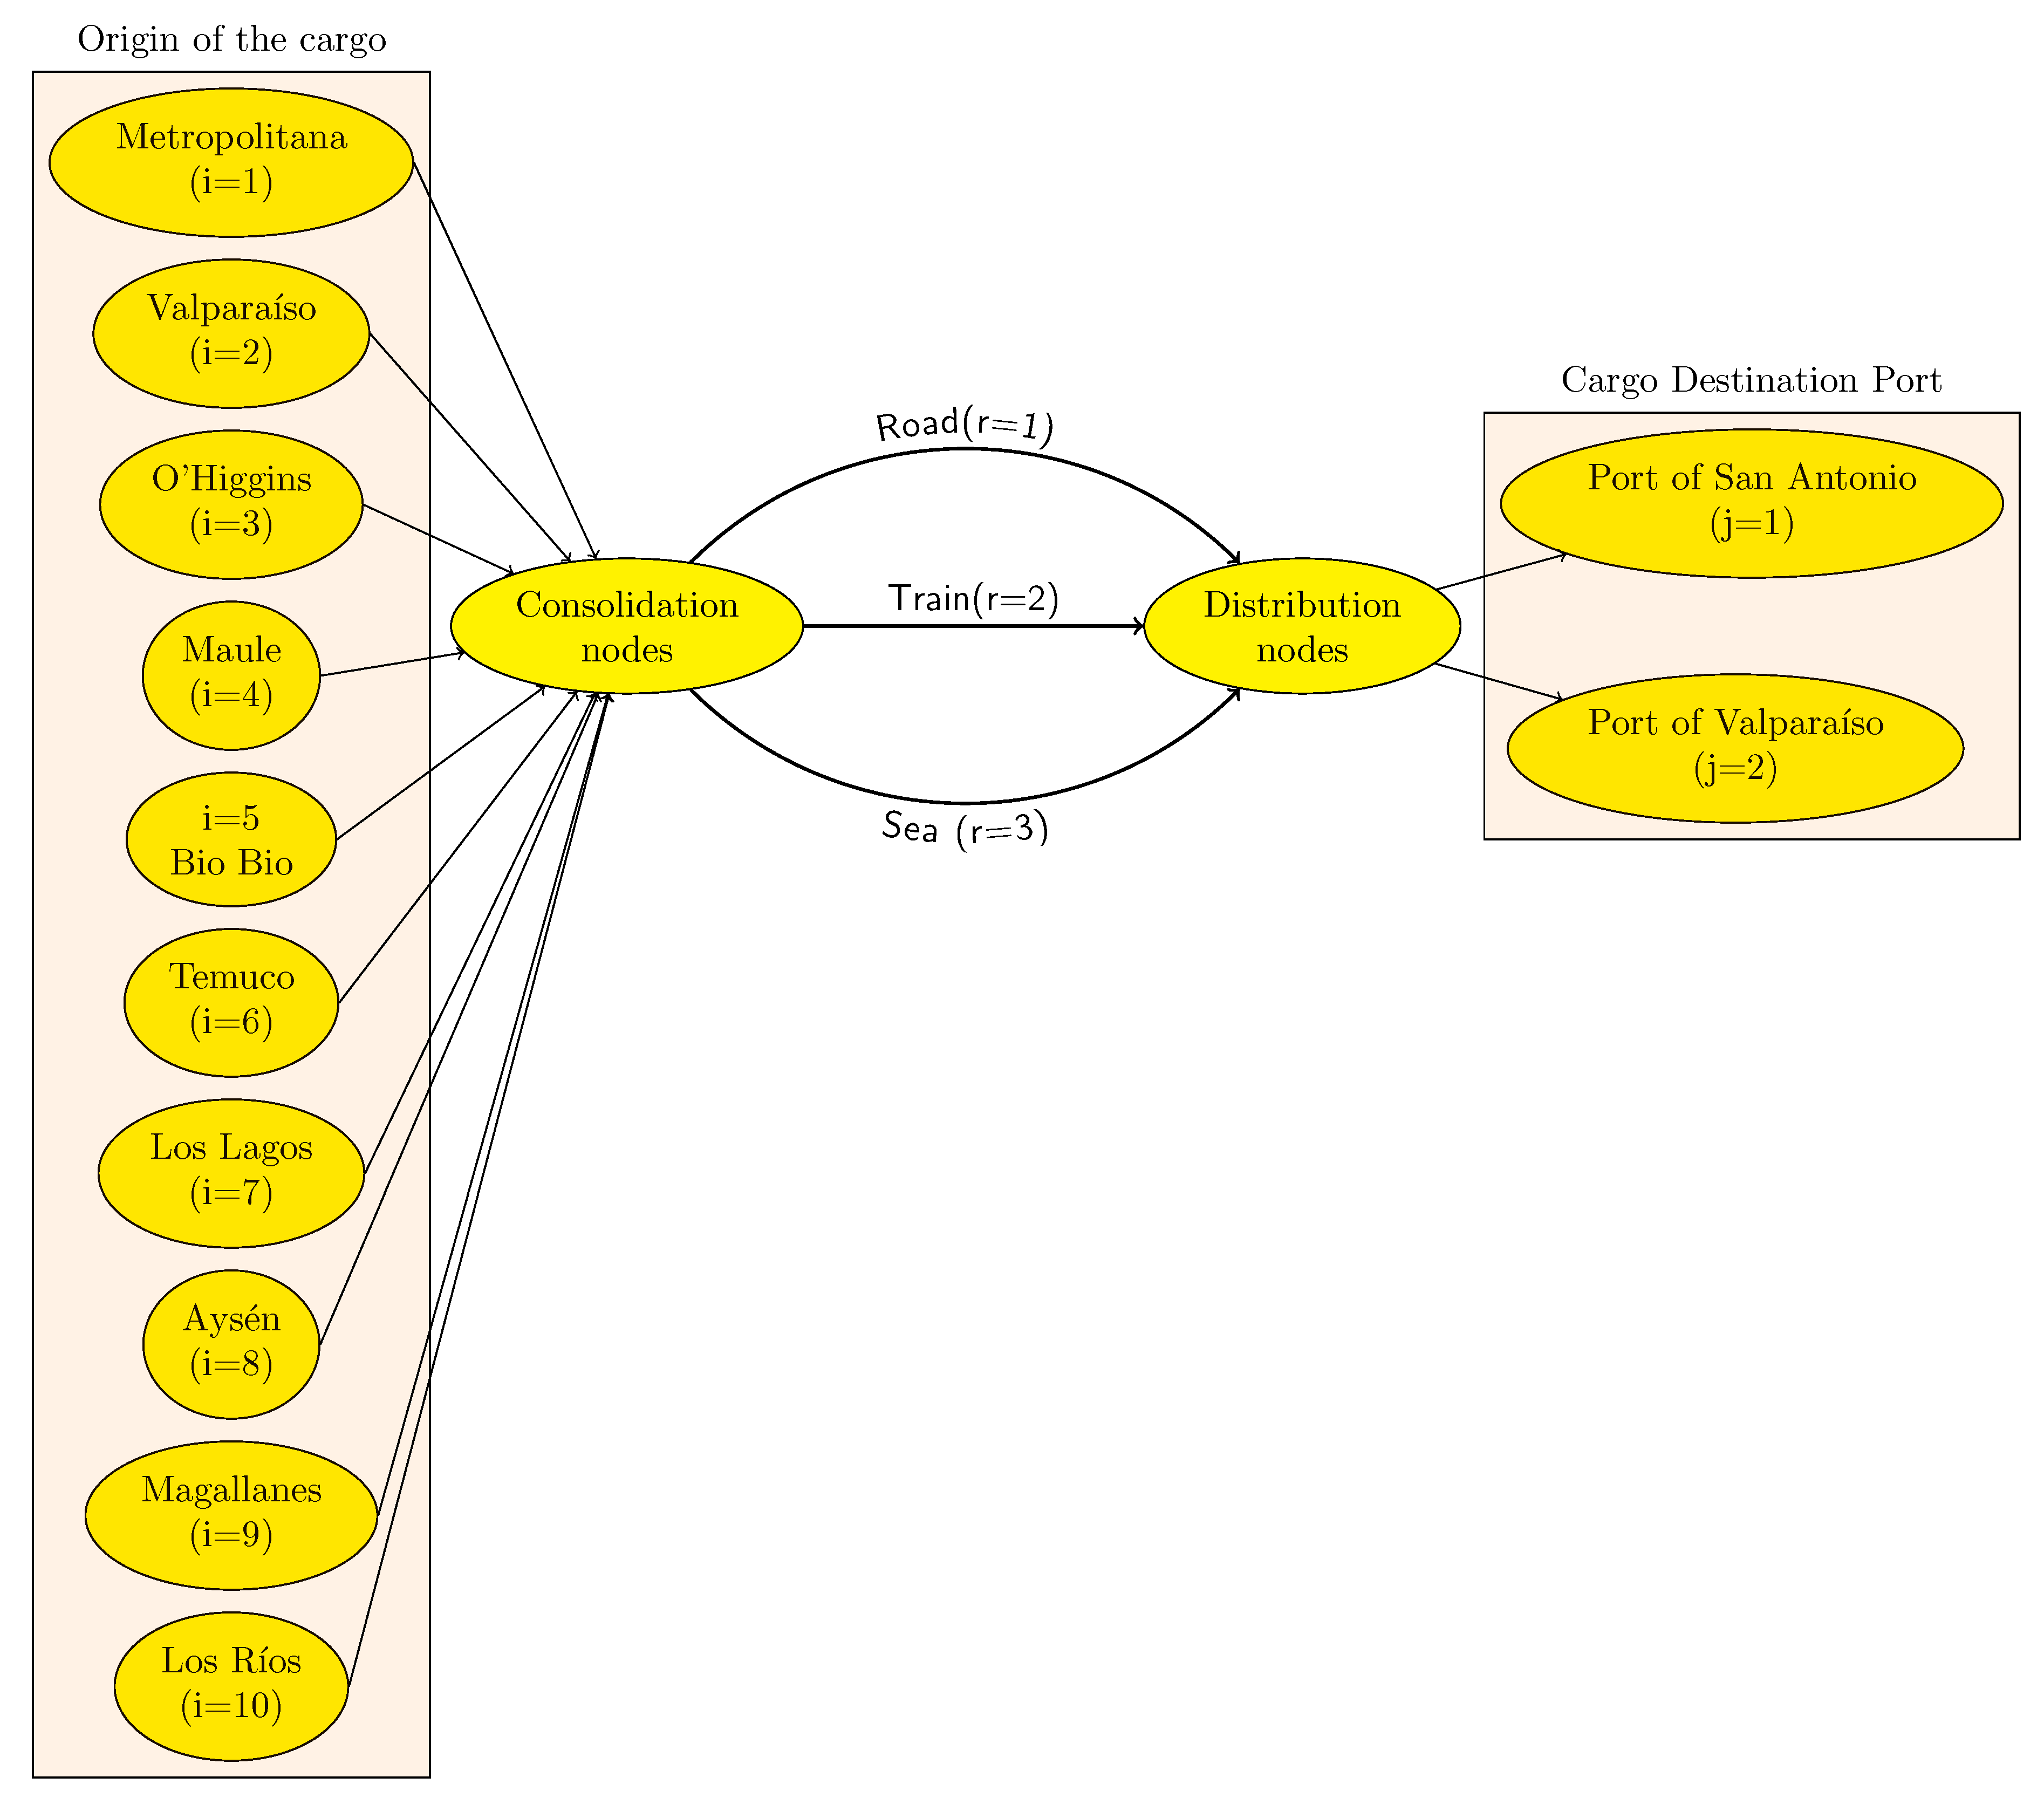

Table 1.
Limitations and Contributions of Multimodal Transport Networks
| Author | Method/ model/ technique | Limitations | Contributions |
|---|---|---|---|
| Transport industry: | |||
| [5] | Multi-objective planning model | Exploring model applicability in various regions, incorporating diverse transport modes, and managing dynamic supply chain and logistics uncertainties are essential areas for research. | Rail transport is the most efficient mode for long distances, surpassing other methods in cost and carbon emissions. |
| [32] | Mathematical modeling to design service schedules for synchromodal freight transport systems. | Examines a case of the Port of Rotterdam hinterland network, limiting generalizability. The study lacks information on barriers to synchromodal freight transport systems. | Improved performance of the intermodal freight system, achieving cost savings, equivalent to a reduction of more than 20%. |
| [33] | SynchroMO algorithm | The study of the hinterland network of the Port of Rotterdam could limit the relevance of the results. Analysis is required for infrastructure, stakeholder collaboration, and regulations. | It allows simulations and comparisons to be made between different routes and schedules, depending on the goods transiting the Rotterdam hinterland container transport. |
| [34] | Genetic algorithm | The study examines 10 regional capitals in Ghana, limiting generalizability. The genetic algorithm model considers time, distance, and CO2 emissions, but overlooks other sustainability factors. | By optimizing the system, total cost savings were achieved, representing a reduction of 4.5 % compared to the same amount of cargo transported with the traditional system. |
| [35] | ArcGIS and event model | The research centers on GIS modeling of freight transportation and logistics in Russia. It does not mention the specific event model employed or the constraints of the GIS model. The absence of exploration into potential biases of the data utilized. | Optimizes the planning and coordination of the transportation and logistics system in the city of St. Petersburg, thus improving regional connectivity within Europe. |
| [36] | Stochastic integer programming model | The paper presents an optimization model for load allocation in synchromodal transport, but lacks detailed information on solution techniques, focuses on a specific problem and lacks assumptions in the model. | Improves sustainability, increases flexibility and reduces costs, among other benefits, in the field of freight transportation. |
| [37] | Multi-objective optimization and genetic algorithm | The investigation focuses on transportation cost, fixed cost, and CO2 emissions while overlooking factors such as social impacts, land use, and noise pollution. Challenges and limitations in applying the model for real-world decisions are not analyzed. | Inland ports are positioned in a multimodal freight transport network to optimize transport and operational costs while lowering CO2 emissions. The growth of inland ports is linked to cost and emission reductions. |
| [38] | Multimodal environment evaluation tool (MEET) | The study examines how modal shifts in Shenzhen affect air quality, without considering social impacts, land use changes, or noise pollution. More research is required to assess the success of accompanying strategies and measure extra advantages. | Replacing road transport with sustainable options such as rail and river transport can benefit port cities in terms of transport efficiency and environmental quality. Stricter emission standards for vehicles can improve air quality by reducing NOX and O3 levels. |
| [39] | Data envelopment analysis (DEA) model | The research explores carbon emissions efficiency of rail-water intermodal transport in China, but findings may not be generalizable. It concentrates on CO2 emissions and overlooks other environmental impacts or pollutants. | Evaluates the carbon emission efficiency of rail-water intermodal transport in 14 Chinese ports, facilitating sustainable transport planning and decision making. |
| [40] | Multi-objective optimization | The research on a European port freight transport network may limit generalizability. Other factors like infrastructural constraints and regulatory policies could affect CO2 emissions and logistics costs balance. | Examines the relationship between logistics costs and CO2 emissions in various freight transport networks. Evaluates the effects of changing modes and routes on the balance between costs and emissions, emphasizing the role of the demands and capacities of the freight transport system. |
| [41] | Integrates Dijkstra’s algorithm and a pattern search algorithm in a bi-level programming model | It is necessary to examine the risks of implementing the subsidy mechanism in the various modes of transport and logistics planning. Further analysis is required to understand the economic, social, environmental and political effects of the proposal. | Utilizes Yangtze River data to optimize China Railway Express freight subsidy system in multimodal transport setup, improving decision-making and policy development for sustainable transport. Sets specific intervals for adjusting unit subsidy based on type of cargo being transported. |
| Industria Portuaria | |||
| [42] | Linear optimization | An in-depth examination is needed on transport strategies, associated risks, and subsidy mechanisms implications. Real-world uncertainties like personnel performance in port operations and current regulations must be evaluated. | Examines carbon reduction methods in supply chains of London Gateway, studying alternative ports and transport modes like short sea shipping. Decreasing travel distances and CO2e emissions leads to lower costs. |
| [43] | Logistic regression model | The logistic regression model of the case study needs to study service reliability and environmental impact to improve the effectiveness of the service design. | Optimizing SSS services in intermodal transport chains involves designing the optimal vessel size based on demand estimation. A case study of a Ro-Pax service in Portugal shows how design adjustments can improve economic performance. |
| [44] | Stochastic network assignment model and global logistics intermodal network simulation model | The model neglects external factors like politics or economics affecting logistics flow. Simulation results are restricted by data availability and accuracy for comparison with observed flows. | Evaluates logistics infrastructure policies in the Greater Mekong subregion of Myanmar, tests various scenarios to determine their effects on goods movement and container traffic. Analyzes the environmental and economic impact of increased truck speed and the opening of the Dawei port on transport modes. |
| [45] | Two-stage stochastic mixed integer model (MIP) | Lack of consideration of weather conditions, port congestion and labor availability, which affects throughput and operating costs. More accurate costing is required for various scenarios and terminals. | Examine how uncertainty affects barge transportation by analyzing real data from a land terminal and evaluating long-term performance through simulated weekly operations for one year. Creates a stochastic program for transportation planning that demonstrates that uncertainty can influence total costs. |
| [46] | Interport Model (network programming tool) | The model examines the rationality of economic agents and perfect competition. It is convenient to study the uncertainty of factors such as container demand, costs, capacity constraints and regulatory changes. | Investigate the link between sustainability and container logistics in Campania ports. Examine the impact of policies and measures on the competitiveness and sustainability of container distribution. Emphasizes the reduction of transport costs and suggests public and private strategies for green transport. |
Table 2.
Parameters.
| Symbol | Description |
|---|---|
| Transport of cargo from origin node i to port of embarkation j for product type p. | |
| Unit cost of transport from the origin node i to the consolidation node k for product type p along route r [dollars per ton-kilometer]. | |
| Unit transport cost from consolidation node k to distribution node m for product type p on route r [dollars per ton-kilometer]. | |
| Unit cost of transportation between distribution node m and port j for product type p along route r [dollars per ton-kilometer] | |
| Unit transport cost from origin node i to consolidation node m for product type p via the route. | |
| Unit transport cost from origin node i to consolidation node m for product type p via the route r. | |
| Generic expression for the distance between the origin node i and the consolidation center at node k. | |
| Generic expression for the distance from consolidation center k to destination node j. | |
| Generic expression for the distance from consolidation center m to destination node j. | |
| Generic expression for the distance between the consolidation center k and the distribution center at node m. | |
| Investment for the setup, operation, and maintenance of a consolidation node. | |
| Investment for the setup, operation, and maintenance of a distribution node. | |
| a | Project evaluation period. |
Table 3.
Variables.
| Symbol | Description |
|---|---|
| A binary variable that equals 1 if product type p is shipped directly from origin i to destination j via route r, and 0 otherwise. | |
| Binary variable is 1 if transport is from origin i to node k for product type p via route r, otherwise 0. | |
| Binary variable equals 1 if cargo is transported from node k to j for product type p along route r, and 0 otherwise. | |
| Binary variable is 1 if cargo moves from consolidation node k to distribution node m for product type p via route r, else 0. | |
| Binary variable equal to 1 if the cargo is transported from node m to port j for product type p via route r, and 0 otherwise. | |
| Binary variable is 1 if cargo is transported from node k to port j for product type p via route r, and 0 otherwise. | |
| Binary variable that is 1 if a consolidation node is installed at node k, otherwise 0. | |
| Binary variable is 1 if a distribution node is installed at node m, and 0 otherwise. | |
| Binary variable: 1 if no consolidation or distribution nodes are installed, 0 otherwise. | |
| Binary variable set to 1 for installing consolidation node at node k and distribution node at node m, otherwise 0. | |
| A binary variable indicating 1 for a distribution node installation at node m, and 0 otherwise. | |
| Binary variable equal to 1 if a consolidation node is installed at node k, otherwise 0. |
Table 4.
Cargo transportation from origins to San Antonio Port [TEUS] [47].
Table 4.
Cargo transportation from origins to San Antonio Port [TEUS] [47].
| id | Region, Capital city | General | Refrigerated | Liquid | Granel |
|---|---|---|---|---|---|
| 1 | Metropolitan Region, Santiago | 7,543,212 | 640,633 | 15,897 | 17,683 |
| 2 | Valparaíso Region, Valparaíso | 880,155 | 1,153,233 | 19,576 | 0 |
| 3 | O’Higgins Region, Rancagua | 1,491,447 | 3,949,870 | 6456 | 0 |
| 4 | Maule Region, Talca | 2,457,589 | 1,545,269 | 22,395 | 0 |
| 5 | Bío Bío Region, Concepción | 320,855 | 48,966 | 144 | 179,314 |
| 6 | Temuco Region, Temuco | 4345 | 58,460 | 0 | 0 |
| 7 | Los Lagos Region, Puerto Montt | 27,845 | 48,016 | 0 | 0 |
| 8 | General Carlos Ibáñez del Campo Region of Aysén, Coyhaique | 8914 | 60,266 | 0 | 0 |
| 9 | Magallanes and Antarctica Chilen Region | 38,078 | 210,935 | 0 | 0 |
| 10 | Los Ríos Region, Valdivia | 24,358 | 12,794 | 0 | 0 |
Table 5.
Cargo transportation from origins to Valparaíso Port [TEUS] [47].
Table 5.
Cargo transportation from origins to Valparaíso Port [TEUS] [47].
| id | Region, Capital city | General | Refrigerated | Liquid | Granel |
|---|---|---|---|---|---|
| 1 | Metropolitan Region, Santiago | 4,133,243 | 530,133 | 6408 | 1 |
| 2 | Valparaíso Region, Valparaíso | 773,020 | 991,239 | 67,241 | 0 |
| 3 | O’Higgins Region, Rancagua | 673,554 | 3,208,655 | 2836 | 0 |
| 4 | Maule Region, Talca | 809,974 | 749,697 | 15,123 | 45 |
| 5 | Bío Bío Region, Concepción | 39,073 | 22,206 | 2133 | 0 |
| 6 | Temuco Region, Temuco | 22,980 | 22,543 | 0 | 0 |
| 7 | Los Lagos Region, Puerto Montt | 7486 | 15,817 | 0 | 0 |
| 8 | General Carlos Ibáñez del Campo Region of Aysén, Coyhaique | 0 | 2185 | 0 | 0 |
| 9 | Magallanes and Antarctica Chilen Region, Punta Arenas | 531 | 6863 | 0 | 0 |
| 10 | Los Ríos Region, Valdivia | 1769 | 1646 | 0 | 0 |
Table 6.
Distances between origin and cargo consolidation nodes1.
| (1) | (2) | (3) | (4) | (5) | (6) | (7) | (8) | (9) | (10) | ||
|---|---|---|---|---|---|---|---|---|---|---|---|
| id | Region | RM 2 | Valparaíso | O’Higgins | Maule | Bio Bio | Temuco | The Lakes | Aysén | Magallanes | Los Lagos |
| 1 | Metropolitan | 0 | 116 | 84 | 257 | 500 | 690 | 1036 | 1898 | 3023 | 855 |
| 2 | Valparaíso | 116 | 0 | 194 | 367 | 610 | 800 | 1203 | 2066 | 3191 | 1023 |
| 3 | O’Higgins | 84 | 194 | 0 | 173 | 416 | 606 | 948 | 1810 | 2935 | 767 |
| 4 | Maule | 257 | 367 | 173 | 0 | 247 | 437 | 777 | 1639 | 2764 | 596 |
| 5 | Bio Bio | 500 | 610 | 416 | 247 | 0 | 305 | 644 | 1506 | 2632 | 464 |
| 6 | Temuco | 690 | 800 | 606 | 437 | 305 | 0 | 353 | 1215 | 1255 | 172 |
| 7 | Los Lagos | 1036 | 1203 | 948 | 777 | 644 | 1032 | 0 | 1042 | 2167 | 211 |
| 8 | Aysén | 1898 | 2066 | 1810 | 1639 | 1506 | 1215 | 1042 | 0 | 1254 | 1073 |
| 9 | Magallanes | 3023 | 3191 | 2935 | 2764 | 2632 | 1255 | 2167 | 1254 | 0 | 2199 |
| 10 | Los Ríos | 855 | 1023 | 767 | 596 | 464 | 172 | 211 | 1073 | 2199 | 0 |
1 Calculate the distance between cities in Chile. https://sitios.cl/servicios/distancias.htm, access 26/3/2024.. 2 RM: Metropolitan Region
Table 7.
Distances between initial, final and intermediate distribution nodes1.
| id | Origin node 2 | San Antonio 3 | Valparaiso 3 | Center of gravity 4 | La Calera |
|---|---|---|---|---|---|
| 1 | Metropolitan | 117 | 125 | 121 | 127 |
| 2 | Valparaíso | 88 | 10 | 39 | 47 |
| 3 | O’Higgins | 141 | 98 | 120 | 208 |
| 4 | Maule | 265 | 366 | 315 | 381 |
| 5 | Bio Bio | 508 | 609 | 558 | 624 |
| 6 | Temuco | 698 | 810 | 754 | 815 |
| 7 | Los Lagos | 1040 | 1142 | 1091 | 1143 |
| 8 | Aysén | 1717 | 1818 | 1767 | 1833 |
| 9 | Magallanes | 3012 | 3123 | 3067 | 3128 |
| 10 | Los Ríos | 856 | 957 | 906 | 958 |
1 Calculate distance between cities in Chile https://sitios.cl/servicios/distancias.htm, access 26/3/2024. 2 Consolidation. 3 Final destination and possible distribution node. 4 Possible distribution node.
Table 8.
Distances between potential consolidation nodes and shipping ports1
| Origin | San Antonio | Valparaiso (Zeal2) |
|---|---|---|
| San Antonio | 0 | 88 |
| Valparaiso (Zeal) | 88 | 10 |
| Center of gravity | 8 | 8 |
| Calera | 113 | 57 |
1 Calculate the distance between cities in Chile https://sitios.cl/servicios/distancias.htm, access 26/3/2024. 2 Logistics Support Extension Zone.
Table 9.
Rail transportation costs for different types of cargo 2018 [ton-km]
| Cargo | Trailer | Cost [CLP/tn-km] | Cost [dollars/tn-km] |
|---|---|---|---|
| General | Flat Trolley | 24 | 0.03428 |
| Refrigerated | Reefer container | 26 | 0.03714 |
| Liquid | Pond | 25 | 0.03571 |
| Granel | Bulk hopper | 24 | 0.03428 |
Table 10.
Road transportation costs for different types of freight 2018 [km-ton]
| Cargo | Tractor | Cost [CLP/tn-km] | Cost[dollars/tn-km] |
|---|---|---|---|
| General | Flat | 49 | 0.070 |
| Refrigerated | Refrigerated | 53 | 0.075 |
| Liquid | Pond | 52 | 0.074 |
| Granel | Hopper | 53 | 0.0757 |
Table 11.
Maritime transportation costs for different types of cargo [] 1
| Cargo | Storage | Cost [CLP/tn] | Cost [dollars/]2 |
|---|---|---|---|
| General | Container | 145 | 0.007631579 |
| Refrigerated | Container reef | 175 | 0.009210526 |
| Liquid | Pond | 58 | 0.003052632 |
| Granel | Pond | 35 | 0.001842105 |
1 shipping cost information [49].2 Average international trade values, calculated on the basis of the most frequent trip to Beijing, China, indicate a distance of
19,000 km.
Table 12.
Costanera Espigón Pier [50].
Table 12.
Costanera Espigón Pier [50].
| Items | Values | Units |
|---|---|---|
| Investment | 19 | millions of dollars |
| Warehouse capacity | 250.000 | TEU/año |
| Train capacity | 600 | mt de largo |
Table 13.
Optimisation results.
| San Antonio | Valparaíso | ||||||||
|---|---|---|---|---|---|---|---|---|---|
| Region | Tipo | General | Reeffer | Liquid | Granel | General | Reeffer | Liquid | Granel |
| 1 RM | Train | 1 | 1 | 1 | 1 | 1 | 1 | 1 | 1 |
| 2 Valparaiso | Road | 0 | 0 | 0 | 1 | 0 | 0 | 0 | 1 |
| 2 Valparaiso | Train | 1 | 1 | 1 | 0 | 1 | 1 | 1 | 0 |
| 3 O’Higgins | Road | 0 | 0 | 0 | 1 | 0 | 0 | 0 | 1 |
| 3 O’Higgins | Train | 1 | 1 | 1 | 0 | 1 | 1 | 1 | 0 |
| 4 Maule | Road | 0 | 0 | 0 | 1 | 0 | 0 | 0 | 0 |
| 4 Maule | Ship | 1 | 1 | 1 | 0 | 1 | 1 | 1 | 1 |
| 5 Bio Bio | Road | 0 | 0 | 0 | 0 | 0 | 0 | 0 | 1 |
| 5 Bio Bio | Ship | 1 | 1 | 1 | 1 | 1 | 1 | 1 | 0 |
| 6 Temuco | Road | 0 | 0 | 1 | 1 | 0 | 0 | 1 | 1 |
| 6 Temuco | Ship | 1 | 1 | 0 | 0 | 1 | 1 | 0 | 0 |
| 7 Los Lagos | Road | 0 | 0 | 1 | 1 | 0 | 0 | 1 | 1 |
| 7 Los Lagos | Ship | 1 | 1 | 0 | 0 | 1 | 1 | 0 | 0 |
| 8 Aysén | Road | 0 | 0 | 1 | 1 | 1 | 0 | 1 | 1 |
| 8 Aysén | Ship | 1 | 1 | 0 | 0 | 0 | 1 | 0 | 0 |
| 9 Magallanes | Road | 0 | 0 | 1 | 1 | 0 | 0 | 1 | 1 |
| 9 Magallanes | Ship | 1 | 1 | 0 | 0 | 1 | 1 | 0 | 0 |
| 10 Los Ríos | Road | 0 | 0 | 1 | 1 | 0 | 0 | 1 | 1 |
| 10 Los Ríos | Ship | 1 | 1 | 0 | 0 | 1 | 1 | 0 | 0 |
Disclaimer/Publisher’s Note: The statements, opinions and data contained in all publications are solely those of the individual author(s) and contributor(s) and not of MDPI and/or the editor(s). MDPI and/or the editor(s) disclaim responsibility for any injury to people or property resulting from any ideas, methods, instructions or products referred to in the content. |
© 2024 by the authors. Licensee MDPI, Basel, Switzerland. This article is an open access article distributed under the terms and conditions of the Creative Commons Attribution (CC BY) license (http://creativecommons.org/licenses/by/4.0/).
Copyright: This open access article is published under a Creative Commons CC BY 4.0 license, which permit the free download, distribution, and reuse, provided that the author and preprint are cited in any reuse.


