
Submitted:
22 March 2024
Posted:
27 March 2024
You are already at the latest version
Abstract
Eight reconstructions of temperature in the Northern Hemisphere covering 1192-2015 years were analyzed using both Fourier, wavelet and principal component approaches. A hemispheric-scale cyclicity with a period of 170-250 years was found present in Northern Hemisphere temperature for more than the last millennium. It is shown that this variation may have a certain contribution to warming in the first half of the 20th century. However, the last 4-5 decades are most likely a period of decline of this cycle. Possible origins of the revealed bicentennial periodicity are discussed.
Keywords:
paleoclimatology
; climatic variability
; dendrochronology
1. Introduction
Global climate change, due to its great impact on all aspects of human activity, has become one of the most important problems of modern natural science. One of the main challenges in global change research is isolating variations caused by external forcings, as they need to be separated from the background of natural climate variability. For example, identifying the anthropogenic contribution to global warming over the past 120 years represents an important scientific task. The main difficulty of such an analysis is related to the brevity of available of instrumental data sets. Direct temperature records typically span no more than the last 100–150 years, so they are insufficient to set limits on the amplitude of long-term (multidecadal or longer) climate variability. Paleoclimatology, which has been actively developing in recent years, makes it possible to overcome these difficulties. The use of long-term paleocrecords provides a unique opportunity to expand our knowledge of long-term climate change. Modern long-term climate reconstructions from natural climate archives span up to the last few millennia. These proxies reconstruct up to 65 % of actual temperature variance over decadal time scale [1,2]. Thus, they seem to be a potential source of information on the climatic variations with periods up to century or even more. The most commonly used source of information on temperature in the past is tree rings since they provide annually resolved and precisely dated climate signal which correlates well with observed temperature and precipitation records. One of the major challenges in dendroclimatology is that the standardization procedure — biological trend removal — can suppress long-term variations and thus limit the preservation of medium- and low-frequency variability. However, recent advances in standardization techniques make it possible to retain much more low-frequency climate information [3]. Another opportunity to preserve long-term variability is use of maximum density chronologies as they are less biased by biological memory effects [4]. Therefore, modern temperature reconstructions have become suitable for analyzing centennial and longer-term variations.
In the last 15 years, a number of evidences have been obtained for the presence of a bicentennial (about 200 years) variability in the Earth's climate. This variation has already been identified in: (a) temperature in Central Asia [5], (b) temperature in northeastern Alaska [6], (c) monsoon precipitation on the Qinghai–Tibetan Plateau [7], (d) monsoon precipitation in South America [8], (e) temperature in Southern Hemisphere [9-10]. Breitenmoser et al. [11] analyzed near global collection of 17 annually-resolved tree-ring-based climate proxies and found bicentennial periodicity in 10 of them. The interest of researchers in the 200-year variation in climate data is due to the fact that the corresponding two-century variation – the Suess or DeVries cycle with a period of 170-260 years [12] – is observed in solar activity.
This work continues the study for a bicentennial cycle in the Earth's climate. The purpose of the study is to search for quasi-200 year climate variation on a hemispheric scale. Thus, it examines the most recent paleoreconstructions of Northern Hemisphere temperature, covering the last 1192-2016 years.
2. Materials and Methods
In this work, I used the longest modern reconstructions of various types based on different temperature indicators including tree-ring width (TRW), maximum latewood density (MXD), stable isotope δ18O in terrestrial archives, pollen (P), borehole temperature (BT), ice melt layers (IM), ice accumulation rate (AC), varved lake sediments (VS), documentary information (D). These series covering at least few 200-year cycles and include: (a) tree-ring series (Esper et al. [13], Schneider et al. [14], Wilson et al. [15], (b) multy-proxies, including both tree-ring data and data of other types (Moberg et al. [16], Christiansen and Ljungqvist [17], Guillet et al. [18], Büntgen et al. [19], (c) multi-proxy of Loehle [20], in which tree-ring data have not been used. The selected series reconstruct the temperature of the Northern Hemisphere in different seasons over 1192-2016 years. These datasets are shown in Figure 1 and are described in Table 1. They were obtained by integrating up to several thousand individual proxy records.
Visual inspection of Figure 1 clearly shows that almost all selected temperature paleorecords have multi-centennial variability. This proves the ability of these series to reconstruct long-term variations and their suitability for studying bicentennial periodicity.
Spectral properties of the analyzed time series were studied by means of wavelet and Fourier analysis. Fourier spectra were normalized by variance (see Torrence and Compo [21]). Wavelet spectra obtained using a complex basis of Morlet were normalized to 0.95 confidence level calculated for red noises with the corresponding AR(1) coefficient according to [21].
Since the strong long-term (multi-centennial and longer) variations contained in most of both solar and climate series can seriously complicate the analysis of shorter-term variations, polynomial trends of the 2nd order were preliminary subtracted from all the datasets used in the work.
Principal component analysis (PCA) was performed to extract the dominant patterns of variability from the set of temperature reconstructions used in the work. The first principal component (PC1) or the first score – a linear combination of original observed variables that captures the data set's maximum variance – was also subjected to spectral analysis using wavelet and Fourier methods.
In order to select quasi-bicentennial cycles all the temperature records were wavelet filtered using the 171–259 year band and real-valued MHAT (Mexican hat) basis (see [21]). The significance of the correlation between band-pass filtered records was assessed using a statistical experiment involving an ensemble of Monte Carlo simulations. Each simulation contained: (a) generating random copies of the analyzed signals by randomizing the phases of their Fourier transforms, (b) wavelet filtering of the random copies in the range 171-259 years, (c) calculating the correlation coefficient between two filtered random copies and comparing them with the coefficient correlations between actually filtered data sets.
3. Results
Fourier and global wavelet spectra of the temperature reconstructions are shown in Figure 2 and Figure 3.
As follows from Figure 2 and 3, the variation with a period of 180-270 years is present in the spectra of all temperature reconstructions of the Northern Hemisphere, despite in series of [16] and [20] it is not significant. Thus, spectral analysis of the eight temperature reconstructions, covering 1192-2016 years, shows the presence of a bicentennial variability in the temperature of the Northern Hemisphere.
The first principal component for Northern Hemisphere temperature during 800-1973 accounting for 55% of the total variability is shown in Figure 4 together with its Fourier, local and global wavelet spectra.
Figure 4C shows evident peak at 189 years. The Fourier spectrum (Figure 4D) allows one to distinguish significant peaks with periods of 190 and 86 years. So, spectral analysis of the first principal component confirms the presence of a bicentennial periodicity in the temperature of the Northern Hemisphere. The local wavelet spectrum shows that this variation is more pronounced in the period AD 800-1000 and after 1600.
Coefficients of correlation between data sets wavelet filtered in bicentennial band are shown in the Table 2 together with their significances (in brackets). Correlations were calculated over the time interval common to both series, e.g., AD 17-1973 for proxies of [17] and [20], AD 800-2002 for proxies of [14] and [15] etc.
As can be seen from Table 2 the majority of band-pass correlation coefficients is significant. Thus, correlation analysis provides additional evidence for the presence of a hemispheric-scale quasi-200-year cyclicity in the climate over the Northern Hemisphere during the last 1- 2 millennia. The relationship between bicentennial variations in eight Northern Hemisphere proxies is shown in Figure 5 which displays temperature reconstructions filtered in the range 171-259 years.
Figure 5 shows that synchrony between ca 200-year periodicities in eight temperature paleorecords is more evident after the end of the 13th century i.e., during the last 4 cycles. The average amplitude of bicentennial temperature periodicity is 0.03-0.10°C (peak-to-trough amplitude 0.06-0.20°C). However, some individual fluctuations have larger range. E.g. the temperature increase from the mid-19th century to the seventieth of 20th century reaches 0.10-0.35°C. The last 4-5 decades are a period of decline in this cycle.
4. Discussion and Conclusions
Both spectral and correlation analysis of eight temperature reconstructions showed that cyclicity with a period 170-250 years occurred in the Northern Hemisphere climate over more than the last millennium. This conclusion was made based on the study of temperature paleoreconstructions obtained by different methods and generalizing from 54 [15] to hundreds [14] and thousands [19] of individual indicators of different types. Quasi-bicentennial variations are expressed to varying degrees in all eight series. They have developed most synchronously in the last 800 years. Some dissimilarity in an earlier period may be due to the fact that the existing reconstructions restore the temperature less accurately in this epoch. Indeed, the number of individual temperature indicators used in its reconstruction decreases significantly as we move deeper into the past (see Figure 2 of [15]). Ogurtsov [10] found also a variation with a period of approximately 250 years temperature of the Southern Hemisphere. This means that the quasi-bicentennial periodicity may be global in nature.
The average peak-to-peak amplitude of bicentennial temperature periodicity is 0.06-0.20°C. But some individual fluctuations have larger range. It is important, that quasi 200-year cycle can provide temperature increase from the mid-19th century to the seventieth of 20th century up to 0.35°C (Figure 3E). Thus, this variation may have a certain contribution to global warming in the first half of the 20th century (see Figure 5). However, the last 4-5 decades are most likely a period of decline of this cycle. This makes the significant rise in temperature in the Northern Hemisphere over the past 30-40 years even more abnormal and provides further evidence that factors not at work in the past contributed significantly to this warming.
According to [11] the bicentennial climatic periodicity could stem from: (a) intrinsic ocean or atmosphere variability, (b) solar forcing, (c) volcanic forcing. However more work is needed to accurately determine its origin.
Additional research using new temperature reconstructions is also needed to clarify the actual shape, amplitude and spatial scale of 200-year temperature variation.
Funding
This research received no external funding.
Data Availability Statement
Publicly available datasets were analyzed in this study. This data can be found here: https://www.ncei.noaa.gov/pub/data/paleo/treering/reconstructions/n_hem_temp/esper2002_nhem_temp.txt. https://www.ncei.noaa.gov/pub/data/paleo/contributions_by_author/moberg2005/nhtemp-moberg2005.txt. https://www.ncei.noaa.gov/pub/data/paleo/contributions_by_author/christiansen2012/christiansen2012.txt. https://www.ncei.noaa.gov/pub/data/paleo/treering/reconstructions/buentgen2021/buentgen2021recon.txt. https://www.ncei.noaa.gov/pub/data/paleo/reconstructions/guillet2017/guillet2017nhtemp.txt. https://www.ncei.noaa.gov/pub/data/paleo/treering/reconstructions/schneider2015mxd.txt. https://www.ncei.noaa.gov/pub/data/paleo/treering/reconstructions/n_hem_temp/ntrend2015regionc3.txt.
Conflicts of Interest
The author declare no conflict of interest.
References
- Barnett, T.P.; Santer, B.D.; Jones, P.D.; Bradley, R.S.; Briffa, K.R. , Estimates of low frequency natural variability in near-surface air temperature. The Holocene 1996, 3, 255–263. [Google Scholar] [CrossRef]
- Briffa, K.R. , Annual climate variability in the Holocene: interpreting the message of ancient trees. Quat. Sci. Rev. 2000, 19, 87–105. [Google Scholar] [CrossRef]
- Andreu-Hayles; L. , Leland, C., Dendrochronology, Progress. Encyclopedia of Scientific Dating Methods 2014, 1–12. [Google Scholar] [CrossRef]
- Esper, J.; Schneider, L.; Krusic, P. J.; Luterbacher, J.; Büntgen, U. ; Timonen, M; Zorita, E., European summer temperature response to annually dated volcanic eruptions over the past nine centuries. Bull. Volcanol, 75. [CrossRef]
- Raspopov, O.M.; Dergachev, V.A.; Esper, J.; Kozyreva, O.V.; Frank, D.; Ogurtsov, M.; Shao, X. , The influence of the de Vries (∼200-year) solar cycle on climate variations: Results from the Central Asian Mountains and their global link. Palaeogeography, Palaeoclimatology, Palaeoecology, 2008; 259, 6–16. [Google Scholar] [CrossRef]
- Ogurtsov, M.; Veretenenko, S.; Lindholm, M.; Jalkanen, R. Possible solar-climate imprint in temperature proxies from the middle and high latitudes of North America. Adv. Space Res. 2016, 57, 1112–1117. [Google Scholar] [CrossRef]
- Liu, X.Q.; Dong, H.L.; Yang, X.D.; Herzschuh, U.; Zhang, E.L.; Stuut, J.B.W.; Wang, Y.B. Late Holocene forcing of the Asian winter and summer monsoon as evidenced by proxy records from the northern Qinghai–Tibetan Plateau. Earth Planet. Sci. Lett. 2009, 280, 276–284. [Google Scholar] [CrossRef]
- Novello, V.; Vuille, M.; Cruz, F. W.; Strikis, N.; Paula, M.; Edwards, R. L.; et al. , Centennial-scale solar forcing of the South American Monsoon System recorded in stalagmites. Sci. Reports 2016, 6(1), 24762. [Google Scholar] [CrossRef] [PubMed]
- Ogurtsov, M. Long-term variability of summer temperature in the southern part of South America – is there a connection with changes in solar activity? Atmosphere 2022, 13, 1360. [Google Scholar] [CrossRef]
- Ogurtsov, M. Study on possible solar influence on the сlimate of the Southern Hemisphere. Atmosphere 2022, 13, 680. [Google Scholar] [CrossRef]
- Breitenmoser, P.; Beer, J.; Brönnimann, S.; Frank, D.; Steinhilber, F.; Wanner, H. Solar and volcanic fingerprints in tree-ring chronologies over the past 2000 years. Palaeogeography, Palaeoclimatology, Palaeoecology 2012, 313-314, 127–139. [Google Scholar] [CrossRef]
- Ogurtsov, M.; Nagovitsyn, Yu.; Kocharov, G.E.; Jungner, H. , Long-Period cycles of the Sun's activity recorded in direct solar data and proxies. Solar Phys. 2002, 211, 371–394. [Google Scholar] [CrossRef]
- Esper, J.; Cook, E.R.; Schweingruber, F.H. Low-frequency signals in long tree-ring chronologies for reconstructing past temperature variability. Science 2002, 295, 2250–2253. [Google Scholar] [CrossRef] [PubMed]
- Schneider, L.; Smerdon, J.E.; Büntgen, U.; Myglan, V.; Kirdyanov, A.V.; Esper, J. Revising midlatitude summer temperatures back to A.D. 600 based on a wood density network. Geophys. Res. Lett. 2015, 42, 4556–4562. [Google Scholar] [CrossRef]
- Wilson, R.; Anchukaitis, K.; Briffa, K.; Büntgen, U.; Cook, E.; D'Arrigo, R. Last millennium northern hemisphere summer temperatures from tree rings: Part I: The long term context. Quat. Sci. Rev. 2016, 134, 1–18. [Google Scholar] [CrossRef]
- Moberg, A.; Sonechkin, D.M.; Holmgren, K.; Datsenko, M.; Karlen, W. Highly variable Northern Hemisphere temperatures reconstructed from low- and high-resolution proxy data. Nature 2005, 433, 613–617. [Google Scholar] [CrossRef] [PubMed]
- Christiansen, B.; Ljungqvist, F.C. The extra-tropical Northern Hemisphere temperature in the last two millennia: reconstructions of low-frequency variability. Clim. of the Past. 2012, 8, 765–786. [Google Scholar] [CrossRef]
- Guillet, S.; Corona, C.; Khodri, M.; Lavigne, F.; Ortega, P.; Eckert, N.; et al. Climate response to the Samalas volcanic eruption in 1257 revealed by proxy records. Nat. Geosci. 2017, 10, 123–128. [Google Scholar] [CrossRef]
- Büntgen, U.; Allen, K.; Anchukaitis, K.J.; Arseneault, D.; Boucher, E. , Chatterjee, S. The influence of decision-making in tree ring-based climate reconstructions. Nat. Commun. 2021, 12, 3411. [Google Scholar] [CrossRef] [PubMed]
- Loehle, C. A 2000-year global temperature reconstruction on non-tree ring proxies. Energy Environ. 2007, 18, 1049–1058. [Google Scholar] [CrossRef]
- Torrence, C.; Compo, G.P. () A Practical Guide to Wavelet Analysis. Bull. Amer. Meteorol. Soc. 1998, 79, 61–78. [Google Scholar] [CrossRef]
Figure 1.
Reconstructions of the Northern Hemisphere temperature used in work: A – the tree-ring proxy of Esper et al. [13]; B – the multiproxy of Moberg et al. [16]; C – the non tree-ring proxy of Loehle [20]; D – the multiproxy of Christiansen and Ljungqvist [17]; E – the tree-ring proxy of Schneider et al. [14]; F – the tree-ring proxy of Wilson et al. [15]; G – the multiproxy of Guillet et al. [18]; H – the tree-ring proxy of Büntgen et al. [19].
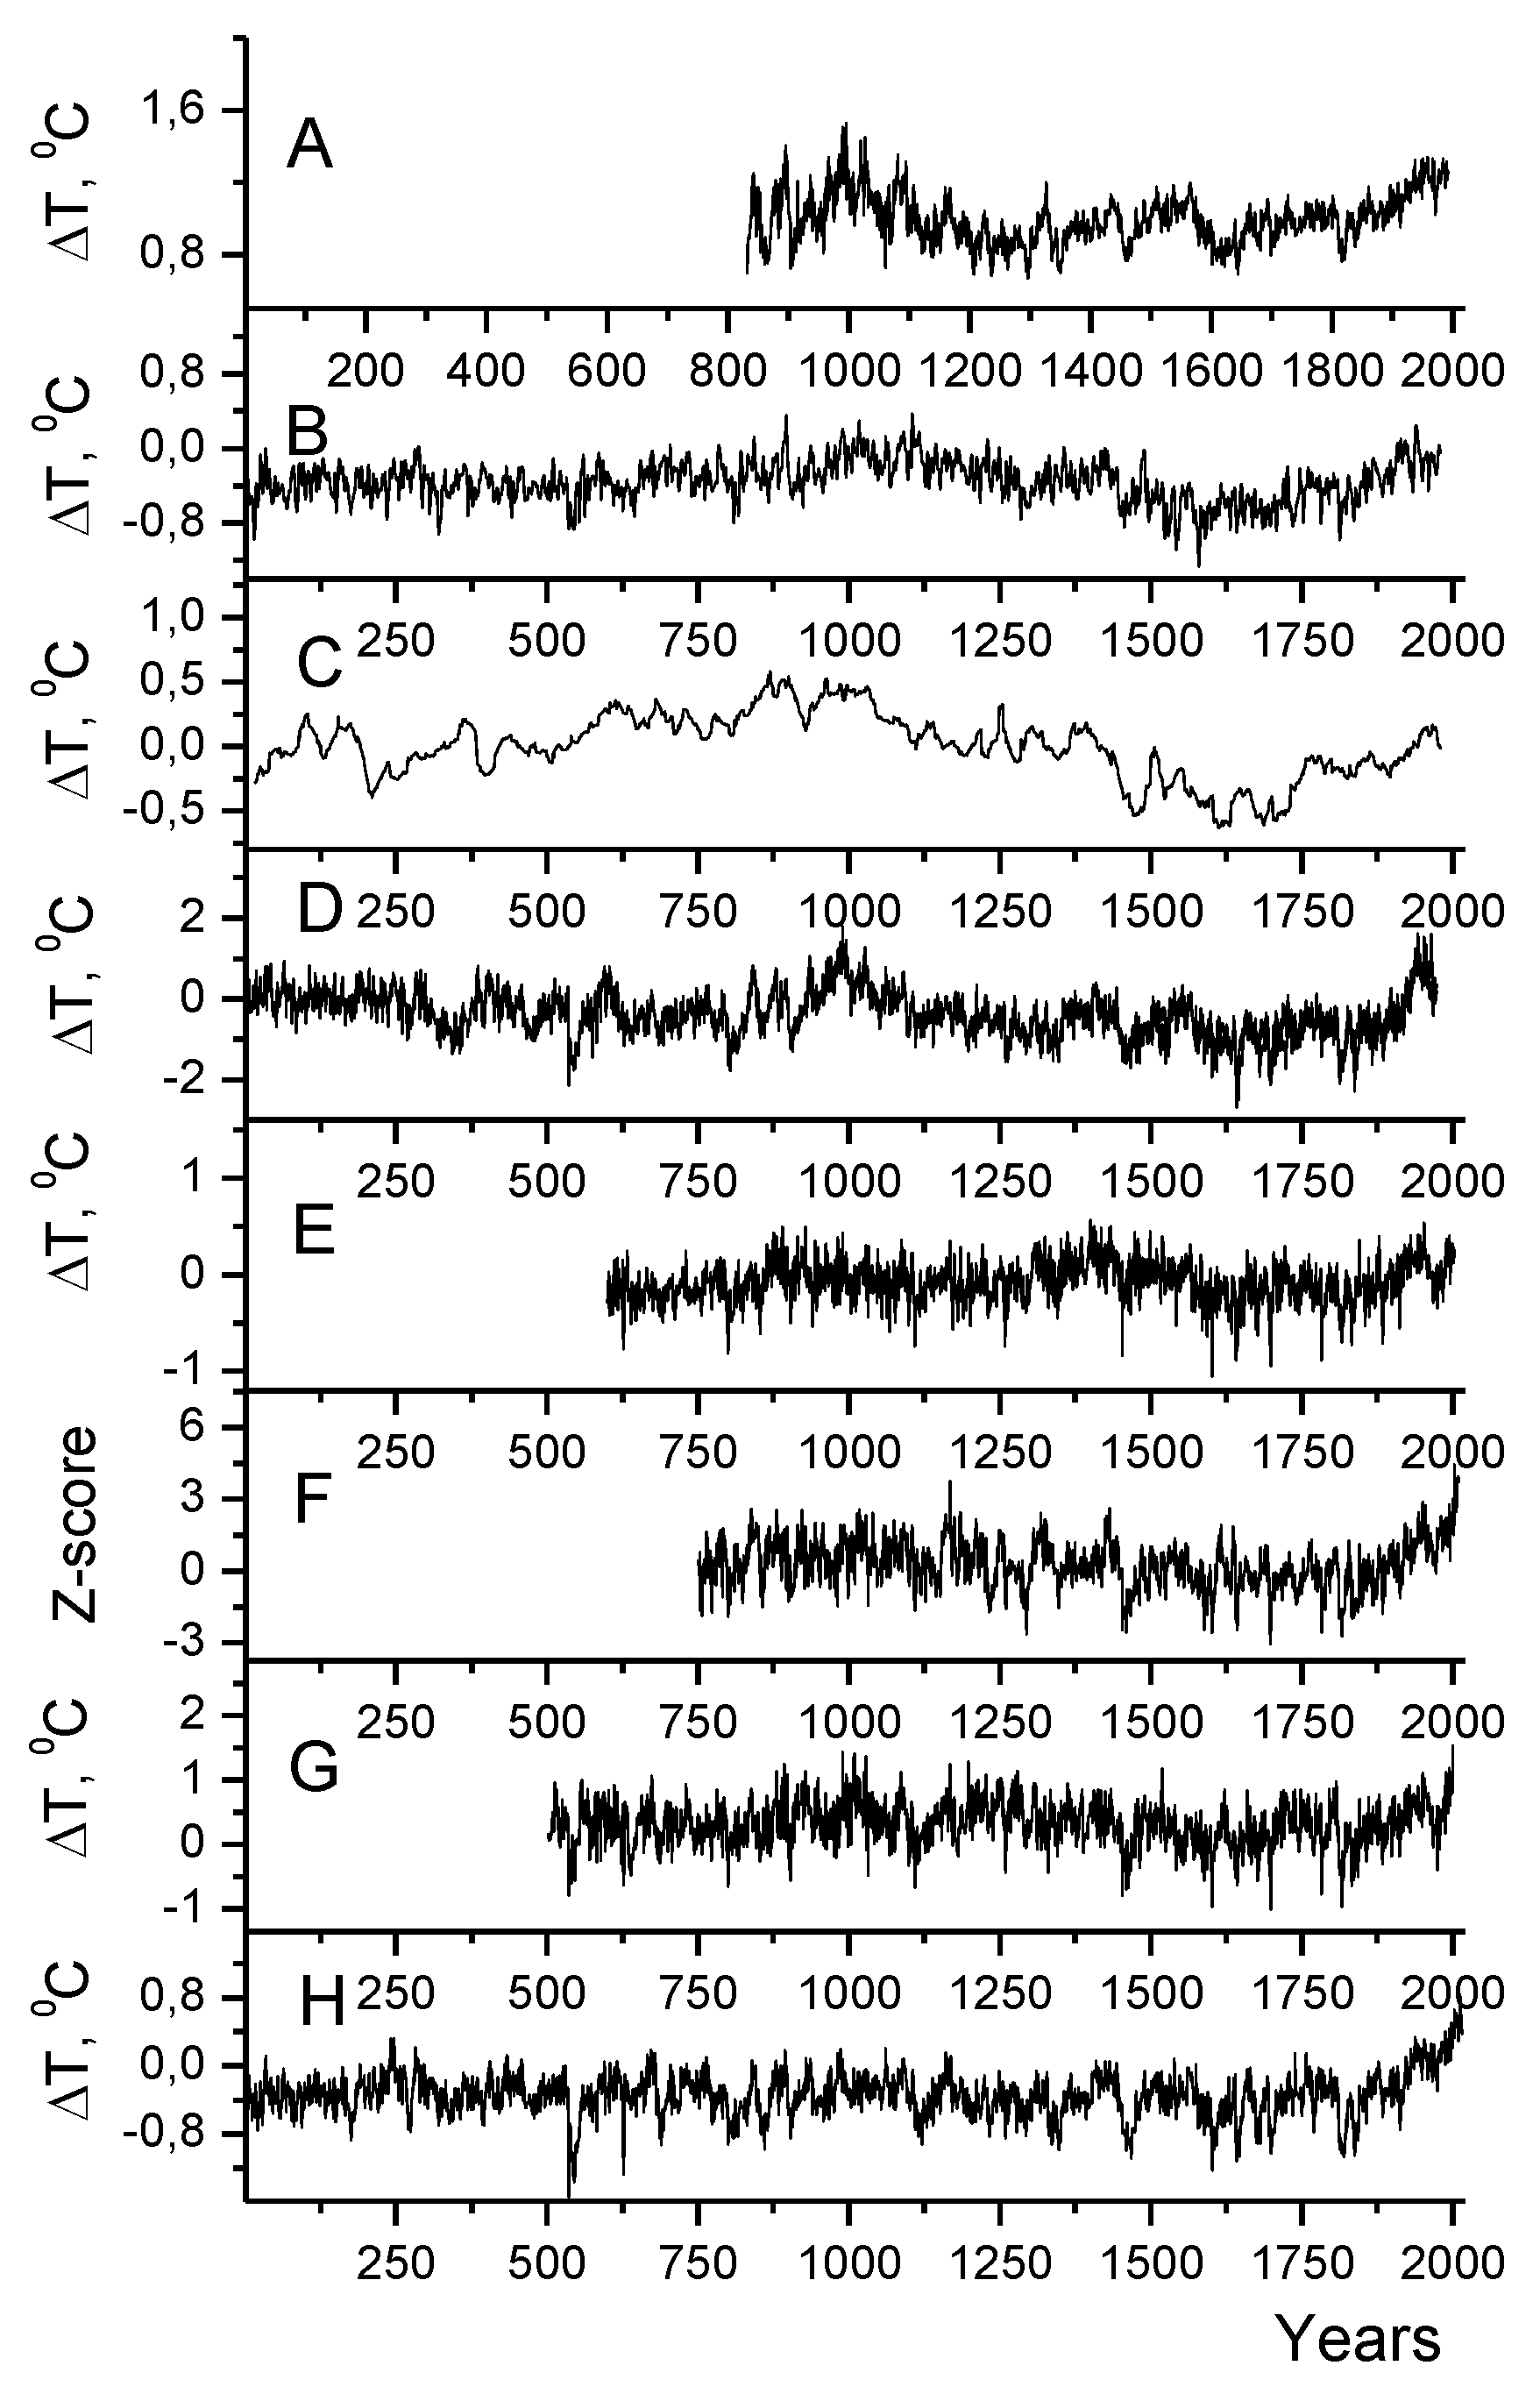
Figure 2.
Fourier spectra of temperature series A – the tree-ring proxy of Esper et al. [13]; B – the multiproxy of Moberg et al. [16]; C – the non tree-ring proxy of Loehle [20]; D – the multiproxy of Christiansen and Ljungqvist [17]; E – the tree-ring proxy of Schneider et al. [14]; F – the tree-ring proxy of Wilson et al. [15]; G – the multiproxy of Guillet et al. [18]; H – the tree-ring proxy of Büntgen et al. [19]. Dashed lines represent 0.95 confidence levels.
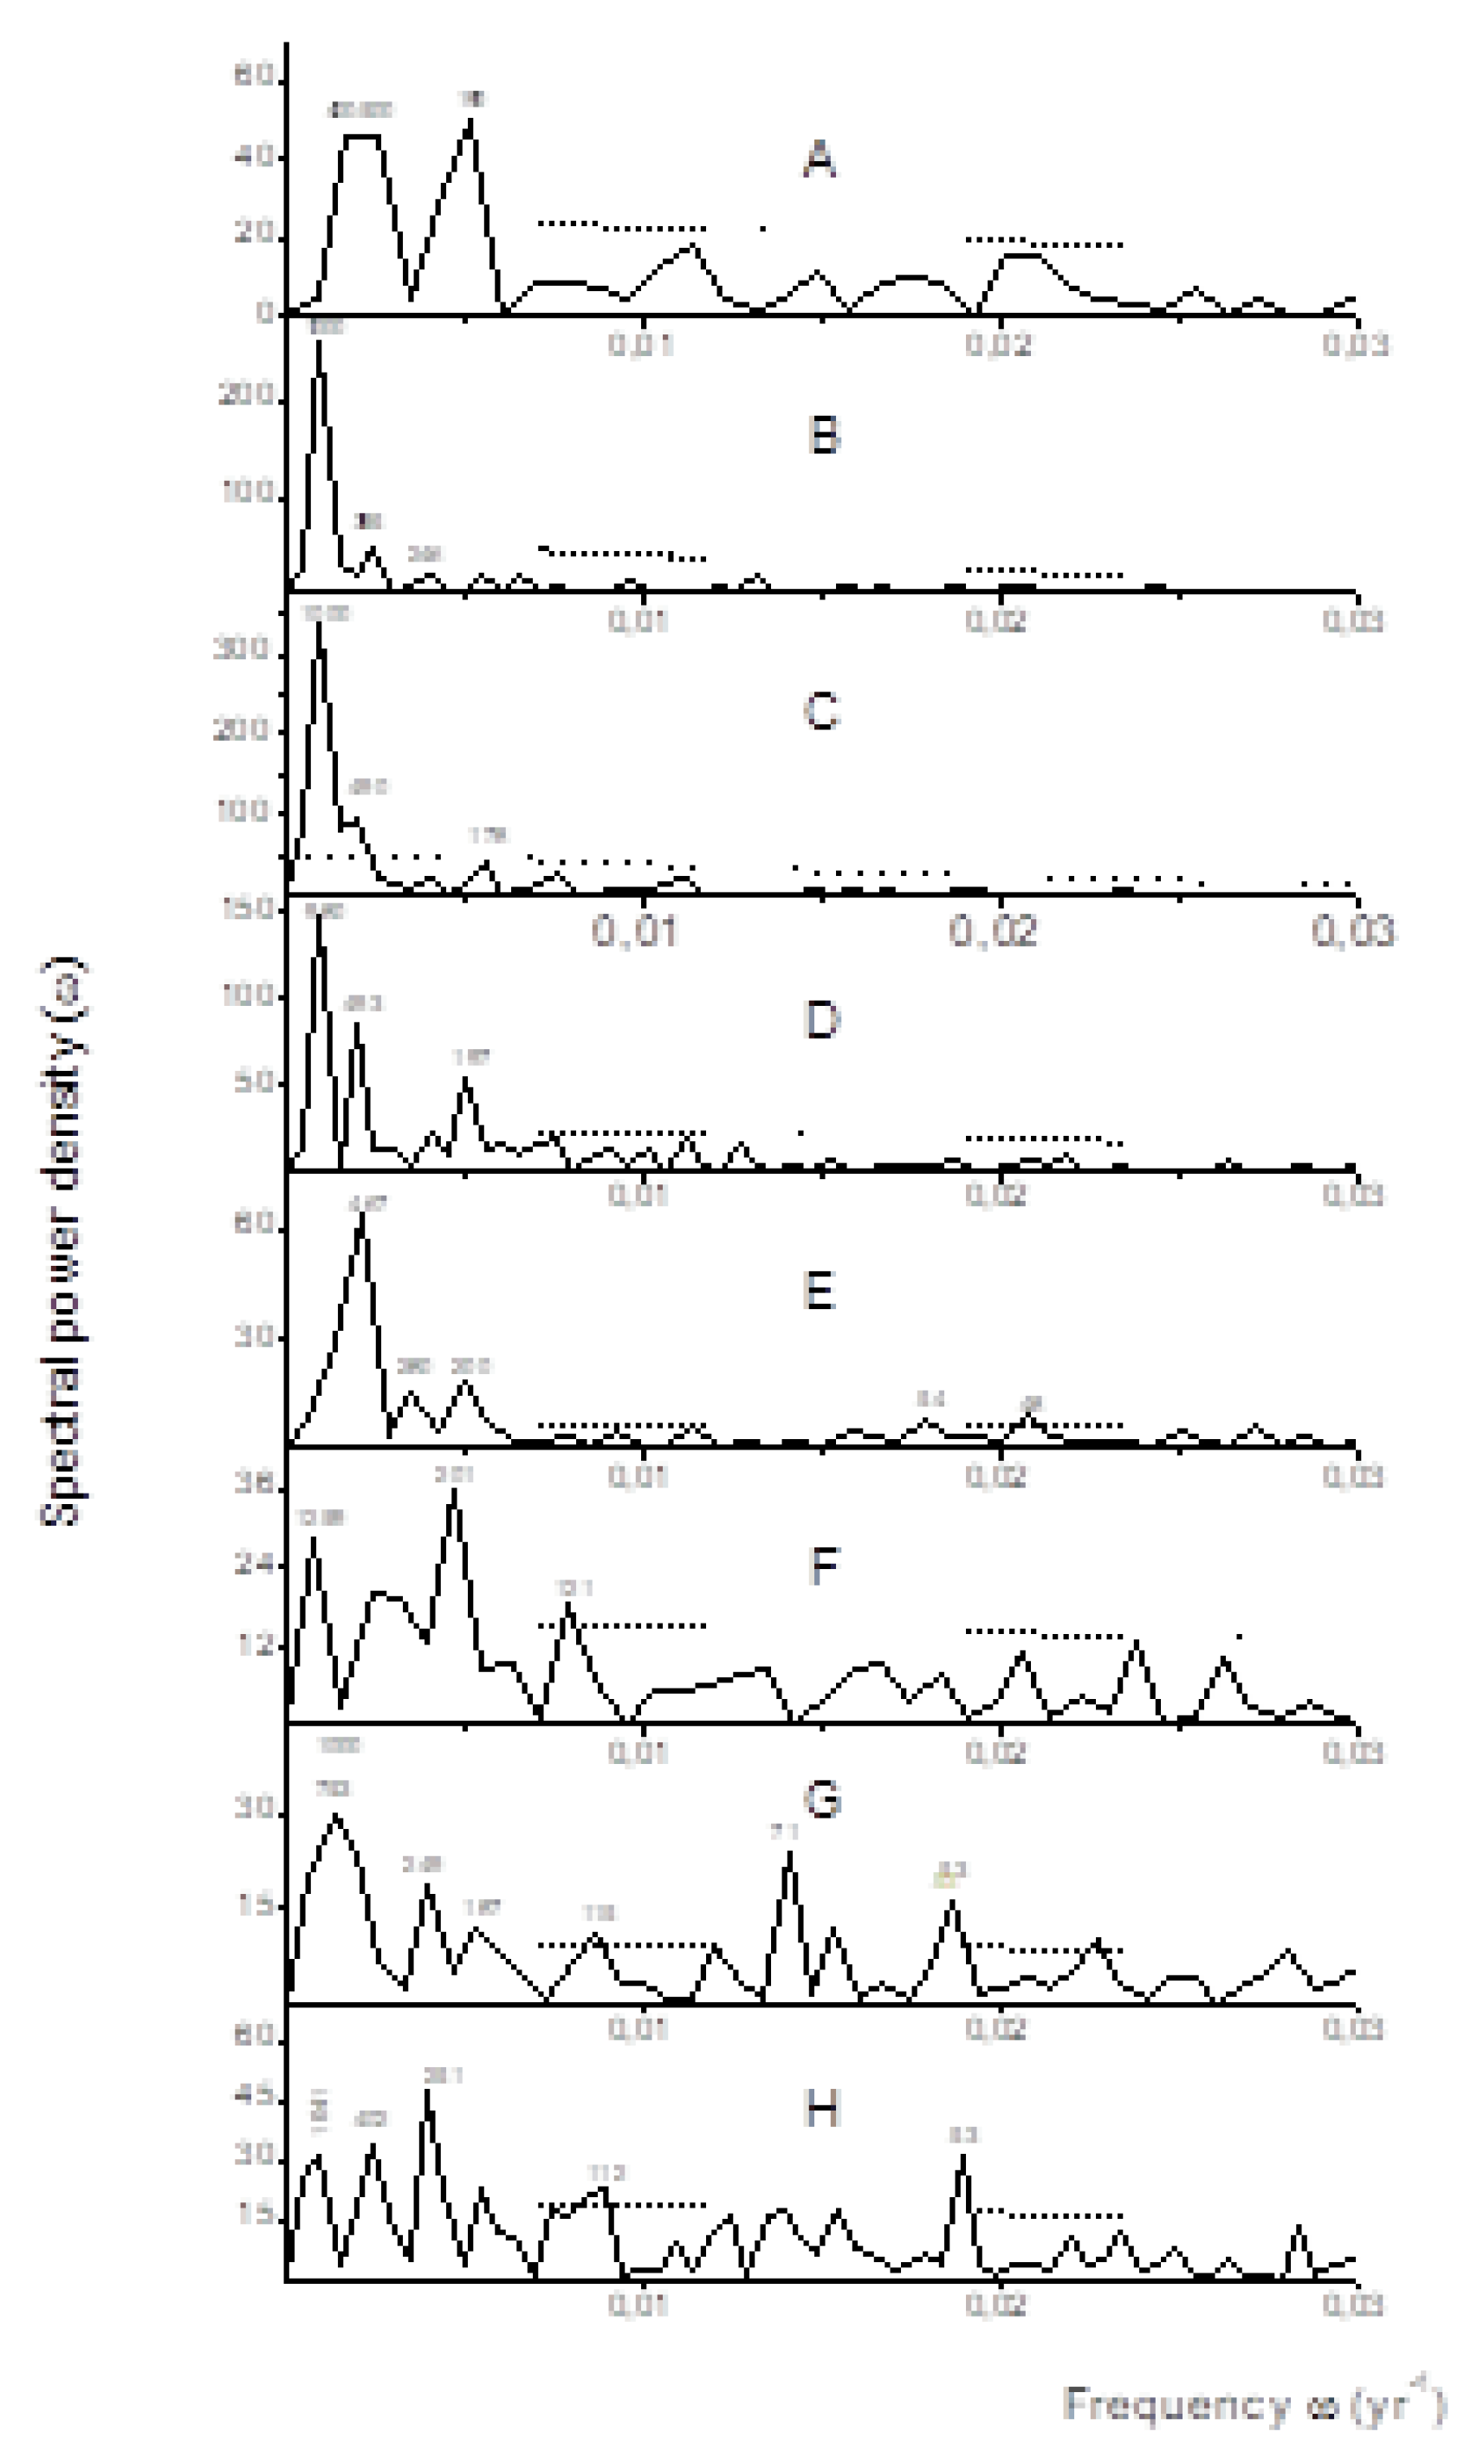
Figure 3.
Global wavelet spectra of temperature series: A – the tree-ring proxy of Esper et al. [13]; B – the multiproxy of Moberg et al. [16]; C – the non tree-ring proxy of Loehle [20]; D – the multiproxy of Christiansen and Ljungqvist [17]; E – the tree-ring proxy of Schneider et al. [14]; F – the tree-ring proxy of Wilson et al. [15]; G – the multiproxy of Guillet et al. [18]; H – the tree-ring proxy of Büntgen et al. [19]. Dashed lines represent 0.95 confidence levels.
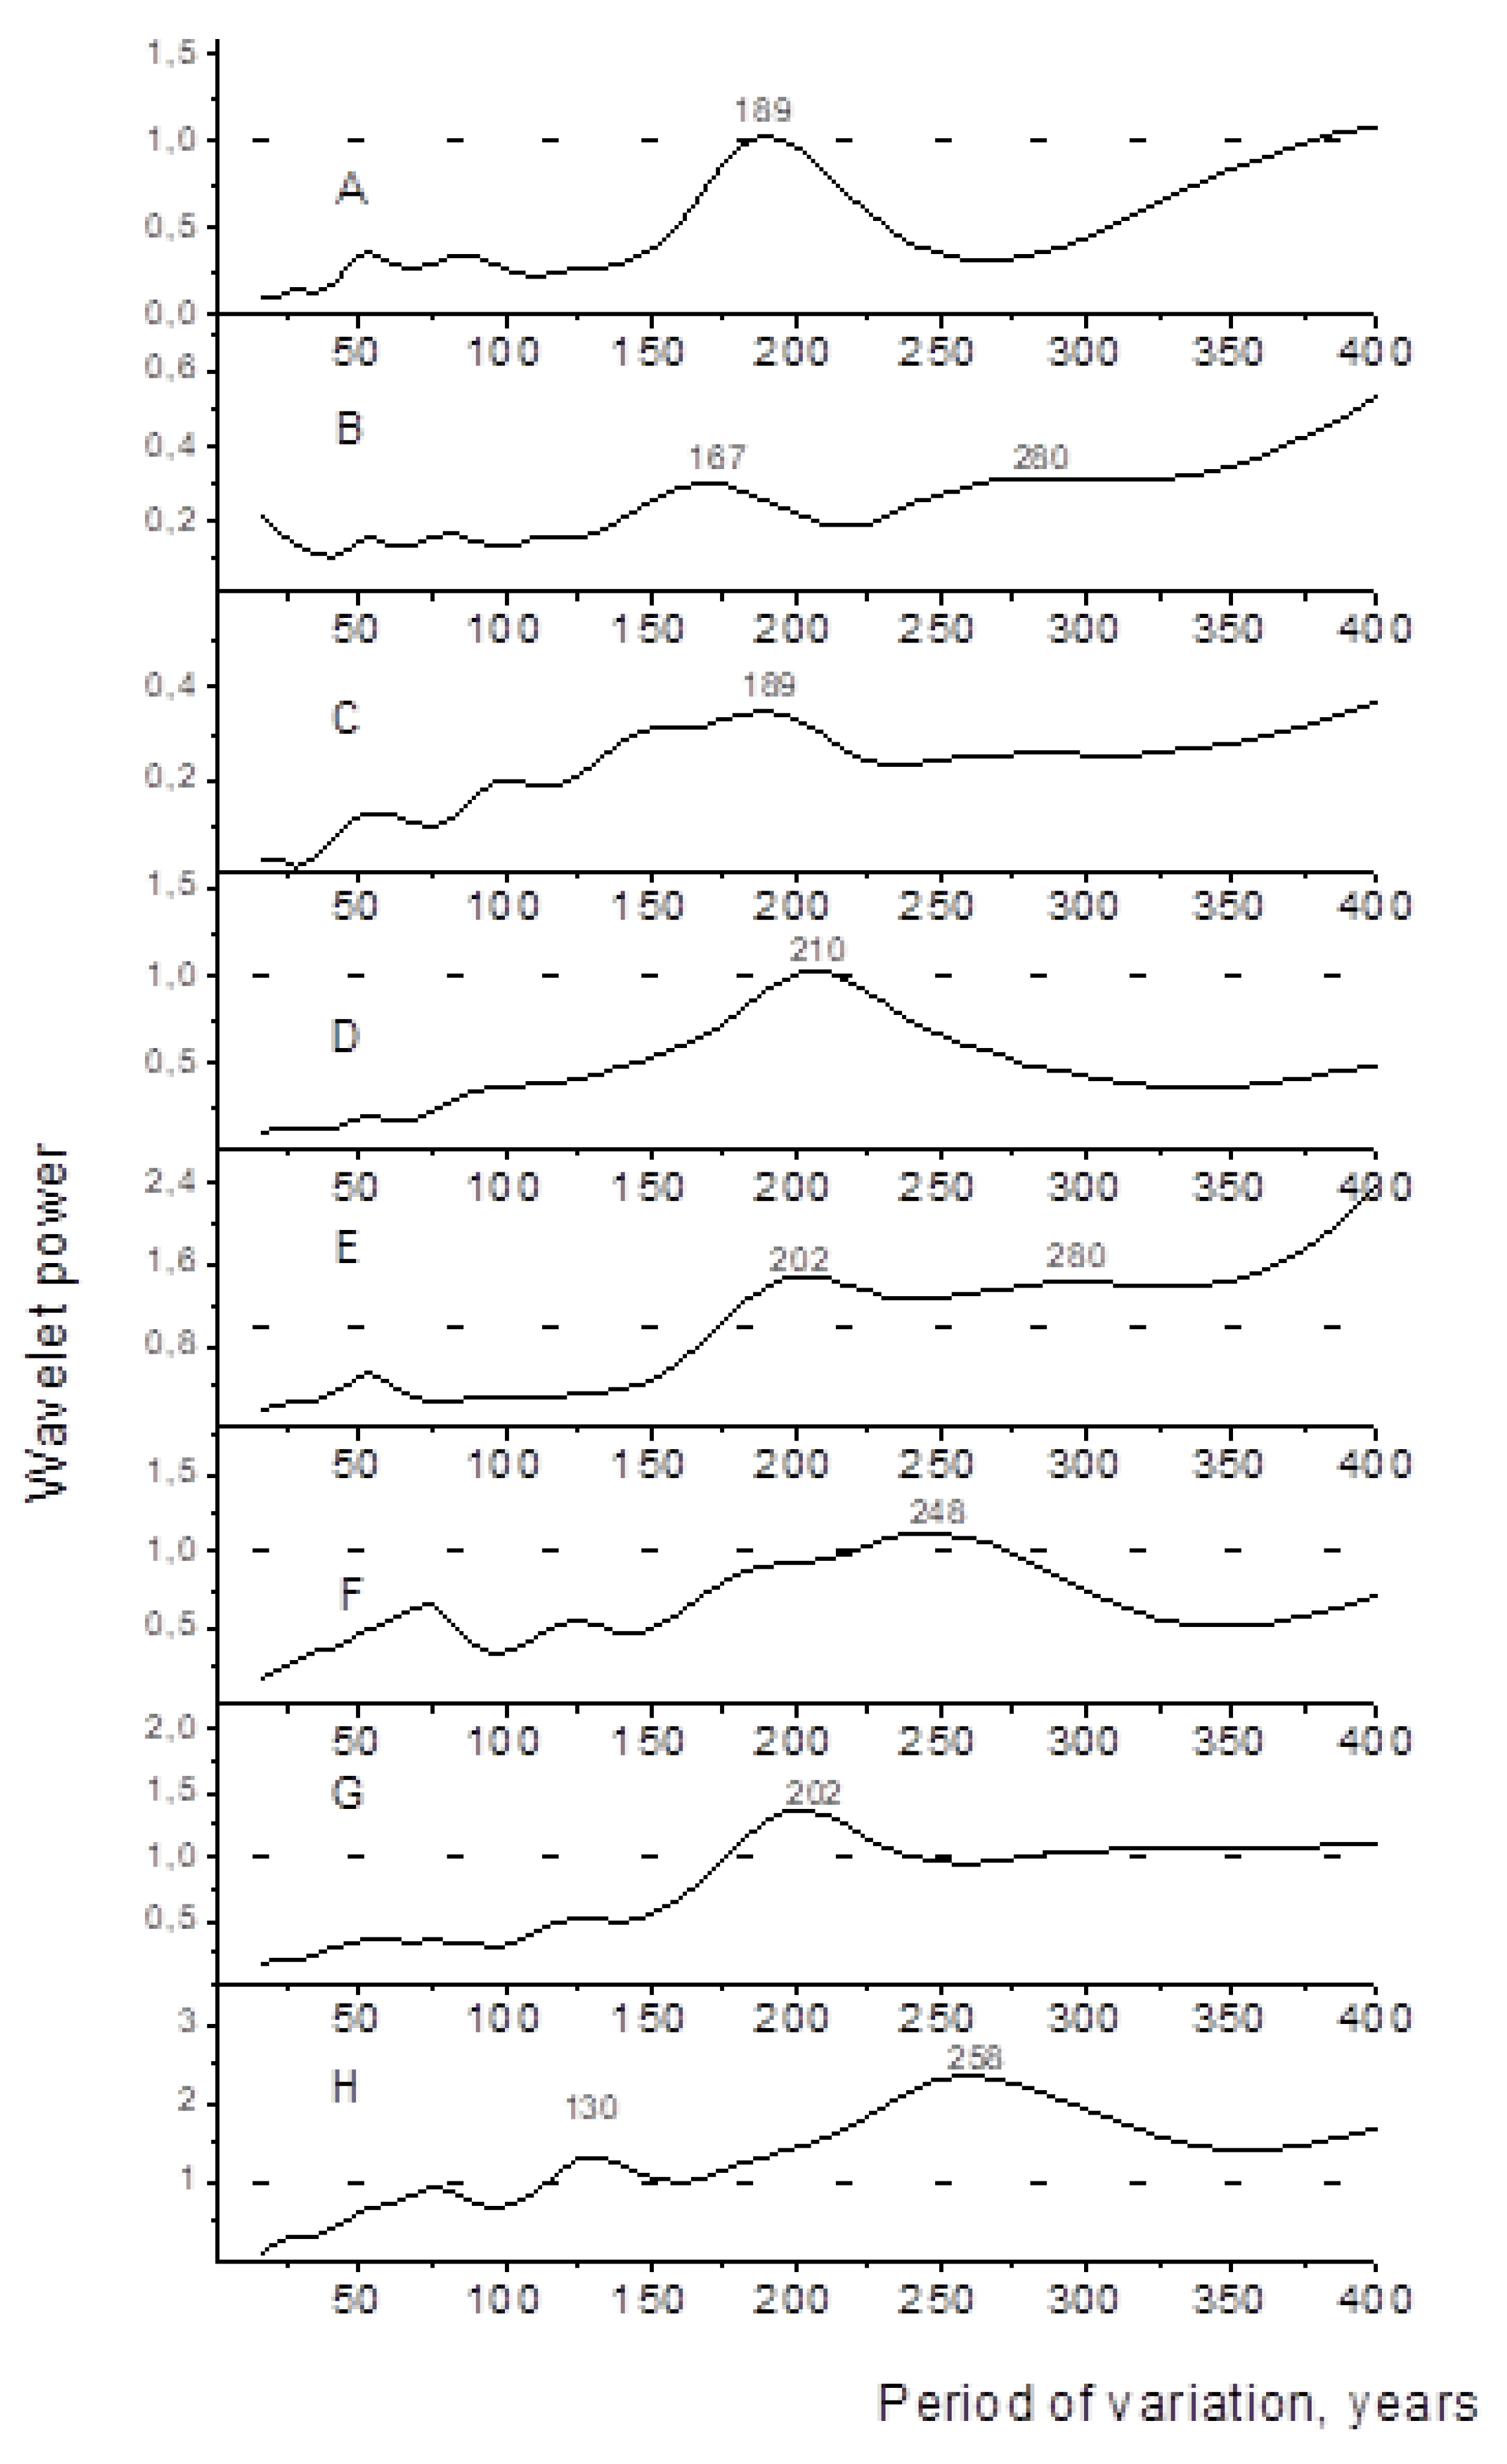
Figure 4.
A – first principal component of eight temperature series PC1; B – local Morlet wavelet spectrum of PC1 normalized to 0.95 confidence level; C – global Morlet wavelet spectrum of PC1 normalized to 0.95 confidence level; D – Fourier spectrum of PC1, dotted line – 0.95 confidence level.
Figure 4.
A – first principal component of eight temperature series PC1; B – local Morlet wavelet spectrum of PC1 normalized to 0.95 confidence level; C – global Morlet wavelet spectrum of PC1 normalized to 0.95 confidence level; D – Fourier spectrum of PC1, dotted line – 0.95 confidence level.
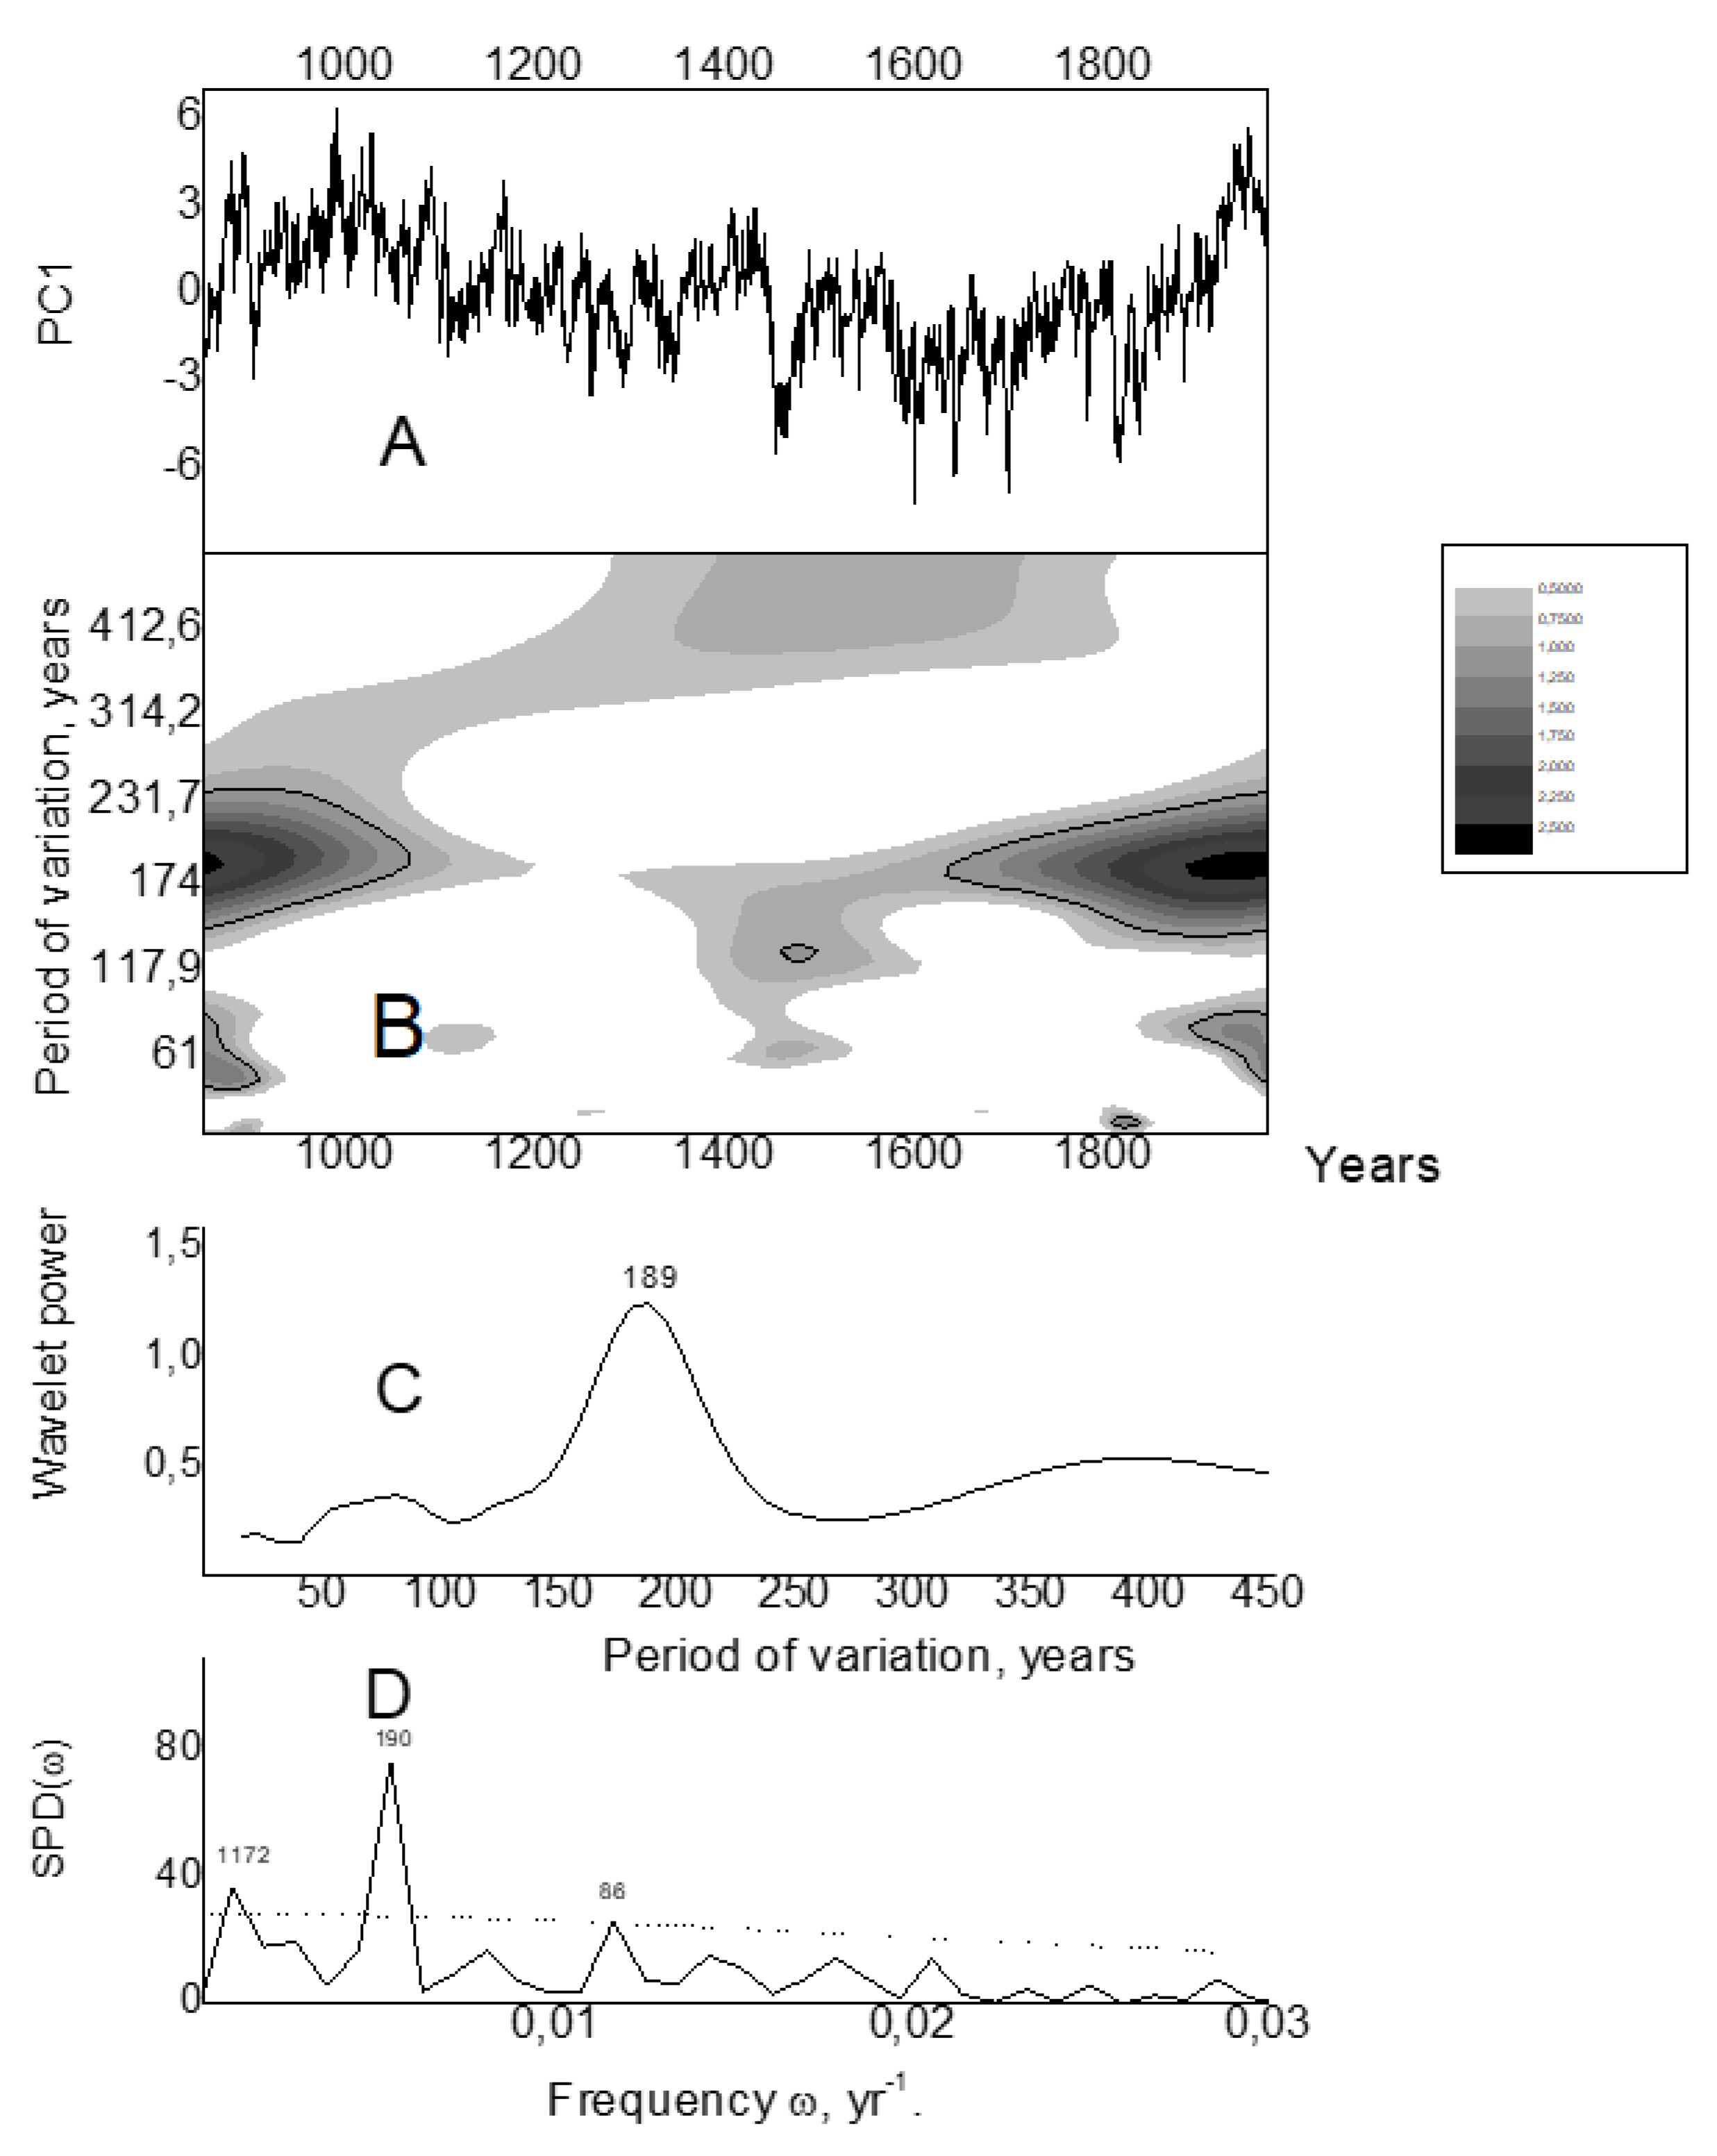
Figure 5.
Temperature proxies, wavelet filtered in 171 – 259 yr scale band. A – the tree-ring proxy of Esper et al. [13]; B – the multiproxy of Moberg et al. [16]; C – the non tree-ring proxy of Loehle [20]; D – the multiproxy of Christiansen and Ljungqvist [17]; E – the tree-ring proxy of Schneider et al. [14]; F – the tree-ring proxy of Wilson et al. [15]; G – the multiproxy of Guillet et al. [18]; H – the tree-ring proxy of Büntgen et al. [19].
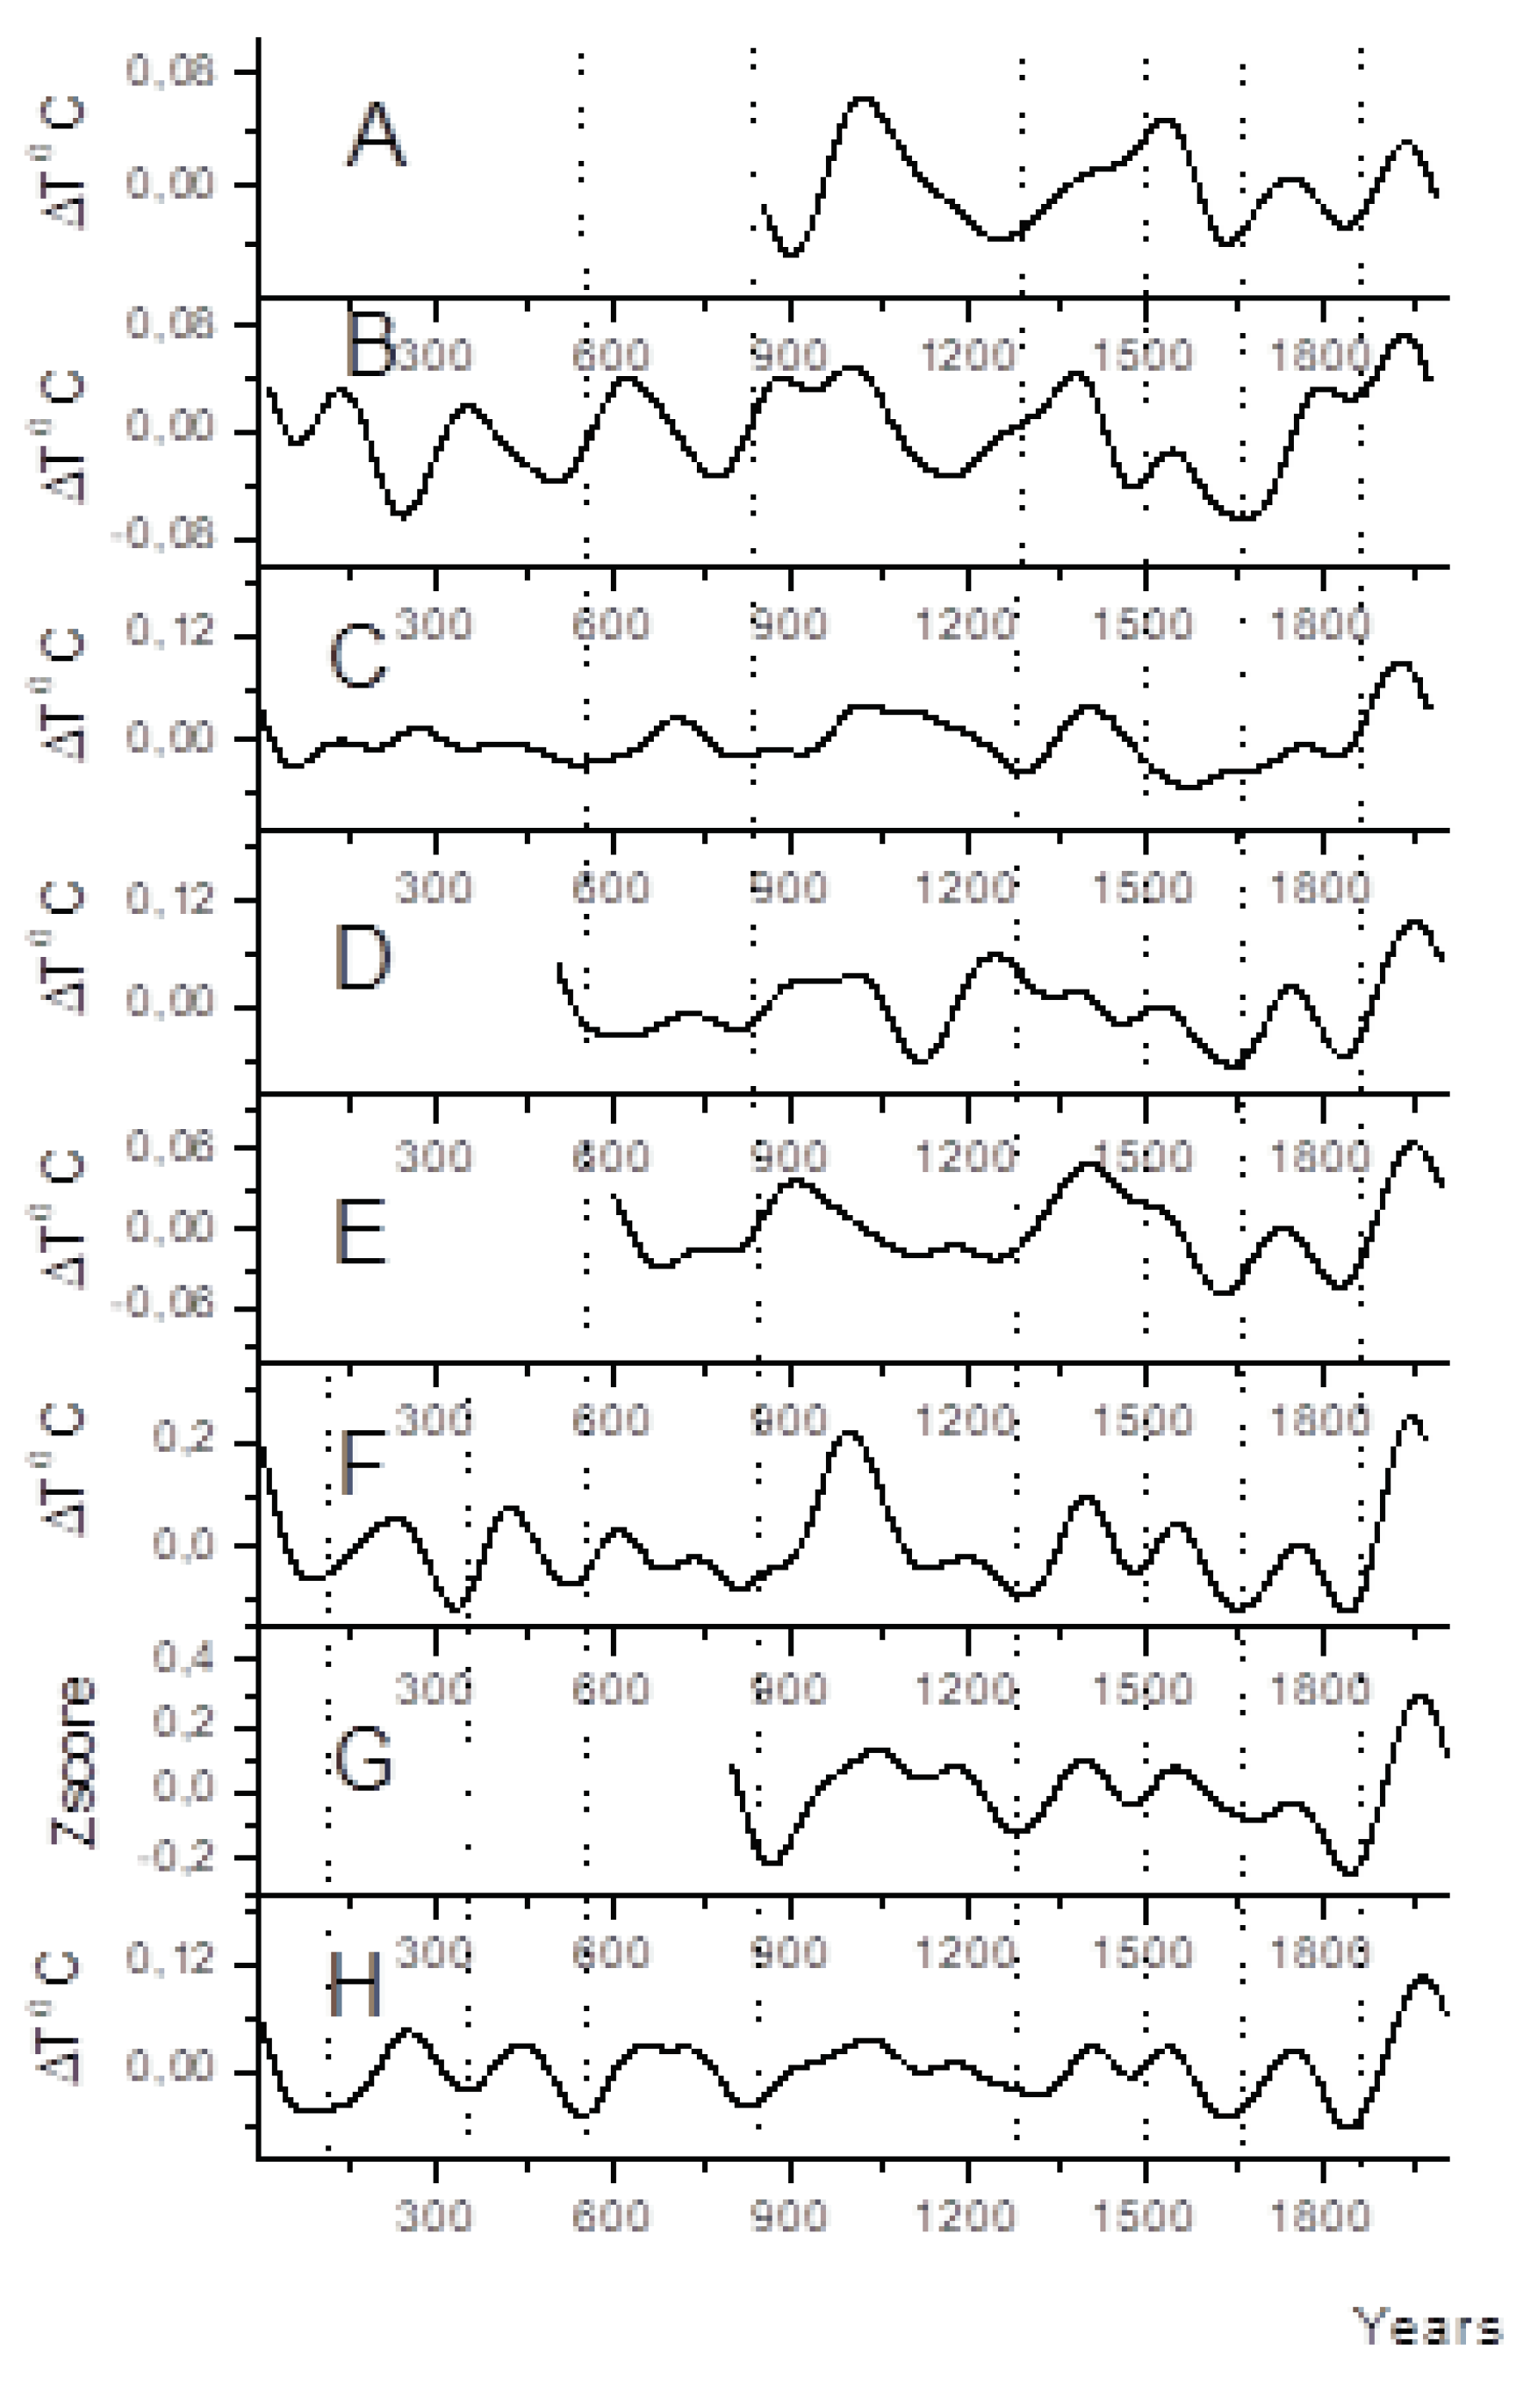

Table 1.
A list of millennial-length reconstructions of the Northern Hemisphere temperature used in analysis.
Table 1.
A list of millennial-length reconstructions of the Northern Hemisphere temperature used in analysis.
| Source | Time span | Responsive season | Geographic area | Data type |
|---|---|---|---|---|
| Esper et al. [13] | 831-1992 | Growing season | Extratropical part of the Hemisphere (Φ>300 | Tree-ring (TRW) |
| Moberg et al. [16] | 1-1979 | annual | Northern Hemisphere | Multi-proxy (TRW, δ18O, P, BT, IM) |
| Loehle [20] | 16-1980 | annual | Northern Hemisphere | Non tree-ring multi-proxy (BT, δ18O, P, Mg/Ca, VS, diatoms) |
| Christiansen and Ljungqvist [17] | 0-1973 | annual | Extratropical part of the Hemisphere (Φ>300 N) | Multi-proxy (TRW, MXD, 18O, VS, D, P, speleotemperaturе) |
| Schneider et al. [14] | 600-2002 | June-August | Extratropical part of the Hemisphere (Φ>300 N) | Tree-ring (MXD) |
| Wilson et al. [15] | 800-2010 | May-August | Northern Hemisphere | Tree-ring (MXD) |
| Guillet et al. [18] | 500-2000 | JunAugust | Northern Hemisphere | Multi-proxy (TRW, MXD, δ18O) |
| Buntgen et al. [19] | 1-2016 | June-August | Northern Hemisphere | TRW |
Table 2.
Bandpass (171–259 year) correlation between different temperature proxies.
| Esper et al. [13] | Moberg et al. [16] | Loehle [20] | Christiansen and Ljungqvist [17] | Schneider et al. [14] | Wilson et al. [15] | Guillet et al. [18] | Büntgen et al. [19] | |
|---|---|---|---|---|---|---|---|---|
| Esper et al. [13] | 0.40 (0.37) | 0.28 (0.45) | 0.81 (0.009) | 0.37 (0.61) | 0.68 (0.023) | 0.16 (0.72) | 0.75 (0.009) | |
| Moberg et al. [16] | 0.49 (0.059) | 0.61 (0.001) | 0.51 (0.097) | 0.67 (0.012) | 0.49 (0.57) | 0.67 (0.001) | ||
| Loehle [20] | 0.45 (0.048) | 0.62 (0.024) | 0.32 (0.43) | 0.61 (0.008) | 0.23 (0.72), | |||
| Christiansen and Ljungqvist [17] | 0.67 (0.046) | 0.87 (0.001) | 0.66 (0.017) | 0.76 (<10-3) | ||||
| Schneider et al. [14] | 0.50 (0.090) | 0.69 (0.012) | 0.71 (0.012) | |||||
| Wilson et al. [15] | 0.45 (0.14) | 0.91 (<10-3) | ||||||
| Guillet et al. [18] | 0.64 (0.009) | |||||||
| Büntgen et al. [19] |
Italic figures in brackets show significance of the correlation coefficient. Small bold figures display coefficients of correlation with significance p<0.10, big bold figures – p<0.05.
Disclaimer/Publisher’s Note: The statements, opinions and data contained in all publications are solely those of the individual author(s) and contributor(s) and not of MDPI and/or the editor(s). MDPI and/or the editor(s) disclaim responsibility for any injury to people or property resulting from any ideas, methods, instructions or products referred to in the content. |
© 2024 by the author. Licensee MDPI, Basel, Switzerland. This article is an open access article distributed under the terms and conditions of the Creative Commons Attribution (CC BY) license (https://creativecommons.org/licenses/by/4.0/).
Copyright: This open access article is published under a Creative Commons CC BY 4.0 license, which permit the free download, distribution, and reuse, provided that the author and preprint are cited in any reuse.


