
Submitted:
26 March 2024
Posted:
27 March 2024
You are already at the latest version
Abstract
In voice analysis, the electroglottographic (EGG) signal has long been recognized as a useful complement to the acoustic signal, if only when the vocal folds are actually contacting, such that this signal has an appreciable amplitude. However, phonation can occur also without vocal fold contacting, as in breathy voice, in which case the EGG amplitude is low, but not zero. It is of great interest to identify the transition from non-contacting to contacting, because this will substantially change the nature of the vocal fold oscillations; yet that transition is not in itself audible. The magnitude of the normalized peak derivative of the EGG signal is a convenient indicator of contacting, but no current EGG hardware has a sufficient signal-to-noise ratio of the derivative. The textbook techniques of spectral thresholding and static notch filtering are straightforward to implement, can run in real time, and can mitigate several noise problems in EGG hardware.
Keywords:
electroglottography
; de-noising
; contact quotient
; peak dEGG
; spectral thresholding
; notch filtering
1. Introduction
In voice analysis, the electroglottographic (EGG) signal has long been recognized [1] as a useful electromechanical complement to the acoustic signal. For the purpose, principle and interpretation of EGG, the reader is referred to existing overviews [2,3].
It is commonly held that the EGG signal is useful mainly when the vocal folds (VF) are actually contacting, such that the variations in vocal fold contact area (VFCA) have an appreciable amplitude. However, phonation can occur also without VF contacting, as in soft or breathy voice. Identifying the transition from non-contacting to contacting is of great theoretical and clinical interest, because the onset of contacting will substantially change the nature of the vocal fold oscillations, with consequences for numerous metrics of the voice. Interestingly, this transition between contacting and non-contacting is not audible as such. In a separate article [4], we describe how EGG metrics can indicate contacting, how VF contacting affects other voice metrics, and how non-contacting VF oscillations dominate the considerable parts of the voice range that are low in sound pressure level (SPL).
In soft or breathy phonation, the vocal folds are oscillating without contacting, and the EGG amplitude is very low. It is not quite zero, because there is still a tiny variation in VFCA at one or both ends of the vocal folds. This ‘micro-variation’ tends to be very nearly sinusoidal. One convenient indicator of VF contacting is the cycle-normalized peak derivative QΔ of the EGG signal [5], which assumes a minimum value of 1 for the sinusoidal waveform of no contacting, and abruptly increases whenever contacting occurs – but this holds only if the signal is not contaminated by noise.
The few existing manufacturers of EGG hardware have hitherto focused entirely on the EGG waveform during contacting, and have striven to achieve a signal-to-noise ratio (SNR) that is adequate for representing high-amplitude signals. This is quite a challenge in itself. In practice, many models on the market have a poor SNR even for signals with distinct contacting, which hampers the precise estimation of waveform characteristics such as the cycle period, the contact quotient and the peak derivative. If we want reliable detection of a low-amplitude modulation of the VFCA, there is currently no commercial hardware that we are aware of that affords a sufficiently high SNR of the signal’s derivative, which is necessarily much noisier than the signal itself.
We therefore seek to mitigate some common noise sources in EGG devices. The present article is a technical note on post-hoc signal processing methods for pragmatically reducing the impact of the various noise sources that may be present in EGG signals. Here, “pragmatic” means that the methods can be applied as part of a real-time analysis chain without requiring much extra time or expertise from the operator. Techniques that automatically characterize and combat noise exist, but since their effects on the EGG waveform are as yet undocumented, they are not considered here. First, several types of noise are reviewed, then some possible remedies are proposed, and finally a practical implementation is described.
2. Types of Noises in EGG Signals
EGG signals are very often contaminated by noise from several sources. These include (1) low-frequency drift due to relatively slow conductance changes in the body of the informant, (2) electrical hum from the device’s own power supply or from the general electromagnetic environment of the experimental setup, (3) broadband system noise of analog or digital origin, and (4) rogue static high frequencies in the 2-20 kHz range. When preparing for data collection with EGG, it is therefore essential first to assess the signal quality by listening to the EGG signal, and also to inspect it with full-range, narrow-band spectra and spectrograms.
2.1. Low-Frequency Drift
While the noise types to be described below all stem from the equipment, even the EGG signal itself contains unwanted components. It is the AC component of the EGG signal that we are interested in, which represents the change in VFCA during phonation. This AC component is however much smaller in amplitude than the total EGG signal amplitude (typically 1-10%). EGG signals tend to contain a large amount of irrelevant low-frequency fluctuations at <20 Hz, “near-DC” (Figure 1b), that are due to conductance variations from muscle activity and sometimes even from the pulsating blood flow in the neck. These near-DC components can make automatic segmentation into cycles [5] less accurate, and they can easily offset the signal by so much that clipping occurs, thereby corrupting or even obliterating the AC component. Therefore, most EGG devices include an analog high-pass filter at 2-20 Hz that attenuates the near-DC parts of the signal. This filtering inevitably introduces some distortion of the EGG pulse shape, especially when fo is low. Some systems can perform post-compensation for such distortion, in software.
2.2. Broadband Noise
Any analog electronic equipment will have some inherent background thermal noise, while digital systems necessarily have quantization noise. Both these noise types are usually evenly spread across the spectrum. However, the dynamic range of the AC component of the EGG signal is typically no larger than 40 dB, even in the best hardware. This means that the analog noise of the EGG device will usually be much stronger than the digital quantization noise introduced by a standard 16-bit A/D converter. (For the acoustic signal, the dynamic range of trained human voices can approach or exceed 90 dB, which requires 24-bit conversion and very low-noise preamplifiers, in order to stay well above the quantization noise floor.)
Some EGG devices have rechargeable lead-acid battery cells, which may start to generate a crackling noise if they are overcharged. Once it has set in, this type of noise does not go away. The cells will need to be replaced, as instructed by the manufacturer.
2.3. Spurious High Frequencies
More often than not, a narrow-band long-time average spectrum (LTAS) of the EGG signal will reveal one or more static frequencies at 2 kHz or more, superimposed on the signal. An example is shown in Figure 2, of a quiescent EGG channel when there is no phonation. Such ‘side tones’ can result from sampling artefacts, switching power supplies, digital/analog crosstalk within the device; or from interference with other equipment that, like the EGG, modulates signals in the MHz range, such as inductive bands for respiration measurements. Such high-frequency spikes in the frequency domain are particularly disruptive to the estimation of QΔ in the time domain. If the frequency of a side tone is static, the tone can usually be suppressed using a narrow notch filter, as described below.
For convenience, current EGG devices often have a low-cost stereo USB audio interface built in, the EGG signal being paired with the microphone signal. This is not necessarily a good idea, though, because (a) the dynamic range of the accompanying microphone preamplifier is rarely large enough for the voice; and (b) such devices are prone to digital-analog crosstalk, which is a source of side-tones. In the current market, this author prefers analog-only EGG devices, and digitizing their signals with a separate high-quality digital audio interface.
2.4. Electrical Hum
Mains-induced hum is a stationary tone at 50 or 60 Hz, with harmonics at integer multiples of that fundamental frequency, sometimes extending as high as 500 Hz. This is in the same range as that of EGG signals of human phonation, which can be problematic if the hum is strong. An example is shown in Figure 3.
3. Signal Clean-Up Techniques
3.1. High-Pass Filtering
EGG devices usually have some kind of analog high-pass filter built in, to attenuate the large unwanted near-DC component. Still, remaining low-frequency content can complicate the computation of the contact quotient. In the digital domain, recursive filters (infinite impulse response, IIR) compute quickly, but tend to introduce phase distortion even above the cutoff frequency. Instead, it is possible to apply a very steep digital linear-phase transverse filter (finite impulse response, FIR) to eliminate the near-DC component almost entirely, which simplifies further processing. The disadvantage is that if the fo descends below the cutoff frequency, there will still be some distortion of the EGG waveform. Also, such a filter is necessarily long and thus introduces a noticeable delay. To achieve low latency for real-time feedback applications, this means that its cutoff frequency cannot be lower than about 100 Hz, if the sampling rate is 44100 Hz. An example is shown in the left-hand part of Figure 2.
3.2. Notch Filtering
In Figure 2, the blue curve shows a LTAS of a quiescent EGG signal with two static side tones at 2850 at 6080 Hz, and also a narrow noise band centered on 3520 Hz. Taking the derivative of a signal is equivalent to tilting its spectrum up by +20 dB per decade in frequency, so these unwanted signal components will cause problems when estimating the aforementioned QΔ metric. A so-called ‘notch’ filter can be used to attenuate them selectively. A notch filter results from setting a parametric equalizer filter to negative gain and a narrow bandwidth. An example of using such filters, manually adjusted, is given by the orange curve in Figure 2. This will work only if the side tones are very stable in frequency over the duration of the recording. The EGG waveform itself normally contains very little energy at these frequencies, so the impact of notch-filtering here on any EGG shape parameters is negligible.
3.3. Spectral Thresholding
If broadband noise has equal power at all frequencies, it is said to be ‘white’. Such noise can be effectively reduced using the textbook technique of spectral thresholding, as follows. The signal to be de-noised is first transformed into the frequency domain, with an analysis bandwidth that is several times smaller than fo, say 20 Hz (Figure 4a). A level threshold is then applied to the log power spectrum, such that only the important EGG harmonics exceed this threshold. In the frequency bins whose levels are below this threshold, the magnitudes are attenuated downwards with a ratio of 4:1 in dB relative to the threshold (dynamics ‘expansion’), while the phases are left unchanged. Expansion is preferable to zeroing, in order to avoid transients when individual frequency components cross the threshold. The result is that any noise whose level is below the threshold, i.e., between the harmonics, is attenuated; while those harmonics whose levels are above the threshold are not attenuated (Figure 4b).
The resulting spectrum is then inverse transformed back to the time domain. This can all be done in real time, with a total buffering delay that is on the order of 80 ms. The effect on noisy EGG waveforms is to make them smooth without distorting the EGG pulse shape. This makes it possible to take the derivative as sample-to-sample differences, where the peak value in a cycle is not corrupted by noise.
The difference between low-pass filtering and spectral thresholding is further illustrated in Figure 5, with a synthesized sawtooth sweep to which white noise is added. It can be seen that a low-pass filter at 5 kHz removes the highest frequencies only, while the thresholding suppresses noise in between the harmonics. In the latter case, the weaker high harmonics are still lost, but they contribute very little to the shape of the EGG.
Better noise rejection can be had by narrowing the analysis bandwidth, but this also reduces the temporal resolution. Changes in fo within a reciprocally longer analysis time window may cause the spectrum envelope between the harmonics to rise above the threshold, reducing the suppression of noise.
If the noise is not white, but unequally distributed across the spectrum, it becomes more complicated to suppress it in this way. Custom solutions, such as a frequency-dependent threshold, then have to be devised for the particular noise.
3.4. Hum Abatement
The harmonics of mains-induced hum are typically close in frequency to those of the EGG signal, so it is usually not possible to filter or otherwise post-process them out without distorting the shape of the EGG waveform itself. Instead, one must take care not to introduce hum in the first place. Placement of the equipment and common electrical grounding of all components will be important. Again, listen to the incoming EGG signal when the electrodes are in place. If a hum changes audibly when you touch your computer or the EGG device, then the electrical grounding needs attention. A first step would be to make sure that all interconnected equipment is supplied from the same power outlet. If the hum persists, disconnect from the mains and power bricks, and run all devices on battery power. This is good also for electrical safety. Sometimes a hum will go away if you just rearrange the equipment, or relocate your setup to another room. Although the same considerations apply to the microphone signal, EGG electrodes may be less shielded electromagnetically than are microphones.
3.5. Low-Pass Filtering
Figure 6 shows an example of a quiescent EGG signal with a small 50 Hz hum at about -70 dBFS. There is also a noise band around 18 kHz that pulsates in synchrony with the hum, so it may be an artefact of a switching power supply. The spectrogram in Figure 6b was made with +6dB/octave pre-emphasis (as for the derivative), and it can there be seen that these very high frequencies will dominate the derivative, so they must be eliminated. EGG spectra seldom contain any interesting information at very high frequencies, so a steep low-pass filter at 10 kHz will suffice to do so. Whether or not the low-frequency hum will be a problem will depend on the strength of the AC component of the EGG, when phonation is present.
3.6. Black Boxes
In the arena for music and audio production, there are many software applications called ‘digital audio workstations’ (DAW) that can be equipped with third-party software plug-ins for particular purposes, including noise reduction. Such plug-ins are typically ‘trained’ on quiescent segments of the signal. From these segments, such plugins construct some internal description of the unwanted noise, which is then used to process the active segments of the signal. This can be effective, although it may require running an extra pass over the signal. The problem is that the algorithms used are usually proprietary, and are designed primarily to sound good with music or speech. Their effect on EGG waveforms – a non-acoustic signal – is plug-in specific, and unknown to the end user.
4. Detecting VF Contact
The gain of EGG signals is all but impossible to calibrate, because the signal strength varies with the physiology of the informant, and with the vertical larynx position changing relative to the electrodes. Therefore, an amplitude threshold is not a good criterion for detecting contacting. Rather, we need a criterion that in some way considers only the EGG waveform shape.
4.1. Using QΔ
VF oscillations without contacting along the length of the vocal folds, as in breathy voice, tend to modulate the contact area only near the ends of the vocal folds, by a very small amount and in a sinusoidal fashion. As soon as the vocal folds make contact somewhere along their length, the increase in VF contact area becomes more abrupt. Hence if the EGG waveform is very close to sinusoidal, regardless of amplitude, it is very likely that there is no contacting. A sinusoidal waveform has a normalized peak derivative QΔ of 1 (the maximum of the cosine function). In practice there seems to be a reliable contacting criterion of QΔ > 2. However, even a slight noise can cause problems for the calculation of the derivative. Even with good EGG hardware, the system noise at these low amplitudes will prevent QΔ from descending completely to 1, which obscures the transition between contacting and non-contacting. This is one reason why we are so interested in de-noising the EGG.
Let us assume that we have obtained a robust segmentation of the EGG signal [5] into cycles to the nearest sampling interval (which at low SNR is not necessarily easy to do). Ideally, we would like to estimate QΔ (the normalized peak dEGG) simply by taking the difference between one sample point and the next, finding the maximum of this difference for each phonatory cycle, and normalizing to period duration and period amplitude [5]. However, any noise or spurious high frequencies will interfere with this scheme, by causing the maximum derivative of noise plus signal to be randomly larger than that of the EGG signal alone. Simply low-pass filtering the signal will not remove noise below the filter cut-off frequency, and has the further disadvantage that attenuating high harmonics will also reduce the estimate of QΔ . The spectral thresholding method, on the other hand, can preserve the amplitudes and phases of the dominating harmonics while removing noise energy at frequencies between the harmonics. This will also reduce the jitter in the cycle segmentation.
4.2. Using the HRF
The ‘harmonic richness factor’ (HRF) was defined by Childers and Lee[6] as
where Hi is the amplitude of the ith harmonic and H1 is the amplitude of the first harmonic, at the fundamental frequency. While their interest was in the glottal flow waveform, the HRF metric is equally applicable to the EGG waveform. From early testing, the onset of VF contacting appears to correspond to the HRFegg (in decibels) becoming higher than about -10 dB. With vocal effort increasing from breathy voice, HRFegg reaches a maximum of about +5 dB when the contact quotient Qci [5] is at its smallest (with the most overtones), and then decreases again as the EGG pulses become wider. An advantage of the HRFegg over QΔ is that in high falsetto voice, QΔ can become rather low, obscuring the contacting transition, while the HRFeggremains greater than -10 dB. The main disadvantage of the HRFegg is that we need to transform the EGG signal into the frequency domain and find the harmonic peaks.
5. A practical Implementation
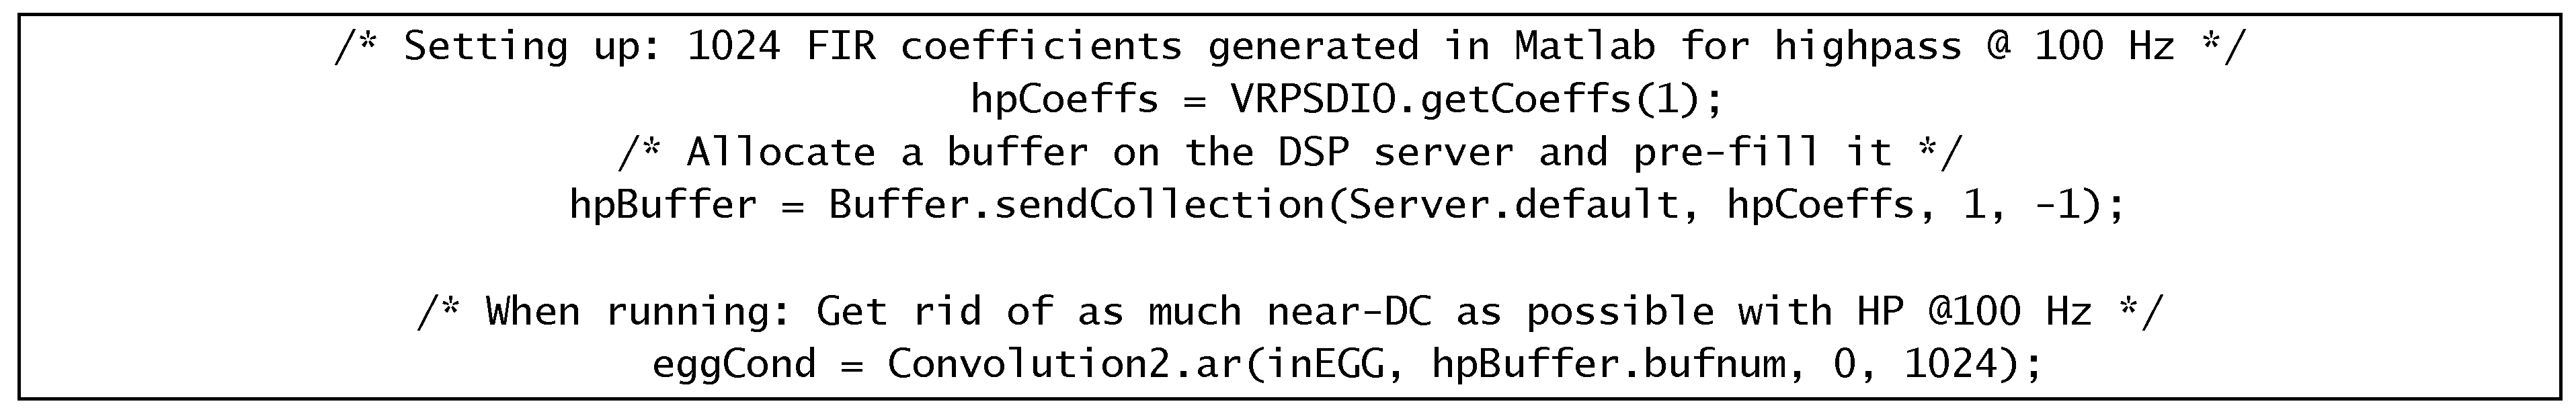
The above methods can be readily implemented with signal-processing algorithms in any math-capable computer language, including Matlab® or Python. In order to visualize how metrics of the acoustic and EGG signals vary over the range of the voice, it is useful to make voice maps [7]. The public-domain software FonaDyn [8] is a voice mapping system in continuous development. FonaDyn is written in SuperCollider [9], which is an open-source system developed for creating computer music. SuperCollider (SC) comprises a language, a signal-processing server and a development environment, and it comes with an extensive library of high-level functions which facilitate the creation of real-time sound-processing applications. Under the hood, FonaDyn implements all the signal conditioning of the EGG signal mentioned above, as follows.
5.1. High-Pass Filtering
This is done using a fixed 1024-point FIR filter, designed in Matlab®, with a linear phase response (the same delay at all frequencies), and the magnitude response shown in Figure 2. The filter class ‘Convolution2’ uses a fast Fourier Transform (FFT) to expedite the filtering. The SC code for this is as follows.
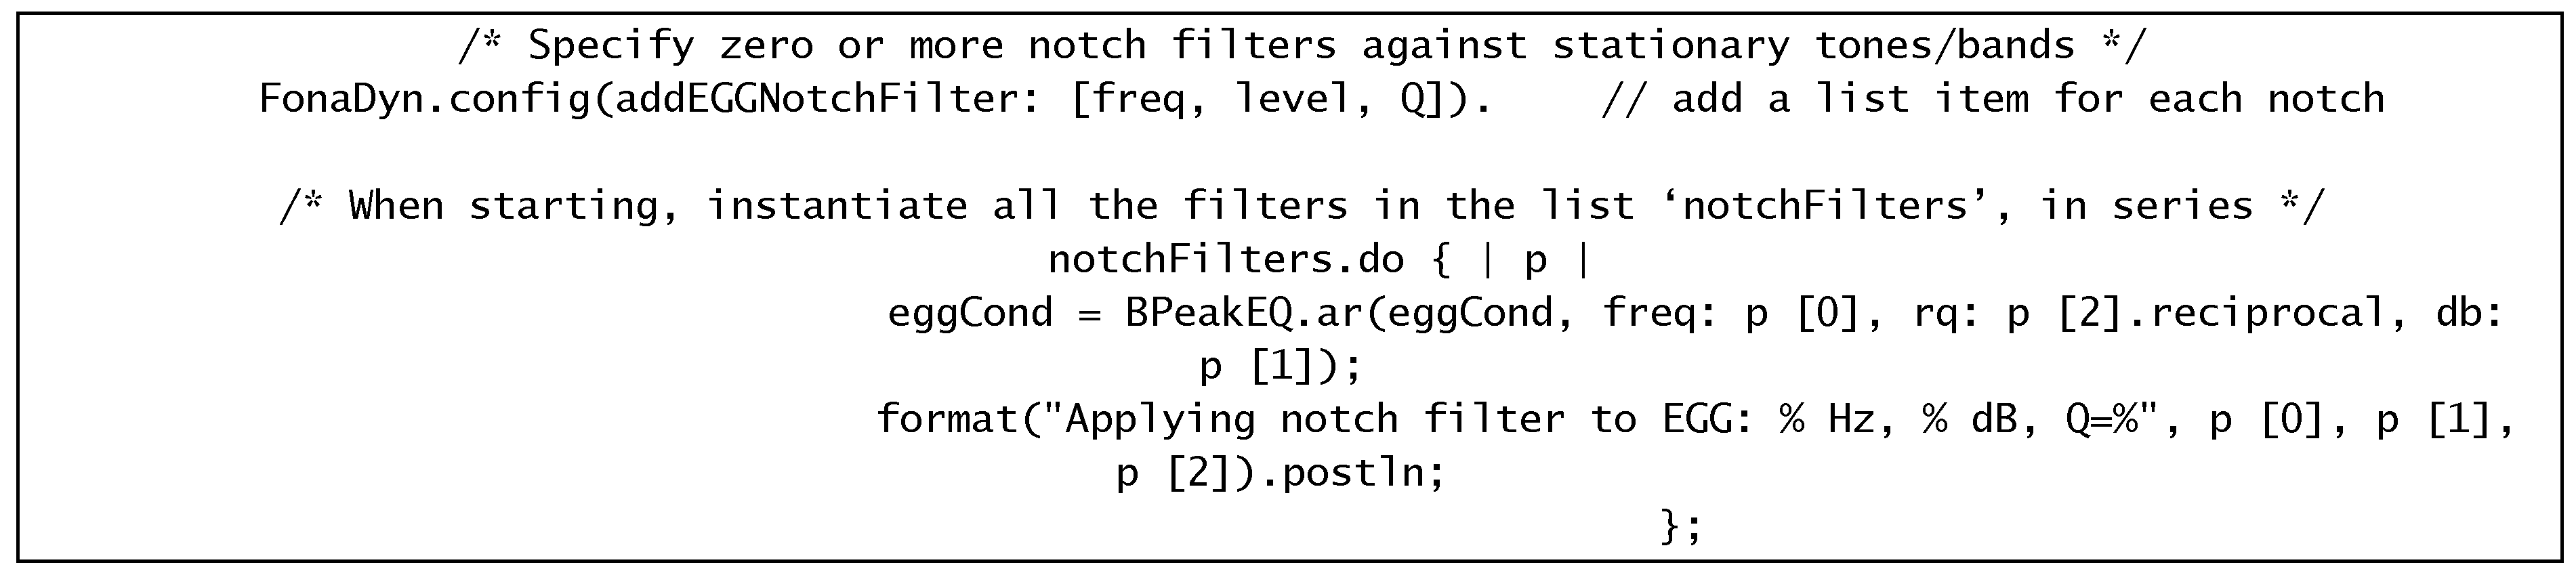
5.2. Optional Notch Filtering
This uses zero or more parametric filters of the class BPeakEQ, for which frequency, gain and Q factor are given in a configuration statement.
5.3. Optional Spectral Thresholding
Using the built-in DSP functions, the SC code for spectral thresholding requires only a few lines. ‘thresh=0’ means no thresholding, thresh > 0 controls the threshold level.
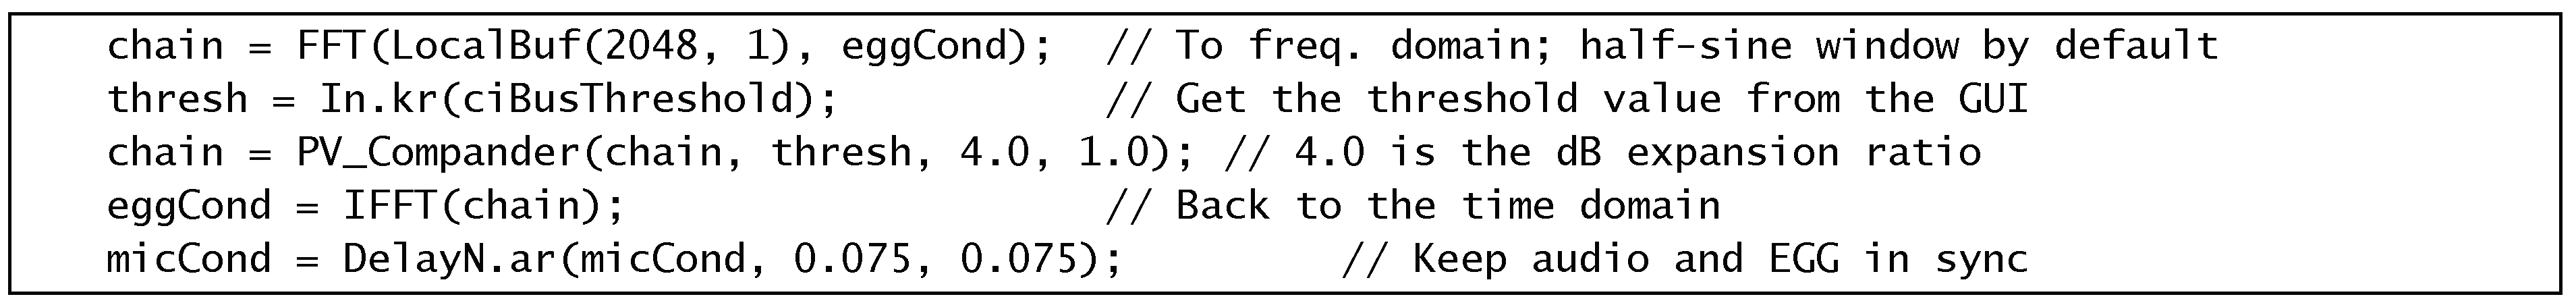
A half-sine window function is used for the FFT, because it gives a somewhat narrower bandwidth than a Hann or Hamming window. In principle, it could be possible to combine all the filtering operations and the spectral thresholding, using a sequence of pre-configured operations on a single frequency-domain buffer, thereby somewhat reducing the computational load and the delays. This optimization remains to be implemented.
FonaDyn 3.1 computes and maps also the HRFegg. It has a robust cycle segmentation, so with a discrete Fourier transform (DFT) directly in the time domain, over exactly each period, up to 20 harmonic magnitudes (and phases) are obtained directly. With this approach, one does not need to search for spectrum peaks, and the HRFegg can be computed cycle-synchronously.
5.4. Results
The most common use case of EGG de-noising is to remove low-level system noise from an otherwise clean recording. Figure 7 is a montage of partial screen-dumps from FonaDyn, with the high-passed signal in (a) and the then de-noised signal in (b). The signal is taken at a moment of soft non-contacting phonation, where the EGG is a very low-amplitude sine wave. The EGG waveform is in the right-hand panels, where the amplitude and the cycle time are both normalized to [0…1]. The contact quotient Qci (red trace) is defined as the area under the normalized pulse, i.e. 0.5 for a sine wave, and the normalized peak dEGG QΔ (yellow trace) is the maximum positive slope which is found at the very edges of the graph. Note how in (b) the yellow curve becomes much clearer and descends to 1. This happens quite abruptly from one cycle to the next when contacting ceases. The inset voice maps of QΔ use a color scale from green for 1 (sine wave) to red for 10 (rapid contacting). Note in (b) also how the bright green region of non-contacting becomes much more distinct. In the companion article [4], this will be used to interpret several other voice metrics.
For examining the result of processing a very noisy recording with phonation, we return to the signal of Figure 2, but in a phonated segment rather than a quiescent one. On the left in Figure 8 are shown the EGG before (a) and after (c) the full anti-noise treatment, and on the right are the corresponding dEGG waveforms.
6. Difficult Cases
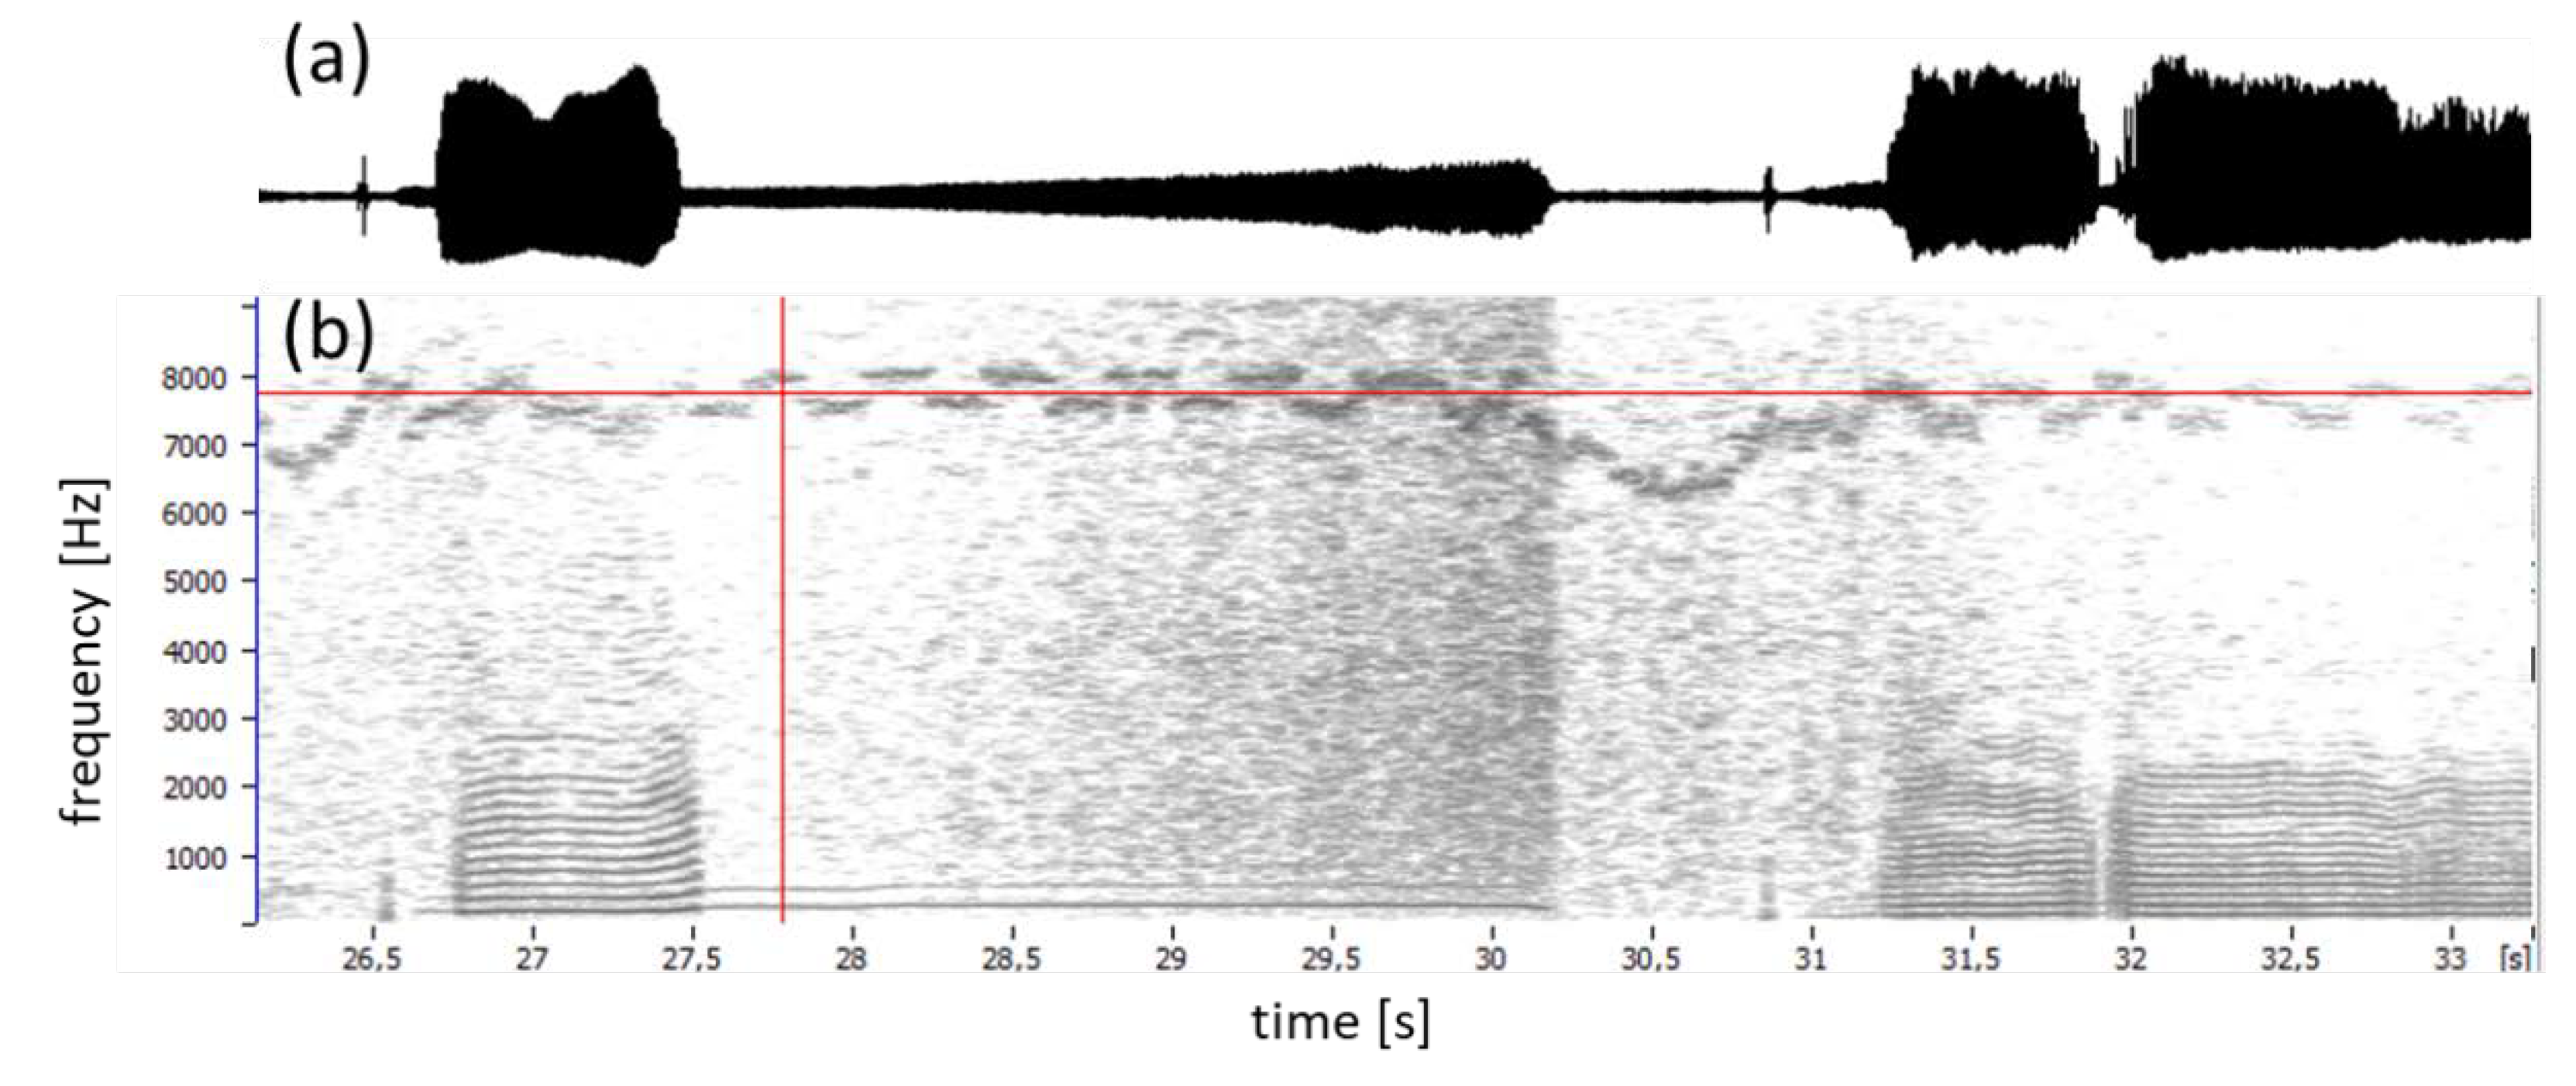
It can happen that side tones are not static, but wander in frequency, which makes it harder to suppress them. Wandering tones are usually easy to hear, and will also stand out in a spectrogram of the EGG signal (Figure 9). We would submit that any EGG hardware with moving interference tones is poorly engineered and should be avoided. In this example, it is also seen that the device in question has an automatic gain control, which is not helpful at all for the spectral thresholding. The threshold would have to adapt to the changing gain.
7. Discussion
The types of EGG signal conditioning detailed here – steep high-pass filtering, spectral thresholding and notch filtering – will all improve both the precision of any subsequent cycle segmentation and of the estimate of metrics of the EGG waveform. In particular, computing the contact quotient Qci as described in [5] needs a really DC-free signal, and computing QΔ as in [5] requires a high SNR. Conversely, Qci is not very sensitive to the SNR, and QΔ is insensitive to the near-DC content.
The fewer the harmonics in the signal, the lower the peak derivative will be. QΔ therefore depends on the number of harmonics within the channel bandwidth, and will tend to decrease with increasing fo . If this dependency is problematic, it can be removed by first constraining the EGG signal to a fixed number of harmonics, whose highest frequency never exceeds the bandwidth of the channel. This issue may require attention for systems that band-limit the signal to 10 kHz or less.
In the spectra given here, the spectrum levels often seem to descend well the quantization noise floor, which at a 16-bit sample depth would be about -96 dB. The reason is that the quantization noise power in each frequency bin is the total quantization noise power divided by the number of frequency bins, which is typically 1024 = 210. Since the digitized signals internally are amply represented by floating-point numbers with at least 32 bits, this adds another 10 × 6 = 60 dB to the potential dynamic range in each frequency bin.
Hum is all too common, so it is annoying that getting rid of it is harder than one would think. As a curiosity, we note that, in principle, a stable electrical hum could be analyzed from non-phonated segments, and resynthesized in counter-phase to the entire recording, so as to remove the hum by cancellation. This would accurately restore the EGG waveform. However, in utility power grids, variations in the total nationwide load will slightly perturb the mains frequency from the nominal 50 or 60 Hz by up to ±0.1 Hz (normal deviations) or ±0.5 Hz (abnormal deviations). The hum frequency would need to be determined very accurately and to remain completely stable over a useful length of time (minutes). Such a cleaning effort would be motivated only for salvaging very important recordings.
8. Summary
- Frequency-domain thresholding with dynamics expansion retains the strongest frequency components in a signal and suppresses everything else.
- It improves the dEGG considerably, which in turn clarifies the onset of VF contacting.
- The EGG waveform essentially retains its shape (unlike with time-domain filtering).
- It works best against white system noise, with a flat spectrum.
- Non-white noises such as hum and spurious side tones are also suppressed, if they are below the threshold. This can be achieved by applying tailored notch filters before the threshold-expand operation.
- A static frequency-domain threshold is often sufficient to make a noisy EGG signal usable.
Funding
This Technical Note received no external funding.
Institutional Review Board Statement
Not applicable.
Informed Consent Statement
Not applicable.
Data Availability Statement
No new data were collected for this Technical Note. Examples were pulled from existing recordings, some of which are not yet analyzed for publication; however, the point is only to demonstrate different kinds of noise in EGG signals, without regard for any informant-specific information.
Acknowledgments
Elias Zea is gratefully acknowledged for suggesting spectral thresholding to reduce noise. Christian Herbst suggested the creation of this article, and kindly supplied the example for Figure 6.
Conflicts of Interest
The author declares no conflicts of interest. Funders had no role in the design of the study; in the collection, analyses, or interpretation of data; in the writing of the manuscript; or in the decision to publish the results.
References
- Herbst, C.T. Electroglottography – An Update. J. Voice 2020, 34, 503–526. [Google Scholar] [CrossRef]
- Baken, R.J. Electroglottography. J. Voice 1992, 6, 98–110. [Google Scholar] [CrossRef]
- Titze, I.R. Interpretation of the Electroglottographic Signal. J. Voice 1990, 4, 1–9. [Google Scholar] [CrossRef]
- Ternström, S. Feature maps of the effects of vocal fold contacting. Bioengineering.
- Ternström, S. Normalized Time-Domain Parameters for Electroglottographic Waveforms. J. Acoust. Soc. Am. 2019, 146, EL65–EL70. [Google Scholar] [CrossRef] [PubMed]
- Childers, D.G.; Lee, C.K. Vocal Quality Factors: Analysis, Synthesis, and Perception. J. Acoust. Soc. Am. 1991, 90, 2394–2410. [Google Scholar] [CrossRef] [PubMed]
- Ternström, S.; Pabon, P. Voice Maps as a Tool for Understanding and Dealing with Variability in the Voice. Appl. Sci. 2022, 12, 11353. [Google Scholar] [CrossRef]
- Ternström, S. Update 3.1 to FonaDyn — a System for Real-Time Analysis of the Electroglottogram, over the Voice Range. SoftwareX 2024, 26, 101653. [Google Scholar] [CrossRef]
- SuperCollider website: http://supercollider.github.io/.
Figure 1.
Views of a brief high-pitched syllable /a/. Left: (a) the acoustic voice signal, (b) the ‘raw’ EGG with near-DC fluctuations remaining after a mild analog high-pass filter in the device, (c) the scaled-up EGG after steep digital high-pass filtering. Right: expanded views of the shaded portions: (d) voice, and (e) high-pass filtered EGG. Note in (e) how the EGG quickly becomes sinusoidal when the brief contacting in every cycle ceases, while there is no corresponding abrupt change in the acoustic signal (d). The horizontal axis is time in seconds, the vertical scale is amplitude relative to full scale.
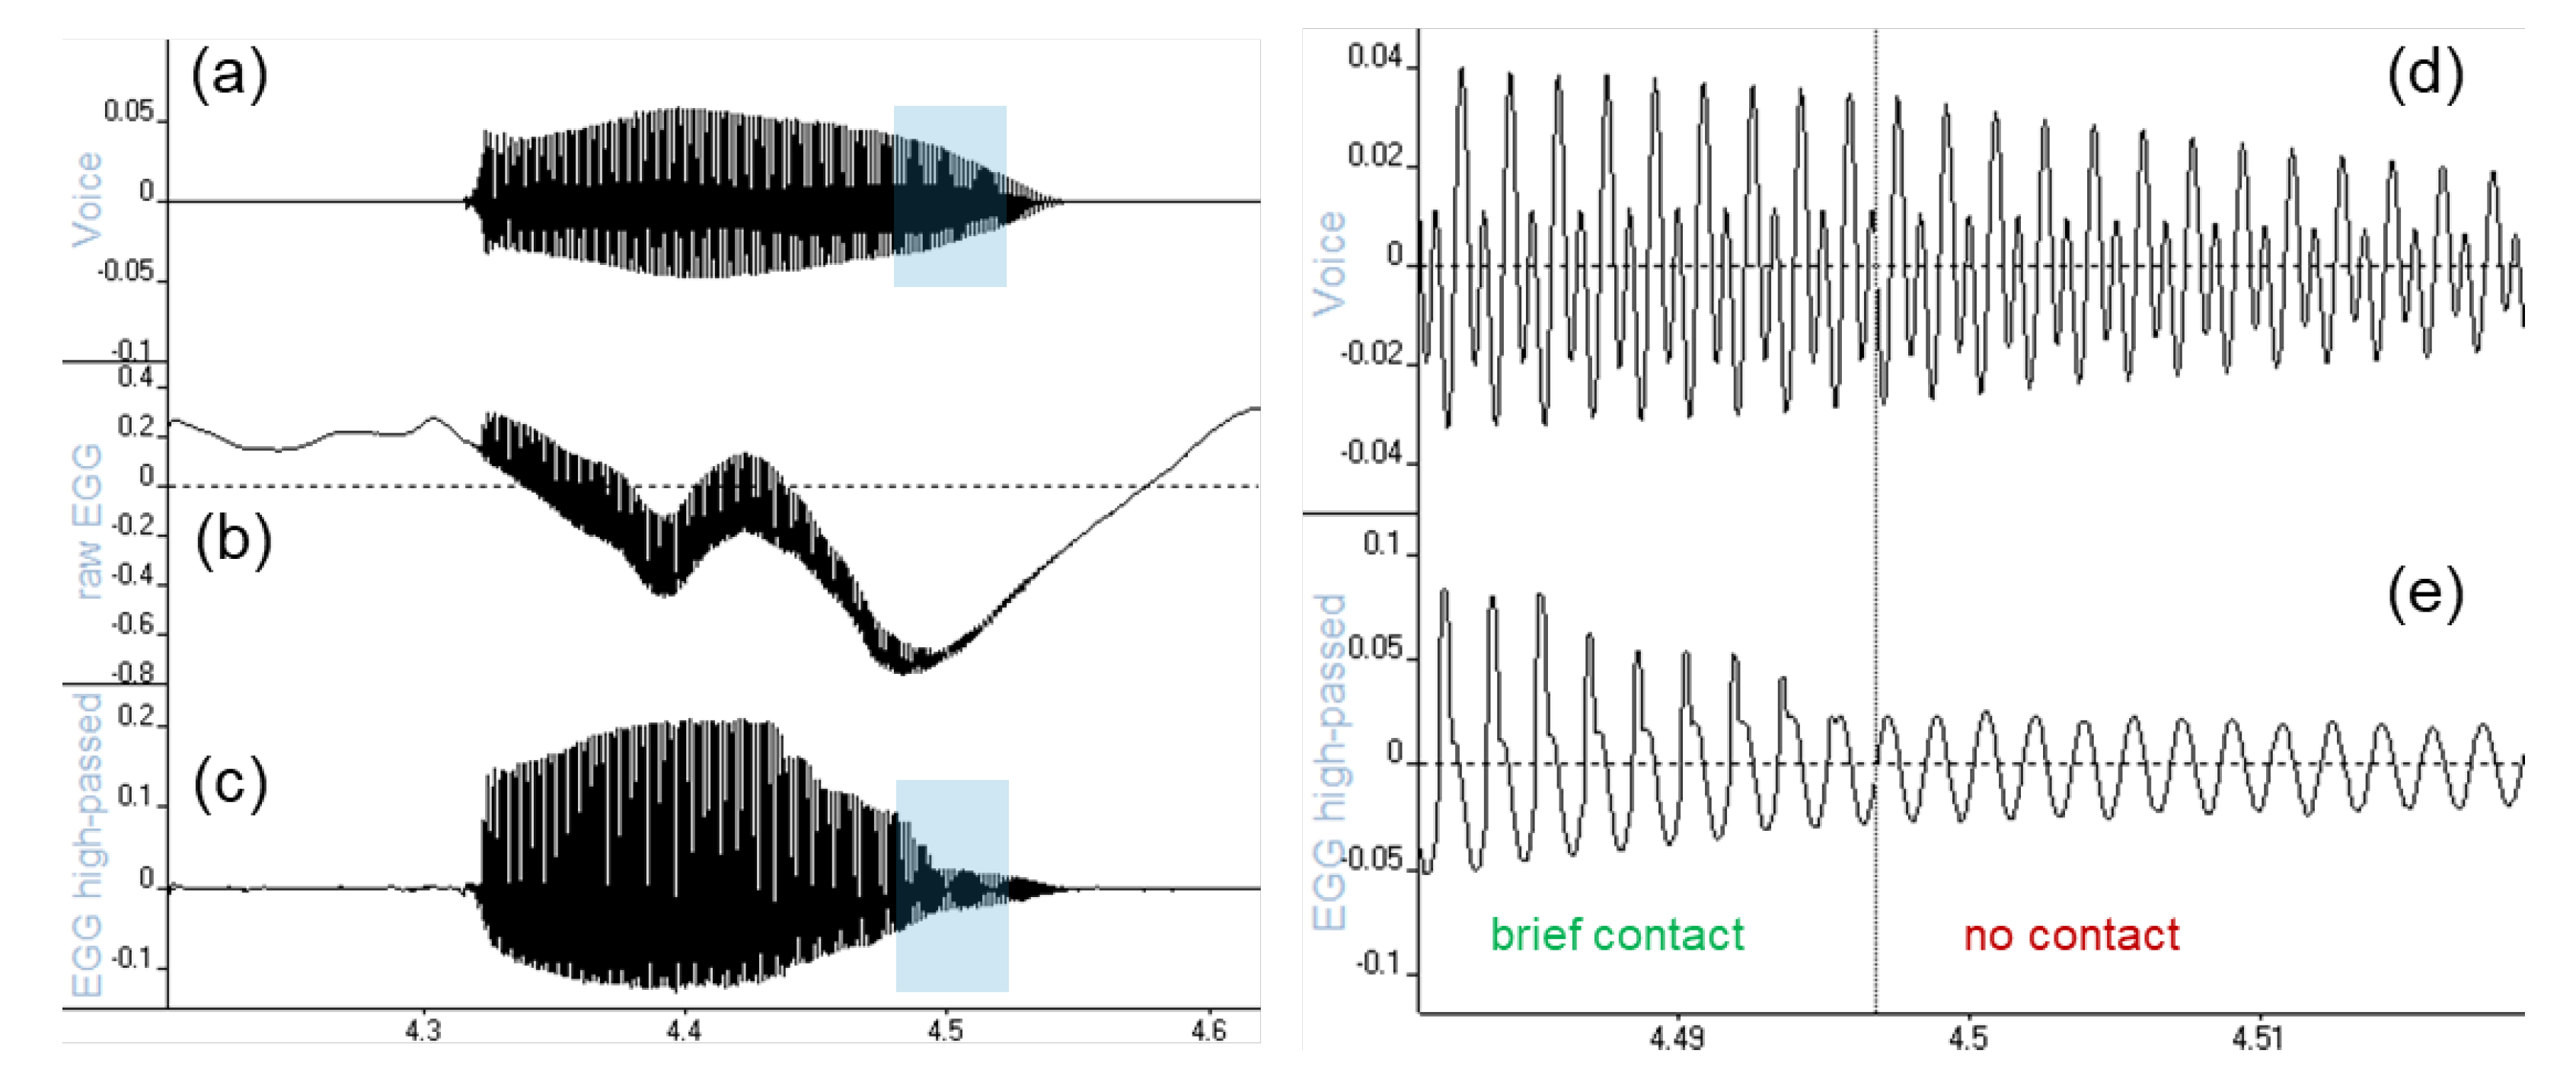
Figure 2.
Narrow band LTAS of an EGG signal during a pause in phonation, i.e. of only background noises. Blue line: original ‘raw’ signal; orange line: after digital high-pass filtering with a 1024 point, high-pass linear phase FIR filter (dashed grey line), to suppress near-DC content, and after three notch filters, manually added, at 2850, 3520 and 6080 Hz.
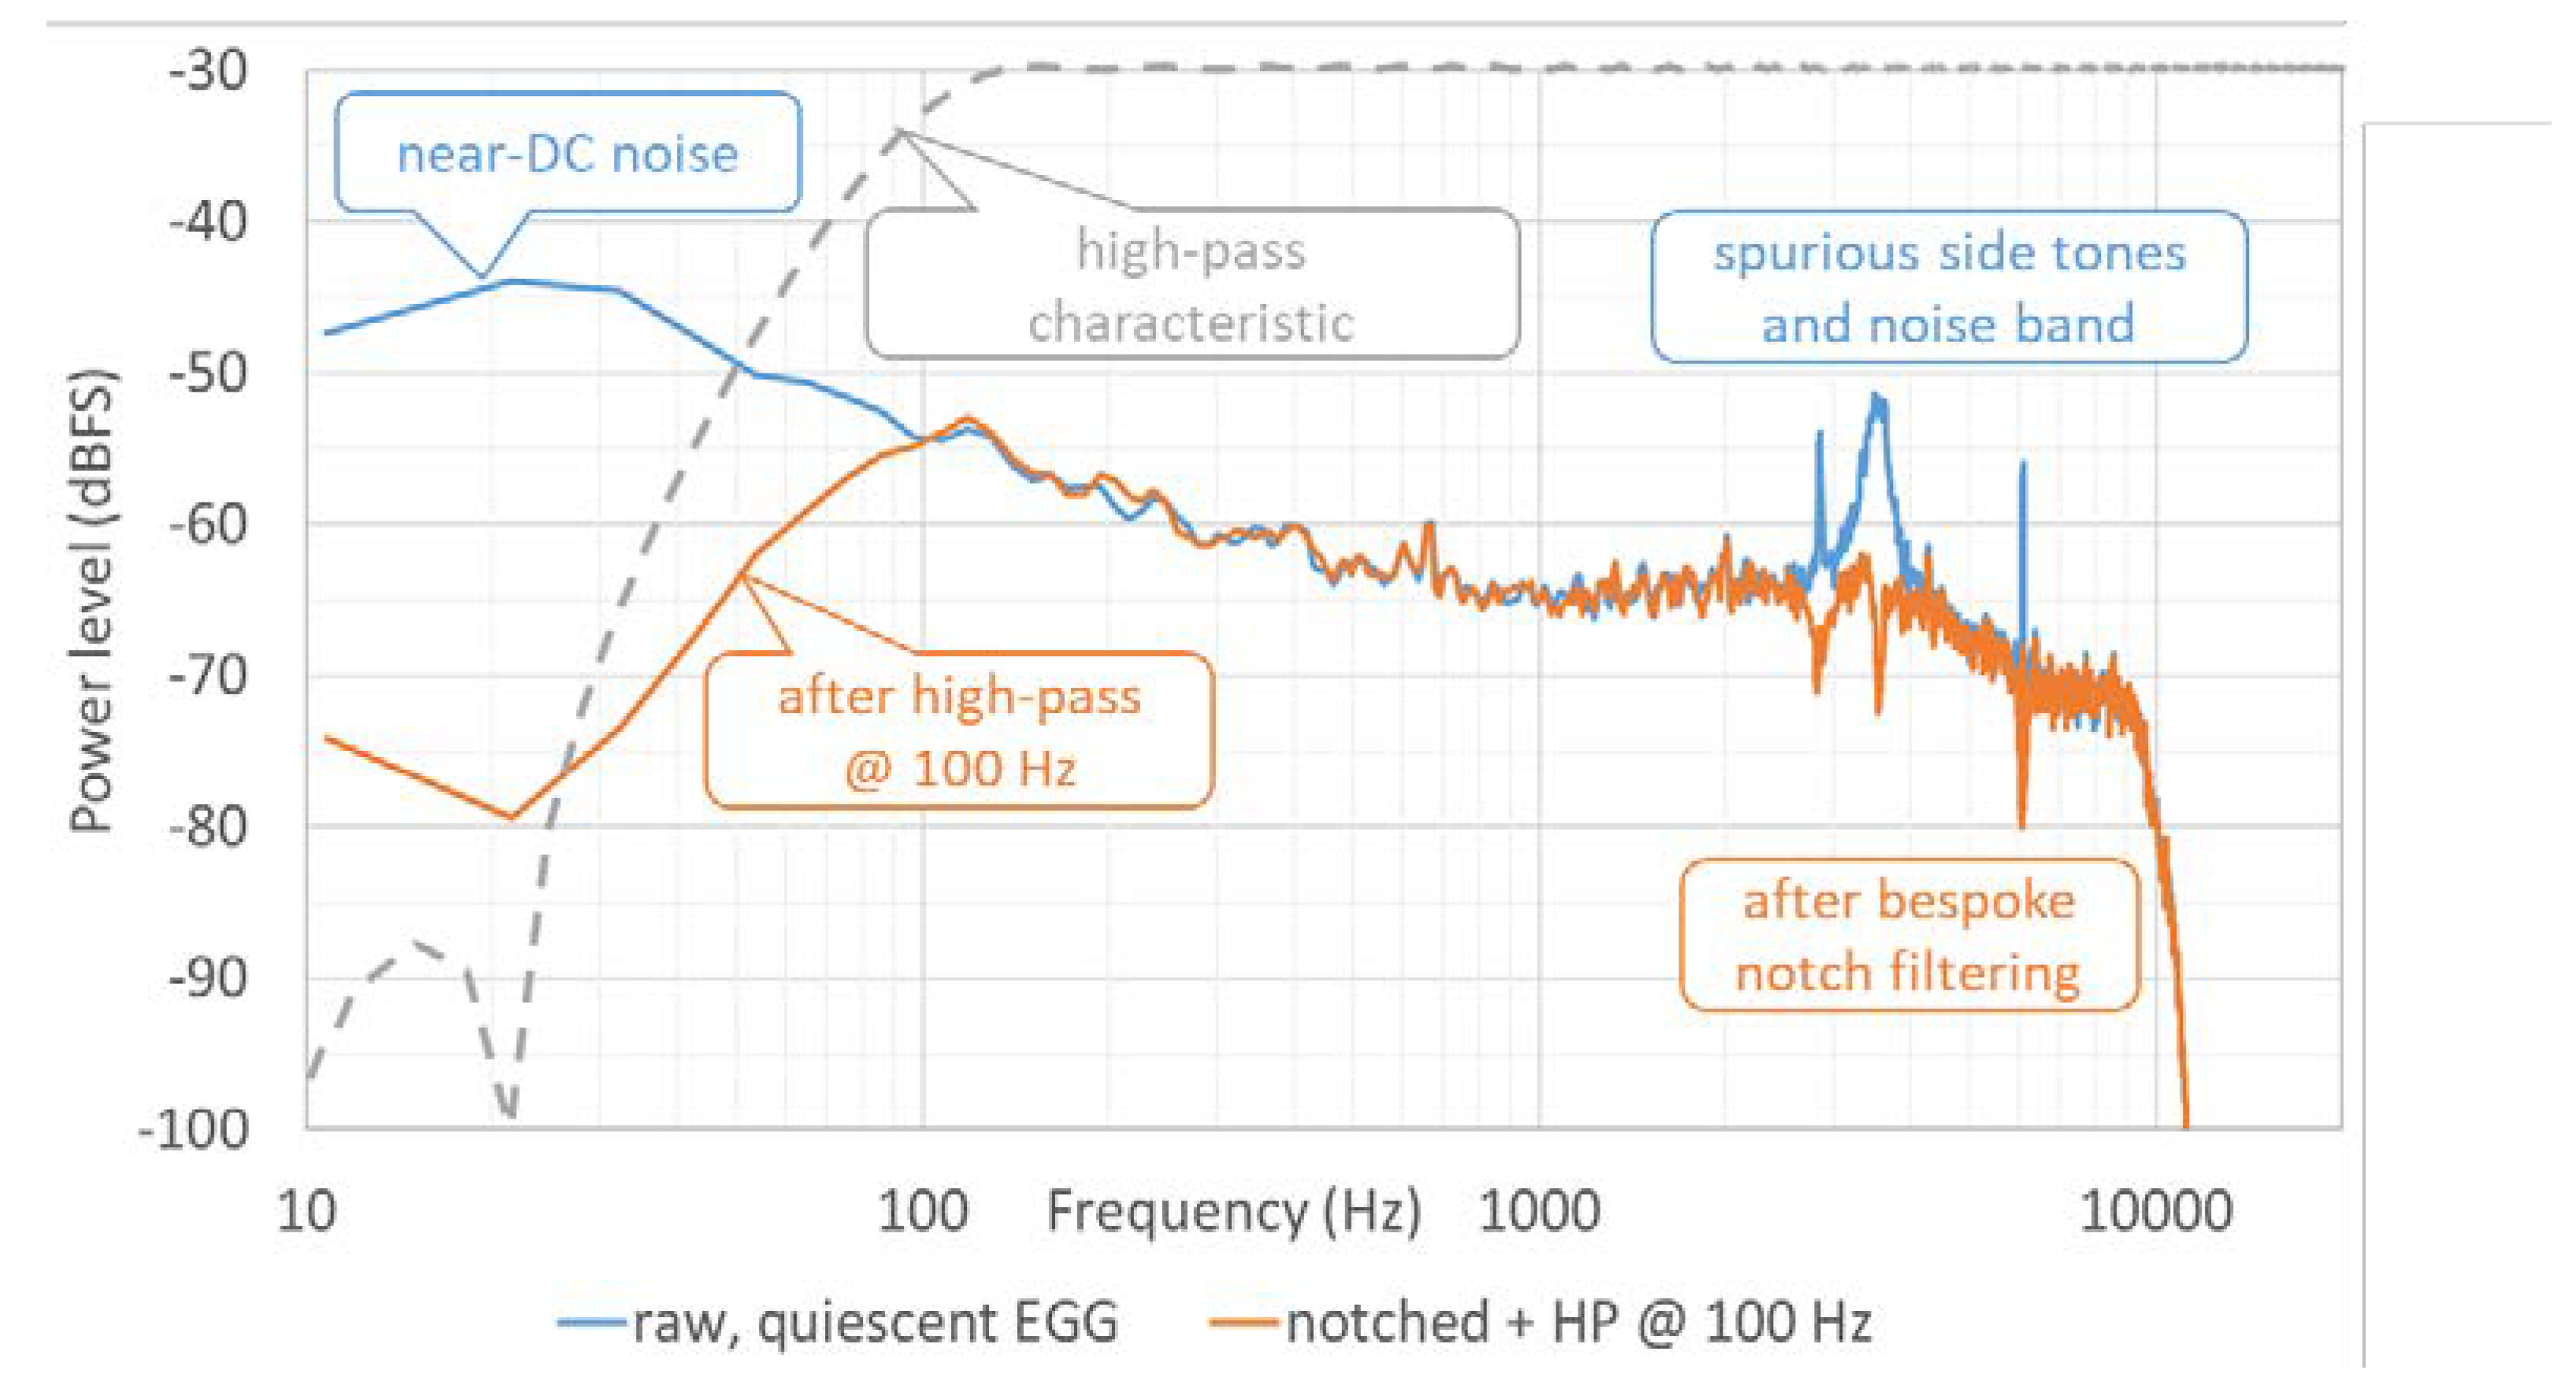
Figure 3.
Black line: LTAS of an example quiescent segment (no phonation); gray line: of a segment with phonation. The harmonics of the hum can be strong enough to distort the waveform of the EGG. Here, we see also stray frequencies at around 1300 and 3500 Hz.
Figure 3.
Black line: LTAS of an example quiescent segment (no phonation); gray line: of a segment with phonation. The harmonics of the hum can be strong enough to distort the waveform of the EGG. Here, we see also stray frequencies at around 1300 and 3500 Hz.
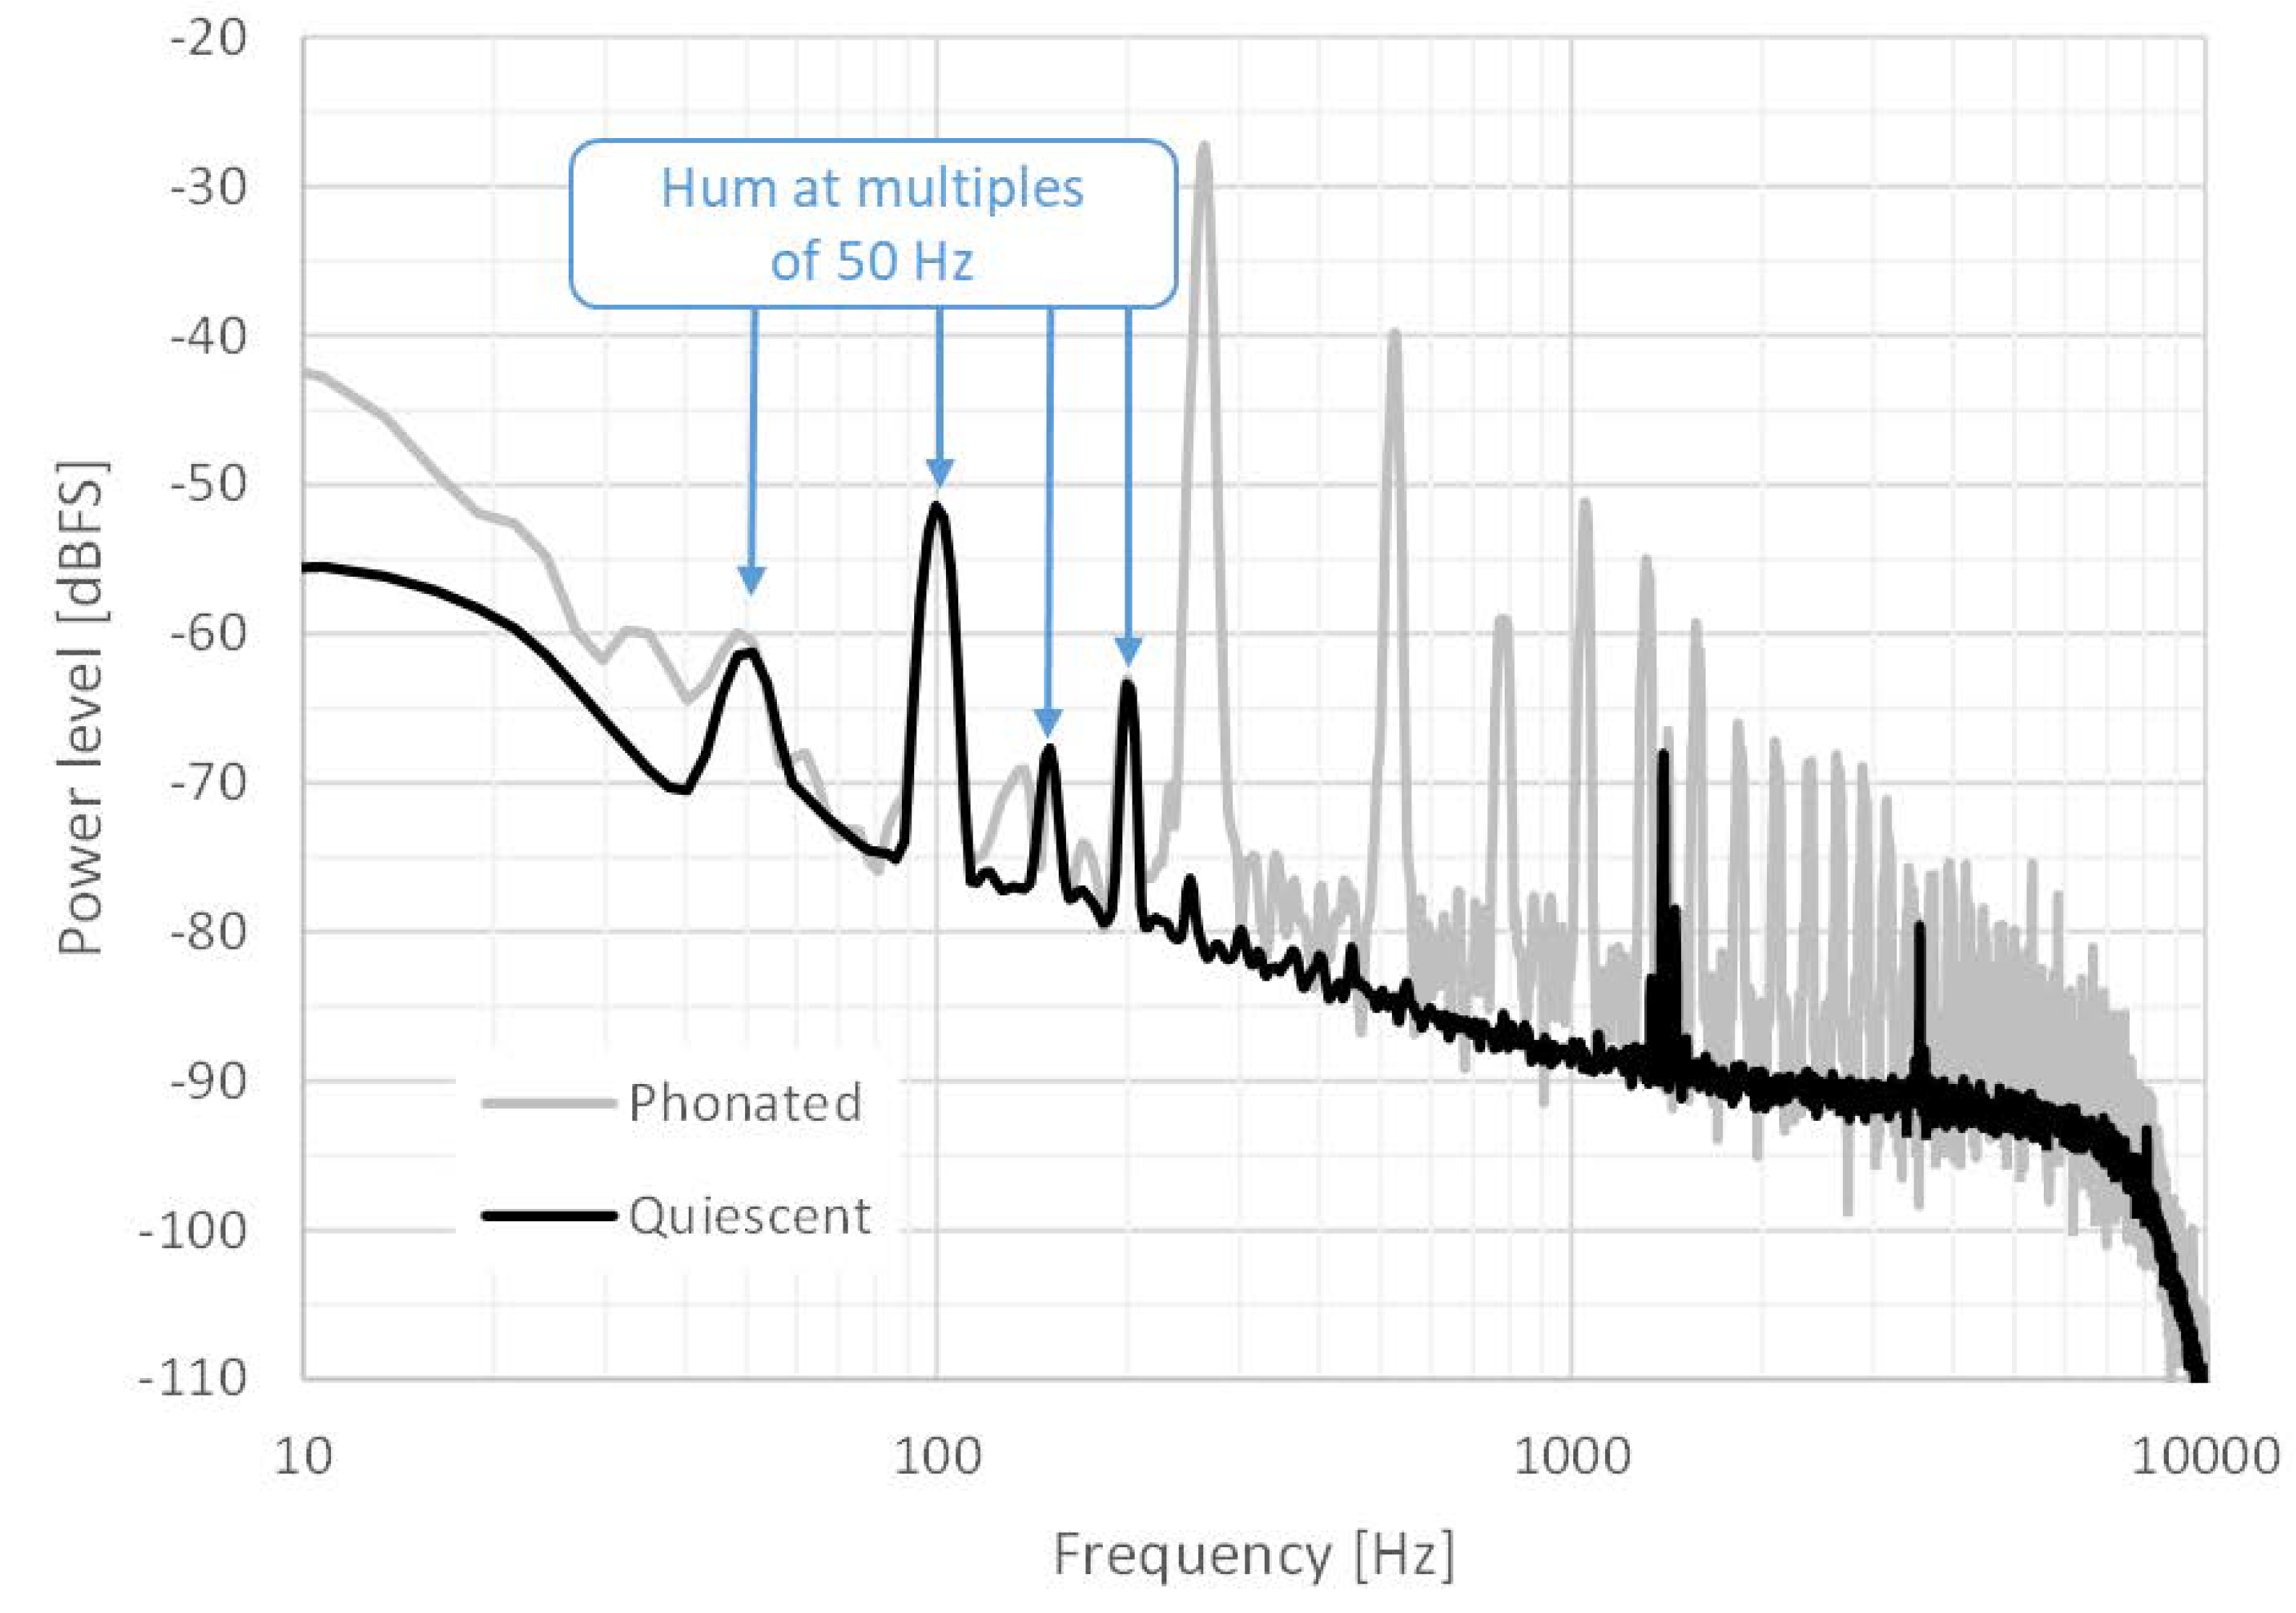
Figure 4.
The effect of thresholding on the spectrum: (a) spectra of the EGG signal in strong and minimal phonation, and the system noise floor without phonation. (b) A level threshold is applied at -80 dBFS (dB relative to full scale), and levels below threshold are expanded downwards. Note how harmonics above the threshold are unchanged, essentially preserving the EGG waveform in the time domain, while noise above 1 kHz is considerably attenuated, by 20-35 dB between harmonics. .
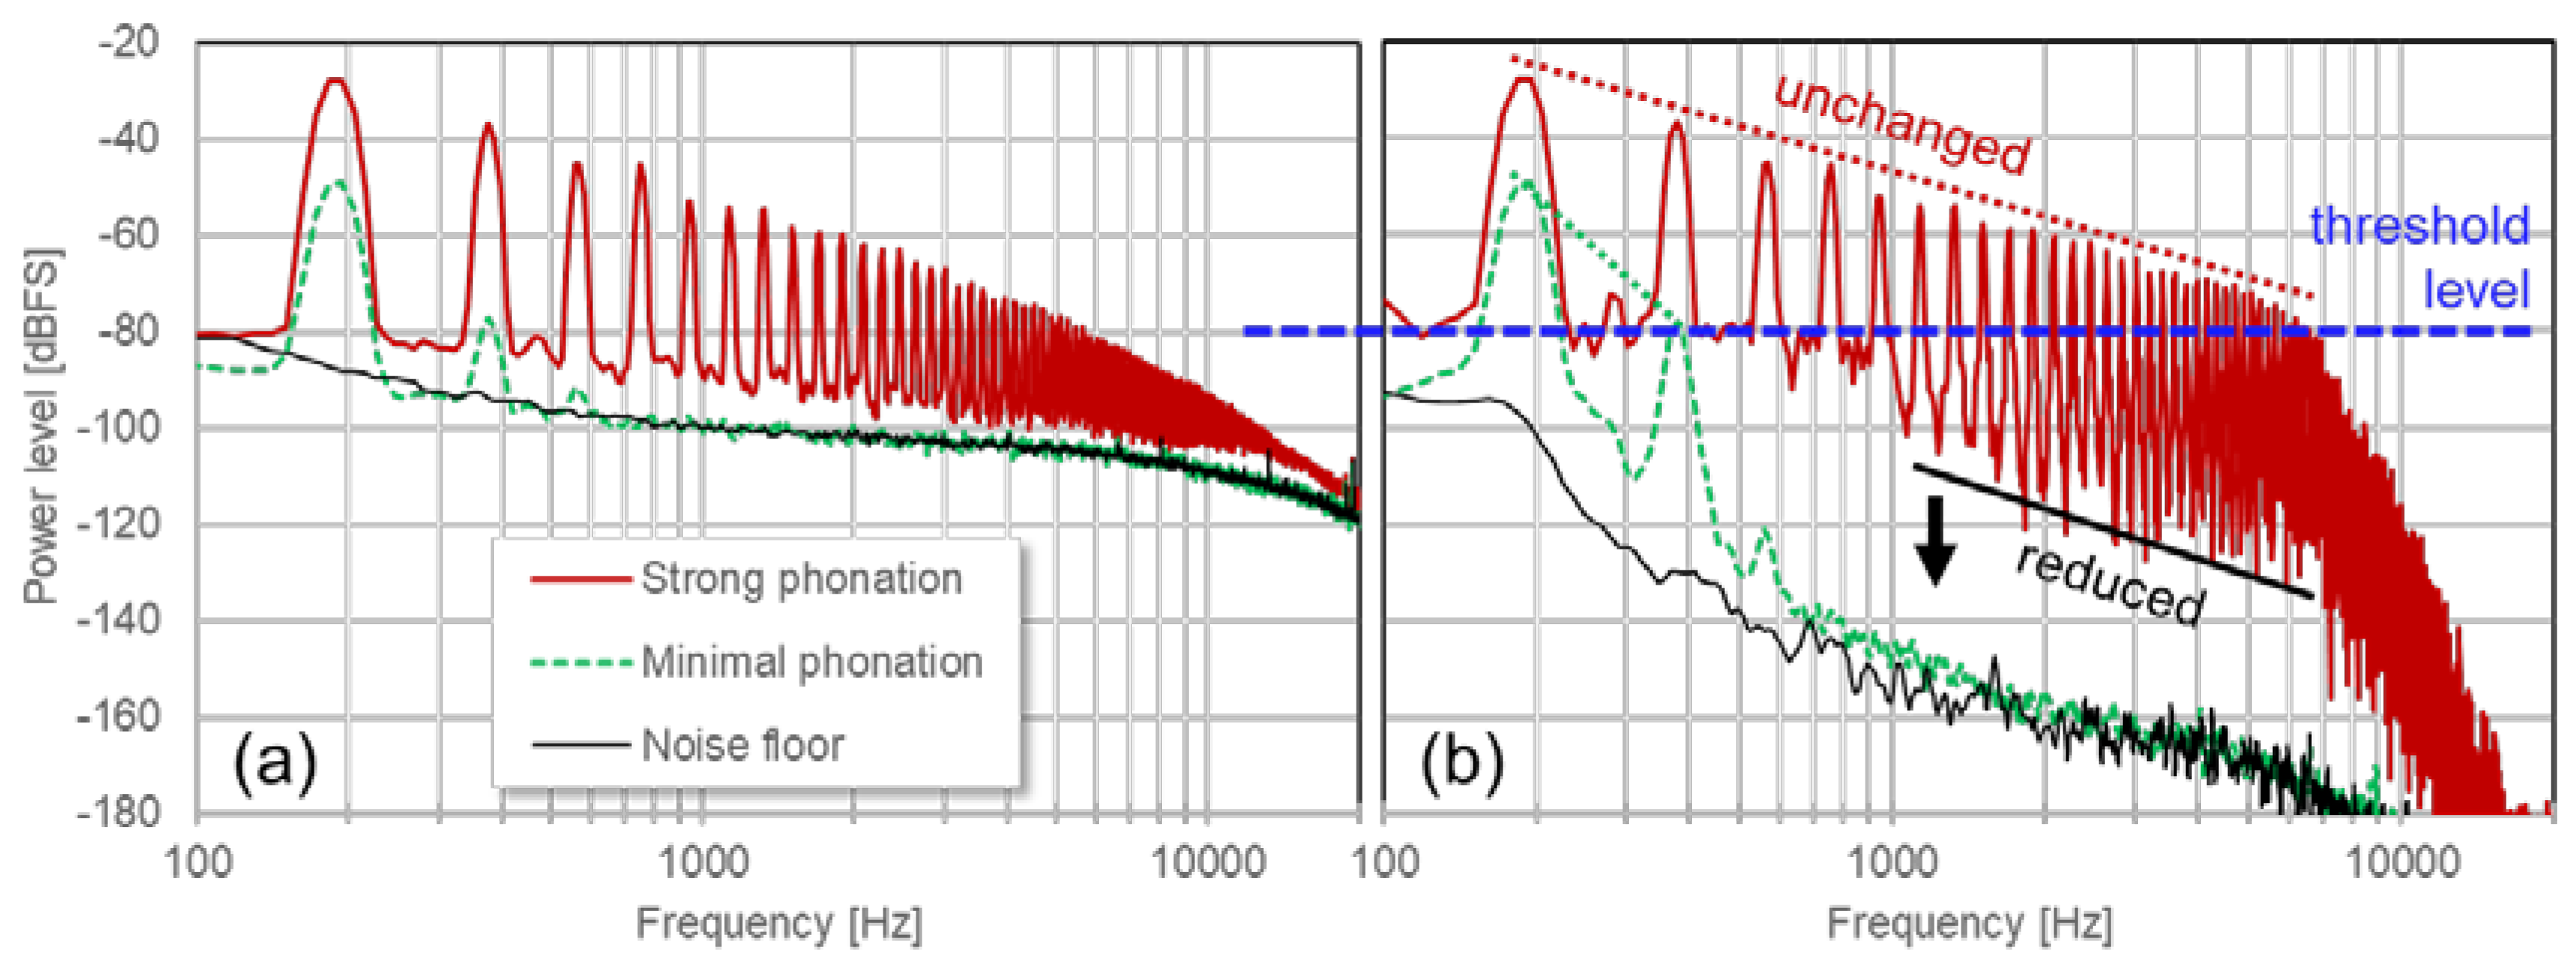
Figure 5.
Spectrograms of a swept sawtooth signal (a) plus white noise (b), to illustrate the difference between low-pass filtering (c) and spectral thresholding (d).
Figure 5.
Spectrograms of a swept sawtooth signal (a) plus white noise (b), to illustrate the difference between low-pass filtering (c) and spectral thresholding (d).
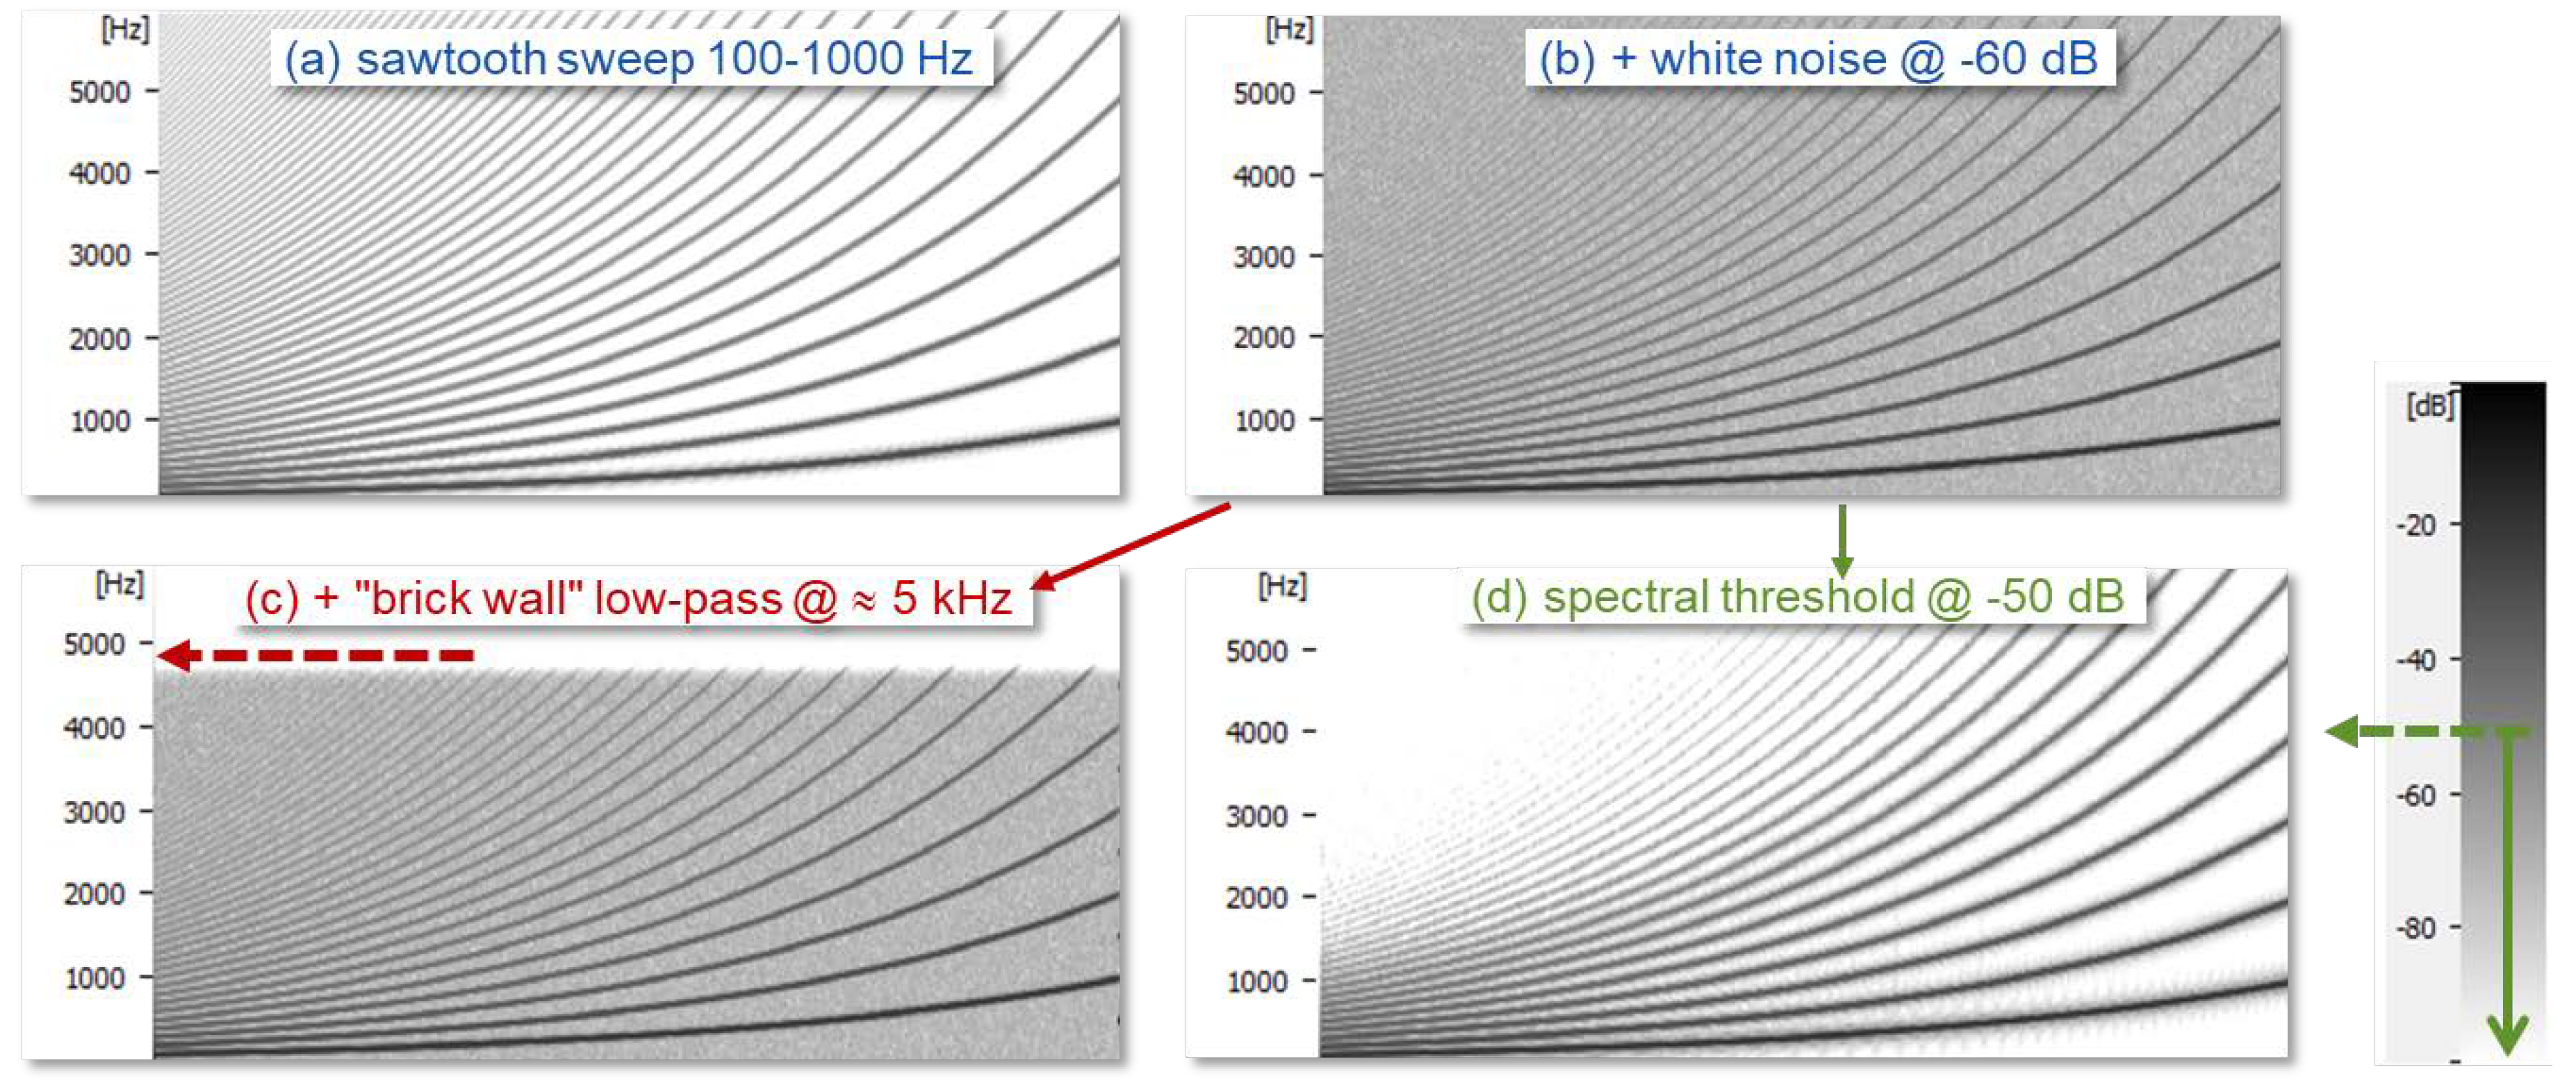
Figure 6.
A quiescent portion of an EGG signal, to illustrate noise phenomena. (a) low-level 50 Hz hum at high magnification, with two noise bursts per cycle; (b) the corresponding spectrogram, with +6 dB/octave pre-emphasis, as if taking the derivative—note the band of noise at about 18 kHz, which can be removed with a low-pass filter; (c) spectrum section showing the harmonic components of this hum, the noise peak at 18 kHz and another around 5 kHz.
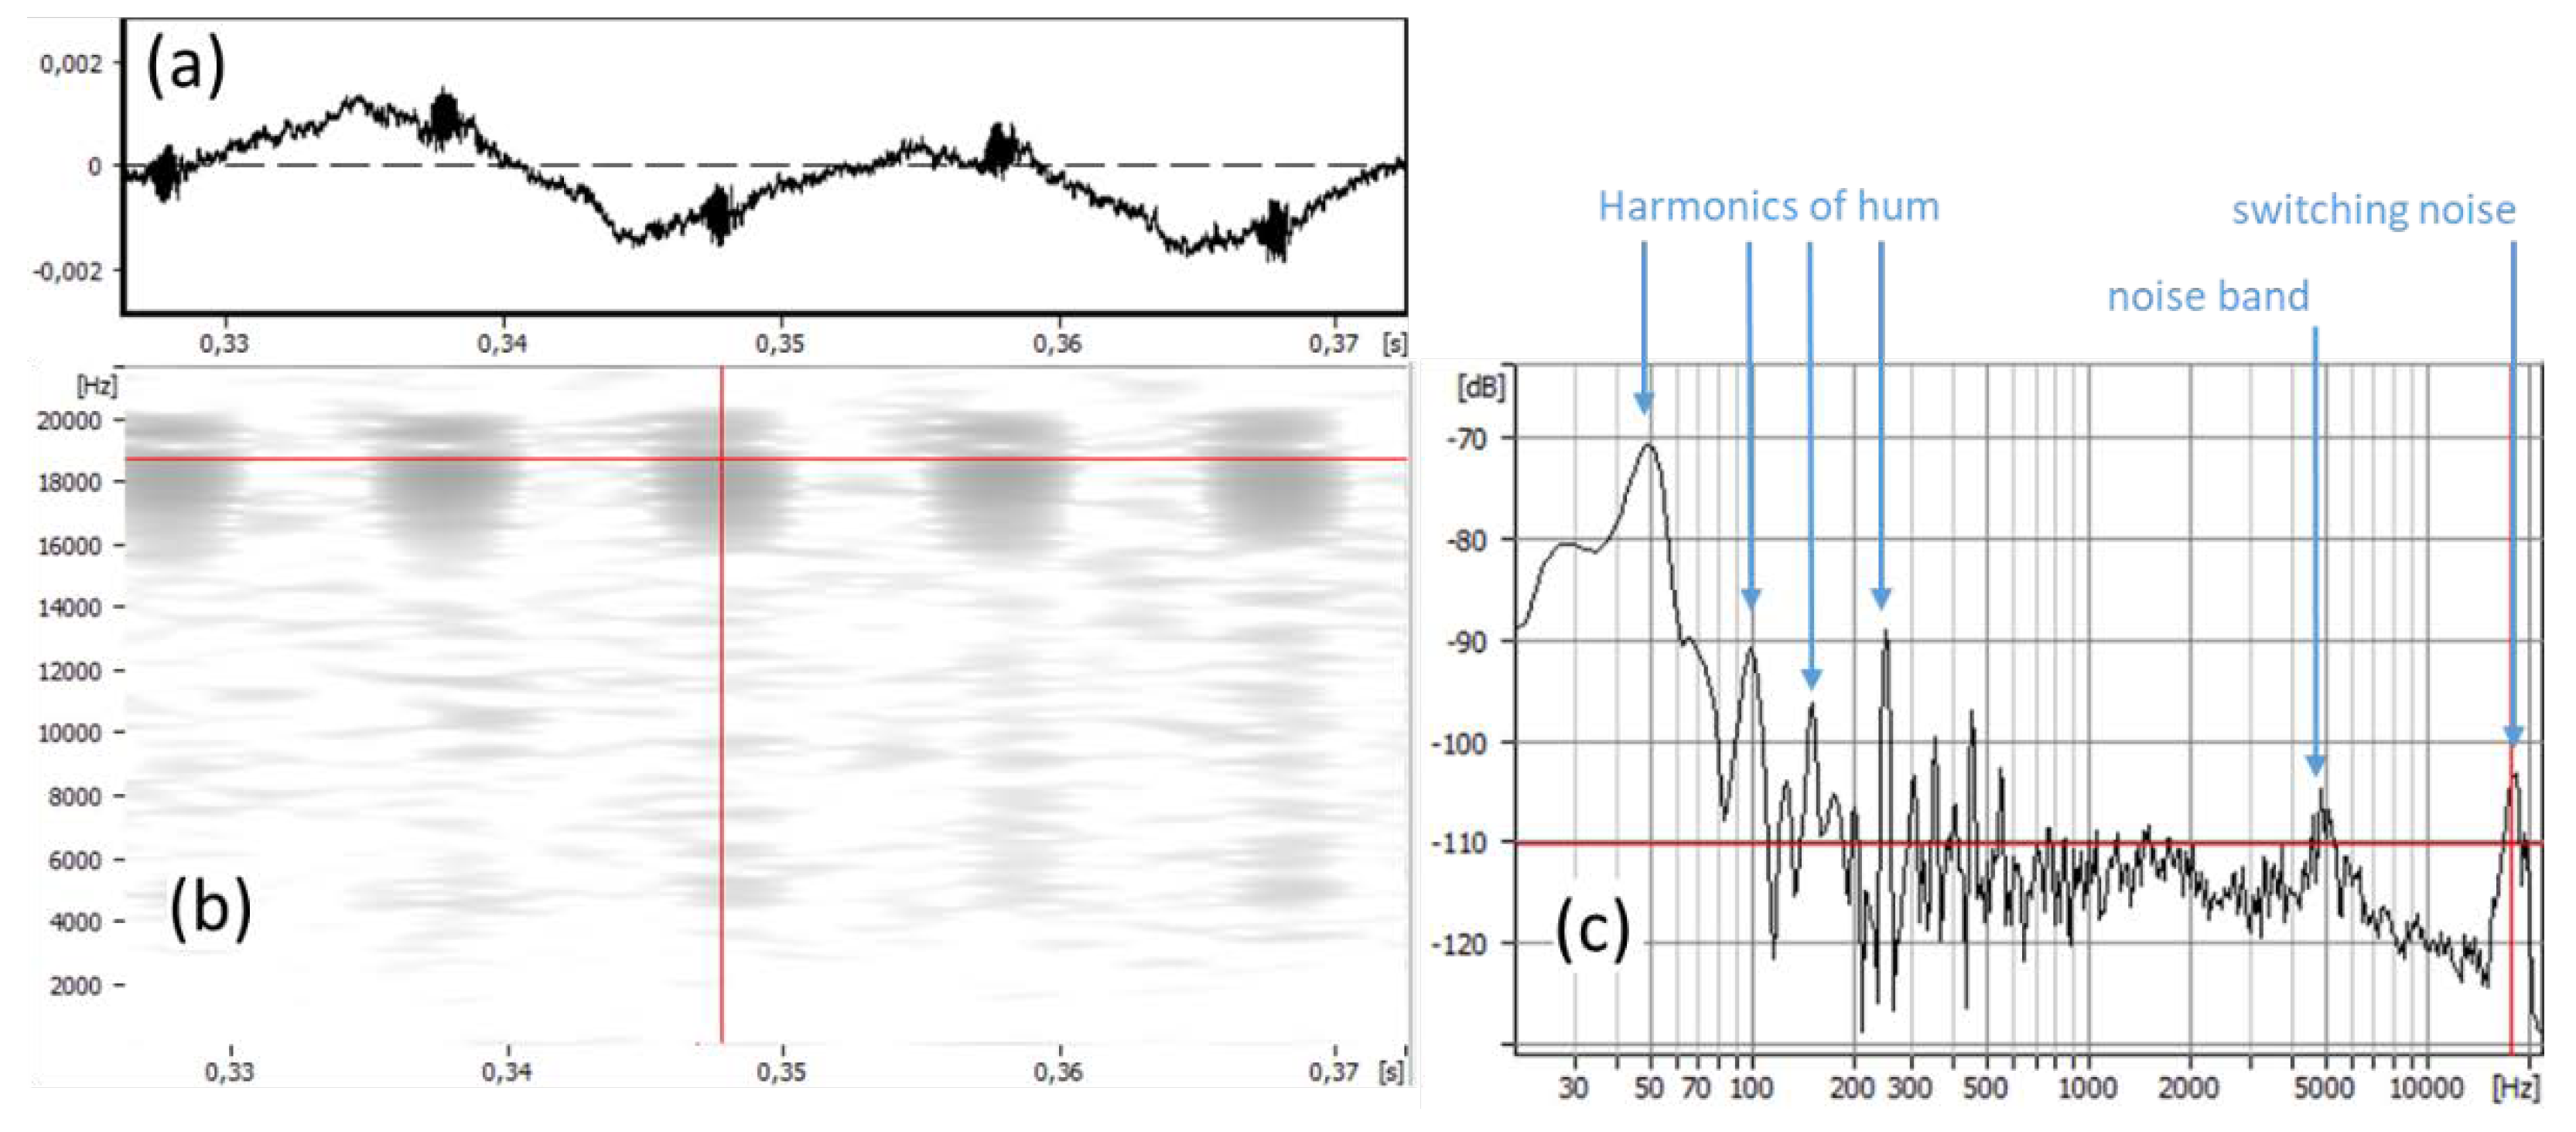
Figure 7.
(a) Appearance of an EGG signal in soft phonation, without any de-noising. Each fleck in the curves represents values from one phonatory cycle; (b) appearance of the same EGG signal as in the previous figure, but with appropriate de-noising. Note how QΔ of the de-noised signal is lower and less erratic overall, and how it descends properly to 1 when there is no vocal fold contact. Insets: voice maps of QΔ of an amateur male singer doing crescendo-decrescendo on notes of a scale. Each ‘pixel’ in the maps is one semitone wide and one decibel high. Illustration from the FonaDyn Handbook [8], with permission.
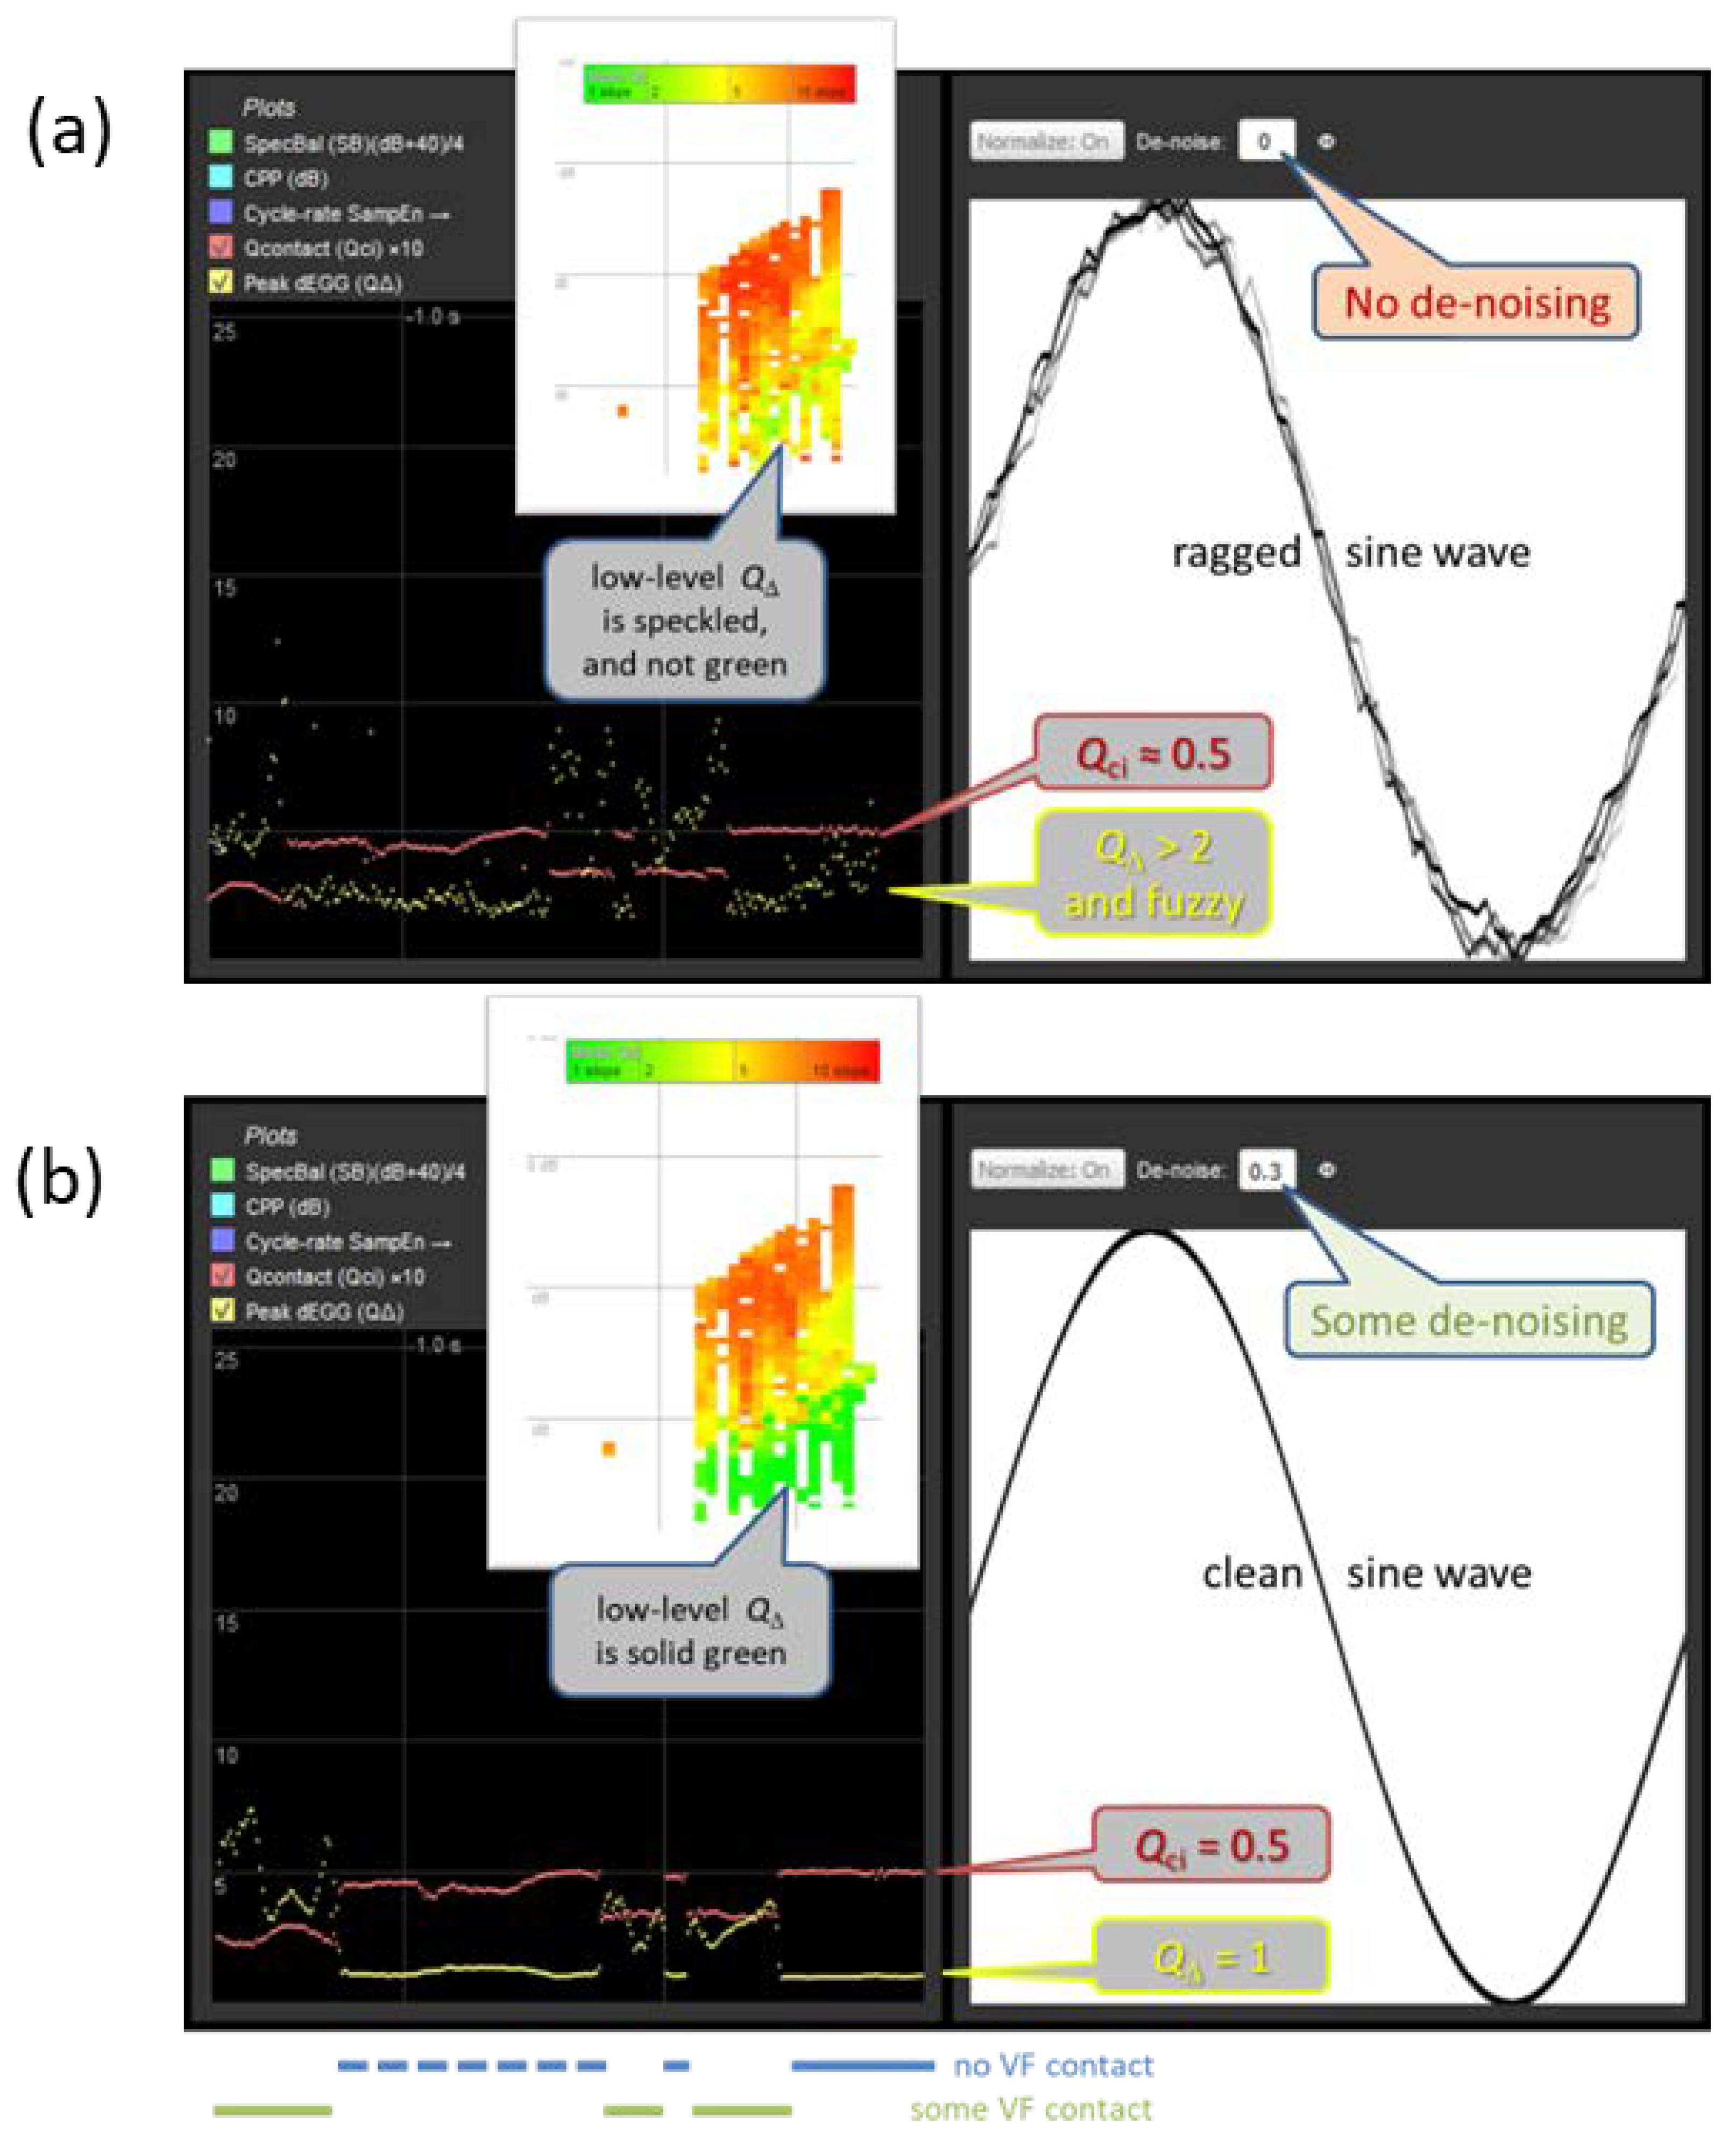
Figure 8.
EGG waveforms (left) and the corresponding dEGG waveforms (right) before (top) and after (bottom) de-noising using notch filtering and spectral thresholding. This is a recording that would hardly be usable without the de-noising. Note in (d) how the dEGG peak amplitude is quite constant and lower than in the noise (b) (change of y scale); and the negative dEGG peaks are clearer.
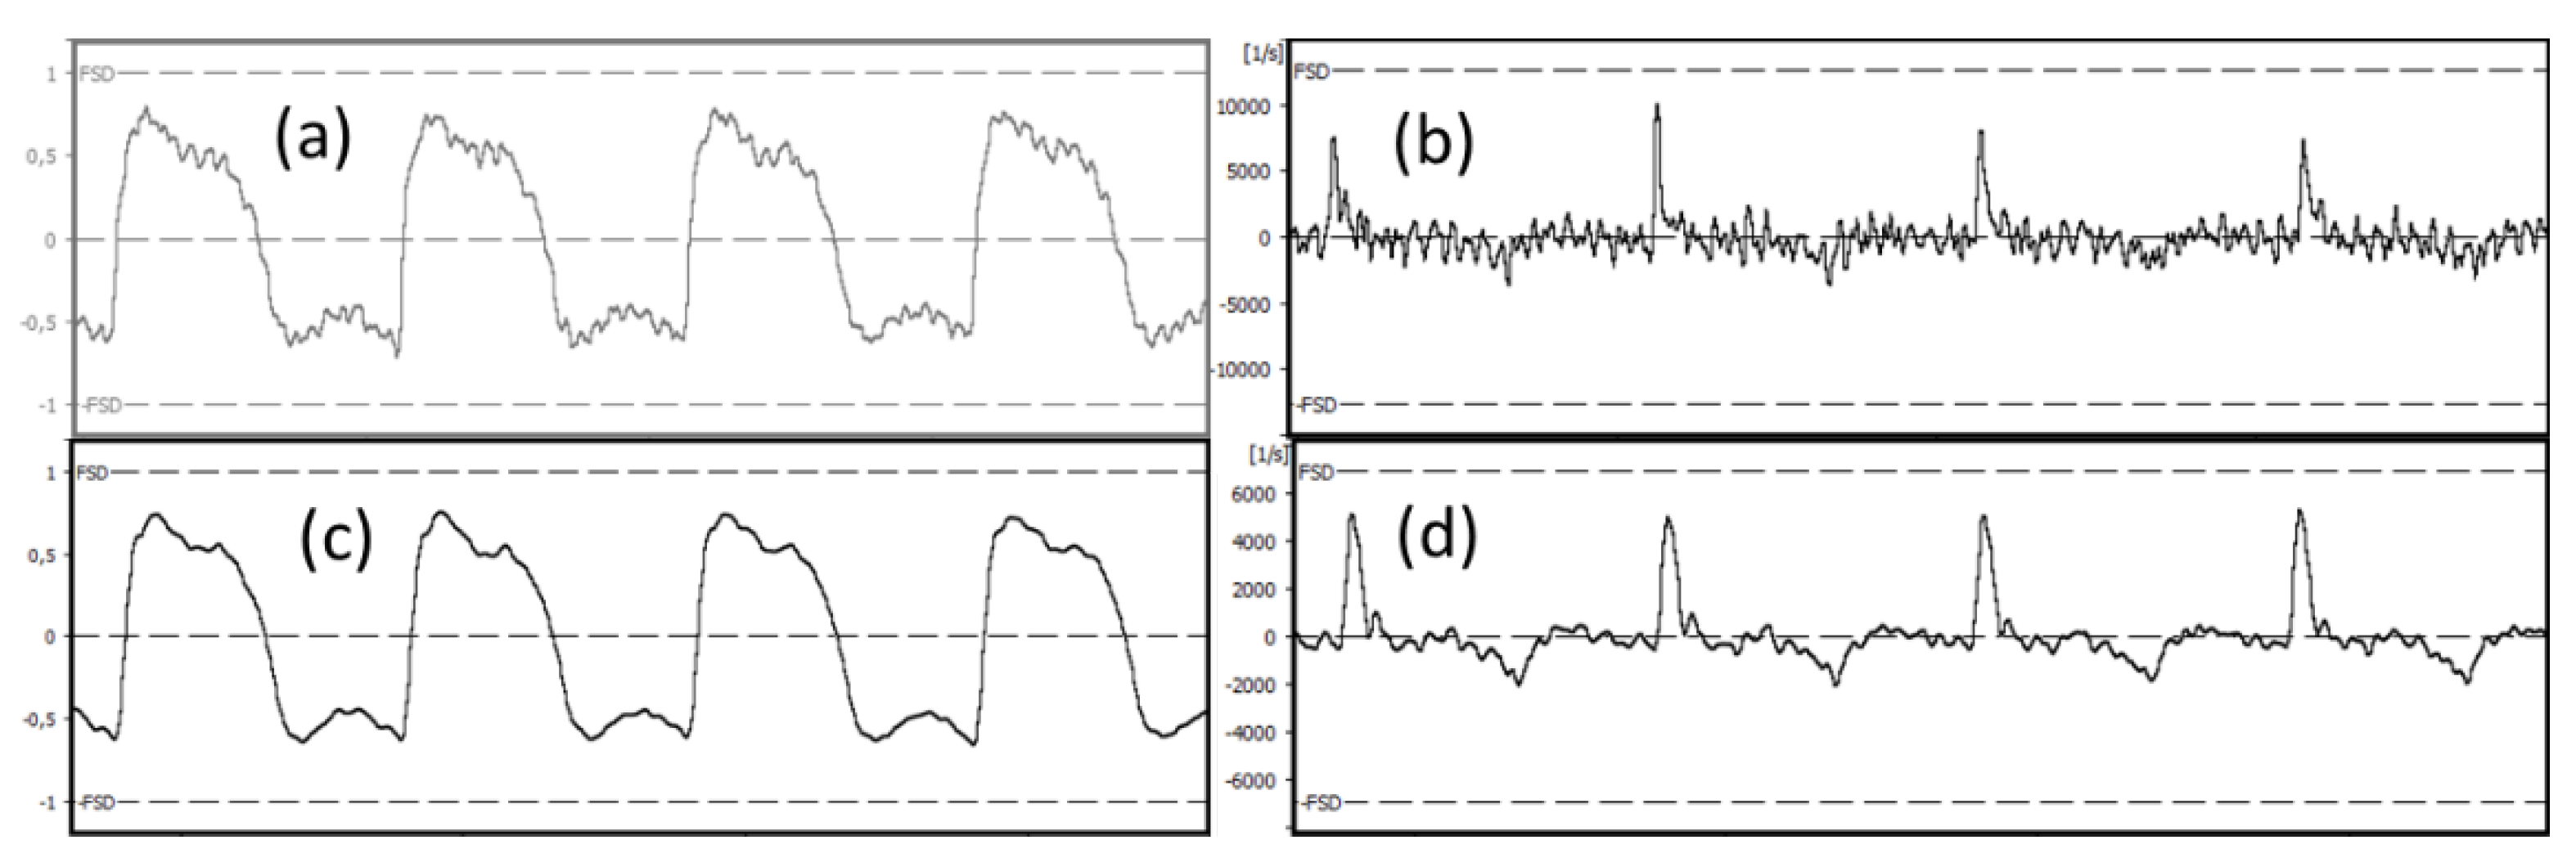
Figure 9.
(a) EGG envelope and (b) spectrogram from an EGG device with automatic gain control, as can be seen operating in the interval 28-30 seconds. This makes the use of a stationary spectral threshold impossible. Also, there is in the 6-8 kHz region a wandering side tone that cannot be negotiated with a static notch filter.
Disclaimer/Publisher’s Note: The statements, opinions and data contained in all publications are solely those of the individual author(s) and contributor(s) and not of MDPI and/or the editor(s). MDPI and/or the editor(s) disclaim responsibility for any injury to people or property resulting from any ideas, methods, instructions or products referred to in the content. |
© 2024 by the authors. Licensee MDPI, Basel, Switzerland. This article is an open access article distributed under the terms and conditions of the Creative Commons Attribution (CC BY) license (http://creativecommons.org/licenses/by/4.0/).
Copyright: This open access article is published under a Creative Commons CC BY 4.0 license, which permit the free download, distribution, and reuse, provided that the author and preprint are cited in any reuse.


