
Submitted:
26 March 2024
Posted:
27 March 2024
You are already at the latest version
Abstract
Electrochemical methods are used for the treatment of both municipal and industrial wastewater, either independently or in conjunction with biological methods. This conjunction is used for pretreatment or posttreatment of biologically treated wastewater. In our work, we focused on the combination of these processes, where pre-electrolysis was used to produce dissolved iron before the activation process. Electrolysis was also directly introduced into the activation using either iron or carbon electrodes. The surface of one iron electrode was 32.2 cm2, the applied voltage was 21 V, and the supplied current was 270 mA. The surface of one carbon electrode was 7.54 cm2, the supplied current was 82.5 mA, and the applied voltage was 21 V. From laboratory research on the treatment of synthetic municipal wastewater using a combination of electrolysis and activation processes, it resulted that the use of iron electrodes increased the efficiency of phosphorus removal compared to its precipitation with iron salts. The electrolysis had a positive effect on the sedimentation properties of sludge and the destruction of filamentous microorganisms. Electrolysis negatively affected the respiration rates of activated sludge and the efficiency of denitrification. However, it did not have a negative impact on the nitrification activity of the sludge.
Keywords:
activated sludge process
; denitrification
; electrolysis
; nitrification
; sludge volume index (SVI)
1. Introduction
Electrochemical methods for water treatment have been used since the late 19th century. Their application is wide-ranging, from electrocoagulation, through electroflotation, electrooxidation, and electroreduction to electrodialysis [1,2]. These methods have been successfully employed for both independent treatment and pretreatment of industrial and municipal wastewater. Electrocoagulation is a frequently used method for wastewater treatment. Studies [3,4,5] have addressed the treatment of domestic or municipal wastewater using electrocoagulation, achieving relatively high efficiencies in removing suspended and dissolved pollutants. Electrocoagulation has also been successfully applied to wastewater from various industrial sectors, such as petrochemical, mechanical, automotive, textile, tanning, paper, and food industries [6,7].
Electrochemical methods are often used in conjunction with biological wastewater treatment and sludge processing methods. For example, anodic oxidation, Fenton-based electrochemical treatment, and electrocoagulation can be combined with bioprocesses for the removal of biologically recalcitrant substances and xenobiotics [8]. However, in these studies, these processes are usually used and monitored separately or in their arrangement in series. The focus is on the impact of electrochemically pretreated water on biological processes or the possibilities of electrochemical posttreatment of biologically treated water.
The impact of electrochemical processes on biological processes can also be direct. This occurs in cases where the overall output from the electrochemical process is introduced into the biological stage, influencing it with its products. Even more significant impact can be expected by directly integrating the electrochemical process into the biological process. Such direct influence of electrochemical methods is often used, for example, in waste sludge treatment. In study [9], excess sludge from the activated sludge process was treated using PbO2 plate electrodes with an applied voltage of 25 V. After 120 minutes of electrolysis, the sludge dewaterability improved by nearly 36%, and there was a 34% reduction in suspended solids. Microscopic analysis revealed that the electrochemical process disrupted sludge cell structures, leading to their death. This process was also supported by the formation of hydroxyl and sulfate radicals. Study [10] suggests that electrolysis can valorize excess activated sludge and prepare valuable chemicals from it. The authors achieved the best results using copper electrodes, an applied voltage of 1.5 V, and a time of 2 hours, resulting in a 30% degradation of volatile suspended solids (VSS) and obtaining 48.7 mg of volatile fatty acids (VFA) per gram of degraded VSS.
There is very little information in the literature regarding the impact of electrolysis products on the subsequent biological wastewater treatment process or the influence of electrolysis integrated directly into this process. One study investigating the direct impact of electrolysis on the activation process is [11], in which the authors examined the effect of electrolysis using iron electrodes on the activation process. The activation was represented by two SBR reactors, each with a volume of 173 m³, a total capacity of 1100 PE, and a wastewater inflow of 32 m³/d. One reactor was connected to a tank with electrolysis with a volume of 170 L, equipped with 16 pairs of iron electrodes under an electrical current of 0.86–2.1 A. The recycle between activation and electrolysis was 100 L/min. The second reactor served as a comparative one. A semi-continuous cycle occurred in the reactors, alternating aeration, mixing, and sedimentation phases. Anaerobic to anoxic processes took place during mixing, and besides denitrification, there was also enhanced biological phosphorus removal. Recirculation from electrolysis to SBR activation was turned off during sedimentation. The results showed that electrolysis did not have a negative impact on activated sludge. Lower output phosphorus concentrations were achieved in the reactor with electrolysis than in the comparative reactor at a molar ratio of Fe/P = 0.4. The authors concluded that integrating electrolysis into the activation process did not negatively impact wastewater pollution removal, enabling increased and sustainable phosphorus removal [11].
In our study, we focused on investigating the direct impact of electrolysis on the activation process by placement the electrolysis before activation or by directly integrating electrolysis into the activation tank. The experiments were conducted during the treatment of synthetic wastewater containing contaminants simulating municipal wastewater, using either iron or carbon electrodes. This choice of electrodes aimed to identify not only the influence of released iron but also the impact of electrolysis itself on the biological process.
2. Materials and Methods
2.1. Reactors for Monitoring the Combination of Electrolysis and Activation Process
The influence of electrolysis on the activation process was monitored in three reactors – laboratory-scale activation models. In Reactor I, the effect of electrolysis with iron electrodes placement in a separate tank on subsequent activated sludge process was observed. In Reactor II, the treatment process was monitored in a combined system – activation with submerged iron electrodes, while Reactor III represented the same system but with carbon electrodes. A comparative model was operated alongside the monitoring of all reactors. For Reactor I and Reactor III, the comparative model was an activation model with the same parameters but without electrolysis before activation or without integrated electrolysis. For Reactor II, after the start of electrolysis in this reactor, Fe2(SO4)3 was dosed into the comparative reactor for phosphorus removal. The volume of all activation models was 4 liters and was inoculated with activated sludge from the Devínska Nová Ves municipal wastewater treatment plant. They operated at laboratory temperature. The volume of the tank with electrolysis before Reactor I was 0.3 liters. The schematic diagram of the laboratory model with electrolysis and activation process is described in caption 2.4.
2.2. Synthetic Wastewater Used
The substrate was pumped into the models using a peristaltic pump. The composition of the model substrate (synthetic wastewater) was designed to correspond to the average pollution of COD, N, and P introduced into municipal wastewater treatment plants. To reduce the flow through the model, this water was doubled in concentration. The organic pollution of this substrate was 800 mg/L COD and consisted of glucose and sodium acetate. The substrate also contained nitrogen and phosphorus. Nitrogen was dosed in the form of NH4Cl, and its concentration in the substrate was 40 mg/L N-NH4. Phosphorus was added in the form of KH2PO4, and its concentration in the substrate was 15 mg/L P-PO4. Micronutrients were also added to the synthetic wastewater in the composition and quantity as stated, for example, in the study [12]. The main components of synthetic wastewater were chosen to achieve filamentous bulking of activated sludge during reactor operation and to monitor the influence of electrolysis integration on this process. The substrate flow rate was 125 mL/h, corresponding to a hydraulic retention time of 1.33 days. The organic loading rate in activation was 0.6 kg/(m3·d) COD, and the sludge age was 15 days. Separation of sludge and treated water occurred in a settling tank, from which the settled sludge was pumped back into the activation tank using a peristaltic pump. Excess sludge was removed daily directly from the activation tank.
2.3. Used Electrodes and Their Parameters
The distance between electrodes in the separate tank and in activation models with electrolysis was 5 cm. This distance was chosen based on measurements of the amount of released iron depending on the electrode distance (see Table 1). Iron electrodes used in Reactor I and Reactor II were made of sheet metal. They were rectangular in shape with dimensions of 5 x 6 cm and a thickness of 0.1 cm. The surface area of one electrode was 32.2 cm2. The applied voltage was 21 V, and the supplied current was 270 mA. Electrolysis occurred twice a day for 15 minutes. In the comparative model, which operated with the same technological parameters as Reactor II with electrolysis, a commercial reagent - a solution of iron sulfate with an iron content of 11.5% by weight and with an average density of 1520 kg/m3 (Prefloc, Kemira) - was dosed. It was dosed in such a volume that the amount of added iron approximately corresponded to the amount of iron released during electrolysis.
Carbon electrodes used in Reactor III were cylindrical with a diameter of 0.8 cm, and their immersion depth was 3 cm. The surface area of one electrode was 7.54 cm2. The supplied current was 82.5 mA, and the applied voltage was 21 V. Electrolysis occurred six time per day for 15 minutes (it will be explained below).
Current switching was automatic, using a timer switch. In the comparative model, which operated with the same technological parameters as the model with electrolysis, nothing was dosed in the first stage except for the model substrate.
Design of the electrolysis switching schedule of 2 x 15 minutes per day, was based on the following reasoning. In synthetic wastewater, is 15 mg/L of phosphorus. With a flow rate of 3 L/d, this amounts to 45 mg/d or 1.45 mmol/d of phosphorus. Assuming a 1.5-fold excess of precipitating agent (molar ratio Fe/P - β = 1.5), the required amount of iron for precipitation is 121.5 mg/d. In reference [1], it is stated that the current supplied to the electrocoagulation system determines the amount of iron released from the electrodes. For iron, this mass electrochemical equivalent is 1041 mg/Ah. With electrolysis duration of 0.5 h per day and a current of 200 - 270 mA (depending on the degree of fouling), 104.1-140 mg/d of iron is released.
In the comparative model to Reactor II with electrolysis, Prefloc was dosed at 0.35 mL twice a day. This dose corresponds to 122.4 mg/d of iron. Therefore, the theoretical amount of dosed iron was comparable to Reactor II with electrolysis using iron electrodes. We started electrolysis on the 20th day of model operation.
2.4. Scheme and Operation of the Laboratory Model
The schematic diagram of the laboratory model with electrolysis and activation process is illustrated in Figure 1. During the operation of the laboratory models, we monitored concentrations of COD, P-PO4, N-NH4, N-NO3 and Fe2+/3+ at filtered effluent, concentrations of activated sludge in the models, concentrations Fe2+/3+ in activated sludge, volume of sludge after 30 min sedimentation, sludge volume index (SVI), endogenous rX,ox,en, and total rX,ox,tot respiration rate. All analyses of the monitored parameters were carried out according to reference [13]. Respirometric measurements were conducted in a closed respirometric chamber according to the work of Drtil et al. [14].
3. Results
3.1. Reactor I – Placement of Electrolysis before the Activation Tank
In this reactor, the influence of electrolysis placement before the activation tank was investigated. Iron electrodes were submerged into a 0.3-liter tank and spaced 5 cm apart. Electrolysis was activated twice a day for 15 minutes each time. Figure 2 illustrates the evolution of iron concentration in the container with electrolysis. This figure represents the dosing of iron into the activation tank. We can observe that this dosing is not steady, and after 15 minutes of iron concentration increase due to electrolysis, iron is gradually washed out by the flow of wastewater into the activation tank. The unevenness of iron concentration over the hydraulic retention time in activation was not reflected in the evolution of iron concentration at the effluent from the activation or from the sedimentation tank (see Figure 3). We primarily monitored the impact of electrolysis on parameters such as COD and P-PO4 at the effluent of the laboratory model, assuming that these parameters might be affected. Additionally, we focused on the influence on sludge sedimentation properties.
The values of COD at the outlet from Reactor I and the comparative model are shown in Figure 4 and Figure 5, respectively. The output concentrations of P-PO4 are also depicted on the same figures. From the COD trends of both models, it is evident that separate electrolysis did not have a significant impact on the output values. This is mainly due to the fact that electrocoagulation has higher efficiencies of COD removal above 50% for wastewater with high concentrations of insoluble, especially colloidal particles, and high molecular weight organic substances [15]. The synthetic wastewater we used contained only simple and easily degradable substances (glucose and sodium acetate), and therefore no contribution to COD removal efficiency was observed for the electrocoagulation process. Nevertheless, the average COD removal efficiency in Reactor I was 90.7%, and in the comparative model, it was 90.9%.
However, the concentrations of P-PO4 were different. While the average concentration of P-PO4 in the comparative model was 8.9 mg/L (Figure 5), in the model with separate electrolysis, this concentration was 9.4 mg/L before the electrolysis was started, and immediately after the electrolysis was initiated, it dropped to values ranging from 0.3 to 1.07 mg/L with an average of 0.52 mg/L (Figure 4). In the comparative model, the decrease in phosphate concentration from 15 mg/L to an average value of 8.9 mg/L was mainly due to assimilation into the newly formed activated sludge. In the model with electrolysis, more than 96.5% efficiency in removing P-PO4 was due to both assimilation and precipitation of phosphates by iron released during electrolysis from the iron electrode. The average concentration of P-PO4 after the electrolysis was initiated was 0.52 mg/L. The concentrations of iron at the outlet from Reactor I and in its activated sludge are shown in Figure 3. From this figure, it can be seen that most concentrations of phosphate were below 1 mg/L. However, this does not necessarily imply the optimal amount of released iron for phosphate precipitation. Iron, besides precipitating with phosphorus, also forms Fe(OH)3 precipitates. These precipitates become part of the activated sludge. While in the comparative model, the initial concentration of activated sludge of 2.1 g/L slightly decreased, reaching 1.52 g/L by the end of operation, in Reactor I, it increased to a concentration of 4.05 g/L (Figure 6). As seen in Figure 3, the iron concentration in the sludge gradually increased, stabilizing at a value of approximately 930 mg/L in the last 20 days of operation. The volatile suspended solids (VSS) content in this sludge was 47%. This indicates the accumulation of chemical sludge in the activation tank. By removing the excess sludge with a sludge age of 15 days after approximately 60 days, an equilibrium was reached in the dissolution of iron by electrolysis, the formation of chemical sludge with iron content, the removal, and the discharge of iron at the outlet of the model. The proportion of activated sludge from the mixture with chemical sludge was 2.4 g, which means that besides the amount of chemical sludge, the amount of activated sludge also slightly increased. The development of the concentration of activated sludge in Reactor I and in the comparative model is shown in Figure 6. Over the entire operating period of the model, approximately 7200 mg of Fe was dissolved, and 6.92 Ah was consumed. This value is derived from the theoretical mass-based electrochemical equivalent of 1041 mg/Ah Fe [1]. This represents a total electricity consumption of 145.3 Wh at the applied voltage of 21 V.
The inclusion of electrolysis before activation also had another effect on improving the sedimentation properties of the sludge (Figure 7). The electrolysis, or the influx of dissolved iron into the activation, appeared almost immediately after the initiation of electrolysis, due to the rapid increase in the concentration of activated sludge, especially its inorganic fraction. However, this was reflected in the sludge volume index (SVI) values only after about 50 days of reactor operation, or 30 days after the start of electrolysis. It was only then that a phase interface between sludge and liquid began to form in the sedimentation cylinder. However, this was not due to the disappearance of filamentous microorganisms but rather due to the weighting effect of iron sludge.
The effect of iron on sludge activity was also assessed by measuring respiration rates - both endogenous and total (endogenous + exogenous). We conducted these measurements using the methodology outlined in reference [14], employing a closed respirometric chamber. The results of these measurements are presented in Table 2. From these values, it is evident that the presence of iron in the activation with pre-electrolysis had a positive effect on the activity of the activated sludge. However, due to the composition of the synthetic wastewater, which contained easily degradable components, this effect was not reflected in the effluent values of COD (Figure 4 and Figure 5). The positive impact of iron dosage on the activity of activated sludge is reported in various studies, such as references [16,17], where authors reported an increase in total respiration rates in the presence of iron by 40 - 50%. However, information in the scientific literature regarding the effect of iron on respiratory rates of activated sludge is contradictory. Some studies mention a negative effect of iron on the activation process due to a decrease in pH values during the formation of Fe(OH)3 [18,19]. In reference [19], authors not only mention a negative effect on respiratory rates but also on nitrification rates. Furthermore, the authors of reference [20] did not observe any changes in exogenous rates before and after simultaneous dosing of FeCl3. However, these findings are questionable because when using domestic wastewater, the measured exogenous respiration rate was only 6.3 mg/(gVSS ·h) O2.
3.2. Reactor II – Electrolysis with Iron Electrodes Directly in the Activation Tank
In reactor II, where electrolysis with iron electrodes directly in the activation tank was used, we assumed that not only the influence of dissolved iron but also the effect of electrical current on the activation process would be evident. We compared the results with a reactor without electrolysis, and in the reference reactor, we initiated dosing of Fe2(SO4)3 (Prefloc) at the same time as the electrolysis in reactor II - on the 20th day of operation.
Electrolysis in the activation was performed twice daily for 15 minutes each time, corresponding to the amount of iron required for chemical precipitation. The dose of Prefloc was administered twice daily at 0.35 mL each time, approximately equivalent to the amount of iron released during electrolysis.
Courses of COD and P-PO4 values in Reactor II and the comparative model are shown in Figure 8 and Figure 9. There were no significant differences in COD values in these activations, with the average outlet COD from both reactors being approximately 72 mg/L. Regarding phosphorus removal, improvement was observed in both reactors after the start of electrolysis or Prefloc dosing. In Reactor II, lower P-PO4 concentrations were achieved in the range of 0.11-0.38 mg/L with an average of 0.27 mg/L, while in the reactor with Prefloc dosing, the range of values was 0.52-1.2 mg/L with an average of 0.87 mg/L.
The studies on the use of electrocoagulation report more effective phosphorus precipitation [21,22]. While in chemical phosphorus precipitation, high removal efficiencies and concentrations in the effluent below 0.5 mg/L P-PO4 are achieved at high molar ratios of Fe/P - β ≥ 2, with electrocoagulation, this is also achieved at molar ratios well below β ≤ 1.5 [21].
The concentration of activated sludge in Reactor II and in the comparative reactor with Prefloc dosing is shown in Figure 10. The dry solids content in both activations increased and reached nearly identical concentrations of approximately 4 g/L. In both cases, this was due to a slight increase in biological sludge, but mainly due to an increase in the concentration of chemical sludge. The loss by ignition in both sludges was approximately 48% at the end of the reactor monitoring period. The impact of electrocoagulation compared to precipitation is evident from the monitoring of sludge sedimentation properties – shown in Figure 11. In the comparative model with Prefloc dosing, the volume of sludge after 30 min sedimentation and sludge volume index followed a similar pattern as in the system with pre-electrolysis – filamentous microorganisms continued to be part of the activated sludge, and the decrease in sediment volume and sludge volume index was caused by chemical sludge loading. In the case of Reactor II, the decrease in sediment volume and sludge volume index was also caused by changes in sludge morphology, gradual disappearance of filamentous microorganisms, and the formation of flocculent biomass.
Microscopic observations confirmed a gradual degradation of Sphaerotilus natans fibers and almost complete disappearance of this type of filamentous microorganism, accompanied by the formation of activated sludge flocs.
Even with this reactor configuration, we conducted measurements of activated sludge activity. From the respiration rates provided in Table 2, it is evident that sludge respiration activity was stimulated when Prefloc was dosed, similar to the pre-electrolysis before activation. However, electrocoagulation within the activation, despite the released iron, had a negative impact on sludge activity. Although electrocoagulation in the activation improved sludge sedimentation properties and reduced phosphorus concentration at the outlet, it inhibited sludge activity. This could be due to the removal of filamentous microorganisms, which played a significant role in removing easily degradable substrate. It is possible that sludge activity would recover with a sufficient increase in the proportion of floc-forming microorganisms. We verified nitrification activity of activated sludge by measuring the concentration of N-NH4 and N-NO3 at the effluent of the models. These concentrations are shown in Figure 12.
From the concentrations of N-NH4 at the effluent, it is evident that the nitrification efficiency in both reactors was high, with average concentrations of ammonium nitrogen around 1 mg/L in both cases. Differences were observed in the concentrations of nitrate nitrogen at the output of the models. In the reactor with Prefloc dosing, the effluent concentration of N-NO3 decreased from an average of 17.6 mg/L to an average of 11.7 mg/L after dosing began. Considering the input concentration of N-NH4 of 40 mg/L, it can be said that, in addition to nitrification, partial simultaneous denitrification occurred at the anoxic core level of the sludge flocs. The presence of iron increased the rate of nitrate respiration. Stimulation of nitrate respiration is also reported by other authors [17]. With an input concentration of phosphate phosphorus of 9 mg/L and a dose of Fe2+, approximately 26% stimulation of nitrate respiration was observed, and with a dose of Fe3+, approximately 108% stimulation was observed. The molar ratio of Fe/P was 1.5. In the case of Reactor II, the opposite was observed. Before the start of electrolysis, the average concentration of N-NO3 was approximately 16.9 mg/L, and after the start of electrolysis, the average concentration of N-NO3 increased to 27.5 mg/L. We can conclude that just as electrolysis negatively affected oxygen respiration rates, it also affected nitrate respiration.
The negative impact of electrolysis on activated sludge has also been utilized in studies where electrolytic decomposition was used for the production of volatile fatty acids [10] or to reduce its quantity and improve dewatering properties [11].
In the next study, we focused on examining the impact of electrolysis itself on the activation process, without the release of iron.
3.3. Reactor III: Electrolysis using Carbon Electrodes Directly in the Activation
During the operation of Reactor III, our focus was on comparing the activation model, which processed synthetic wastewater with carbon electrodes submerged. The wastewater used was the same as in the operation of Reactor I and Reactor II, and the parameters of electrolysis with carbon electrodes are provided in the experimental section. Due to the different shape of the electrodes, we had to select a criterion for comparing the electrolysis parameters. We chose electrical power consumption, or rather, the consumption of electrical energy, which was in the case of using iron electrodes 2.1-2.84 Wh/d. The electrolysis operated twice a day for 15 minutes each time. In the case of carbon electrodes, a voltage of 21 V was applied, and the current supplied was 82.5 mA. With a 15-minute duration of electrolysis, the energy consumption is 0.433 W. If we want energy consumption in the same range as with iron electrodes, we need approximately six times longer duration of electrolysis. This means the duration of electrolysis with carbon electrodes needs to be six times 15 minutes per day. The electrolysis started operation, as in all cases, on the 20th day of activation operation. The comparative activation was the same as in Reactor I. The values of COD and P-PO4 concentrations at the outlet of the comparative model are shown in Figure 5. The trends of these parameters for Reactor III were very similar to those in the comparative reactor. We can conclude that submerged carbon electrolysis had no impact on the outlet concentrations of COD and P-PO4. We also monitored the concentrations of N-NH4 and N-NO3 at the effluent of the model with submerged electrolysis and in the comparative reactor. Ammonium nitrogen concentrations were low, with an average value at the outlet of both reactors around 1 mg/L, similar to Figure 12. There were no differences between the models in the outlet concentrations of nitrate nitrogen, which ranged from 13-20 mg/L, as seen in Figure 12 in the first 20 days of model operation. The only difference was in the volume of sedimented sludge after 30 minutes and in the sludge volume index shown in Figure 13. The comparative sludge reached a sediment volume of 1000 ml even before the 20th day, and it maintained this volume throughout the operation due to the presence of filamentous microorganisms. The sludge from the activation with carbon electrodes reached approximately 1000 ml sediment volume until the 35th day of operation, about 15 days after the electrolysis was initiated. Then, it began to gradually decrease until reaching a volume of approximately 550 ml at the end of its operation. The activity of the sludge was also measured using respiratory rates - see Table 2. Only the respiratory rates for Reactor III are provided in the table. The respiratory rates in the comparative model were the same as in the case of Reactor I. From these measurements, it is evident that electrolysis using carbon electrodes inserted into the activation had no effect on the respiratory activity of the sludge. The consistent trend in the concentration of N-NO3 during the operation at the output of both reactors indicated that partial simultaneous denitrification occurs at the anoxic core level of the sludge flocs, and neither was the nitrate respiration of the sludge affected by electrolysis. This finding contradicts the result obtained with submerged electrolysis using iron electrodes in Reactor II. In that case, the respiratory rate was negatively affected, and after the electrolysis was switched on, the nitrate concentration at the outlet increased - see Figure 12. This could be due to the fact that although the electrical power input to the electrodes was the same for Reactors II and III, the difference lay in the supplied current - it was 270 mA for the iron electrodes and 82.5 mA for the carbon electrodes.
5. Conclusions
The results obtained from the study on the combined use of electrolysis and biological wastewater treatment revealed several interesting findings.
Pre-electrolysis using iron electrodes before the activation process improved the removal of phosphorus from wastewater and increased the respiration rates of activated sludge by the action of dissolved iron. The presence of heavier and denser iron precipitates in the activated sludge also improved sludge sedimentation.
When evaluating the effect of electrolysis with iron electrodes inserted into the activation, we found an improvement in respiratory rates and denitrification efficiency in the comparative reactor with Fe2(SO4)3 dosing. The reactor with inserted electrolysis showed a deterioration in both respiration and denitrification rates, but sedimentation properties of the sludge significantly improved with the disappearance of filamentous microorganisms.
The effect of inserted electrolysis on the destruction of filamentous microorganisms was also confirmed when using carbon electrodes. However, the lower current between the carbon electrodes did not inhibit respiration and denitrification rates and improved sludge sedimentation properties.
It was confirmed that inserted electrolysis has no negative impact on the removal of organic pollution from wastewater and on nitrification in the case of both iron and carbon electrodes.
Author Contributions
Conceptualization, M.H. (Miroslav Hutňan); methodology, M.H. and R.Z. (Ronald Zakhar); validation, M.H. and B.J. (Barbora Jankovičová); formal analysis, B.J., R.Z., N.Š. (Nikola Šoltýsová); investigation, B.J., R.Z. and N.Š.; resources, all authors.; data curation, M.H. writing—original draft preparation, M.H.; writing—review and editing, M.H.; visualization, B.J., N.Š. All authors have read and agreed to the published version of the manuscript.
Funding
This research received no external funding.
Data Availability Statement
Data are contained within the article.
Conflicts of Interest
The authors declare no conflicts of interest.
References
- Chen, G. Elektrochemical Technologies in Wastewater Treatment. Sep. Purif. Technol. 2004, 38, 1–41. [Google Scholar] [CrossRef]
- Feng, Y.; Yang, L.; Liu, J.; Logan, B.E. Electrochemical technologies for wastewater treatment and resource reclamation. Environ. Sci. Water Res. Technol. 2016, 2, 800–831. [Google Scholar] [CrossRef]
- Hutnan, M.; Drtil, M.; Kalina, A. Anaerobic stabilisation of sludge produced during municipal wastewater treatment by electrocoagulation. J. Hazard. Mater. 2006, 131, 163–169. [Google Scholar] [CrossRef] [PubMed]
- Bukhari, A.A. Investigation of the electro-coagulation treatment process for the removal of total suspended solids and turbidity from municipal wastewater. Bioresour. Technol. 2008, 99, 914–921. [Google Scholar] [CrossRef] [PubMed]
- Ensano, B.M.B.; Borea, L.; Naddeo, V.; Belgiorno, V.; de Luna, M.D.G.; Balakrishnan, M.; Ballesteros Jr, M.F.C. Applicability of the Electrocoagulation Process in Treating Real Municipal Wastewater Containing Pharmaceutical Active Compounds. J. Hazard. Mater. 2019, 361, 367–373. [Google Scholar] [CrossRef] [PubMed]
- Boinpally, S.; Kolla, A.; Kainthola, J.; Kodali, R.; Vemuri, J. A state-of-the-art review of the electrocoagulation technology for wastewater treatment. Water Cycle 2023, 4, 26–36. [Google Scholar] [CrossRef]
- Kumar, V. A Review on the Feasibility of Electrolytic Treatment of Wastewater: Prospective and Constraints. Arch.Agri.Environ. Sci. 2017, 2, 52–62. [Google Scholar]
- Mousset, E.; Trellu, C.; Olvera-Vargas, H.; Pechaud, Y.; Fourcade, F.; Oturan, M.A. Electrochemical technologies coupled with biological treatments. Curr. Opin. Electrochem. 2020, 26, 100668. [Google Scholar] [CrossRef]
- Lu, S.; Li, X. Tang, G. ; Liu, T.; Ke, Y.; Liu, B.; Hua, W. Electrochemical Treatment of Waste Activated Sludge: Volume Reduction Mechanism and Improvement Possibilities., Sep. Purif. Technol. 2022, 300, 121617. [Google Scholar]
- Jafari, M.; Botte, G.G. Electrochemical valorization of waste activated sludge for short-chain fatty acids production. Front. Chem. 2022, 10, 974223. [Google Scholar] [CrossRef] [PubMed]
- Mishima, I.; Nakajima, J. Application of Iron Electrolysis to Full-Scale Activated Sludge Process for Phosphorus Removal. J. Water Environ. Technol. 2011, 9, 359–369. [Google Scholar] [CrossRef]
- Thela, N.; Ikumi, D.; Harding, T.; Basitere, M. Growing an Enhanced Culture of Polyphosphate-Accumulating Organisms to Optimize the Recovery of Phosphate from Wastewater. Water 2023, 15, 2014. [Google Scholar] [CrossRef]
- APHA/AWWA/WEF (2017) Standard Methods for the Examination of Water and Wastewater. American Public Health Association, USA.
- Drtil, M.; Németh, P.; Bodík, I. Kinetic constants of nitrification. Water Res. 1993, 27, 35–39. [Google Scholar] [CrossRef]
- Mao, Y.; Zhao, Y.; Cotterill, S. Examining Current and Future Applications of Electrocoagulation in Wastewater Treatment. Water 2023, 15, 1455. [Google Scholar] [CrossRef]
- Derco, J.; Žarnovský, L.; Kuffa, R.; Liptáková, E. Influence of Iron and Aluminium Salts on Activated Sludge Process During Simultaneous Precipitation of Phosphorus. Pol. J. Environ. Stud. 1996, 5, 23–28. [Google Scholar]
- Derco, J.; Kuffa, R.; Urminská, B.; Dudáš, J.; Kušnierová, J. Influence of Phosphorus Precipitation on Wastewater Treatment Processes. In Operations Research – the Art of Making Good Decisions; InTech: Rijeka, Croatia, 2016; pp. 103–132. [Google Scholar]
- Mishima, I.; Suzuki, M.; Nakajima, J.; Kaneko, M. Effect of Iron Coagulant on Respiratory Activity of Activated Sludge. Environ. Eng. Res. 2004, 41, 127–136. [Google Scholar]
- Philips, S.; Rabaey, K.; Verstraete, W. Impact of iron salts on activated sludge and interaction with nitrite or nitrate. Bioresour. Technol. 2003, 88, 229–239. [Google Scholar] [CrossRef] [PubMed]
- Costa, R.H.R.; Villafranca, B.M.; Voltolini, C.A.; Guimarães, L.B.; Hoffmann, H.; Velho, V.F.; Mohedano, R.A. Effectiveness of Phosphorus Removal in an SBR Using Co-precipitation with Ferric Chloride, and its Effects on Microbial Activity. Braz. J. Chem. Eng. 2019, 36, 785–795. [Google Scholar] [CrossRef]
- Stafford, B.; Dotro, G.; Vale, P.; Jefferson, B.; Jarvis, P. Removal of phosphorus from trickling filter effluent by electrocoagulation. Environ. Technol. 2014, 35, 3139–3146. [Google Scholar] [CrossRef] [PubMed]
- Hashim, K.S.; Al Khaddar, R.; Jasim, N.; Shaw, A.; Phipps, D.; Kot, P.; Pedrola, M.O.; Alattabi, A.W.; Abdulredha, M.; Alawsh, R. Electrocoagulation as a green technology for phosphate removal from river water. Sep. Purif. Technol. 2018, 210, 135–144. [Google Scholar] [CrossRef]
Figure 1.
Scheme of laboratory model with electrolysis 1 – stock solution (synthetic wastewater), 2 – peristaltic pump, 3 – activated sludge tank, 4- immersed electrodes with voltage source (alternative placement in separate tank), 5 – immersed electrodes with voltage source (placement in activation), 6 – sedimentation tank, 7 – returned sludge, 8 – peristaltic pump for sludge recirculation, 9 – effluent of wastewater.
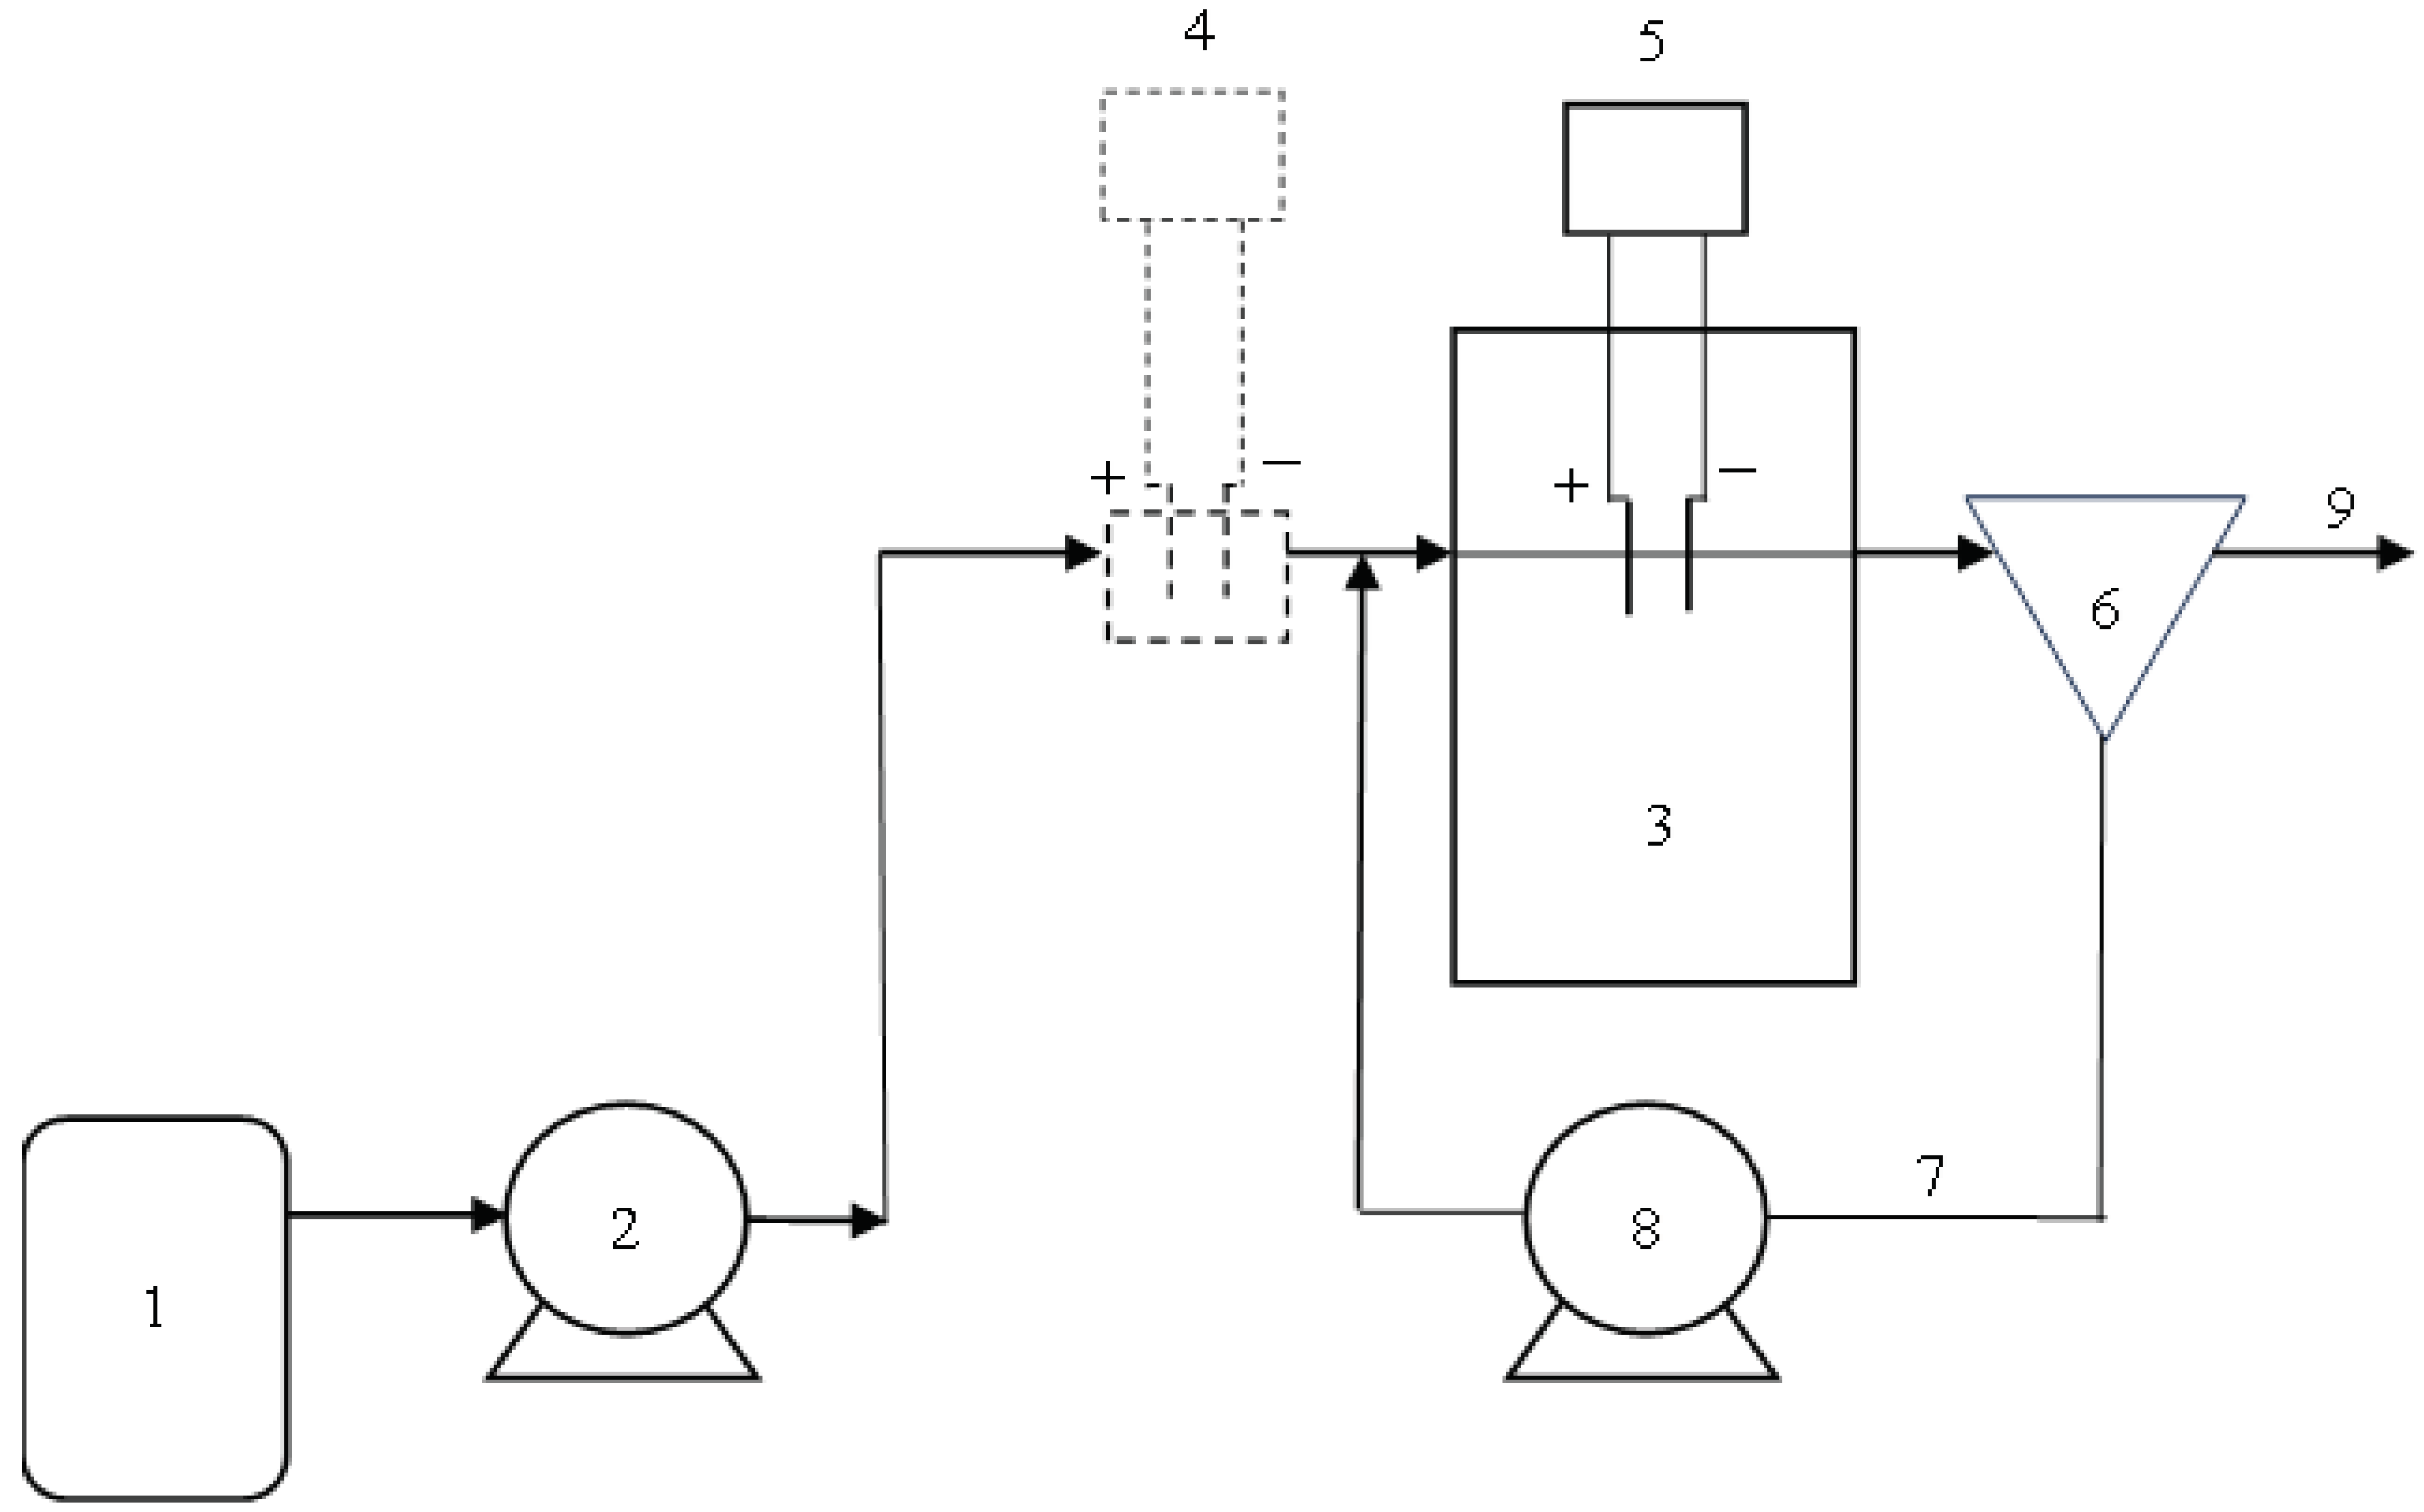
Figure 2.
Concentration profile of iron in separate electrolysis.
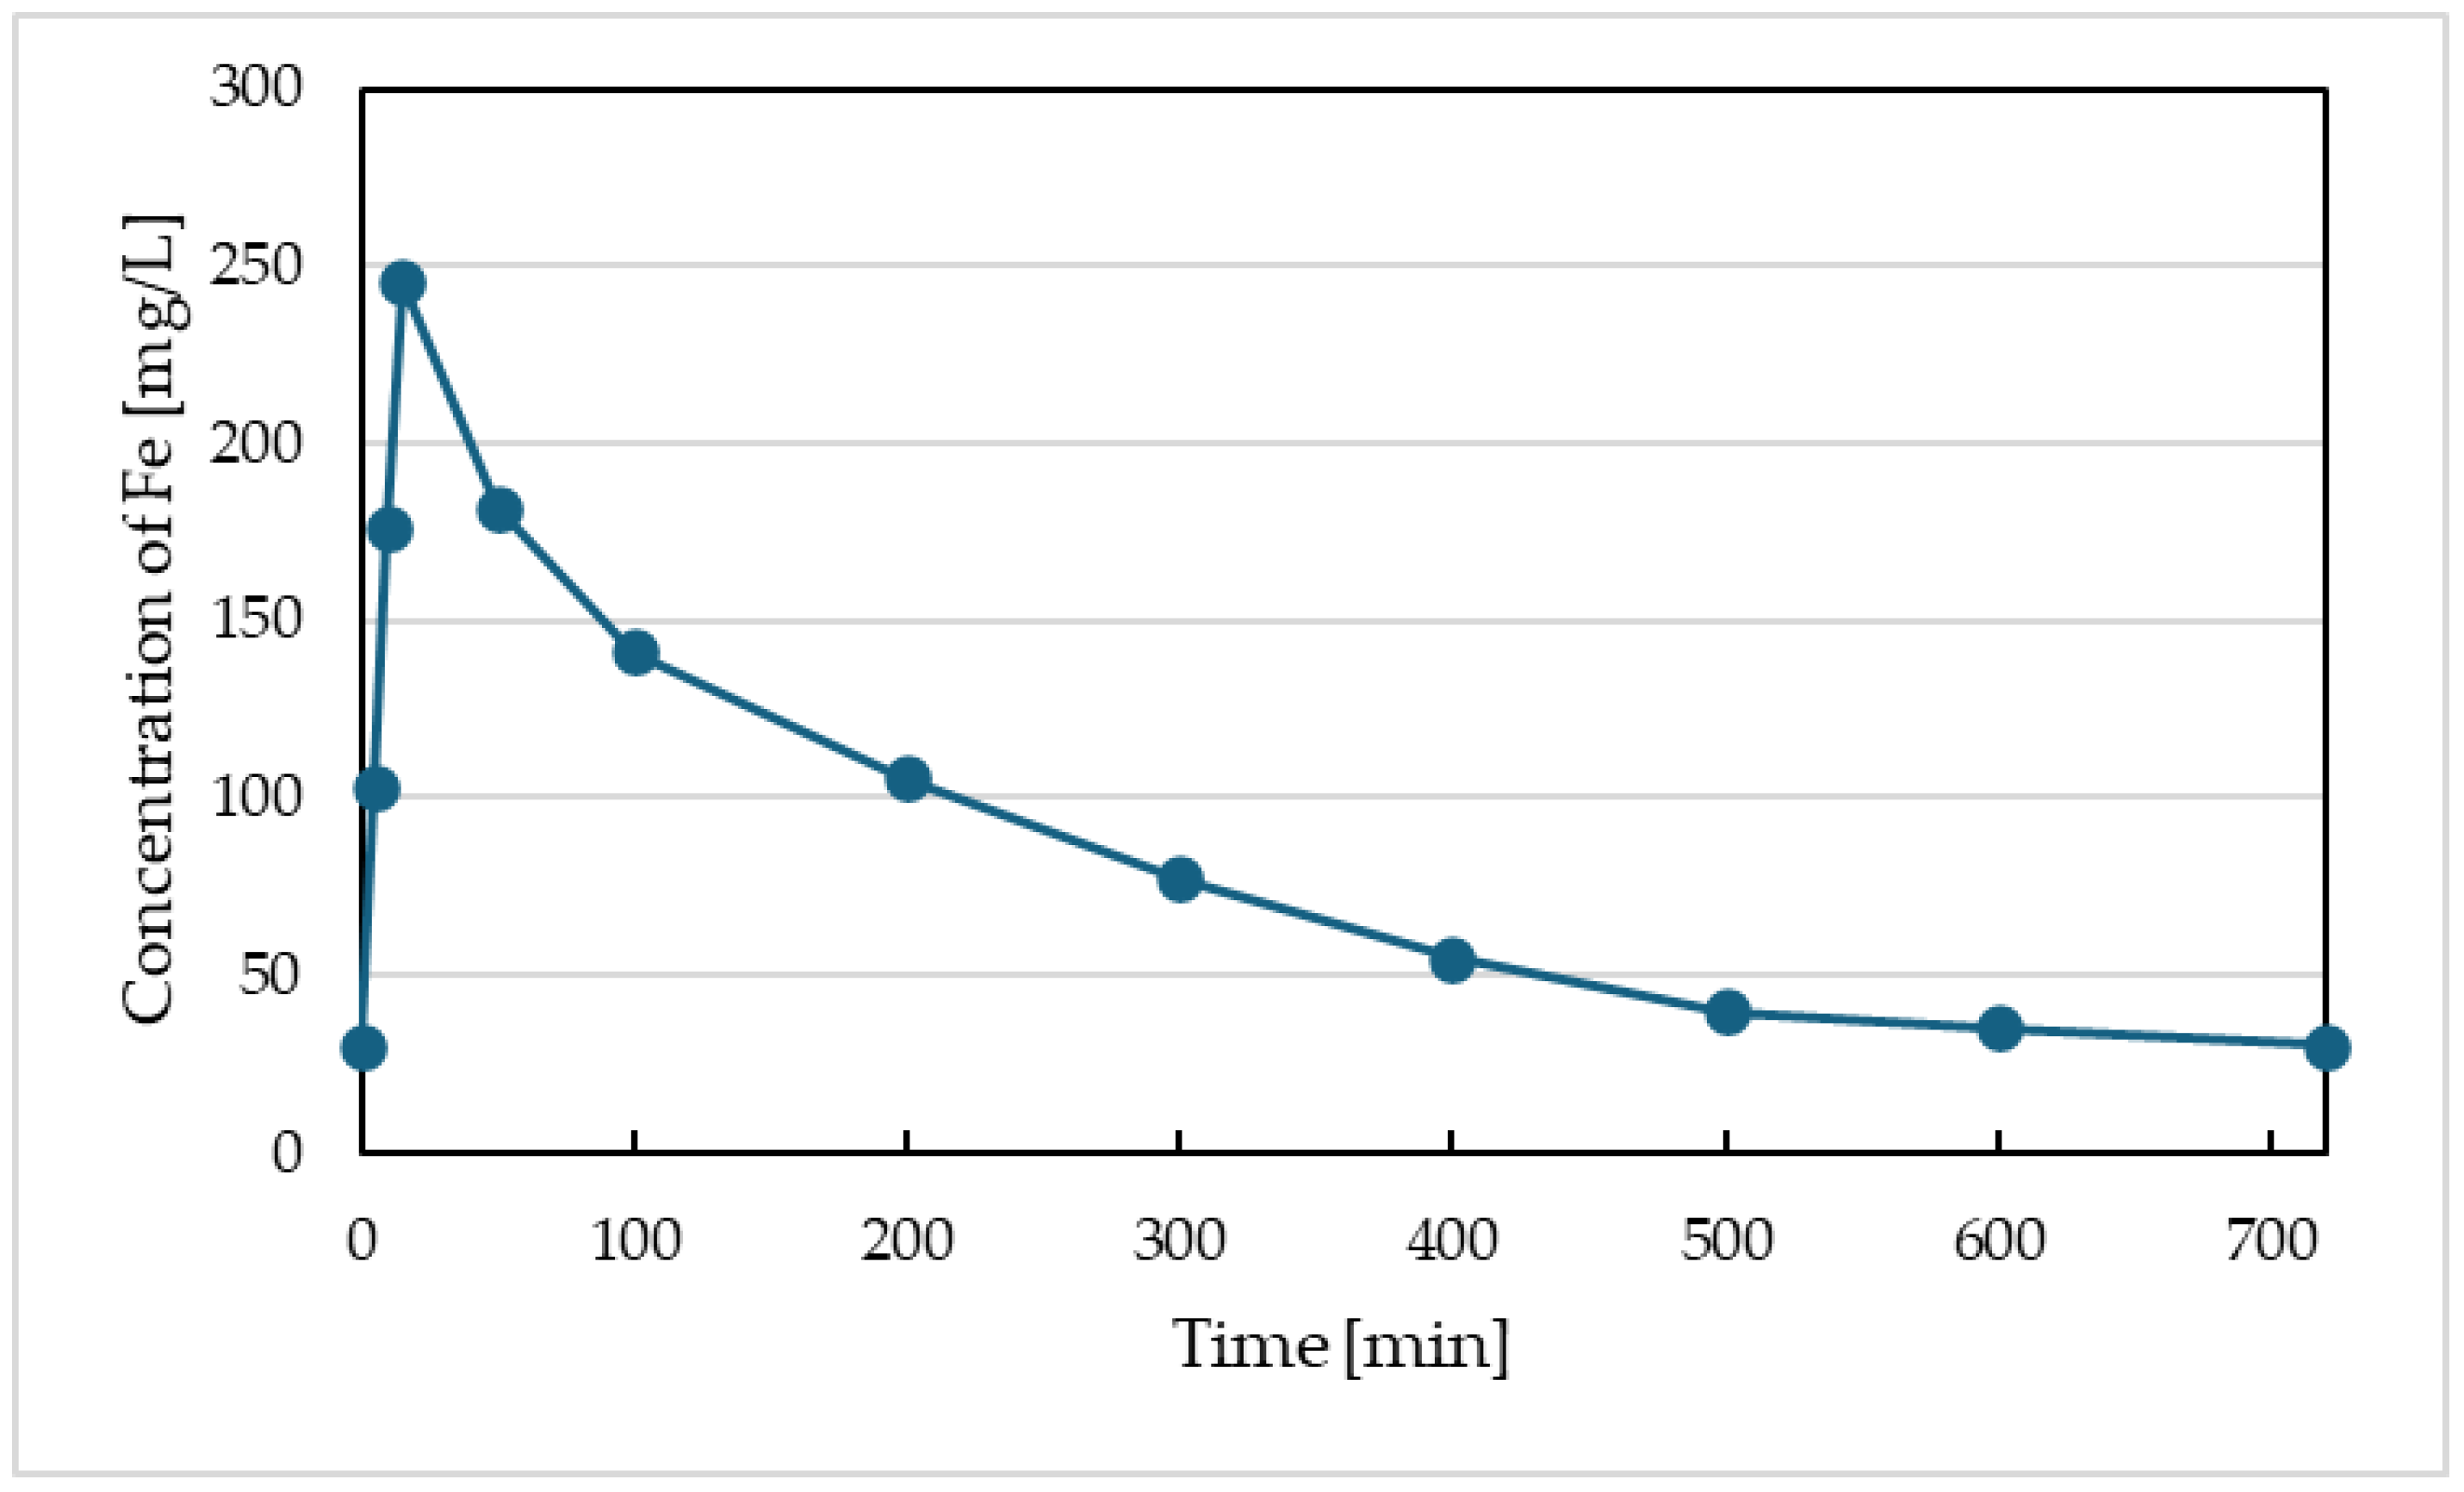
Figure 3.
Course of Fe2+/3+ at the effluent and in the sludge of Reactor I.
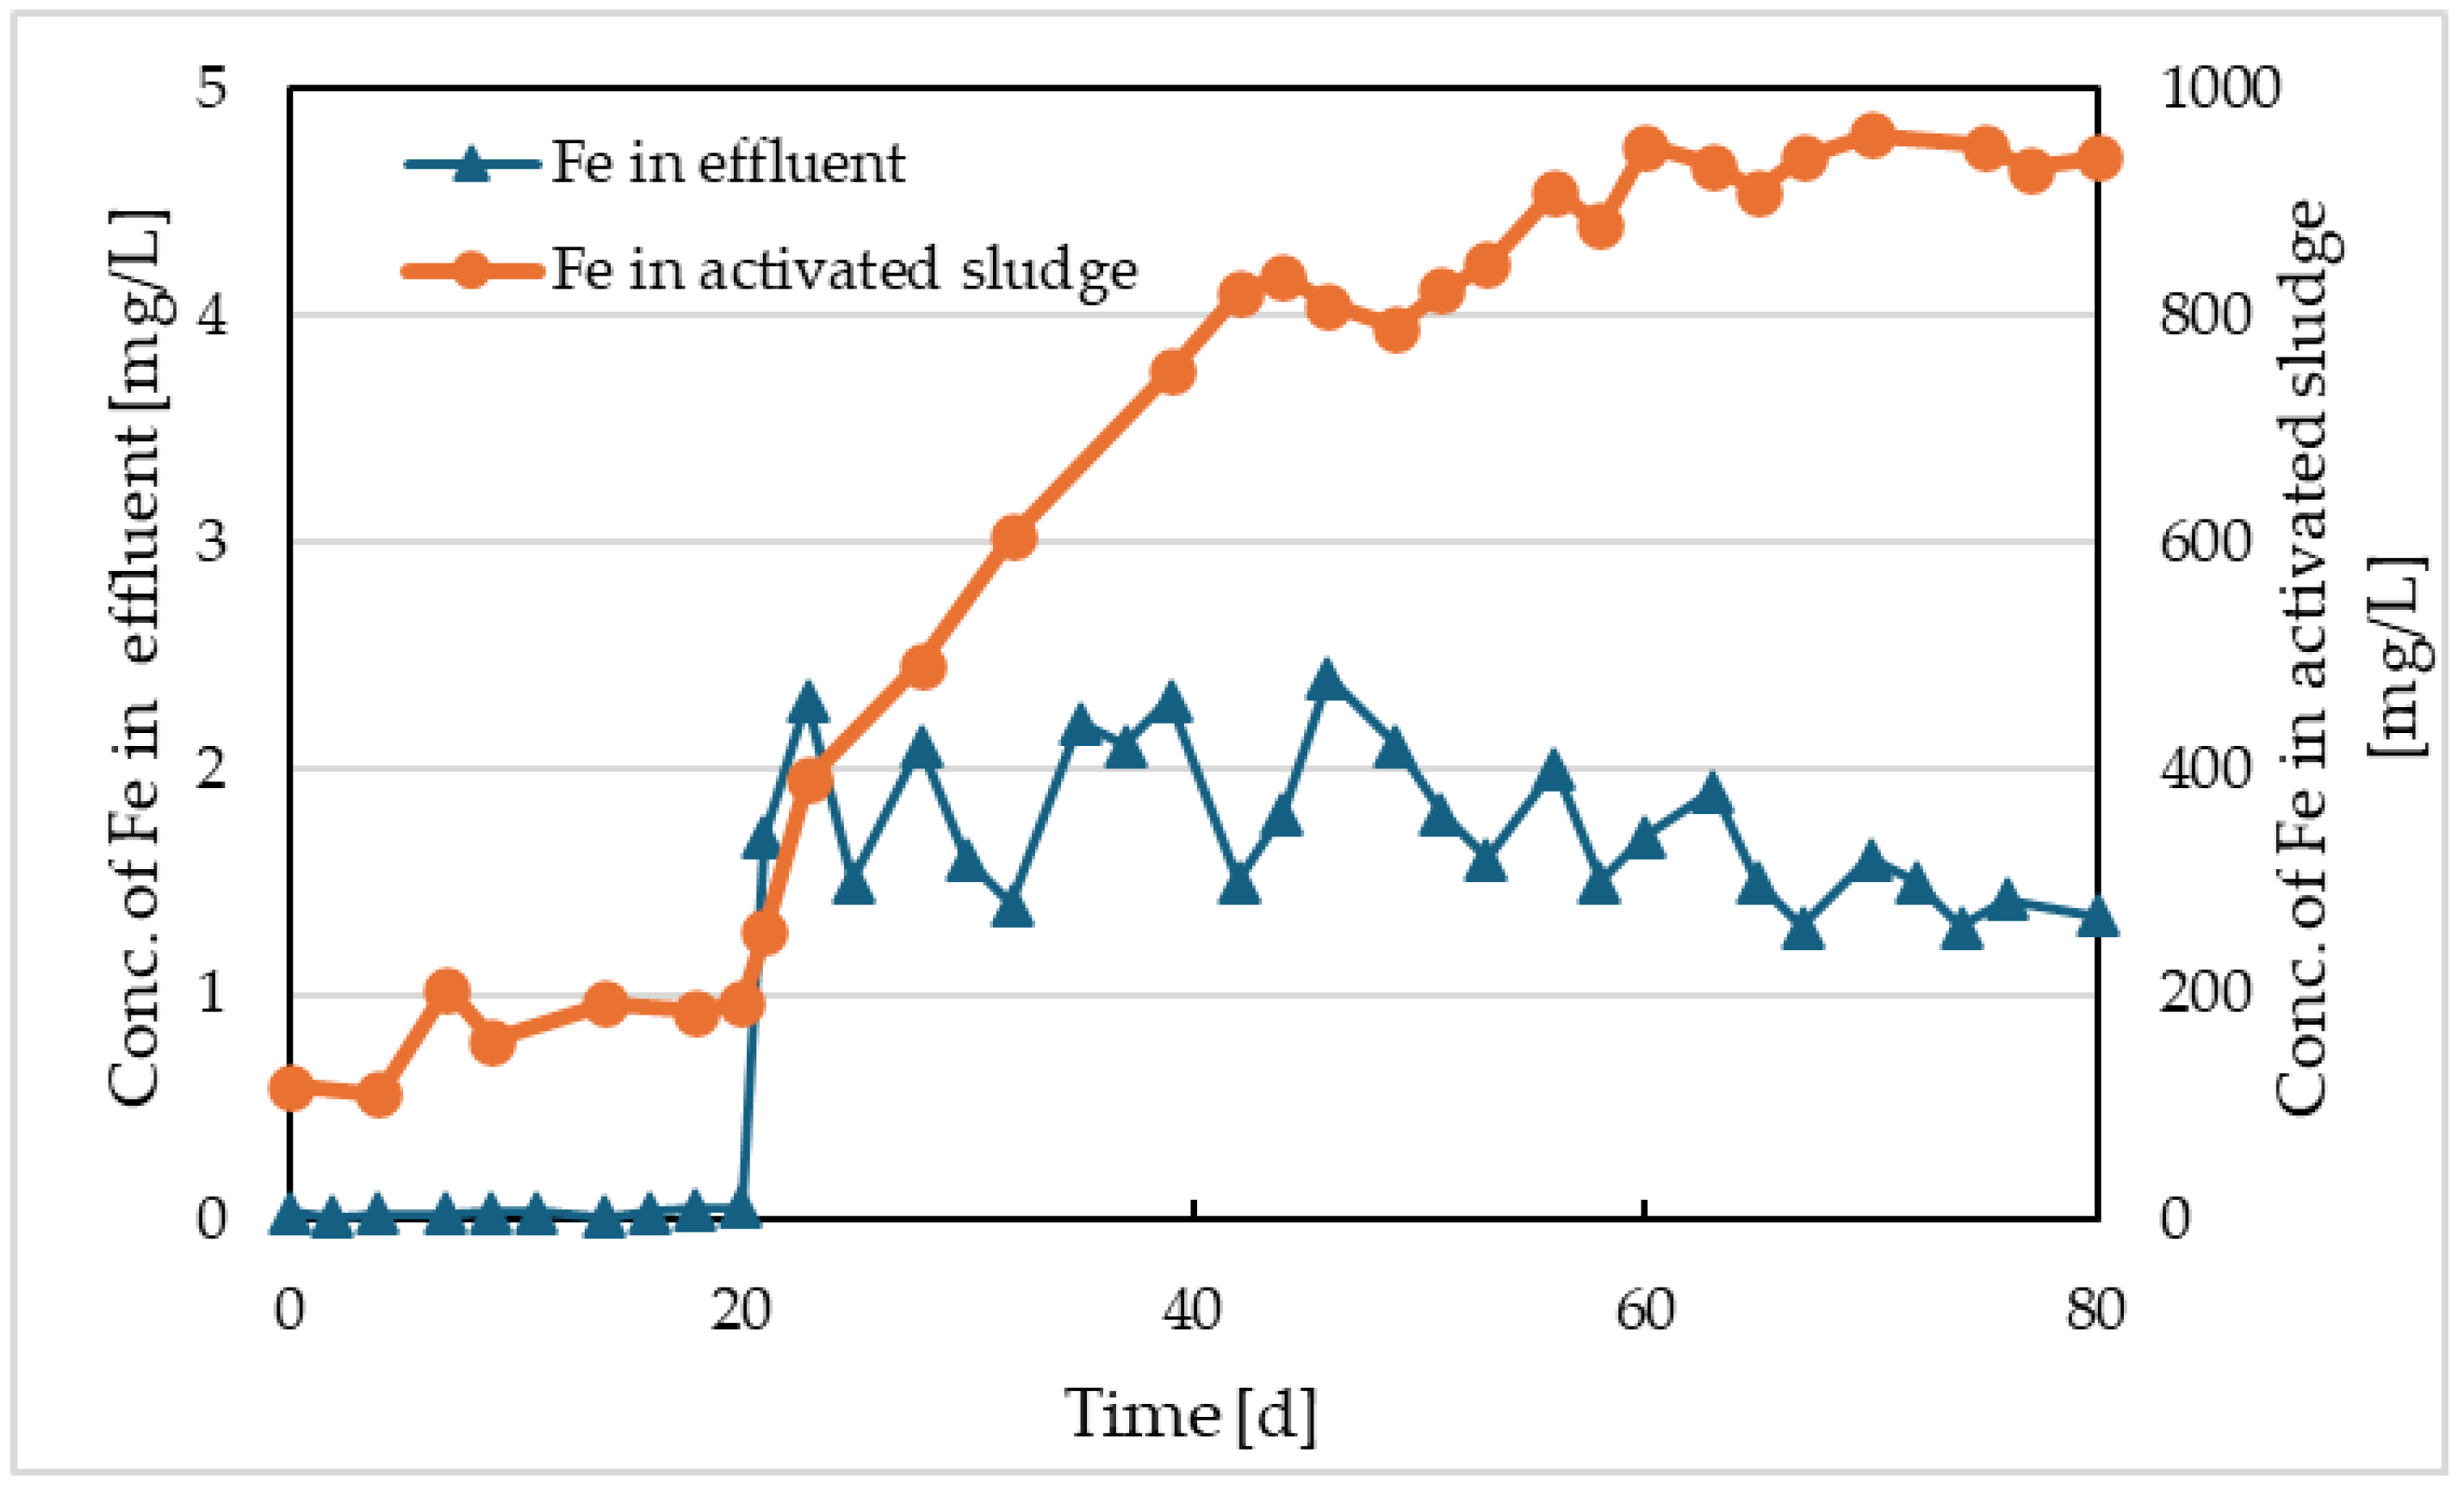
Figure 4.
Values of COD and P-PO4 concentrations at effluent of Reactor I.
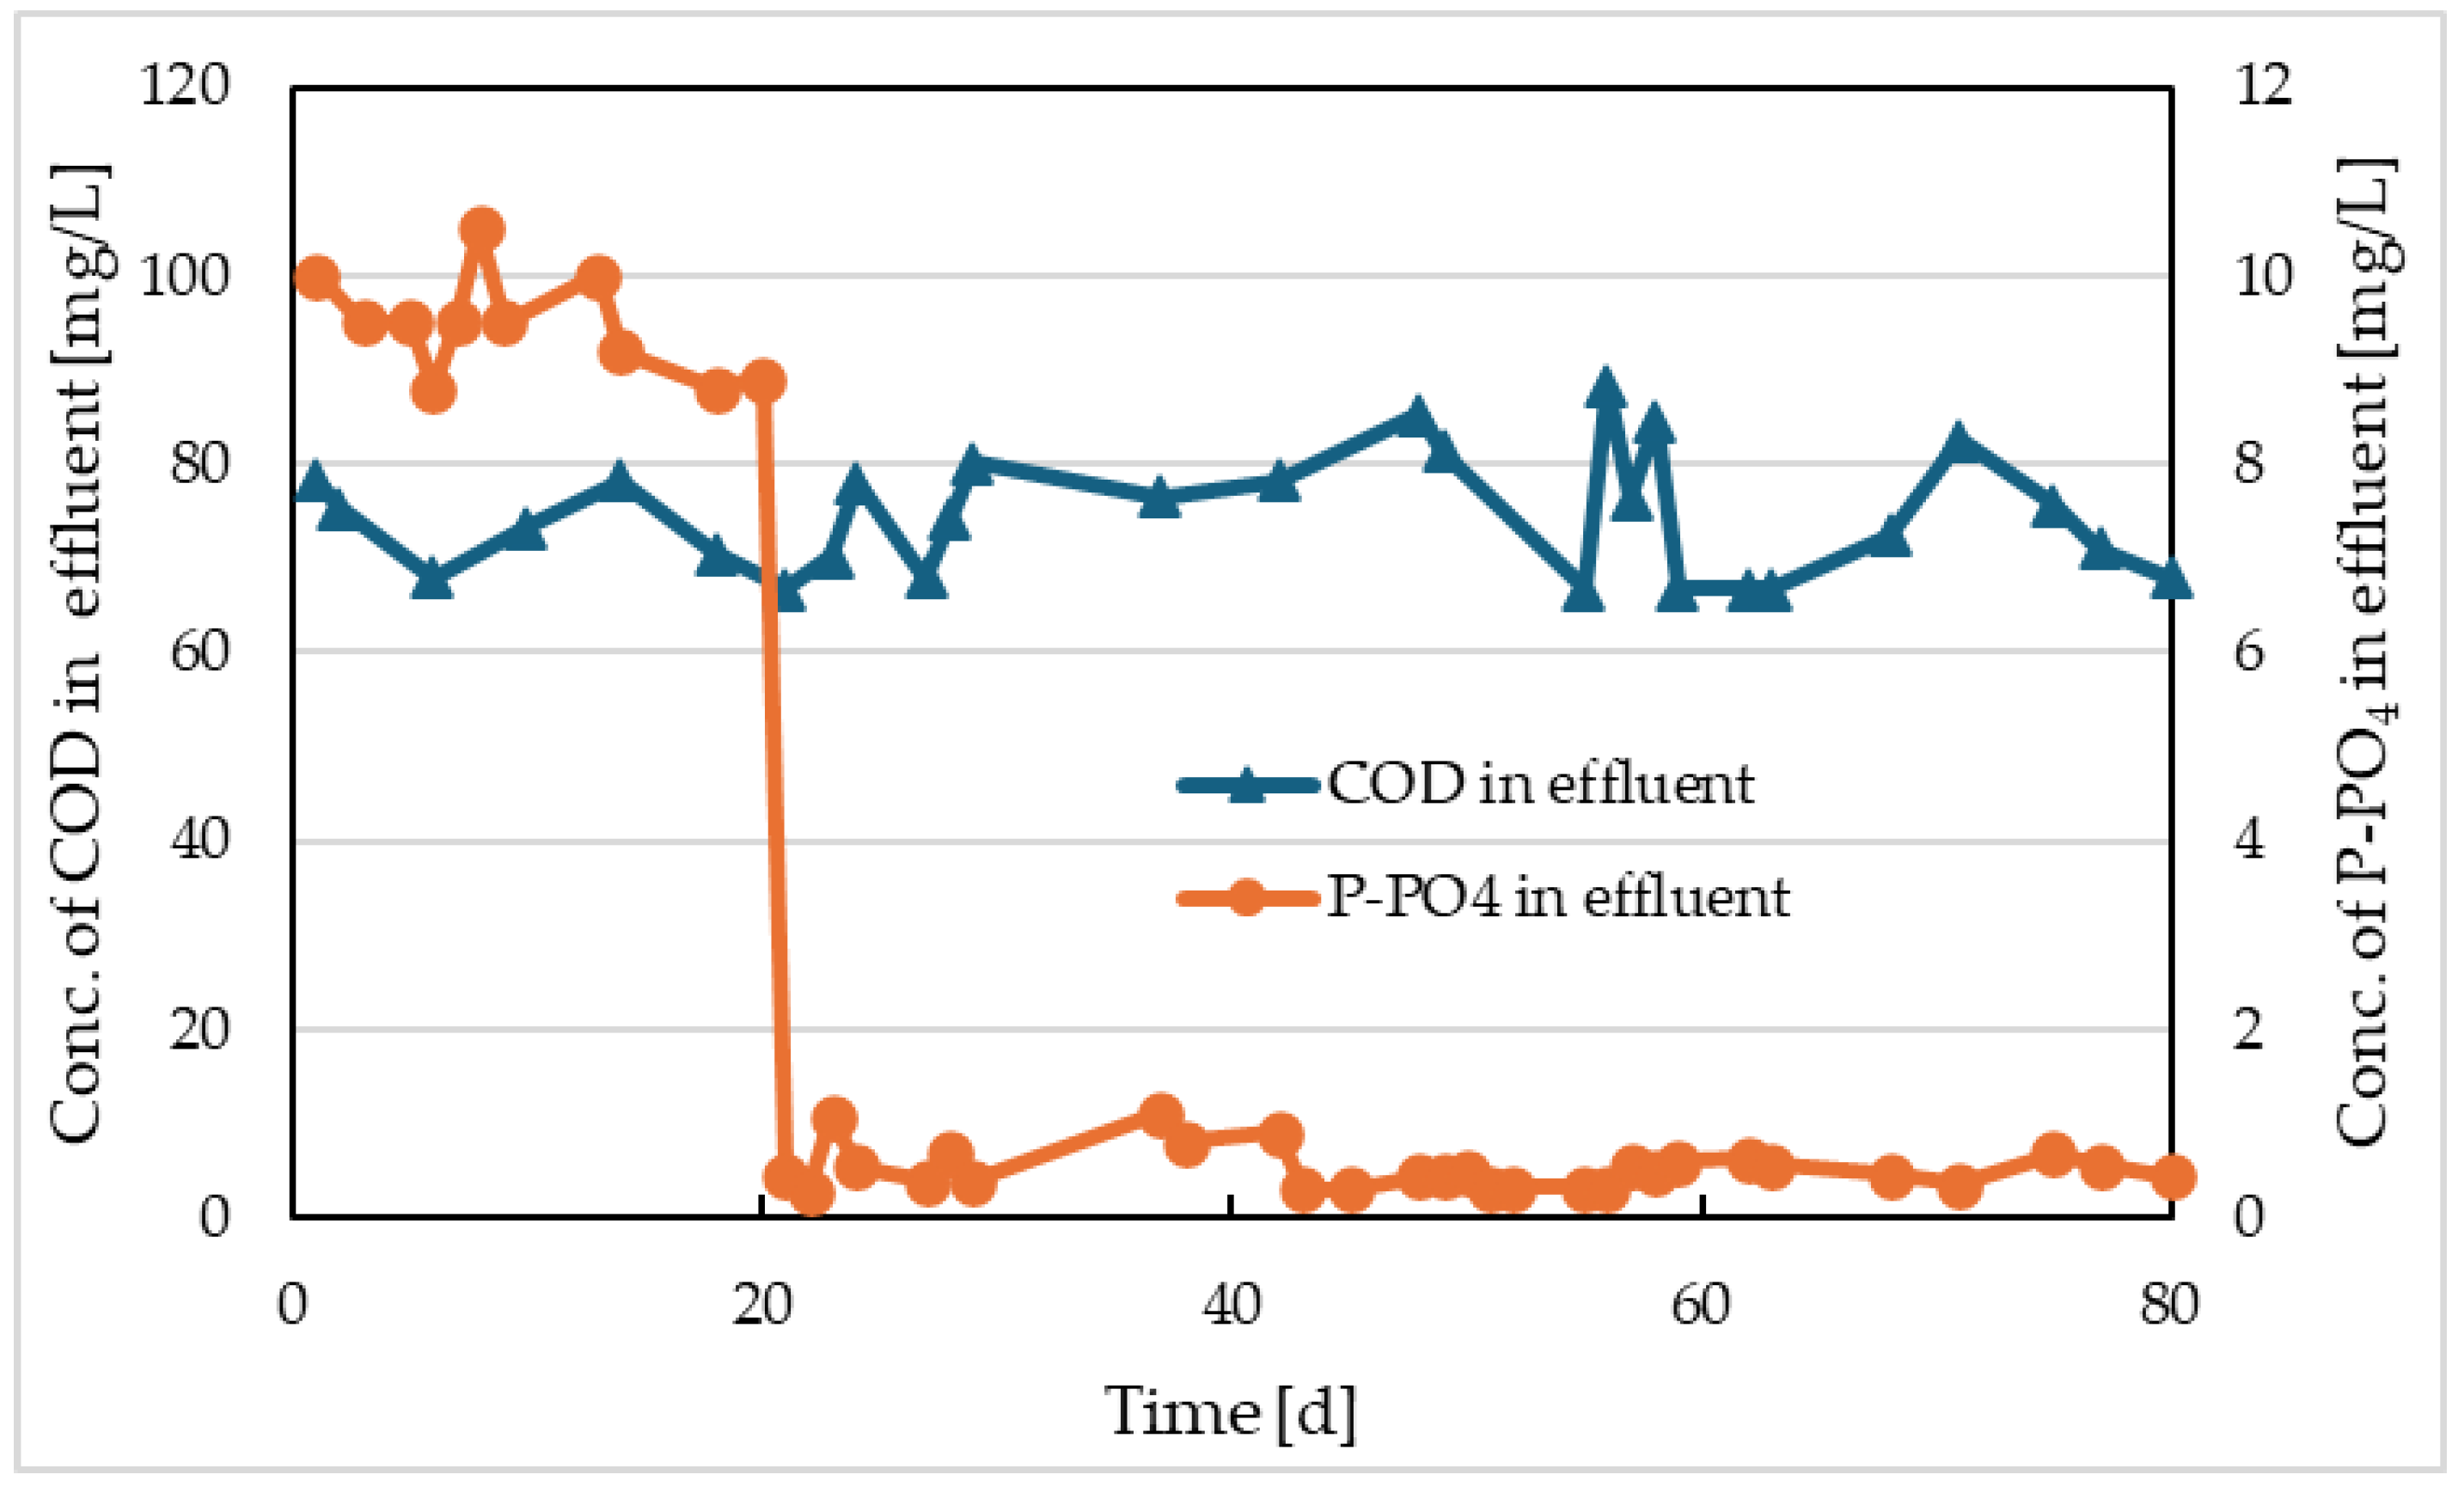
Figure 5.
Values of COD and P-PO4 concentrations at effluent of comparative model.
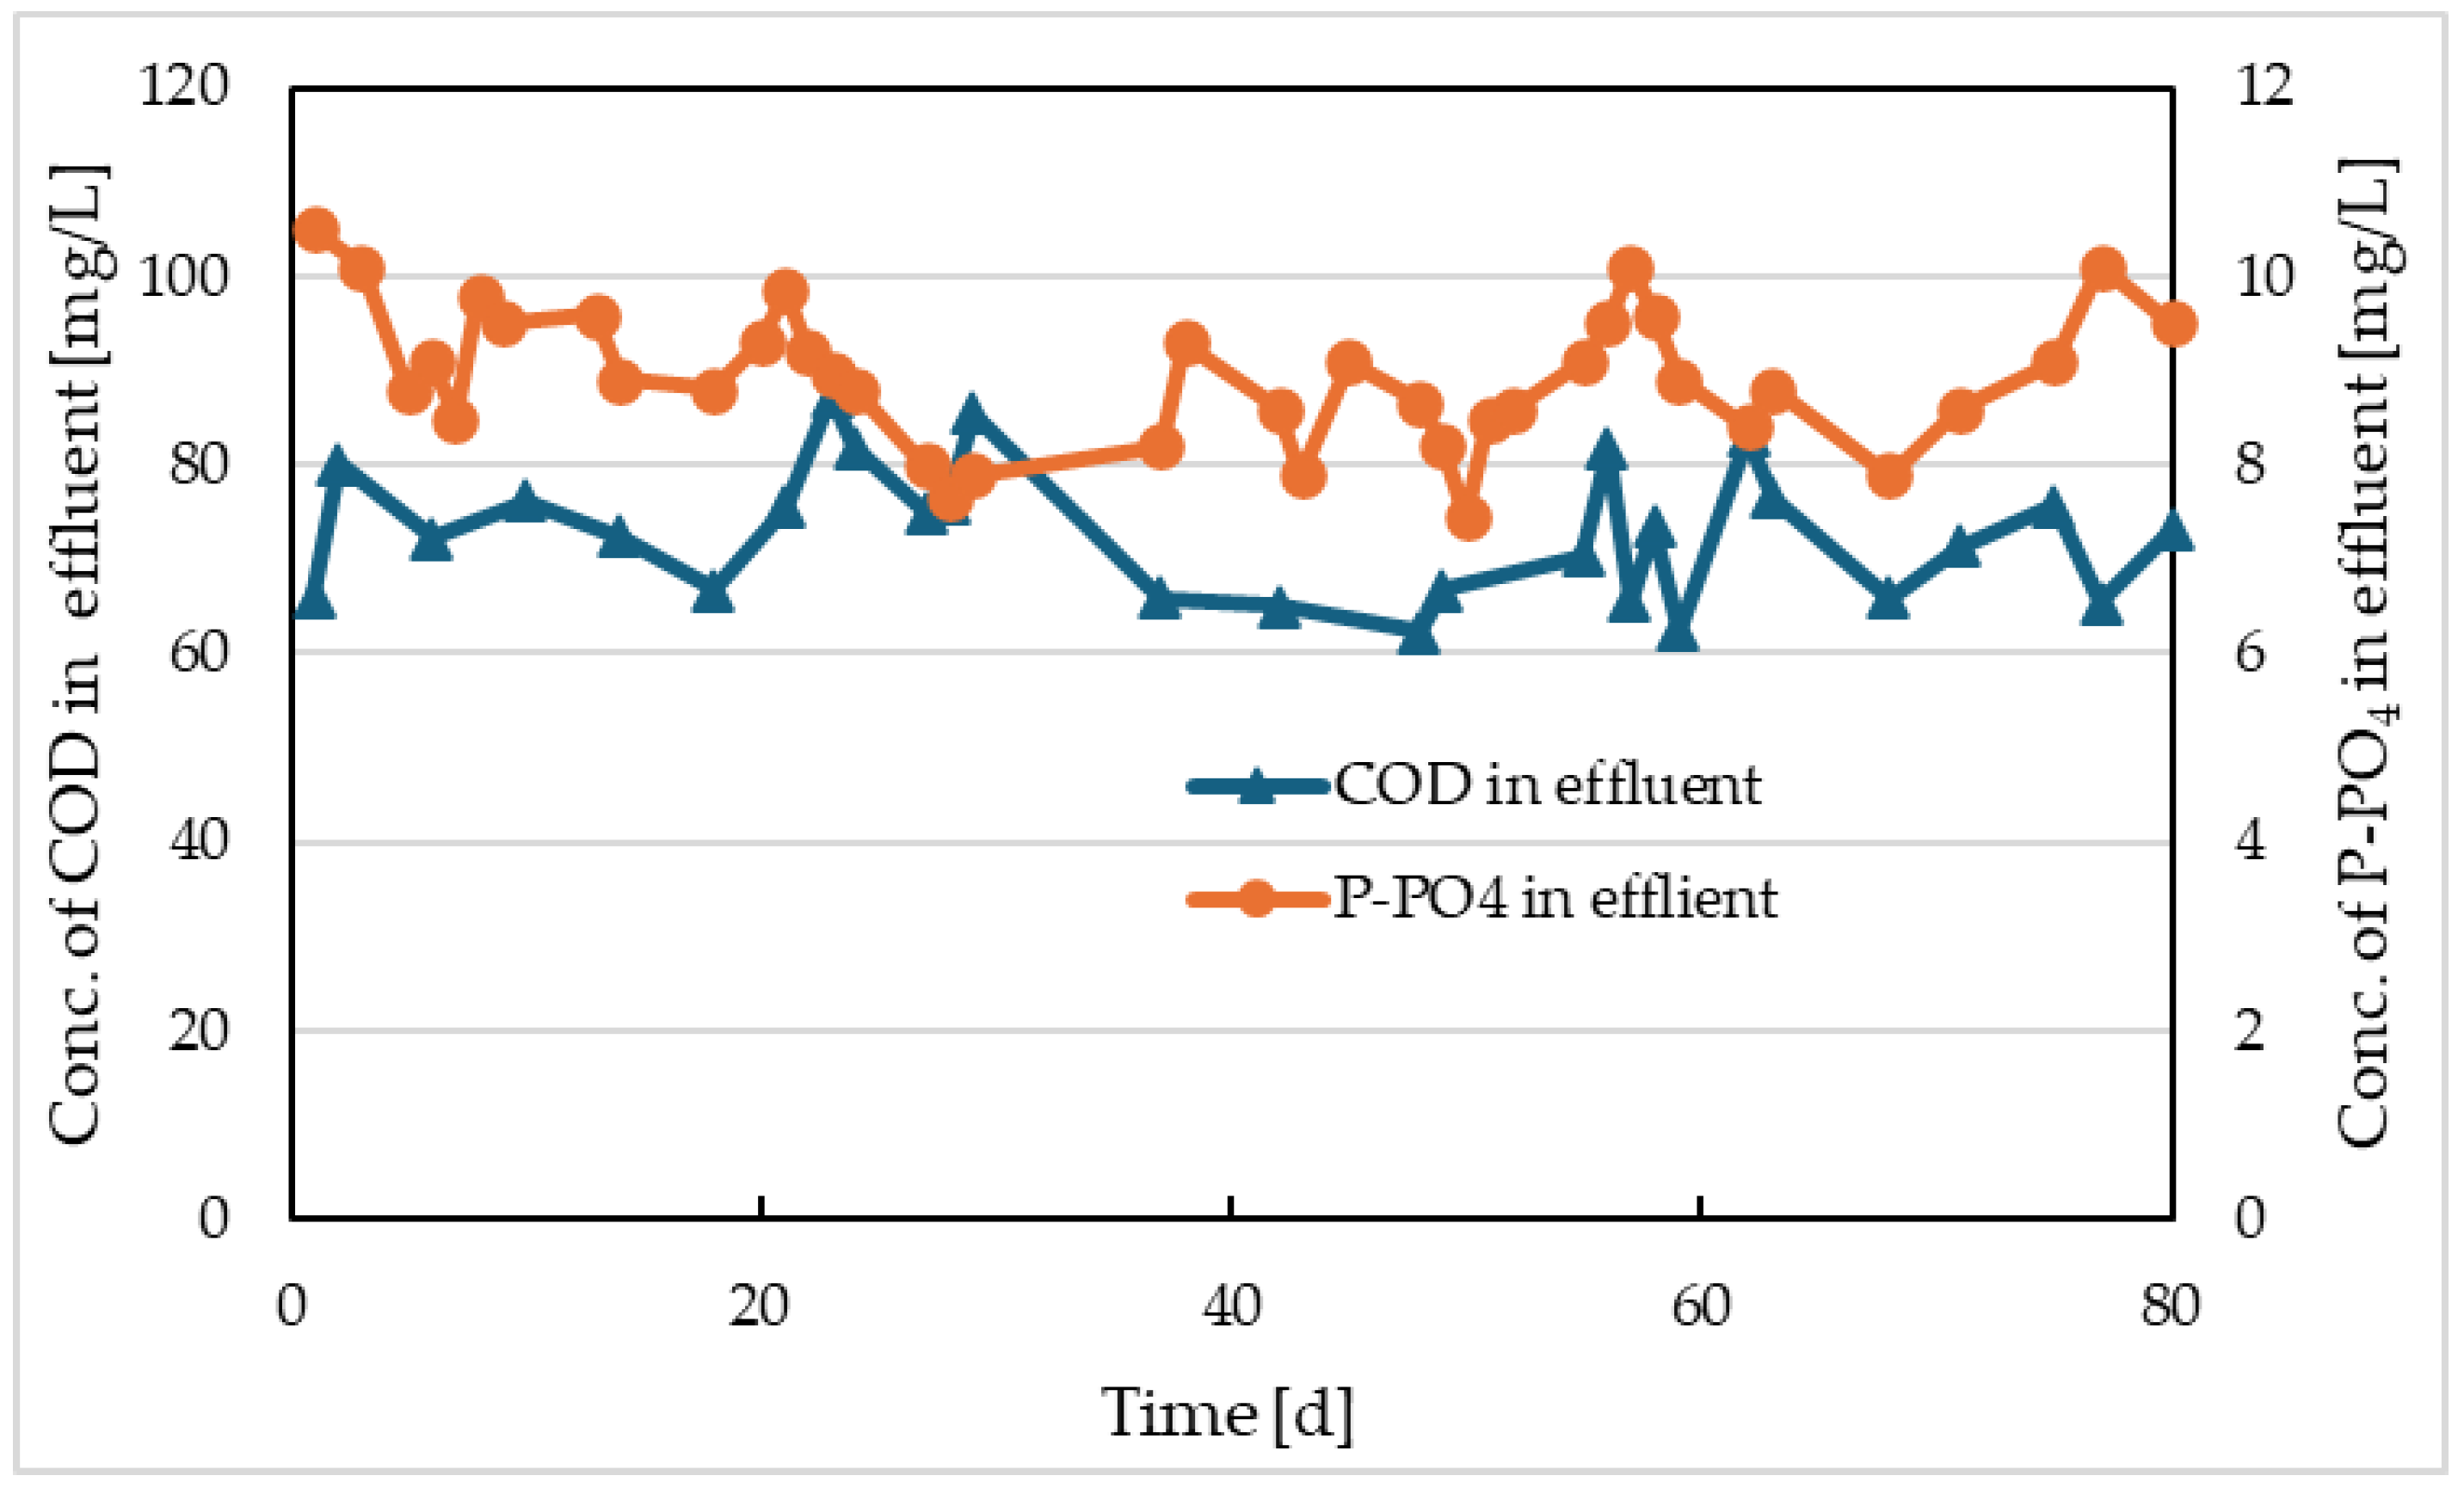
Figure 6.
Development of activated sludge concentration in Reactor I and in comparative model.
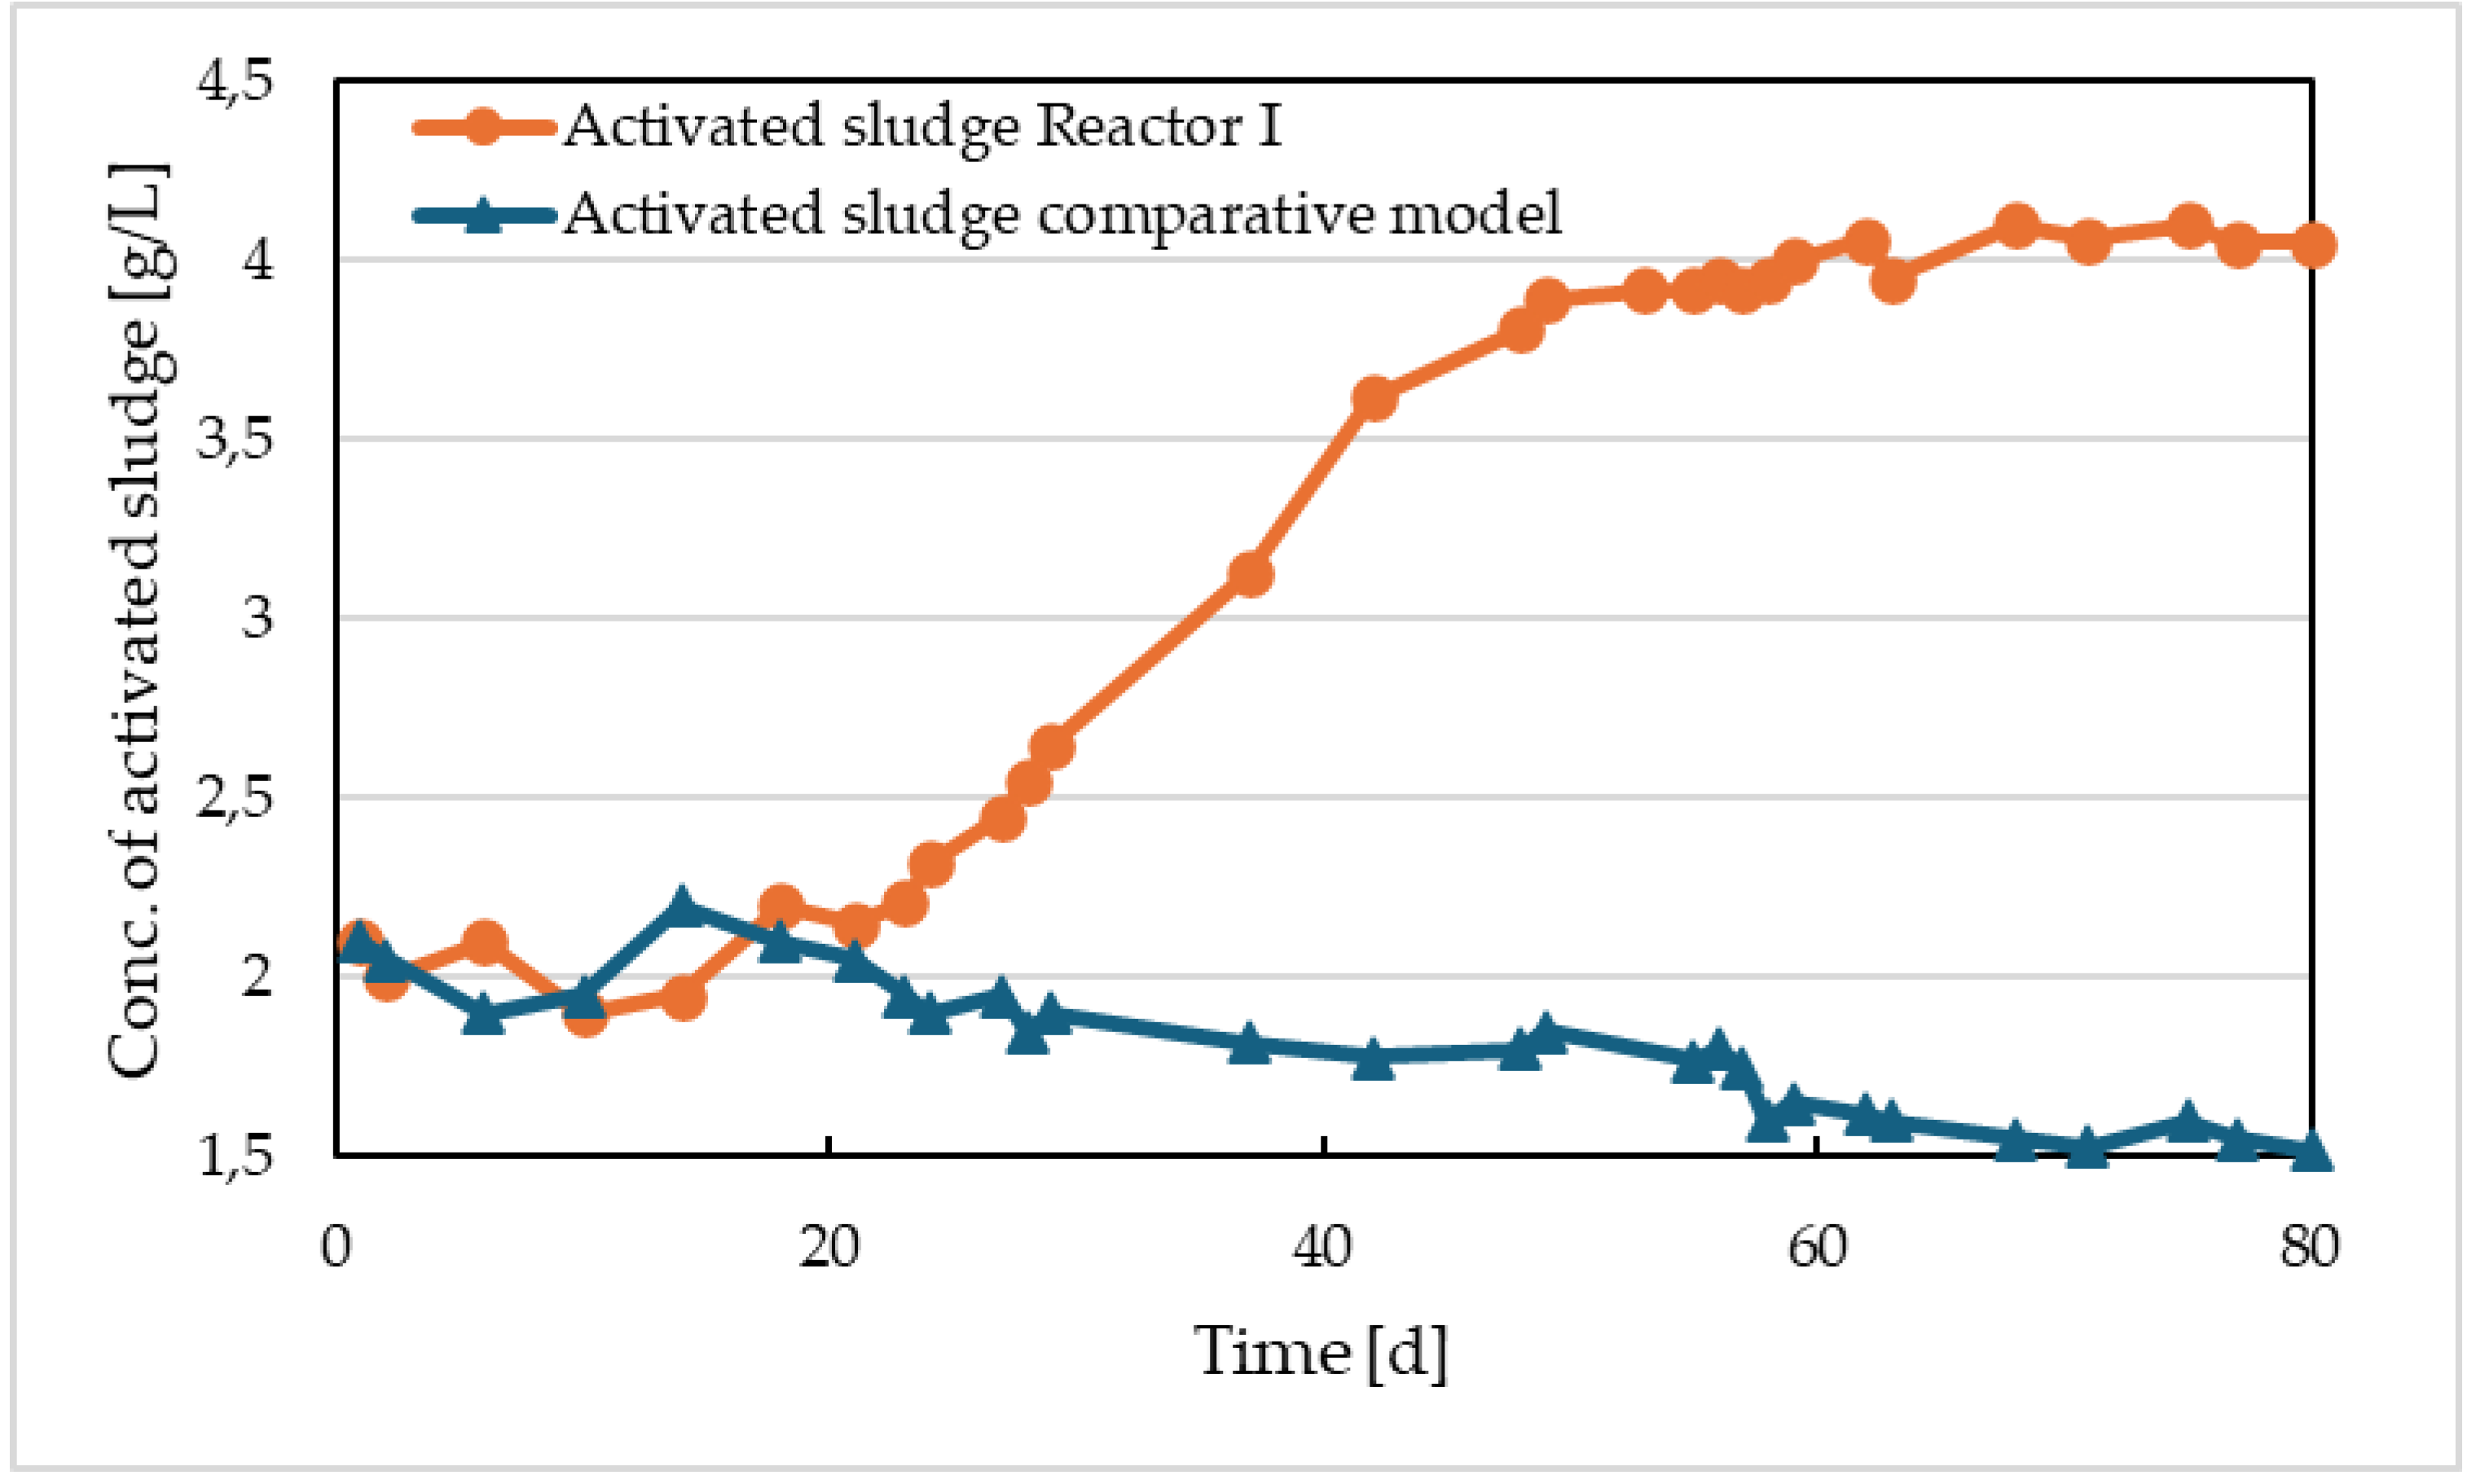
Figure 7.
Sedimentation properties of activated sludge in Reactor I and in comparative model – sludge volume after 30 min sedimentation and SVI.
Figure 7.
Sedimentation properties of activated sludge in Reactor I and in comparative model – sludge volume after 30 min sedimentation and SVI.
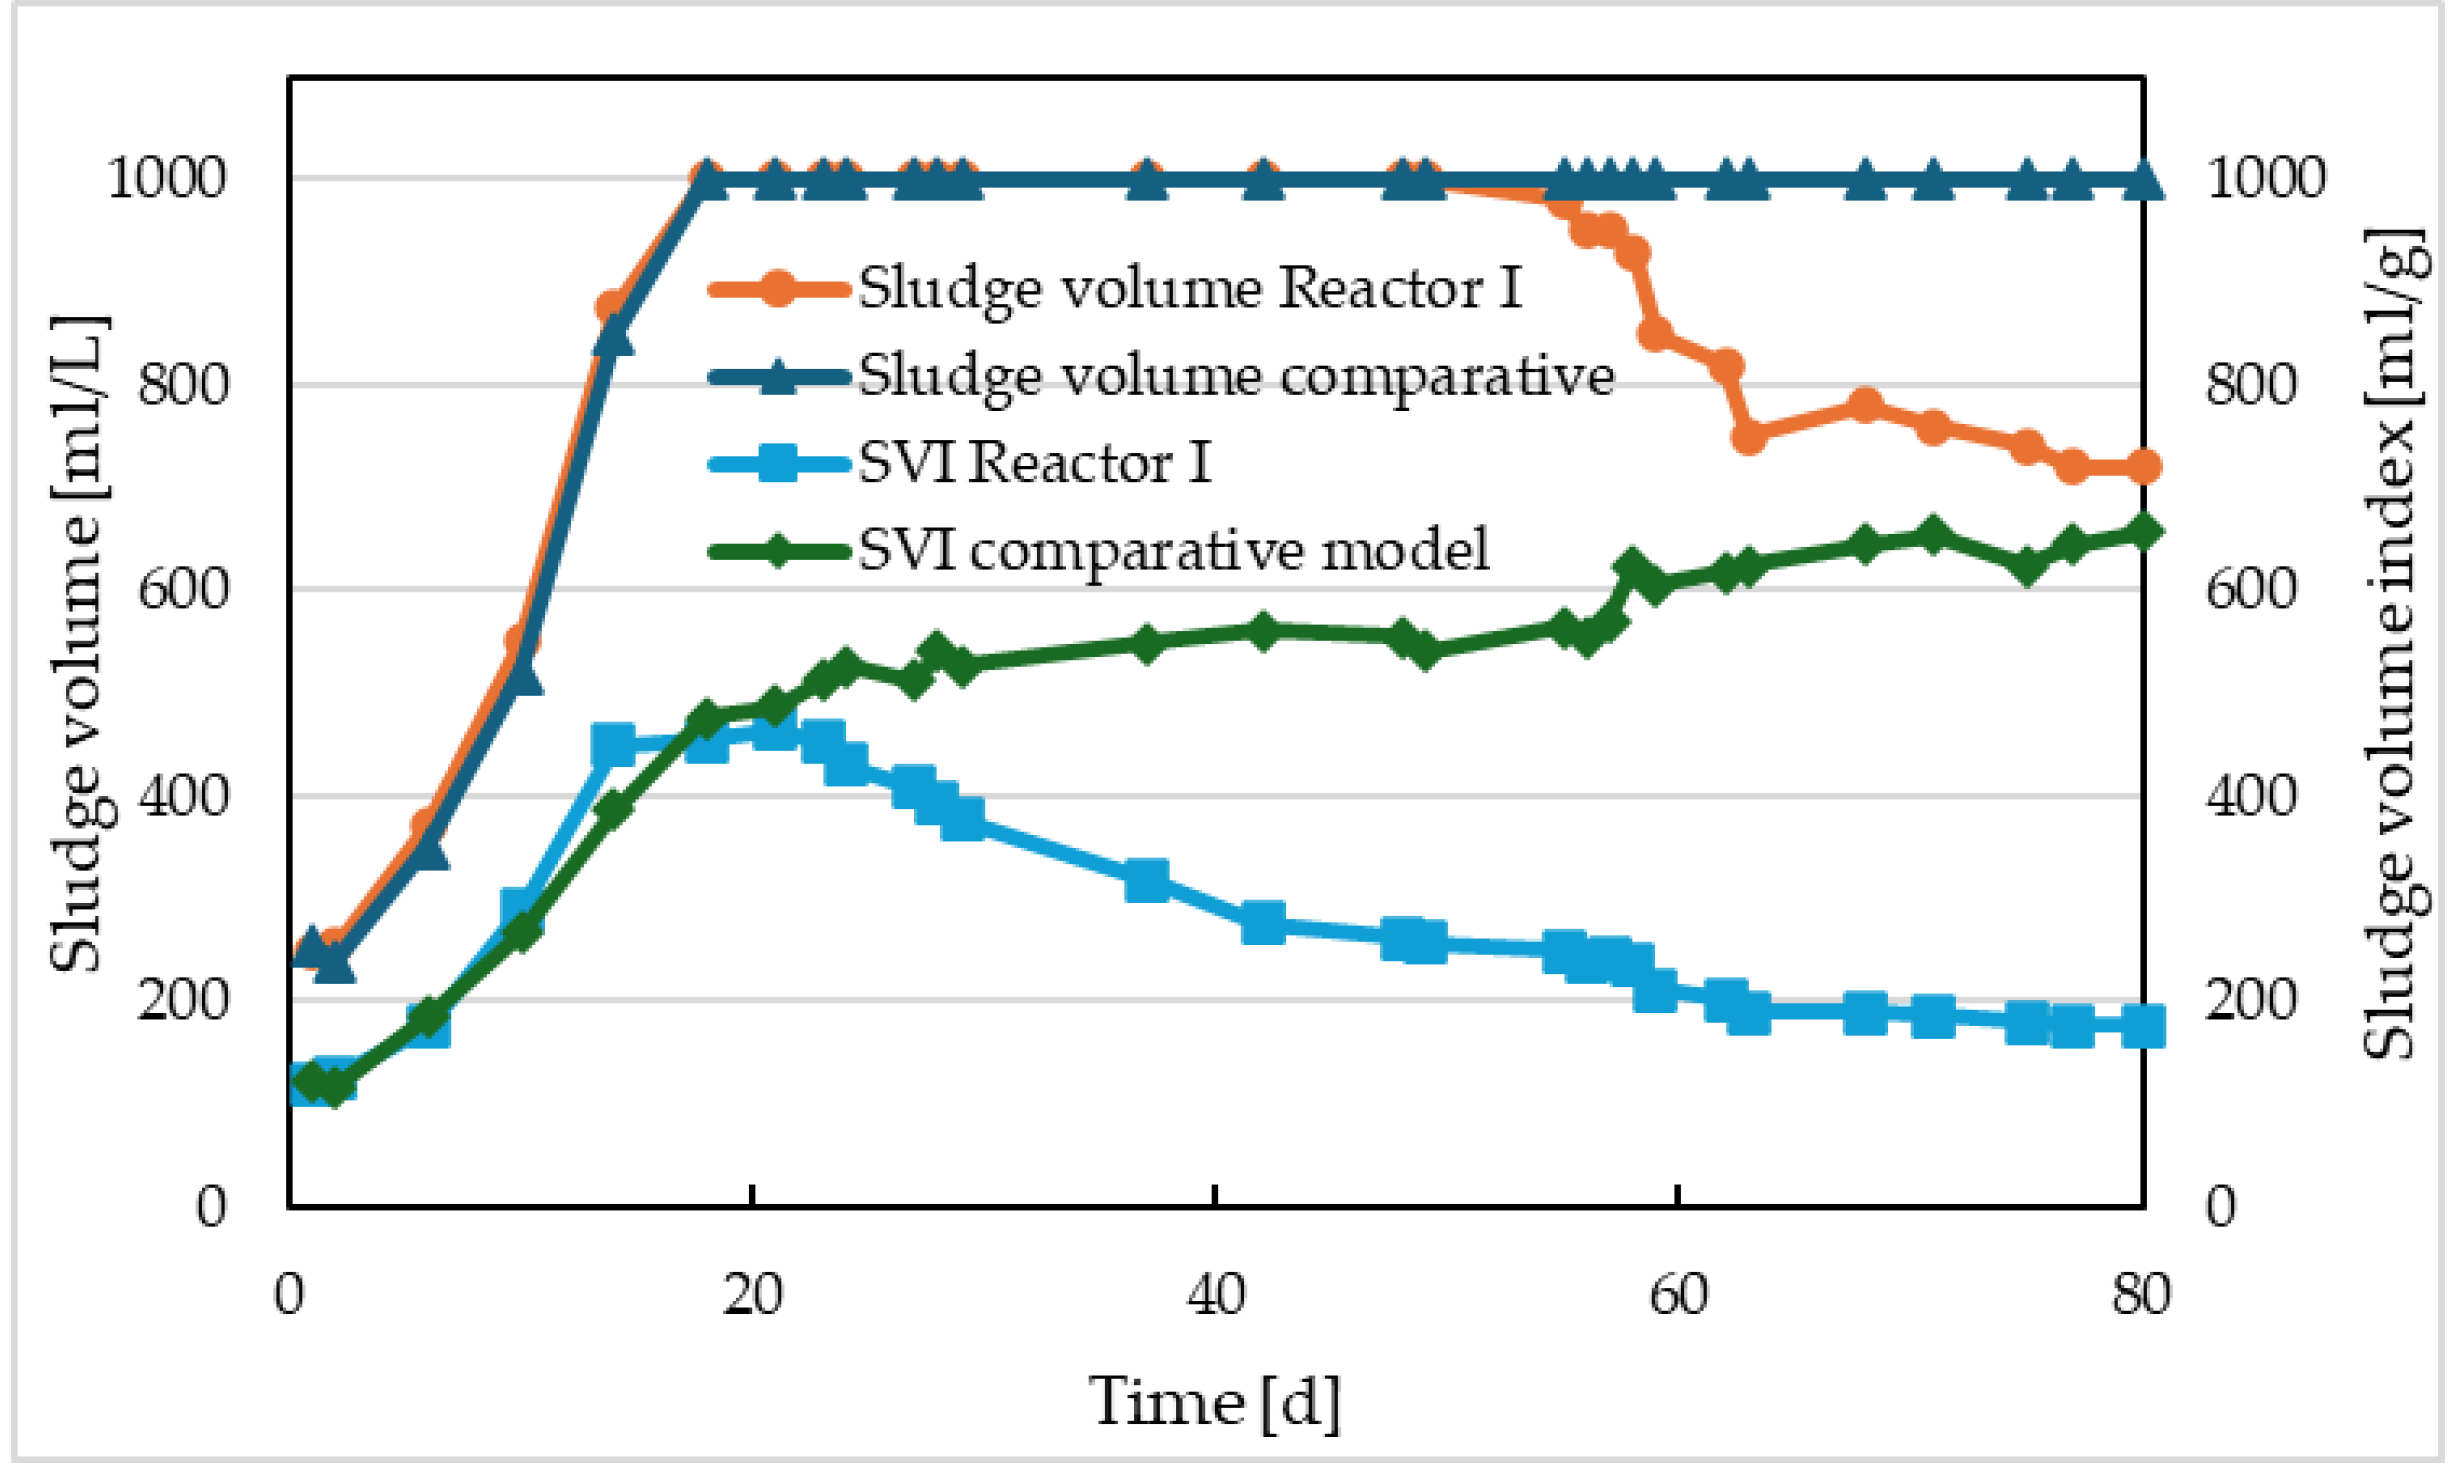
Figure 8.
Values of COD and P-PO4 concentrations at effluent of Reactor II.
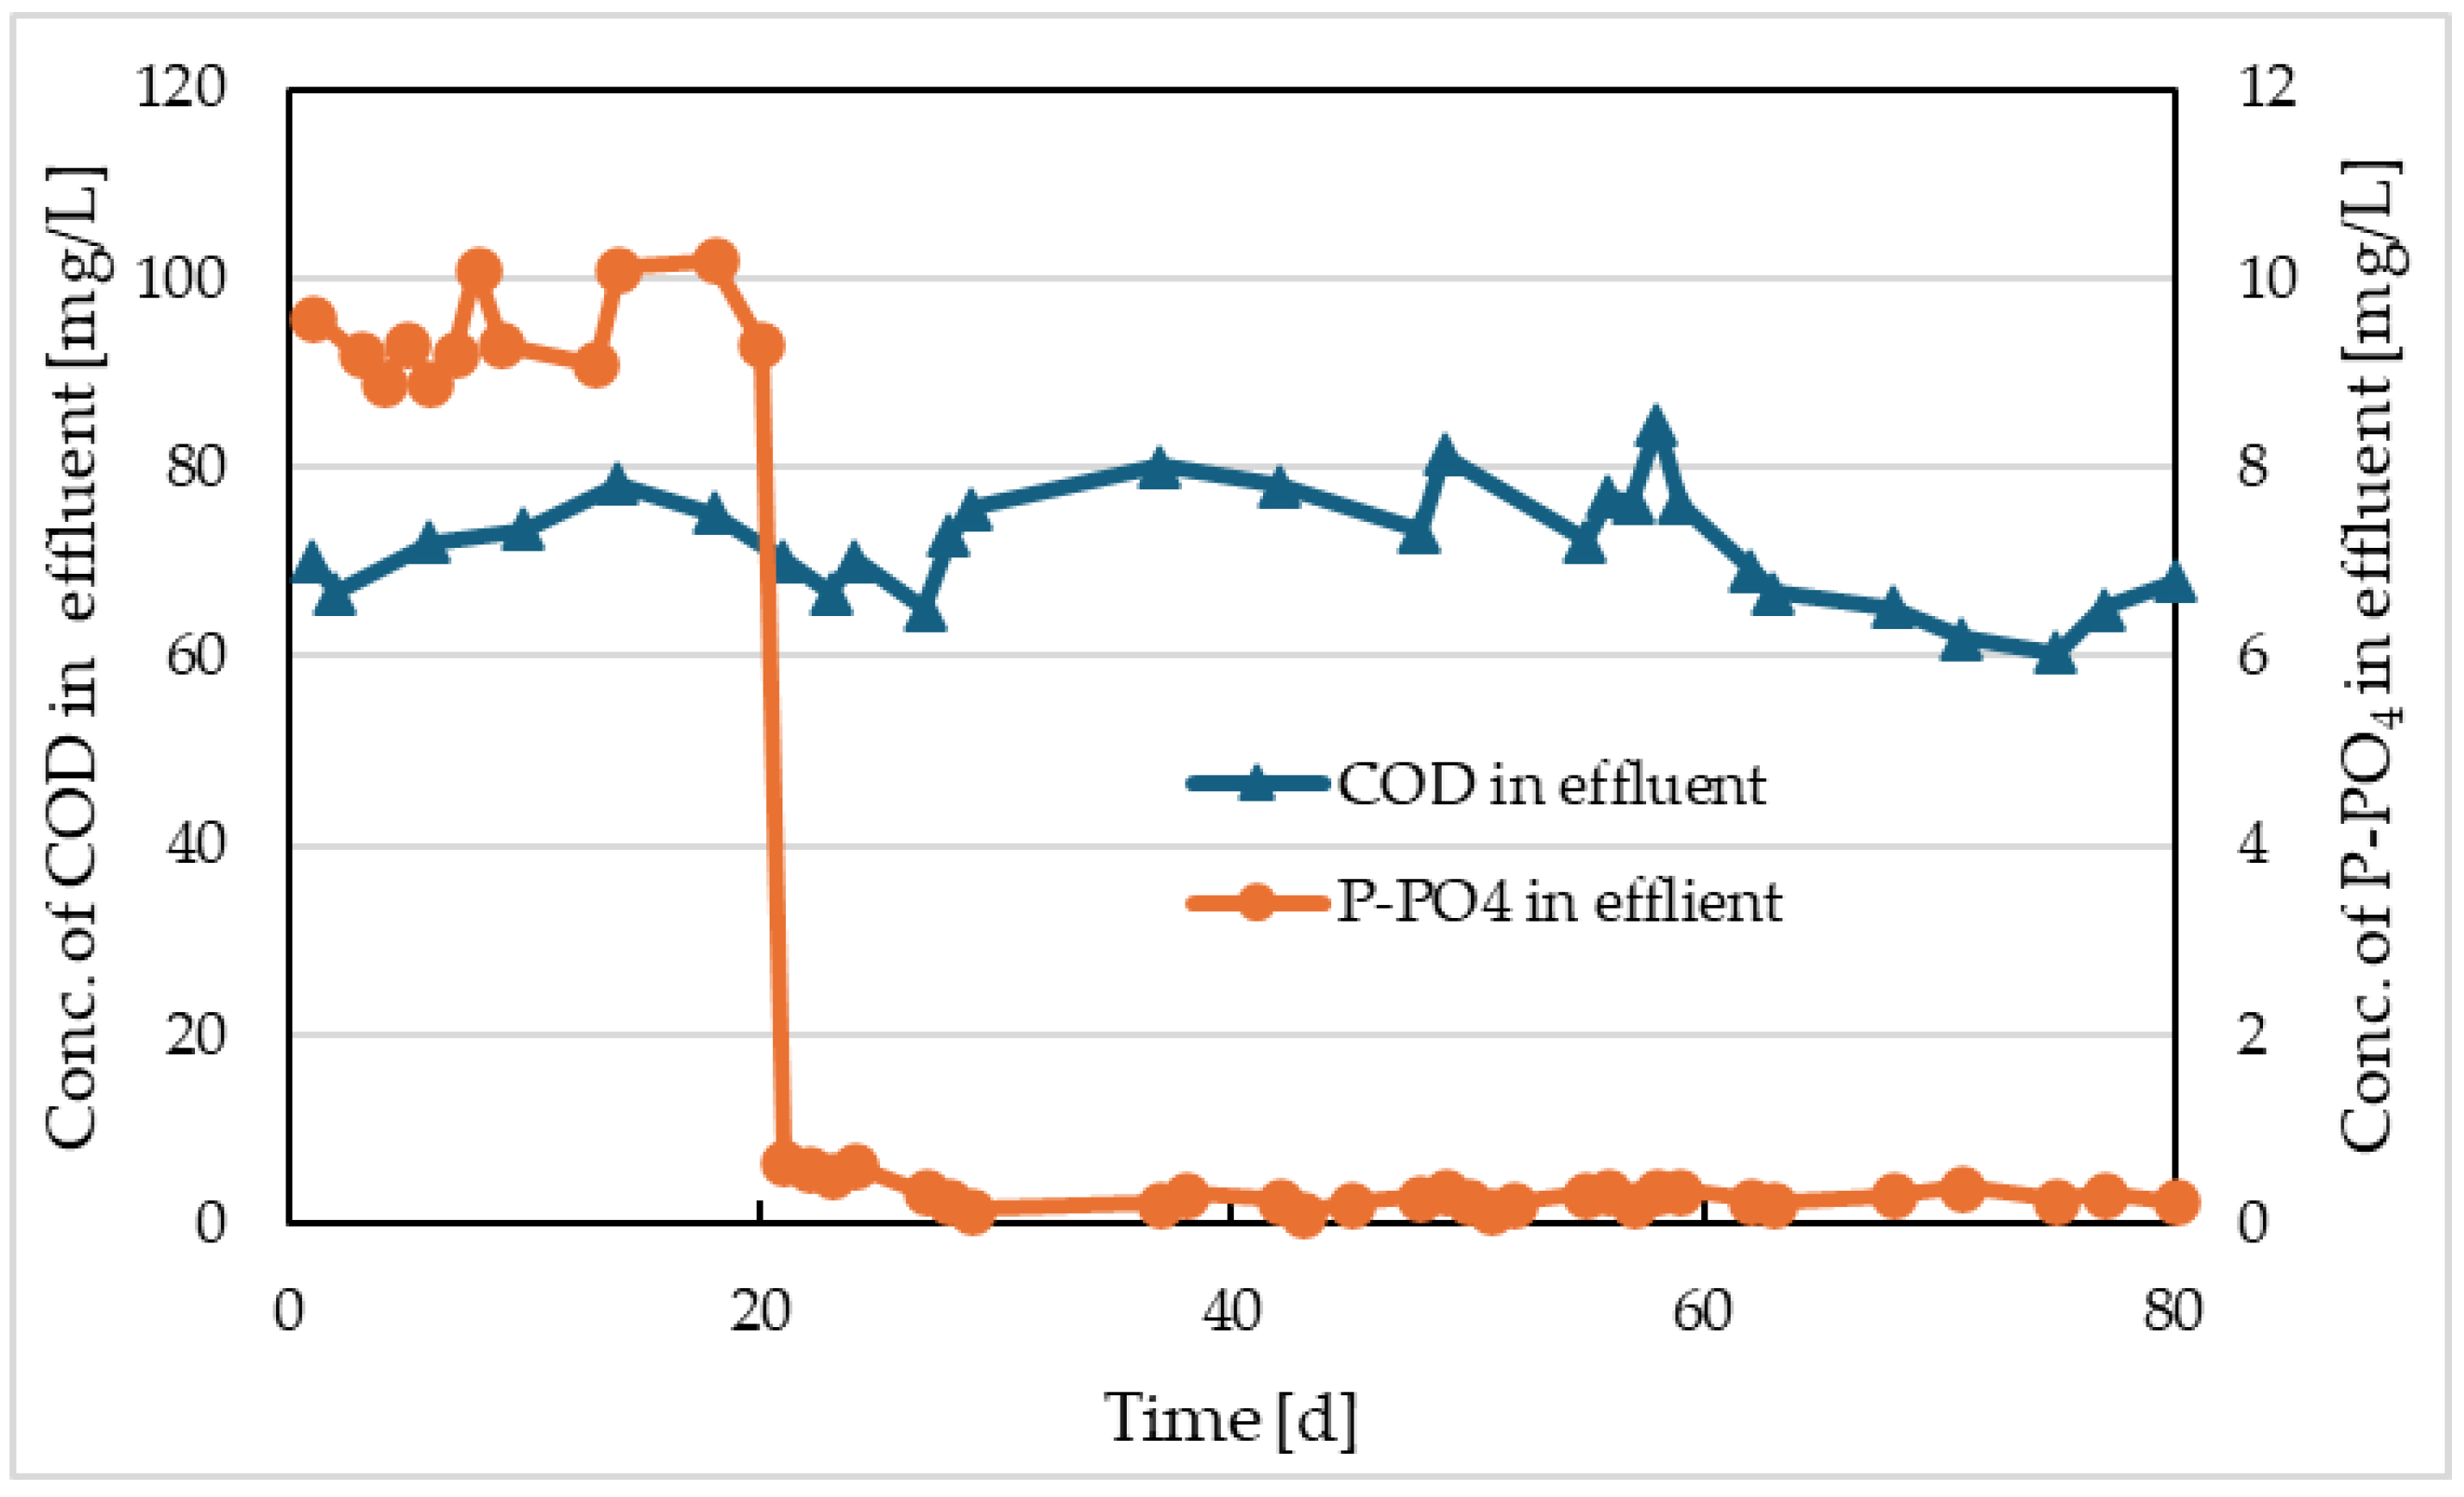
Figure 9.
Values of COD and P-PO4 concentrations at effluent of comparative reactor with Prefloc dosing.
Figure 9.
Values of COD and P-PO4 concentrations at effluent of comparative reactor with Prefloc dosing.
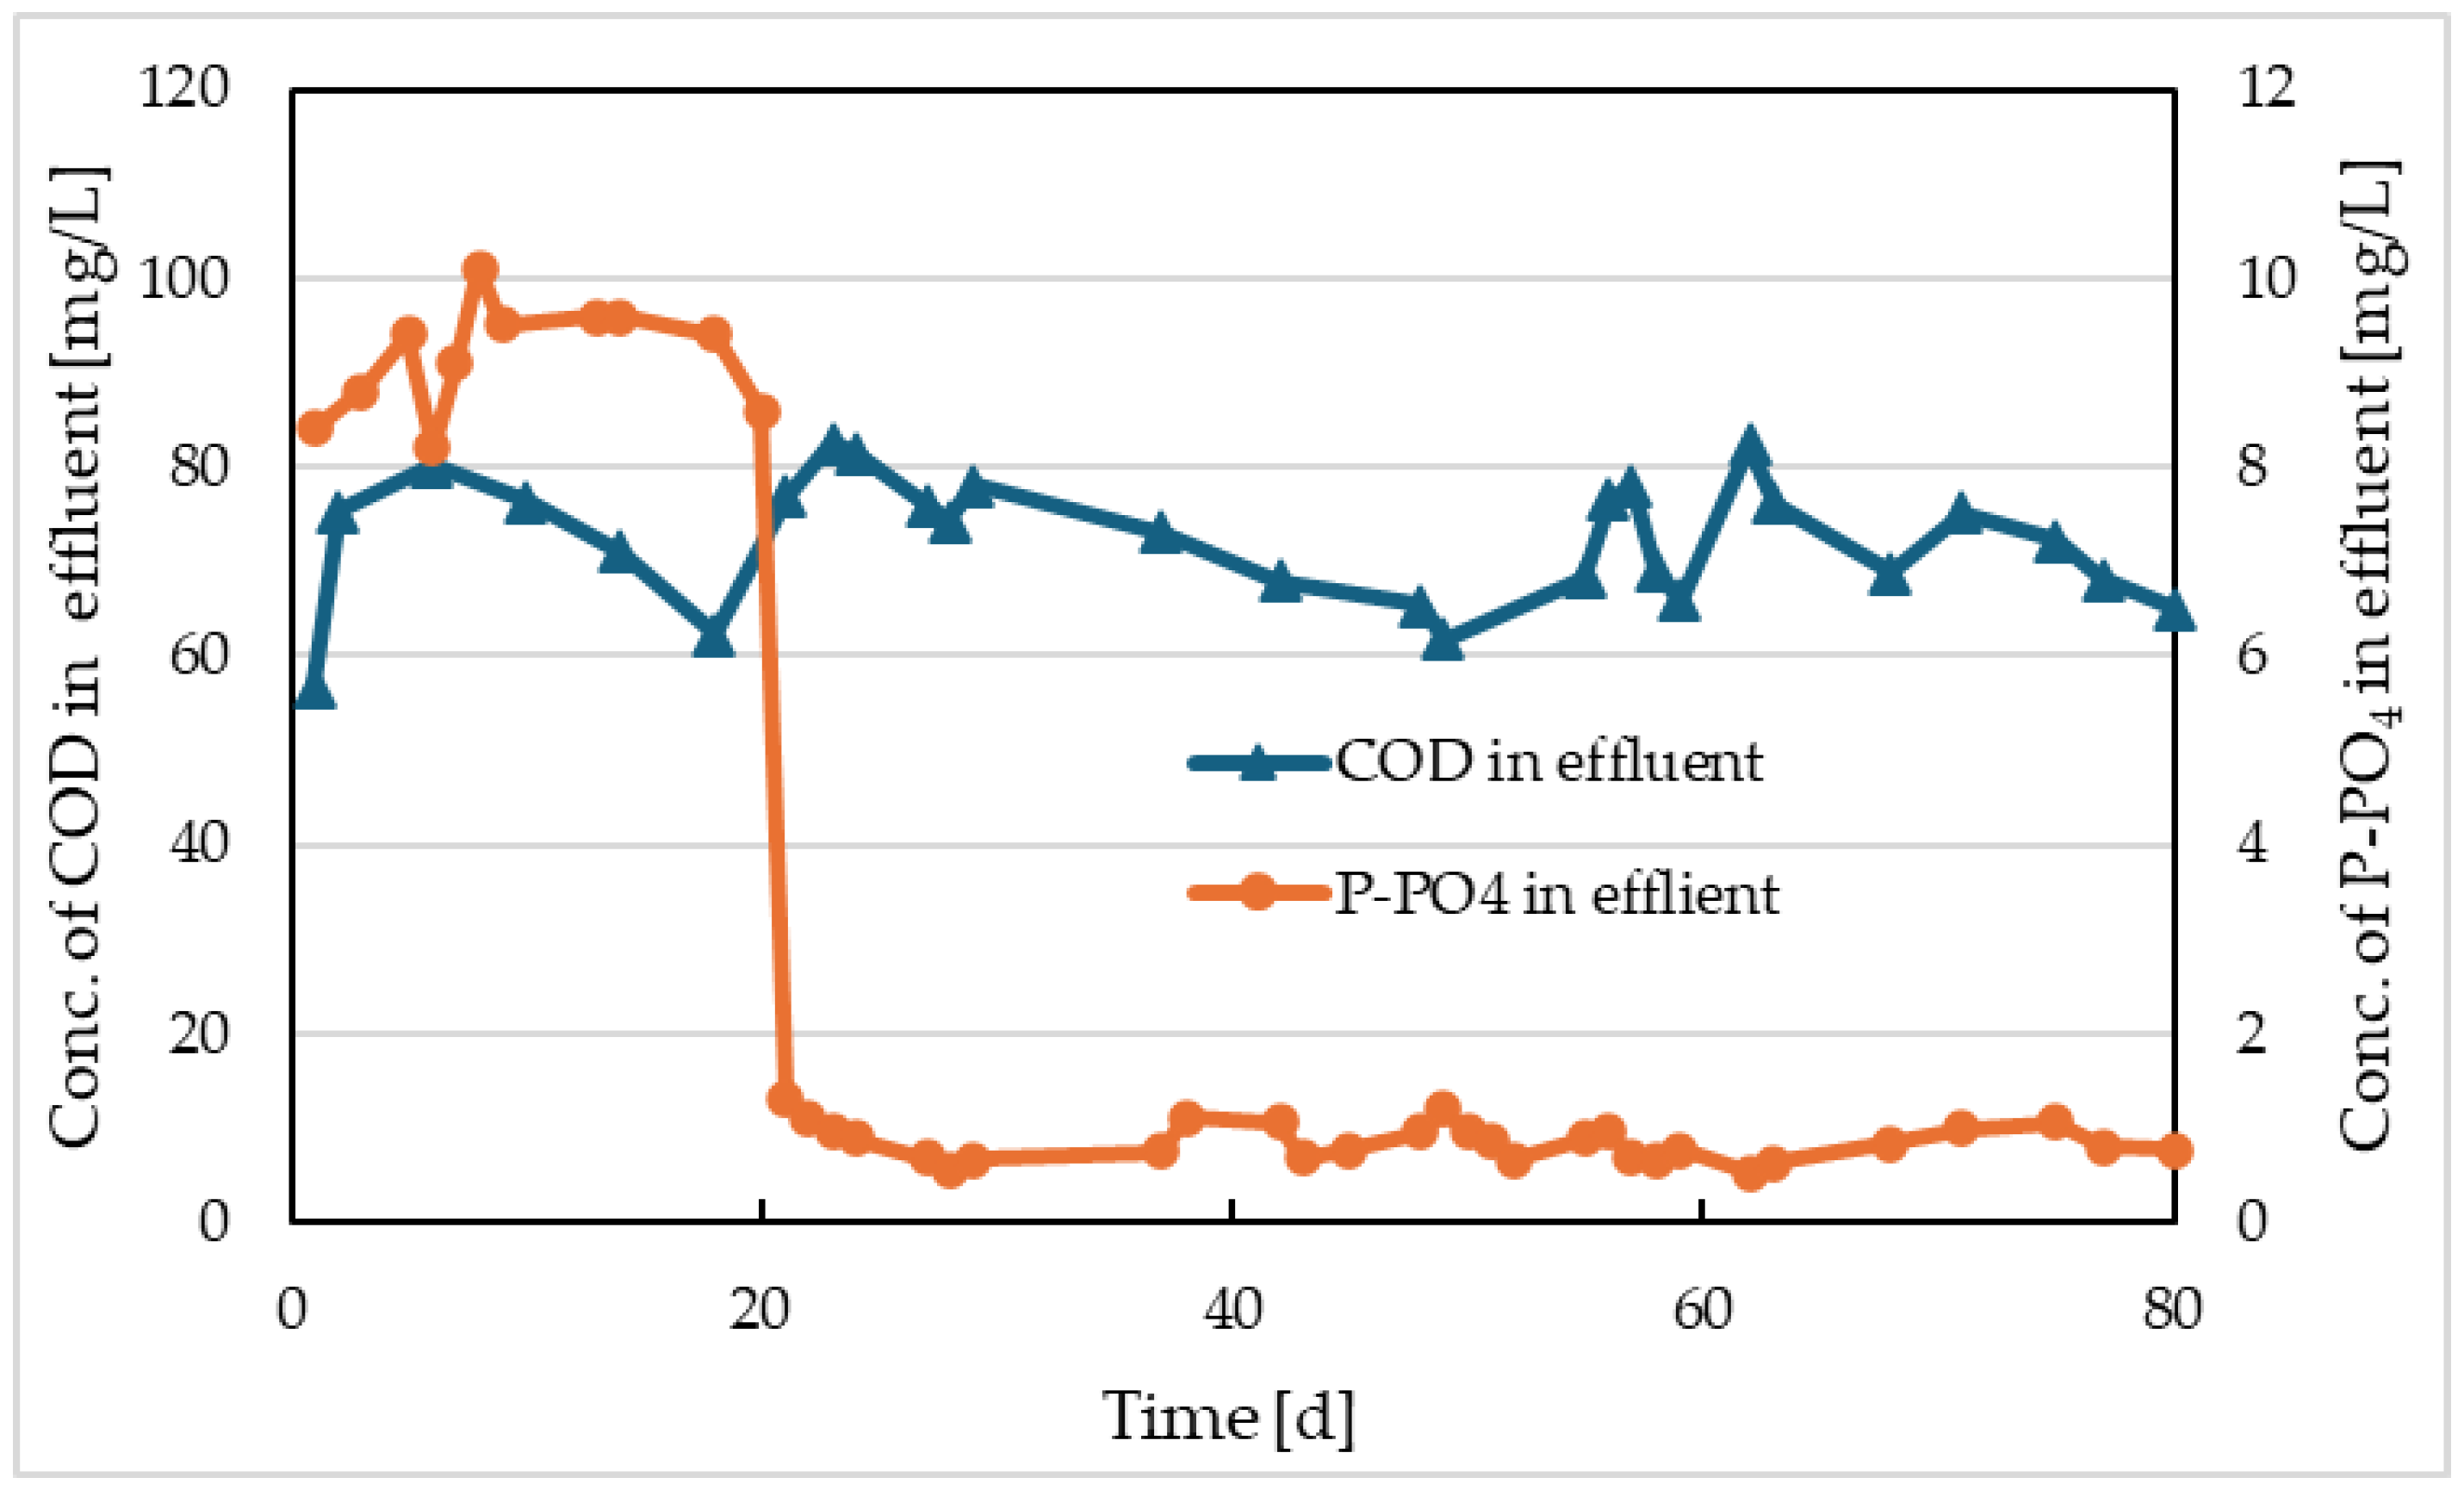
Figure 10.
Concentration of activated sludge in the Reactor II and in comparative model with dosing of Prefloc.
Figure 10.
Concentration of activated sludge in the Reactor II and in comparative model with dosing of Prefloc.
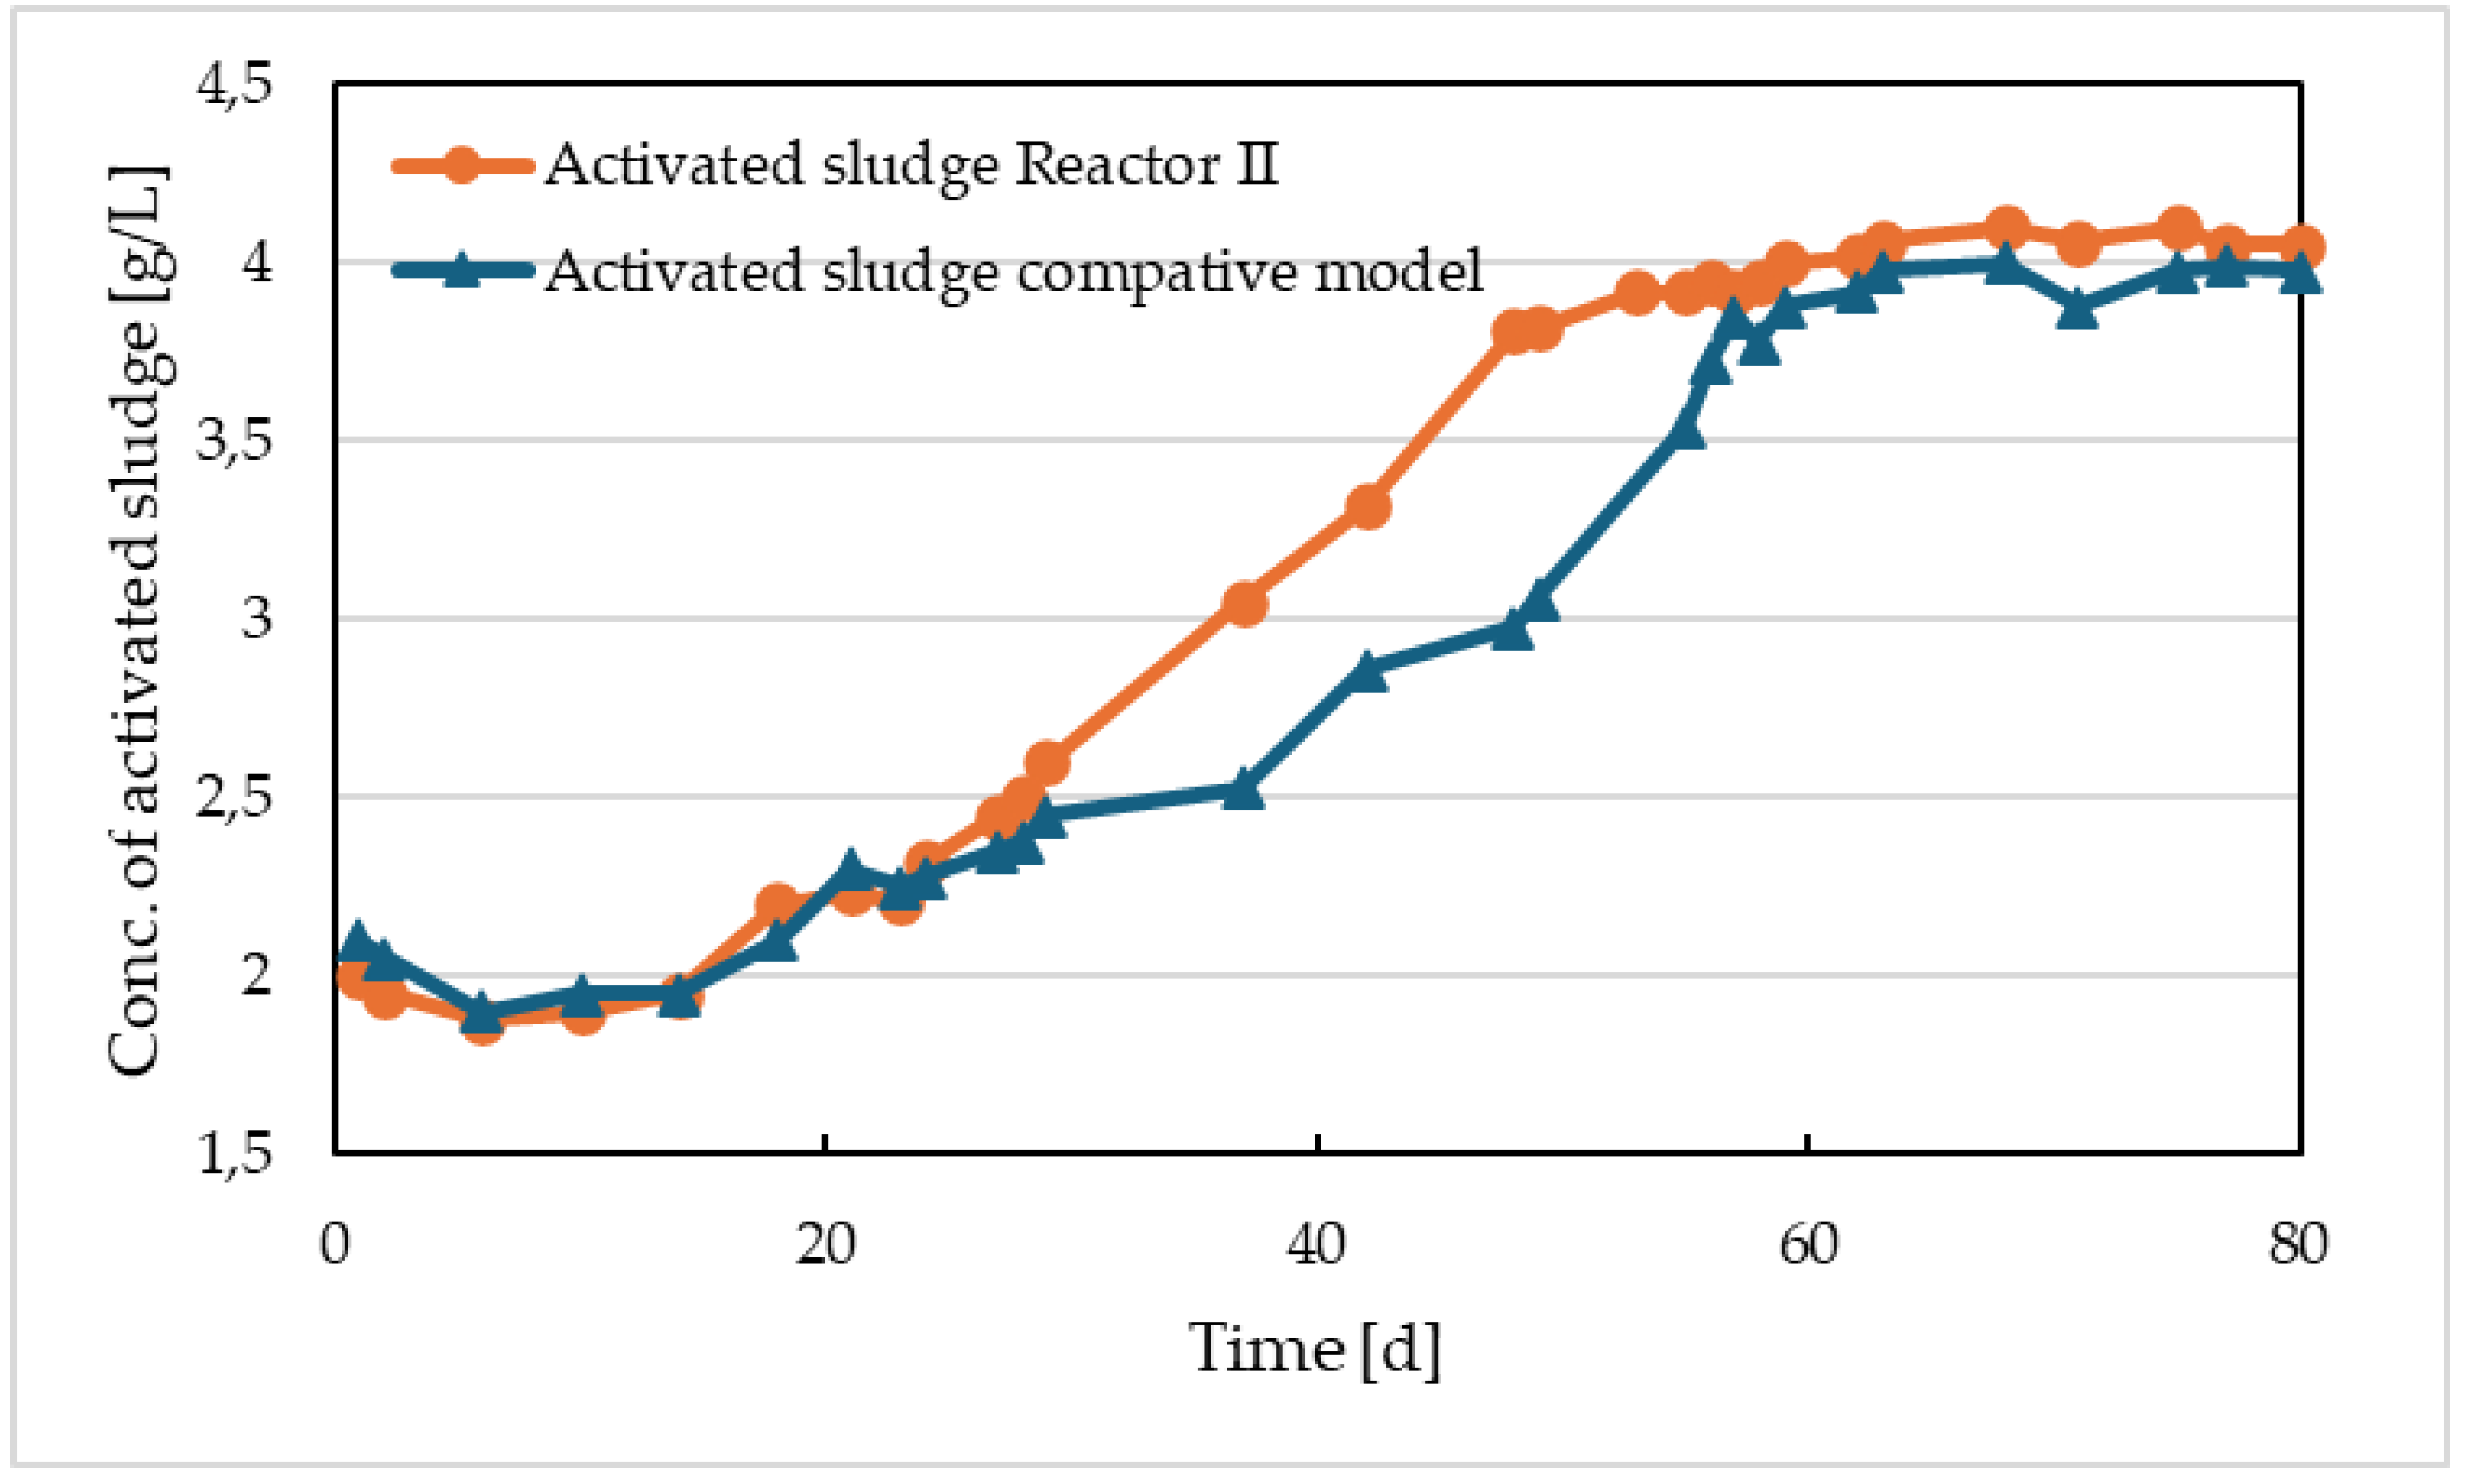
Figure 11.
Sedimentation properties of activated sludge in Reactor II and in comparative model with dosing of Prefloc – sludge volume after 30 min sedimentation and SVI.
Figure 11.
Sedimentation properties of activated sludge in Reactor II and in comparative model with dosing of Prefloc – sludge volume after 30 min sedimentation and SVI.
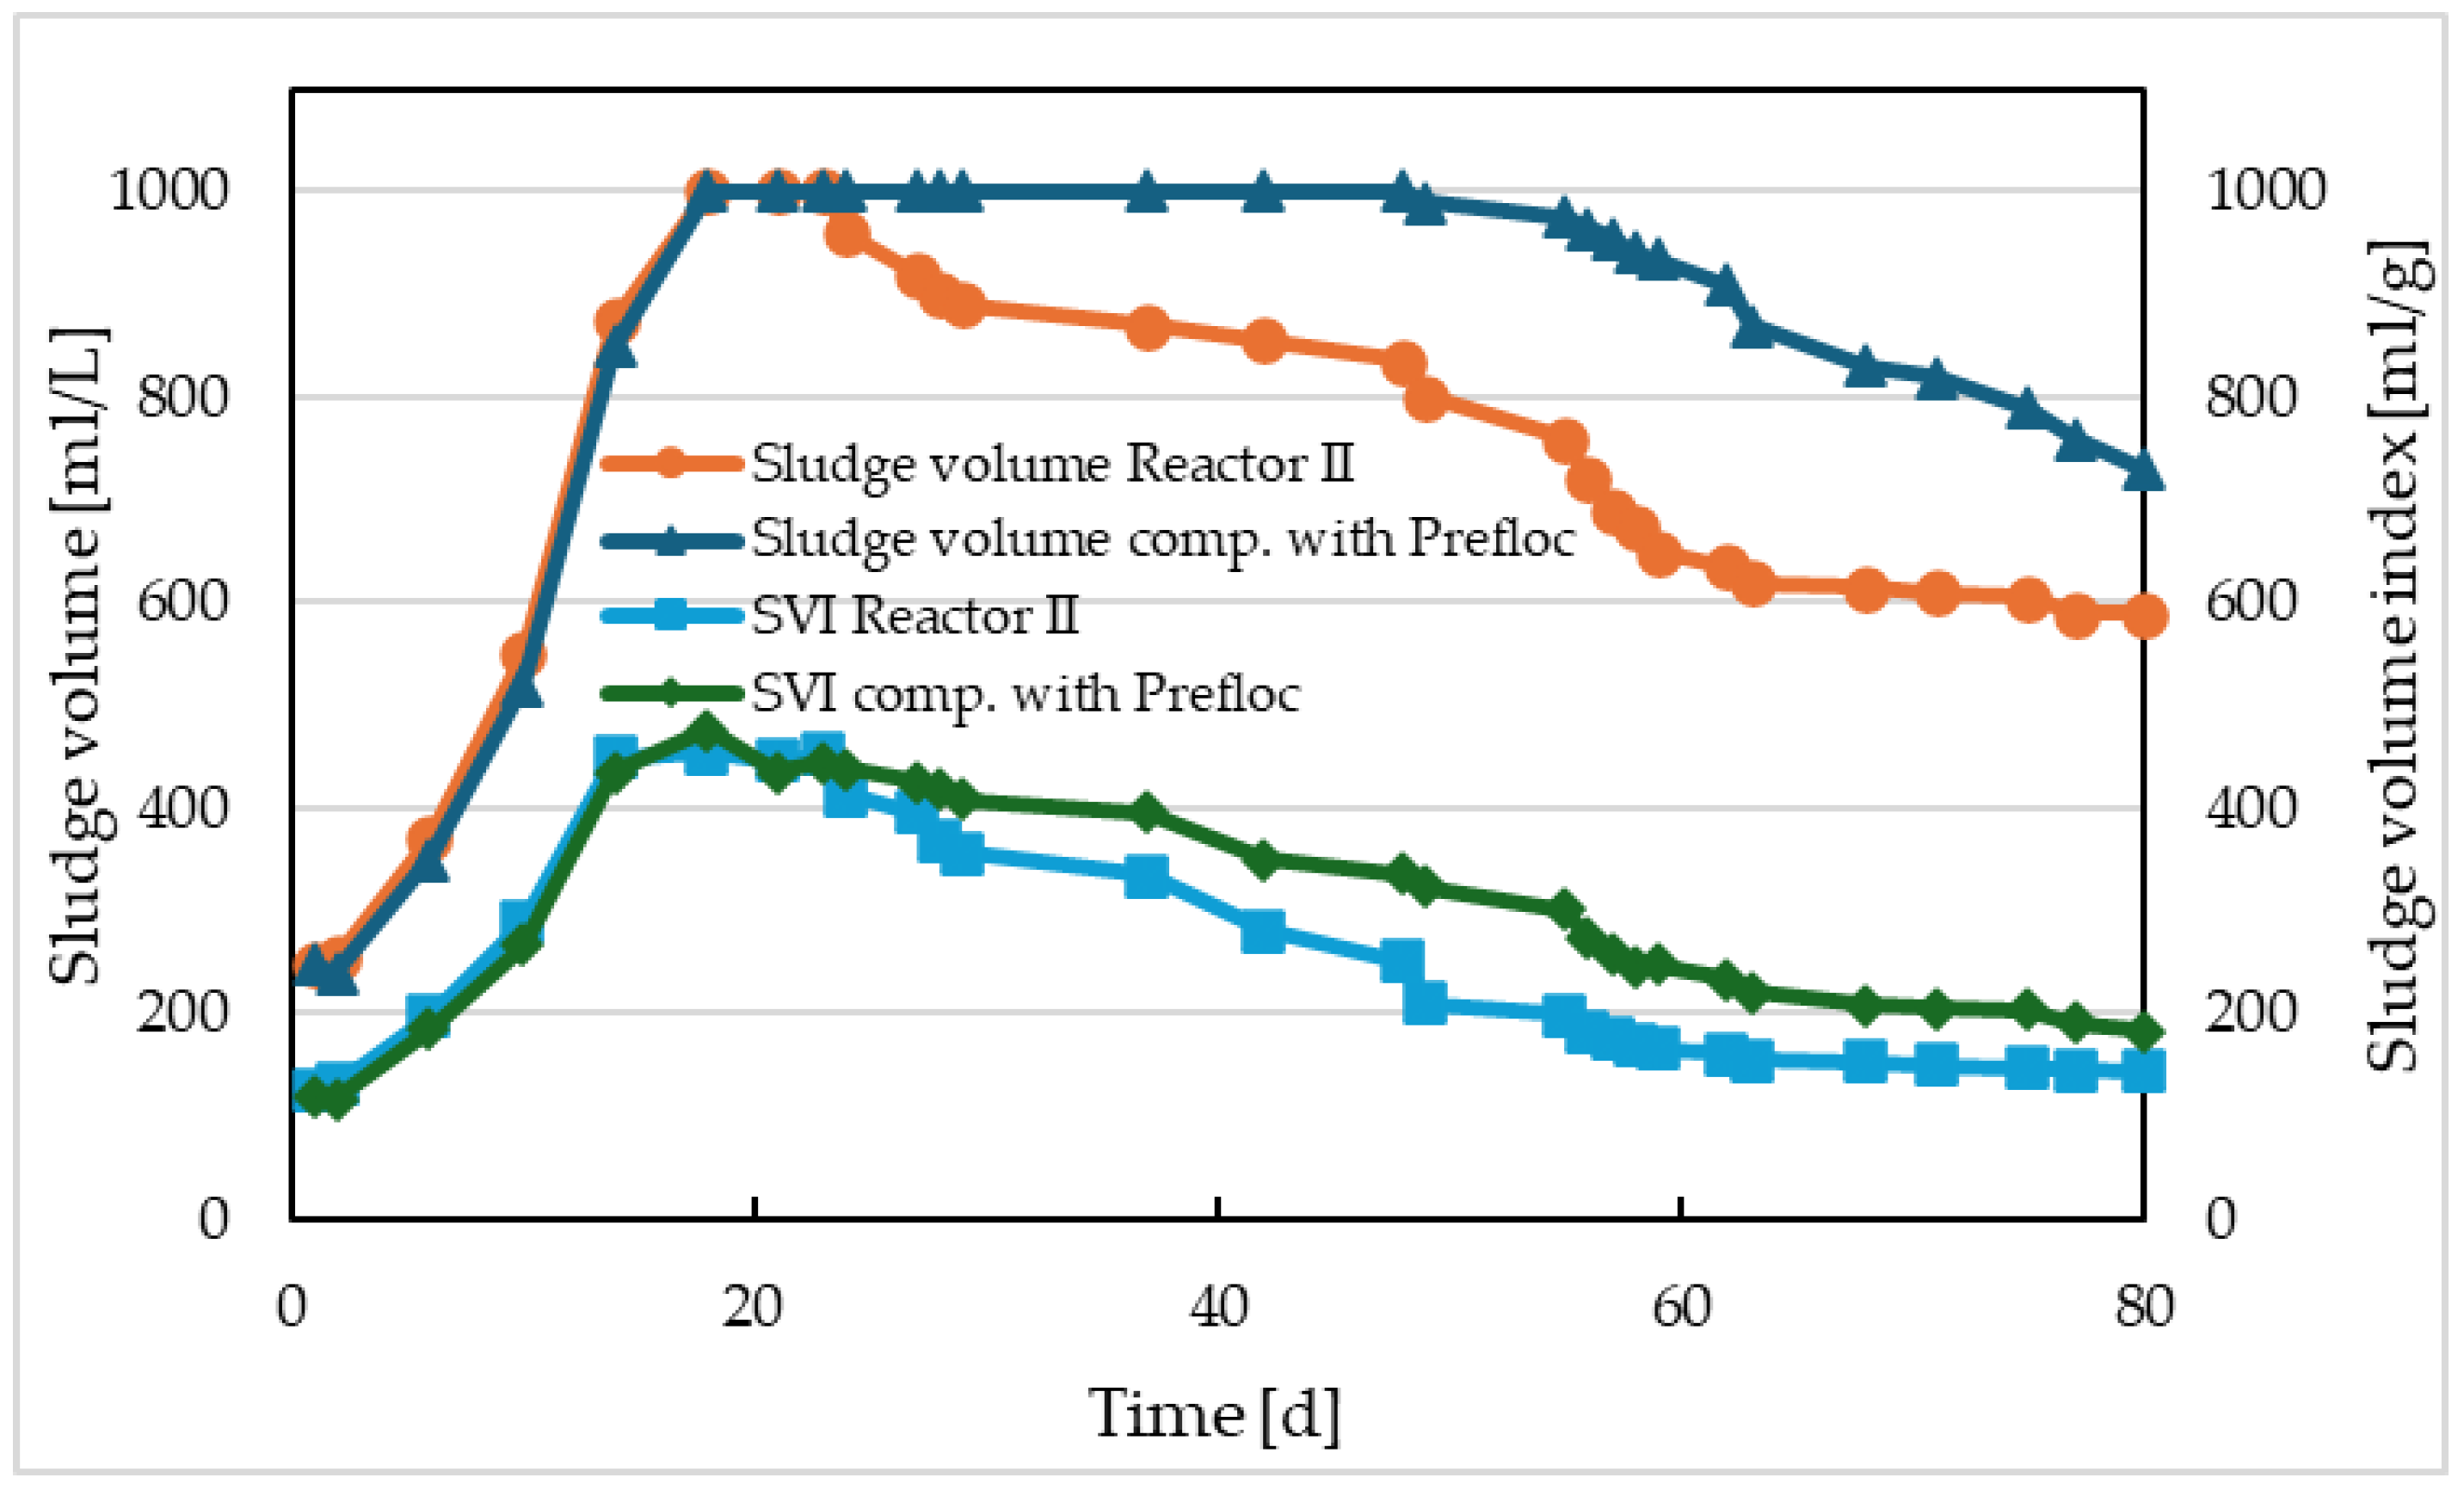
Figure 12.
Course of N-NH4 a N-NO3 concentrations at effluent from Re from comparative model with dosing of Prefloc.
Figure 12.
Course of N-NH4 a N-NO3 concentrations at effluent from Re from comparative model with dosing of Prefloc.
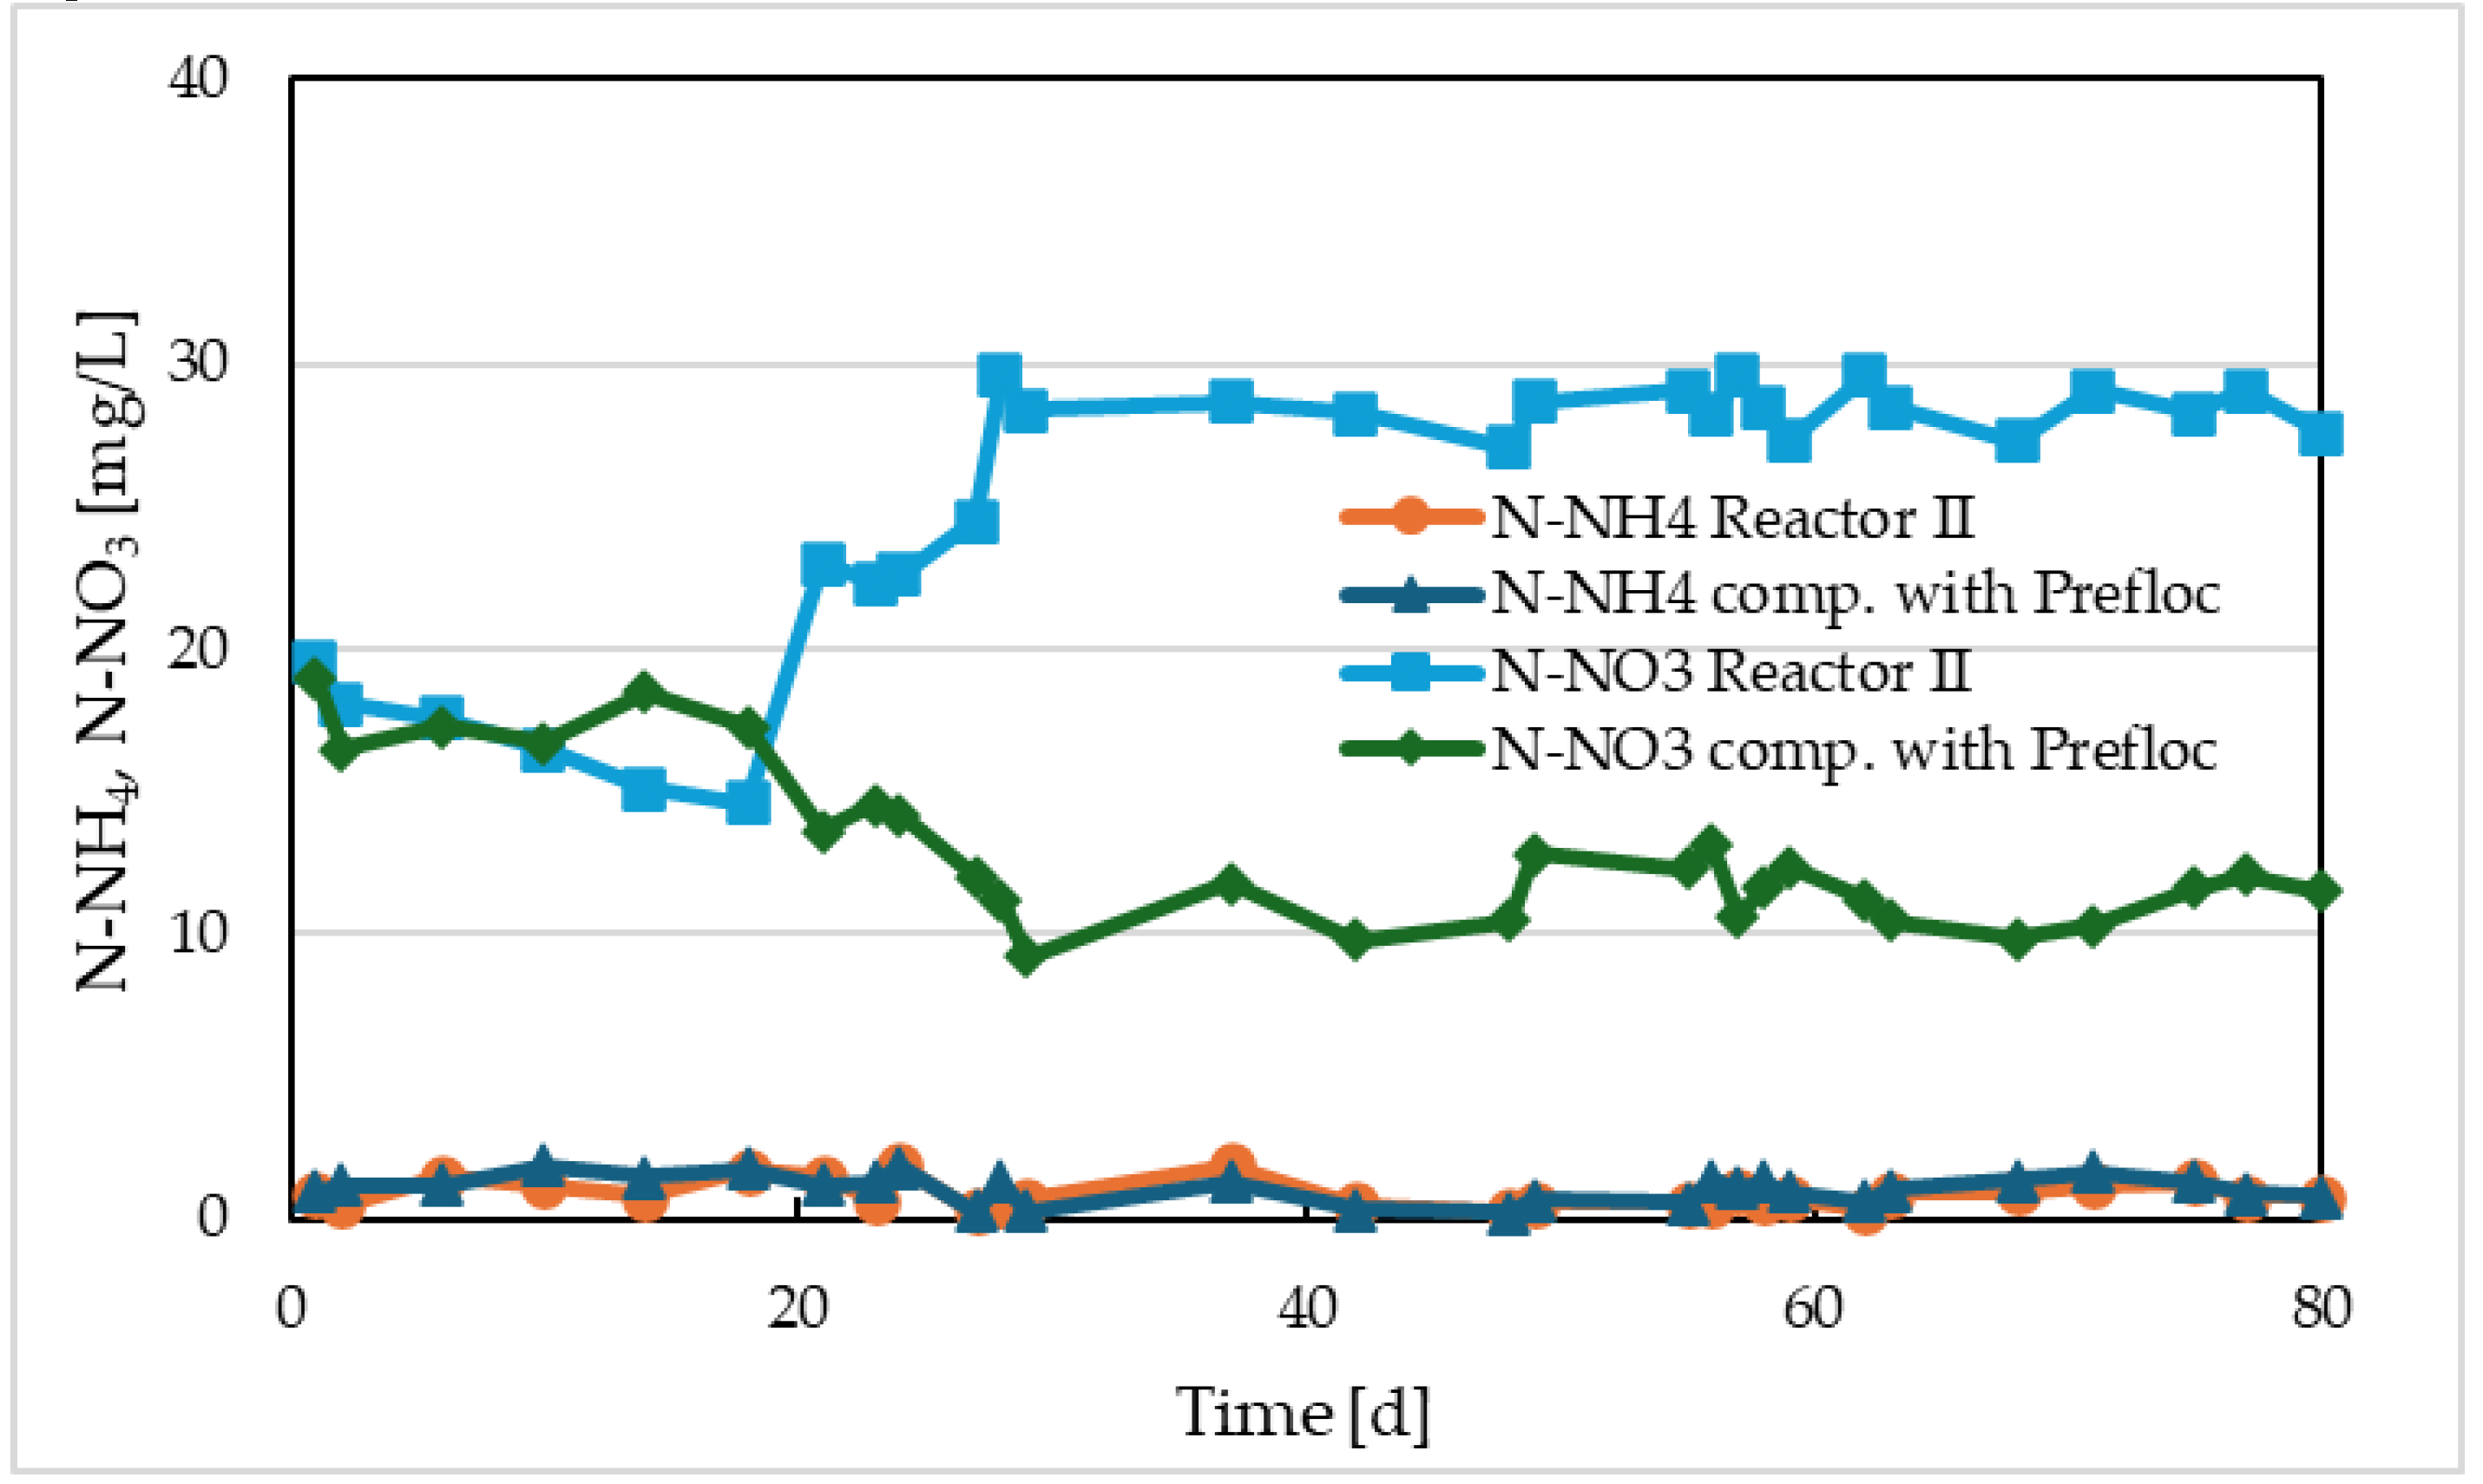
Figure 13.
Sedimentation properties of activated sludge in Reactor III and in comparative model – sludge volume after 30 min sedimentation and SVI.
Figure 13.
Sedimentation properties of activated sludge in Reactor III and in comparative model – sludge volume after 30 min sedimentation and SVI.


Table 1.
Amount of released iron (Fe2+/3+) in mg/L depending on electrodes distance.
|
Time [min] |
Distance of electrodes [cm] | ||
| 2 | 3 | 5 | |
| 5 | 63.7 | 48.3 | 21.9 |
| 10 | 130.7 | 79.6 | 43.8 |
| 15 | 190.2 | 139.1 | 64.7 |
Table 2.
Respiration rates in Reactor I, II and III and in comparative models.
| Reactor model | Respiration phase | Respiration rate [mg/(gVSS·h)] | |
|---|---|---|---|
| Before electrolysis | 80th day of operation | ||
| Reactor I | endogenous rX,ox,en | 7.82 | 11.65 |
| total rX,ox,tot | 62.12 | 65.34 | |
| Comparative model | endogenous rX,ox,en | 7.75 | 8.10 |
| total rX,ox,tot | 63.90 | 98.25 | |
| Reactor II | endogenous rX,ox,en | 7.70 | 7.46 |
| total rX,ox,tot | 67.82 | 47.40 | |
| Comparative modelwith Prefloc | endogenous rX,ox,en | 7.35 | 9.44 |
| total rX,ox,tot | 64.27 | 88.55 | |
| Reactor III | endogenous rX,ox,en | 7.83 | 8.12 |
| total rX,ox,tot | 59.61 | 63.16 | |
Disclaimer/Publisher’s Note: The statements, opinions and data contained in all publications are solely those of the individual author(s) and contributor(s) and not of MDPI and/or the editor(s). MDPI and/or the editor(s) disclaim responsibility for any injury to people or property resulting from any ideas, methods, instructions or products referred to in the content. |
© 2024 by the authors. Licensee MDPI, Basel, Switzerland. This article is an open access article distributed under the terms and conditions of the Creative Commons Attribution (CC BY) license (https://creativecommons.org/licenses/by/4.0/).
Copyright: This open access article is published under a Creative Commons CC BY 4.0 license, which permit the free download, distribution, and reuse, provided that the author and preprint are cited in any reuse.


