
Submitted:
01 August 2024
Posted:
06 August 2024
You are already at the latest version
Abstract
In this paper, the results of a high-precision control survey carried out in the underground mining of the Oyu Tolgoi project using terrestrial laser scanning technology are presented. The purpose of the measurements was to ensure that the direction, total length and volume of the penetration and excavation works were being implemented in accordance with the planned and designed dimensions. The coordinates of the geodetic traverse checkpoints were also assessed. In addition, we checked a traverse network of 18 checkpoints in the tunnel of the selected underground level. These checkpoints were repeatedly measured four times by two using readings of the Trimble S7 1” total station and were processed using the Compass/Bowditch method with Trimble Business Center software. All points except for one were within the tolerance limits. Based on these points, the excavation length and volumes were determined using the terrestrial laser scanners (TLSs) Trimble X7 and Trimble SX12 [25]. The difference between the planned work quantity provided by the Oyu Tolgoi project and the actual values measured using laser scanner was calculated with the comparative method. The TLS partial control measurements in the excavations made through the ore bodies revealed a length of 20285.72m and a volume of 441128.80m3 for the seven underground mine levels, while their project values were 16158.26m length and 422837.50m3 volume.
Keywords:
laser scanning
; point clouds
; mining tunnel monitoring
; precise total station
1. Introduction
Traditional underground mine surveying for inspection validity of the penetration and excavation works, coincidence of its heading and volume with the planned design were implemented by using a digital electronic total station. In recent years, laser scanning technology has rapidly entered in numerous engineering applications such as cross-sectional area and volume calculations, monitoring and measurements of deformations in construction, infrastructure, mining, road and bridge, archeological and historical artifacts studies etc., due to its high accuracy, high speed, high spatial resolution and efficiency for acquiring 3D representation of different objects. In these tasks, the 3D models are necessary to reconstruct the measurement or inventory object. In many scientific publications, we see very simplified 3D or only 2D models which were made using technical design documentation or manual measurements [7,9]. These models can be improved by laser scanning data and a reconstruction model from a data point cloud [23]. It takes a lot of time and requires a lot of effort to make it accurate and to a satisfactory degree of simplification. If we think about monitoring of geometry, we need to keep updates in a loop after any shape change. It can be done using machine learning and automatic recognition objects from a point cloud [7]. Modern TLS device can measure 104-106 points per second with an accuracy of 10-1-100 cm. In this sense, TLS are becoming increasingly affordable tool in engineering and in the quality control of facilities and infrastructures, for underground mining applications that can provide rapid rich geometric information in the form of 3D point cloud. Currently, two types of laser scanning to produce point clouds are widely used in underground mines: terrestrial laser scanning (TLS) and mobile laser scanning (MLS) [23].
To estimate the size of under and overbreak an appropriate measurement method that provides data high quality and easy collection is required. The actual shape and reliable cross-section of the tunnel of underground mining play important role on all levels of engineering operations as well as for ventilation. Besides, underground mine tunnels, mine headings are susceptible to the impact of convergence, therefore systematic control measurement of the location and height of the points, of the base geodetic network are of great importance in many tasks related to the maintenance, inventory and underground extraction. We carried out an inspection in the excavation and penetration mining work in the Oyu Tolgoi underground mining using high-speed Trimble X7 and SX12 laser scanning system to ensure whether the heading, total length and volume of the penetration and excavation works are being implementing in accordance with the planned and designed dimensions.
Oyu Tolgoi deposit is now extracting its concentrate from open pit ore. However, it is considered that 80 percent of the total resources, or the high-grade ore, is located underground hundreds of meters deep and copper and gold content of these ore bodies is largest in the world. The vertical penetration shaft of the underground mine of the deposit has been in operation since 2005. The 1st, 2nd and 5th vertical shafts have been put into operation, and the 3rd and 4th shafts are ongoing. Since 2007, more than 100 km of 8 level excavation work has been carried out at the depth of 1300 m.
2. Methodology
Measurements in the Mining Tunnel Using Terrestrial Laser Scanning
In order to evaluate the point coordinates and heights of the mine tunnel we established traverse control network. The excavation and penetration works were mapped by constructing its 3D model from point clouds data collected by TLS measurements and the model was compared with the project values. Before conducting TLS, a ground control marks were fixed on the wall of the tunnel in accordance with the accepted in the Oyu Tolgoi underground mine network as shown in Figure 2. The TLS measurements were conducted along the tunnel center line with a distance between station being between 10-50 m. The connection error between the stations was checked by scanning software and if the overlap is not less than 70% then the movement to the next station points were made.
LiDAR, defined as Laser Induced Detection and Ranging or Light Detection and Ranging, is a laser-based device allowing users to measure the distance between the sensor and other objects. It is obtained thanks to its active sensor high frequency spins emitting a laser beam, which is reflected from the object and received back, allowing precise determination of the position of the object in relation to the sensor. LiDAR can operate in two different modes: sending short pulses or continuous signals. Based on this, the distance is obtained through Time-of-Flight (ToF) of the laser beam or phase-shift estimation of the electromagnetic wave that returns to the sensor relative to the output electromagnetic wave. Generally, the better sensing range is exhibited by ToF Terrestrial Laser Scanners, while phase-based devices give higher accuracy. As a result of laser scanner measurements, a precise and dense point cloud is obtained, which is the set of coordinates of points in a three-dimensional coordinate system. Numerous reflections of the same, scattered beam of different strength may be detected by the LiDAR and used for sophisticated data analysis, together with other features provided, e.g., intensity or reflectance of the beam
The penetration and excavation heading and length were determined from the point clouds and 3D model and also were compared with the project values. One of the drawbacks working with point cloud in manual approach is tedious browsing, time-consuming, requires of capable computer. Therefore, we used semi-automated time-saving approach in which the cross-section maps were derived from the constructed 3D model. Derivation of cross-section maps at desired size and per meter allow its easier comparison with the designed value in short time. All the processing and calculation of the measurements were carried out by using the Trimble Business Center software with Tunnel module.
2.1. Measuring Device
For determination and evaluation of the reference points coordinates of the geodetic base network that are necessary for defining geometric dimensions such as cross penetration of excavation, its heading, length and volumes, Trimble S7 fully robotic electron total station with 1” accuracy was used. It combines in one Trimble Vision, Magdrive, Surepoint, Finelock, Autolock technologies and laser pointing.
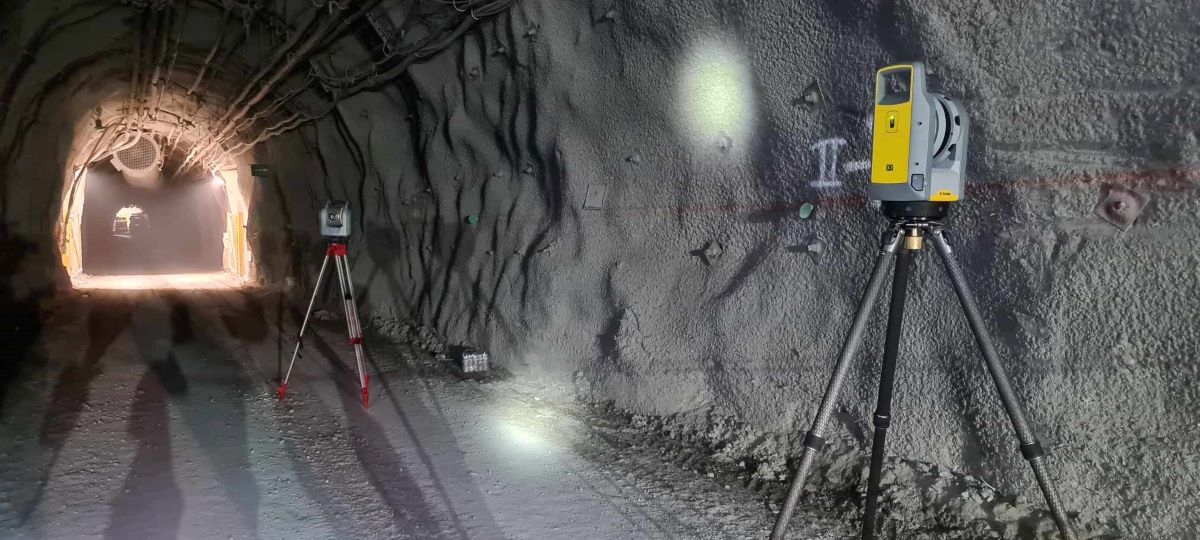
For determination of mine advance and shifting, Trimble X7 and SX12 laser scanners with easy orientation, measuring and marking possibilities were used. A green focusable laser pointer yields the smallest spot size currently in use, just 6 mm at 100 m, letting work from longer range. In general, the instrument operating range is 0.9 – 600 m, beam divergence is 0.2 mrad, field-of-view 360° ×300° scanner angular accuracy is 5”.
2.2. Measurement of the Traverse Network
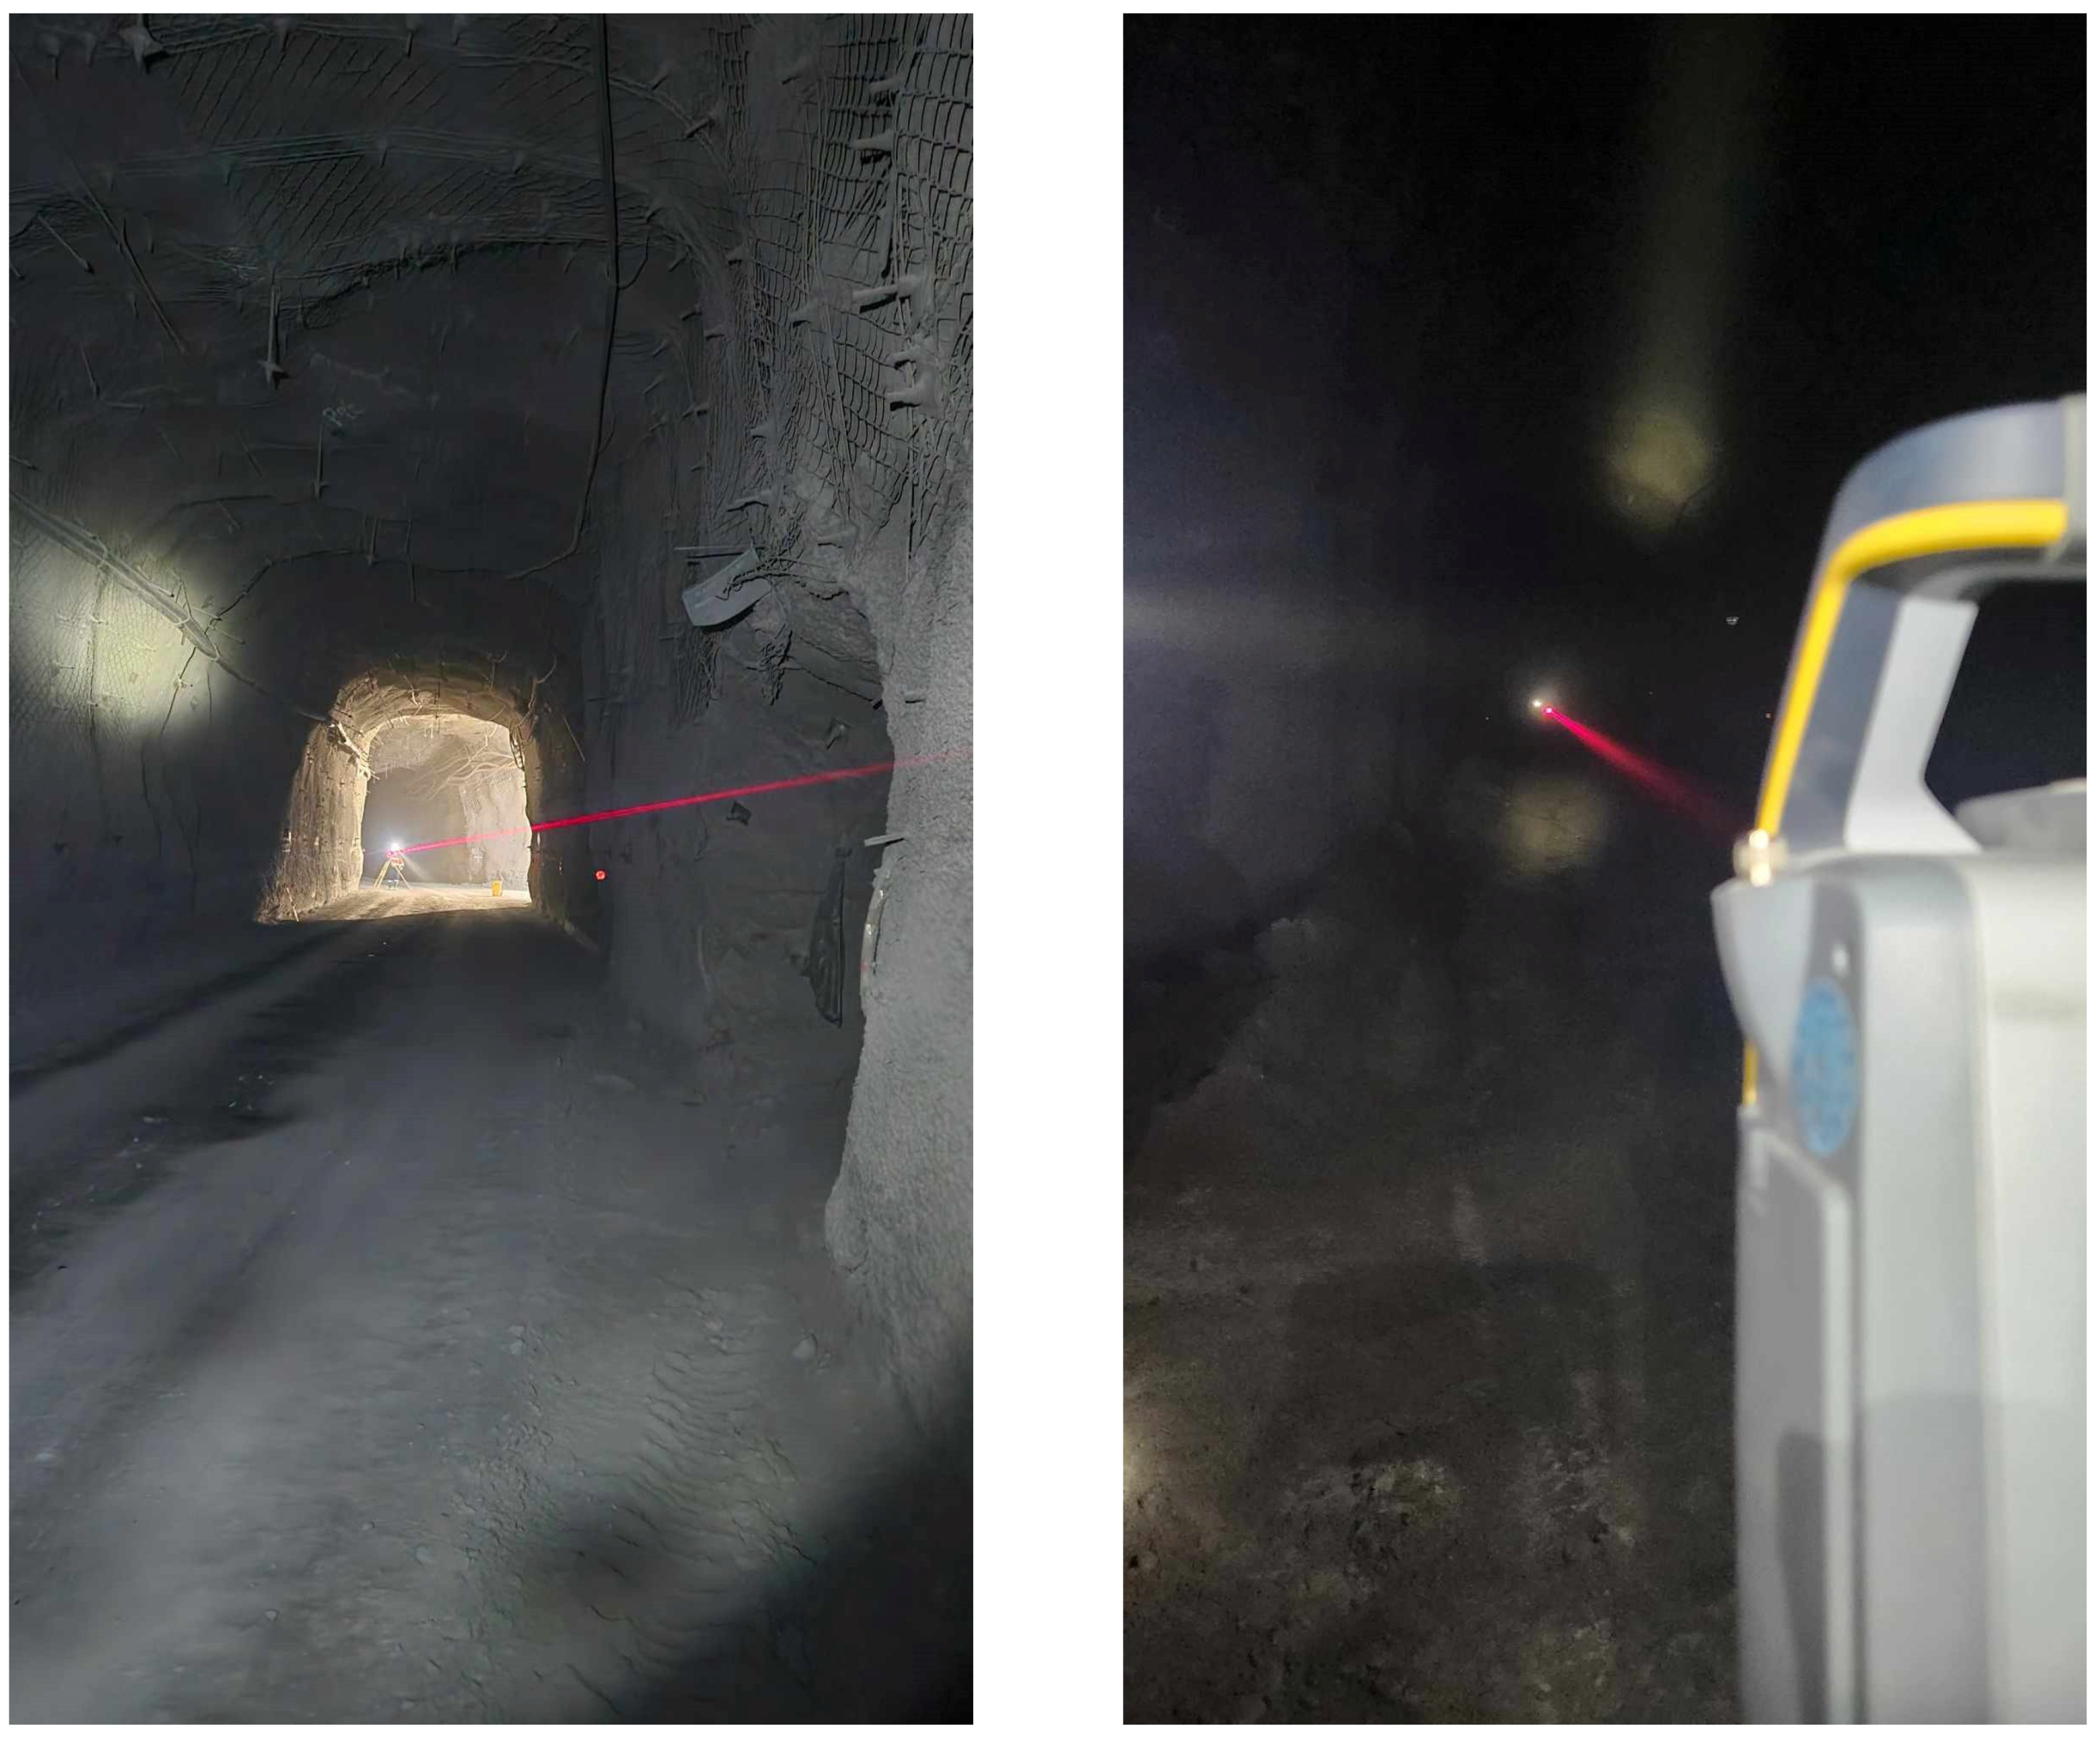
In the tunnel to vertical shaft-4, 18 points of the network with a total length of 600 m were measured using Rounds module of the total station. Three circle readings in forward and backward directions which totals of 6 measurements were performed on all points as shown in Figure 1 [1].
The angular measurements carried out from the station 1 of the traverse network with directional line to CS968 point (Figure 1) are shown on Table 1.

Table 1.
Traverse network report.
| ADJUSTED COORDINATE | GIVEN COORDINATES | DIFFERENCE | ||||||||
|---|---|---|---|---|---|---|---|---|---|---|
| № | North | East | Elevation | Point ID | North | East | Elevation | del N | del E | del El |
| N18 | 650954.651 | 4767734.964 | -90.167 | CS796 | 650954.664 | 4767735.002 | -90.171 | -0.013 | -0.038 | 0.004 |
| N12 | 650761.172 | 4767800.378 | -60.819 | CS878 | 650761.184 | 4767800.385 | -60.819 | -0.012 | -0.007 | 0.000 |
| N13 | 650821.106 | 4767780.171 | -69.646 | CS880 | 650821.116 | 4767780.181 | -69.646 | -0.010 | -0.010 | 0.000 |
| N16 | 650913.067 | 4767749.622 | -83.897 | CS882 | 650913.077 | 4767749.650 | -83.898 | -0.010 | -0.028 | 0.001 |
| N10 | 650696.274 | 4767822.673 | -50.492 | CS958 | 650696.284 | 4767822.681 | -50.491 | -0.010 | -0.008 | -0.001 |
| N8 | 650662.942 | 4767833.654 | -45.432 | CS959 | 650662.952 | 4767833.660 | -45.433 | -0.010 | -0.006 | 0.001 |
| N7 | 650607.864 | 4767852.018 | -35.483 | CS960 | 650607.871 | 4767852.022 | -35.483 | -0.007 | -0.004 | 0.000 |
| N5 | 650548.905 | 4767871.278 | -24.685 | CS961 | 650548.907 | 4767871.280 | -24.682 | -0.002 | -0.002 | -0.003 |
| N4 | 650527.766 | 4767878.308 | -20.379 | CS962 | 650527.772 | 4767878.309 | -20.377 | -0.006 | -0.001 | -0.002 |
| N2 | 650501.919 | 4767886.825 | -15.714 | CS963 | 650501.917 | 4767886.823 | -15.714 | 0.002 | 0.002 | 0.000 |
| Traverse Adjustment Report | ||||||||||||||
| Summary | ||||||||||||||
| Compass/Bowditch | ||||||||||||||
| Adjustment method: | ||||||||||||||
| Traverse name: | CheckSurvey | |||||||||||||
| Adjustment mode: | Adjust automatically | Angular adjustment: | Equal proportions | |||||||||||
| Adjustment date: | 10/22/2023 7:38:35 PM | Vertical adjustment: | Proportional to distance | |||||||||||
| Adjusted points: | 13 | |||||||||||||
| Start point: | z1 | End point: | z1 | |||||||||||
| Orientation method: | Single Point | Orientation method: | Single Point | |||||||||||
| Orientation point: | CS968 | Orientation point: | CS965 | |||||||||||
| Point azimuth: | 23°19′47.9” | Point azimuth: | 289°53′18.2” | |||||||||||
| Angular misclosure: | 36.020 sec (60.000 sec) | Traverse length: | 1067.0183 m | |||||||||||
| Easting misclosure: | -0.0004 m | Vertical misclosure: | -0.0005 m | |||||||||||
| Northing misclosure: | 0.0010 m | Vertical precision: | 1:2170201 | |||||||||||
| Longitudinal: | ? | Horizontal misclosure: | 0.0011 m | |||||||||||
| Transversal: | ? | Horizontal precision: | 1:1000681 | |||||||||||
| Angular misclosure: | 0.000 sec | Traverse length: | 1067.0183 m | |||||||||||
| Easting misclosure: | -0.0137 m | Vertical misclosure: | -0.0005 m | |||||||||||
| Northing misclosure: | -0.0387 m | Vertical precision: | 1:2170201 (1:25000) | |||||||||||
| Longitudinal: | ? | Horizontal misclosure: | 0.0411 m | |||||||||||
| Transversal: | ? | Horizontal precision: | 1:25968 (1:25000) | |||||||||||
| Easting misclosure: | 0.0000 m | Vertical misclosure: | 0.0000 m | |||||||||||
| Northing misclosure: | 0.0000 m | Post rotation: | 0.000 sec | |||||||||||
| Reduced Horizontal Distances Before Adjustment | ||||||
| Station | Reverse Distance | Forward Component | Forward Difference from Mean | Reciprocal Component | Reciprocal Difference from Mean | Meaned Forward Distance |
| z1 (S2) | 40.3078 m | 44.9586 m | -0.0007 m | 44.9593 m | 0.0001 m | 44.9592 m |
| z2 (S3) | 44.9593 m | 65.0036 m | 0.0002 m | 65.0033 m | -0.0002 m | 65.0034 m |
| z3 (S5) | 65.0033 m | 80.3801 m | 0.0003 m | 80.3794 m | -0.0003 m | 80.3797 m |
| z4 (S6) | 80.3794 m | 105.1060 m | 0.0000 m | 105.1061 m | 0.0000 m | 105.1060 m |
| z5 (S7) | 105.1061 m | 91.0382 m | 0.0000 m | 91.0382 m | 0.0000 m | 91.0382 m |
| z6 (S8) | 91.0382 m | 96.7012 m | 0.0002 m | 96.7007 m | -0.0003 m | 96.7010 m |
| z7 (S9) | 96.7007 m | 50.3114 m | -0.0002 m | 50.3118 m | 0.0002 m | 50.3116 m |
| z8 (S10) | 50.3118 m | 55.5475 m | 0.0000 m | 55.5474 m | 0.0000 m | 55.5474 m |
| z9 (S11) | 55.5474 m | 85.8946 m | 0.0002 m | 85.8943 m | -0.0002 m | 85.8944 m |
| z10 (S12) | 85.8943 m | 90.7848 m | 0.0001 m | 90.7847 m | -0.0001 m | 90.7848 m |
| z11 (S13) | 90.7847 m | 101.9709 m | 0.0005 m | 101.9700 m | -0.0005 m | 101.9704 m |
| z12 (S14) | 101.9700 m | 75.3148 m | 0.0002 m | 75.3144 m | -0.0002 m | 75.3146 m |
| z13 (S16) | 75.3144 m | 66.7112 m | -0.0001 m | 66.7115 m | 0.0001 m | 66.7114 m |
| z14 (S18) | 66.7115 m | 57.2958 m | -0.0003 m | 57.2964 m | 0.0003 m | 57.2961 m |
| z1 (S19) | 57.2964 m | 42.1400 m | 0.0000 m | ? | ? | 42.1400 m |
| Fixed Points | |||
| Point | Easting | Northing | Elevation |
| CS968 | 650471.5260 m | 4767942.2240 m | -3.8130 m |
| z1 | 650455.5629 m | 4767905.2114 m | -6.3976 m |
| CS965 | 650415.9360 m | 4767919.5470 m | 1.2620 m |
| Horizontal Adjustments | ||||||
| From Station | Azimuth Adjustment | Adjusted Azimuth | Easting Adjustment | Adjusted Easting | Northing Adjustment | Adjusted Northing |
| z1 (S2) | -2.401 sec | 108°17′25.4” | 0.0000 m | 650455.5629 m | 0.0000 m | 4767905.2114 m |
| z2 (S3) | -4.803 sec | 108°12′38.9” | 0.0006 m | 650498.2513 m | 0.0016 m | 4767891.1033 m |
| z3 (S5) | -7.204 sec | 107°34′46.0” | 0.0014 m | 650559.9997 m | 0.0040 m | 4767870.7912 m |
| z4 (S6) | -9.605 sec | 109°03′14.8” | 0.0024 m | 650636.6266 m | 0.0069 m | 4767846.5172 m |
| z5 (S7) | -12.007 sec | 108°57′41.9” | 0.0038 m | 650735.9753 m | 0.0107 m | 4767812.2080 m |
| z6 (S8) | -14.408 sec | 108°04′07.2” | 0.0050 m | 650822.0746 m | 0.0140 m | 4767782.6298 m |
| z7 (S9) | -16.809 sec | 109°30′15.9” | 0.0062 m | 650914.0081 m | 0.0175 m | 4767752.6409 m |
| z8 (S10) | -19.211 sec | 287°09′44.7” | 0.0068 m | 650961.4333 m | 0.0194 m | 4767735.8447 m |
| z9 (S11) | -21.612 sec | 290°00′42.2” | 0.0075 m | 650908.3600 m | 0.0214 m | 4767752.2377 m |
| z10 (S12) | -24.013 sec | 288°24′33.6” | 0.0086 m | 650827.6527 m | 0.0245 m | 4767781.6349 m |
| z11 (S13) | -26.415 sec | 288°30′30.7” | 0.0098 m | 650741.5151 m | 0.0278 m | 4767810.3084 m |
| z12 (S14) | -28.816 sec | 287°59′41.6” | 0.0111 m | 650644.8202 m | 0.0315 m | 4767842.6822 m |
| z13 (S16) | -31.217 sec | 288°39′54.1” | 0.0121 m | 650573.1906 m | 0.0342 m | 4767865.9521 m |
| z14 (S18) | -33.619 sec | 288°12′35.2” | 0.0129 m | 650509.9888 m | 0.0367 m | 4767887.3044 m |
| z1 (S19) | -36.020 sec | 289°53′18.2” | 0.0137 m | 650455.5629 m | 0.0387 m | 4767905.2114 m |
| Reduced Vertical Distances Before Adjustment | ||||||
| Station | Reverse Distance | Forward Component | Forward Difference from Mean | Reciprocal Component | Reciprocal Difference from Mean | Meaned Forward Distance |
| z1 (S2) | 2.5856 m | -8.3765 m | -0.0034 m | 8.3725 m | 0.0006 m | -8.3731 m |
| z2 (S3) | 8.3725 m | -11.5216 m | 0.0005 m | 11.5225 m | -0.0005 m | -11.5220 m |
| z3 (S5) | 11.5225 m | -14.4255 m | 0.0011 m | 14.4276 m | -0.0009 m | -14.4266 m |
| z4 (S6) | 14.4276 m | -15.3907 m | 0.0003 m | 15.3912 m | -0.0003 m | -15.3910 m |
| z5 (S7) | 15.3912 m | -13.5262 m | 0.0005 m | 13.5272 m | -0.0005 m | -13.5267 m |
| z6 (S8) | 13.5272 m | -14.4359 m | 0.0004 m | 14.4368 m | -0.0005 m | -14.4363 m |
| z7 (S9) | 14.4368 m | -6.9431 m | 0.0002 m | 6.9435 m | -0.0002 m | -6.9433 m |
| z8 (S10) | 6.9435 m | 8.0186 m | 0.0003 m | -8.0179 m | -0.0003 m | 8.0182 m |
| z9 (S11) | -8.0179 m | 12.4706 m | 0.0008 m | -12.4691 m | -0.0008 m | 12.4698 m |
| z10 (S12) | -12.4691 m | 13.3301 m | 0.0007 m | -13.3287 m | -0.0007 m | 13.3294 m |
| z11 (S13) | -13.3287 m | 14.7396 m | 0.0003 m | -14.7390 m | -0.0003 m | 14.7393 m |
| z12 (S14) | -14.7390 m | 13.7742 m | 0.0005 m | -13.7733 m | -0.0005 m | 13.7737 m |
| z13 (S16) | -13.7733 m | 11.7040 m | 0.0012 m | -11.7016 m | -0.0012 m | 11.7028 m |
| z14 (S18) | -11.7016 m | 10.5864 m | 0.0012 m | -10.5840 m | -0.0012 m | 10.5852 m |
| z1 (S19) | -10.5840 m | 7.6601 m | 0.0000 m | ? | ? | 7.6601 m |
| Vertical Adjustments | ||
| From Station | Vertical Adjustment | Adjusted Vertical |
| z1 (S2) | 0.0000 m | -6.3976 m |
| z2 (S3) | 0.0000 m | -14.7706 m |
| z3 (S5) | 0.0001 m | -26.2926 m |
| z4 (S6) | 0.0001 m | -40.7192 m |
| z5 (S7) | 0.0001 m | -56.1101 m |
| z6 (S8) | 0.0002 m | -69.6368 m |
| z7 (S9) | 0.0002 m | -84.0731 m |
| z8 (S10) | 0.0002 m | -91.0164 m |
| z9 (S11) | 0.0003 m | -82.9981 m |
| z10 (S12) | 0.0003 m | -70.5282 m |
| z11 (S13) | 0.0004 m | -57.1988 m |
| z12 (S14) | 0.0004 m | -42.4594 m |
| z13 (S16) | 0.0004 m | -28.6857 m |
| z14 (S18) | 0.0005 m | -16.9828 m |
| z1 (S19) | 0.0005 m | -6.3976 m |
Figure 2.
The check survey points of the traverse network.
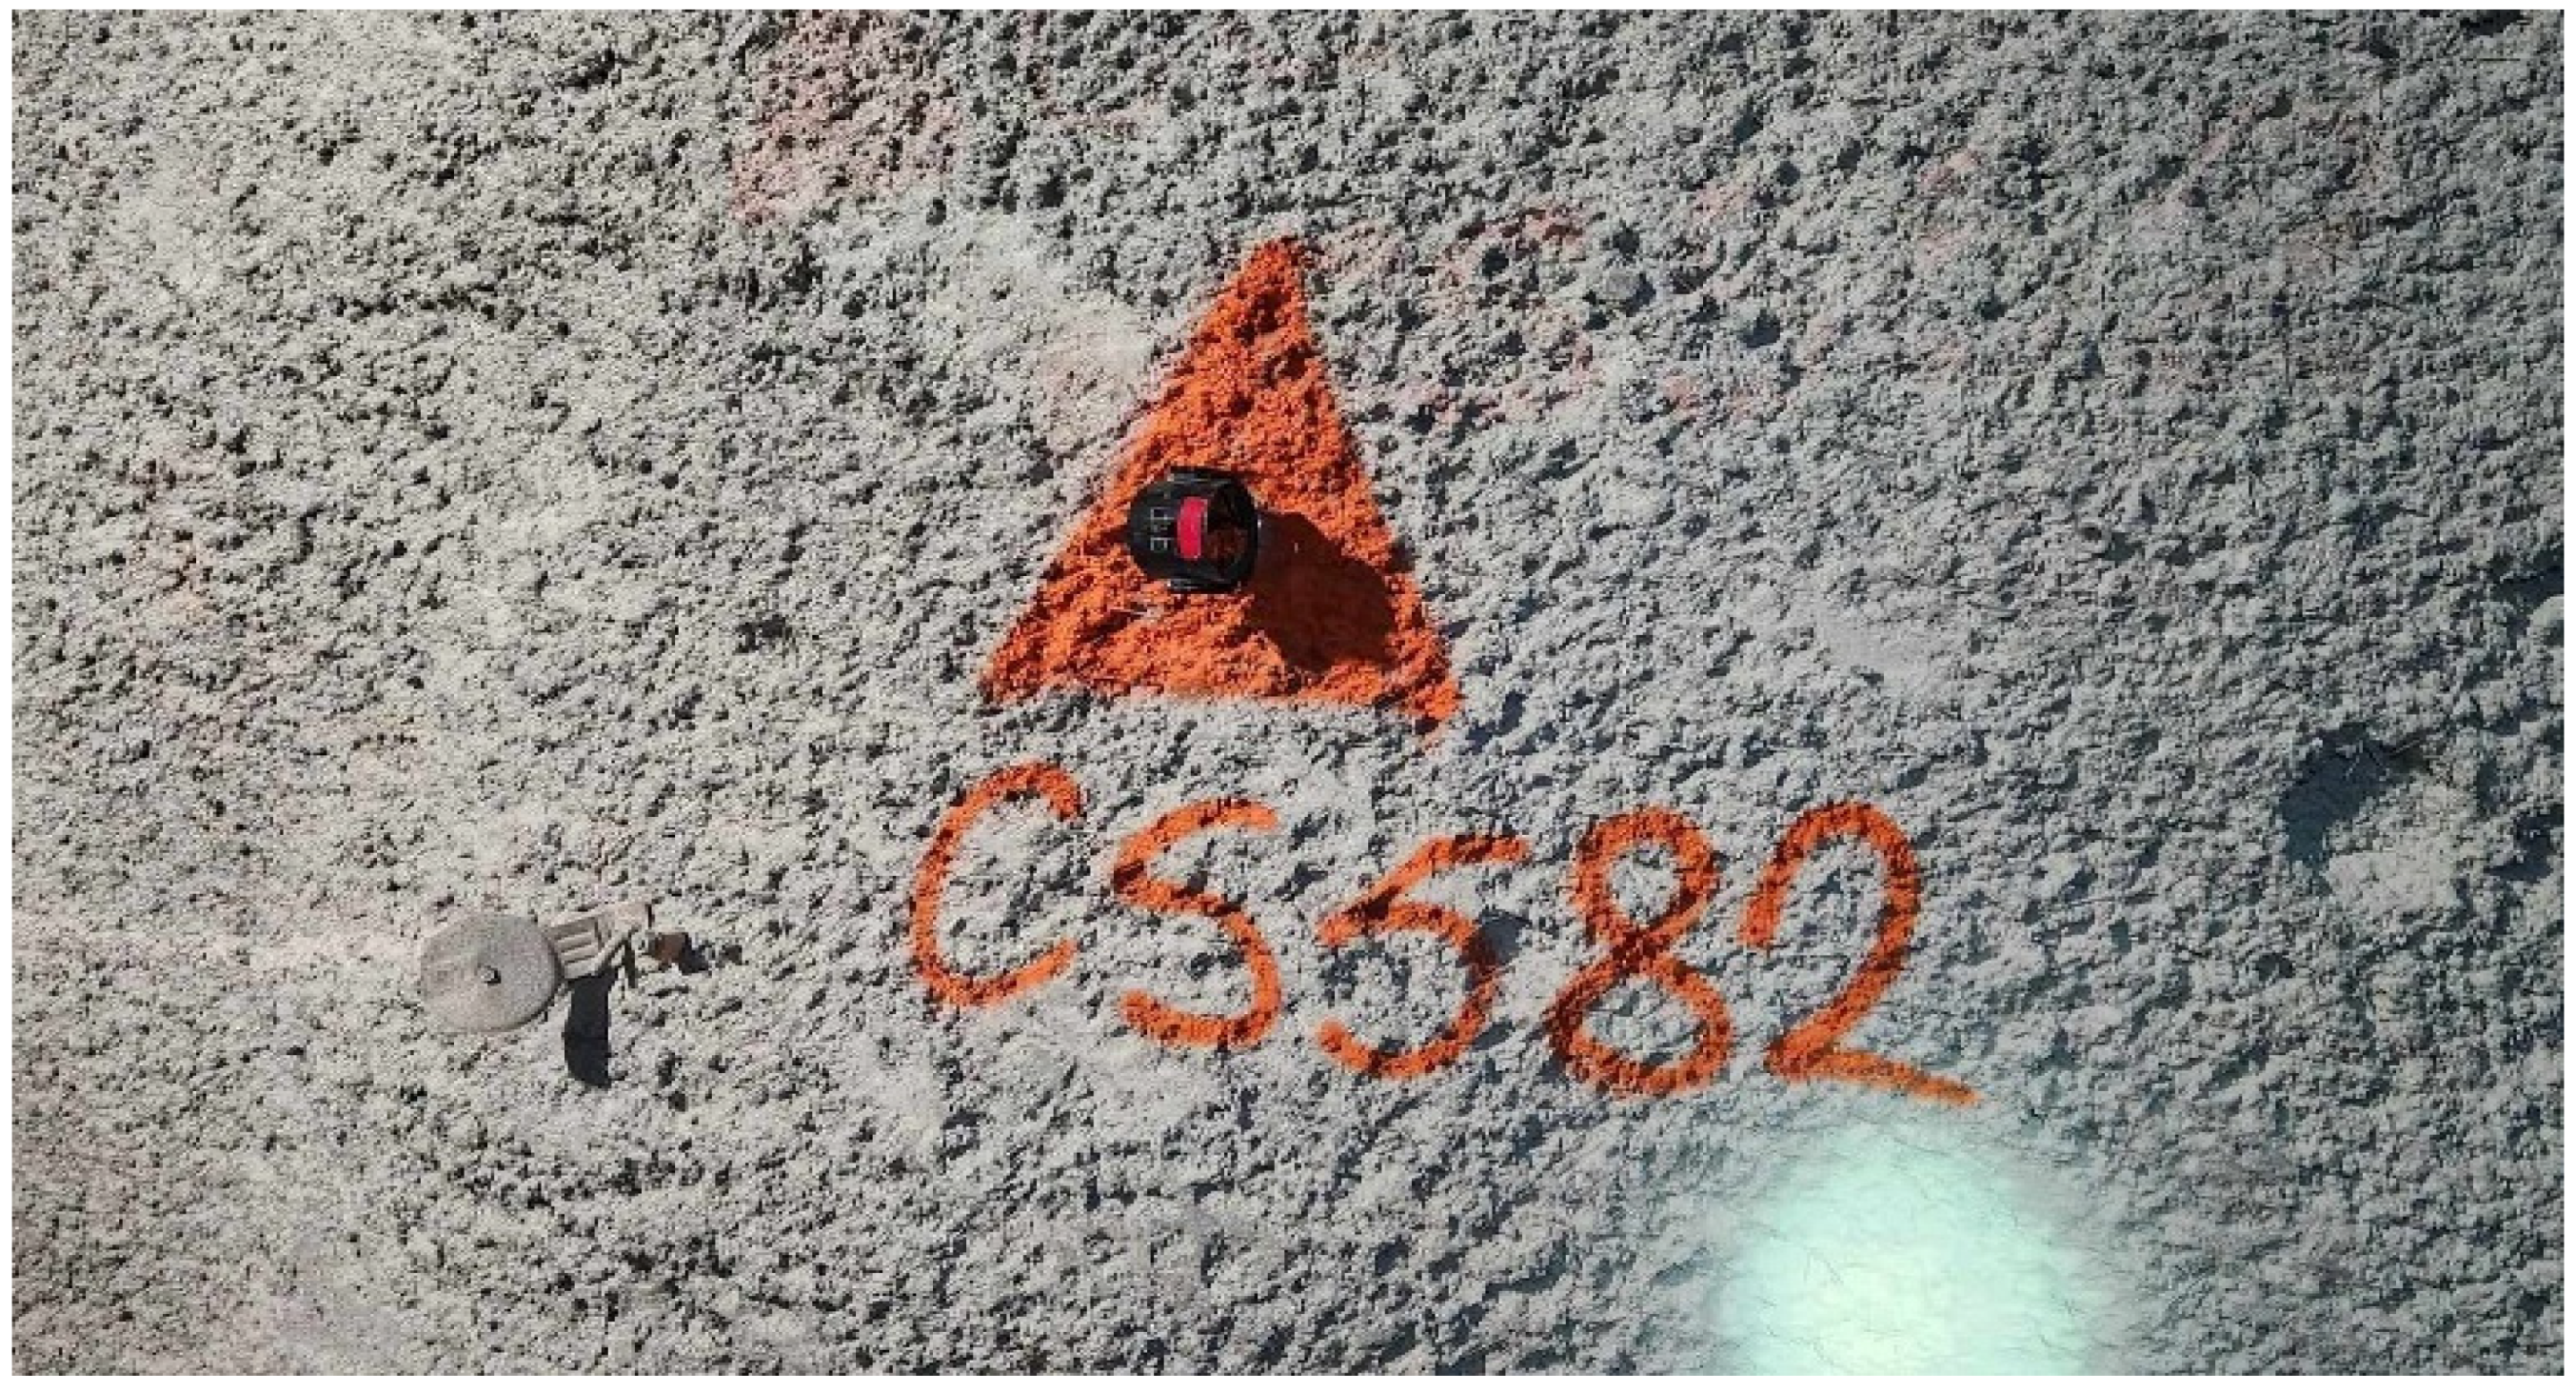
Figure 3.
Check survey during traverse network measurement.
The TLS mapping were performed by measuring 190 stations by Trimble SX12 laser scanner, 715 stations by Trimble X7 laser scanner. In total using 905 stations and placing 829 ground control marks, 40.755.000.000 points by X7 device and 1.606.305.600 points by SX12 device were collected respectively.
Figure 4.
TLS measurement of underground mining tunnel.
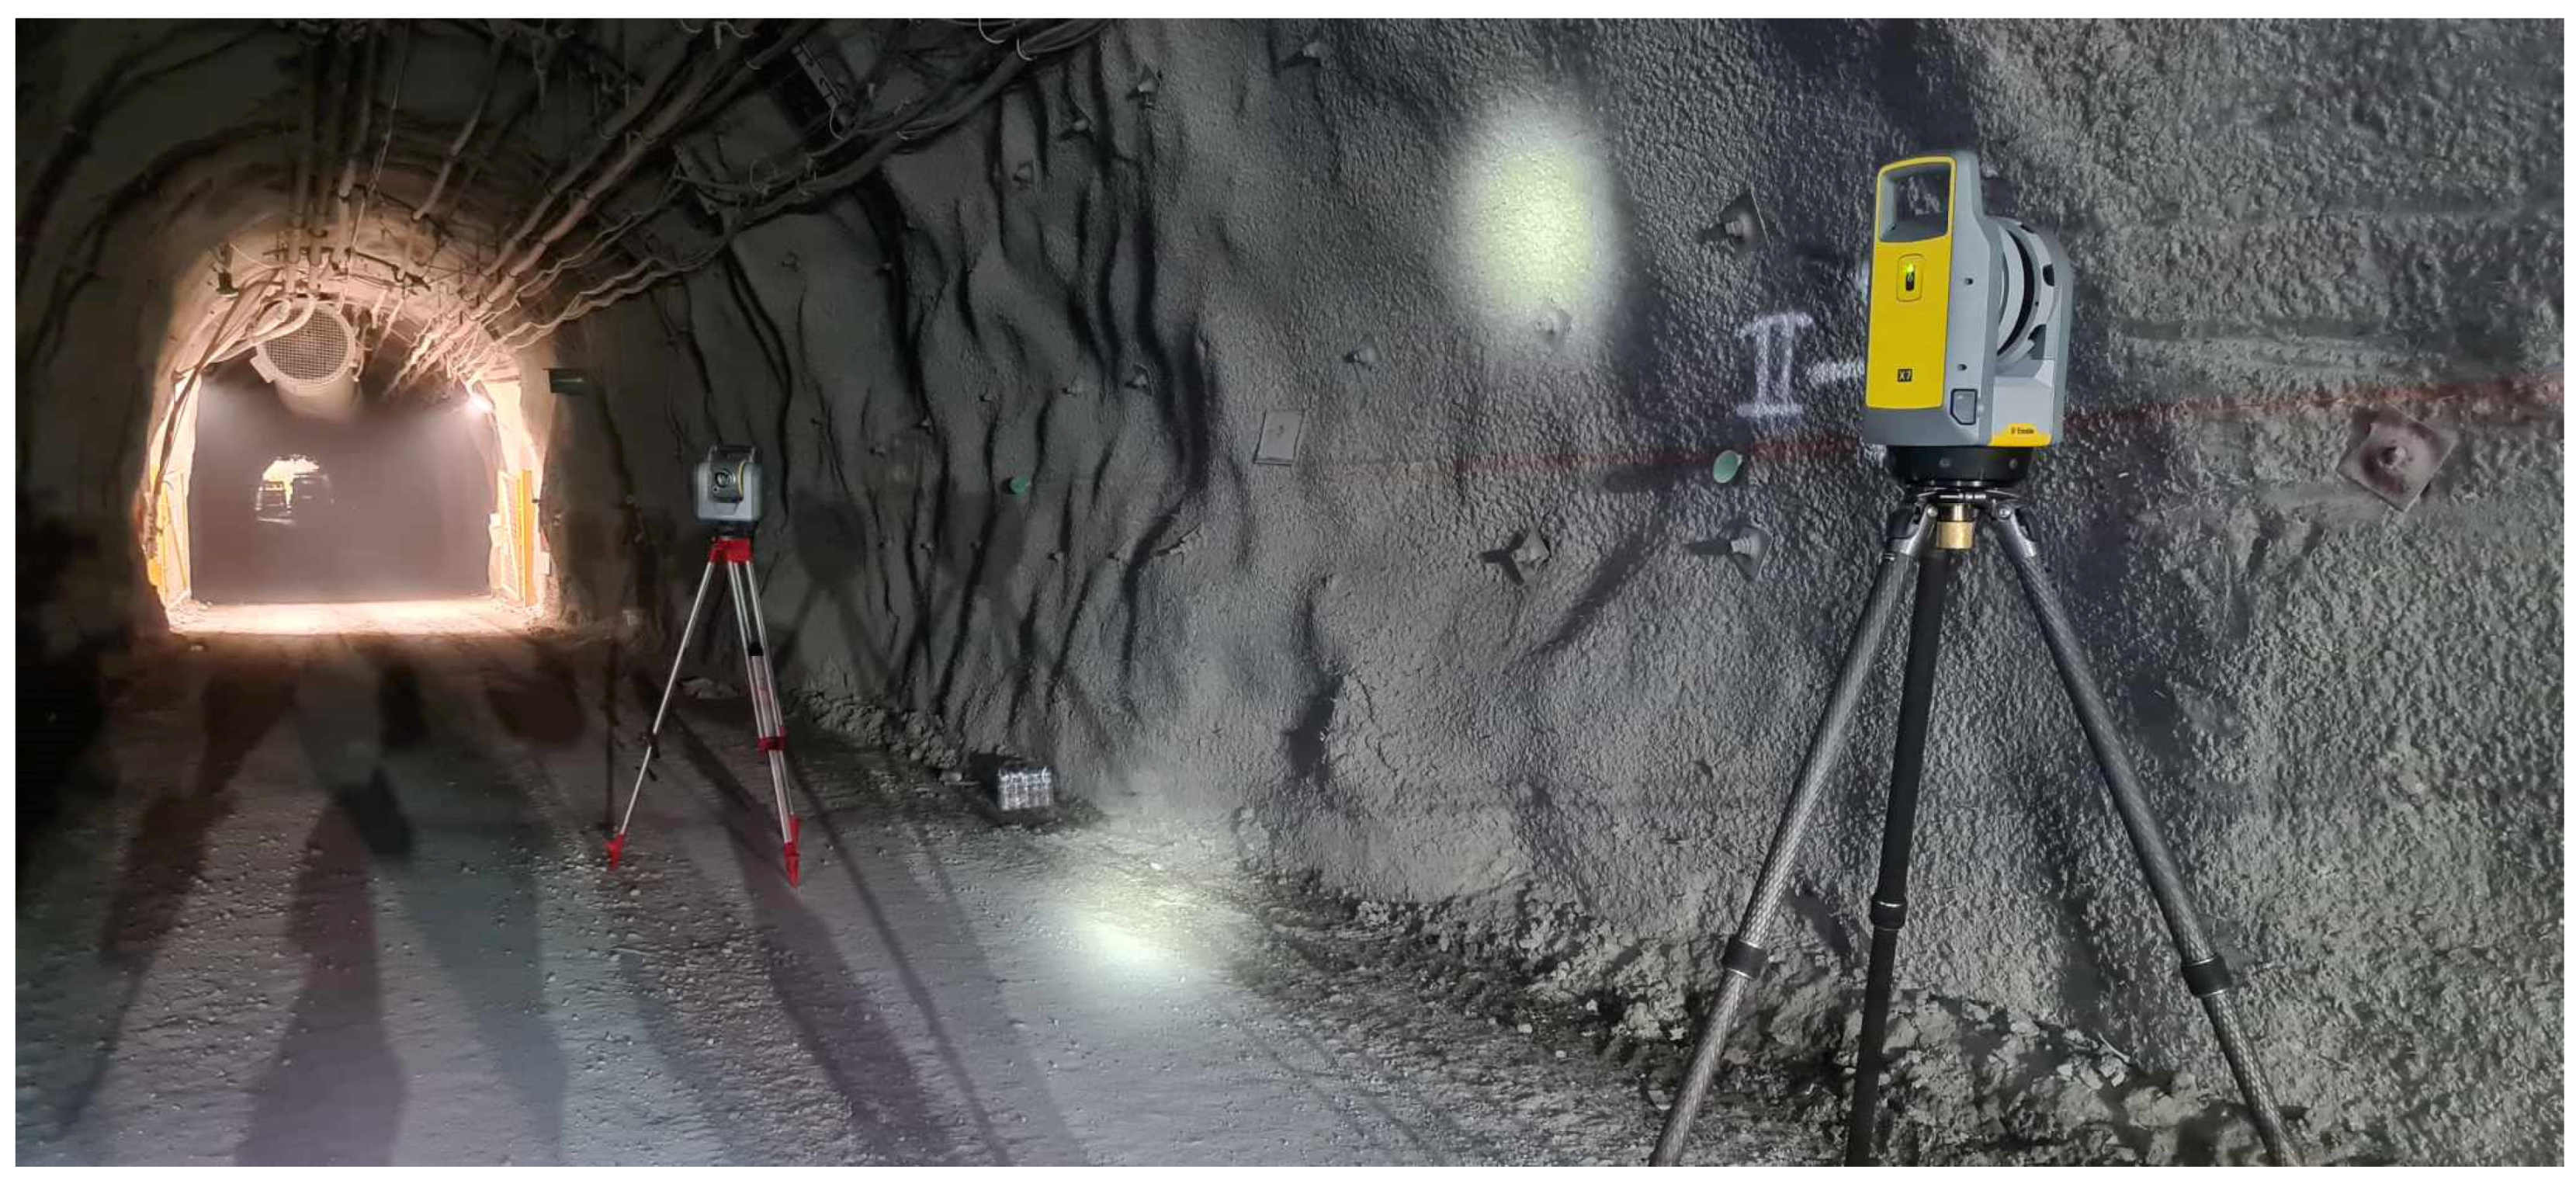
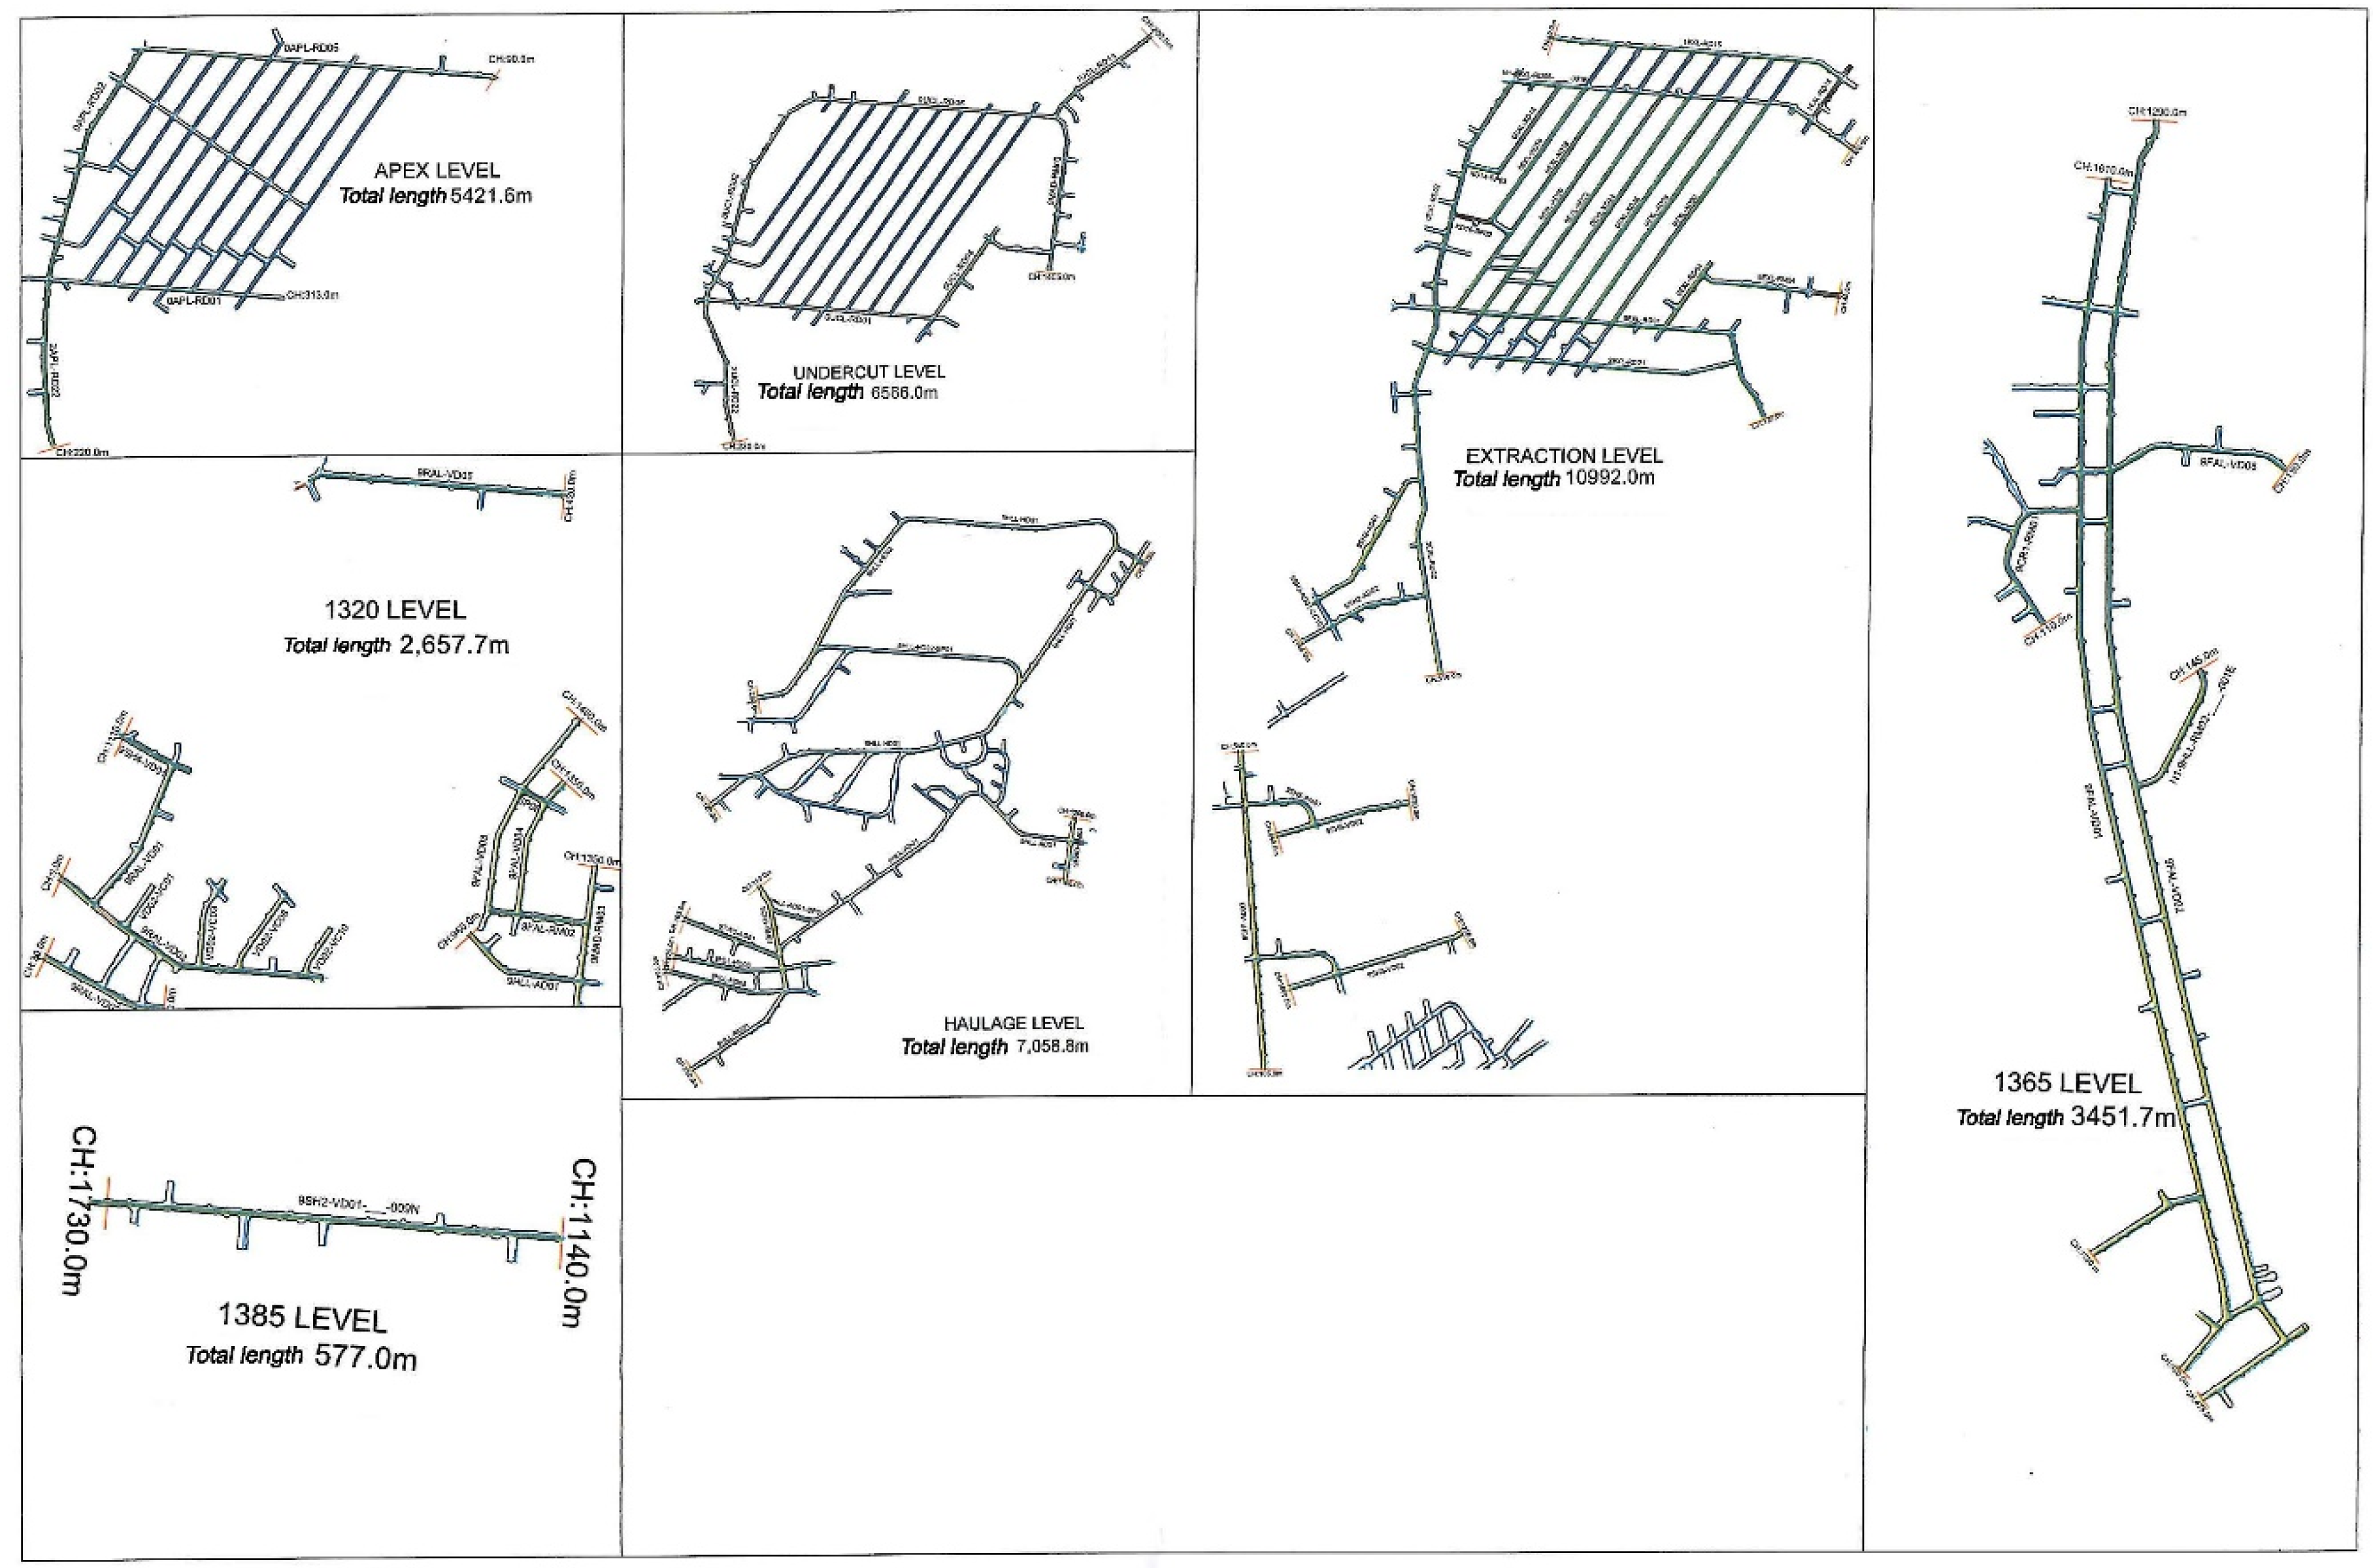
Figure 5.
Overall observation plan for 7 level; APL (Apex level), UCL (Undercut level), EXL (Extraction level), RAL (Return Air level), HLL (Haulage level), TWS (Track Work Shop), FAL (Fresh Air level).
Figure 5.
Overall observation plan for 7 level; APL (Apex level), UCL (Undercut level), EXL (Extraction level), RAL (Return Air level), HLL (Haulage level), TWS (Track Work Shop), FAL (Fresh Air level).
2.3. The Measurements and Survey Carried Out at the Mine Tunnel
For implementing the TLS, the suitable stations were selected that provide uninterruptable operation of the equipment in the tunnel and complete mapping of the tunnel. The control or connection points number were marked on the wall by fireproof paint and distance between points were set to be no more than 10-30 m (Figure 7).
Figure 6.
The ground control mark used in the underground mine.
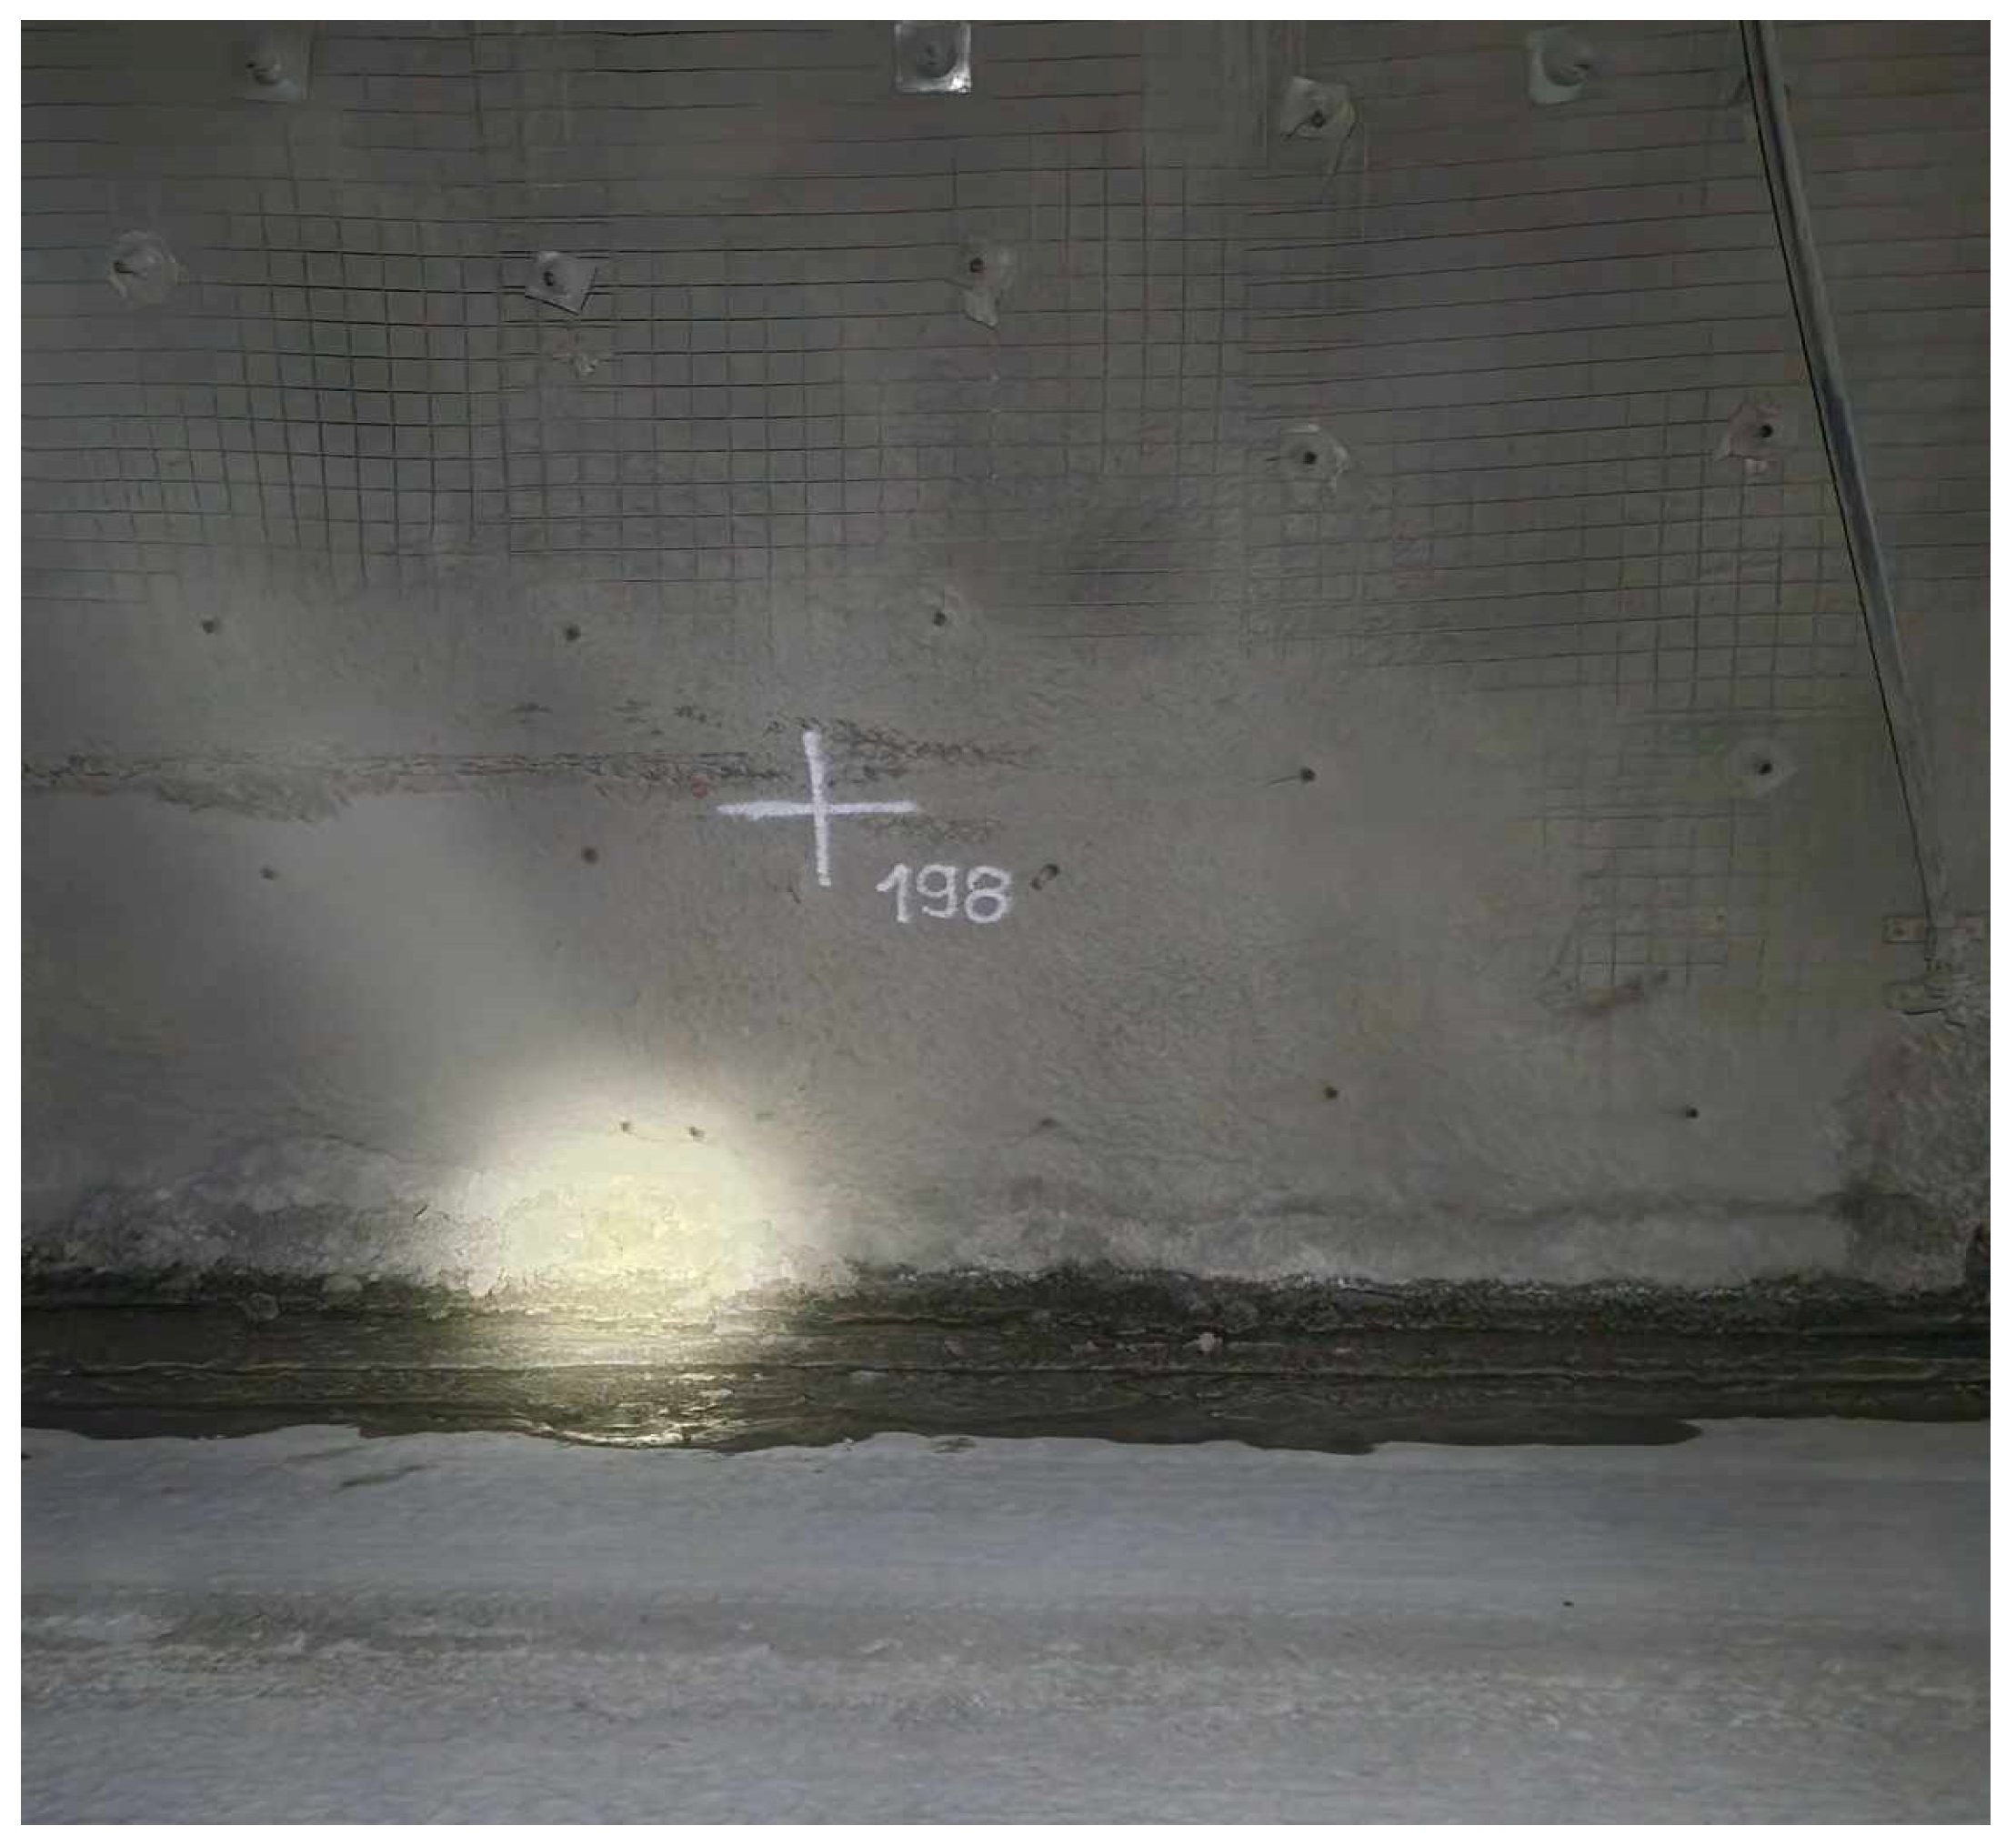
The ground control marks serve to georeference the point cloud measured by the TLS and place them to the final correct position.
3. TLS Registration Process between Stations
Data processing was carried out using Trimble Perspective field software, Trimble Real Works software for processing laser scanning data, Trimble Business Center software for processing digital total station, leveling, GNSS data, static and mobile laser scanning data, drone or photogrammetric data.
The overlap between scanner stations were checked by Trimble Perspective software and if overlap has more than 30% registration working automatically.
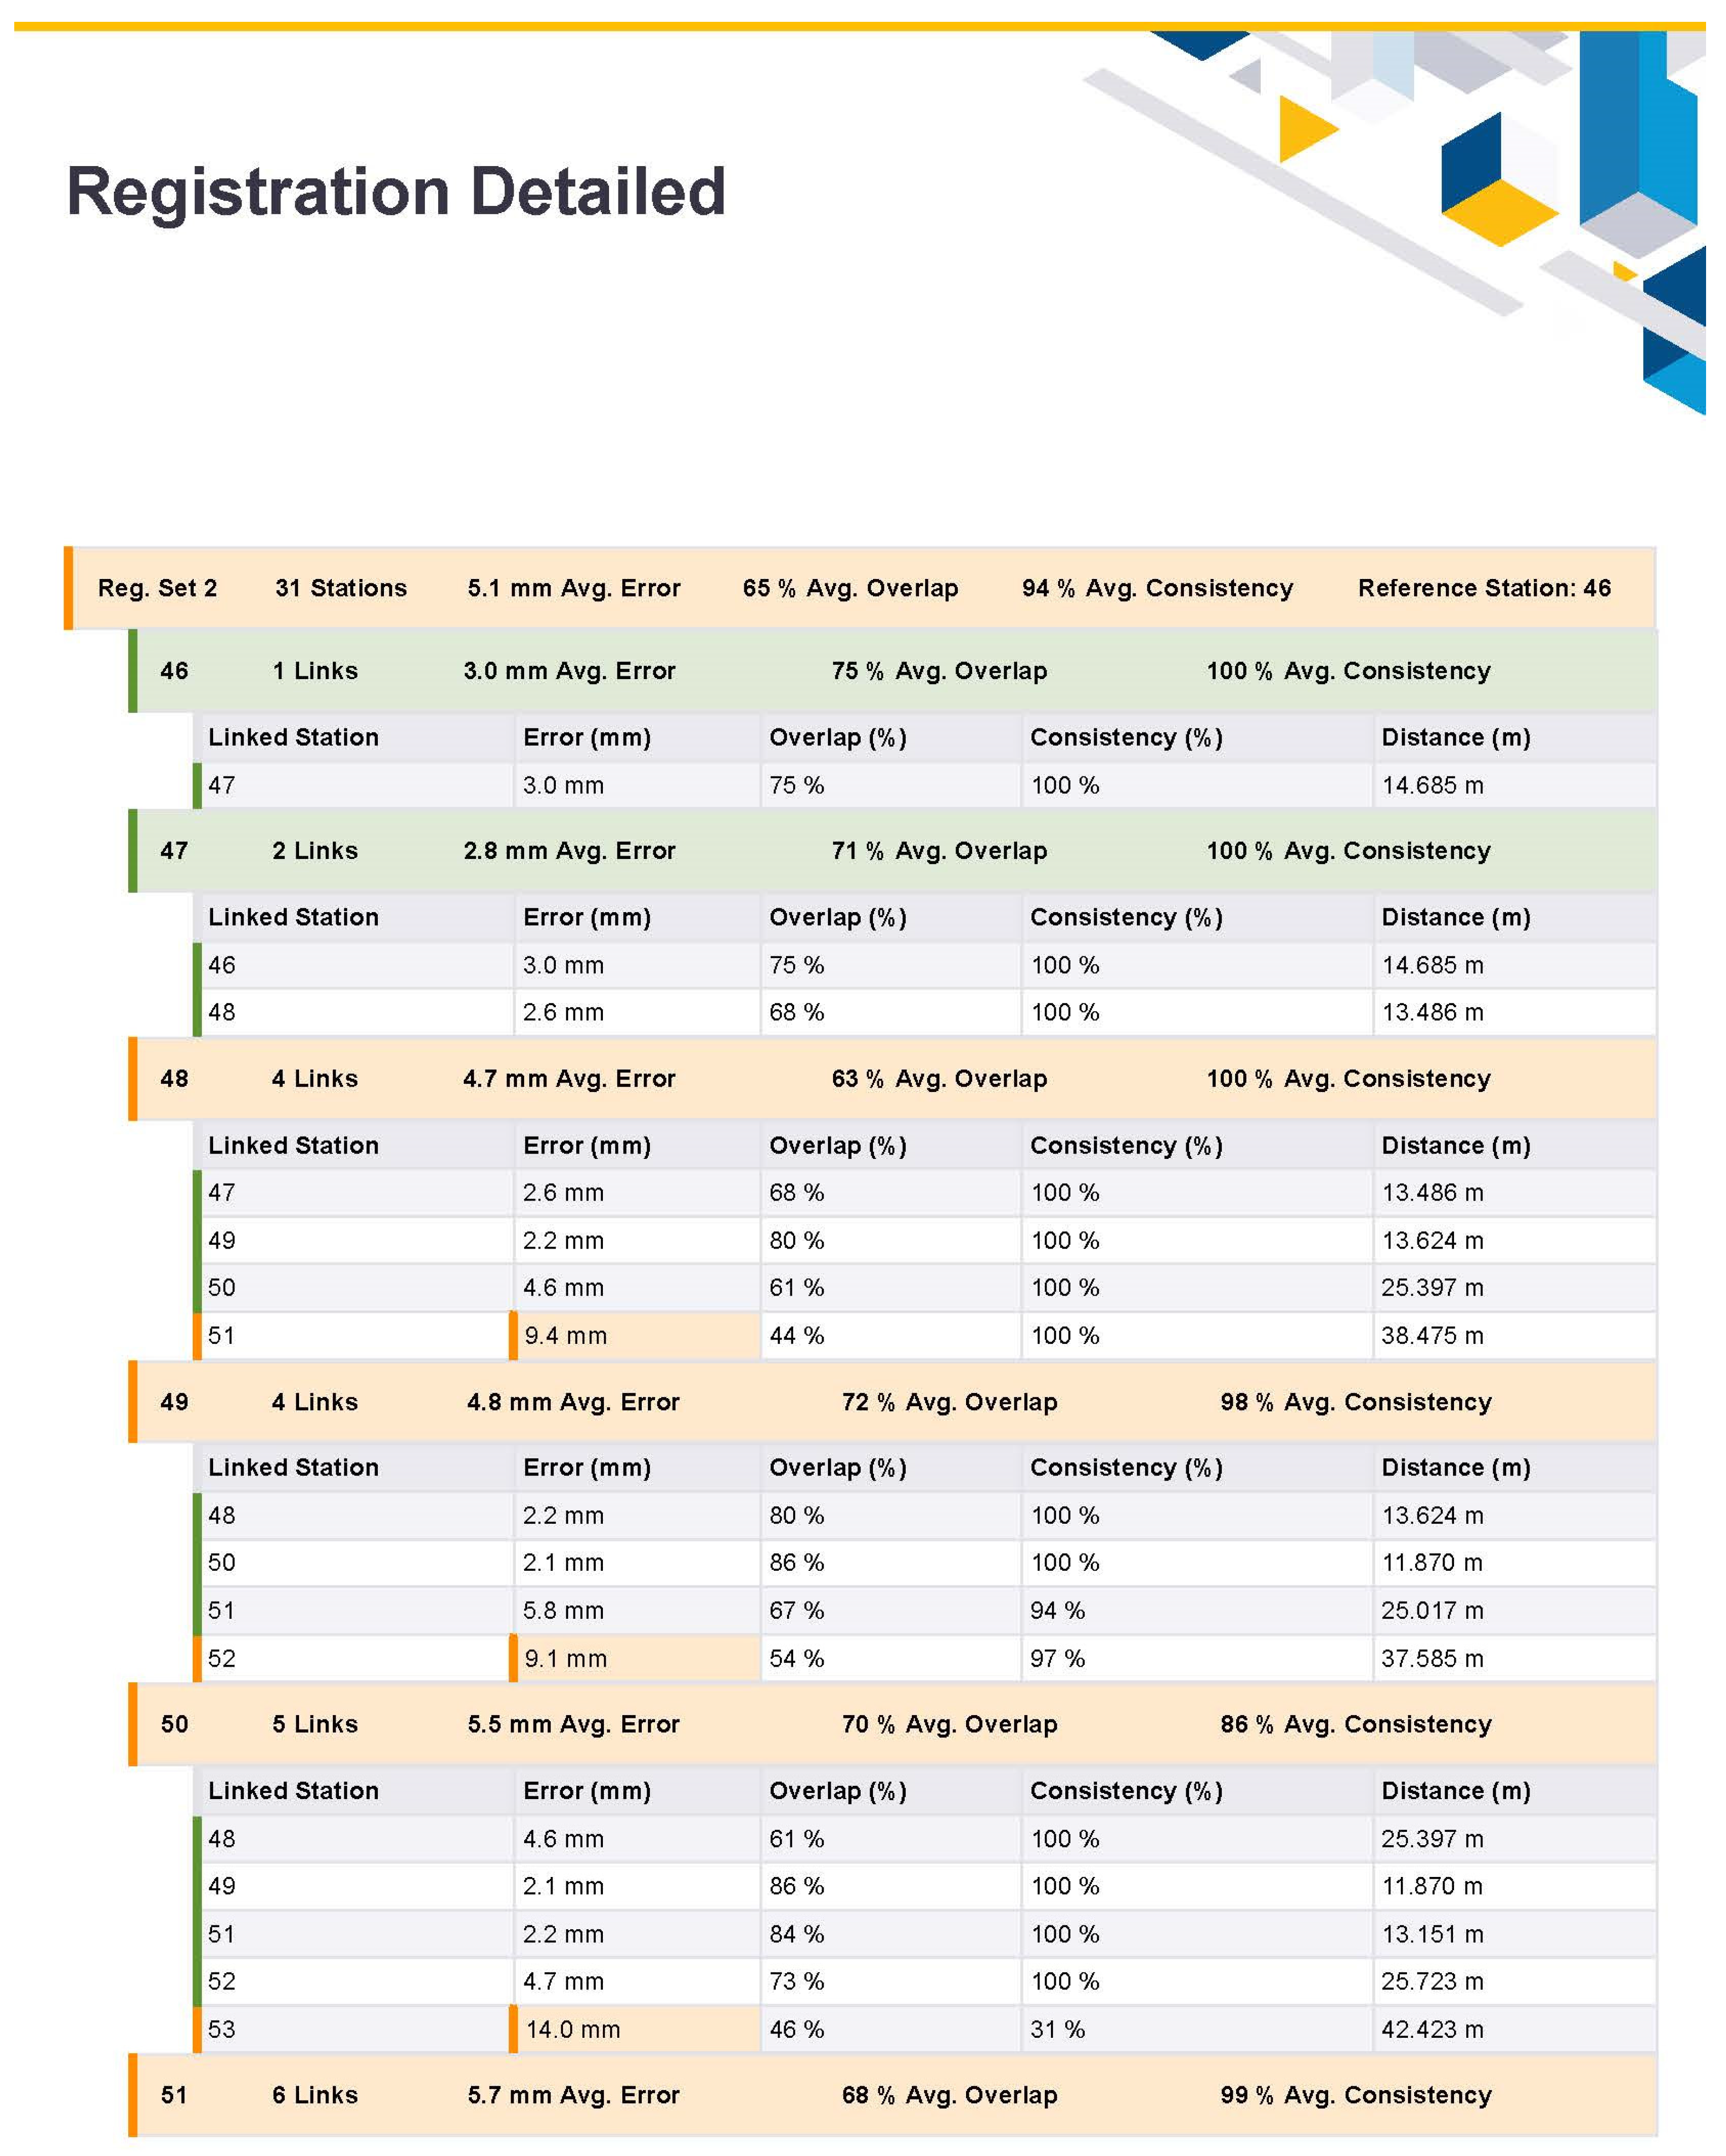
Figure 7.
Registration report.
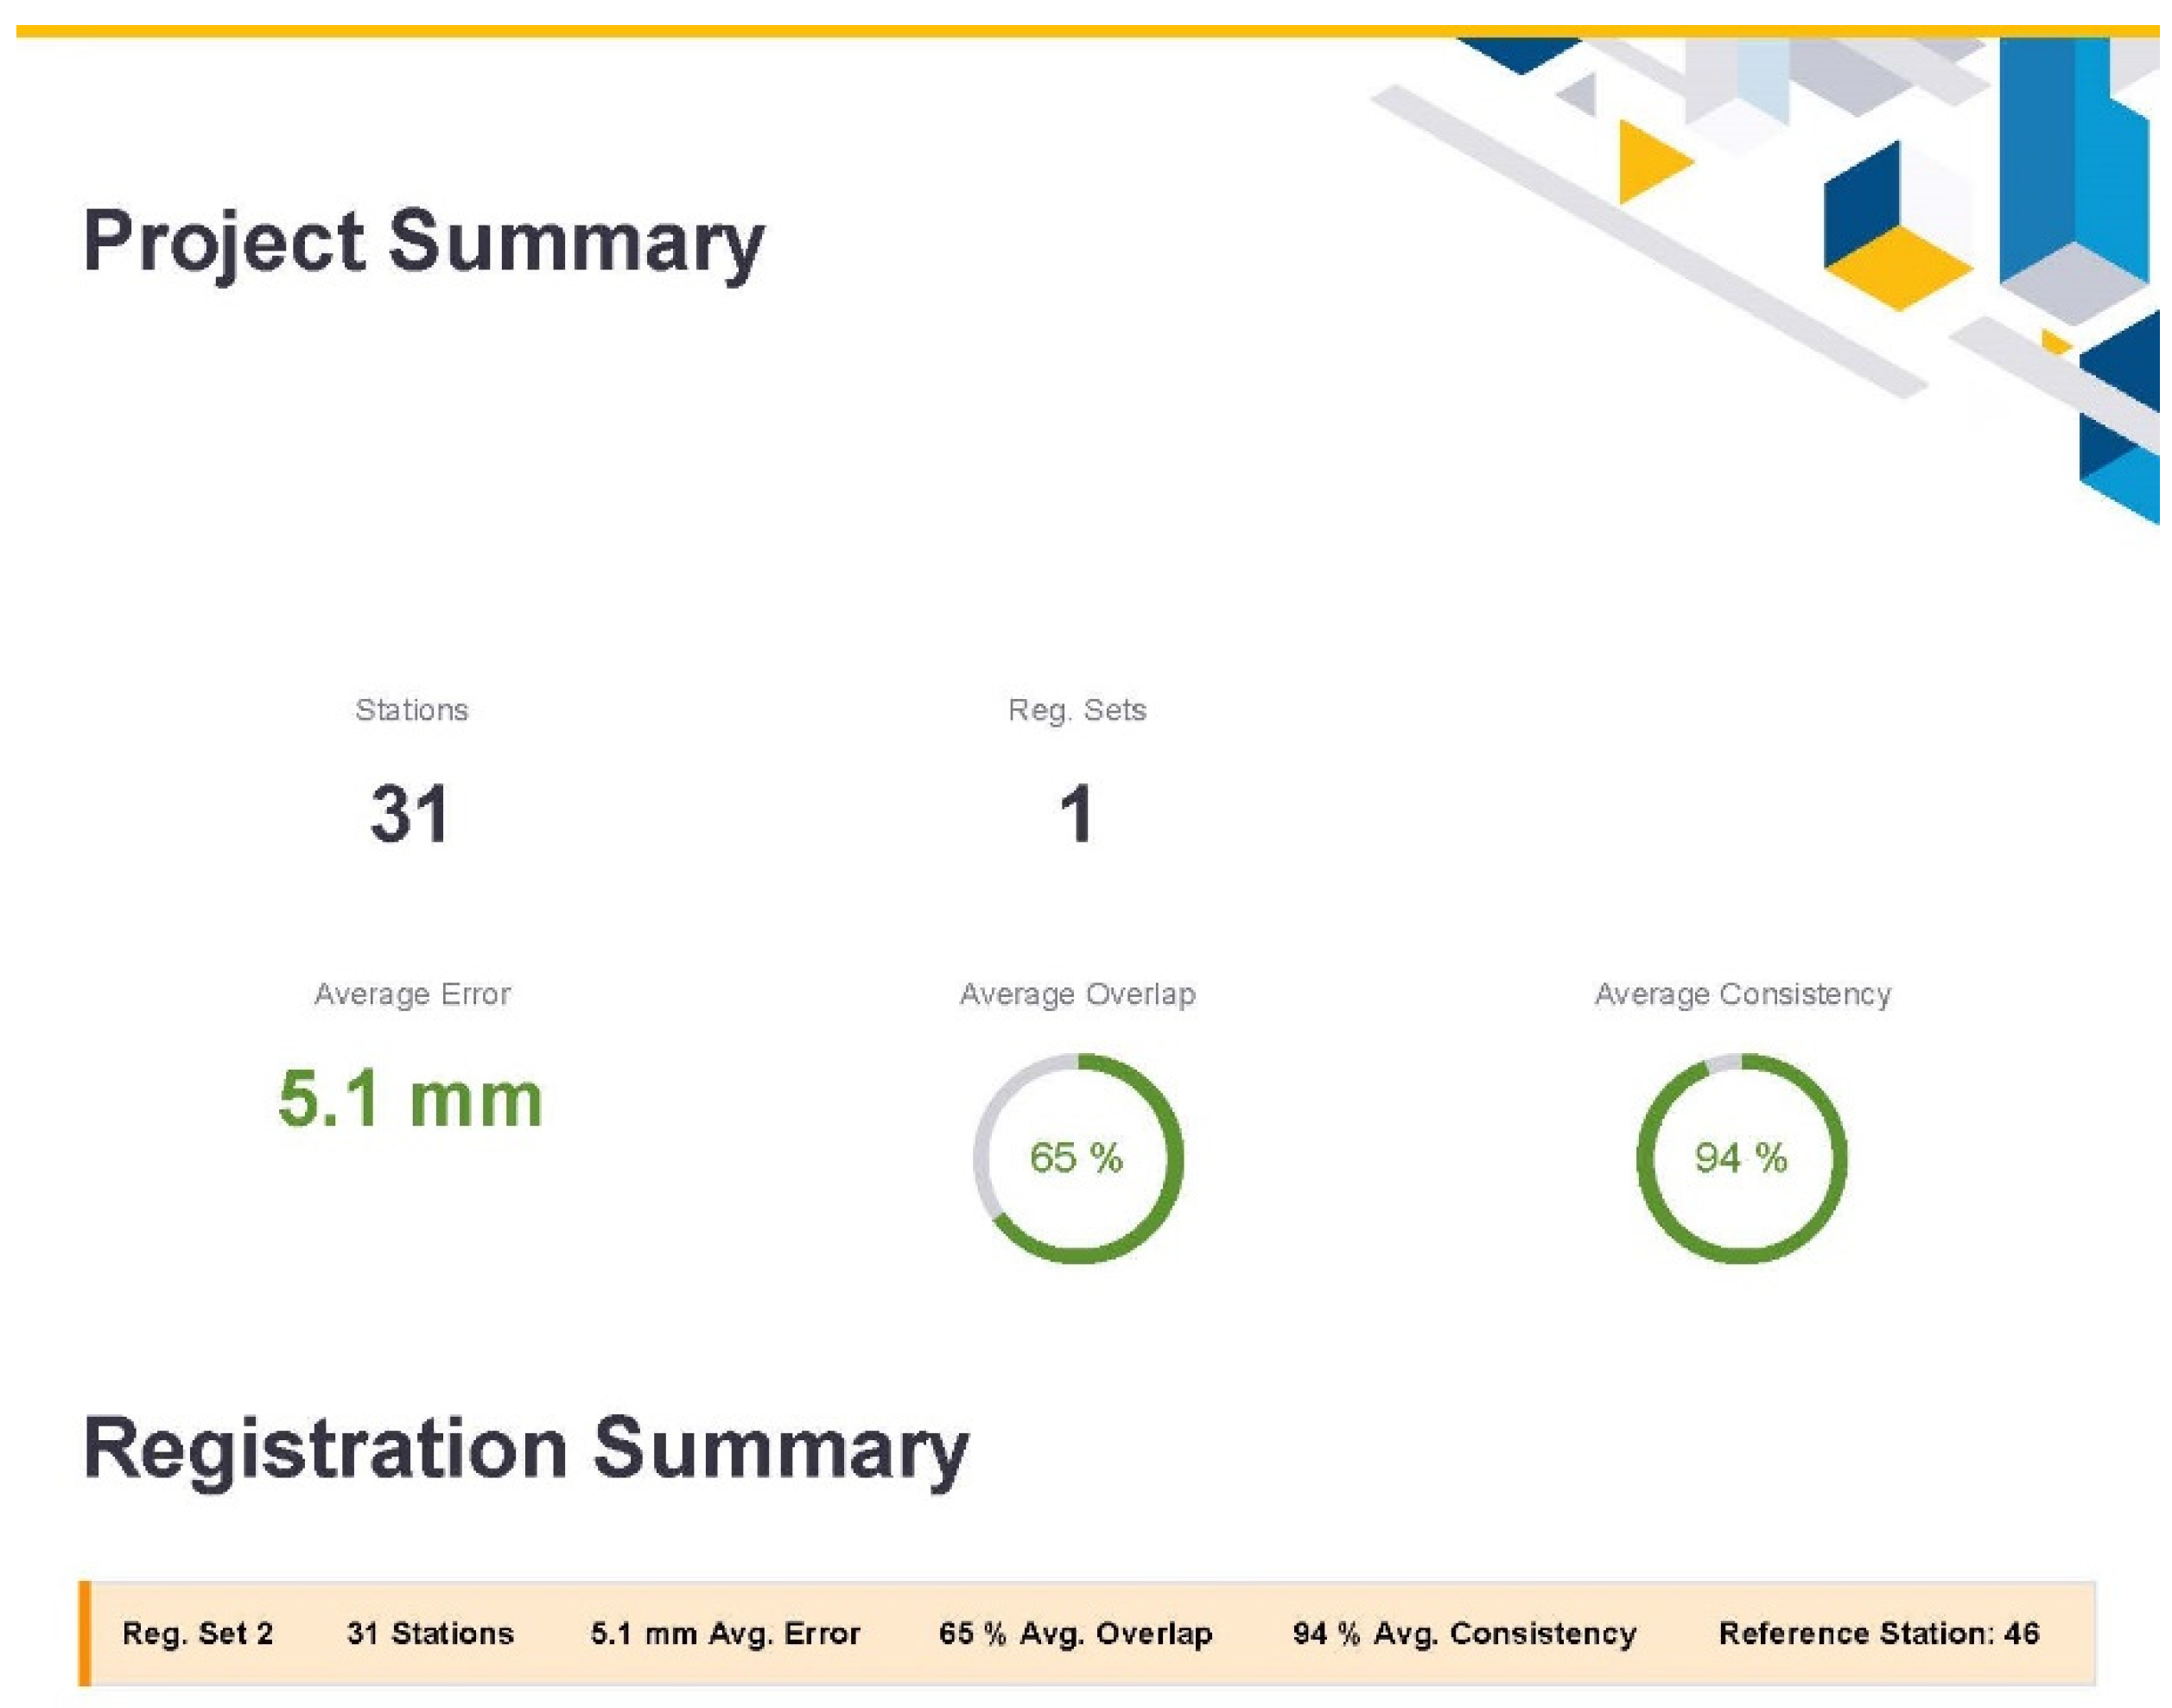

After registration process has done georeferencing all TLS measurement data.
3.1. 3D Modeling Using Point Clouds
All the measurement such as TLS and traverse has used non-projected ground plane. 3D model of the tunnel is created from the point clouds based on the center line provided by the project with the following assumption on its size: 2.5 m to both sides (right and left) from the center line, 3m in the perpendicular direction above the center line, upper top radius of the circle is 2.5 m. 3D model of the tunnel created using the point clouds is shown on Figure 8.
The erroneous points due to the machinery, techniques, human and other objects were filtered out from the point cloud using a statistical outlier removal (SOR) filter (in the software Trimble Business Center, module Tunnel).
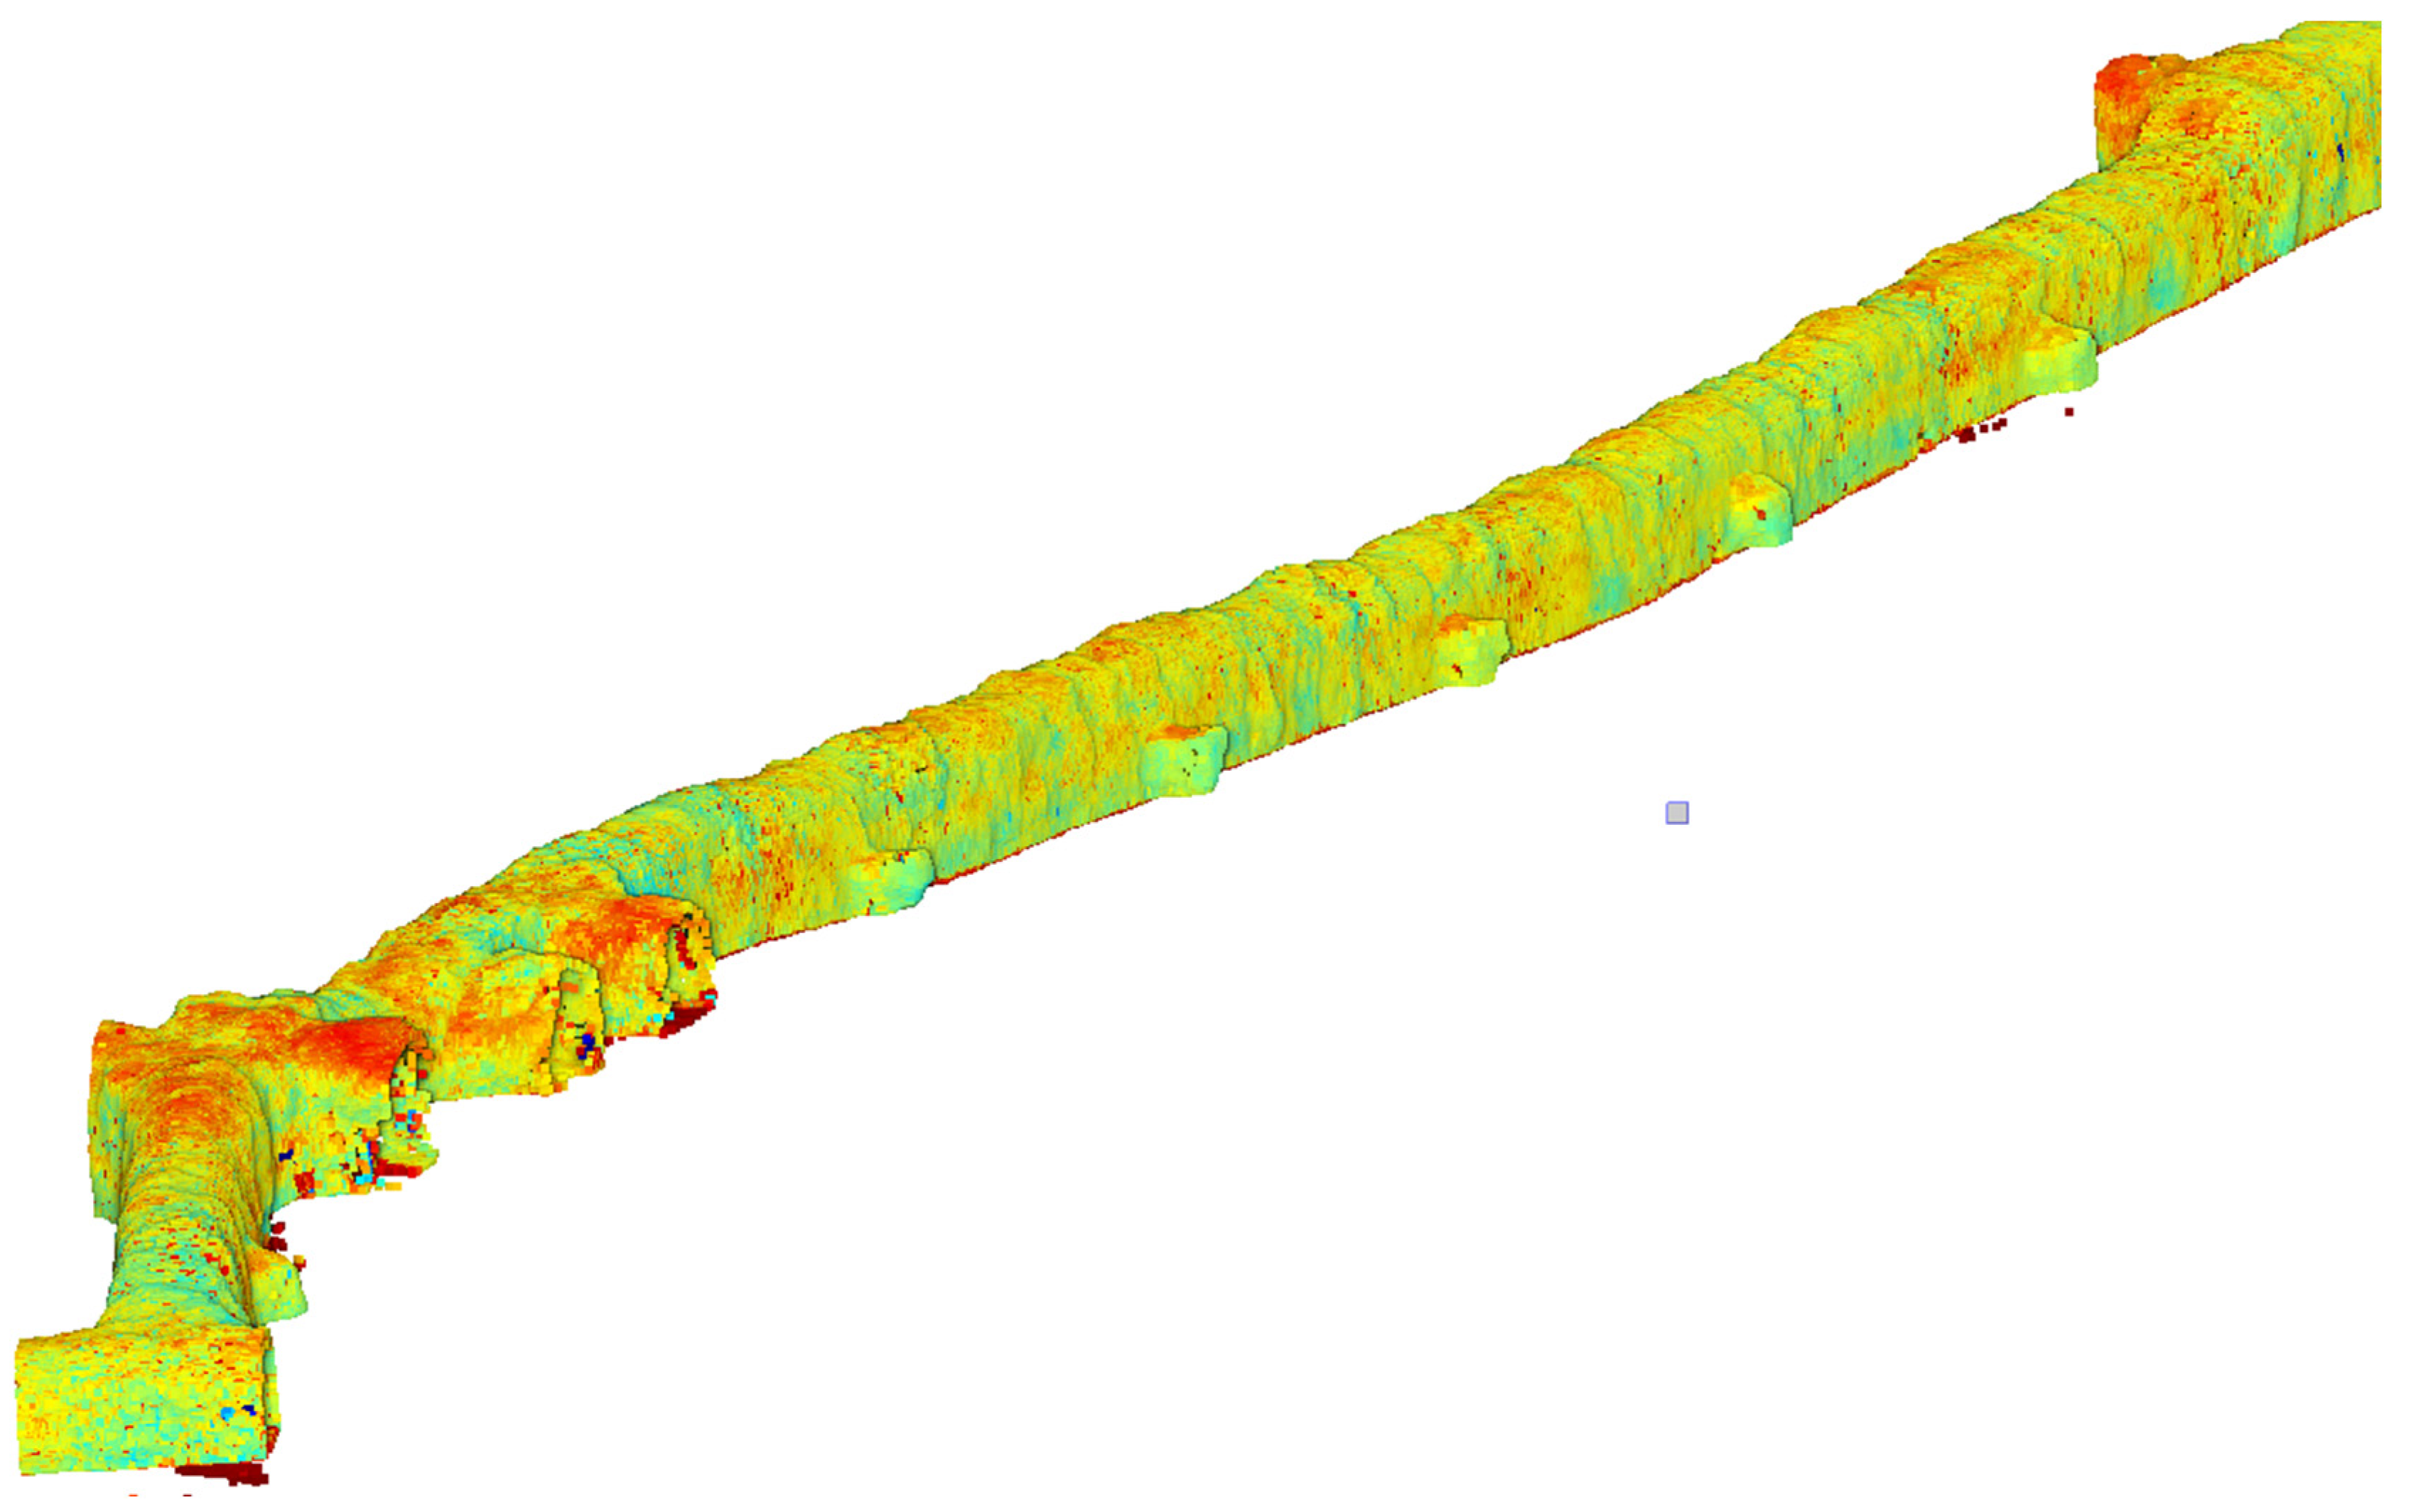
Figure 9.
3D tunnel generated from TLS point cloud.
3.2. Determining the Volume of Excavations through Ore Bodies
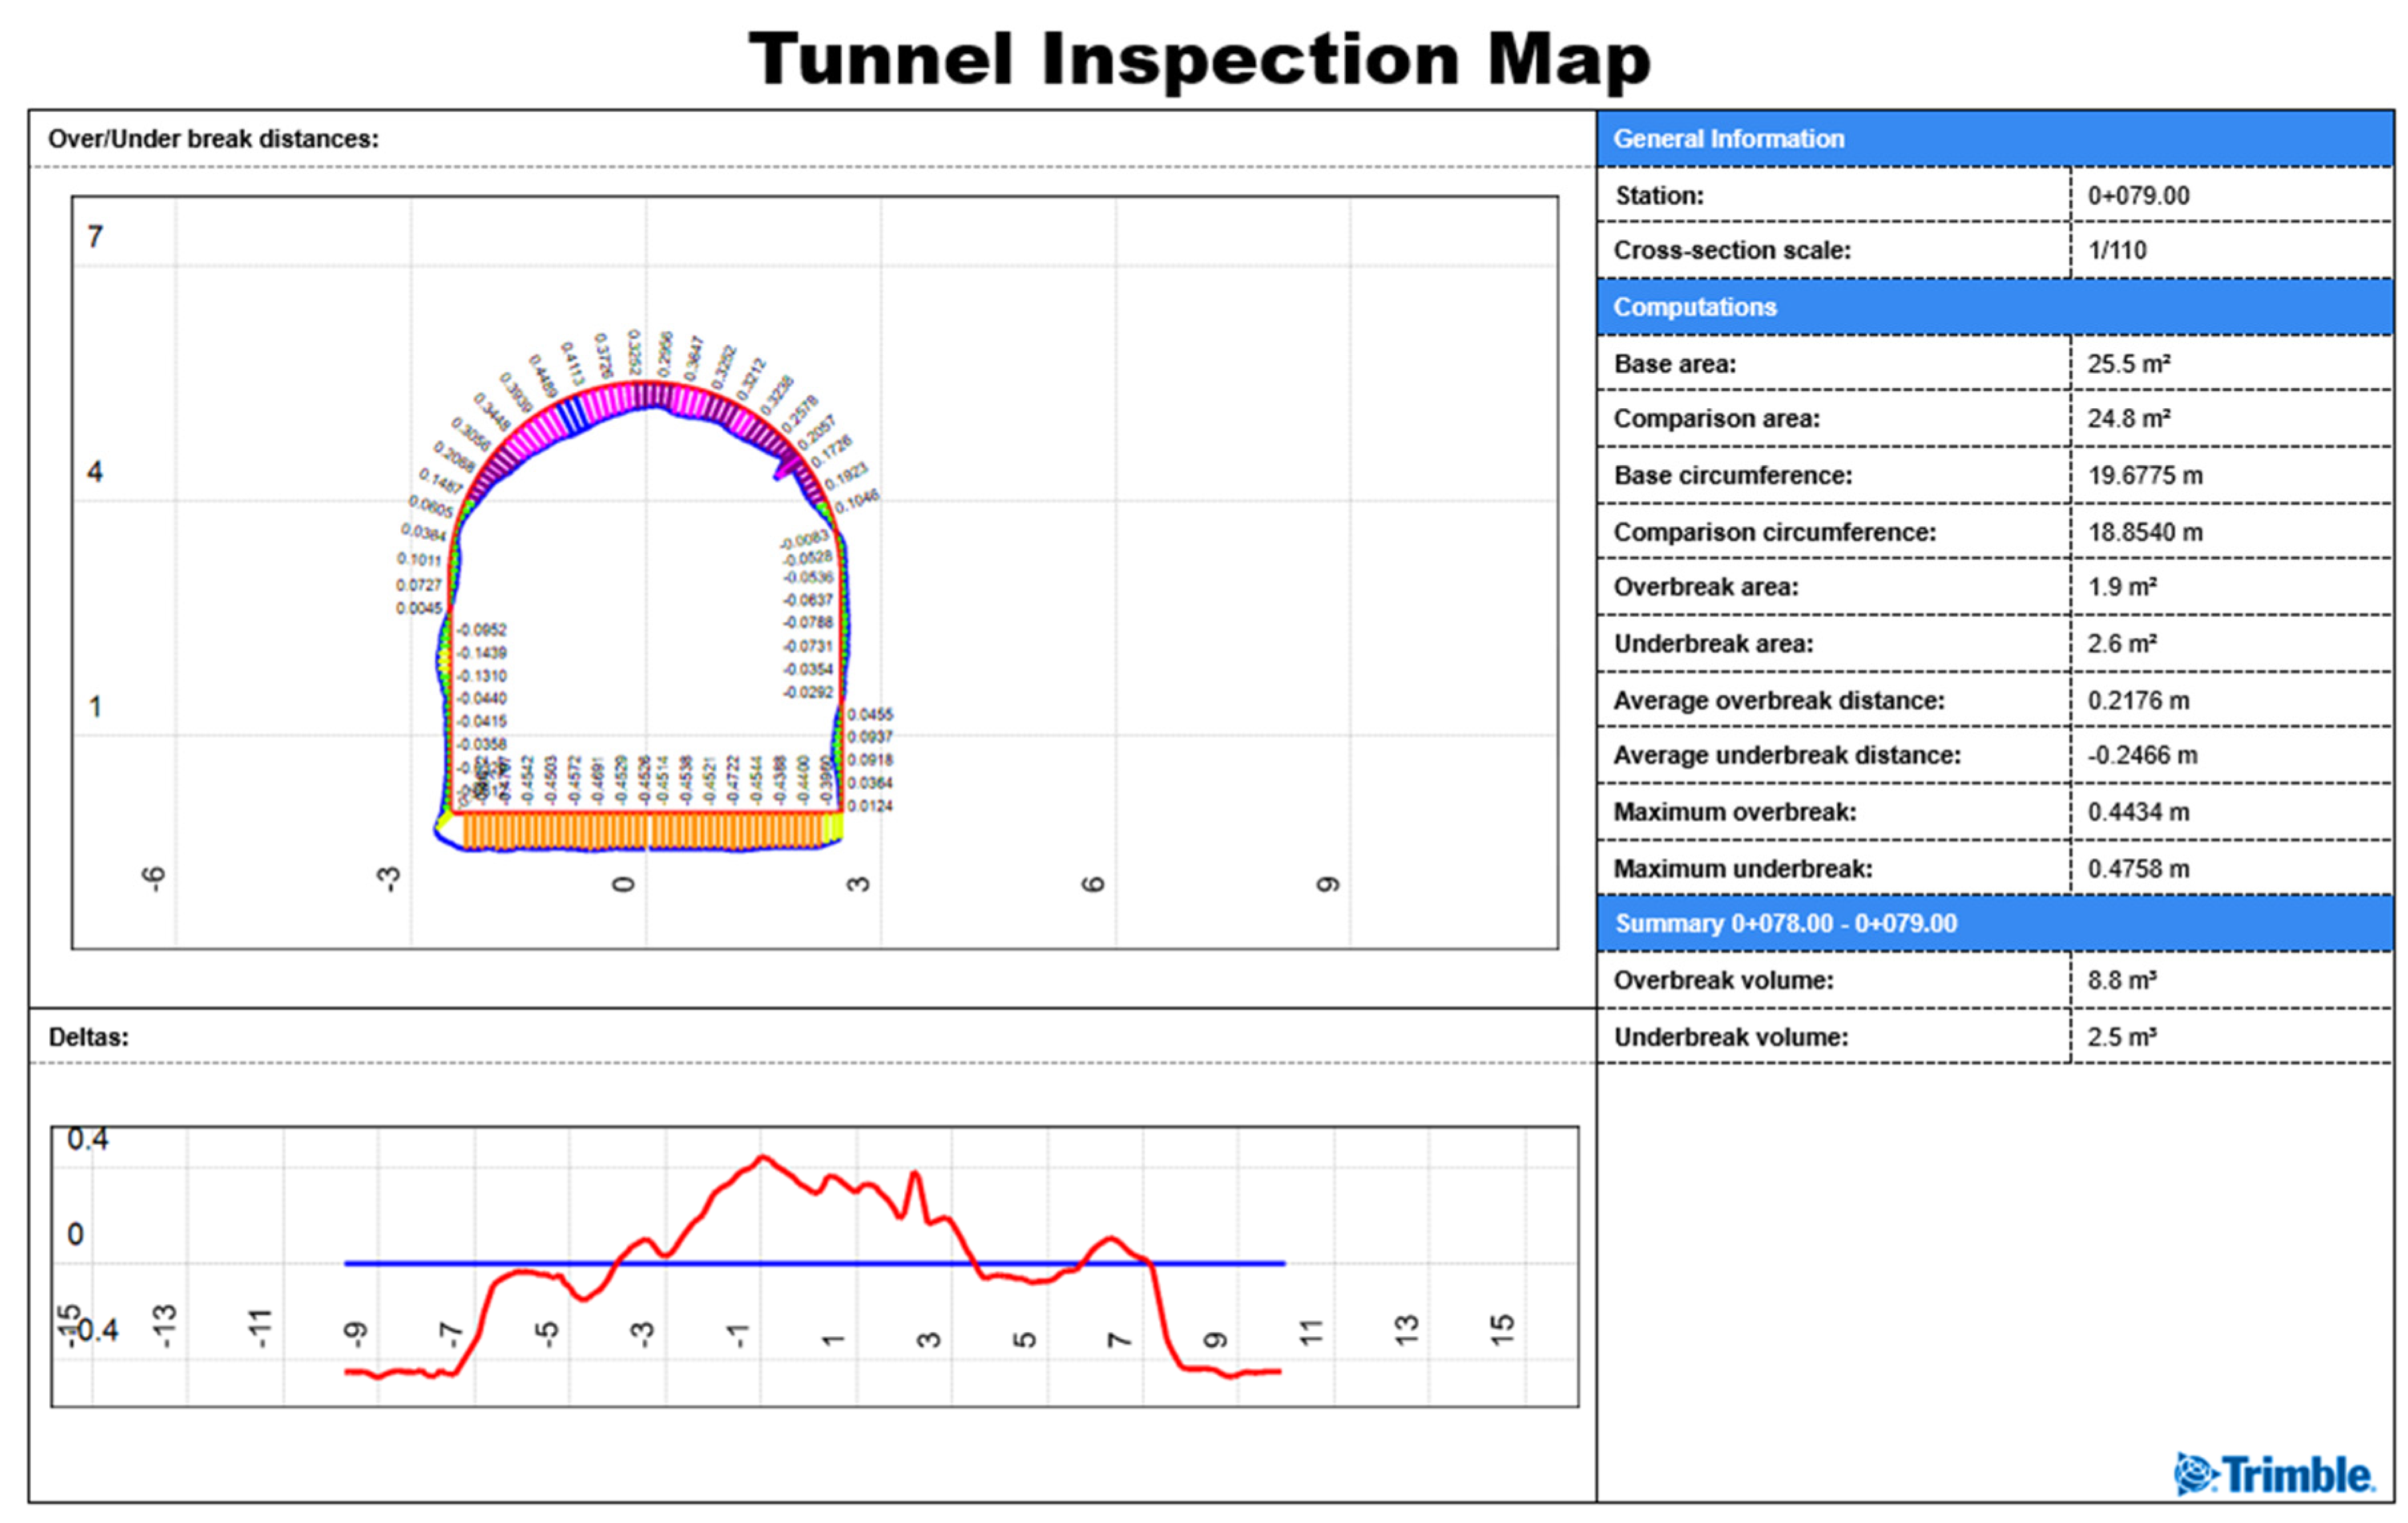
By building the tunnel based on the given center line an object is created from TLS point cloud. From this object the volume is calculated. Than a cross-section of cross excavation and penetration was created at every 1 meter, the area of which were compared with the project areas (Figure 9) [22].
Figure 9.
A comparison of the tunnel design and actual measured dimensions.
4. Results
Table 2 shows the results of the measured total length, large excavation size and actual volumes obtained on the underground mine levels provided by the Oyu Tolgoi project.
5. Conclusion and Discussion
The adjustment relative error of the underground control network of 18 points was 1:26000 in horizontal and 1:22000000 in vertical. These values satisfy the statement “In case the linear error of polygons less than 1:25000, polygons perimeter is less than 250 m, the absolute error does not exceed 10 mm”, thus the measurement and adjustment are considered as acceptable [2,3,6,7]. But at two points, shift of 28 mm along the Y (easting) axis at point CS882, 38 mm along the Y (easting) axis at CS796 were measured respectively to compare with the previous measurements. This difference might be explained by the displacement occurred due to the mining explosions and blasts. Therefore, additional redundant measurements of these points are required.
Our inspection carried out on comparison of the theoretical surface of the tunnel to a surface fitted to the point cloud shows the results of the point cloud, center line, surface mesh obtained from the TLS of the tunnel coincide with the excavation and penetration heading, measurement and mapping works ongoing in the underground mine of the Oyu Tolgoi project.
In the 7 levels of the underground mine, the measurement length provided by the project is 17358.3 m, measured value by the contractor is 17520.5 m; the total volume provided by the project 408285.4 m3, while the measured at all levels total volume is 431712.3 m3. Since the actual measured difference of 23426.9 m3 in volume, corresponding to the total length of 17.5 km of the selected tunnel, covers the mine shelters, service and ventilation pipes and other non-movable items, the heading, length and volume of excavation and penetration in the Oyu Tolgoi underground mine are being carried out in accordance with the planned design.
References
- А. Damdinsuren, J. Altantsetseg, Geodetic surveying and processing works. Sub-vol. Ulaanbaatar, 2013, p. 57-62.
- BR 11-106-08. Instructions for topographical drawing for scales 1:500, 1:1000, 1:2000 and 1:5 000. Ulaanbaatar, 2008. p. 37-41.
- BNaR 11-08-21. Geodetic works in construction, Ulaanbaatar,.
- BNaR 11-08-23. Geodetic work of construction objects., Ulaanbaatar, p. 51-71.
- BNaR 14-101-08. Main rules for establishing geodetic network of Mongolia using satellite (GPS/GLONASS) technology. Ulaanbaatar, 2014,.
- Chen, B.; Deng, K.; Fan, N.; Hao, M. 2013. Large-scale deformation monitoring in mining area by D-InSAR and 3D laser scanning technology integration. China, p. 4-5.
- Gallwey, J.; Eyre, M.; Coggan, J. A machine learning approach for the detection of supporting rock bolts from laser scan data in an underground mine. Tunn. Undergr. Space Technol. 2021, 107, 103656. [Google Scholar] [CrossRef]
- “Geodetic works in Construction” Building Norm and Rules. 11-108-21, Ulaanbaatar, 2021.
- Jakub Janus., Piotr Ostrogorski. 2022. Underground mine tunnel modelling using laser scan data in relation to manual geometry measurements. P. 7-8.
- Jiang, Q.; Zhong, S.; Pan, P.-Z.; Shi, Y.; Guo, H.; Kou, Y. Observe the temporal evolution of deep tunnel’s 3D deformation by 3D laser scanning in the Jinchuan No. 2 Mine. Tunn. Undergr. Space Technol. 2020, 97, 103237. [Google Scholar] [CrossRef]
- Kekec, B.; Bilim, N.; Karakaya, E.; Ghiloufi, D. Applications of Terrestrial Laser Scanning (TLS) in Mininig: A Review. Turkish Journal of LiDAR 2021, 3, 31–38. [Google Scholar]
- Krach, A.; Krawczyk, J.; Kruczkowski, J.; Pałka, T. Variability of the velocity field and volumetric flow rate in air ways of underground mines. Arch. Min. Sci. 2006, 1. [Google Scholar]
- Lenda, G.; Lewi’ nska, P.; Siwiec, J. Accuracy of merging point clouds at the maximum range of a scanner with limited pos-sibilities of target placement. Arch. Civ. Eng. 2019, 65, 4. [Google Scholar]
- Lenda, G.; Lewi’ nska, P.; Siwiec, J. Accuracy of merging point clouds at the maximum range of a scanner with limited pos-sibilities of target placement. Arch. Civ. Eng. 2019, 65, 4. [Google Scholar]
- Michalak, D.; Gomez Herrero, J.A. Innovative solutions need an innovative approach–3D printing technology, example of use and conclusion from implementation in an organization. Min. Mach. 2020, 162, 2. [Google Scholar]
- Milenkovic, M.; Pfeifer, N.; Glira, P. Applying terrestrial laser scanning for soil surface roughness assessment. Remote. Sens. 2015, 7, 2007–2045. [Google Scholar] [CrossRef]
- Mo, S.; Sheffield, P.; Corbett, P.; Ramandi, H.L.; Oh, J.; Canbulat, I.; Saydam, S. A numerical investigation into floor buckling.
- mechanisms in underground coal mine roadways. Tunn. Undergr. Space Technol. 2020, 103, 103497. [CrossRef]
- Ozturk, C. Support design of underground openings in an asphaltite mine. Tunn. Undergr. Space Technol. 2013, 38, 288–305. [Google Scholar] [CrossRef]
- Peji’c, M. Design and optimisation of laser scanning for tunnels geometry inspection. Tunn. Undergr. Space Technol. 2013, 37, 199–206. [Google Scholar] [CrossRef]
- Roszczynialski, W.; Trutwin, W.; Wacławik, J. Kopalniane Pomiary Wentylacyjne; S’la˛sk: Katowice, Poland, 1992. [Google Scholar]
- Raval, S.; Banerjee, B.P.; Kumar Singh, S.; Canbulat, I. A preliminary investigation of mobile mapping technology for underground mining. In Proceedings of the IEEE International Geoscience and Remote Sensing Symposium; IEEE: Yokohama, 2019; pp. 6071–6074. [Google Scholar]
- Xie, H.; Zhao, J.; Zhou, H.; Ren, S.; Zhang, R. Secondary utilizations and perspectives of mined underground space. Tunn. Undergr. Space Technol. 2020, 96, 103129. [Google Scholar] [CrossRef]
- https://geospatial.trimble.com/en/links?dcs=Collection-131200.
Figure 1.
Sketch of the measured traverse network (shown part of the network).
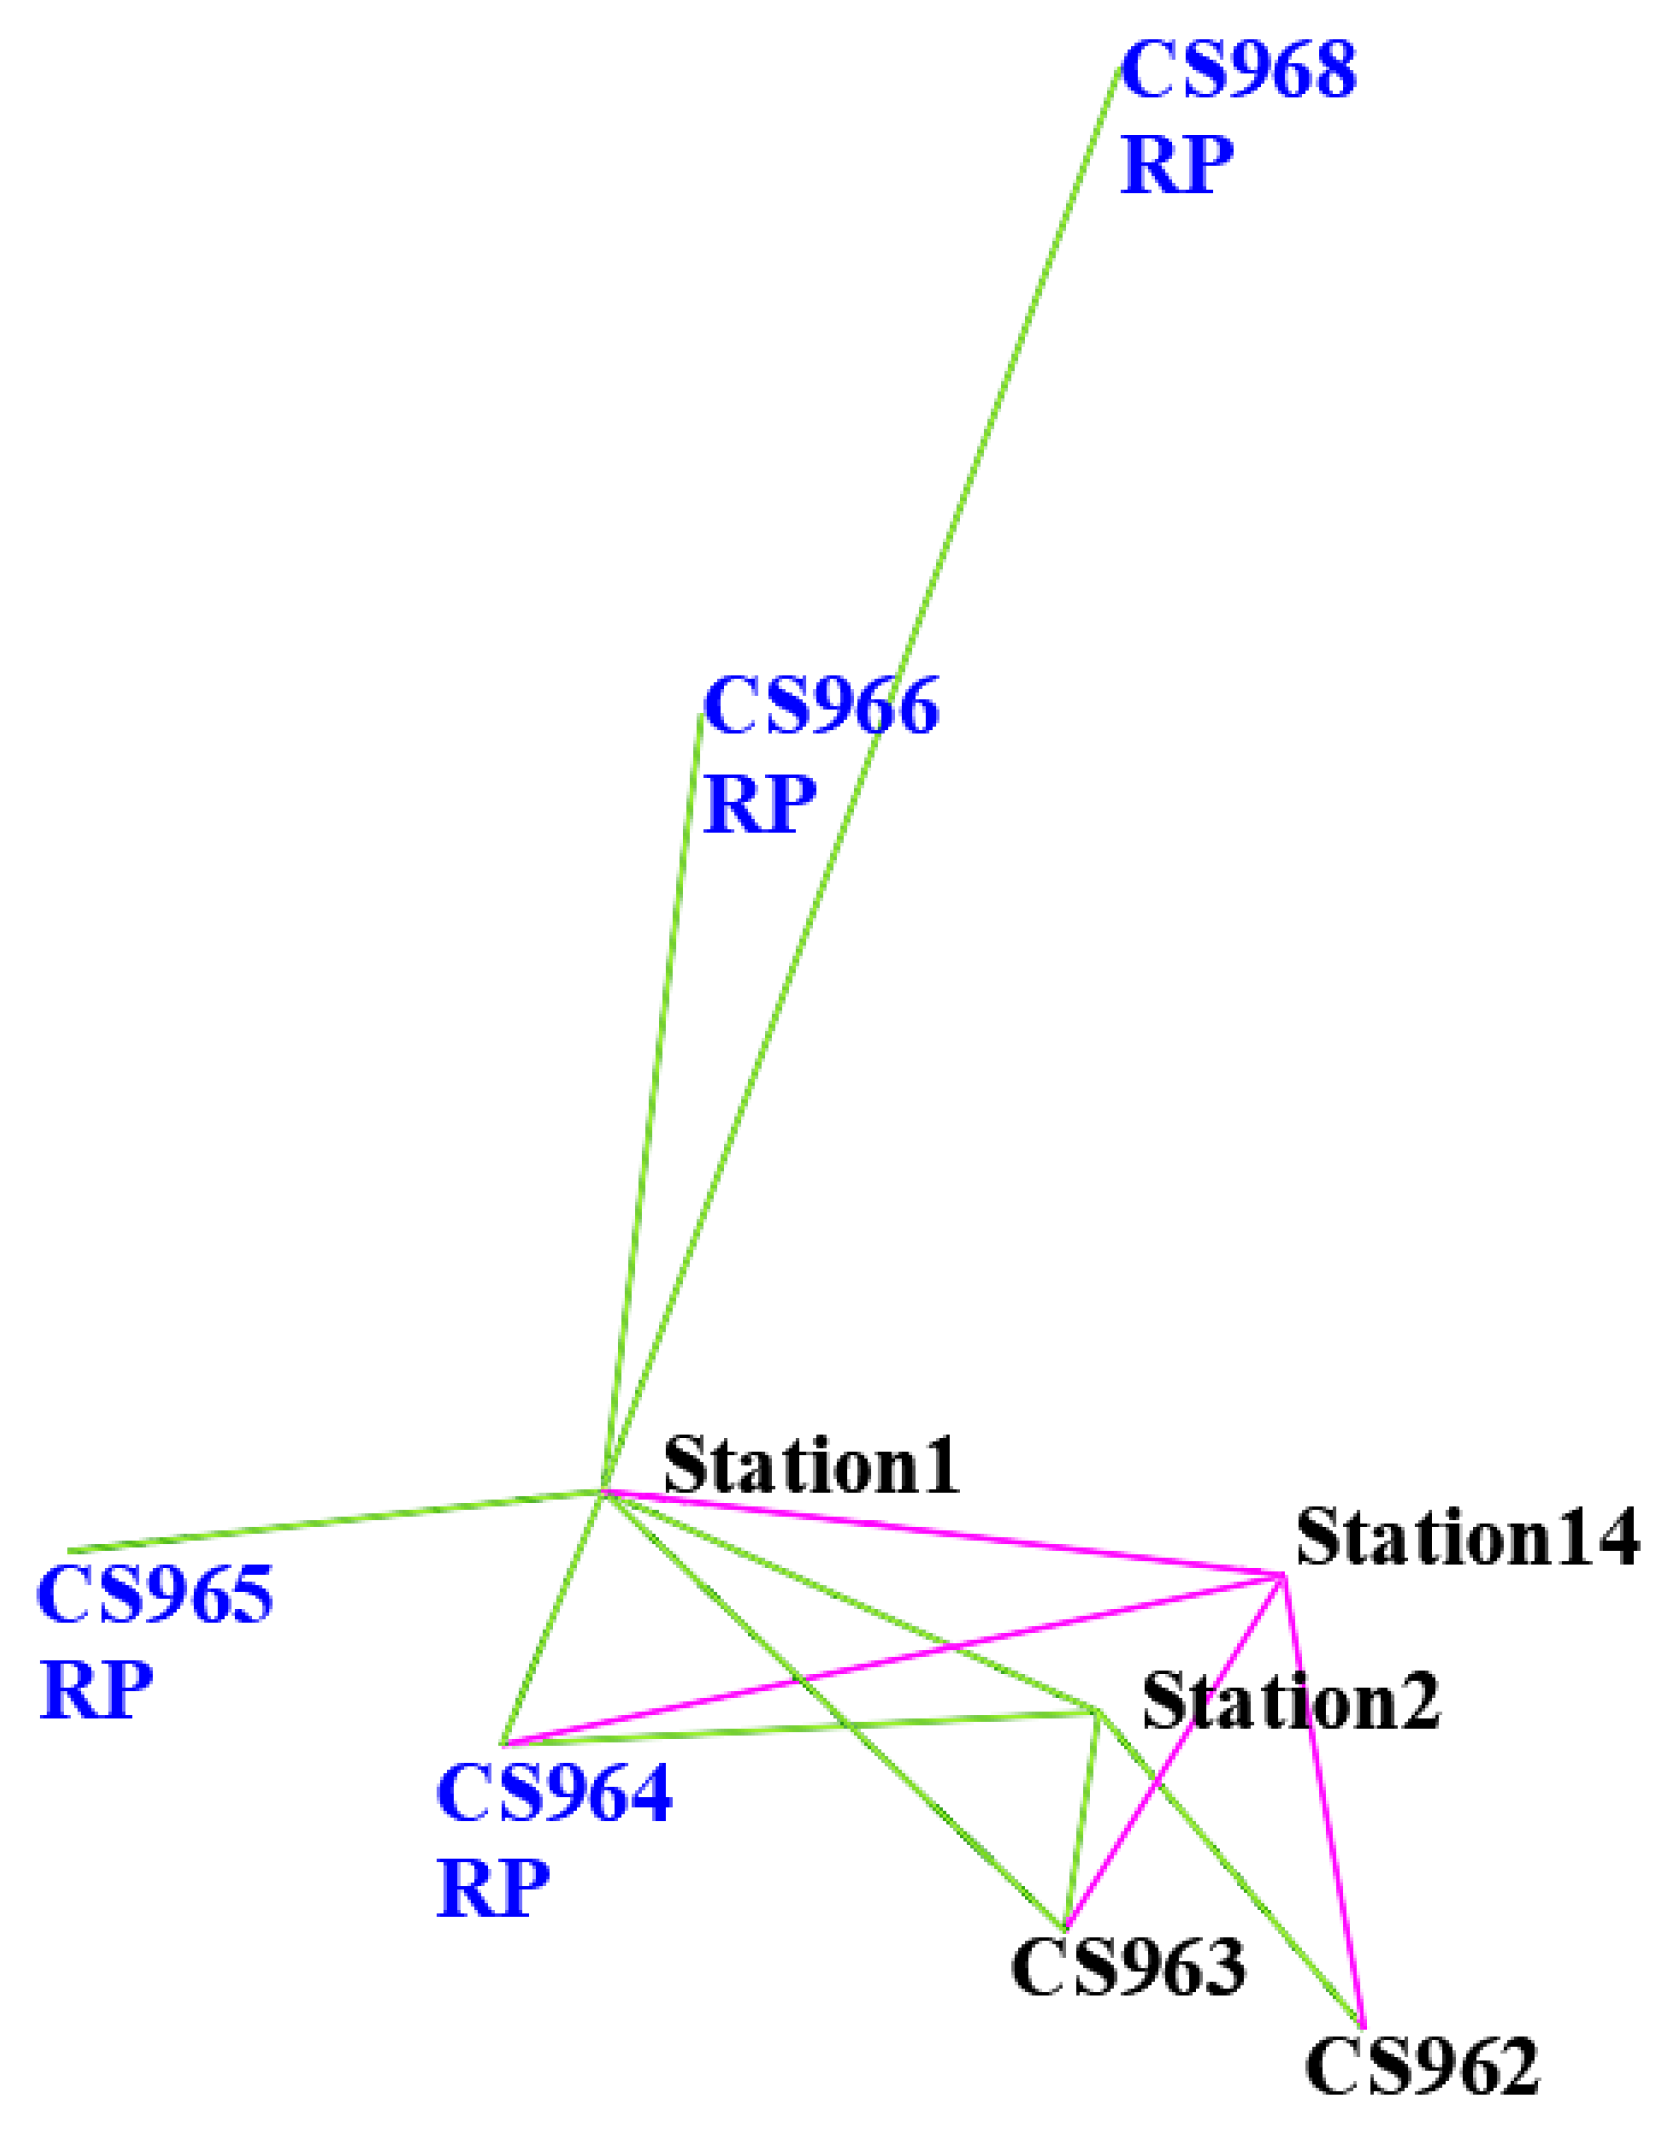
Figure 8.
3D representation of the tunnel generated from TLS point cloud.
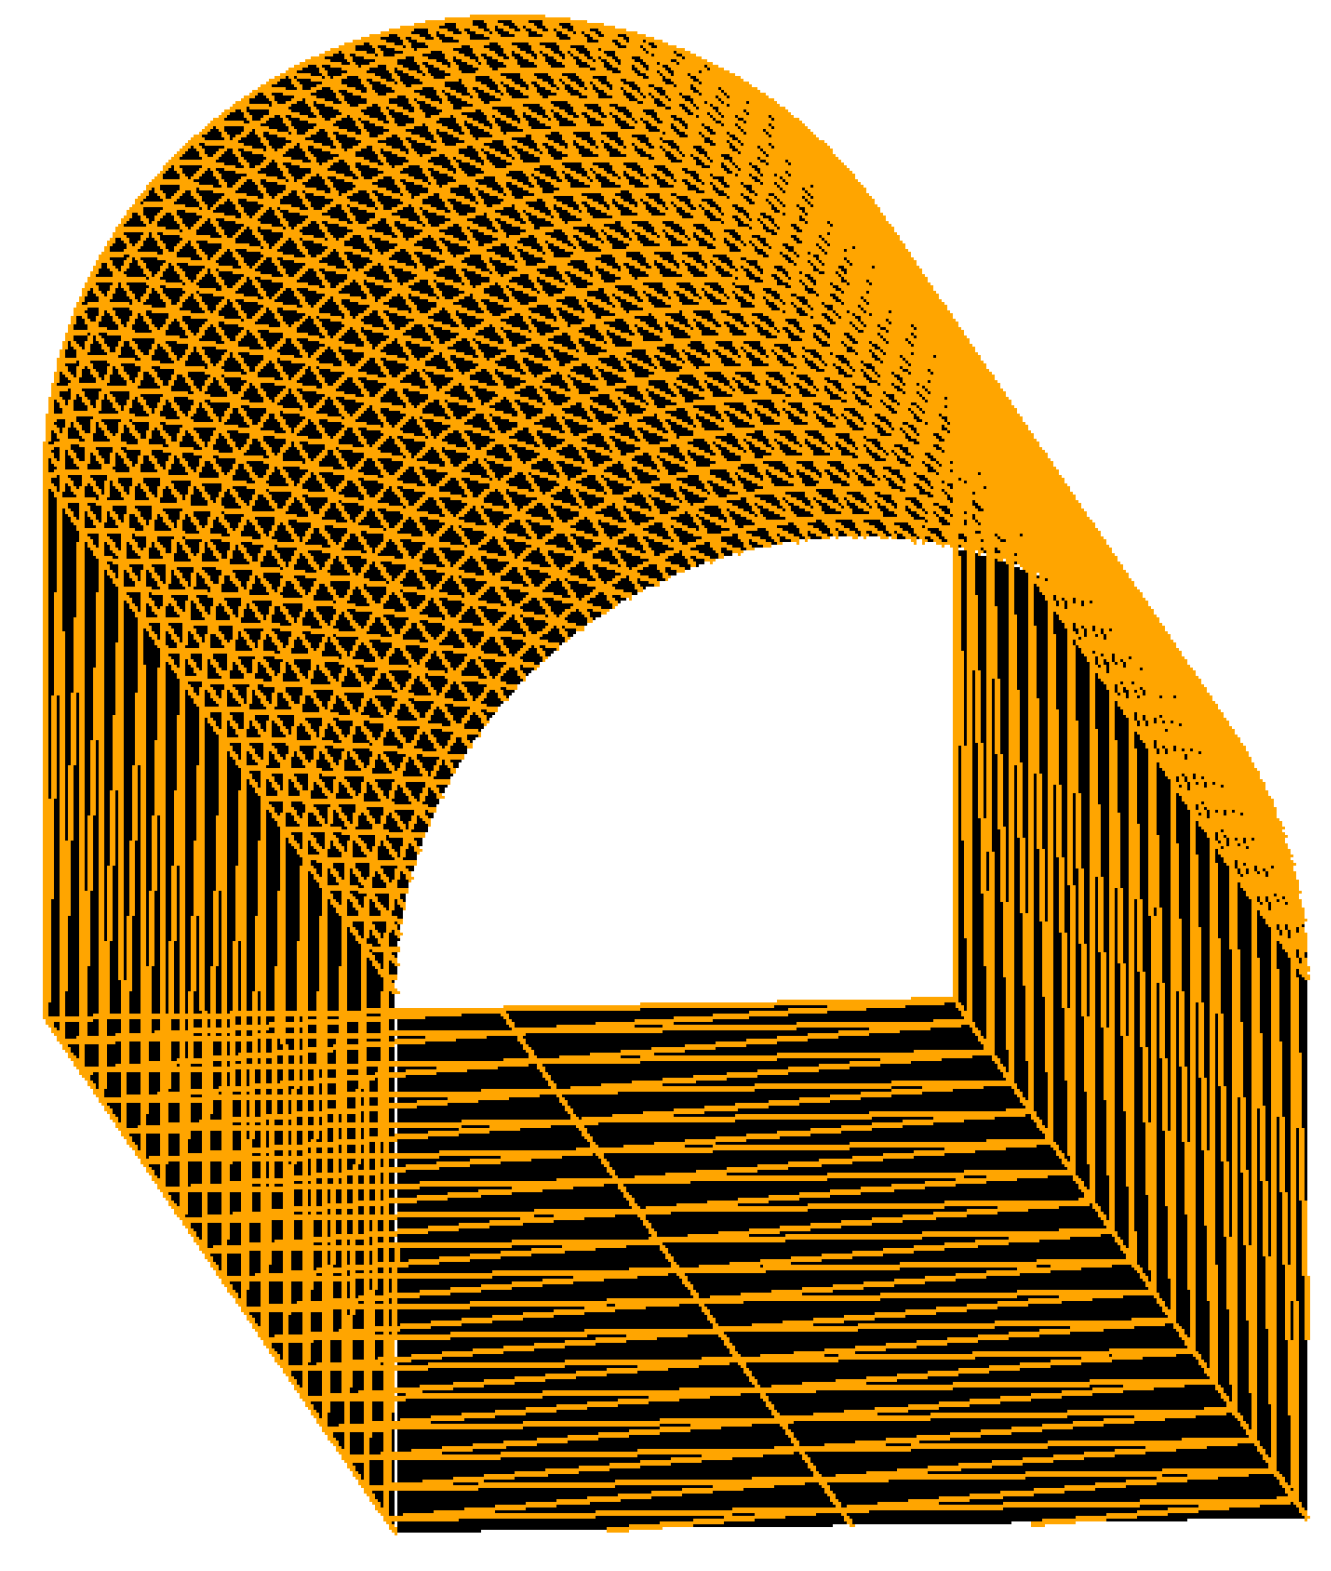
Figure 11.
Tunnel dimensions with 24.8 sq.m area, volume in 1 m length tunnel: 24.8 cubic meter = 1 equivalent meter.
Figure 11.
Tunnel dimensions with 24.8 sq.m area, volume in 1 m length tunnel: 24.8 cubic meter = 1 equivalent meter.
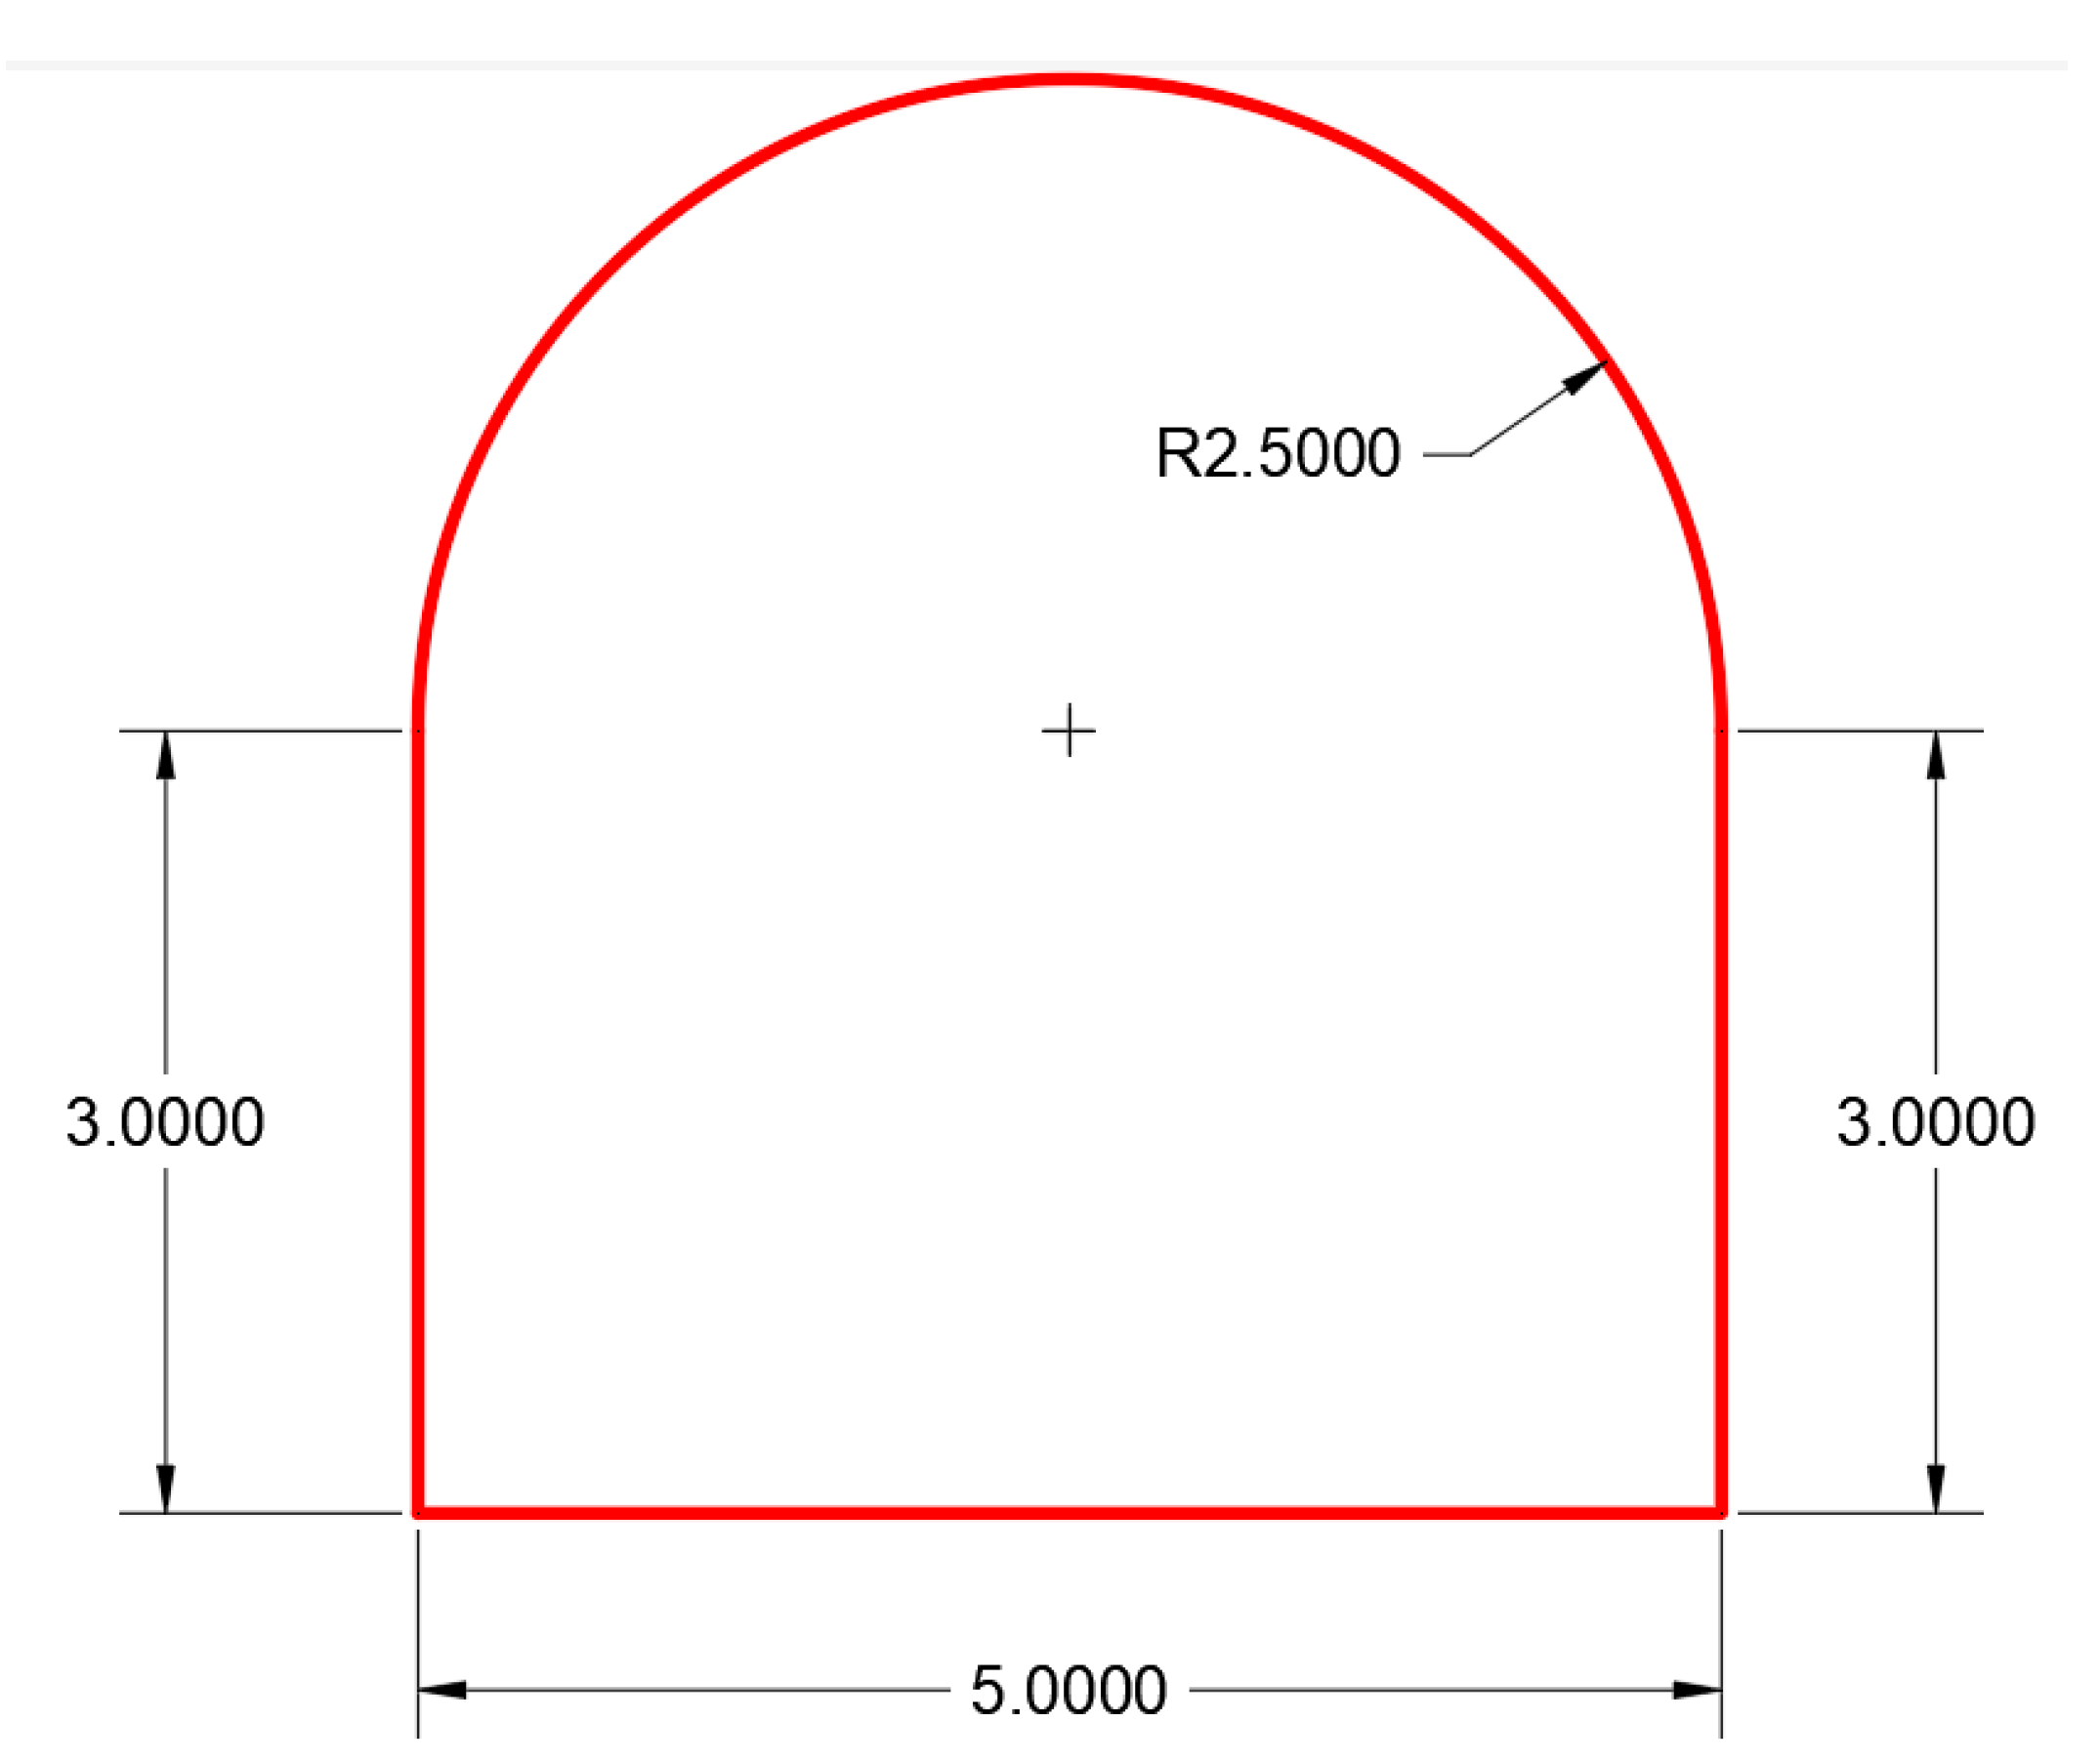
Table 2.
Results of measurements made on the underground mine levels and comparison with the project designed value: total length, dimenstions of large excavation and actual volumes.
Table 2.
Results of measurements made on the underground mine levels and comparison with the project designed value: total length, dimenstions of large excavation and actual volumes.
| Mine area level | Total actual length (m) | Total designed length (m) | Actual Volume (cubic m) | Designed value(cubic m) | Differences (m) |
| APL | 1180.2 | 1181.1 | 26559.8 | 29290.2 | 0.9 |
| UCL | 2050.4 | 2050.7 | 47362.6 | 49264.4 | 0.3 |
| EXL | 6476.7 | 6467.9 | 125105.1 | 159539.7 | -8.8 |
| RAL | 641 | 640.8 | 21474.3 | 15908.6 | -0.2 |
| HLL | 3732.2 | 3733.18 | 112302.7 | 92313.2 | 0.98 |
| TWS | 166.6 | 166.6 | 4657.9 | 4134.1 | 0 |
| FAL | 3276.3 | 3280.2 | 90149.9 | 81262.1 | 3.9 |
| Total | 17523.4 | 17520.48 | 408285.4 | 431712.3 | -2.92 |
Note: The meanings of abbreviations: APL – Apex level, UCL – Undercut level, EXL – Extraction level, RAL – Return air level, HLL – Haulage level, TWS – Track Work Shop, FAL – Fresh air level. The measurement was made on these 7 levels and according to the length of the line provided by the customer, the volume of the tunnel measured at each level and the dimensions were determined.
Disclaimer/Publisher’s Note: The statements, opinions and data contained in all publications are solely those of the individual author(s) and contributor(s) and not of MDPI and/or the editor(s). MDPI and/or the editor(s) disclaim responsibility for any injury to people or property resulting from any ideas, methods, instructions or products referred to in the content. |
© 2024 by the authors. Licensee MDPI, Basel, Switzerland. This article is an open access article distributed under the terms and conditions of the Creative Commons Attribution (CC BY) license (http://creativecommons.org/licenses/by/4.0/).
Copyright: This open access article is published under a Creative Commons CC BY 4.0 license, which permit the free download, distribution, and reuse, provided that the author and preprint are cited in any reuse.


