
Submitted:
22 March 2024
Posted:
26 March 2024
You are already at the latest version
Abstract
This study aimed to evaluate the safety and tolerability of STP1, a combination of ibudilast and bumetanide, tailored for the treatment of a specific subgroup of patients with Autism Spectrum Disorder (ASD), namely ASD Phenotype 1 (ASD-Phen1). We conducted a randomized, double-blind, placebo-controlled, parallel-group phase 1b study with two 14-day treatment phases (registered at clinicaltrials.gov as NCT04644003). Nine ASD-Phen1 patients were administered STP1, while three received a placebo. We assessed safety and tolerability, along with electrophysiological markers, such as EEG, Auditory Habituation, and Auditory Chirp Synchronization, to better understand STP1's mechanism of action. Additionally, we used several clinical scales to measure treatment outcomes. The results showed that STP1 was safe and well-tolerated, with electrophysiological markers indicating a significant and dose-related reduction of gamma power in the whole brain and in brain areas associated with executive function and memory. Treatment with STP1 also increased alpha 2 power in frontal and occipital regions and improved habituation and neural synchronization to auditory chirps. Although numerical improvements were observed in several clinical scales, they did not reach statistical significance. Overall, this study suggests that STP1 is safe and well-tolerated in ASD-Phen1 patients and shows indirect target engagement in ASD brain regions of interest.
Keywords:
ASD-Phen1
; STP1
; ibudilast
; bumetanide
; phase 1b
; EGG
; NIH-TCB
; SRS-2
; ABC-C
1. Introduction
Autism Spectrum Disorder (ASD) comprises a group of lifelong neurodevelopmental conditions that, according to recent estimates, affect 1.5% of the population in developed countries [1]. In 2020, a study showed that prevalence in the USA was 3.8 times higher among boys as compared to girls (43.0 versus 11.4)[2]. According to the current diagnostic criteria DSM-5 (Diagnostic and Statistical Manual of Mental Disorders, 5th Edition) [3], an individual with ASD must show deficits in social interaction and communication combined with at least two of four subdomains of restricted or repetitive behaviors. The manifestations of ASD must cause clinically significant impairment, affecting the ability of patients to interact with others, especially same aged peers in youth.
The current version of the DSM-5 abandoned classifications of subtypes of ASD to group them under one umbrella, mostly due to the lack of objective criteria to define previous subtypes including Asperger’s Disorder and Pervasive Developmental Disorder Not Otherwise Specified (PDD-NOS) [4]. However, ASD remains characterized by a high heterogeneity in its behavioral manifestations with very complex genetic underpinnings, suggesting the existence of subtypes of ASD [5]. Therefore, efforts to categorize ASD are still of critical importance and must rely on defining a relationship between clinical symptoms and biological mechanisms to improve the outcome of clinical trials. Along these lines, Stalicla’s Databased Endophenotyping Patient Identification (DEPI) technology was developed as a systems biology based, artificial intelligence (AI)-driven first-in-class platform enabling matching biologically defined populations of patients with neurodevelopmental disorders (NDDs) with tailored treatments, with a first application to ASD [6].
Application of DEPI led to the identification of a first biologically defined subgroup of patients with ASD, ASD Phenotype 1 (ASD-Phen1), characterized by the presence of specific, non-behavioral, clinical signs and symptoms (CSSs) mirroring the effects of an over-activation of NRF2 gene and its related pathways [6]. STP1, a combination of ibudilast and bumetanide, was then identified by DEPI as a potential tailored treatment for ASD-Phen1.
Ibudilast is a brain penetrant phosphodiesterase 3 (PDE3), 4 (PDE4), 10 (PDE10), and 11 (PDE11) inhibitor [7,8]; and bumetanide is an inhibitor of the sodium-potassium-chloride co-transporter 1 and 2 (NKCC1/NKCC2) [9]. At the physiological level, the increased expression and activation of NKCC1 may lead to the accumulation of chloride in cells and antagonize the gamma-aminobutyric acid (GABA) current in neurons, thereby decreasing inhibition and favoring excitation [10]. This increased neuronal excitation can then lead to an aberrant neuronal network activity and affect patient behavior [11]. To compensate for this indirect effect of ibudilast, we proposed to combine ibudilast with bumetanide, an inhibitor of NKCC1, for the treatment of ASD-Phen1 patients.
2. Materials and Methods
2.1. Design
We performed a randomized, double-blind, placebo-controlled, parallel-group, 2-dose ascending study. Each dose was given for 14 days treatment bid. Eight eligible patients were randomized and allocated to one of two treatment groups with a 3:1 ratio. The study was conducted in accordance with the Declaration of Helsinki and good clinical practice and was approved by Cincinnati Children’s Hospital Medical Center Institutional Review Board (ClinicalTrials Gov Identifier: NCT04644003, 25/11/2020). Approval for this study was obtained from the Cincinnati Children’s Hospital Institutional Review Board (IRB ref. 2020-0751). Patients provided written informed consent in all cases.
2.2. Diagnosis and Main Criteria for Eligibility
Patients were eligible to participate in the study if they met all of the following inclusion criteria: 1) Male or female individuals, aged between 18 and 40 years inclusive, previously diagnosed with ASD (based on Diagnostic and Statistical Manual of Mental Disorders, 5th Edition [DSM-5] criteria confirmed by a history and interview with an expert in autism diagnosis (C.A.E.); 2) a well-documented enlarged head size at any time point after birth and before 24 months of age, defined as a head circumference ≥ 75th percentile Centre for Disease Control and Prevention (CDC) growth charts or diagnosed with macrocephaly; 3) a systematic aggravation of ASD behavioral symptoms, so-called flares occurring during episodes of immune challenges (such as fever and infectious events e.g., acute inflammation) as assessed by the ASD-Phen1 semi-structured interview form developed by the sponsor using the DEPI platform; 4) a parent or reliable caregiver who agrees to provide information about the patient as required by the protocol; 5) patient willing and consenting or assenting to participate as applicable and if assent provided by the patient, parent or legal guardian also willing to give written consent; 6) patients with ASD and comorbid seizure disorder should be seizure-free for at least six months prior to screening; 7) before entering the study, patients must agree to use double-barrier birth control methods if they engage in intercourse; 8) women of childbearing potential, defined as all women physiologically capable of becoming pregnant, could be enrolled if they are using highly effective methods of contraception during dosing and for one week after discontinuation of the investigational drug.
Patients were excluded if they met any of the following exclusion criteria: 1) patients with an identified genetic cause of ASD in their medical record; 2) history of traumatic head injury, cerebrovascular disorder, congestive heart failure, hepatic, diabetes, or renal disease or thrombocytopenia (1 year before the screening visit) or significant abnormal laboratory tests. Additional exclusion criteria included use of prohibited medications or herbal remedies within two weeks prior to randomization, or five half-lives (whichever was longer), alcohol and/or substance abuse/dependence within 12 months prior to screening, or any active infection, suicidal risk, or any history of malignancy of any organ system, or any episode of fever or illness without fever within 10 days before the treatment. Some concomitant medications like the antioxidant supplement or the vitamins were prohibited 2 weeks prior to the treatment period.
2.3. Patient Disposition
Participants were randomly assigned in a 3:1 ratio, through randomized treatment assignments generated by the Sponsor’s designer using SAS PROC PLAN software. A total of 8 subjects 18 years of age or older underwent randomization at one site in the US at the Cincinnati Children’s Hospital Medical Center (6 males, 2 females) in the Cohort 1. Following the review of Cohort 1 data, the Data and Safety Monitoring Board (DSMB) recommended the initiation of Cohort 2. Four additional subjects (including three patients from Cohort 1) were assigned to Cohort 2 (3 males, 1 females).
Overall, a total of 12 patients (median age 19.2 years) were screened for study eligibility, of which, 12 (100.0%) were randomized to treatment with STP1 low dose (n=6) or placebo (n=2) in cohort 1 and STP1 high dose (n=3) or placebo (n=1) in Cohort 2. From the 2 cohorts (n=12), comprising the safety population, all 12 patients enrolled (100.0 %) completed the study (Figure 1).
2.4. Dosing
The study was blinded for patients/caregivers, study personnel with direct interaction with the subjects, using placebo capsules and tablets that match the active drugs in appearance, labelling and packaging. The total number of capsules making up each dose was identical for both STP1 dose levels and placebo.
Cohort 1 received SPT1 5/1 mg per os b.i.d (i.e., 5 mg ibudilast and 1 mg bumetanide, n=6) or matching oral placebo (n=2). Once the first dose cohort (eight patients) finished the two weeks of STP1 treatment and then two weeks of follow-up, a DSMB evaluated the safety data before allowing enroll patients in Cohort 2. Cohort 2 received STP1 10/1 mg per os b.i.d. (i.e., 10 mg ibudilast and 1 mg bumetanide, n=3), or matching oral placebo (n=1).
The two drugs (ibudilast and bumetanide) were taken at the same time with food and water, and the two daily doses were separated by approximately six hours. For all patients, twice daily dosing occurred on Days 1 to 13, inclusive, and a final single dose administration occurred on the morning of Day 14 (morning dose only). On Days 1, 7, and 14, the morning dose was taken on site.
The screening visit included: written informed consent, updated medical history, physical examination, drugs of abuse screening, pregnancy test (females only), alcohol test, laboratory, Electrocardiogram (ECG) safety, coagulation, viral serology, urinalysis, and inclusion/exclusion criteria. Patients returned to the study site at scheduled visits on Day 1, Day 7, Day 14/15, and optionally up to Day 18 for evaluation and PK sampling, and at approximately 14 days (Day 28) after the last dose for a post-treatment safety follow-up visit. Twelve subjects returned on Day 14 as samples collected and assayed with quantifiable concentration were used in PK analysis for t1/2 estimation.
For each dose cohort, the total duration of the study for each participant was up to six weeks, divided as follows: a screening phase of up to two weeks (from Day -14 to Day -1); a double-blind treatment phase of two weeks (from Day 1 to Day 14); and a follow-up phase of two weeks after treatment discontinuation (from Day 15 to Day 28).
2.5. Primary Endpoints
Incidence, nature, and severity of adverse events (AEs) and severity of serious adverse events (SAEs), as well as change from baseline in DBP (diastolic blood pressure), SBP (systolic blood pressure), and heart rate (HR), and respiratory rate as well incidence of clinically relevant laboratory abnormalities, based on hematology, coagulation, blood chemistry, ECG, and urinalysis test results.
2.6. Secondary Endpoints
Pharmacokinetics: blood samples for determination of plasma concentration of ibudilast and bumetanide, as well as urine sample. For placebo subjects, only Day 1 (1h and 6h), Day 7 (pre-dose), Day 14/15 (1h and 6h to determine PK characteristics).
2.7. Electrophysiological Parameters
Electroencephalogram (EEG) Acquisition and Preprocessing: an EGI/Magstim NetAmp 400 amplifier system was used to acquire EEG data using 128-channel Hydrocel saline-based electrode nets at a sampling rate of 1000 Hz. EEG data was blinded and semi-autonomously preprocessed. After visualization of raw data, bad channels were interpolated using spherical spline interpolation. EEG data were first downsampled to 500 Hz and average referenced. High- and low-pass cutoff frequencies were set at 2 and 120 Hz; a 60-Hz notch filter was used for the removal of power-line noise. Physiological artifacts (eye movement, cardiac, and muscle movement) were removed using independent component analysis (ICA; extended infomax) in EEGLAB [12] using MATLAB 2021A (MathWorks, Natick, MA, United States).
Resting-EEG: change from baseline in resting-EEG gamma power (dB, absolute and relative) in several brain areas associated with cognition and emotional processing (frontal poles, entorhinal, superior temporal) were calculated by subtracting the group-averaged pre-dose scores. The changes in resting-EEG power were compared between cohorts.
Eighty seconds of continuous artifact-free data was included from each session for analysis following preprocessing. This artifact-free continuous data was segmented into 2-second epochs, detrended, and tapered with a Hanning window. Fast Fourier transform was used to generate Fourier coefficients in 0.5 Hz frequency steps and squared to yield power values (μV2). Frequencies were divided into six frequency bands: delta (2–3 Hz), theta (4–7 Hz), lower alpha (8–10 Hz), upper alpha (10–12 Hz), beta (13–30 Hz), and gamma (30–80 Hz). To calculate relative power, the relative power of each frequency band was computed as the fraction of the sum of power measurements from 2 to 80 Hz [13].
Auditory Chirp (Auditory Synchronization): the current experiment utilized a chirp stimulus to evaluate neural synchronization to sensory input across a range of frequencies from 1 to 100 Hz (gamma waves). Participants heard an auditory chirp stimulus generated using a 1000-Hz tone that was amplitude modulated by a sinusoid linearly increasing in frequency from 1 to 100 Hz over 2 s. Data were epoched into 3250 ms trials (-500 to 2750 ms). Trials with a post-ICA (Independent Component Analysis) amplitude exceeding 120 μV were rejected. Data from 23-sensors distributed across the fronto-central scalp were used as an a-priori region of interest to capture auditory cortex signals [14]. Single-trial power (STP) and inter-trial coherence (ITC) were calculated using Morlet wavelets with a 1 Hz frequency step using a linearly increasing cycle length from 1 cycle at the lowest frequency (2 Hz) to 30 cycles at the highest (120 Hz). ITC was calculated after baseline correction using the 500 ms pre-stimulus period. Raw ITC values were also corrected by the trial number by subtracting the critical r value as calculated by sqrt [-1/(number of trials) ∗log(0.5)]. Final STP and ITC values were averaged over trials for each individual and transformed into time-frequency plots.
2.8. Pharmacodynamic (PD) Parameters
For the PD parameters, change from baseline to Day 14 was measured for the following assessments: sub-tasks from the National Institutes of Heal Toolbox Cognition Battery (NIH-TCB) to assess cognition, in particular the crystalized composite that included twp subtest: Picture vocabulary and oral reading, to assess cognition dependent upon past experiences. Aberrant Behavior Checklist-Community (ABC-C) sub-scores was used to assess behavioral disturbances, Social Responsiveness Scale, 2nd Edition (SRS-2) sub-scores to assess social abilities, and Clinical Global Impression-Severity (CGI-S) scale, reflected by the Clinical Global Impression-Improvement (CGI-I) scale, to assess symptoms severity and treatment response.
2.9. Analysis Populations
The primary objective of this study was to evaluate the safety and tolerability profile of 2 dose levels of STP1 in patients with ASD-Phen1. Up to six patients on active and up to 2 placebo per dose level (maximum 4 on placebo total) was considered sufficient for the primary objective.
The safety analysis, pharmacokinetic analysis and exploratory analysis populations were defined as follows. The safety analysis population consisted of all patients who had received at least one administration of the study treatments, whether prematurely withdrawn from the study or not. For the safety analysis population, data was analyzed according to the treatment taken.
The pharmacokinetic (PK) analysis population consisted of all patients with at least one administration of the study treatments and with at least one sample collected and analyzed for plasma drug concentration, whether prematurely withdrawn from the study or not.
The exploratory analysis population consisted of all randomized patients who met the inclusion/exclusion criteria, received full course of the study drug as per randomization scheme, had completed the main relevant visits and without any major protocol violations which would render the data unreliable.
For this Phase 1b study, descriptive statistics were provided for all variables by treatment group (placebo data were pooled from the two dose cohorts). For continuous endpoints, summary statistics, i.e., n (number of non-missing observations), mean, standard deviation (SD), median, minimum, and maximum were provided. For categorical variables, the frequency count and proportion in each category were summarized.
Some assessment time points varied according to which protocol amendment was in place at the time a patient was enrolled. Data from all time points was summarized as appropriate. All data collected were presented in the by-patient data listings, sorted by patient and by time point, where appropriate. No missing value imputation was used. That is, all analyses were based on the observed data (i.e., a complete case analysis).
EEG statistical analyses: change from baseline in resting-EEG gamma power was calculated and compared across cohorts, using a 1-way Analysis of Variance (ANOVA) test, followed by Tukey pairwise post-hoc tests. In addition, EEG topographic maps were plotted, providing whole-brain visualization of changes from baseline in gamma power. Pearson correlation analyses were conducted between resting-EEG gamma power in regions of interest and STP1 concentrations pooled across Day 1 and Day 14
Chirp Task statistical analyses: changes from baseline across treatment periods of chirp response variables (gamma STP, ITC 40 Hz, ITC 80 Hz, and ITC onset) were compared using a 2-way repeated measures ANOVA.
3. Results
The ASD-Phen1 patients were identified based on a previous biomarker study conducted at the same site (ClinicalTrials.gov Identifier: NCT04273087) as previously described (6). Participants were randomly assigned in a 3:1 ratio, through randomized treatment assignments generated by the Sponsor’s designer to receive the active treatment STP1 or matching placebo administered orally twice a day for 2 weeks. This 2-week treatment period was followed by a 2-week follow-up period.
3.1. Patient Demographics
There was a total of 9 male subjects (75%) in the overall study with 5 subjects (83%) in the STP1 5/1 mg, 2 subjects (67%) in the STP1 10/1 mg group, and 2 subjects (67%) in the placebo group. For female subjects, there was a total of 3 subjects (25%) in the overall study with 1 subject (17%) in the STP1 5/1 mg group, 1 subject (33%) in the STP1 10/1 mg group, and 1 subject (33%) in the placebo group. All subjects were classified as not Hispanic in the overall study (Table 1).
The mean age, height, and head circumference within the first two years of age were similar in all groups. One patient diagnosed with megacephaly participated in cohort 1 and 2. The mean weight and Body Mass Index (BMI) were lower in the placebo group than in the STP1 5/1 mg and STP1 10/1 mg groups. The mean weight (kg) in the STP1 5/1 mg group was 114.22 kg, mean weight of 109.80 kg in the STP1 10/1 mg group, and a mean weight of 78.13 kg in the placebo group. The mean BMI in the STP1 5/1 mg was 36.80, mean BMI of 27.07 in the STP1 10/1mg group, and a mean BMI of 25.17 in the placebo group.
3.2. Adverse Events
A total of 4 subjects (67%) experienced at least one adverse event in the STP1 5/1 mg group with all having a maximum severity grade of Mild and 1 subject (17%) with an adverse event being treatment related. Two subjects (67%) in the STP1 10/1 mg experienced at least one adverse event and both subjects had a maximum adverse event severity grade of Mild. There were 2 subjects (67%) in the placebo group that experienced at least one adverse event with all subjects having a maximum severity grade of Mild. All adverse events had a severity grading of Mild. There was only 1 subject (17%) with an adverse event (pollakiuria) related to the study drug in the STP1 5/1 mg group (Table 2).
There were no reported serious adverse events (SAE) and no reported adverse events of special interest (AESI) in the study overall. There were no deaths reported in the study overall.
3.3. Pharmacokinetic Analysis
Ibudilast and bumetanide mean plasma concentration levels by treatment are shown in Figure 2.
Compared to the STP1 5/1 mg group, ibudilast plasma concentrations in the STP1 10/1 mg group does appear to have approximately a 2-fold increase in plasma concentration with the corresponding visit days and times mentioned.
It appears that the bumetanide plasma concentrations in both the STP1 5/1 mg and STP1 10/1 mg group were similar, as the same dose of bumetanide is administered. Bumetanide reaches the highest mean plasma concentration within about 1-2 hours of the dose administration and then the plasma concentrations after these time points proceed to decrease on Day 1 and Day 14/15.
Summary statistics of estimated PK plasma parameters for ibudilast by treatment is provided in Table 3. From the data, it appears that following STP1 5/1 mg and 10/1 mg administration, ibudilast has a high volume of distribution which may suggest that the drug is distributed well into body tissue. Both ibudilast 5 mg and 10 mg also appear to show low clearance. However, it should be noted that the mean t1/2 of ibudilast 5 mg was 67.28 hours and mean t1/2 of ibudilast 10 mg was 16.71 hours on Day 14.
Both ibudilast 5 mg and ibudilast 10 mg appear to take about 4 hours to reach maximum plasma concentration on Day 14.
Summary statistics of estimated PK plasma parameters for bumetanide by treatment are provided in Table 3. Overall, similar PK parameters were observed for bumetanide after STP1 5/1 mg or 10/1 mg administration, as the same dose of bumetanide is administered. Overall, bumetanide has a short half-life of about 2 hours with a moderate volume of distribution and appears to show low clearance. It appears to take to bumetanide about 2 hours to reach max plasma concentration on Day 1 and Day 14 in both STP1 5/1 mg and STP1 10/1 mg groups.
Coefficient of variation (CV) was high to very high with values ranging between 27% to 86% for Cmax and AUC, since the mathematical models applied to calculate the PK parameters including Day 28 data and at this data point only patients from cohort 1 were sampled. Additionally, BMI and weight are expected to have influenced Cmax and AUC and an inverse correlation between body weight and exposure is therefore expected. Future PK studies will give a better description of the PK characteristics.
It is noteworthy that ibudilast AUC geometric mean was comparable with albeit slightly lower than published reports [15] for Cohort 2.
Mean cumulative excretion in (mcg) for bumetanide in STP1 5/1 mg group over a 12-hour period at Day 14 was 334.01 mcg (SD not calculated, N=1 only, i.e., 33 % of the given oral dose excreted in urine) and for the STP1 10/1 mg group was 350.31 mcg (SD 102234.89, N=3, i.e., 35 % of the given oral dose excreted in urine).
Overall, following STP1 administration ibudilast does not seem to be excreted unchanged in the urine (i.e., < 0.1% of the administered dose recovered over a 12-hour period at Day 14), while bumetanide seems to be significantly excreted unchanged in the urine (around 35% of the administered dose recovered over a 12-hour period at Day 14). Dose of bumetanide was excreted unmetabolized in urine of Cohorts 1 and 2, closely replicating the value of 51.3% reported in the literature [16].
3.4. Exploratory Endpoints: NIH-TCB Crystalized Composite
NIH-TCB Crystalized composite (NIH-TCB-picture vocabulary and NIH-TCB-oral reading) showed a numerical increase (indicative of improvement) from baseline for the Crystalized Composite Fully Uncorrected Standard Score for subjects in the STP1 5/1 mg and in the STP1 10/1 mg groups relative to baseline on Day 14/15 (Figure 3a), whereas a decrease was observed in the placebo group. On Day 28, i.e., 2 weeks after the end of the treatment the STP1 effect seems to be lost. Due to the small “N”, no significance was reached. Whereas, NIH-TCB-picture vocabulary showed a minimal increase from baseline for subjects in the STP1 5/1 mg and in the STP1 10/1 mg groups on Day 14/15 (Figure 3a); NIH-TCB-Oral Reading Recognition showed a numerical increase (indicative of improvement) from baseline for subjects in the STP1 5/1 mg group on Day 14/15 (Figure 3a).
3.5. Exploratory Endpoint: Aberrant Behavior Checklist-Community (ABC-C)
For ABC-C, there did appear to be a numerical decrease (indicative of improvement) in the mean change from baseline score at Day 14/15 in the STP1 5/1 mg and STP1 10/1 mg groups compared to placebo and maintained at day 28. The most noticeable improvements in the STP1 groups appear to be in Irritability, Hyperactivity, and Inappropriate Speech sub-scales (Figure 3b). Due to the small “N”, no significance was reached.
Exploratory endpoint: Social Responsiveness, 2nd Edition (SRS-2)
For SRS-2, there did appear to have had a numerical decrease (indicative of improvement) in the mean change from baseline score on Day 14/15 in the STP1 5/1 mg group as compared to placebo group and maintained at day 28. Overall, the scores with the most numerical decrease were in the subdomains of Social Awareness, Social Motivation and Mannerisms (Figure 3c). Due to the small “N”, no significance was reached.
3.6. Exploratory Endpoints EEG-Gamma Bands
Resting EEG shows a dose-related effect of STP1 in reducing gamma power (dB, absolute and relative, Figure 4a).
3.7. Gamma Bands in Brain Regions of Interest
In brain regions of interest associated with executive function (frontal left and right poles) and memory (left and right entorhinal regions), STP1 induced a statistically significant dose-related effect in reducing gamma power in comparison to placebo (Figure 4b). Specifically, a significant effect was observed in brain regions of interest associated with social cognition and emotional processing for the left and right frontal poles (executive function; F(2,9)=7.23, p=0.013, eta-squared=0.616 and F(2,9)=7.37, p=0.012, eta-squared=0.621, respectively), left and right entorhinal regions (memory-related processes; F(2,9)=5.76, p=0.024, eta-squared=0.561 and F(2,9)=5.21, p=0.031, eta-squared=0.536, respectively), and right superior temporal region (indirect target engagement; F(2,9)=4.97, p=0.035, eta-squared=0.525).
The resting state data were reanalyzed using source estimation to confirm scalp EEG gamma changes with treatment. Previously published methods [17] were used to generate a minimal norm estimate (MNE) electrical model of EEG activity. For this analysis, only participants with both a pre and 14-day post-timepoint were included. The bar plot shows that STP 10/1 mg is associated with a drop in gamma power across multiple cortical regions. (Figure 4c).
Correlation analyses between resting-EEG gamma power in the regions of interest and ibudilast concentrations pooled across Day 1 and Day 14 revealed significant negative correlations in left and right frontal poles (r=-0.66, p=0.005, and r=-0.50, p=0.045, respectively), left and right entorhinal regions (r=-0.56, p=0.021, and r=-0.57, p=0.020, respectively), and right superior temporal region (r=-0.58, p=0.017) (Figure 4d).
3.8. Exploratory Endpoints; EEG-Alpha Bands
In ASD-Phen1, treatment with STP1 increased alpha waves (Figure 5) in the occipital and prefrontal regions, similar to other studies [18]. Treatment with STP1 showed a significant increase of alpha 2 power in frontal and occipital regions and in brain areas associated with memory function (frontal right poles, right isthmus cingulate) and sensory (right paracentral regions).
3.9. Exploratory Endpoint: EEG-Complex Auditory Synchronization
For the Chirp Analysis, 10 of 12 subjects with complete datasets were considered. Two subjects did not complete baseline chirp EEG. Responses include intertrial phase coherence (ITC; 40 Hz, 80 Hz, onset, and offset) and single trial power (STP; alpha, gamma1, and gamma2). Increased ITC indicates increased neural synchronization to the auditory chirp. STP refers to background spectral power during the auditory chirp. The ITC values are approximated from time-frequency analysis of the chirp response depicted in Figure 6. Overall, no clear numerical trends were identified in the STP1 5/1 mg group in regard to ITC.
In the STP1 10/1 mg group (N=3), the provided mean score refers to change from baseline to either Day 1 (acute post-dose), Day 14, and Day 28. Mean score for follow-up Day 14 includes ITC 40 Hz (0.008, SD=0.086), ITC 80 Hz (0.030, SD=0.053), STP mean scores for follow-up Day 14 include alpha (-1.3, SD=6.8), gamma1 (-2.1, SD=2.7), gamma2 (-2.6, SD=1.7). Overall, there was a clear numerical increase in ITC 80 Hz neural synchronization which can be visualized in Figure 6. Due to the small “N”, no significance was reached.
3.10. Exploratory Endpoints: PK/PD Modeling Analysis
PK/ PD modeling analyses showed linear PK/PD models indicating that STP1 treatment effect at higher dosages will show a greater improvement in ABC-C and SRS-2. The data for ABC-C total score indicate a numerical treatment effect such that for a one log unit increase in Cmax would expect a 5.3-point decrease in the ABC-C total score. Lower the score, greater beneficial effect (Figure 7a). Similarly, the data for total score indicates a numerical treatment effect such that for a one log unit increase in Cmax one would expect an 8-point decrease in the SRS-2 total score. The lower the score, the greater the beneficial effect (Figure 7b). Future studies will evaluate if a larger data set fits the model.
4. Discussion
The main objective of the study was to assess the safety and tolerability of STP1. In this regard, STP1 showed good safety and tolerability at the two dosages used, proving that the safety profile is favorable for STP1.
Treatment with STP1 5/1 mg and STP1 10/1 mg does not appear to increase safety risk for the patients.
In regard to the PK characterizations, STP1 seems to have a similar PK profile as the ones described for ibudilast and bumetanide [15,16]. One of the limitations to the pharmacokinetics data is the low number of patients enrolled in the study and especially after STP1-10/1 mg administration. Therefore, in future studies, a larger number of participants and a wider dose range will be needed to fully characterize the PK of STP1 (ibudilast and bumetanide).
We used EEG as exploratory objective to assess target engagement. Gamma oscillations hold a special interest in neurodevelopmental disorders because of their relation to cortical excitability [19,20], association with cognitive processes [21], and analogous measurability in animal models [22].
Resting EEG shows a significant dose-related effect of STP1 in reducing gamma power in brain regions of interest associated with working memory and flexible thinking processing for the left and right frontal poles (executive function), left and right entorhinal regions (related to memory), and right superior temporal region (understanding language, memory acquisition). Although not statistically significant due to a low sample size a numerical improvement for the chirp task (auditory synchronization) was observed, in which STP1 10/1 increased synchronization ability, these effects (gamma power reduction) in brain areas of interest may predict an improvement in sensory processing, that need to be validated in future studies. Additionally, resting EEG shows a significant increase of alpha power in brain regions of interest. Treatment with STP1 showed a significant increase of Alpha 2 power in frontal and occipital regions and in brain areas associated with memory function (left superior frontal area, right isthmus cingulate) and sensory (right paracentral regions). Previous reports have reported lower alpha waves in ASD. In a case report of a patient diagnosed with ASD, epilepsy, cortical dysplasia and a 15q11.2 duplication, bumetanide treatment has been shown to increase alpha power and improve cognition [23]. Similarly, in patients diagnosed with tuberous sclerosis complex (which leads to multiorgan lesions including neurodevelopmental disorders, e.g., intellectual disability, ASD-related behavior, epilepsy), bumetanide treatment has been shown to increase alpha power which was correlated to an improvement in irritability [23].
Although the data in NIH-crystalized composite, ABC-C and SRS-2 were not statistically significant, the numerical improvement are encouraging, and future studies powered to assess stastical differences will be needed to confirm these findings.
Considering the low number of patients, there was no testing of statistical significance conducted on these exploratory endpoints. However, there was a clear numerical increase in ITC 80 Hz neural synchronization. With improvement in auditory synchronization, clinically we would expect this enhanced brain response to benefit learning and communication. Essentially, normalization of this parameter represents an electrophysiologic marker of improved brain function in response to sensory system stimulation.
Future studies using a larger “N” and longer exposure are warranted to confirm the efficacy in this subpopulation of ASD.
6. Patents
Some results described in this study were patented by L.D. (US 10940140B2 and US11439627B2).
Author Contributions
L.A.D. conceived the original idea. L.A.D. designed the clinical study. L.A.D., C.A.E., O.P., E.P., G.B., M.W. and H.S. coordinated the trial. B.G.M., C.A.E., E.V.P., L.M.S., O.L., and G.I. coordinated and supervised the analytical plans. B.G.M., E.V.P., L.M.S., O.L., G.I., A.S. and J.M.H. performed analyses, and interpreted results. C.A.E., and H.S. performed clinical evaluation, applying the clinical exclusion/inclusion criteria proposed by Stalicla. E.V.P., H.S., L.D., and G.W. performed the EEG and data acquisition. E.V.P., G.I,. and O.L. coordinated and supervised the analytical plans for the EEG. L.M.S. and H.S. performed the clinical cognitive tests and supervised the analytical plans, and interpretation of the data. B.G.M. and J.M.H took the lead on writing the manuscript. All authors reviewed and approved the manuscript.
Funding
This study was supported by Stalicla S.A.
Informed Consent Statement
Informed consent was obtained from participants to allow use of their serum samples for the current study. Approval for this study was obtained from the Cincinnati Children’s Hospital Institutional Review Board (IRB ref. 2020-0751).
Institutional Review Board Statement
The study (ClinicalTrials Gov Identifier: NCT04644003) was conducted in accordance with the Declaration of Helsinki and good clinical practice and was approved by the Cincinnati Children’s Hospital Institutional Review Board (IRB ref. 2020-0751). Patients provided written informed consent in all cases.
Data Availability Statement
The trail protocol, datasets used and/or analyzed during the current study are available from the corresponding authors on reasonable request.
Acknowledgments
The authors are grateful to all the families participating in the study.
Conflicts of Interest
In the interest of full disclosure for consideration of any potential conflicts of interest, L.A.D, B.G.M, E.P., G.B., J.M.H. are Stalicla SA employees, a company advancing treatment candidates for subgroups of patients with NDDs that sponsored the study. A.S. and O.P. are former employees of Stalicla SA. Dr. Erickson is a consultant to Stalicla, Scioto Bioscience, Spinogenix, and Forge Therapeutics. He is an inventor on several patents describing treatment development in autism and fragile X syndrome. The patents are held by the Indiana University School of Medicine and Cincinnati Children's Hospital Medical Center and do not specifically related to any content in this manuscript. Ernest Pedapati, was involved in the study as a contributing researcher and paid consultant for Stalicla. The analysis and results presented in this paper were conducted independently and blinded and were not influenced by the consulting agreement. All methods, tools, and software used in the analysis have been disclosed transparently within the manuscript. To ensure the credibility and objectivity of the study, all data and methodologies are available for independent verification. The other authors have no potential conflicts of interests to disclose.
References
- Baxter, A.J. The epidemiology and global burden of autism spectrum disorders. Psychol. Med. 2015, 45, 601–613. [Google Scholar] [CrossRef] [PubMed]
- Maenner, M.J. Prevalence and Characteristics of Autism Spectrum Disorder Among Children Aged 8 Years — Autism and Developmental Disabilities Monitoring Network, 11 Sites, United States, 2018. MMWR Surveill. Summ. 2021, 70, 1–16. [Google Scholar] [CrossRef]
- Association, A.P. Diagnostic and Statistical Manual of Mental Disorders; 2013.
- Syriopoulou- Delli, C.K.; Papaefstathiou, E. Review of cluster analysis of phenotypic data in Autism Spectrum Disorders: distinct subtypes or a severity gradient model? International Journal of Developmental Disabilities 2020, 66, 13–21. [Google Scholar] [CrossRef]
- Masi, A.; DeMayo, M.M.; Glozier, N.; Guastella, A.J. An Overview of Autism Spectrum Disorder, Heterogeneity and Treatment Options. Neurosci. Bull. 2017, 33, 183–193. [Google Scholar] [CrossRef] [PubMed]
- Pérez-Cano, L.; Boccuto, L.; Sirci, F.; Hidalgo, J.M.; Valentini, S.; Bosio, M. Characterization of a clinically and biologically defined subgroup of patients with autism spectrum disorder and identification of a tailored combination treatment.
- Gibson, L.C.D. The inhibitory profile of Ibudilast against the human phosphodiesterase enzyme family. European Journal of Pharmacology 2006, 538, 39–42. [Google Scholar] [CrossRef] [PubMed]
- Huang, Z. Preferential inhibition of human phosphodiesterase 4 by ibudilast. Life Sciences 2006, 78, 2663–2668. [Google Scholar] [CrossRef] [PubMed]
- Russell, J.M. Sodium-Potassium-Chloride Cotransport. Physiological Reviews 2000, 80, 211–276. [Google Scholar] [CrossRef] [PubMed]
- Capsoni, S. Targeting the Cation-Chloride Co-Transporter NKCC1 to Re-Establish GABAergic Inhibition and an Appropriate Excitatory/Inhibitory Balance in Selective Neuronal Circuits: A Novel Approach for the Treatment of Alzheimer’s Disease. Brain Sciences 2022, 12, 783. [Google Scholar] [CrossRef] [PubMed]
- Zikopoulos, B.; Barbas, H. Altered neural connectivity in excitatory and inhibitory cortical circuits in autism. Front. Hum. Neurosci. 2013, 7. [Google Scholar] [CrossRef] [PubMed]
- Delorme, A.; Makeig, S. EEGLAB: an open source toolbox for analysis of single-trial EEG dynamics including independent component analysis. Journal of Neuroscience Methods 2004, 134, 9–21. [Google Scholar] [CrossRef] [PubMed]
- Wang, D.; Negra, R. Design of a dual-band rectifier for wireless power transmission. 2013.
- Ethridge, L.E.; et al. Neural synchronization deficits linked to cortical hyper-excitability and auditory hypersensitivity in fragile X syndrome. Molecular Autism 2017, 8, 22. [Google Scholar] [CrossRef] [PubMed]
- Rolan, P.; et al. Ibudilast in healthy volunteers: safety, tolerability and pharmacokinetics with single and multiple doses. British Journal of Clinical Pharmacology 2008, 66, 792–801. [Google Scholar] [CrossRef] [PubMed]
- Halladay, S.C.; Sipes, I.G.; Carter, D.E. Diuretic effect and metabolism of bumetanide in man. Clinical Pharmacology & Therapeutics 1977, 22, 179–187. [Google Scholar]
- Pedapati, E.V.; et al. Neocortical localization and thalamocortical modulation of neuronal hyperexcitability contribute to Fragile X Syndrome. Commun Biol 2022, 5, 442. [Google Scholar] [CrossRef] [PubMed]
- Juarez-Martinez, E.L.; et al. Bumetanide Effects on Resting-State EEG in Tuberous Sclerosis Complex in Relation to Clinical Outcome: An Open-Label Study. Front. Neurosci. 2022, 16, 879451. [Google Scholar] [CrossRef] [PubMed]
- Antoine, M.W.; Langberg, T.; Schnepel, P.; Feldman, D.E. Increased Excitation-Inhibition Ratio Stabilizes Synapse and Circuit Excitability in Four Autism Mouse Models. Neuron 2019, 101, 648–661.e644. [Google Scholar] [CrossRef] [PubMed]
- Goswami, U. Speech rhythm and language acquisition: an amplitude modulation phase hierarchy perspective. Annals of the New York Academy of Sciences 2019, 1453, 67–78. [Google Scholar] [CrossRef] [PubMed]
- Mably, A.J.; Colgin, L.L. Gamma oscillations in cognitive disorders. Current Opinion in Neurobiology 2018, 52, 182–187. [Google Scholar] [CrossRef] [PubMed]
- Jonak, C.R.; Lovelace, J.W.; Ethell, I.M.; Razak, K.A.; Binder, D.K. Multielectrode array analysis of EEG biomarkers in a mouse model of Fragile X Syndrome. Neurobiology of Disease 2020, 138, 104794. [Google Scholar] [CrossRef] [PubMed]
- Bruining, H.; et al. Paradoxical Benzodiazepine Response: A Rationale for Bumetanide in Neurodevelopmental Disorders? Pediatrics 2015, 136, e539–e543. [Google Scholar] [CrossRef] [PubMed]
Figure 1.
Patient Disposition. Note: from the 18 ASD-Phen1 adult subject identified under the study NCT04273087, 12 agreed to participate to the study STA-P1-C004 (ClinicalTrials.gov Identifier: NCT04644003).
Figure 1.
Patient Disposition. Note: from the 18 ASD-Phen1 adult subject identified under the study NCT04273087, 12 agreed to participate to the study STA-P1-C004 (ClinicalTrials.gov Identifier: NCT04644003).
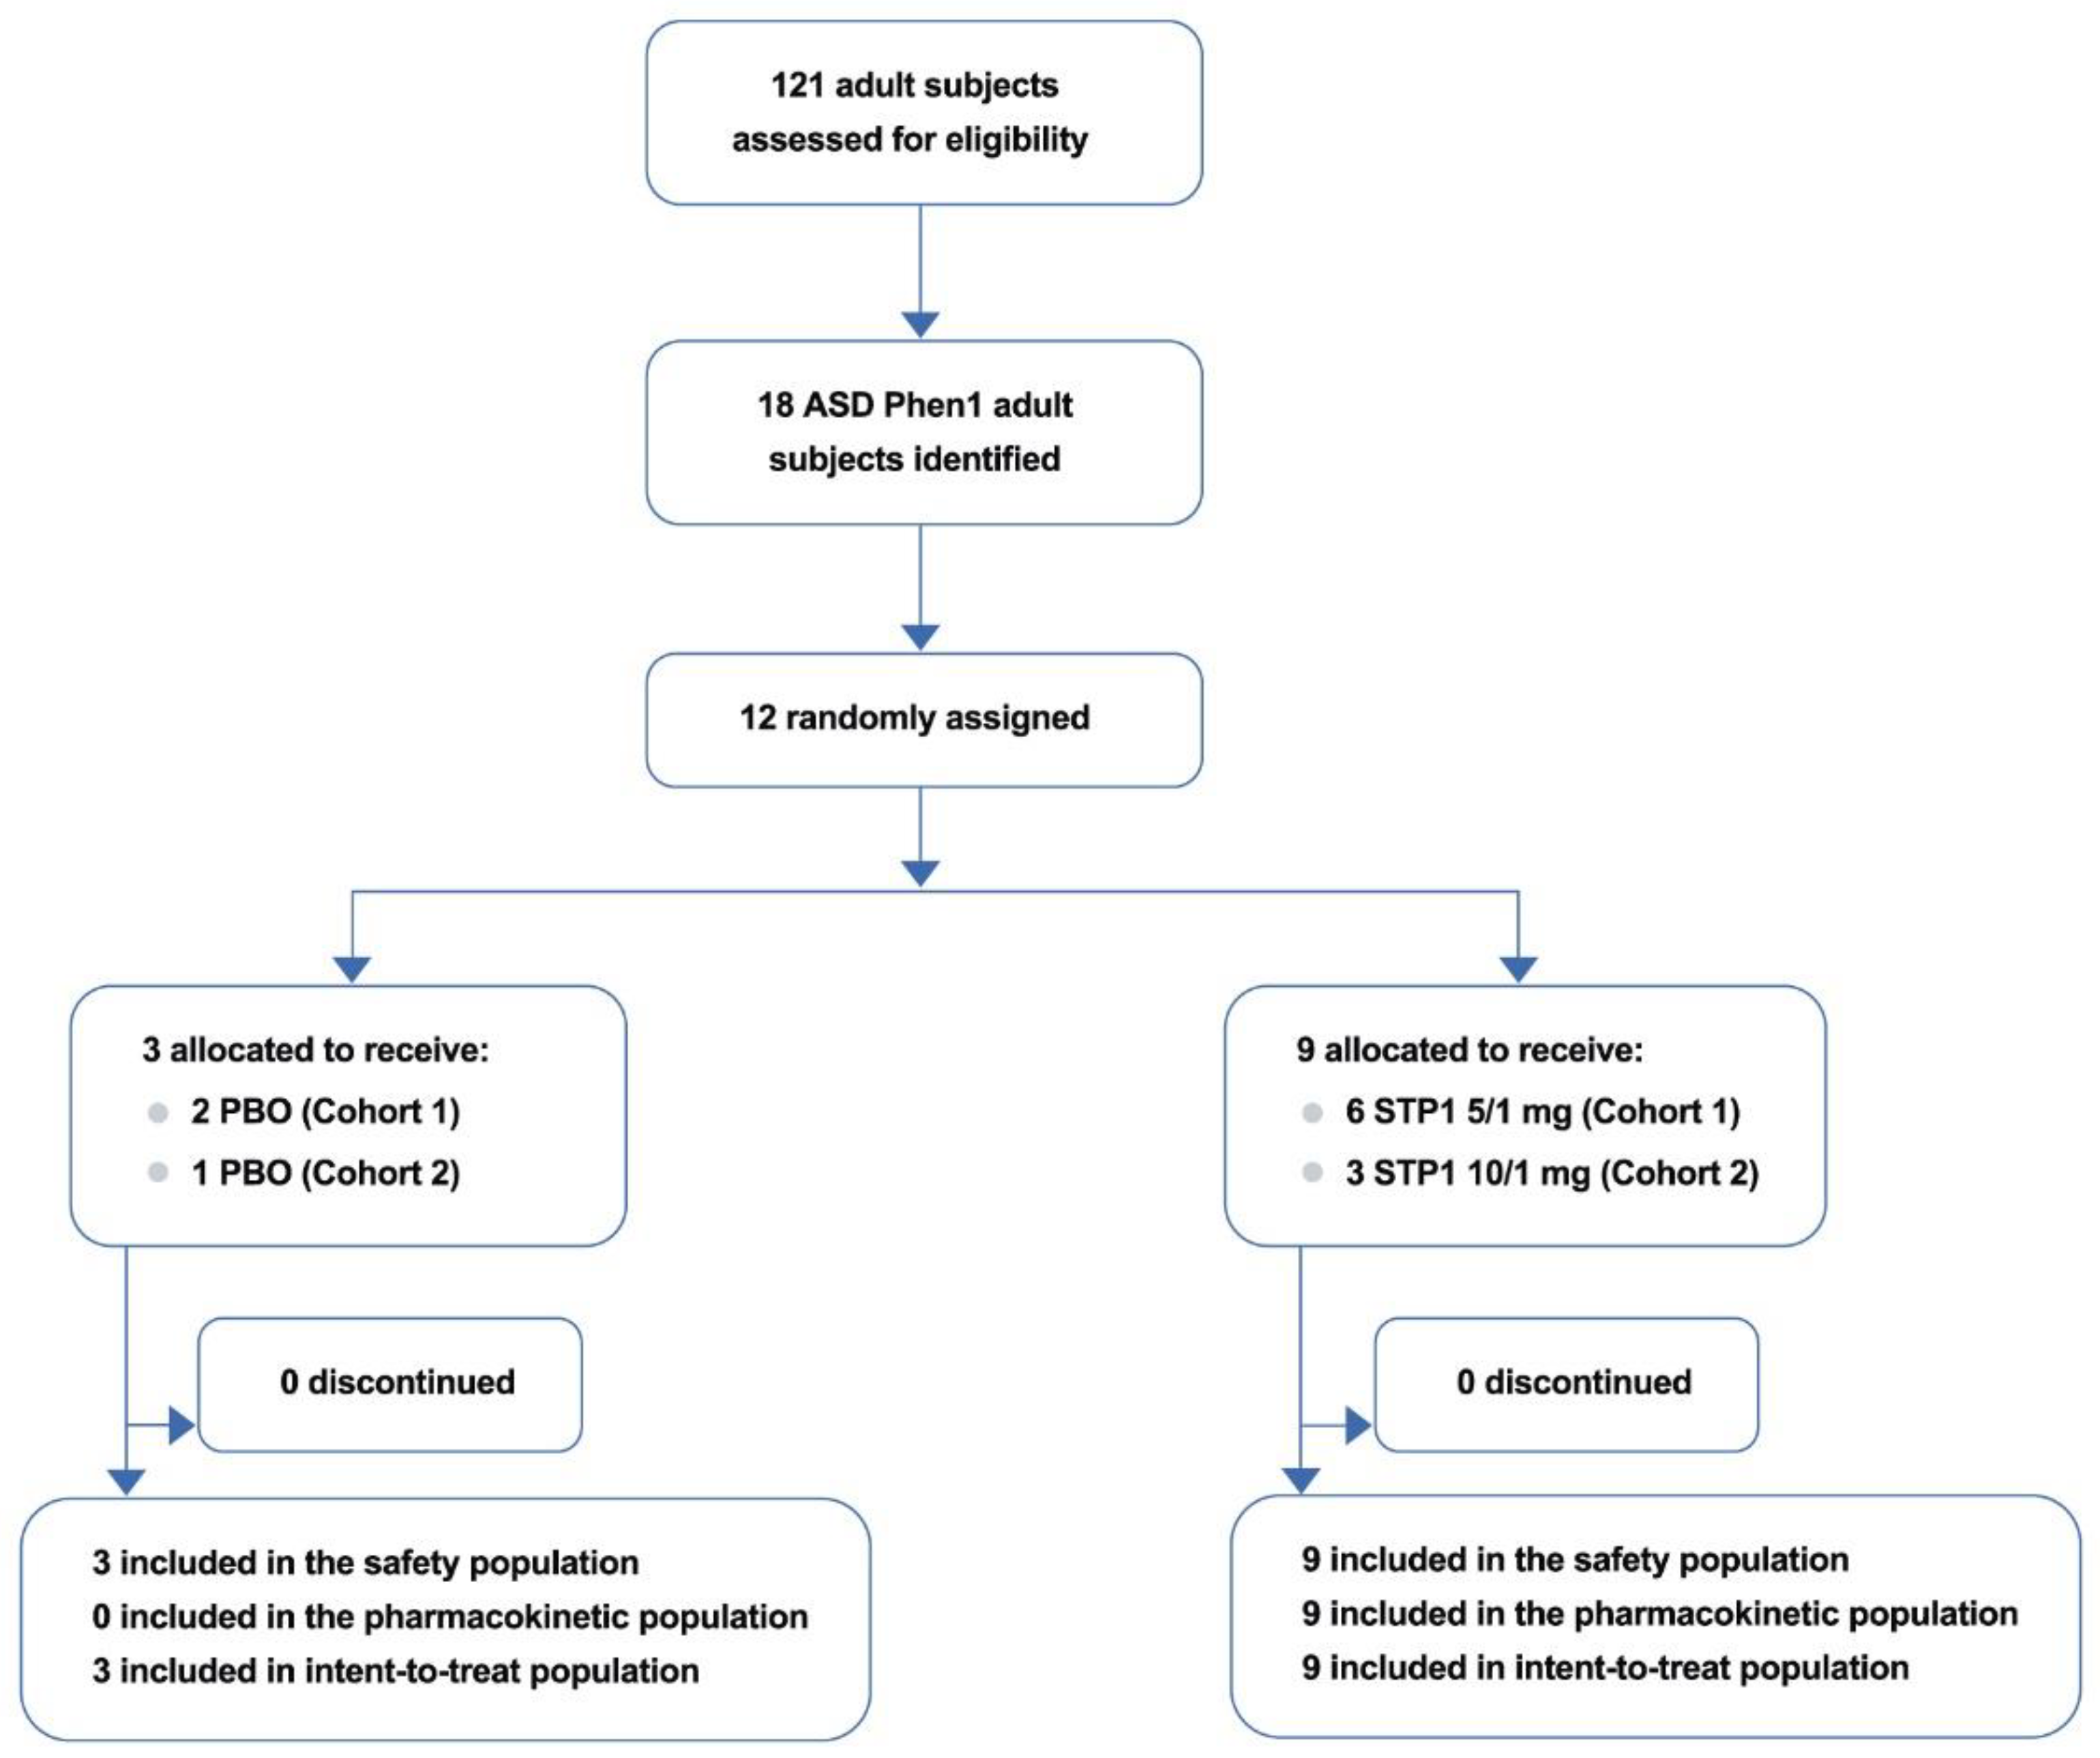
Figure 2.
Pharmacokinetic profiles of ibudilast and bumetanide in ASD-Phen1 dosed with STP1 5/1 mg (i.e., 5mg ibudilast plus 1mg bumetanide, N=6) or STP1 10/1 mg (i.e., 10mg ibudilast plus 1mg bumetanide, N=3), twice a day during a 2-week treatment period. (a) shows concentrations of ibudilast and bumetanide using linear scale; (b) shows concentration of ibudilast using log scale. Note on Day 14, patients received morning dose only. Symbols indicate mean, bars indicate standard deviation (SD).
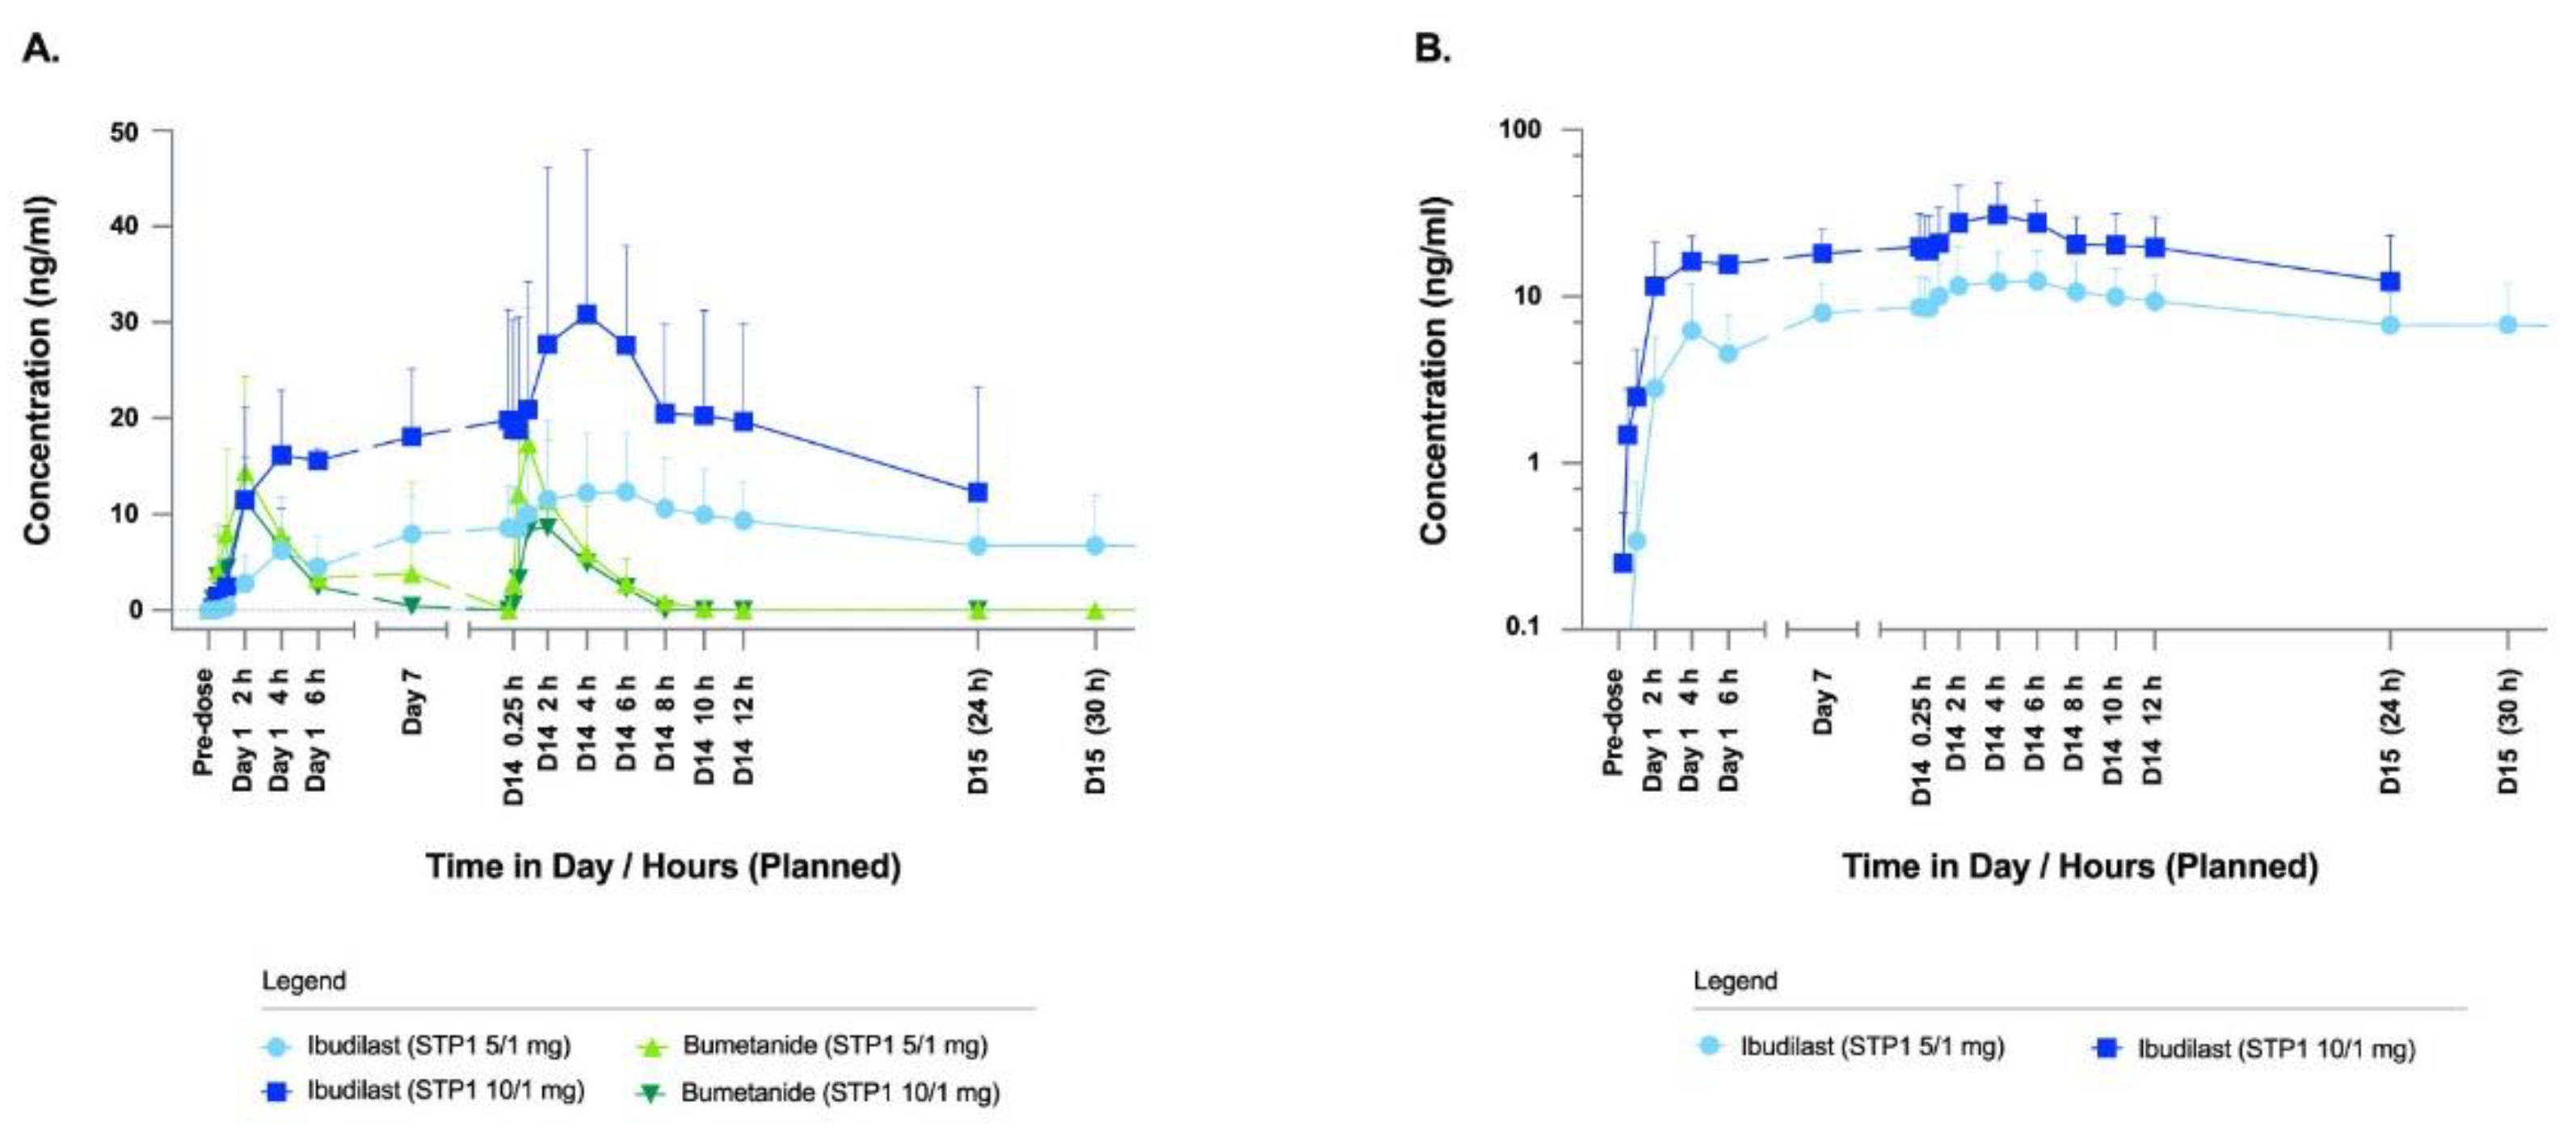
Figure 3.
NIH-TCB, ABC-C and SRS-2. a) NIH-TCB-Picture Vocabulary, NIH-TCB-Oral Reading Recognition and NIH-TCB-Crystalized composite uncorrected scores after administration of STP1 5/1 mg (N= 4-6), STP1 10/1 mg (N=3) and placebo (N=3), twice a day, on Day 14/15 and on Day 28 (i.e., 2 weeks following last dosage). Note: NIH-TCB oral reading recognition was acquired only in N=4 patients treated with STP1 5/1, therefore NIH-TCB crytalized composite was only computed in N=4 patients treated with STP1 5/1; b) Aberrant Behavior Checklist- Community (ABC-C) sub-scales in ASD-Phen1 patients dosed with STP1 5/1 mg (N=6), STP1 10/1 mg (N=3) or Placebo (N=3), on Day 14/15 and Day 28. Note: on Day 28, SRS-2 subscales were not collected for the Cohort 2 with STP1 10/1 mg; c) Social Responsive sub-scales in ASD-Phen1 patients dosed with STP1 5/1 mg (N=6), STP1 10/1 mg (N=3) and placebo (N=3) on Day 14/15 and Day 28. Data are expressed as change from baseline (CFB) (i.e., score measured during screening visit). Column bar represents min-max and mean, dots represent individual values.
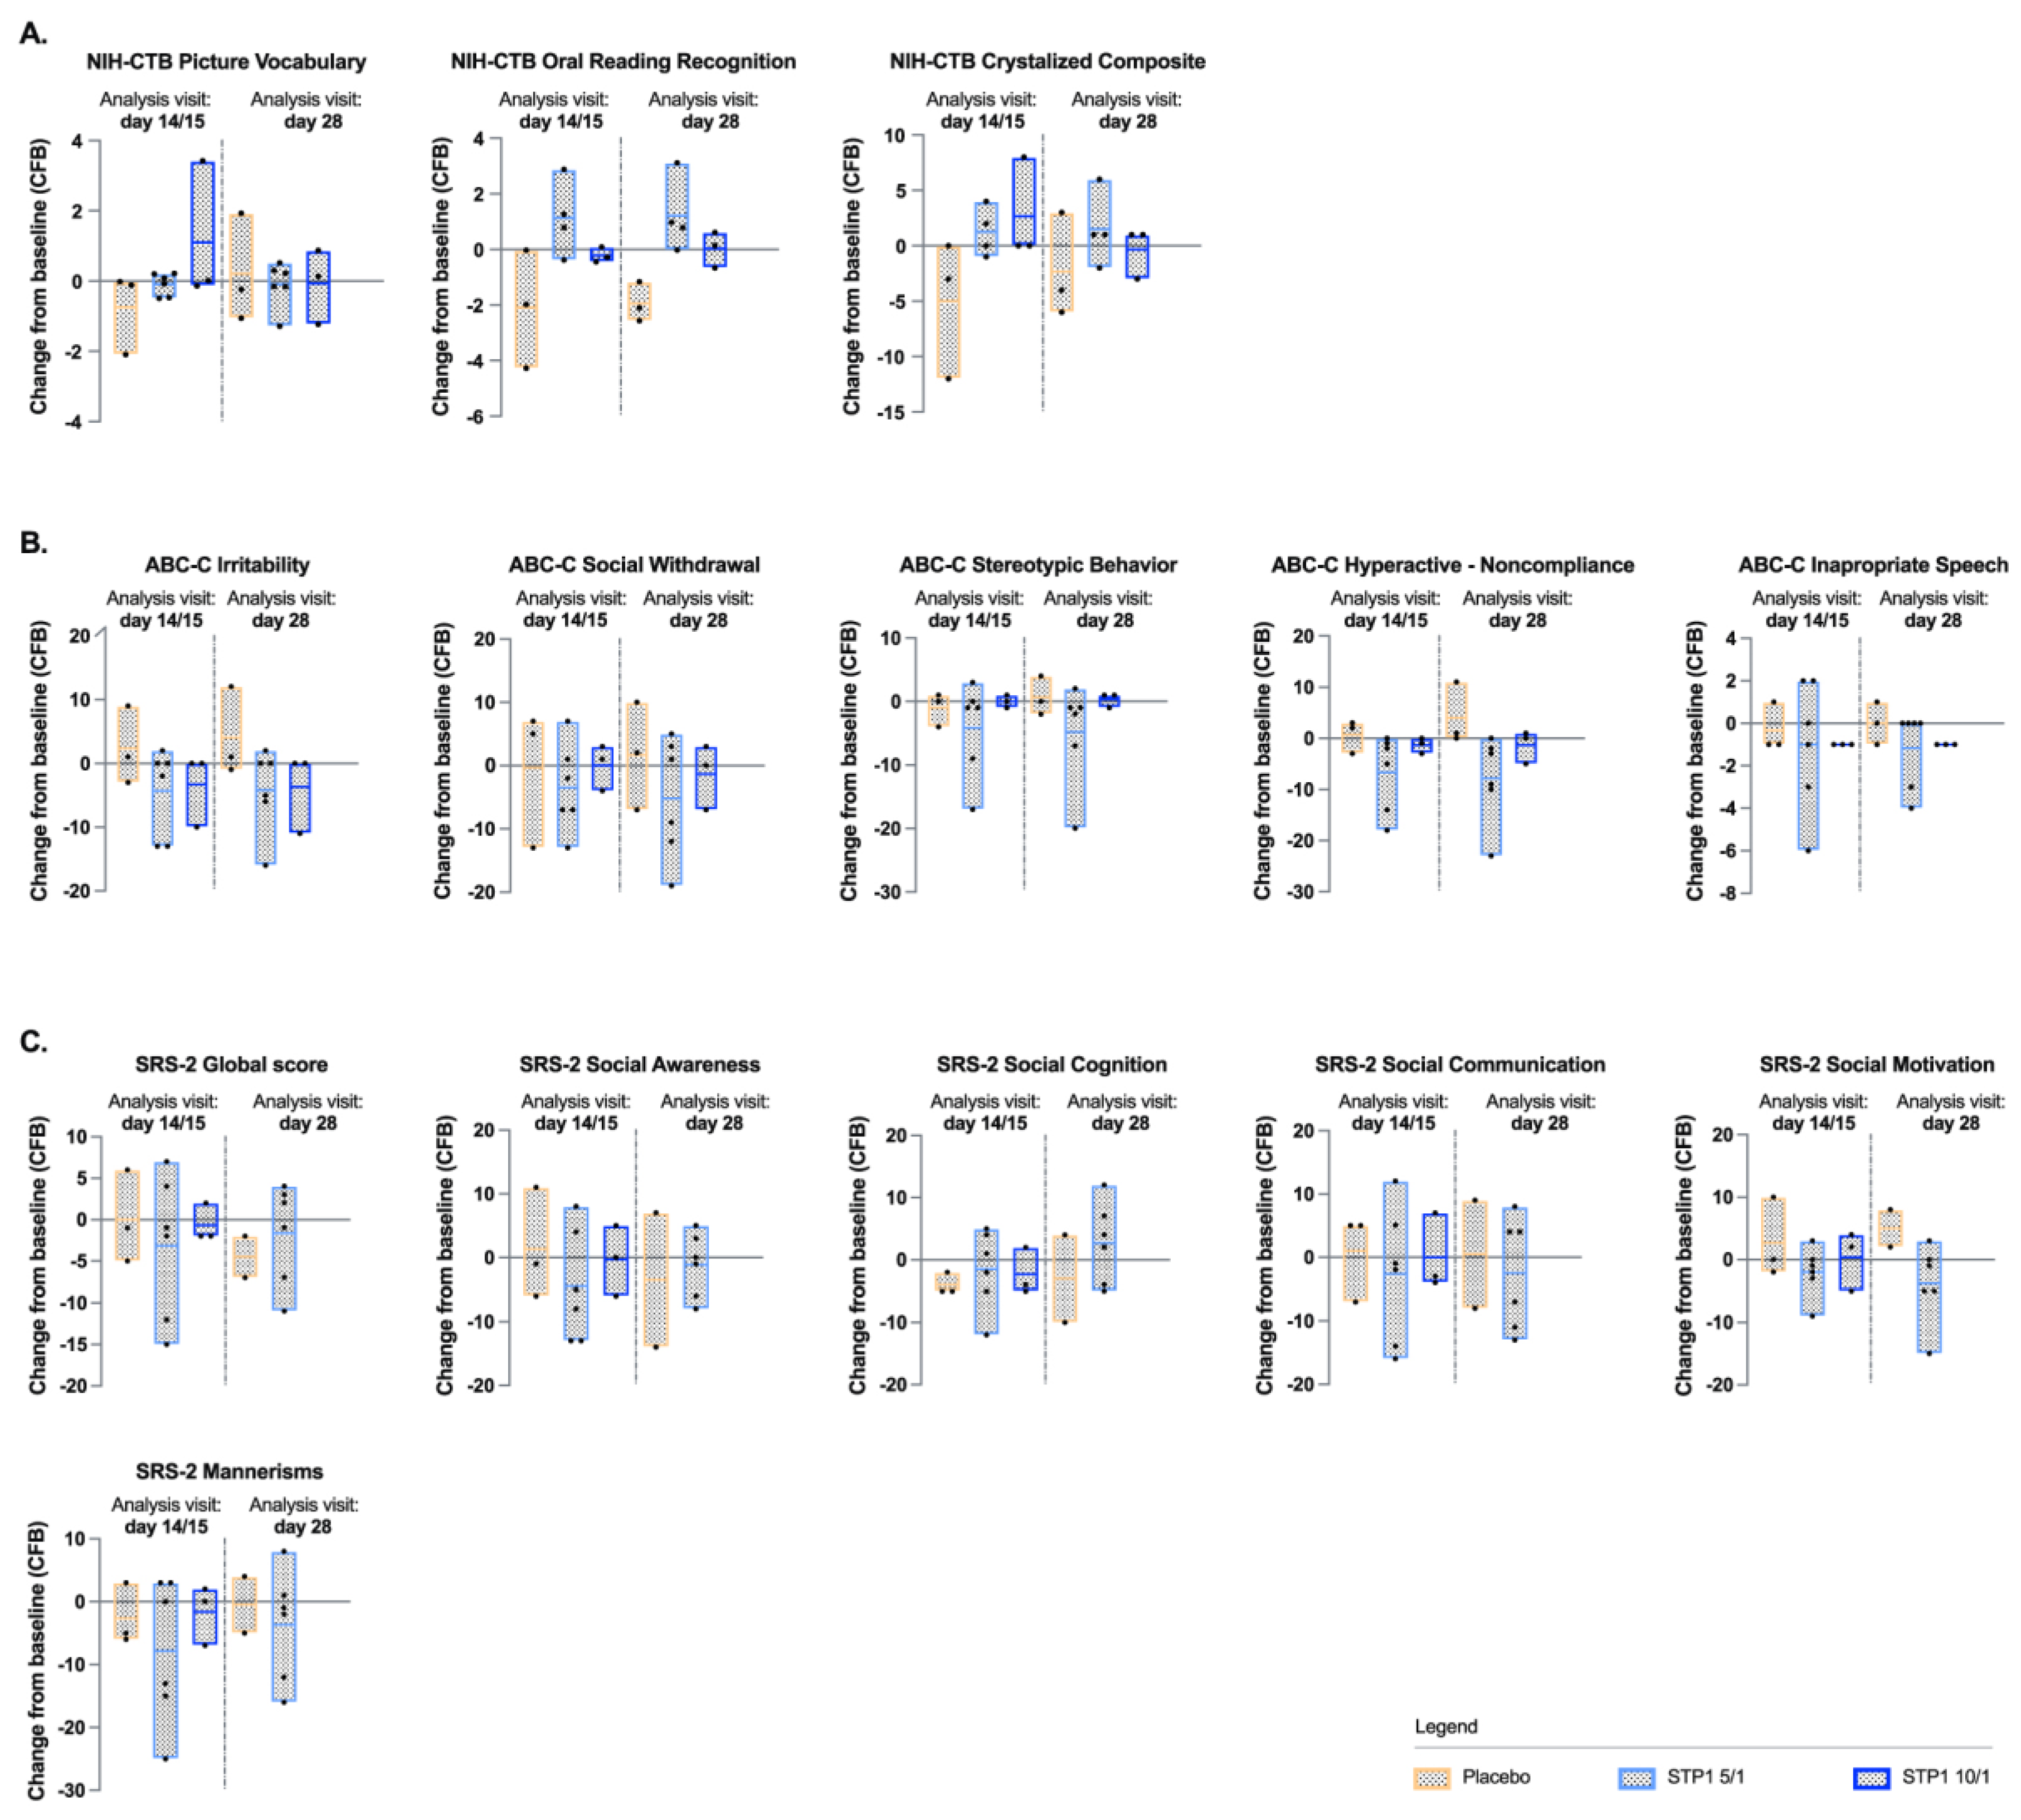
Figure 4.
Gamma bands in ASD-Phen1 patients dosed with STP1 5/1 mg (N=6) (i.e., ibudilast 5mg plus bumetanide 1mg), STP1 10/1 mg (N=3) (i.e., ibudilast 10mg plus bumetanide 1mg) or Placebo (N=3), twice a day on Day 14 (end of treatment). a) topoplots showing change in absolute (top) and relative (bottom) power in gamma1, gamma 2; b) Gamma 1 Power (dB) in Frontal and Entorhinal brain regions at Day 14 (each value is normalized to pre-dose); c). Scalp EEG gamma changes in placebo, STP1 5/1 mg and STP1 10/1 mg. Only participants with both pre-post treatment within hemispheric region were considered, N =2 placebo, N=5 STP1 5/1 mg and N=3 STP1 10/1 mg. Values less than 0 indicate a drop in gamma power following treatment. For this analysis only participants with pre and post timepoints were considered (one patient in placebo group and one patient in STP1 5/1 mg were excluded); d) correlation between EEG gamma power (dB) and ibudilast Cmax concentration (ng/mL) measured at Day 1 and at Day 14 post-dose in cohorts STP1 5/1 mg (n=10) and STP1 10/1 mg (n=6). Pearson`s r and p values are presented for each correlation. Shaded areas indicate 95% CI.
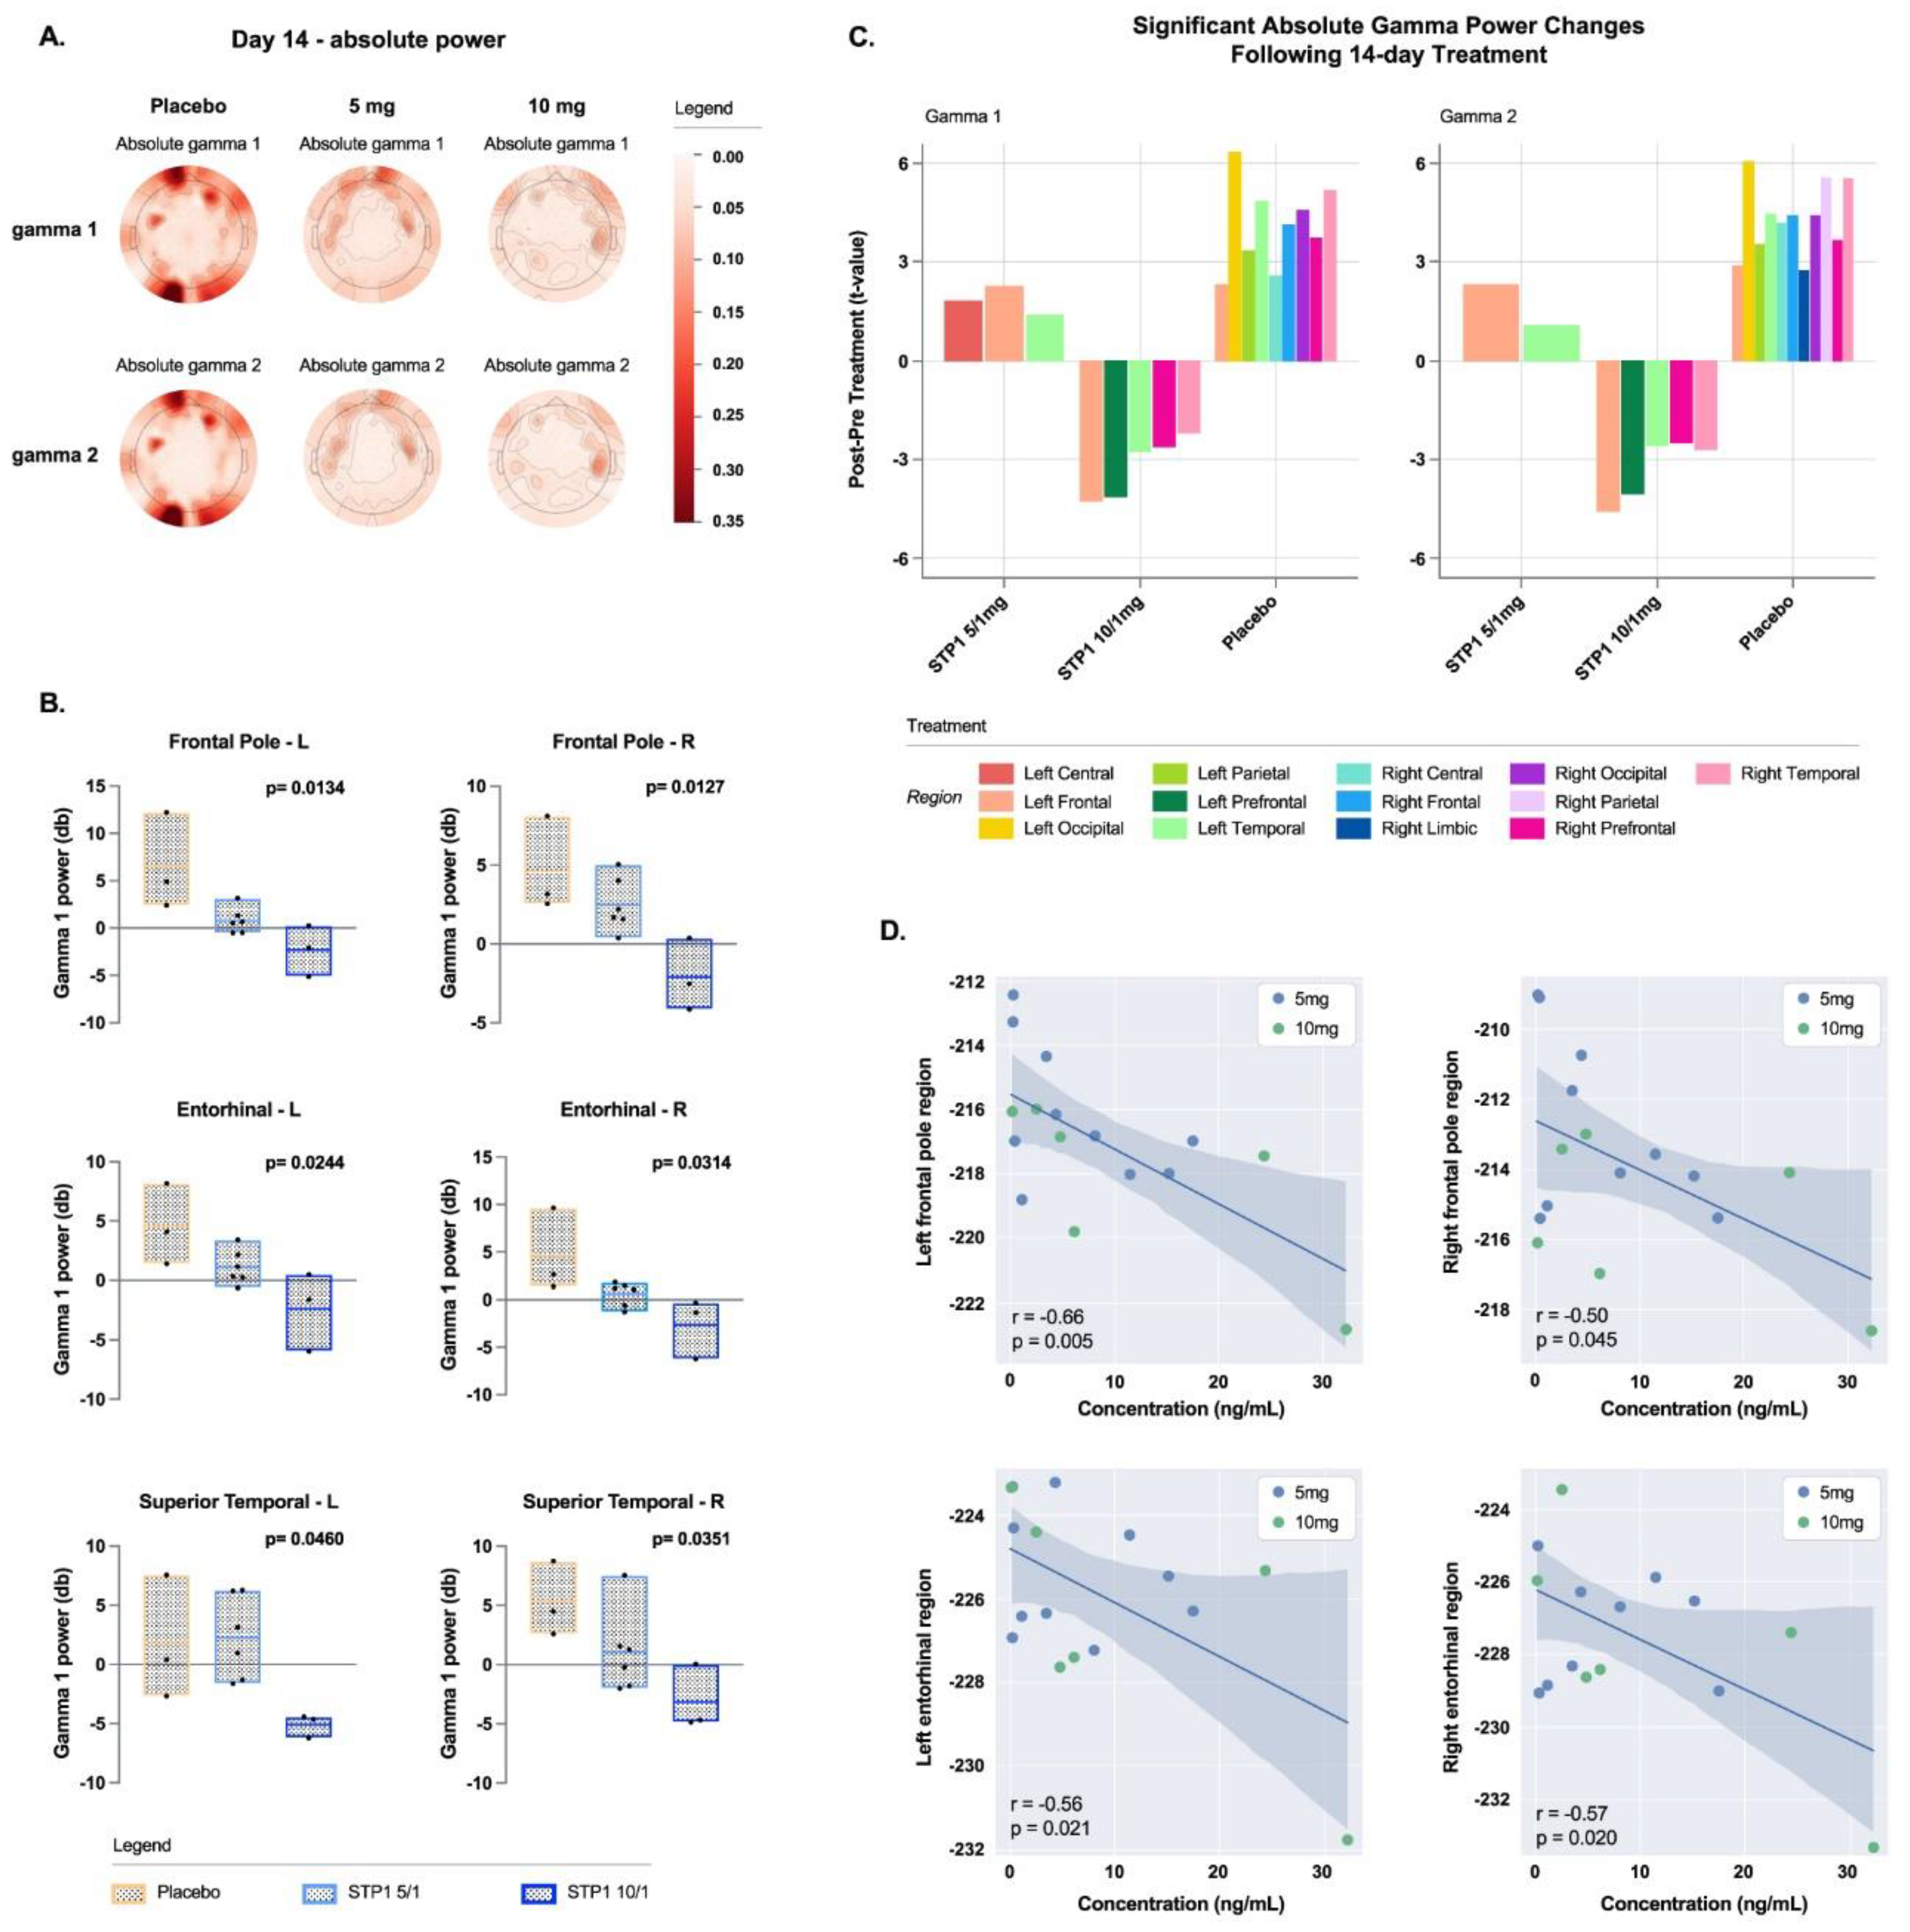
Figure 5.
Alpha bands in ASD-Phen1 patients dosed with STP1 5/1 mg (N=6) (i.e., ibudilast 5mg plus bumetanide 1mg), STP1 10/1 mg (N=3) (i.e., ibudilast 10mg plus bumetanide 1mg) or Placebo (N=3), twice a day on Day 14 (end of treatment). a) topoplots showing change in absolute power in alpha 1 and alpha 2; b) alpha 2 (relative) in brain regions on Day 14 (each value is normalized to pre-dose).
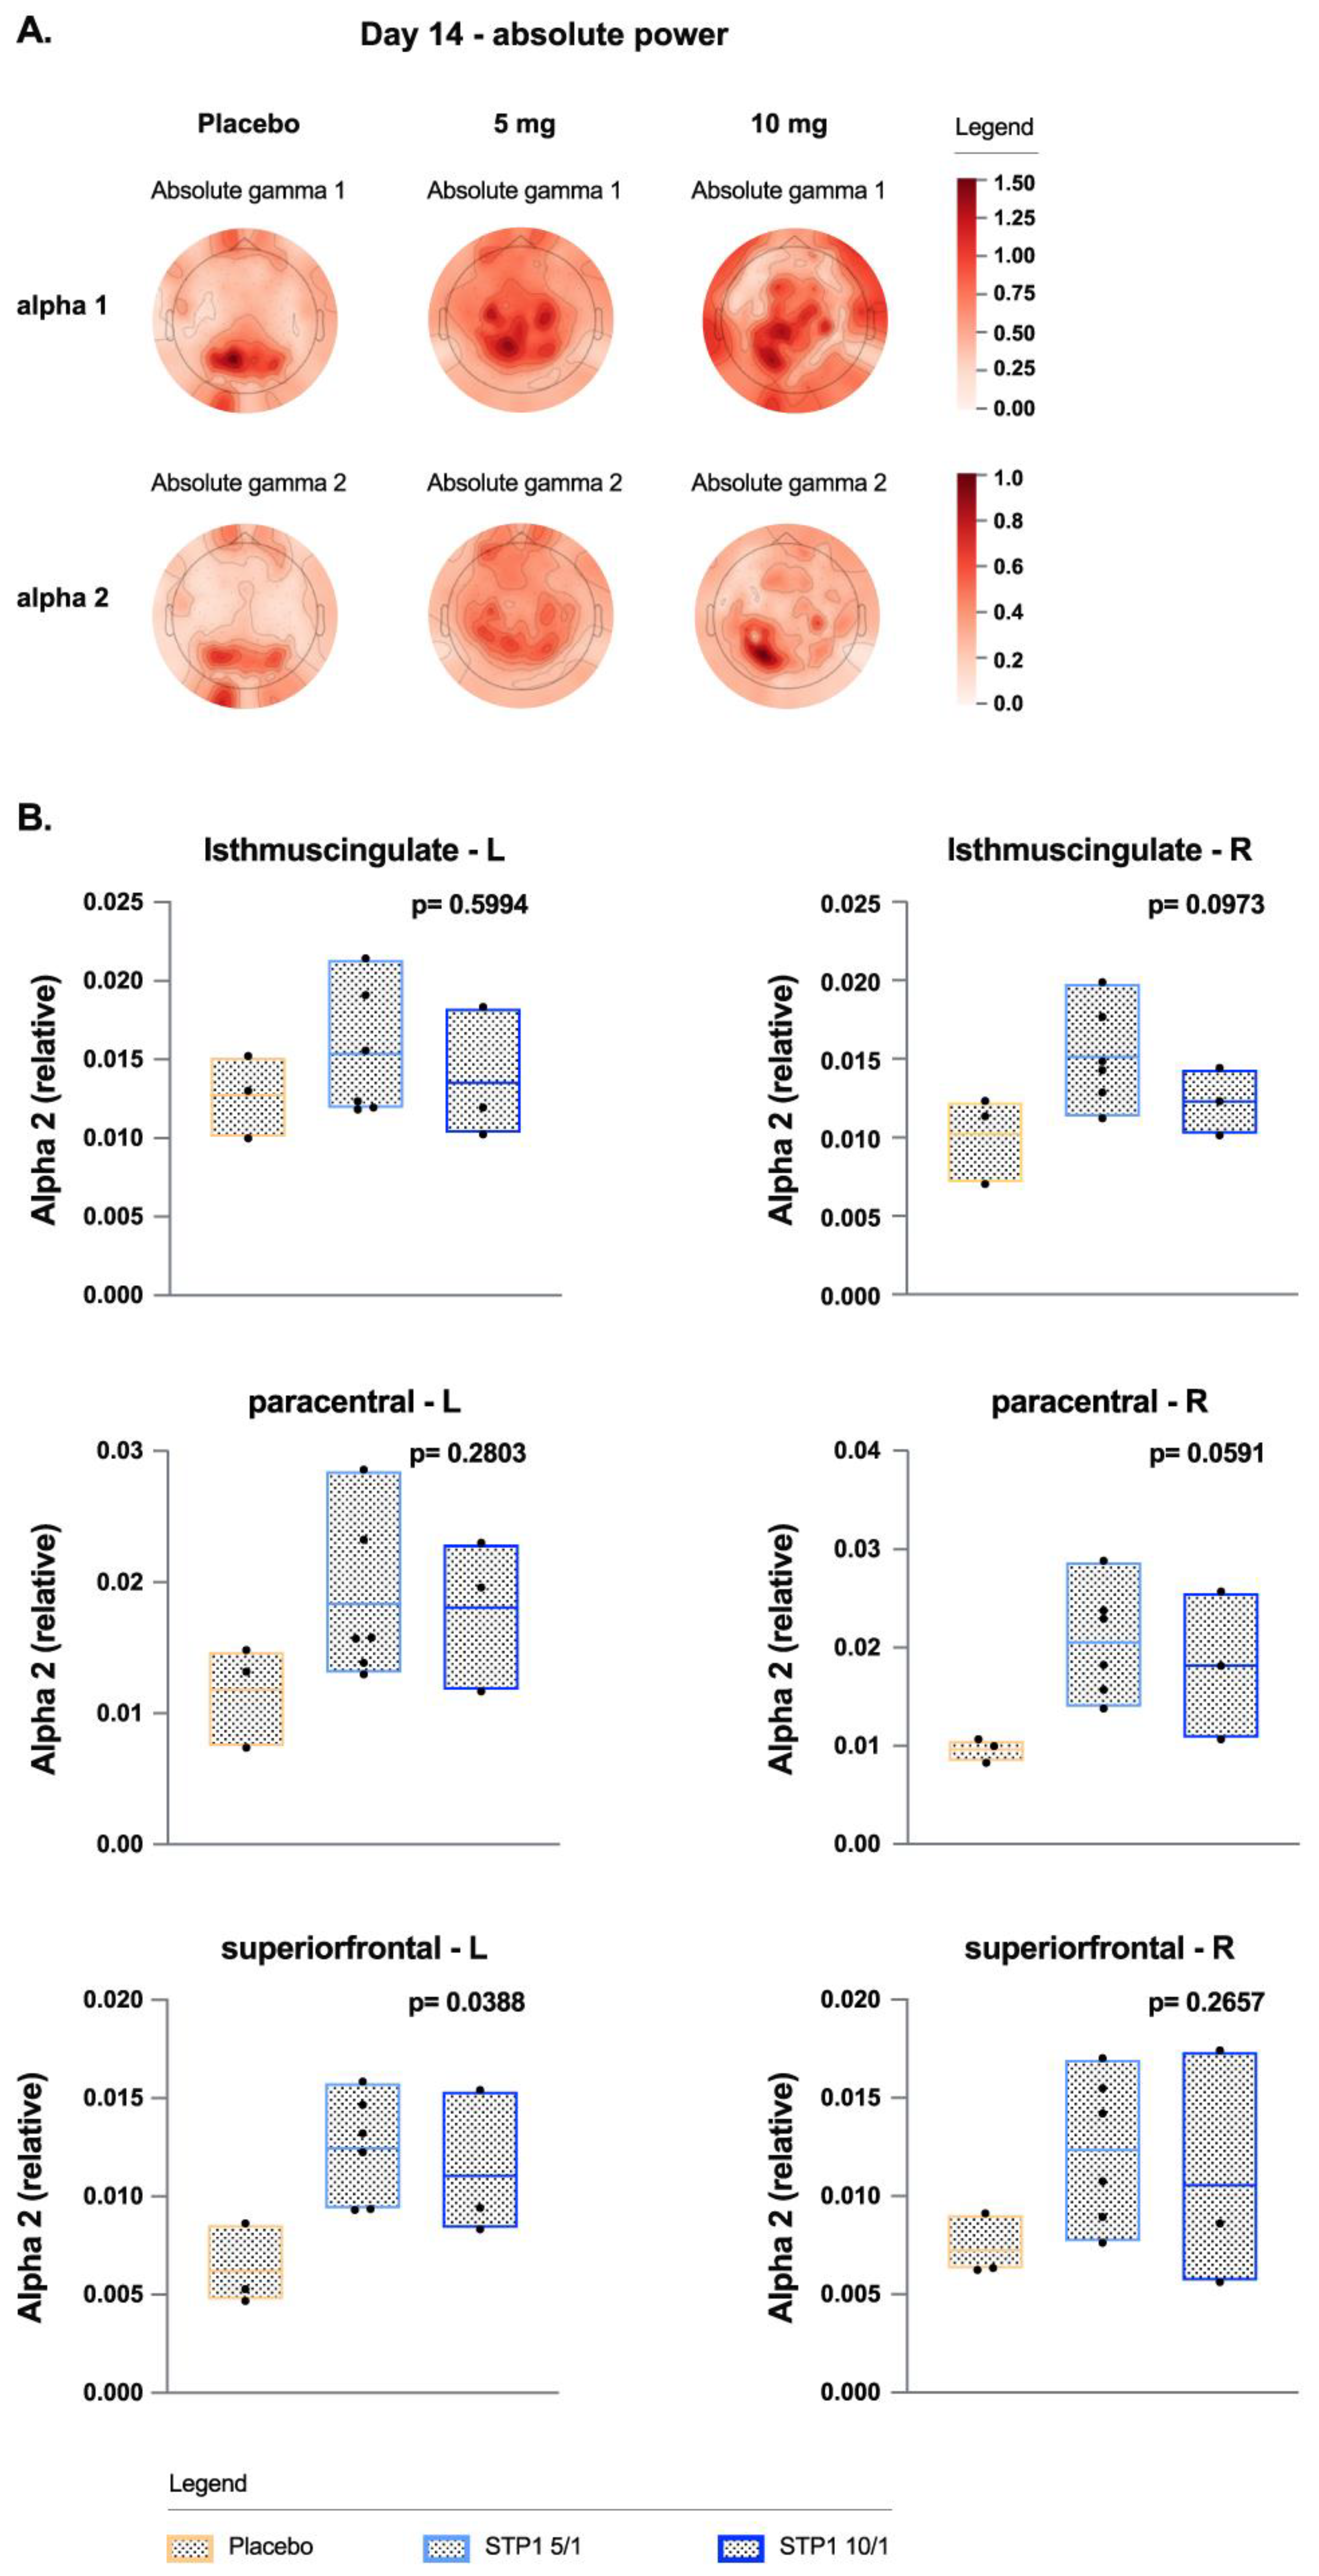
Figure 6.
Complex synchronization analysis showing an increased ITC signal indicates increased neural synchronization to the auditory chirp measured in placebo N=2, STP1 5/1 mg N=5 and STP1 10/1 mg N=3 at Day 1 post-dose and Day 14.
Figure 6.
Complex synchronization analysis showing an increased ITC signal indicates increased neural synchronization to the auditory chirp measured in placebo N=2, STP1 5/1 mg N=5 and STP1 10/1 mg N=3 at Day 1 post-dose and Day 14.
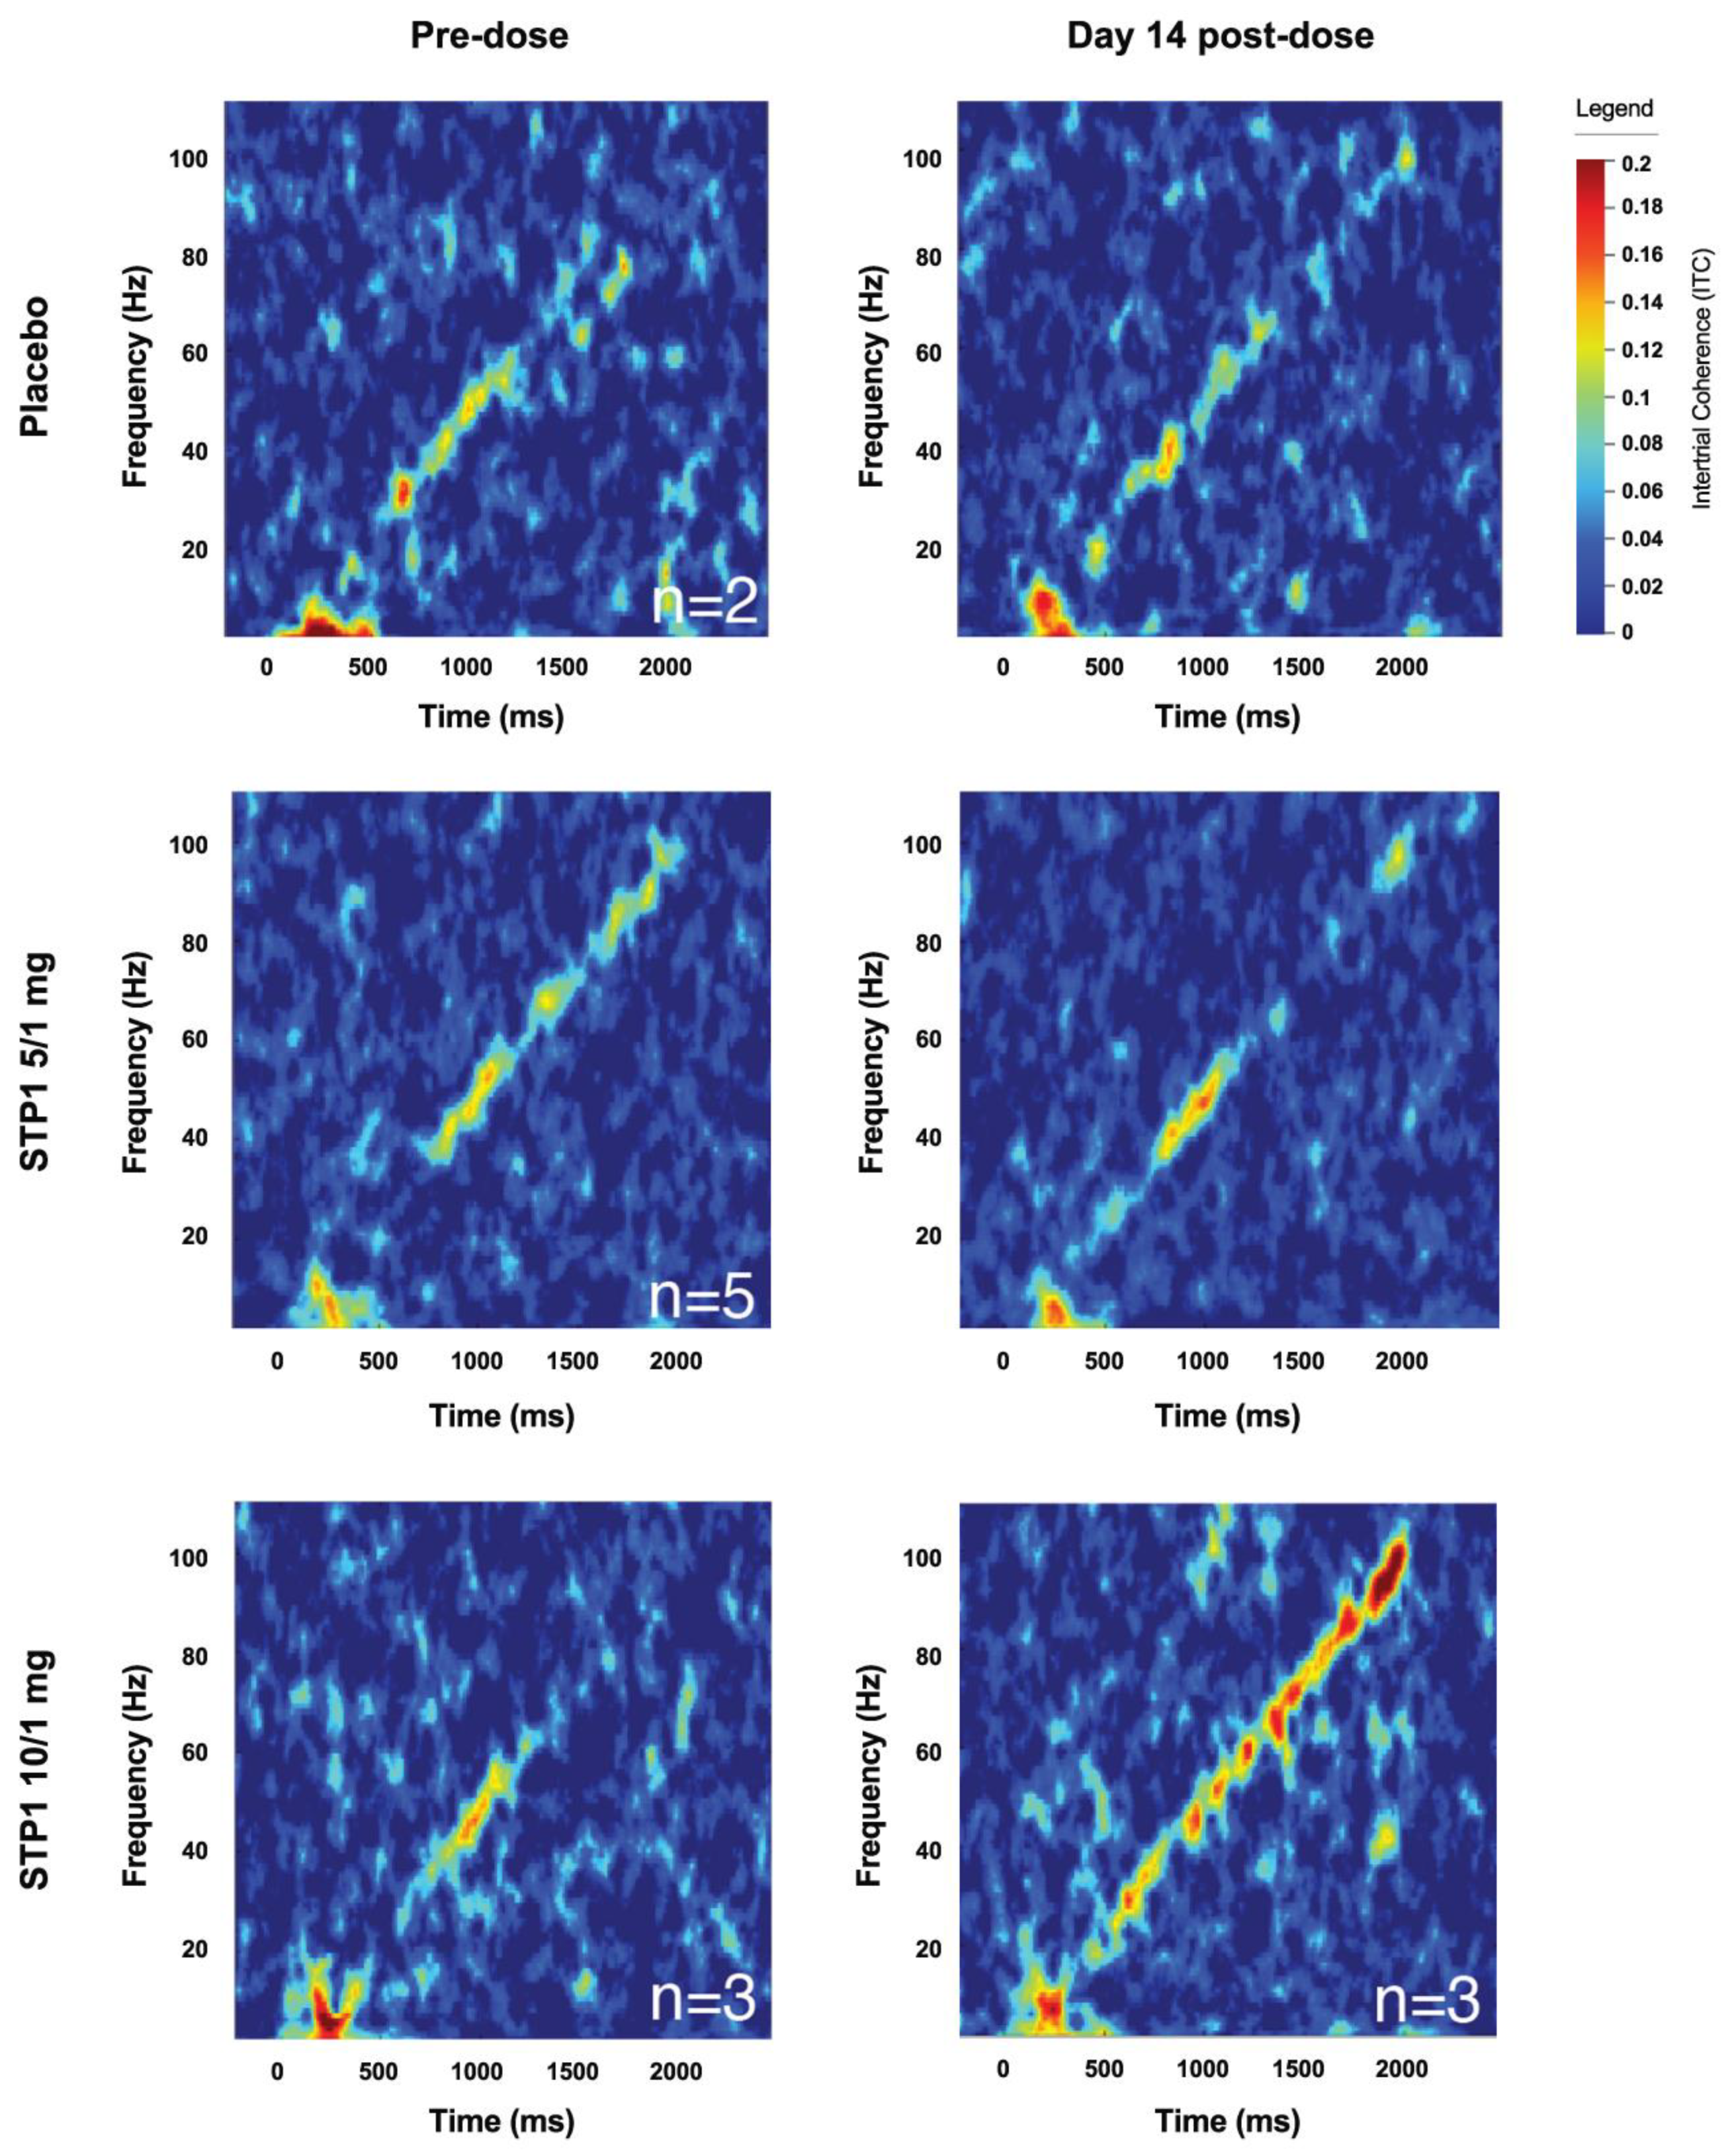
Figure 7.
Linear PK/PD models using ABC-C scores (a) and SRS-2 scores (b) and ibudilast Cmax (ng/ml) at Day 14.
Figure 7.
Linear PK/PD models using ABC-C scores (a) and SRS-2 scores (b) and ibudilast Cmax (ng/ml) at Day 14.
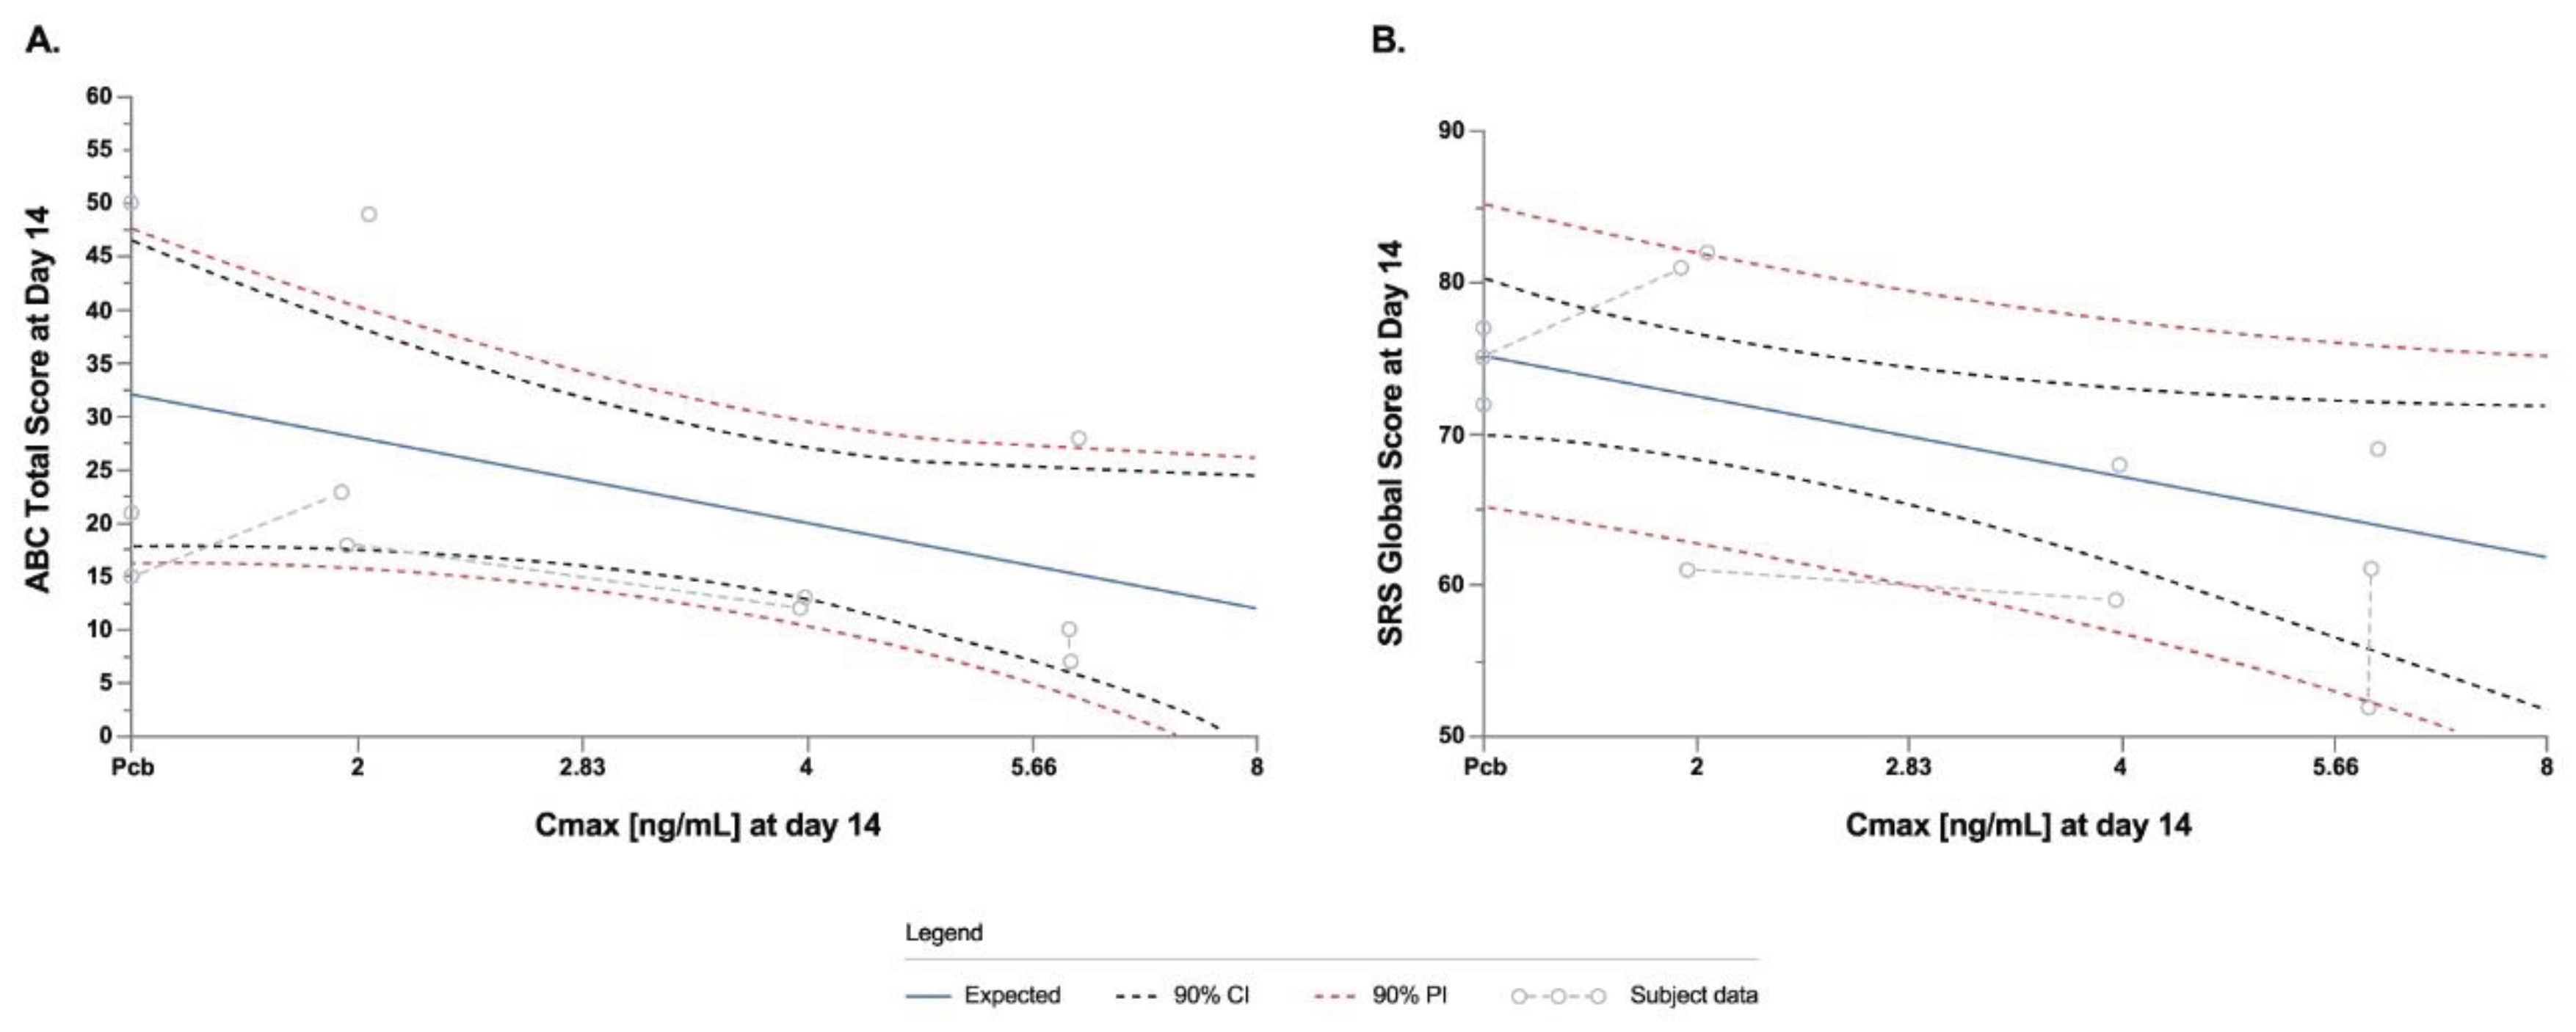

Table 1.
Demographics.
| STP1 5/1mg (N=6) |
STP1 10/1mg (N=3) |
Placebo (N=3) |
Overall (N=12) |
||
|---|---|---|---|---|---|
| Age (years), n | 6 | 3 | 3 | 12 | |
| Mean (SD) |
18.67 (0.82) |
19.67 (1.53) |
19.67 (2.89) |
19.17 (1.59) |
|
| Median (Min, Max) |
18.50 (18.0 - 20.0) |
20.00 (18.0 -21.0) |
18.00 (18.0 - 23.0) |
18.50 (18.0 - 23.0) |
|
| Height (cm), n | 6 | 3 | 3 | 12 | |
| Mean (SD) |
175.50 (10.60) |
171.33 (14.15) |
174.67 (11.15) |
174.25 (10.64) |
|
| Median (Min, Max) |
178.00 (155.0 - 185.0) |
179.00 (155.0 - 180.0) |
179.00 (162.0 - 183.0) |
179.00 (155.0 - 185.0) |
|
| Weight (kg), n | 6 | 3 | 3 | 12 | |
| Mean (SD) |
114.22 (23.46) |
109.80 (31.23) |
78.13 (26.32) |
104.09 (28.32) |
|
| Median (Min, Max) |
111.20 (82.4 - 146.0) |
100.20 (84.5 - 144.7) |
73.40 (54.5 - 106.5) |
102.90 (54.5 - 146.0) |
|
| BMI (kg/m2), n | 6 | 3 | 3 | 12 | |
| Mean (SD) |
36.80 (5.02) |
37.07 (6.89) |
25.17 (5.84) |
33.96 (7.38) |
|
| Median (Min, Max) |
36.00 (32.1 - 45.1) |
35.20 (31.3 - 44.7) |
22.90 (20.8 - 31-8) |
33.25 (20.8 - 45.1) |
|
|
Head circumference within First Two Years of Age (cm), n |
5 | 2 | 3 | 10 | |
| Mean (SD) |
47.48 (5.03) |
44.05 (7.85) |
47.03 (4.27) |
46.66 (4.91) |
|
| Median (Min, Max) |
49.60 (38.5 - 50.2) |
44.05 (38.5 - 49.6) |
49.50 (42.1 - 49.5) |
49.50 (38.5 - 50.2) |
|
| SB5-ABIQ, n | 6 | 3 | 3 | 12 | |
| Mean (SD) |
74.17 (18.06) |
70.33 (21.08) |
82.00 (13.08) |
75.17 (16.73) |
|
| Median (Min, Max) |
74.50 (47.0 - 94.0) |
76.00 (47.0 - 88.0) |
88.00 (67.0 - 91.0) |
79.00 (47.0 - 94.0) |
|
| Sex, n (p) | 6 | 3 | 3 | 12 | |
| Male | 5 (0.83) | 2 (0.67) | 2 (0.67) | 9 (0.75) | |
| Female | 1 (0.17) | 1 (0.33) | 1 (0.33) | 3 (0.25) | |
| Race, n (p) | 6 | 3 | 3 | 12 | |
| American Indian | 0 (0.00) | 0 (0.00) | 0 (0.00) | 0 (0.00) | |
| Asian | 0 (0.00) | 0 (0.00) | 0 (0.00) | 0 (0.00) | |
| Black | 1 (0.17) | 1 (0.33) | 0 (0.00) | 2 (0.17) | |
| Hawaiian | 0 (0.00) | 0 (0.00) | 0 (0.00) | 0 (0.00) | |
| White | 5 (0.83) | 2 (0.67) | 3 (1.00) | 10 (0.83) | |
| Other | 0 (0.00) | 0 (0.00) | 0 (0.00) | 0 (0.00) | |
| Ethnicity, n (p) | 6 | 3 | 3 | 12 | |
| Hispanic | 0 (0.00) | 0 (0.00) | 0 (0.00) | 0 (0.00) | |
| Not Hispanic | 6 (1.00) | 3 (1.00) | 3 (1.00) | 12 (1.00) | |
Table 2.
Adverse Events (AEs) in ASD-Phen1 patients dosed with STP1 5/1 mg, STP1 10/1 mg or placebo over a 2-week, twice a day, treatment period.
Table 2.
Adverse Events (AEs) in ASD-Phen1 patients dosed with STP1 5/1 mg, STP1 10/1 mg or placebo over a 2-week, twice a day, treatment period.
| STP1 5/1mg (N=6) |
STP1 10/1mg (N=3) |
Placebo (N=3) |
||||||||
|---|---|---|---|---|---|---|---|---|---|---|
| Mild | Moderate | Severe | Mild | Moderate | Severe | Mild | Moderate | Severe | ||
| Total Number of AEs | 5 | 0 | 0 | 2 | 0 | 0 | 2 | 0 | 0 | |
| Patients with at least one AE | 4 (0.67) | 0 (0.00) | 0 (0.00) | 2 (0.67) | 0 (0.00) | 0 (0.00) | 2 (0.67) | 0 (0.00) | 0 (0.00) | |
| Gastrointrestinal disorders | 2 (0.33) | 0 (0.00) | 0 (0.00) | 0 (0.00) | 0 (0.00) | 0 (0.00) | 2 (0.67) | 0 (0.00) | 0 (0.00) | |
| Diarrhea | 1 (0.17) | 0 (0.00) | 0 (0.00) | 0 (0.00) | 0 (0.00) | 0 (0.00) | 0 (.00) | 0 (0.00) | 0 (0.00) | |
| Nausea | 1 (0.17) | 0 (0.00) | 0 (0.00) | 0 (0.00) | 0 (0.00) | 0 (0.00) | 2 (0.67) | 0 (0.00) | 0 (0.00) | |
| Infections and infestions | 0 (0.00) | 0 (0.00) | 0 (0.00) | 2 (0.67) | 0 (0.00) | 0 (0.00) | 0 (0.00) | 0 (0.00) | 0 (0.00) | |
| Infection | 0 (0.00) | 0 (0.00) | 0 (0.00) | 1 (0.33) | 0 (0.00) | 0 (0.00) | 0 (0.00) | 0 (0.00) | 0 (0.00) | |
| Upper respiratory tract infection | 0 (0.00) | 0 (0.00) | 0 (0.00) | 1(0.33) | 0 (0.00) | 0 (0.00) | 0 (0.00) | 0 (0.00) | 0 (0.00) | |
| Psychiatric disorders | 1 (0.17) | 0 (0.00) | 0 (0.00) | 0 (0.00) | 0 (0.00) | 0 (0.00) | 0 (0.00) | 0 (0.00) | 0 (0.00) | |
| Trichotillomania | 1 (0.17) | 0 (0.00) | 0 (0.00) | 0 (0.00) | 0 (0.00) | 0 (0.00) | 0 (0.00) | 0 (0.00) | 0 (0.00) | |
| Renal and urinary disorders | 1 (0.17) | 0 (0.00) | 0 (0.00) | 0 (0.00) | 0 (0.00) | 0 (0.00) | 0 (0.00) | 0 (0.00) | 0 (0.00) | |
| Pollakiuria | 1 (0.17) | 0 (0.00) | 0 (0.00) | 0 (0.00) | 0 (0.00) | 0 (0.00) | 0 (0.00) | 0 (0.00) | 0 (0.00) | |
| Respiratory, thoracic, and mediastinal disorders | 1 (0.17) | 0 (0.00) | 0 (0.00) | 0 (0.00) | 0 (0.00) | 0 (0.00) | 0 (0.00) | 0 (0.00) | 0 (0.00) | |
| Dyspnoea | 1 (0.17) | 0 (0.00) | 0 (0.00) | 0 (0.00) | 0 (0.00) | 0 (0.00) | 0 (0.00) | 0 (0.00) | 0 (0.00) | |
Table 3.
Pharmacokinetics characteristics of ibudilast and bumetanide in ASD-Phen1 dosed with STP1 5/1 mg and STP1 10/1 mg, twice a day, during a 2-week treatment period. Data are expressed as mean ± SD, CV is indicated in brackets.
Table 3.
Pharmacokinetics characteristics of ibudilast and bumetanide in ASD-Phen1 dosed with STP1 5/1 mg and STP1 10/1 mg, twice a day, during a 2-week treatment period. Data are expressed as mean ± SD, CV is indicated in brackets.
| Ibudilast 5mg (STP1 5/1mg) |
N | Ibudilast 10mg (STP1 10/1mg) |
N | Bumetanide 1mg (STP1 5/1mg) |
N | Bumetanide 1mg (STP1 10/1mg) |
N | ||||
| Day 1 | |||||||||||
| Cmax, Day1 (ng/mL) |
6.45 ± 5.48 (85.01) |
6 | 18.23 ± 5.05 (27.71) |
3 | 15.08 ± 9.31 (61.77) |
6 | 11.45 ± 4.48 (39.10) |
3 | |||
| Tmax (hrs) |
4.68 ± 1.62 (34.61) |
6 | 4.00 ± 1.96 (48.99) |
3 | 1.76 ± 0.62 (35.51) |
6 | 2.07 ± 0.09 (4.13) |
3 | |||
| AUC0-tau(6h) (hrs*ng/mL) |
27.21 ± 18.95 (69.27) |
4 | 72.48 | 1 | 42.21 ± 22.38 (53.02) |
5 | 27.21 | 1 | |||
| AUC0-last (hrs*ng/mL) |
21.55 ± 17.88 (83.00) |
6 | 66.09 ± 28.63 (43.33) |
3 | 48.35 ± 25.00 (51.70) |
6 | 37.85 ± 19.80 (52.32) |
3 | |||
| Vz/F (mL) | - | 0 | - | 0 | 95235.99 | 1 | - | 0 | |||
| Cl/F (mL/hrs) | - | 0 | - | 0 | 32873.83 | 1 | - | 0 | |||
| Day 7 | |||||||||||
| Steady state concentration | 7.94 ± 3.93 (49.50) |
6 | 18.07 ± 7.08 (39.18) |
3 | na | na | |||||
| Day 14 | |||||||||||
| Steady state concentration | 8.61 ± 4.33 (50.30) |
6 | 19.84 ± 11.46 (57.76) |
3 | na | na | |||||
| Cmax (n g/mL) |
14.95 ± 6.66 (44.54) |
6 | 33.37 ± 15.52 (46.51) |
3 | 21.74 (58.07) |
6 | 11.09 ± 7.84 (70.69) |
3 | |||
| Tmax (hrs) |
3.66 ± 1.99 (54.22) |
6 | 3.99 ± 2.00 (50.14) |
3 | 1.54 (87.15) |
6 | 1.64 ± 0.59 (35.71) |
3 | |||
| Ctrough (ng/mL) |
6.16 ± 3.99 (54.22) |
6 | 15.64 ± 9.70 (62.00) |
3 | 1.00 ± 0.00 (0.00) |
6 | 1.00 ± 0.00 0.00 |
3 | |||
| t 1/2 (hrs) | 67.28 ± 38.67 (57.48) |
6 | 16.71 ± 10.36 (62.02) |
3 | 1.83 ± 0.50 (27.28) |
5 | 1.65 | 1 | |||
| AUC0-tau(6h) (hrs*ng/mL) |
66.86 ± 34.96 (52.29) |
6 | 158.52 ± 88.37 (55.75) |
3 | 50.23 ± 25.06 (39.21) |
6 | 32.61 ± 14.92 (45.76) |
3 | |||
| AUC0-last (hrs*ng/mL)/dose | 1019.53 ± 875.64 (85.89) |
6 | 390.48 ± 259.84 (66.54) |
3 | 55.08 ± 25.06 (45.50) |
6 | 33.01 ± 14.90 (58.69) |
3 | |||
| Vz/F (mL) | 597563.58 ± 552913.71 (92.53) |
6 | 397451.90 ± 282049.30 (70.96) |
3 | 47158.13 ± 19241.59 (40.80) |
5 | 43460.94 | 1 | |||
| Cl/F (mL/hrs) | 9123.07 ± 9799.35 (107.41) |
6 | 19955.24 ± 14255.34 (71.80) |
3 | 19349.81 ± 10827.27 (55.96) |
5 | 18224.58 | 1 | |||
Disclaimer/Publisher’s Note: The statements, opinions and data contained in all publications are solely those of the individual author(s) and contributor(s) and not of MDPI and/or the editor(s). MDPI and/or the editor(s) disclaim responsibility for any injury to people or property resulting from any ideas, methods, instructions or products referred to in the content. |
© 2024 by the authors. Licensee MDPI, Basel, Switzerland. This article is an open access article distributed under the terms and conditions of the Creative Commons Attribution (CC BY) license (https://creativecommons.org/licenses/by/4.0/).
Copyright: This open access article is published under a Creative Commons CC BY 4.0 license, which permit the free download, distribution, and reuse, provided that the author and preprint are cited in any reuse.


