Submitted:
22 March 2024
Posted:
25 March 2024
You are already at the latest version
Abstract
Keywords: retinoblastoma, RB, gastric inhibitory polypeptide receptor, GIPR, trefoil factor family peptide, TFF1, CAM, tumorigenesis, MK0893, miR5-542-5p
Keywords:
retinoblastoma
; RB
; gastric inhibitory polypeptide receptor
; GIPR
; trefoil factor family peptide
; TFF1
; CAM
; tumorigenesis
; MK0893
; miR5-542-5p
1. Introduction
With approximately 1 in every 18,000 live births worldwide, retinoblastoma (RB) is a rare tumor, yet the most common intraocular pediatric malignancy found in younger children under five years of age [1,2,3]. In bilateral RBs, which make up approx. 40% of all cases, the tumor effects both eyes [4]. The RB1 gene regulates the cell cycle and inhibits tumorigenesis and RB develops after a loss or mutation of both gene copies [1,2,4,5,6]. If diagnosed early, RB is curable, but if left untreated it leads to severe visual impairment and can even become life-threatening due to metastatic spread [1,7,8,9,10,11]. Enucleation, the complete removal of the affected eye, is avoided whenever salvage is possible, e.g. via intraarterial chemotherapy (IAC) or intravitreal chemotherapy (IVC). IVC focusses on precise drug delivery to the hotspot of tumor seeding, the vitreous body, reducing the toxicity of systemic chemotherapy [1,11,12,13,14,15]. However, current therapies are associated with a considerable, sometimes even complete loss of vision and a significantly increased risk for secondary tumors [16] as well as the development of chemotherapy resistance [17]. Therefore, current therapeutic and diagnostic procedures need to be improved and new or complementary treatment methods are required.
In humans, the trefoil factor family (TFF) comprises 3 peptides - TFF1, TFF2, and TFF3 - all possessing a characteristic clover leaf-like disulfide structure, the so-called TFF domain (for review see: [18,19,20]). TFF peptides have been shown to be aberrantly expressed in a wide range of human cancer entities including retinoblastoma (for review see:[21]). Our group demonstrated that TFF1 acts as tumor suppressor in the progression of retinoblastoma by reducing RB cell viability, growth and proliferation and increasing apoptosis in vitro as well as inhibiting tumor growth in vivo [22]. Besides, we previously discovered that TFF1 levels correlate with a higher clinical RB tumor-node-metastasis (TNM) stage [23] and recently TFF1 was described as a biomarker in retinoblastoma patients with a more advanced subtype and poor prognosis [7,24]. Most recently, we demonstrated a promising role of TFF1 as a prognostic and diagnostic marker available in aqueous humor of RB liquid biopsies in general and under therapy in particular [25,26]. After TFF1 overexpression in RB cells we identified several differentially expressed genes and pathways involved in cancer progression by gene expression array analysis [22]. One of the genes with the highest fold change in expression levels after TFF1 overexpression was the glucose-dependent insulinotropic polypeptide or gastric inhibitory polypeptide receptor (GIPR). The human GIPR gene encoding for a G protein-coupled class B transmembrane protein was first cloned and molecularly characterized in 1995 [27,28,29]. G protein coupled receptors (GPCRs) have been described as low affinity receptors for TFF2 and TFF3 [30,31] and might be potential mediators in TFF signaling. GIPR mediates the metabolic function of the glucose-dependent insulinotropic or gastric inhibitory polypeptide (GIP) namely glucose-dependent stimulation of insulin release from beta-cells of the pancreas ([32]; for review see [33,34]). GIPR is, however, not only expressed on beta-cells of the pancreas, throughout the gastrointestinal tract and in adipose tissues, but also in certain regions of the rat and human brain [35,36,37,38]. In the nervous system, GIP effects on neurogenesis and neuronal survival have been reported (for overview see: [37]. Recently, alterations in GIPR expression have been reported in neuroendocrine tumors [39], neuroendrocrine neoplasms [40] and medullary thyroid cancer [41], suggesting a clinically significant diagnostic and prognostic potential (for review see: [33,34]).
As various studies reported that signaling along the GIP/GIPR axis exerts pro-proliferative and anti-apoptotic effects [42,43,44,45,46,47] in the study presented, we investigated if the effects seen after TFF1 overexpression relating to RB cell viability, cell growth, proliferation, apoptosis and tumorigenicity are potentially mediated via the GIPR signaling axis and if GIPR might even be the TFF1 receptor yet to be found. For this purpose, we overexpressed GIPR in the RB cell lines WERI-Rb1 and Y79 and examined the effects on RB cell behavior in vitro as well as in vivo in in ovo chorioallantoic membrane (CAM) assays. Besides, we investigated the expression of GIPR in primary RB tumor cells in correlation with TFF1 expression and examined up- and down-stream signaling components of GIPR via luciferase binding studies and proteome profiler oncology array.
2. Materials and Methods
2.1. Human Retina and Retinoblastoma Samples
In this study, we used postmortem healthy human retinal tissue and samples of retinoblastoma patients. The research was conducted following the principles outlined in the Declaration of Helsinki. Approval for the use of human retinal tissue (approval no. 06-30214) and RB samples (approval no. 14-5836-BO) was granted by the Ethics Committee of the Medical Faculty at the University Hospital Essen of the University of Duisburg-Essen. Informed consent was obtained from all subjects involved in the study.
2.2. Human Cell Lines and Culture
The RB cell lines WERI-Rb1 (Weri; [48] and Y79 [49], initially acquired from the Leibniz Institute DSMZ (German Collection of Microorganisms and Cell Cultures), were generously supplied by Dr. H. Stephan. RB cell lines were cultivated as suspension cultures as described previously [50]. Human embryonic kidney (HEK293T) cells were cultivated as an adherent cell culture in DMEM medium (PAN-Biotech, Aidenbach, Germany), supplemented with 10% FBS (PAN-Biotech, Aidenbach, Germany), 4 mM L-glutamine (Gibco, Karlsruhe, Germany), 100 U penicillin/mL, and 100 μg streptomycin/mL (Gibco, Karlsruhe, Germany). The cells were maintained at 37°C, 5% CO2, and 95% humidity.
2.3. Expression Vectors
For the construction of the GIPR overexpression vector (GIPR_plenti), the human GIPR cDNA sequence was excised from the human hGip-R pcDNA3 plasmid (cat. #14942; Addgene, Watertown, MA, USA, [28]) using the NotI fast digest restriction enzyme (Thermo Scientific, Oberhausen, Germany). Subsequently, it was ligated into the NotI-digested pENTR4 vector (cat. #17424; Addgene, Watertown, MA, USA [51]). Afterwards, the GIPR sequence was inserted into the plenti CMV Puro Dest vector (cat. #17452; Addgene, Watertown, MA, USA, [51]) using the Gateway LR Clonase II Enzyme Mix (Invitrogen, Darmstadt, Germany) and following the manufacturer's protocol. In all GIPR overexpression experiments, an empty plenti vector (empty_plenti) served as the control vector.
MicroRNA-542-5p sequences were extracted from genomic HEK293T DNA via PCR using specific primers (forward: 5′-GAATTCATTTGGGATCGGTCAAGGATG-3′ and reverse: 5′-GGATCCTTTGCTTAGGGCCCACTTTC-3′) containing EcoRI or BamHI restriction sites (underlined). After EcoRI/BamHI digestion (Thermo Scientific, Oberhausen, Germany), the miR-542-5p PCR product was integrated into the pSG5 vector (cat. #216201; Stratagene, La Jolla, CA, USA) to generate a pSG5-miR-542-5p vector. The empty pSG5 vector (pSG5) served as a control vector.
For miR-542-5p binding studies, the wildtype miR-542-5p binding site (GIPR-BS) within the 3´-UTR of the GIPR sequence was amplified by PCR from the GIPR_plenti plasmid DNA using specific primers (forward: 5′-ACTAGTCCACACACGCTATGGAATG-3´ and reverse: 5′-GAGCTCGGGCCTTTGCCTATGCTATC-3′), containing SpeI or SacI restriction sites (underlined). Subsequently, the PCR fragments were inserted into a pCR®4-TOPO vector with the TOPO™TA Cloning™ Kit (Thermo Scientific; Oberhausen, Germany) following the manufacturer´s protocol. To create a mutant binding site (GIPR-MUT), primers (forward: 5'-CACTTAAGCCAGTCGACAAAGAGGTGAAAG-3' and reverse: 5'-CTTTCACCTCTTTGTCGACTGGCTTAAGTG-3') containing a SalI restriction site (underlined) instead of the miR-542-5p binding site were used in combination with the wildtype primers mentioned above. Following SpeI/SacI digestion (Thermo Scientific; Oberhausen, Germany), the wildtype and mutant miR-542-5p binding site PCR products were ligated into the pmiR-TK-RNL vector [52] to generate pmiR-GIPR-BS and pmir-GIPR-MUT vectors. The empty pmiR-TK-RNL vector (pmiR) served as a control vector. Validation of all constructed vectors was performed via Sanger sequencing (Microsynth, Balgach, Switzerland).
2.4. Luciferase Binding Studies
The interaction between miR-542-5p and the potential binding site in the 3′-UTR of the GIPR gene was investigated using a Dual-Luciferase® Reporter Assay System (Promega, Mannheim, Germany). HEK293T cells were transiently co-transfected with either the miR-542-5p expression vector (pSG5-miR-542-5p) or an empty control vector (pSG5), in combination with the empty pmiR-TK-RNL vector (pmiR), a vector containing the miR-542-5p binding site (pmiR-GIPR-BS) or a vector containing the mutant binding site (pmiR-GIPR-MUT). After incubation for 48 hours, cells were lysed in 1x passive lysis buffer (Promega) and luciferase activity was quantified via Dual-Luciferase Reporter Assay (cat. #E1910, Promega, Walldorf, Germany) and visualized using a GloMax 20/20 luminometer (Promega, Walldorf, Germany) following the manufacturer's instructions. In the assay performed, binding to the potential binding site decreases luciferase activity. The relative luciferase activity was calculated as the ratio of firefly luciferase to renilla luciferase activity. All analyses were conducted in triplicates.
2.5. Transient GIPR and miR-542-5p Overexpression
For transient GIPR and miR-542-5p overexpression, 5×10⁵ Weri or Y79 cells were seeded into six-well plates with 2 mL DMEM (PAN-Biotech, Aidenbach, Germany) supplemented with 15% FBS (PAN-Biotech, Aidenbach, Germany) and 4 mM L-glutamine (Gibco, Karlsruhe, Germany). Plasmid DNA (4 µg) of GIPR_plenti, empty_plenti, pSG5-miR-542-5p, or empty pSG5 vectors were combined with transfection reagent (FuGENE® HD; Promega, Walldorf, Germany) at a ratio of 1:5 following our previously established protocol [22].
2.6. Lentivirus Production and Transduction
For lentivirus production, 6×10⁶ HEK293T cells were co-transfected with 6 μg of each of the following plasmid DNAs: packaging vectors pczVSV-G [53], pCD NL-BH [54] and GIPR_plenti or empty_plenti, the latter serving as a negative control. Transfections were performed in the presence of 45 μg polyethyleneimine (PEI, Sigma-Aldrich, St.Louis, USA) in DMEM medium. After 24 hours the medium was changed to Iscove’s Modified Dulbecco’s medium (IMDM, Pan-Biotech, Aidenbach, Germany) supplemented with 10% FBS and 1% penicillin/streptomycin. Seventy-two hours after transfection viral supernatants were harvested, filtered (0.45 μm sterile filter), and stored at -80°C until use.
For lentiviral transduction, 0.5×10⁶/mL RB cells were seeded in cell culture flasks (Greiner, Kremsmünster, Austria) in DMEM cell culture medium supplemented with 15% FBS, 4 mM L-glutamine, 100 U penicillin/mL, and 100 μg streptomycin/mL. After 24 hours the medium was replaced by GIPR (GIPR_plenti) or negative control (empty_plenti) viral supernatant. Transduction was performed in the presence of 50 μg/ml polybrene (H9268, Sigma-Aldrich, München, Germany). After 24 hours, double the volume of DMEM medium was added to the virus supernatant. Forty-eight hours later, the medium was exchanged completely with DMEM medium.
Virus production and transduction with TFF1 lentiviral supernatant was performed as described previously [22].
2.7. RNA Extraction and Quantitative Real-Time PCR
RNA was isolated using a NucleoSpin® RNA II Kit (Macherey & Nagel, Düren, Germany) and microRNA was isolated using a miRNeasy Kit (Qiagen, Hilden, Germany), both following the manufacturers` protocols.
Complementary DNA (cDNA) was synthesized using a QuantiTect Reverse Transcription Kit (Qiagen) following the manufacturer's protocol. For quantitative Real-Time (RT) PCR analysis of GIPR, a SYBR™ Green PCR assay (Applied Biosystems, Dreieich, Germany) was used with specific primers (forward: 5´-GGACTATGCTGCACCCAATG-3´ and reverse: 5´-CAAAGTCCCCATTGGCCATC-3´). Human GAPDH (forward: 5′-ACCCACTCCTCCACCTTTGA-3′ and reverse: 5′-CTGTTGCTGTAGCCAAATTCGT-3′) served as an endogenous control. RT-PCRs were performed in triplicates using 20 µL of SYBRTM Green PCR Master Mix (Applied Biosystems, Dreieich, Germany). Thermal cycling (Mastercycler X50s, Eppendorf, Hamburg, Germany) program comprised an initial denaturation step at 95 °C for 15 min, followed by 40 cycles of denaturation at 94 °C for 15 s, annealing at 55 °C for 30 s, and extension at 70 °C for 34 s.
The following primers (see Table 1) were used to analyze expression levels of potential downstream targets of GIPR (see Supl. Figure S1)
TaqMan Gene Expression Real-Time PCR analysis was performed according to the manufacturer's protocol using the TaqMan Universal PCR Master Mix (Applied Biosystems, Dreieich, Germany). Reactions were performed in duplicate with a total volume of 20 µl and the following cycling program: 2 minutes at 50°C, 10 minutes at 95°C, followed by 40 cycles of 15 seconds at 95°C and 60 seconds at 60°C. The following TaqMan Real-Time PCR assays (Applied Biosystems, Dreieich, Germany) were used: 18S (Hs99999901_s1), GIPR (Hs00609210_m1) and TFF1 (Hs00907239 m1).
MiRNA expression analyses were conducted using a miScript PCR Starter Kit (cat. # 2181193; Qiagen, Hilden, Germany) following the manufacturer's instructions. For miRNA quantification, miScript HiSpec buffer (Qiagen, Hilden, Germany) was used with specific primers for miR-542-5p (5´-TCGGGGATCATCATGTCACGAGA-3´) and 5.8S RNA (5′-CTACGCCTGTCTGAGCGTCGCTT-3′) as an internal control. The reactions were conducted in duplicates with the following subsequent thermal cycling program: 95 °C for 15 min; 94 °C for 15 s, 55 °C for 30 s, and 70 °C for 34 s, with a total of 40 cycles.
2.8. Western Blot Analyses
For Western blot analyses, 10x106 cells were washed with phosphate buffer saline (PBS) and subsequently lysed in RIPA buffer supplemented according to a previously described protocol (Weise und Dünker 2013). Protein extraction was done by ultrasonic cell lysis at 4°C and afterwards lysates were centrifuged at 10,000 g at 4 °C for 30 min. Protein concentration was determined using a bicinchoninic acid assay (BCA; Thermo Scientific, Oberhausen, Germany) following the manufacturer's instructions. Equal amounts of protein extracts were separated on a 10% SDS/PAGE gel and transferred onto nitrocellulose membranes. Membranes were blocked in 5% milk powder (Roth, Karlsruhe, Germany) and incubated overnight at 4 °C with primary antibodies against GIPR (1:2000; cat. #ab136266, abcam, Cambridge, UK), TFF1 (1:1000; cat. #ab92377, abcam, Cambridge, UK), or β-actin (1:1000; cat. #4967; Cell Signaling Technology, Danvers, USA). Blots were either cut or stripped by incubation in 0.2 N NaOH (Roth, Karlsruhe, Germany) for 15 min at RT, followed by re-blocking and incubation in antibody solution. Horseradish peroxidase (HRP) conjugated secondary antibodies (goat anti-rabbit; P0448, Agilent, Santa Clara, CA, USA) were applied at a dilution of 1:10,000 at room temperature for 1 hour. The HRP signal was visualized with a Western Bright Chemiluminescence Reagent (Advansta, San Jose, CA, USA) and detected with Celvin S reader (Biostep, Burkhardtsdorf, Germany).
2.9. Cell Viability Assays
For the determination of cell viability, a total of 4×10⁴ cells were seeded in 100 µL of DMEM medium into a 96-well plate in quintuplicates. Following 48 hour incubation, 10 µL of a water-soluble tetrazolium (WST-1) solution (Sigma-Aldrich, St.Louis, USA) was added to each well, and the cells were incubated at 37 °C for 2 hours. The formazan product produced by viable cells was quantified using a microplate reader (Agilent BioTek, Santa Clara, CA, USA) at an absorbance of 450 nm.
2.10. Growth Kinetics
Growth kinetics analyses were performed using 24-well plates. 3×10⁵ cells were seeded in triplicates, with each well containing 500 µL of DMEM medium (see above). The quantity of viable cells was determined by manual counts of trypan blue stained cells at defined intervals (0, 24, 48, 72, 96 and 168 hours).
2.11. BrdU and Caspase-3 Assays
Cell proliferation was examined by addition of 5 µM of BrdU (5-Bromo-2′-deoxyuridine; Sigma-Aldrich, Steinheim, Germany) to the cells. Thereafter, cells were seeded on Poly-D-Lysin (Sigma, St.Louis, USA) coated coverslips. After 4 hours at 37° and 10% CO2, cells were fixed in 4% paraformaldehyde (PFA). Subsequently, cells were permeabilized with 0.1% triton X-100 (Sigma, St.Louis, USA) in PBS for 30 min. To prevent unspecific binding, the cells were blocked in PBS containing 5% BSA (bovine serum albumin; Sigma, St.Louis, USA) and 5% NGS (normal goat serum; Dako, Santa Clara, USA). Next, cells were incubated overnight at 4°C with a rat anti-BrdU primary antibody (1:1000; cat. # ab6326; Abcam, Cambridge, UK). The next day the cells were washed (3x 5 min with PBS) and incubated with an Alexa Fluor 594-labeled goat anti-rat secondary antibody (1:1000 in PBS; cat. # A-1007, Molecular Probes, Eugene, OR, USA). The number of proliferating cells was determined by manual counting.
Caspase-3-dependent apoptosis was investigated by seeding cells on coverslips and fixing them 2 hours later with 4% PFA. Cells were treated with blocking solution (5% BSA, 5% NGS and 0.1% triton in PBS) for 1 hour at room temperature, followed by incubation with a cleaved, active caspase-3 antibody (1:400; cat.# 9664, Cell Signaling Technology, Danvers, USA), overnight at 4°C. The next day, cells were washed with PBS three times (5 min each) and incubated with an Alexa Fluor 594-labeled goat anti-rabbit secondary antibody (1:1000 in PBS; cat.# A-11012, Molecular Probes, Eugene, OR, USA). The number of caspase-3 dependent apoptotic cells was determined by manual counting.
2.12. GIPR Inhibitor Studies
For GIPR inhibitor studies, 4×10⁴ cells transduced with GIPR or control lentiviral supernatant were seeded in 100 µL of DMEM medium in a 96-well plate (Greiner, Kremsmünster, Austria). Cells were treated with the GIPR inhibitor MK0893 (MedChemExpress, Monmouth Junction, USA) diluted in DMSO (Sigma-Aldrich, Steinheim, Germany) at a final concentration of 5 nM or a DMSO (Sigma-Aldrich, Steinheim, Germany) control. Two hours later, recombinant TFF1 (rTFF1; Preprotech, Cranbury, NJ, USA) reconstituted in water was added at a final concentration of 5 µM. Controls were treated with water.
2.13. In Ovo Chorioallantoic Membrane (CAM) Assays
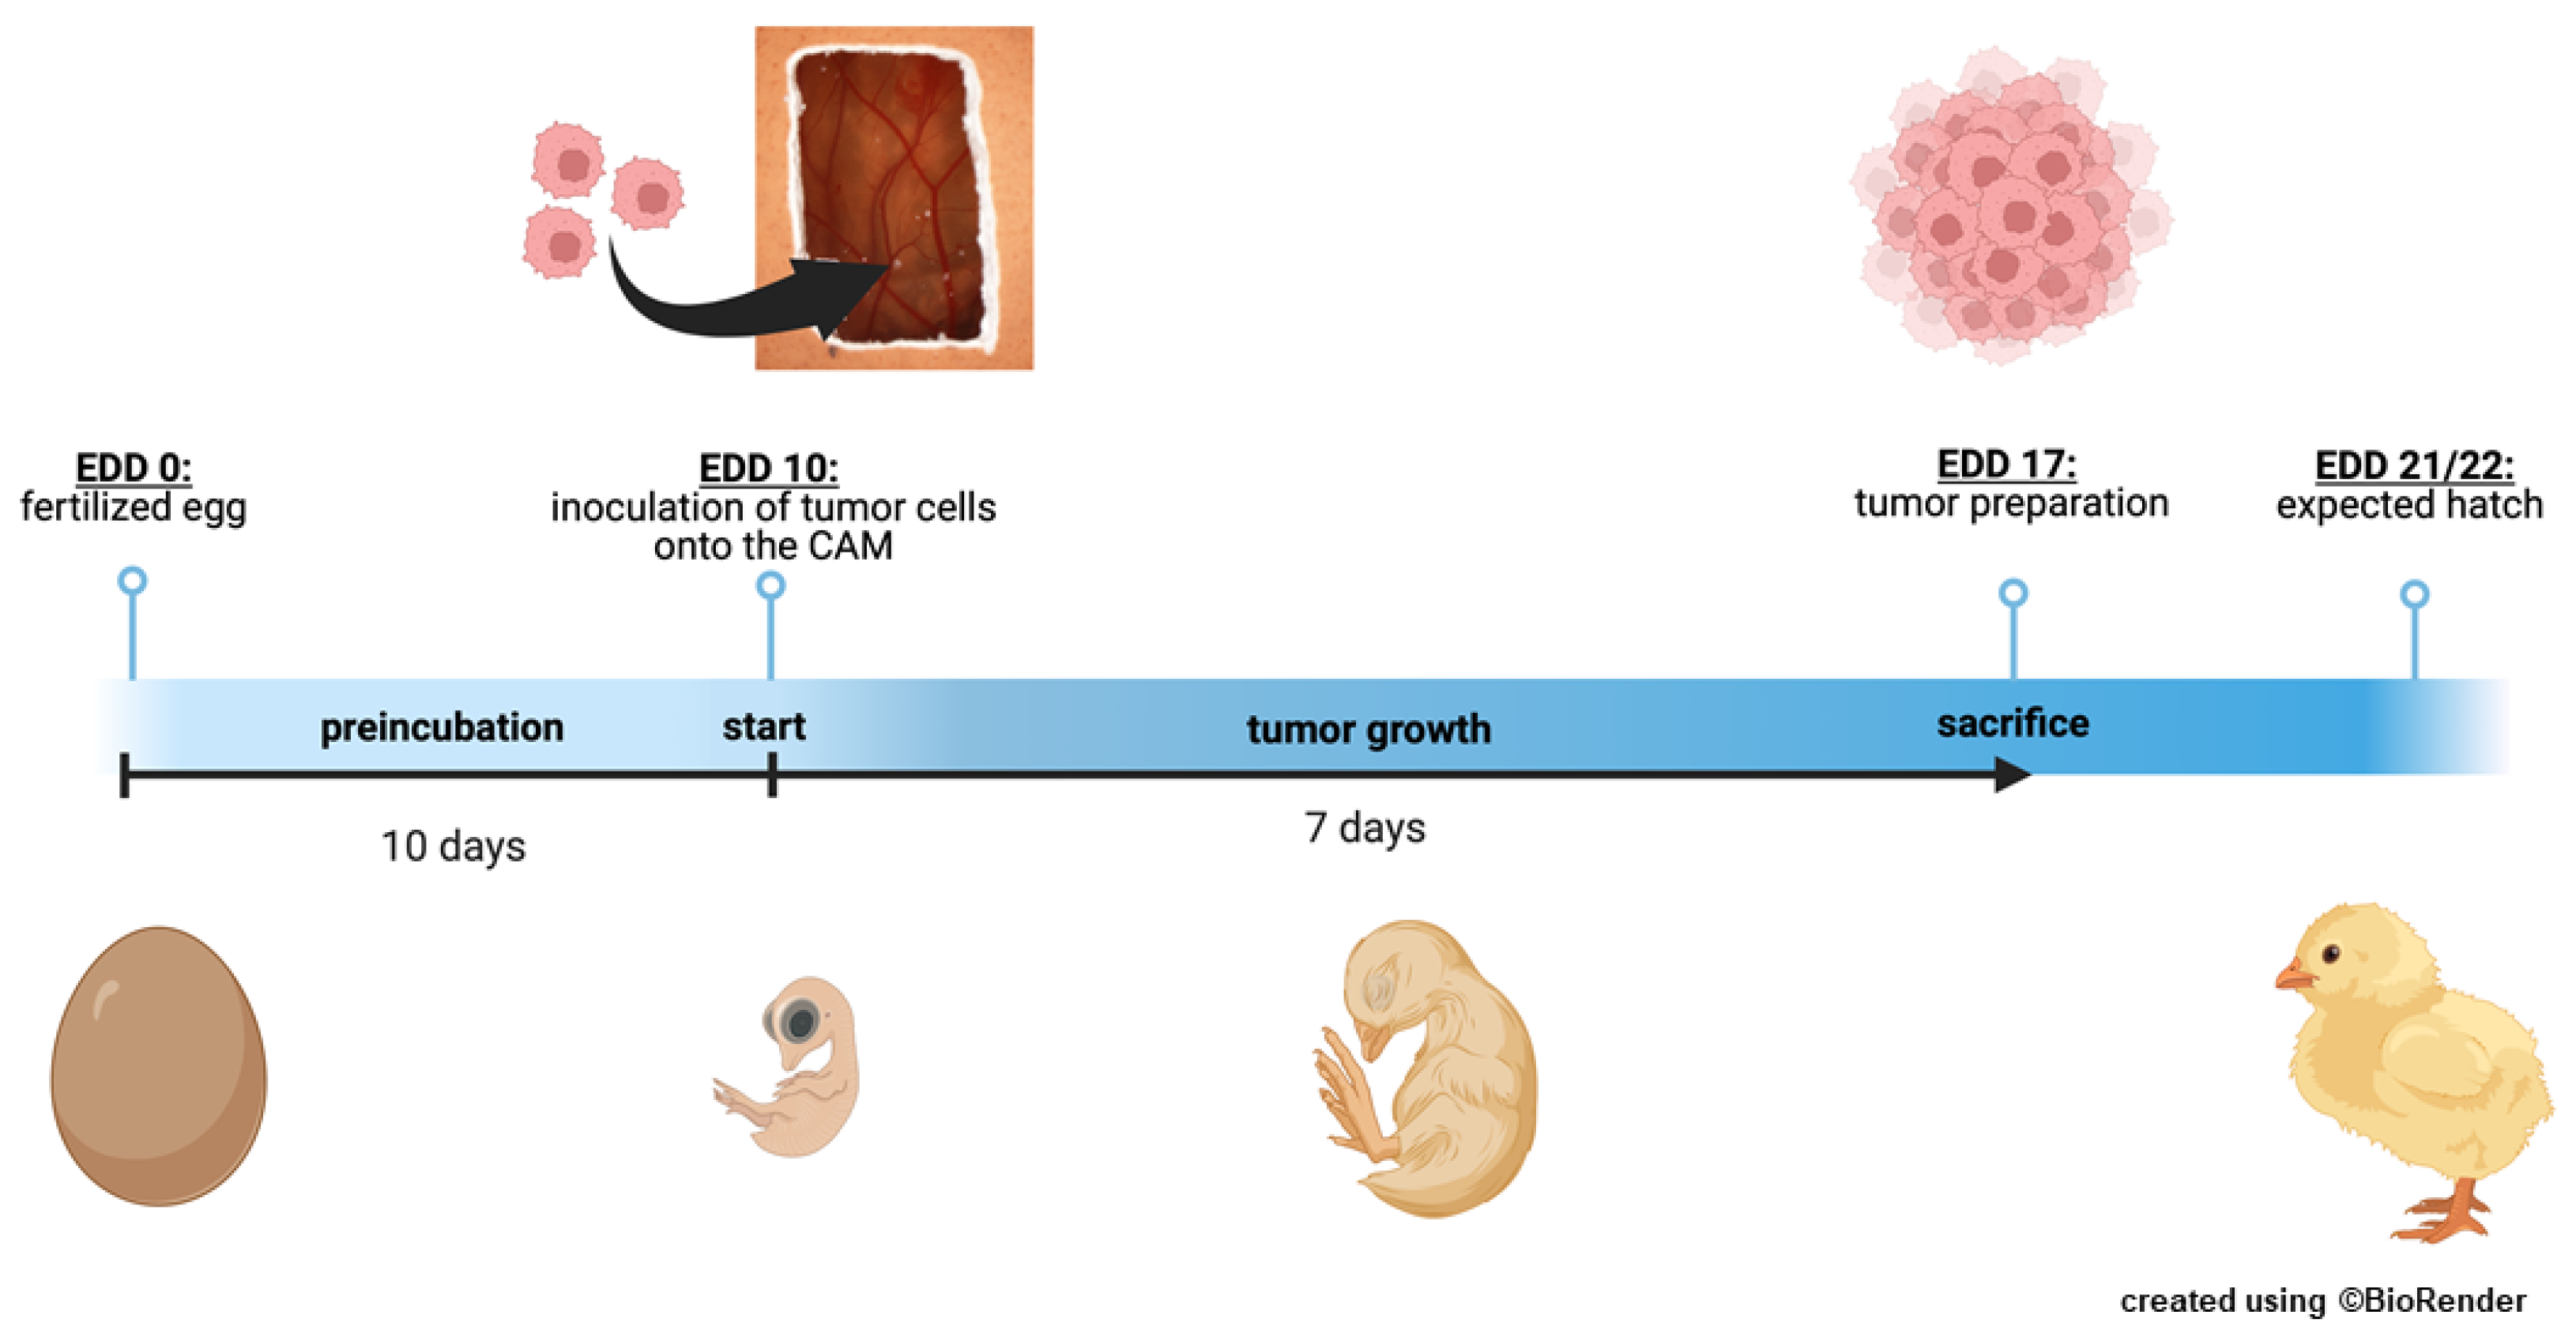
In order to quantify changes in tumor formation capacity, tumor size, and weight of GIPR overexpressing RB cells, 1×10⁶ cells transduced with GIPR or control virus particles were grafted onto the chorioallantoic membrane (CAM) of fertilized chicken eggs as described previously [50] based on the protocol of Zijlstra and Palmer [55,56]. Twenty-five fertilized eggs were grafted in at least three independent experiments. At chick embryonic developmental day (EDD) 17, seven days after grafting of the RB cells at EDD10, tumors were excised, measured, and photographed as described previously [22,57,58].
Figure 1.
Schematic depiction of the chorioallantoic membrane (CAM) assay. Timeline of the in ovo chorioallantoic membrane (CAM) tumor cell graft model. Fertilized chicken eggs were incubated for 10 days. At embryonic development day (EDD) 10, eggs were opened and tumor cells were inoculated onto the CAM. At EDD 17, four days before hatching, the tumors were harvested and analyzed.
2.14. Cancer-Related Protein Expression Profiling
The expression levels of 84 human cancer-related proteins were evaluated in Weri cells transduced with either GIPR or control lentiviral supernatant using the Proteome Profiler Human XL Oncology Array (R&D Systems, Minneapolis, MN, USA). Expression levels were determined in duplicate, using 200 µg of protein following the manufacturer's protocol.
2.15. Statistical Analysis
Statistics were calculated using GraphPad Prism 9. The data presented represent means ± standard error of the mean (SEM) from at least three experiments. Data were analyzed by Student’s t-test and statistical significance was assigned for p-values less than 0.05 (*), 0.01 (**), 0.001 (***), or 0.0001 (****).
Statistical analyses of growth curves were performed using web interface (http://bioinf.wehi.edu.au/software/compareCurves/). This interface allows to compare growth curves from the statmod statistical modeling package, which is available through the "R Project for Statistical Computing" (http://www.r-project.org).
For biological pathway and gene ontology (GO) term analyses on target genes, we used Kyoto encyclopedia of genes and genomes (KEGG) pathway enrichment analysis using the database for annotation, visualization, and integration discovery (DAVID) software [59]. The analysis, based on hypergeometric distribution, utilized a significance threshold of p < 0.05 for the selection of GO terms and pathways.
3. Results
3.1. GIPR and TFF1 are Co-Expressed in Retinoblastoma Tumors
Previous investigations by our group revealed that the G protein coupled receptor (GPCR) GIPR is one of the genes with the highest fold change in expression after TFF1 overexpression in RB cells. First, we verified GIPR upregulation upon successful lentiviral TFF1 overexpression (Figure 2a,c) in the RB cell lines Weri and Y79 on RNA and protein level by Real-Time PCR (Figure 2 b) and Western blot analysis (Figure 2 c).
Next, we investigated GIPR expression levels in retinoblastoma primary tumor tissue and correlated it with TFF1 expression. Real-Time PCR analyses revealed that cultured primary RB patient derived tumor cells, which do not express TFF1 (TFF1 negative; TFF1) displayed similar GIPR levels as the healthy human retina (hRet; Figure 3 a). TFF1 expressing (TFF1 positive; TFF1+) RB tumor cells, by contrast, showed significantly increased GIPR expression compared to TFF1- RB tumor cells and compared to the hRet (Figure 3 a). Formalin fixed, paraffin embedded TFF1- RB patient tumors displayed higher, yet not significantly increased GIPR levels compared to the hRet, whereas TFF1+ tumors showed significantly increased GIPR expression compared to hRet and TFF1-RB tumors (Figure 3 b). Immunohistochemical stains of RB patient tumor sections revealed that TFF1+ tumors are also positive for GIPR, whereas TFF1- tumors also stain negatively for GIPR (Figure 3 c). The co-expression of GIPR and TFF1 in RB patient tumors, which do express TFF1, allowing a potential TFF1 signaling via the GIPR receptor.
3.2. GIPR Overexpression Results in Decreased Cell Viability, Cell Growth and Proliferation as Well as Increased Apoptosis in RB Cell Lines In Vitro
In order to investigate if the decrease in RB cell viability, cell growth, proliferation and tumorigenicity and the increase in apoptosis seen after TFF1 overexpression might be mediated via the GIPR signaling axis, we transduced GIPR in the RB cell lines Weri and Y79, generating stably GIPR overexpressing cells. Successful GIPR overexpression was verified by Real-Time PCR (Figure 4 a), Western blot analysis (Figure 4 b), and immunofluorescence staining (Figure 4 c).
Cell viability was significantly decreased after GIPR overexpression in both RB cell lines investigated as revealed by WST-1 viability assays (Figure 5 a). Accordingly, growth curve analyses showed significantly diminished growth rates of Weri and Y79 GIPR overexpressing cells compared to control cells (Figure 5 b,c) and proliferation levels of both cell lines were also decreased as revealed by BrdU cell counts (Figure 5 d,e). Additionally, a significant increase in caspase-3 dependent apoptosis was seen upon GIPR overexpression in both cell lines as revealed by quantification of immunofluorescent stainings against cleaved caspase-3 (Figure 5 f,g). In summary, the impact of GIPR overexpression mirrors the effects previously seen upon TFF1 overexpression, indicating potential TFF1 signaling via the GIPR axis.
3.3. GIPR Overexpressing RB Cells form Significantly Smaller Tumors In Vivo
Next, we used the chicken chorioallantoic membrane (CAM) assay to examine the impact of GIPR overexpression on RB cell tumor growth and formation capacity in an in vivo model (schematic depiction see Figure 1). Stably GIPR overexpressing Weri and Y79 cells were inoculated onto the CAM of 10-day old chicken embryos. Quantification of CAM tumor weight and size revealed that both GIPR overexpressing RB cell lines investigated form significantly lighter and smaller tumors in ovo than control cells (Figure 6 a, b, d). Compared to controls, the tumor formation capacity was not significantly changed in GIPR overexpressing Weri and Y79 cells (Figure 6 c).
3.4. Impact of Administration of a GIPR Inhibitor and/or Recombinant TFF1 on Cell Viability, Proliferation and Cell Death of GIPR Overexpressing RB Cell Lines
Next, we set out to address the question, if the effects seen after GIPR overexpression are specific and if GIPR might be a receptor for TFF1. For this purpose, we blocked GIPR signaling after its overexpression in two RB cell lines by a specific inhibitor (MK0893) and treated the cells with recombinant TFF1 (rTFF1) alone or in combination with MK0893 and analyzed effects on cell viability, proliferation and apoptosis.
The significant reduction in cell viability and proliferation as well as the induction of apoptosis seen after GIPR overexpression in the retinoblastoma cell lines Weri and Y79 was significantly reversed upon administration of MK0893 (Figure 7 a-f) indicating that the effects seen after GIPR overexpression on RB cells were specific. Treatment of GIPR overexpressing RB cells with rTFF1 did not change cell viability levels, proliferation or apoptosis levels compared to those of untreated GIPR-overexpressing cells (Figure 7 a-f). Thus, no additive or synergistic effect due to the binding of TFF1 to the upregulated GIPR receptor levels in GIPR overexpressing cells could be observed. By contrast, combined treatment with the GIPR inhibitor and rTFF1 resulted in a significant decrease in cell viability and proliferation compared to administration of the GIPR inhibitor alone (Figure 7 a-e), indicating that the effects on cell viability and proliferation induced by TFF1 are independent of GIPR. However, an induction of apoptosis upon treatment with rTFF1 in comparison to an induction of apoptosis by MK0893 alone could not been detected (Figure 7c, e). Although our data revealed that GIPR is not a direct TFF1 receptor, the fact that GIPR is upregulated after TFF1 overexpression and the same effects are induced upon GIPR and TFF1 overexpression indicates that TFF1 and GIPR are involved in the same signaling cascades.
3.5. GIPR Expression in Retinoblastoma Cells and Its Regulation by miR-542-5p
As GIPR has previously been described as a potential target gene of miR-542-5p [60], we analyzed the expression of this miR and GIPR in Weri and Y79 RB cells in comparison to the healthy human retina. Compared to the healthy human retina GIPR expression was significantly increased in both RB cell lines investigated (Figure 8 a), whereas miR-542-5p expression levels were significantly decreased (Figure 8 b). The opposing expression of miR-542-5p and GIPR suggests that GIPR levels in RB cells might be regulated by mir-542-5p. This hypothesis was supported by the observation that GIPR expression significantly decreased (Figure 8 d) upon transient mir-542-5p overexpression (Figure 8 c) in Weri and Y79 cells.
Target scans predicted a potential binding site for miR-542-5p within the 3′-UTR region of the GIPR gene (Figure 9 a). Luciferase activity assays were performed to assess the binding of miR-542-5p to the GIPR 3′-UTR region. Our binding study revealed that miR-542-5p binds to the wild-type binding site of GIPR in the 3′-UTR detected by significantly reduced luciferase activity (Figure 9 b). As a control for the binding specificity we mutated the GIPR binding site (Figure 9 a) and measured the binding of miR-542-5p. In this setting, luciferase activity remained unchanged compared to binding of the empty vector control (Figure 9 b), indicating that miR-542-5p has the capability to specifically bind to and regulate GIPR expression in RB cell lines.
3.6. GIPR Downstream Signaling Targets
To gain a deeper insight into GIPR downstream signaling in RB cells, cancer-associated proteins were analyzed in a human oncology array. Following GIPR overexpression 9 out of 84 proteins were differentially regulated in Weri RB cells: BCLXL, enolase 2, ErbB2, FGFb, p27/Kip1, p53 and survivin were upregulated, whereas MMP3 was downregulated compared to controls (Figure 10).
Differential expression of these proteins was confirmed at mRNA level via Real-Time PCR (Suppl. Figure 1). In Y79 cells no significant regulation of the before mentioned proteins was seen on protein level (data not shown). On mRNA level, by contrast, all proteins up-regulated in Weri cells were likewise up-regulated, however, levels did not reach significance (Suppl. Figure 1)
DAVID analyses of all proteins differentially expressed in Weri cells revealed 10 significantly enriched GO terms (Table S1) and 18 KEGG pathways with at least 3 counts and p<0.05 (Table S2). Most of the GO terms were related to "apoptosis", "proliferation", “cell migration”, “cell cycle” and "angiogenesis”, processes playing an important role in cancer and shown to be effected by GIPR overexpression in RB cells. Nine out of the 18 identified KEGG pathways were associated with cancer.
4. Discussion
We previously discovered that TFF1 overexpression in RB leads to anti-tumorigenic effects suggesting a potential tumor suppressor role of TFF1 in this tumor entity [22,23]. Upon TFF1 overexpression, we found GIPR to be one of the highest differentially regulated genes and hypothesized that TFF1 effects on cell viability, growth, proliferation, apoptosis and tumorigenicity of RB cells might be mediated via the GIPR signaling axis and GIPR might as well be a receptor for TFF1. Most recently, TFF1 was also identified as a RB biomarker for a subset of more advanced RBs [7,23,24], being detectable in the aqueous humor of RB patients [25,26]. At first glance, a potential tumor suppressor function of TFF1 and elevated expression levels in more advanced, higher metastasizing RB tumors seems to be conflicting. However, the two facts are not necessarily contradictory, as various mechanisms potentially upregulate a tumor suppressor in advanced tumors. Possible scenarios are e.g. cellular stress response to hypoxia and high reactive oxygen species (ROS) levels, frequently observed in more advanced tumor stages, or activation of the immune system by inflammation, a key player in cancerogenesis. Fittingly, an ectopic expression of TFF1 during chronic inflammation processes and a role of TFF1 as ROS scavenger was previously described for various tissues (for review see: [18]). In addition, genetic alterations including mutations or altered epigenetic regulations are potential mechanisms explaining the discrepancy described above. Along this line, we could show that TFF1 is epigenetically regulated in RB [61] and others observed a correlation between cancer progression and mutations/polymorphisms in the TFF1 gene [62,63,64,65,66]. To gain a deeper understanding of the molecular mechanisms underlying the dual tumor suppressor and biomarker function of TFF1 it is important to gain a deeper insight in its signaling pathways.
Thus, we investigated the general function of GIPR signaling in RB and its correlation with TFF1. In the study presented, we observed significantly elevated GIPR levels in Weri and Y79 RB cells compared to the healthy human retina. In a pathological context, human and rat medullary thyroid cancers display high GIPR expression levels compared to normal tissue and a massive overexpression of GIPR was described for neoplastic C cells of both, rats and human [41]. Besides, GIPR is significantly overexpressed in various neuroendocrine tumors (NETs) compared to normal tissue [67,68]. Particularly pancreatic, illeal, and bronchial NETs display a very high GIPR expression [39]. Besides, while TFF1 negative RB tumor cells displayed similar GIPR levels as the healthy human retina, significantly increased GIPR expression levels were detected in TFF1 positive primary tumor cells, representing the subset of more advanced RBs with TFF1 as indicating biomarker [7,24]. Additionally, we verified upregulation of GIPR levels upon TFF1 overexpression in Weri and Y79 cells on RNA and protein level, indicating a possible functional correlation of both proteins. In neuroendocrine neoplasms (NENs) high GIPR expression likewise correlates with high tumor grade. In these tumor entities, GIPR levels gradually increased in a subset of insulinomas and non-functioning pancreatic NENs [40]. Besides, increased GIPR expression was correlated with liver metastasis [69]. Further along this line, Costa et al. observed significantly higher GIPR mRNA levels in malignant adrenocortical carcinomas than in benignant adenomas of both, pediatric and adult patients [70]. Moreover, the presence of GIPR was demonstrated in advanced colorectal cancer (CRC) and MC-26 and HT29 cells, two CRC cell lines [43]. Interestingly, neither epithelial and stromal gastrointestinal (GI) tumors and GI stromal tumors nor lung adenocarcinomas express the GIPR except for a subgroup of pancreatic adenocarcinomas [39]. Our data support the hypothesis that TFF1 and GIPR, both expressed in higher grade RB tumors, may be involved in the same signaling pathways.
To further study the functional role of GIPR in RB we overexpressed GIPR in Weri and Y79 retinoblastoma cells. Increased GIPR expression resulted in significantly reduced cell viability, cell growth, proliferation and significantly smaller tumors were formed in in vivo CAM assays as well as significantly increased caspase-3 dependent cell death levels in vitro mirroring the effects previously seen after TFF1 overexpression [22] and indicating a role as a tumor suppressor. In previous studies, GIPR signaling has instead mainly been linked to the survival of pancreatic ß-cells [45]. Contrasting our findings, Campbell et al. demonstrated that pancreatic ß-cells from Gipr-/-ßCell mice with a selective ablation of GIPR display significantly higher sensitivity to apoptosis [45]. Further along this line, in vitro studies in ß-insulin (INS) cells showed that GIP stimulation protects these cells against streptozotocin induced apoptosis [46]. Besides, GIP promotes ß-(INS) cell survival [47] and stimulates the proliferation of MC-26 and HT29 CRC cells expressing the GIPR [43], contradicting the findings of our study, where high GIPR levels after GIPR overexpression reduces cell viability and growth. This discrepancy might be explained in terms of comparing the effects of metabolic signaling along the GIP/GIPR axis with pathological conditions of a cancer cell line. Or the effects might be tissue dependent, as very high GIPR levels in neuroendrocrine tumors have been observed to either increase or decrease raised proliferation levels, depending on the tumor site [39,40].
Next, we set out to investigate how GIPR expression is regulated in RB tumor cells. In non-small cell lung cancer (NSCLC), GIPR has been described as one of 457 potential target genes of miR-542-5p [60]. Besides, it has been shown that pristimerin, a natural occurring quinone methide triterpenoid with anticancer effects, inhibits glioblastoma progression by targeting two receptors, the protein tyrosine phosphatase, non-receptor type 1 (PTPN1) and Argonaute 2 (AGO2) via miR-542-5p [71]. Target scans confirmed GIPR as a potential target of this miR, but it had not been experimentally proven so far. In the study presented, we observed an opposing expression pattern of miR-542-5p and GIPR expression, with GIPR expression being significantly higher in Weri and Y79 RB cells and miR-542-5p levels being significantly lower compared to the healthy human retina. Upon miR-542-5p overexpression, GIPR significantly decreased, suggesting that miR-542-5p plays a role in regulating GIPR expression in RB cells. To further address this hypothesis, we performed luciferase binding studies and were able to proof direct binding of miR-542-5p to the 3`-UTR of the GIPR gene. Thus, GIPR expression in RB cells is most likely at least partially regulated by miR-542-5p.
A TFF receptor has been unknown for a long time, until in 2009 the chemokine receptor type 4 (CXCR4), which belongs to the G protein-coupled receptor family (GPCR), was described as a low affinity receptor for TFF2 [30]. Besides, Dieckow et al. could show that CXCR4 and CXCR7 are involved in TFF3 dependent activation of cell migration [31]. Therefore, GPCRs like GIPR, involved in various diseases and consequently targets of over 40% of drugs currently on the market [72,73], are potential mediators in TFF signaling. To address the question, if GIPR is involved in TFF1 signaling as a direct TFF1 receptor, in the study presented, we performed GIPR inhibitor experiments and stimulated the cells with recombinant TFF1 (rTFF1). We could show that the effects of GIPR overexpression are specific, since the reduction in cell viability seen in GIPR overexpressing cells was reversed upon administration of the GIPR inhibitor. However, reduced cell viability of GIPR overexpressing cells induced by rTFF1 could not be reversed by inhibiting GIPR, indicating that this effect is not GIPR dependent and thus, GIPR is most likely no direct TFF1 receptor.
Subsequently, we investigated downstream targets of GIPR signaling in RB cells via human oncology array, revealing p53 as one of the upregulated proteins in Weri and Y79 RB cells. The tumor suppressor gene TP53 is e.g. involved in the regulation of cell cycle arrest and apoptosis [74,75,76]. Our group already demonstrated that TFF1 induces apoptosis and decreases proliferation and tumor growth of human retinoblastoma cell lines in a p53-dependent manner [22]. Thus, upregulated p53 levels following GIPR overexpression would support the hypothesis that TFF1 effects are mediated via GIPR signaling. Since it has been shown that p53 induces cell death via transcriptional activation of the pro-apoptotic protein Bax [77] or direct binding to Bcl2 and BclXL [78], we also investigated the expression of these proteins. In Western Blot analyses we did not observe any significant changes in protein expression levels of Bax and Bcl2 following GIPR overexpression in Weri and Y79 cells (data not shown). BclXL on the hand was found to be upregulated by GIPR overexpression in Weri and Y79 cells. In our setting, increased levels of the anti-apoptotic protein BclxL at a first glance do not correlate with increased apoptosis levels following GIPR overexpression in RB cells. However, since p53 was also upregulated after GIPR overexpression, a possible scenario fitting our effects could be a direct induction of mitochondrial outer-membrane permeabilization (MOMP) via interaction with anti-apoptotic BclxL, which in turn leads to caspase dependent apoptosis [78]. This would confirm our previously shown results, that TFF1 induces apoptosis of human RB cell lines in a caspase-dependent manner [22]. Fittingly, in the study presented the increase in apoptosis seen after GIPR overexpression in RB tumor cells was likewise caspase-3-dependent. In addition, it has been demonstrated that GIP-mediated suppression of apoptosis in a pancreatic ß-insulin cell line is caspase-3-dependent [42,46]. Besides, “regulation of apoptosis” was a significantly enriched GO-term in GIPR overexpressing Weri RB cells and “apoptosis” one of the enriched KEGG pathways.
In conjunction with apoptosis regulation, we found survivin, an anti-apoptotic family member of the inhibitor of apoptosis proteins (IAPs; for review see [79]), to be upregulated in GIPR overexpressing Weri cells. Survivin is overexpressed in various tumor entities and its overexpression frequently correlates with cancer progression and recurrence [79]. Increased levels of survivin do, however, not correlate with increased apoptosis levels and reduced tumorigenicity following GIPR overexpression in Weri RB cells. These discrepancies might be explained in terms of counter-regulatory mechanisms induced by the pro-apoptotic effects seen after GIPR overexpression.
In the study presented, fibroblast growth factor 2 (FGF2/FGFb) was likewise upregulated upon GIPR overexpression in RB cells. FGFs are known as key factors in tissue homeostasis and cancer. FGFb regulates self-renewal of multiple stem-cell types and plays a pivotal role in brain tumors, particularly malignant glioma [80]. Downstream signaling involves the FGF receptor family, PI3K/AKT, and RAS/RAF/MAPK, which also exert pro-proliferative and anti-apoptotic effects during metabolic signaling along the GIP/GIPR axis [42,43,44,81]. Therefore, we analyzed the phosphorylation status of Akt and the MAP kinase ERK1/2 after GIPR overexpression in Weri and Y79 RB cells, however, observed no obvious changes in phosphorylation (data not shown). In line with these findings, in medullary thyroid cancer cells effects of a GIPR receptor stimulation on the downstream PI3K-Akt and MAPK-ERK1/2 signaling axis were likewise only marginal [34]. How upregulated FGFb expression fits into the signaling pathways and GIPR mediated effects seen in RB cells remains to be further investigated.
In summary, we identified GIPR as a potential key player involved in TFF1 signaling triggering tumor suppressing effects in RB, most likely with the involvement of miR-542-5p and p53 as up- and downstream mediators.
5. Conclusions
In the study presented, stable overexpression of the G protein coupled transmembrane receptor GIPR, shown to be upregulated following overexpression of TFF1, resulted in significantly increased apoptosis levels and a concomitant decrease in cell viability, growth, and proliferation in vitro as well as tumor growth in vivo, suggesting a tumor suppressor role of GIPR in RB. Although our data indicate that GIPR is not a receptor for TFF1, TFF1 and GIPR seem to be involved in the same signaling cascades and up- and downstream signaling mediators like miR-542-5p and p53 are potential new targets for novel retinoblastoma treatment approaches.
Supplementary Materials
The following supporting information can be downloaded at: Preprints.org, Figure S1: Verification of human oncology array data via Real-Time PCR. Table S1: Significantly enriched GO-terms of genes differentially expressed after GIPR overexpression in Weri RB cells Table S2. Significantly enriched KEGG-pathways of genes differentially expressed after GIPR overexpression in Weri RB cells.
Author Contributions
Conceptualization, MAB and ND; methodology, AH and MAB; validation, MAB and AH; formal analysis, AH; investigation, AH, EA, FY, DVM; data curation, AH and MAB; writing—original draft preparation, ND, MAB and AH; writing—review and editing, ND and MAB; visualization, AH; supervision, MAB and ND; project administration, ND and MAB. All authors have read and agreed to the published version of the manuscript.
Funding
This research received no external funding.
Institutional Review Board Statement
The study was conducted according to the guidelines of the Declaration of Helsinki and approval for the use of human retinal tissue (approval no. 06-30214) and RB samples (approval no. 14-5836-BO) was granted by the Ethics Committee of the Medical Faculty at the University Hospital Essen of the University of Duisburg-Essen.
Informed Consent Statement
Informed consent was obtained from all subjects involved in the study.
Data Availability Statement
The data presented in this study are available on request from the corresponding author.
Acknowledgments
The authors would like to thank the Institute for Pathology and Dr. E. Biewald for their valuable support as well as A. Bollmeier, A. Doege and D. Gioé for their excellent technical assistance. We acknowledge support by the Open Access Publication Fund of the University of Duisburg-Essen.
Conflicts of Interest
The authors declare no conflict of interest.
References
- Byroju, V.V.; Nadukkandy, A.S.; Cordani, M.; Kumar, L.D. Retinoblastoma: present scenario and future challenges. Cell Communication and Signaling 2023, 21, 226. [Google Scholar] [CrossRef] [PubMed]
- Bouchoucha, Y.; Matet, A.; Berger, A.; Carcaboso, A.M.; Gerrish, A.; Moll, A.; Jenkinson, H.; Ketteler, P.; Dorsman, J.C.; Chantada, G.; et al. Retinoblastoma: From genes to patient care. Eur. J. Med. Genet. 2023, 66, 104674. [Google Scholar] [CrossRef] [PubMed]
- Bornfeld, N.; Lohmann, D.; Bechrakis, N.E.; Biewald, E. [Retinoblastoma]. Der Ophthalmologe 2020, 117, 389–402. [Google Scholar] [CrossRef] [PubMed]
- Roy, S.; Kaliki, S. Retinoblastoma: A Major Review. Mymensingh medical journal : MMJ 2021, 30, 881–895. [Google Scholar] [PubMed]
- Dimaras, H.; Corson, T.W. Retinoblastoma, the visible CNS tumor: A review. Journal of Neuroscience Research 2019, 97, 29–44. [Google Scholar] [CrossRef] [PubMed]
- Rathore, S.; Verma, A.; Ratna, R.; Marwa, N.; Ghiya, Y.; Honavar, S.G.; Tiwari, A.; Das, S.; Varshney, A. Retinoblastoma: A review of the molecular basis of tumor development and its clinical correlation in shaping future targeted treatment strategies. Indian Journal of Ophthalmology 2023, 71, 2662. [Google Scholar] [CrossRef] [PubMed]
- Liu, J.; Ottaviani, D.; Sefta, M.; Desbrousses, C.; Chapeaublanc, E.; Aschero, R.; Sirab, N.; Lubieniecki, F.; Lamas, G.; Tonon, L.; et al. A high-risk retinoblastoma subtype with stemness features, dedifferentiated cone states and neuronal/ganglion cell gene expression. Nature Communications 2021, 12, 5578. [Google Scholar] [CrossRef] [PubMed]
- Chronopoulos, A.; Babst, N.; Schiemenz, C.; Schutz, J.S.; Heindl, L.M.; Ranjbar, M.; Kakkassery, V. A Narrative Review - Therapy Options and Therapy Failure in Retinoblastoma. Neurosignals 2022, 30, 39–58. [Google Scholar]
- Shields, C.L.; Bas, Z.; Laiton, A.; Silva, A.M.V.; Sheikh, A.; Lally, S.E.; Shields, J.A. Retinoblastoma: emerging concepts in genetics, global disease burden, chemotherapy outcomes, and psychological impact. Eye 2023, 37, 815–822. [Google Scholar] [CrossRef]
- Kaewkhaw, R.; Rojanaporn, D. Retinoblastoma: Etiology, Modeling, and Treatment. Cancers 2020, 12, 2304. [Google Scholar] [CrossRef]
- Munier, F.L.; Beck-Popovic, M.; Chantada, G.L.; Cobrinik, D.; Kivelä, T.T.; Lohmann, D.; Maeder, P.; Moll, A.C.; Carcaboso, A.M.; Moulin, A.; et al. Conservative management of retinoblastoma: Challenging orthodoxy without compromising the state of metastatic grace. “Alive, with good vision and no comorbidity”. Progress in Retinal and Eye Research 2019, 73, 100764. [Google Scholar] [CrossRef]
- Manjandavida, F.P.; Shields, C.L. The role of intravitreal chemotherapy for retinoblastoma. Indian Journal of Ophthalmology 2015, 63, 141–145. [Google Scholar] [CrossRef] [PubMed]
- Francis, J.H.; Abramson, D.H.; Ji, X.; Shields, C.L.; Teixeira, L.F.; Schefler, A.C.; Cassoux, N.; Hadjistilianou, D.; Berry, J.L.; Frenkel, S.; et al. Risk of Extraocular Extension in Eyes With Retinoblastoma Receiving Intravitreous Chemotherapy. JAMA Ophthalmology 2017, 135, 1426. [Google Scholar] [CrossRef]
- Shields, C.L.; Manjandavida, F.P.; Arepalli, S.; Kaliki, S.; Lally, S.E.; Shields, J.A. Intravitreal Melphalan for Persistent or Recurrent Retinoblastoma Vitreous Seeds: Preliminary Results. JAMA Ophthalmology 2014, 132, 319. [Google Scholar] [CrossRef] [PubMed]
- Shields, C.L.; Douglass, A.M.; Beggache, M.; Say, E.A.T.; Shields, J.A. INTRAVITREOUS CHEMOTHERAPY FOR ACTIVE VITREOUS SEEDING FROM RETINOBLASTOMA. Retina 2016, 36, 1184–1190. [Google Scholar] [CrossRef] [PubMed]
- Temming, P.; Arendt, M.; Viehmann, A.; Eisele, L.; Le Guin, C.H.D.; Schündeln, M.M.; Biewald, E.; Astrahantseff, K.; Wieland, R.; Bornfeld, N.; et al. Incidence of second cancers after radiotherapy and systemic chemotherapy in heritable retinoblastoma survivors: A report from the German reference center. Pediatric Blood & Cancer 2017, 64, 71–80. [Google Scholar] [CrossRef]
- Zhang, M.G.; Kuznetsoff, J.N.; Owens, D.A.; Gallo, R.A.; Kalahasty, K.; Cruz, A.M.; Kurtenbach, S.; Correa, Z.M.; Pelaez, D.; Harbour, J.W. Early Mechanisms of Chemoresistance in Retinoblastoma. Cancers 2022, 14, 4966. [Google Scholar] [CrossRef] [PubMed]
- Hoffmann, W. Trefoil Factor Family (TFF) Peptides and Their Links to Inflammation: A Re-evaluation and New Medical Perspectives. International Journal of Molecular Sciences 2021, 22, 4909. [Google Scholar] [CrossRef]
- Hoffmann, W. Trefoil Factor Family (TFF) Peptides and Their Diverse Molecular Functions in Mucus Barrier Protection and More: Changing the Paradigm. International Journal of Molecular Sciences 2020, 21, 4535. [Google Scholar] [CrossRef]
- Jahan, R.; Shah, A.; Kisling, S.G.; Macha, M.A.; Thayer, S.; Batra, S.K.; Kaur, S. Odyssey of trefoil factors in cancer: Diagnostic and therapeutic implications. Biochimica et Biophysica Acta (BBA) - Reviews on Cancer 2020, 1873, 188362. [Google Scholar] [CrossRef]
- Busch, M.; Dünker, N. Trefoil factor family peptides – friends or foes? Biomolecular Concepts 2015, 6, 343–359. [Google Scholar] [CrossRef] [PubMed]
- Busch, M.; Große-Kreul, J.; Wirtz, J.J.; Beier, M.; Stephan, H.; Royer-Pokora, B.; Metz, K.; Dünker, N. Reduction of the tumorigenic potential of human retinoblastoma cell lines by TFF1 overexpression involves p53/caspase signaling and miR-18a regulation. International Journal of Cancer 2017, 141, 549–560. [Google Scholar] [CrossRef] [PubMed]
- Busch, M.; Metz, K.; Beier, M.; Biewald, E.; Dünker, N. TREFOIL FACTOR FAMILY 1 EXPRESSION CORRELATES WITH CLINICAL OUTCOME IN PATIENTS WITH RETINOBLASTOMA. Retina 2018, 38, 2422. [Google Scholar] [CrossRef] [PubMed]
- Aschero, R.; Ganiewich, D.; Lamas, G.; Restrepo-Perdomo, C.A.; Ottaviani, D.; Zugbi, S.; Camarero, S.; Néspoli, E.; Vilanova, M.C.; Perez-Jaume, S.; et al. Immunohistochemical expression of TFF1 is a marker of poor prognosis in retinoblastoma. Pediatric Blood & Cancer 2024, 71, e30717. [Google Scholar] [CrossRef]
- Busch, M.A.; Haase, A.; Miroschnikov, N.; Doege, A.; Biewald, E.; Bechrakis, N.E.; Beier, M.; Kanber, D.; Lohmann, D.; Metz, K.; et al. TFF1 in Aqueous Humor—A Potential New Biomarker for Retinoblastoma. Cancers 2022, 14, 677. [Google Scholar] [CrossRef] [PubMed]
- Busch, M.A.; Haase, A.; Alefeld, E.; Biewald, E.; Jabbarli, L.; Dünker, N. Trefoil Family Factor Peptide 1—A New Biomarker in Liquid Biopsies of Retinoblastoma under Therapy. Cancers 2023, 15, 4828. [Google Scholar] [CrossRef]
- Yamada, Y.; Hayami, T.; Nakamura, K.; Kaisaki, P.J.; Someya, Y.; Wang, C.-Z.; Seino, S.; Seino, Y. Human Gastric Inhibitory Polypeptide Receptor: Cloning of the Gene (GIPR) and cDNA. Genomics 1995, 29, 773–776. [Google Scholar] [CrossRef]
- Gremlich, S.; Porret, A.; Hani, E.H.; Cherif, D.; Vionnet, N.; Froguel, P.; Thorens, B. Cloning, functional expression, and chromosomal localization of the human pancreatic islet glucose-dependent insulinotropic polypeptide receptor. Diabetes 1995, 44, 1202–1208. [Google Scholar] [CrossRef] [PubMed]
- Volz, A.; Göke, R.; Lankat-Buttgereit, B.; Fehmann, H.-C.; Bode, H.P.; Göke, B. Molecular cloning, functional expression, and signal transduction of the GIP-receptor cloned from a human insulinoma. FEBS Letters 1995, 373, 23–29. [Google Scholar] [CrossRef]
- Dubeykovskaya, Z.; Dubeykovskiy, A.; Solal-Cohen, J.; Wang, T.C. Secreted Trefoil Factor 2 Activates the CXCR4 Receptor in Epithelial and Lymphocytic Cancer Cell Lines *. Journal of Biological Chemistry 2009, 284, 3650–3662. [Google Scholar] [CrossRef]
- Dieckow, J.; Brandt, W.; Hattermann, K.; Schob, S.; Schulze, U.; Mentlein, R.; Ackermann, P.; Sel, S.; Paulsen, F.P. CXCR4 and CXCR7 Mediate TFF3-Induced Cell Migration Independently From the ERK1/2 Signaling Pathway. Investigative Ophthalmology & Visual Science 2016, 57, 56. [Google Scholar] [CrossRef]
- Dupre, J.; Ross, S.A.; Watson, D.; Brown, J.C. STIMULATION OF INSULIN SECRETION BY GASTRIC INHIBITORY POLYPEPTIDE IN MAN. ^1. The Journal of Clinical Endocrinology & Metabolism 1973, 37, 826–828. [Google Scholar] [CrossRef]
- Regazzo, D.; Barbot, M.; Scaroni, C.; Albiger, N.; Occhi, G. The pathogenic role of the GIP/GIPR axis in human endocrine tumors: emerging clinical mechanisms beyond diabetes. Reviews in Endocrine and Metabolic Disorders 2020, 21, 165–183. [Google Scholar] [CrossRef] [PubMed]
- Regazzo, D.; Bertazza, L.; Galletta, E.; Barollo, S.; Mondin, A.; Zovato, S.; Iacobone, M.; Zilio, E.; Scaroni, C.; Radu, C.M.; et al. The GIP/GIPR axis in medullary thyroid cancer: clinical and molecular findings. Endocrine-Related Cancer 2022, 29, 273–284. [Google Scholar] [CrossRef]
- Usdin, T.B.; Mezey, V.; Button, C.; Brownstein, J.; Bonner, T.I. Gastric Inhibitory Polypeptide Receptor, a Member of the Secretin-Vasoactive Intestinal Peptide Receptor Family, Is Widely Distributed in Peripheral Organs and the Brain.
- Singh, A.N.; Basu, D.; Skoblenick, K.J.; Castellano, J.M.; Pontoriero, G.; Thomas, N. MAPPING OF HUMAN BRAIN FOR GLUCOSE-DEPENDENT INSULINOTROPIC POLYPEPTIDE (GIP) AND GIP RECEPTORS EXPRESSION: IMPLICATIONS IN SCHIZOPHRENIA. Schizophrenia Research 2010, 2-3, 528. [Google Scholar] [CrossRef]
- Verma, M.K.; Goel, R.; Krishnadas, N.; Nemmani, K.V.S. Targeting glucose-dependent insulinotropic polypeptide receptor for neurodegenerative disorders. Expert Opinion on Therapeutic Targets 2018, 22, 615–628. [Google Scholar] [CrossRef]
- Samms, R.J.; Sloop, K.W.; Gribble, F.M.; Reimann, F.; Adriaenssens, A.E. GIPR Function in the Central Nervous System: Implications and Novel Perspectives for GIP-Based Therapies in Treating Metabolic Disorders. Diabetes 2021, 70, 1938–1944. [Google Scholar] [CrossRef]
- Waser, B.; Rehmann, R.; Sanchez, C.; Fourmy, D.; Reubi, J.C. Glucose-Dependent Insulinotropic Polypeptide Receptors in Most Gastroenteropancreatic and Bronchial Neuroendocrine Tumors. The Journal of Clinical Endocrinology & Metabolism 2012, 97, 482–488. [Google Scholar] [CrossRef]
- Körner, M.; Waser, B.; Reubi, J.C. Does Somatostatin or Gastric Inhibitory Peptide Receptor Expression Correlate with Tumor Grade and Stage in Gut Neuroendocrine Tumors? Neuroendocrinology 2015, 101, 45–57. [Google Scholar] [CrossRef]
- Waser, B.; Beetschen, K.; Pellegata, N.S.; Reubi, J.C. Incretin Receptors in Non-Neoplastic and Neoplastic Thyroid C Cells in Rodents and Humans: Relevance for Incretin-Based Diabetes Therapy. Neuroendocrinology 2011, 94, 291–301. [Google Scholar] [CrossRef]
- Widenmaier, S.B.; Ao, Z.; Kim, S.-J.; Warnock, G.; McIntosh, C.H. Suppression of p38 MAPK and JNK via Akt-mediated Inhibition of Apoptosis Signal-regulating Kinase 1 Constitutes a Core Component of the β-Cell Pro-survival Effects of Glucose-dependent Insulinotropic Polypeptide. Journal of Biological Chemistry 2009, 284, 30372–30382. [Google Scholar] [CrossRef] [PubMed]
- Prabakaran, D.; Wang, B.; Feuerstein, J.D.; Sinclair, J.A.; Bijpuria, P.; Jepeal, L.I.; Wolfe, M.M. Glucose-dependent insulinotropic polypeptide stimulates the proliferation of colorectal cancer cells. Regulatory Peptides 2010, 163, 74–80. [Google Scholar] [CrossRef] [PubMed]
- Yabe, D.; Seino, Y. Two incretin hormones GLP-1 and GIP: Comparison of their actions in insulin secretion and β cell preservation. Progress in Biophysics and Molecular Biology 2011, 107, 248–256. [Google Scholar] [CrossRef] [PubMed]
- Campbell, J.E.; Drucker, D.J. Islet α cells and glucagon—critical regulators of energy homeostasis. Nature Reviews Endocrinology 2015, 11, 329–338. [Google Scholar] [CrossRef]
- Pospisilik, J.A.; Martin, J.; Doty, T.; Ehses, J.A.; Pamir, N.; Lynn, F.C.; Piteau, S.; Demuth, H.-U.; McIntosh, C.H.S.; Pederson, R.A. -Cell Survival and Islet Neogenesis in 2003, 52.
- Ehses, J.A.; Casilla, V.R.; Doty, T.; Pospisilik, J.A.; Winter, K.D.; Demuth, H.-U.; Pederson, R.A.; McIntosh, C.H.S. Glucose-Dependent Insulinotropic Polypeptide Promotes β-(INS-1) Cell Survival via Cyclic Adenosine Monophosphate-Mediated Caspase-3 Inhibition and Regulation of p38 Mitogen-Activated Protein Kinase. Endocrinology 2003, 144, 4433–4445. [Google Scholar] [CrossRef] [PubMed]
- McFall, R.C.; Sery, T.W.; Makadon, M. Characterization of a New Continuous Cell Line Derived from a Human Retinoblastoma1. Cancer Research 1977, 37, 1003–1010. [Google Scholar]
- Reid, T.W.; Albert, D.M.; Rabson, A.S.; Russell, P.; Craft, J.; Chu, E.W.; Tralka, T.S.; Wilcox, J.L. Characteristics of an Established Cell Line of Retinoblastoma2. JNCI: Journal of the National Cancer Institute 1974, 53, 347–360. [Google Scholar] [CrossRef]
- Busch, M.; Philippeit, C.; Weise, A.; Dünker, N. Re-characterization of established human retinoblastoma cell lines. Histochemistry and Cell Biology 2015, 143, 325–338. [Google Scholar] [CrossRef]
- Campeau, E.; Ruhl, V.E.; Rodier, F.; Smith, C.L.; Rahmberg, B.L.; Fuss, J.O.; Campisi, J.; Yaswen, P.; Cooper, P.K.; Kaufman, P.D. A Versatile Viral System for Expression and Depletion of Proteins in Mammalian Cells. PLOS ONE 2009, 4, e6529. [Google Scholar] [CrossRef]
- Imig, J.; Motsch, N.; Zhu, J.Y.; Barth, S.; Okoniewski, M.; Reineke, T.; Tinguely, M.; Faggioni, A.; Trivedi, P.; Meister, G.; et al. microRNA profiling in Epstein–Barr virus-associated B-cell lymphoma. Nucleic Acids Research 2011, 39, 1880–1893. [Google Scholar] [CrossRef]
- Pietschmann, T.; Heinkelein, M.; Heldmann, M.; Zentgraf, H.; Rethwilm, A.; Lindemann, D. Foamy Virus Capsids Require the Cognate Envelope Protein for Particle Export. Journal of Virology 1999, 73, 2613–2621. [Google Scholar] [CrossRef] [PubMed]
- Mochizuki, H.; Schwartz, J.P.; Tanaka, K.; Brady, R.O.; Reiser, J. High-Titer Human Immunodeficiency Virus Type 1-Based Vector Systems for Gene Delivery into Nondividing Cells. Journal of Virology 1998, 72, 8873–8883. [Google Scholar] [CrossRef] [PubMed]
- Zijlstra, A.; Mellor, R.; Panzarella, G.; Aimes, R.T.; Hooper, J.D.; Marchenko, N.D.; Quigley, J.P. A Quantitative Analysis of Rate-limiting Steps in the Metastatic Cascade Using Human-specific Real-Time Polymerase Chain Reaction1. Cancer Research 2002, 62, 7083–7092. [Google Scholar]
- Palmer, T.D.; Lewis, J.; Zijlstra, A. Quantitative Analysis of Cancer Metastasis using an Avian Embryo Model. JoVE (Journal of Visualized Experiments) 2011, 2815. [CrossRef]
- Busch, M.; Papior, D.; Stephan, H.; Dünker, N. Characterization of etoposide- and cisplatin-chemoresistant retinoblastoma cell lines. Oncology Reports 2018, 39, 160–172. [Google Scholar] [CrossRef]
- Busch, M.; Klein, S.; Große-Kreul, J.; Scheiner, O.; Metz, K.; Stephan, H.; Dünker, N. p53, miR-34a and EMP1—Newly Identified Targets of TFF3 Signaling in Y79 Retinoblastoma Cells. International Journal of Molecular Sciences 2019, 20, 4129. [Google Scholar] [CrossRef] [PubMed]
- Dennis, G.; Sherman, B.T.; Hosack, D.A.; Yang, J.; Gao, W.; Lane, H.C.; Lempicki, R.A. DAVID: Database for Annotation, Visualization, and Integrated Discovery. Genome Biology 2003, 4, R60. [Google Scholar] [CrossRef]
- He, R.; Li, X.; Liang, L.; Xie, Y.; Luo, D.; Ma, J.; Peng, Z.; Hu, X.; Chen, G. The suppressive role of miR-542-5p in NSCLC: the evidence from clinical data and in vivo validation using a chick chorioallantoic membrane model. BMC Cancer 2017, 17, 655. [Google Scholar] [CrossRef] [PubMed]
- Philippeit, C.; Busch, M.; Dünker, N. Epigenetic Control of Trefoil Factor Family (TFF) Peptide Expression in Human Retinoblastoma Cell Lines. Cellular Physiology and Biochemistry 2014, 34, 1001–1014. [Google Scholar] [CrossRef]
- Huang, Y.-G.; Li, Y.-F.; Pan, B.-L.; Wang, L.-P.; Zhang, Y.; Lee, W.-H.; Zhang, Y. Trefoil factor 1 gene alternations and expression in colorectal carcinomas. Tumori Journal 2013, 99, 702–707. [Google Scholar] [CrossRef]
- Park, W.S.; Oh, R.R.; Park, J.Y.; Lee, J.H.; Shin, M.S.; Kim, H.S.; Lee, H.K.; Kim, Y.S.; Kim, S.Y.; Lee, S.H.; et al. Somatic mutations of the trefoil factor family 1 gene in gastric cancer. Gastroenterology 2000, 119, 691–698. [Google Scholar] [CrossRef]
- Shekarriz, R.; Kochaki, N.; Eslami-Jouibari, M.; Omrani-Nava, V.; Ahmadi, M.; Alizadeh-Navaei, R. TFF1 gene single nucleotide polymorphism (rs3761376) and colorectal cancer risk. Molecular Biology Reports 2022, 49, 10127–10131. [Google Scholar] [CrossRef] [PubMed]
- Wang, W.; Li, Z.; Wang, J.; Du, M.; Li, B.; Zhang, L.; Li, Q.; Xu, J.; Wang, L.; Li, F.; et al. A functional polymorphism in TFF1 promoter is associated with the risk and prognosis of gastric cancer. International Journal of Cancer 2018, 142, 1805–1816. [Google Scholar] [CrossRef]
- Yio, X.; Diamond, M.; Zhang, J.-Y.; Weinstein, H.; Wang, L.-H.; Werther, L.; Itzkowitz, S. Trefoil Factor Family-1 Mutations Enhance Gastric Cancer Cell Invasion Through Distinct Signaling Pathways. Gastroenterology 2006, 130, 1696–1706. [Google Scholar] [CrossRef]
- Reubi, J.C.; Fourmy, D.; Cordomi, A.; Tikhonova, I.G.; Gigoux, V. GIP receptor: Expression in neuroendocrine tumours, internalization, signalling from endosomes and structure-function relationship studies. Peptides 2020, 125, 170229. [Google Scholar] [CrossRef] [PubMed]
- Sherman, S.K.; Maxwell, J.E.; Carr, J.C.; Wang, D.; O’Dorisio, M.S.; O’Dorisio, T.M.; Howe, J.R. GIPR expression in gastric and duodenal neuroendocrine tumors. Journal of Surgical Research 2014, 190, 587–593. [Google Scholar] [CrossRef] [PubMed]
- Karpathakis, A.; Dibra, H.; Pipinikas, C.; Feber, A.; Morris, T.; Francis, J.; Oukrif, D.; Mandair, D.; Pericleous, M.; Mohmaduvesh, M.; et al. Prognostic Impact of Novel Molecular Subtypes of Small Intestinal Neuroendocrine Tumor. Clinical Cancer Research 2016, 22, 250–258. [Google Scholar] [CrossRef]
- Costa, M.H.S.; Latronico, A.C.; Martin, R.M.; Barbosa, A.S.; Almeida, M.Q.; Lotfi, C.F.P.; Valassi, H.P.L.; Nishi, M.Y.; Lucon, A.M.; Siqueira, S.A.; et al. Expression profiles of the glucose-dependent insulinotropic peptide receptor and LHCGR in sporadic adrenocortical tumors. The Journal of Endocrinology 2009, 200, 167–175. [Google Scholar] [CrossRef]
- Li, Z.; Hu, C.; Zhen, Y.; Pang, B.; Yi, H.; Chen, X. Pristimerin inhibits glioma progression by targeting AGO2 and PTPN1 expression via miR-542-5p. Bioscience Reports 2019, 39, BSR20182389. [Google Scholar] [CrossRef]
- Bachelerie, F.; Ben-Baruch, A.; Burkhardt, A.M.; Combadiere, C.; Farber, J.M.; Graham, G.J.; Horuk, R.; Sparre-Ulrich, A.H.; Locati, M.; Luster, A.D.; et al. International Union of Basic and Clinical Pharmacology. LXXXIX. Update on the Extended Family of Chemokine Receptors and Introducing a New Nomenclature for Atypical Chemokine Receptors. Pharmacological Reviews 2014, 66, 1–79. [Google Scholar] [CrossRef]
- Hauser, A.S.; Attwood, M.M.; Rask-Andersen, M.; Schiöth, H.B.; Gloriam, D.E. Trends in GPCR drug discovery: new agents, targets and indications. Nature Reviews Drug Discovery 2017, 16, 829–842. [Google Scholar] [CrossRef]
- Kastenhuber, E.R.; Lowe, S.W. Putting p53 in Context. Cell 2017, 170, 1062–1078. [Google Scholar] [CrossRef] [PubMed]
- Levine, A.J. p53: 800 million years of evolution and 40 years of discovery. Nature Reviews Cancer 2020, 20, 471–480. [Google Scholar] [CrossRef] [PubMed]
- Wang, H.; Guo, M.; Wei, H.; Chen, Y. Targeting p53 pathways: mechanisms, structures, and advances in therapy. Signal Transduction and Targeted Therapy 2023, 8, 92. [Google Scholar] [CrossRef] [PubMed]
- Chen, Y.; Zhang, X.; Dantas Machado, A.C.; Ding, Y.; Chen, Z.; Qin, P.Z.; Rohs, R.; Chen, L. Structure of p53 binding to the BAX response element reveals DNA unwinding and compression to accommodate base-pair insertion. Nucleic Acids Research 2013, 41, 8368–8376. [Google Scholar] [CrossRef] [PubMed]
- Wei, H.; Qu, L.; Dai, S.; Li, Y.; Wang, H.; Feng, Y.; Chen, X.; Jiang, L.; Guo, M.; Li, J.; et al. Structural insight into the molecular mechanism of p53-mediated mitochondrial apoptosis. Nature Communications 2021, 12, 2280. [Google Scholar] [CrossRef]
- Kondapuram, S.K.; Ramachandran, H.K.; Arya, H.; Coumar, M.S. Targeting survivin for cancer therapy: Strategies, small molecule inhibitors and vaccine based therapeutics in development. Life Sciences 2023, 335, 122260. [Google Scholar] [CrossRef]
- Jimenez-Pascual, A.; Mitchell, K.; Siebzehnrubl, F.A.; Lathia, J.D. FGF2: a novel druggable target for glioblastoma? Expert Opinion on Therapeutic Targets 2020, 24, 311–318. [Google Scholar] [CrossRef]
- Chandarana, R.; D’Souza, J.S.; Coutinho, E.C. Glucose-Dependent Insulinotropic Polypeptide Receptor (GIPR).
Figure 2.
Verification of GIPR upregulation after lentiviral TFF1 overexpression in two retinoblastoma cell lines. (a) Verification of successful TFF1 overexpression in Weri and Y79 RB cells via Real-Time PCR. (b) After lentiviral TFF1 overexpression in two RB cell lines, GIPR is significantly upregulated at mRNA level as revealed by Real-Time PCR. (c) In TFF1 overexpressing Weri and Y79 RB cells, GIPR is likewise upregulated on protein level as revealed by Western blot analysis. CTRL = cells transduced with control vector. TFF1 OE = TFF1 overexpression. Values represent means ± SEM; significances were calculated by unpaired Student`s t-test. *p<0.05; ***p<0.001.
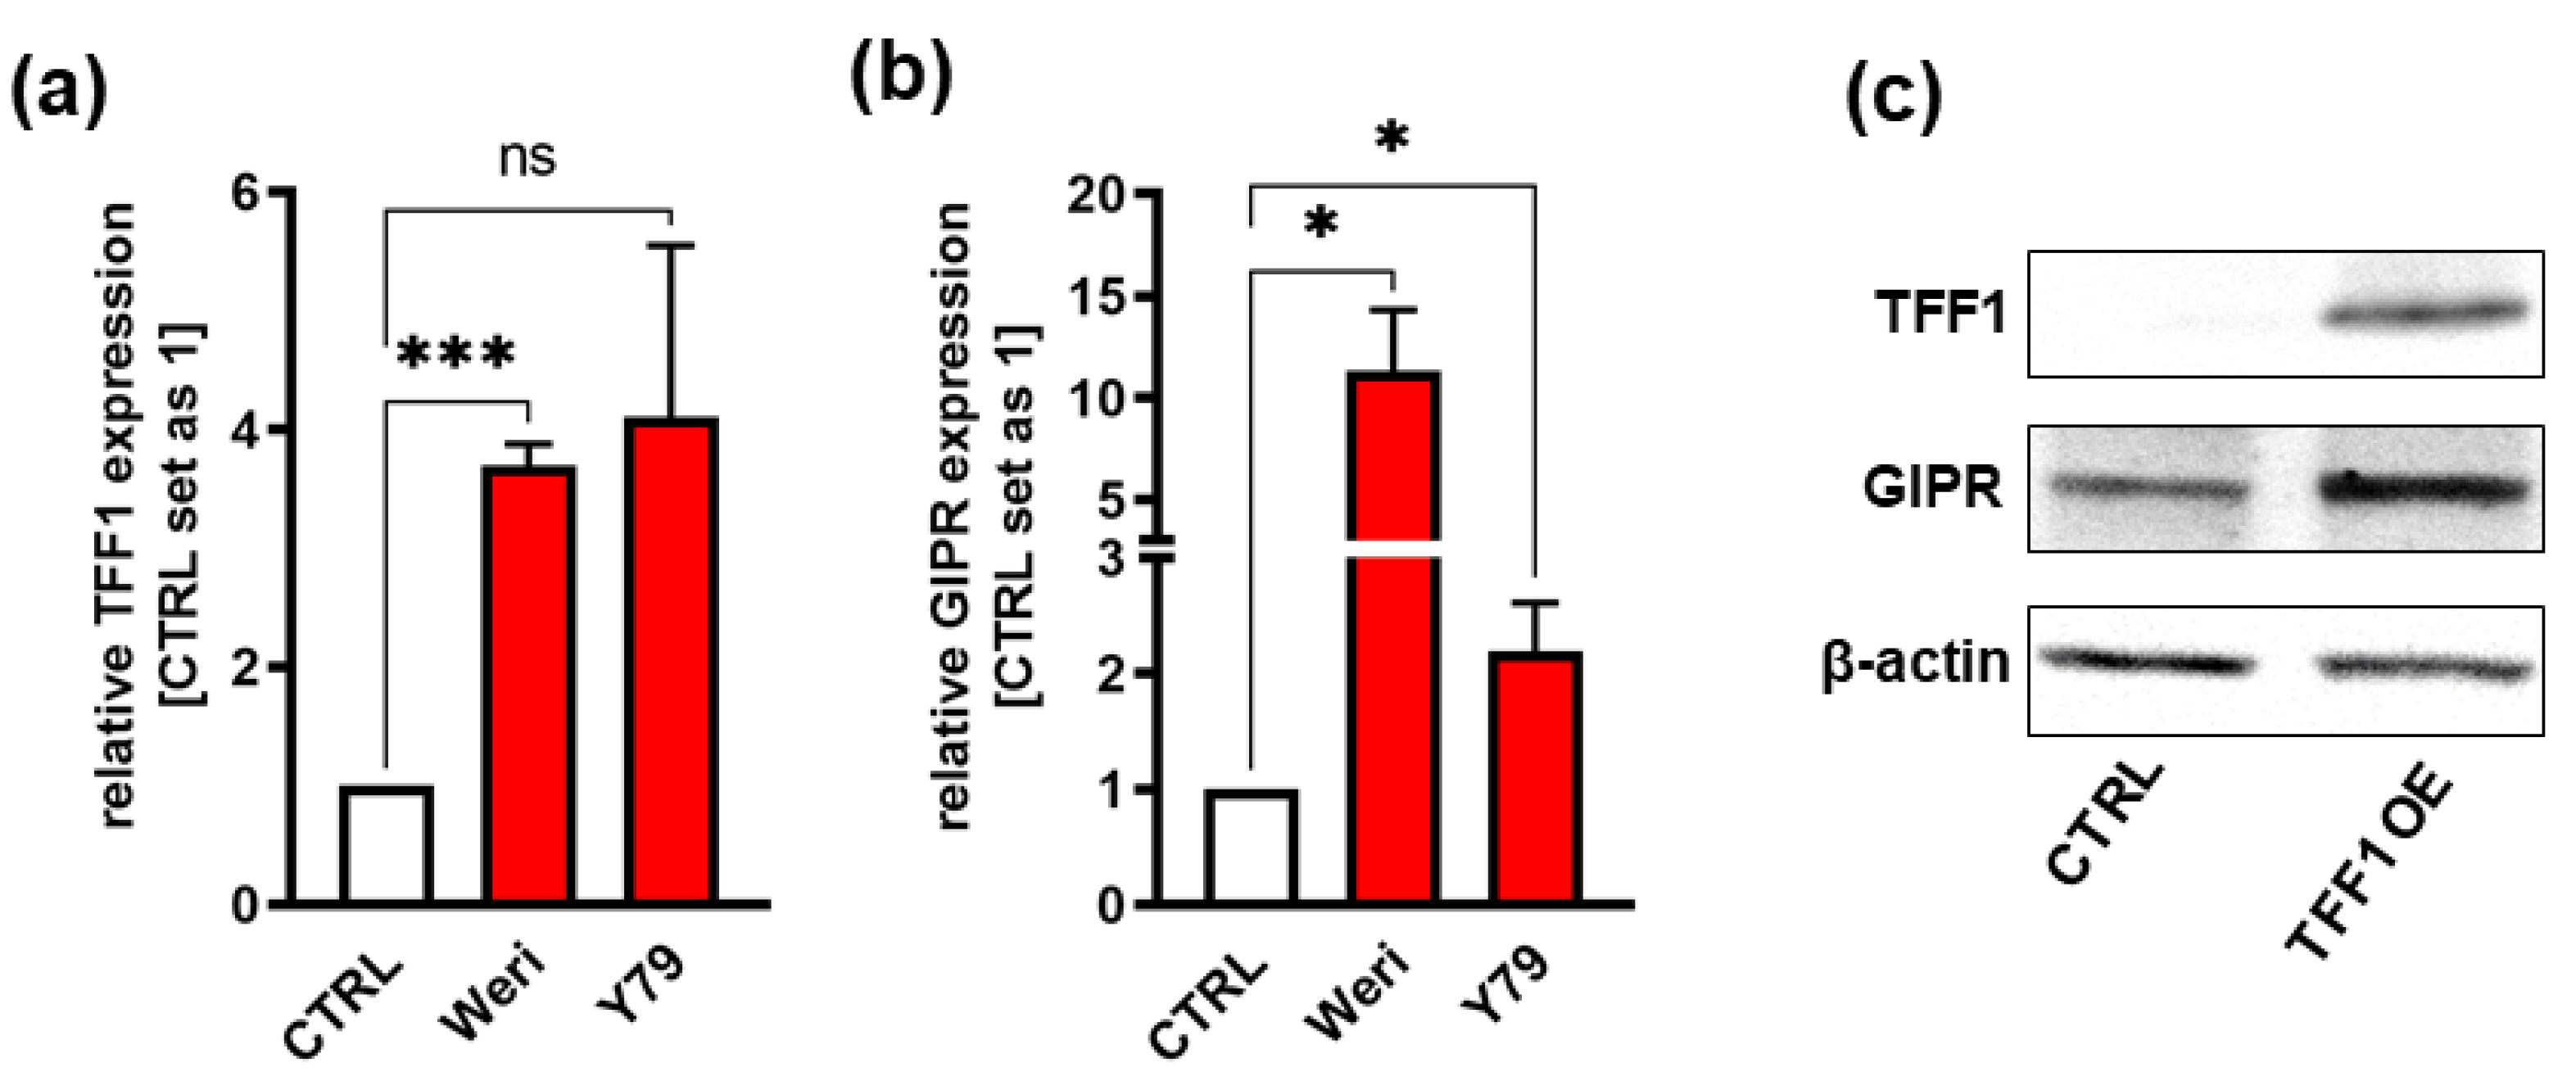
Figure 3.
GIPR expression in TFF1 negative and TFF1 positive primary RB patient tumors. (a) Cultured TFF1 negative (TFF1-) patient derived retinoblastoma (RB) tumor cells display similar GIPR mRNA levels as the healthy human retina (hRet) as revealed by Real-Time PCR. By contrast, TFF1 positive (TFF1+) RB tumor cells show significantly increased GIPR expression. GIPR expression in TFF1+ primary RB tumor cells is significantly increased compared to TFF1- tumor cells. (b) Real-Time PCR analyses with RNA extracted from formalin fixed, paraffin embedded (FFPE) RB patient tumors revealed that TFF1- RB tumors show higher, yet not significantly increased GIPR mRNA levels compared to hRet, whereas TFF1+ tumors display significantly increased GIPR expression compared to hRet and TFF1- RB tumors. (c) Immunohistochemical stains against GIPR and TFF1 (brown) in TFF1+ and TFF1- in hematoxylin counterstained (blue) paraffin sections of RB patient tumors. Scale bar: 50 µm; applies for all pictures in C. Values represent means ± SEM; significances were calculated by unpaired Student`s t-test. ns=p>0.05; *p<0.05; **p<0.01; ***p<0.001.
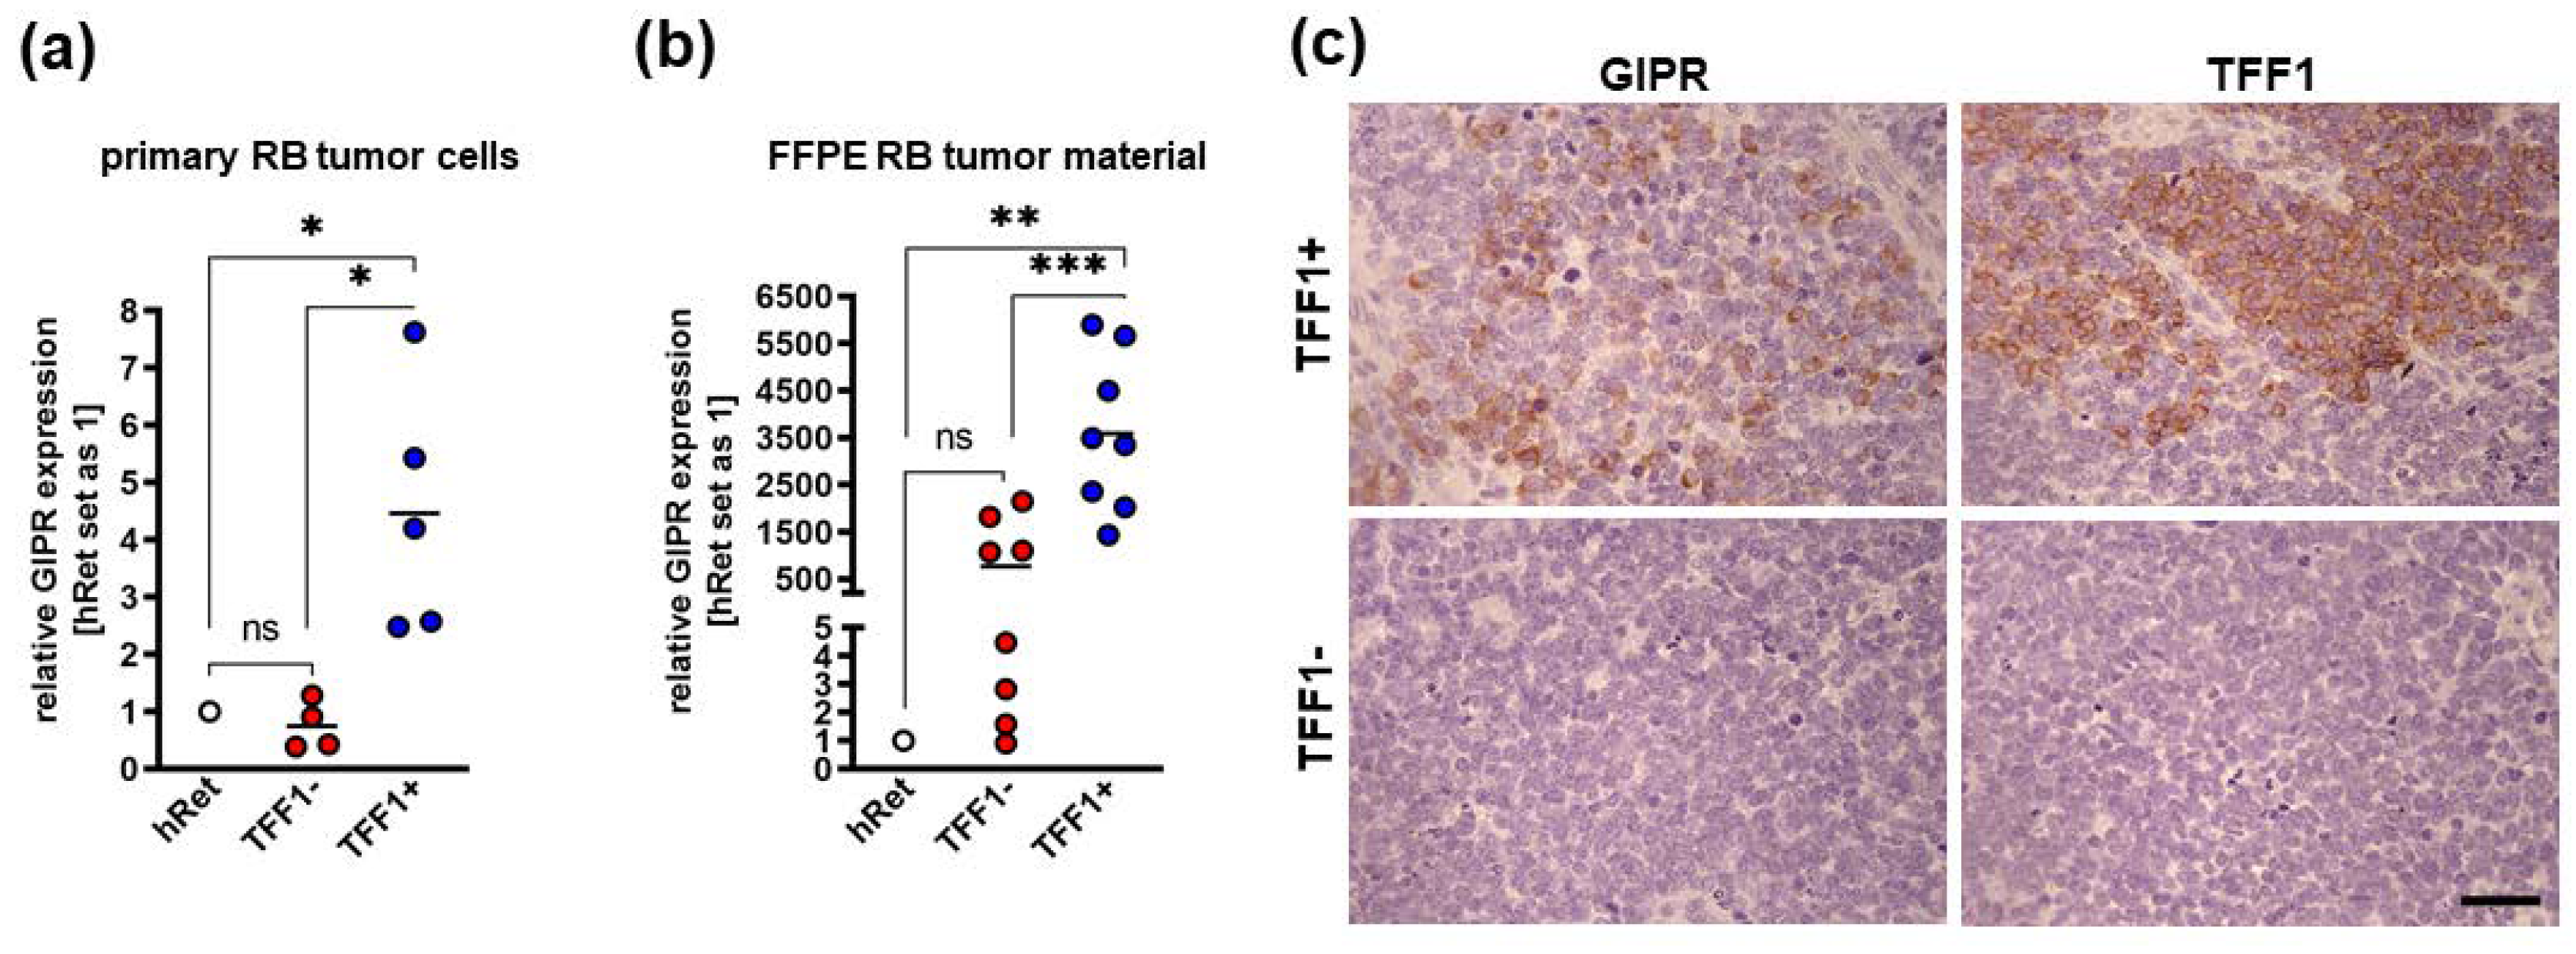
Figure 4.
Verification of GIPR overexpression in retinoblastoma cell lines. (a) Verification of GIPR overexpression (OE) in the retinoblastoma (RB) cell lines Weri and Y79 on mRNA level via Real-Time PCR. (b) Verification of GIPR overexpression on protein level via Western blot analysis in the RB cell lines Weri and Y79. (c) Immunofluorescent stains against GIPR (red fluorescence) with DAPI (blue) counterstaining after GIPR overexpression in Weri RB cells. Scale bar: 50 µm (applies for all pictures in C). CTRL= cells transduced with control vector. GIPR OE= GIPR overexpression. Values represent means ± SEM; significances were calculated by unpaired Student`s t-test. *p<0.05; **p<0.01.
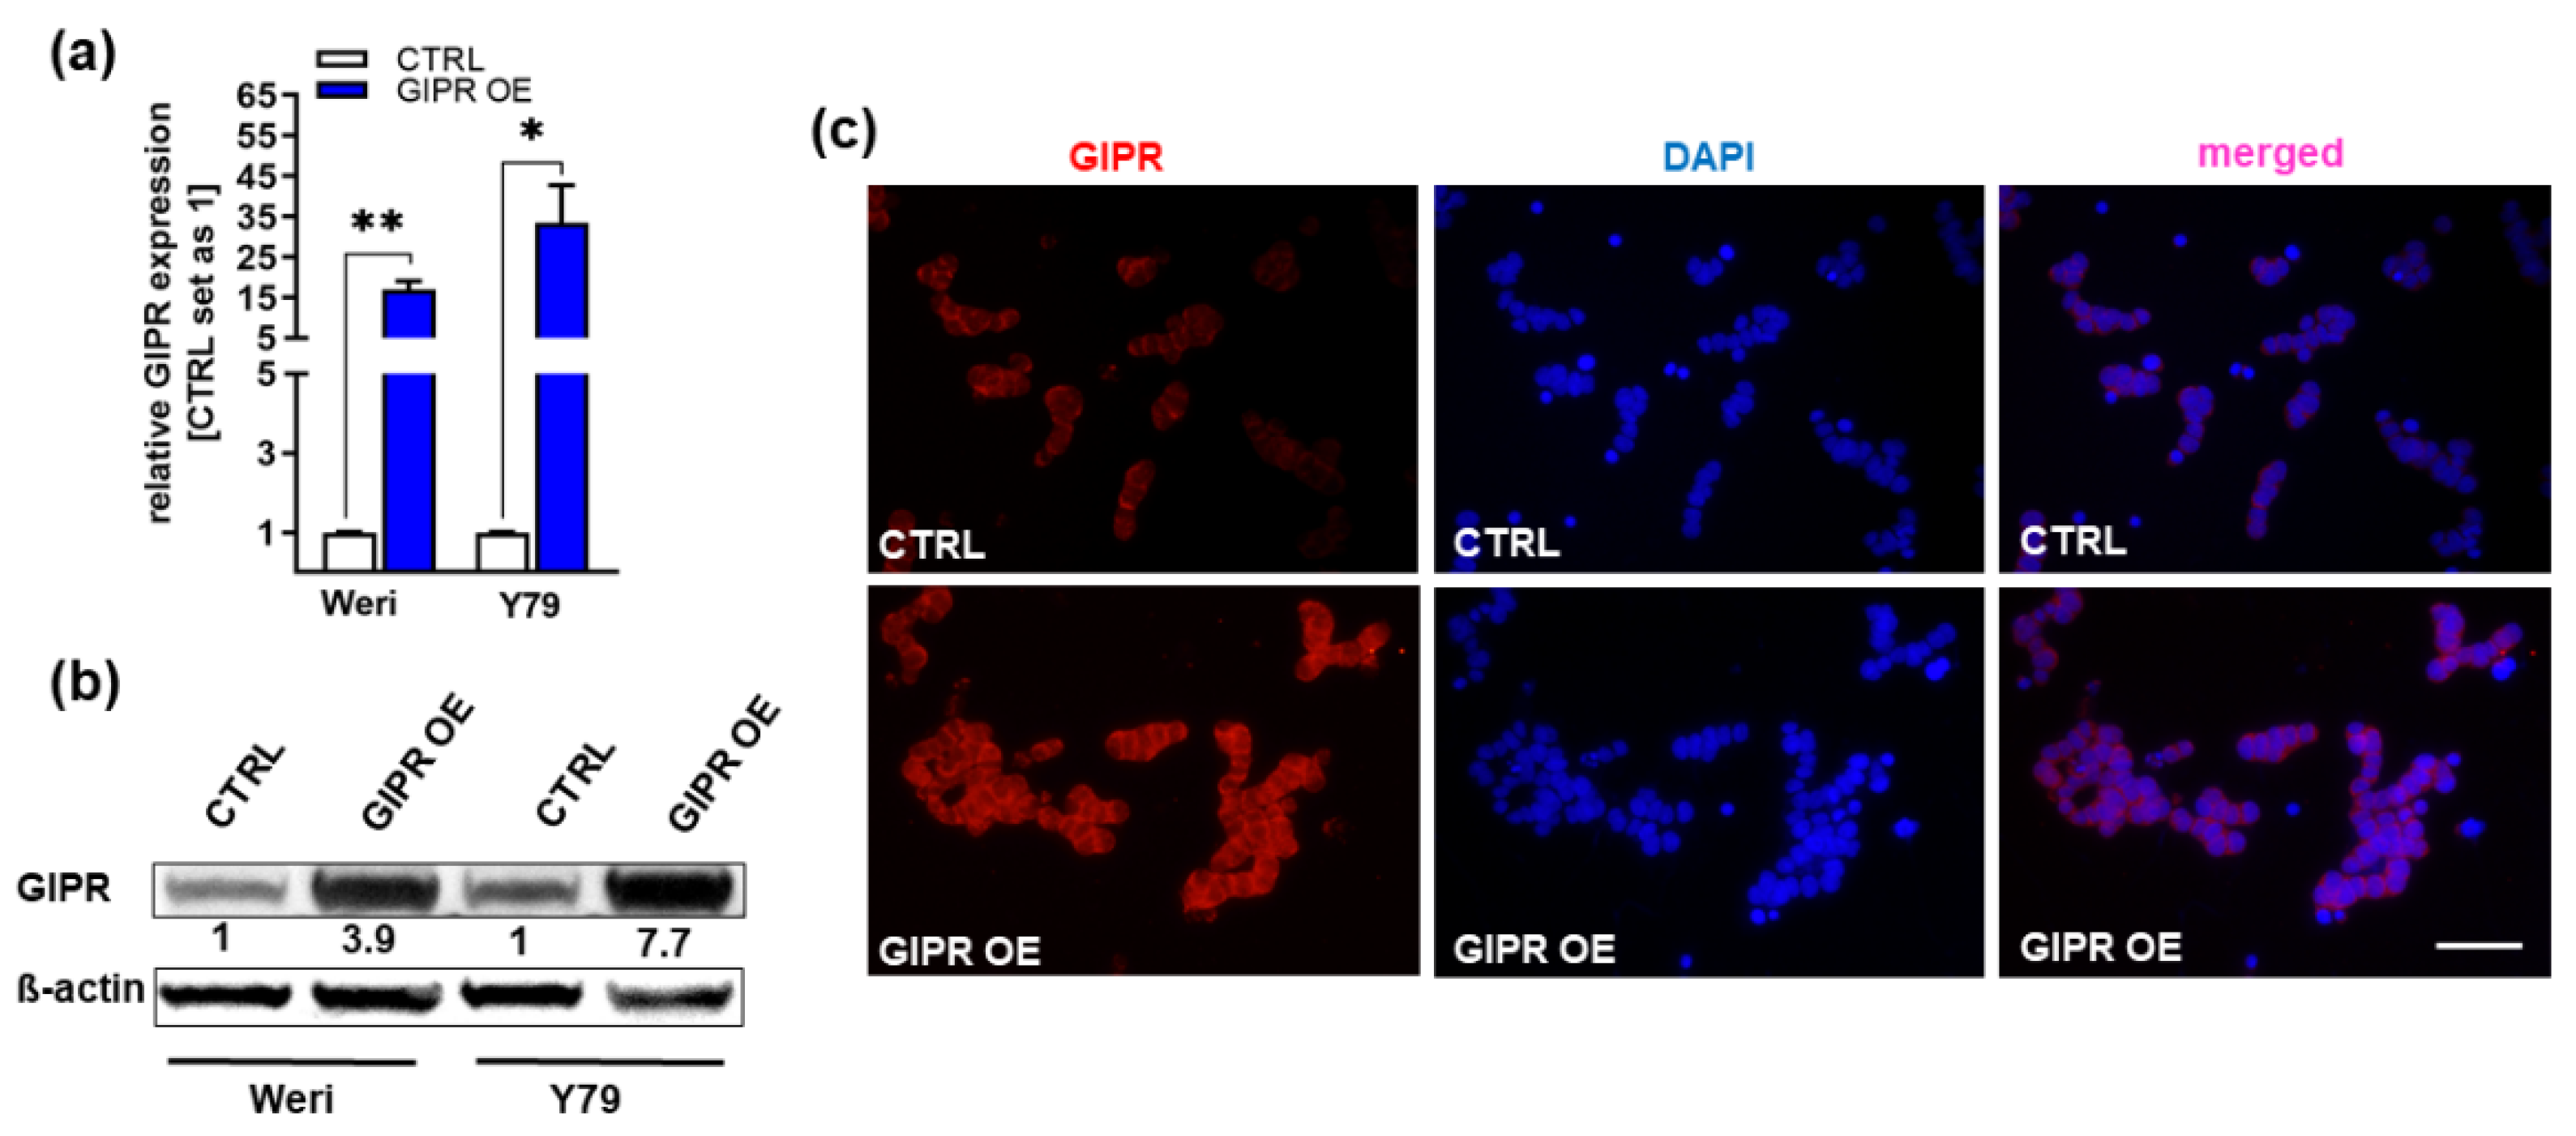
Figure 5.
In vitro effects of GIPR overexpression in retinoblastoma cell lines. (a) Cell viability was significantly decreased following GIPR overexpression (GIPR OE; blue bars) in the retinoblastoma (RB) cell lines Weri and Y79 as revealed by WST-1 assays. (b, c) Growth kinetics of Weri (b) and Y79 (c) RB cells were significantly decreased after GIPR overexpression. (d) Proliferation of Weri and Y79 cells was significantly decreased after GIPR overexpression as revealed by quantification of BrdU stains. (e) The significant increase in apoptosis after GIPR overexpression in Weri and Y79 cells is caspase-3 dependent as revealed by quantification of immunocytochemical stains against cleaved caspase-3. (f) Immunocytochemical stains against cleaved caspase-3 in Weri control cells (CTRL) and GIPR overexpressing (GIPR OE) Weri cells. Arrowheads indicate cleaved caspase-3 positive (cleaved caspase-3+) cells. Scale bar 50 µm. CTRL= cells transduced with control vector. Values represent means ± SEM; significances were calculated by unpaired Student`s t-test. ns=p>0.05; *p<0.05; **p<0.01; ***p<0.001; ****p<0.0001.
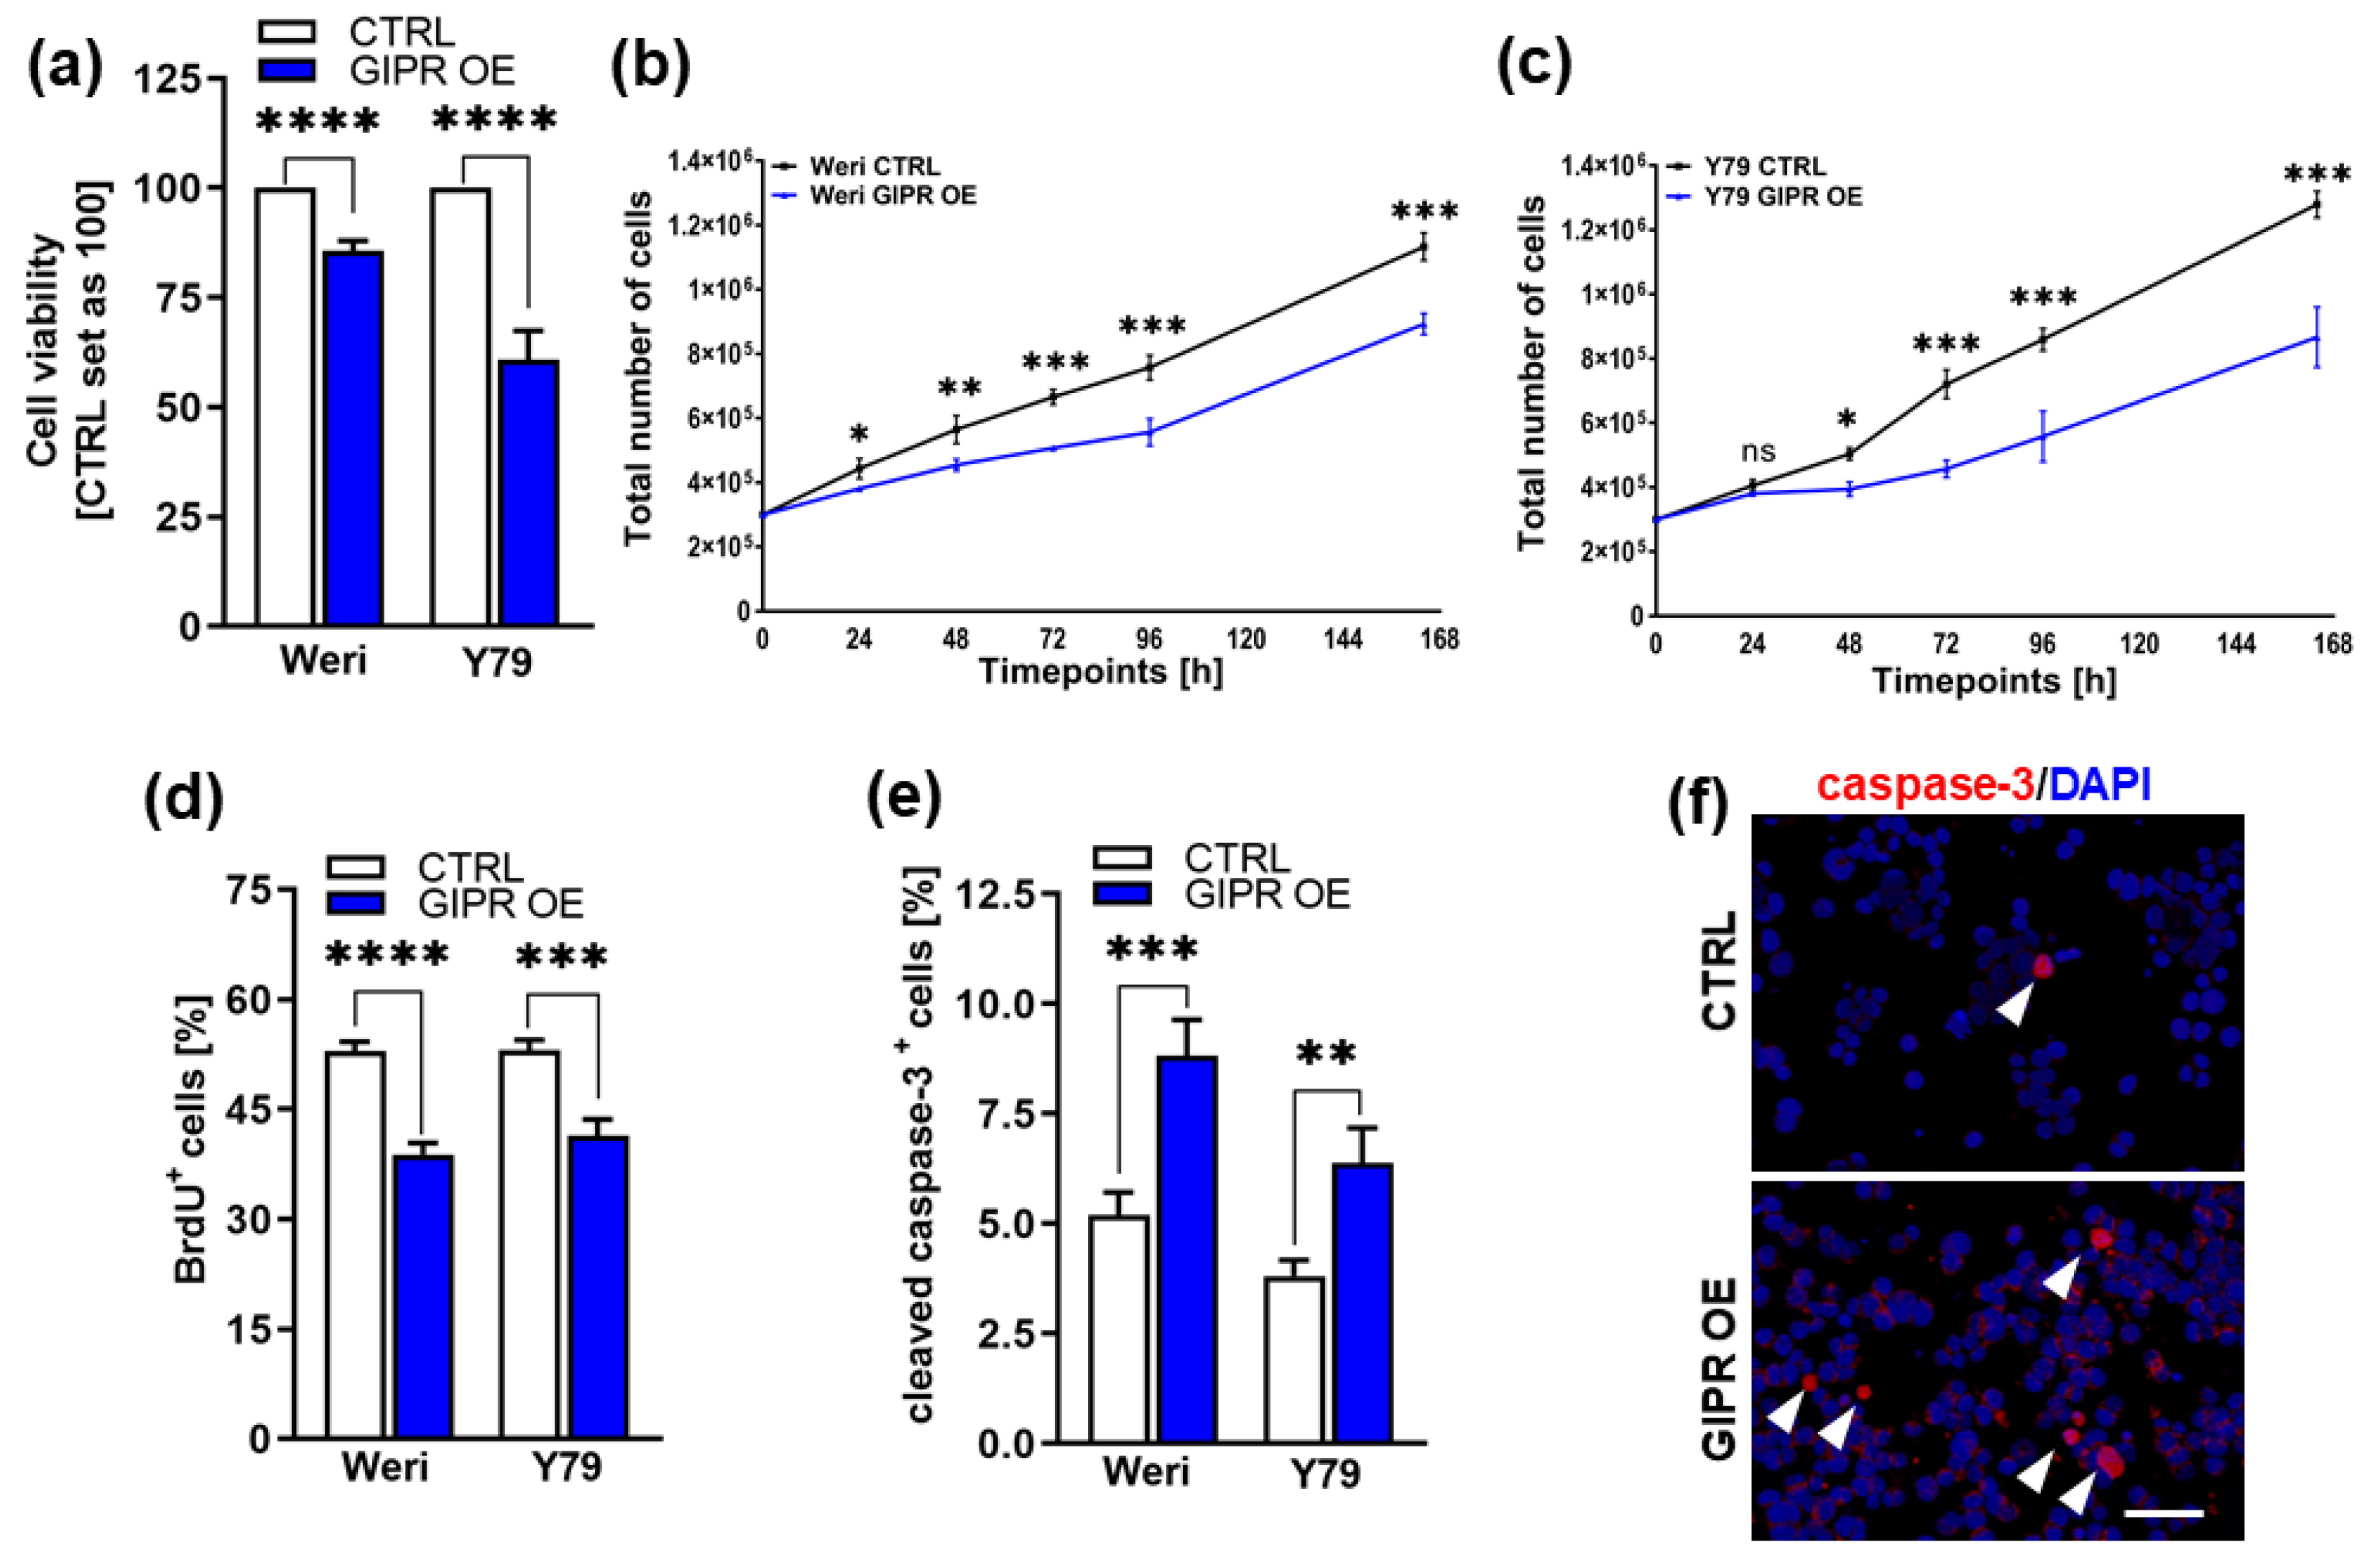
Figure 6.
In vivo effects of GIPR overexpression in in ovo CAM assays. (a-c) Quantification of weight, size and formation capacity of CAM tumors developing from GIPR overexpressing (GIPR OE) Weri and Y79 RB cells inoculated on the CAM. (d) Representative pictures of RB CAM tumors in situ and excised tumors on a ruler (insets). GIPR overexpressing RB cells form significantly smaller tumors in the in ovo CAM assay. Scale bar in d: 5 mm; applies for all pictures. CTRL= cells transduced with control vector. Values represent means ± SEM; significances were calculated by unpaired Student`s t-test. ns=p>0.05; **p<0.01; ***p<0.001.
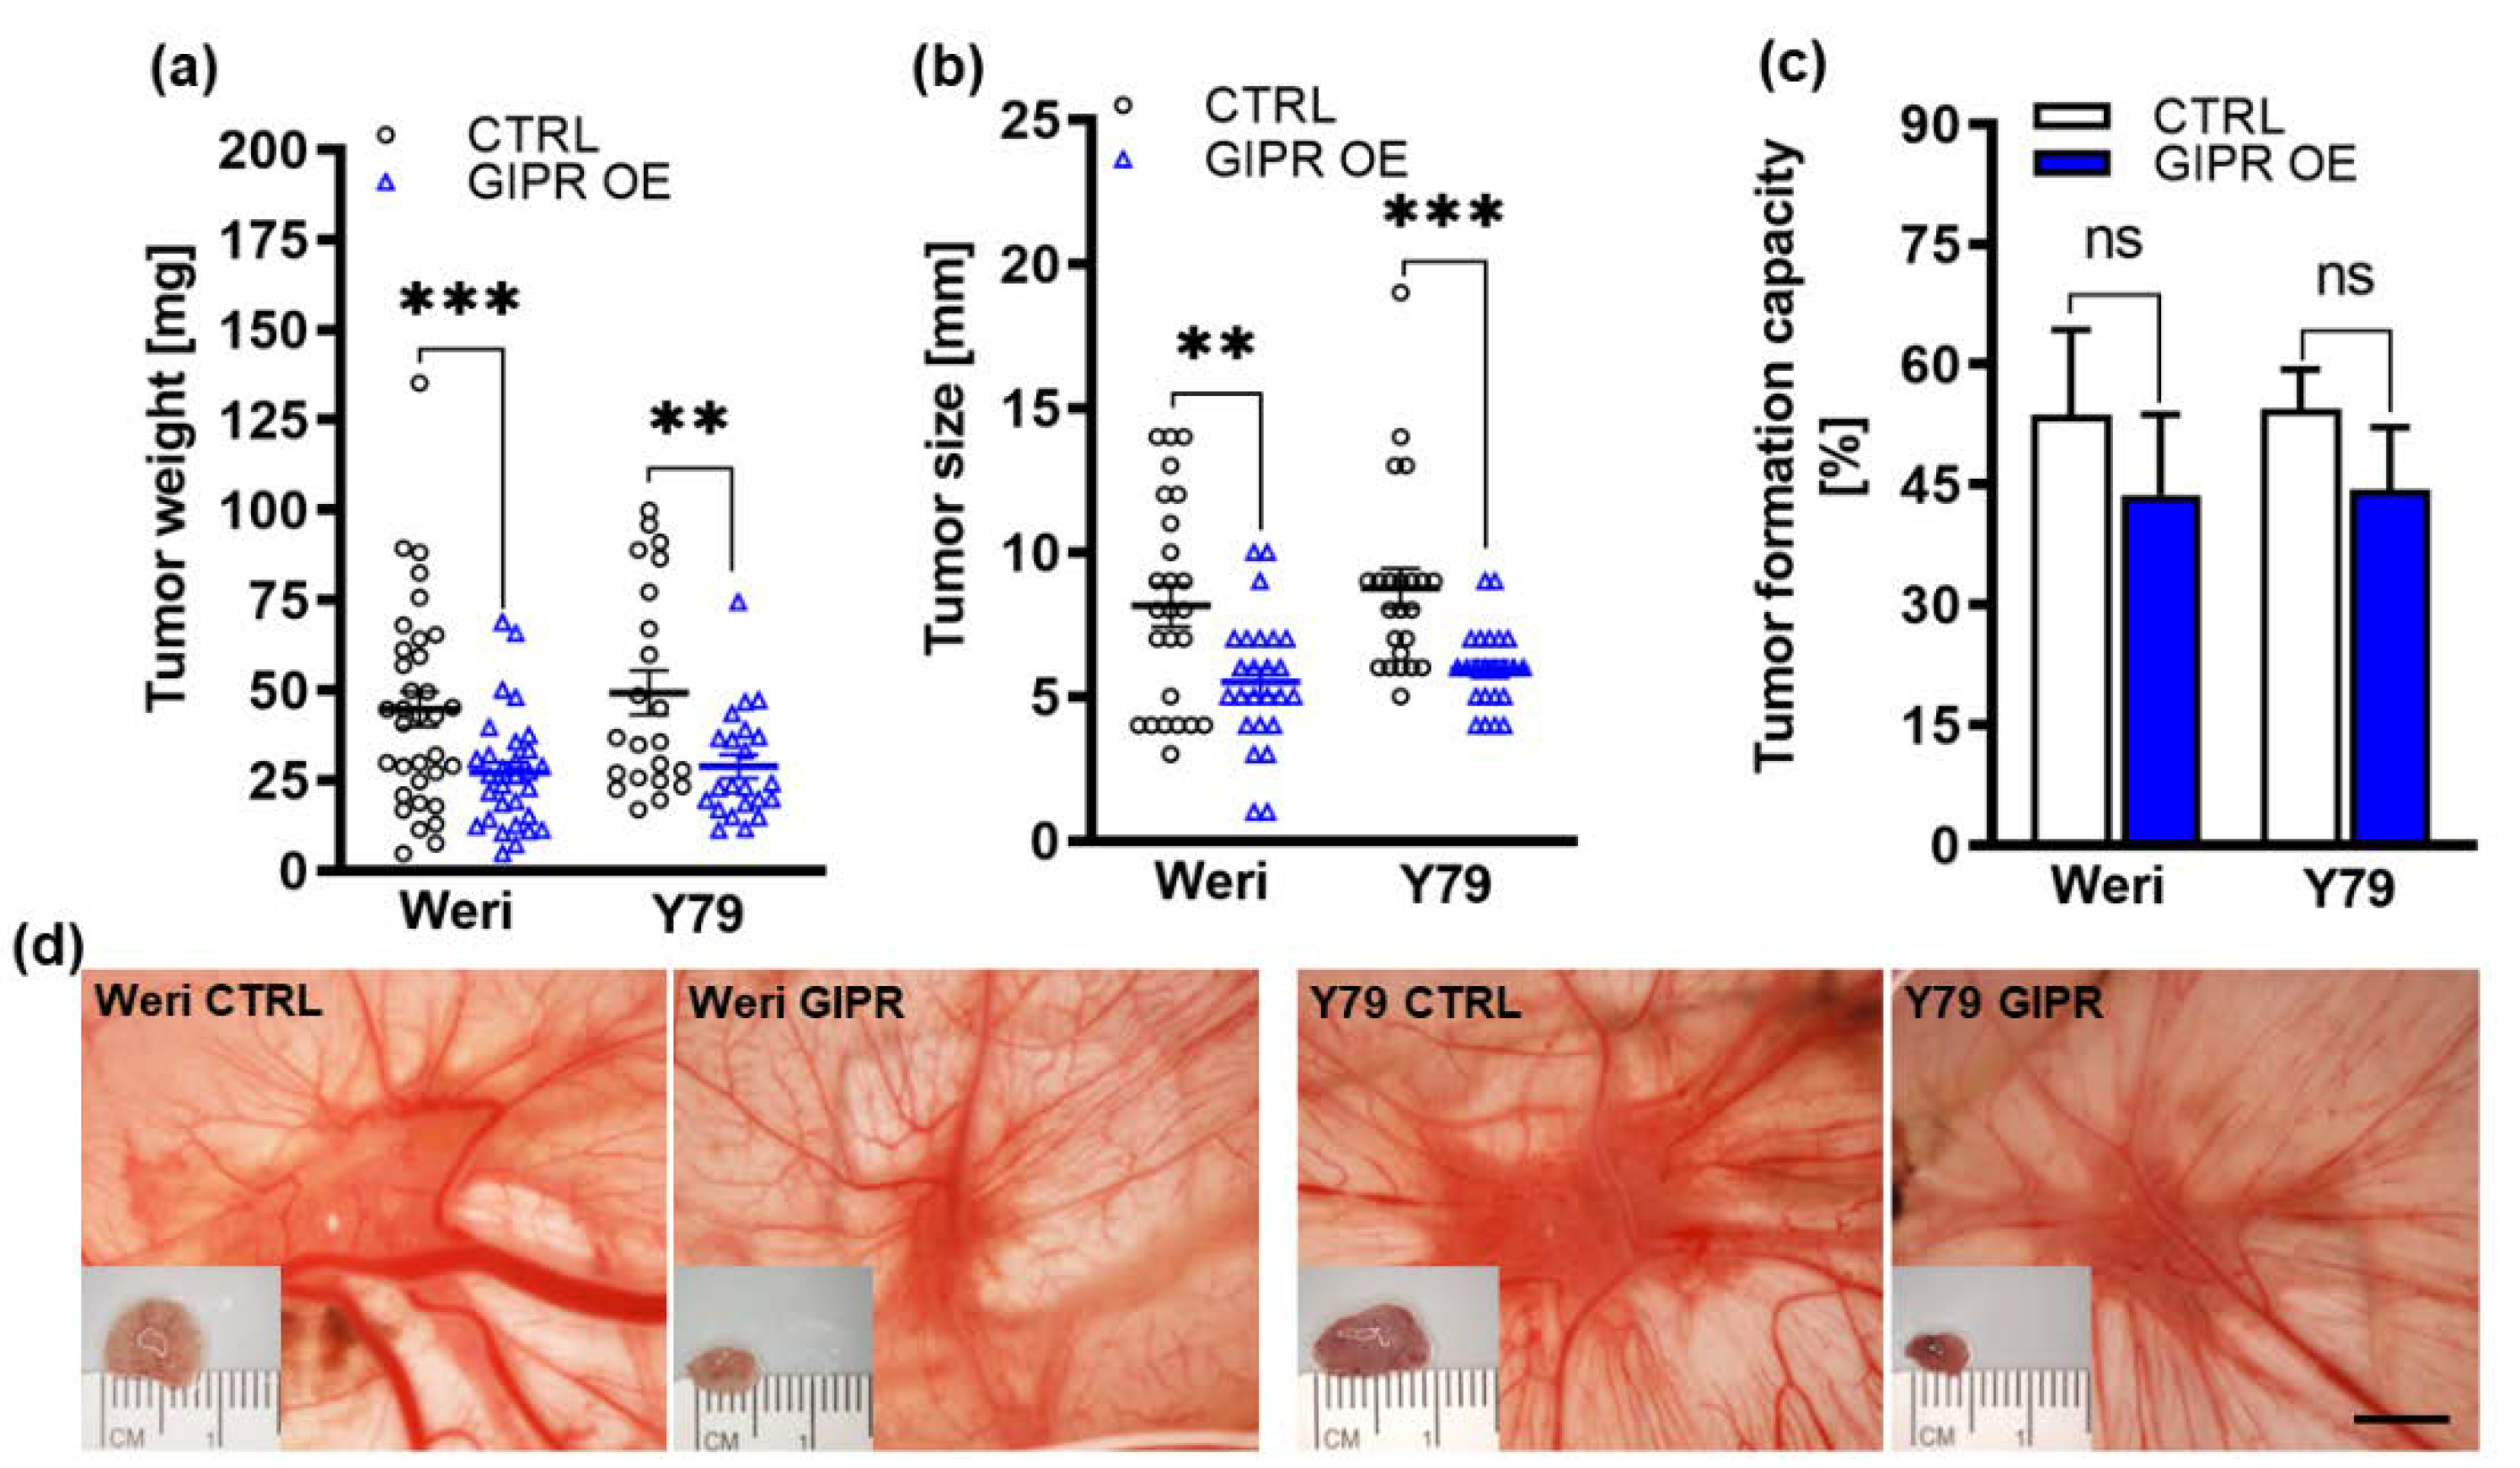
Figure 7.
Effects of administration of a GIPR inhibitor and recombinant TFF1 on GIPR overexpressing RB cells. (a, d) Cell viability was significantly decreased following GIPR overexpression (GIPR OE; blue bars) in the retinoblastoma (RB) cell lines Weri (a) and Y79 (d) as revealed by WST-1 assays after 24 hours. After administration of the GIPR inhibitor MK0893, the effect was reversed. The addition (+) of recombinant TFF1 (rTFF1) or a combination of MK0893 and rTFF1 did not lead to changes in cell viability compared to untreated GIPR overexpressing cells (-). (b, e) Cell proliferation in Weri (B) as well as in Y79 (c) cells was decreased after GIPR overexpression as revealed by quantification of BrdU stains. Following administration of MK0893, the effect was reversed and proliferation levels exceeded those of control cells, transduced with a control vector (CTRL). The addition of rTFF1 did not lead to changes in proliferation compared to the untreated GIPR overexpressing cells. (c, f) Changes in cell death levels after GIPR overexpression were revealed by counting of trypan blue-positive cells. GIPR overexpression resulted in an increased apoptosis level of Weri (c) and Y79 (f) cells. Following administration of MK0893, cell death levels dropped significantly in Y79 (f) but not in Weri cell line. The addition of rTFF1 did not lead to significantly changes compared to cell death levels of untreated controls. The legends in a and d also apply for all other graphs. Values represent means ± SEM; significances were calculated by unpaired Student`s t-test. ns=p>0.05; *p<0.05; **p<0.01; ***p<0.001.
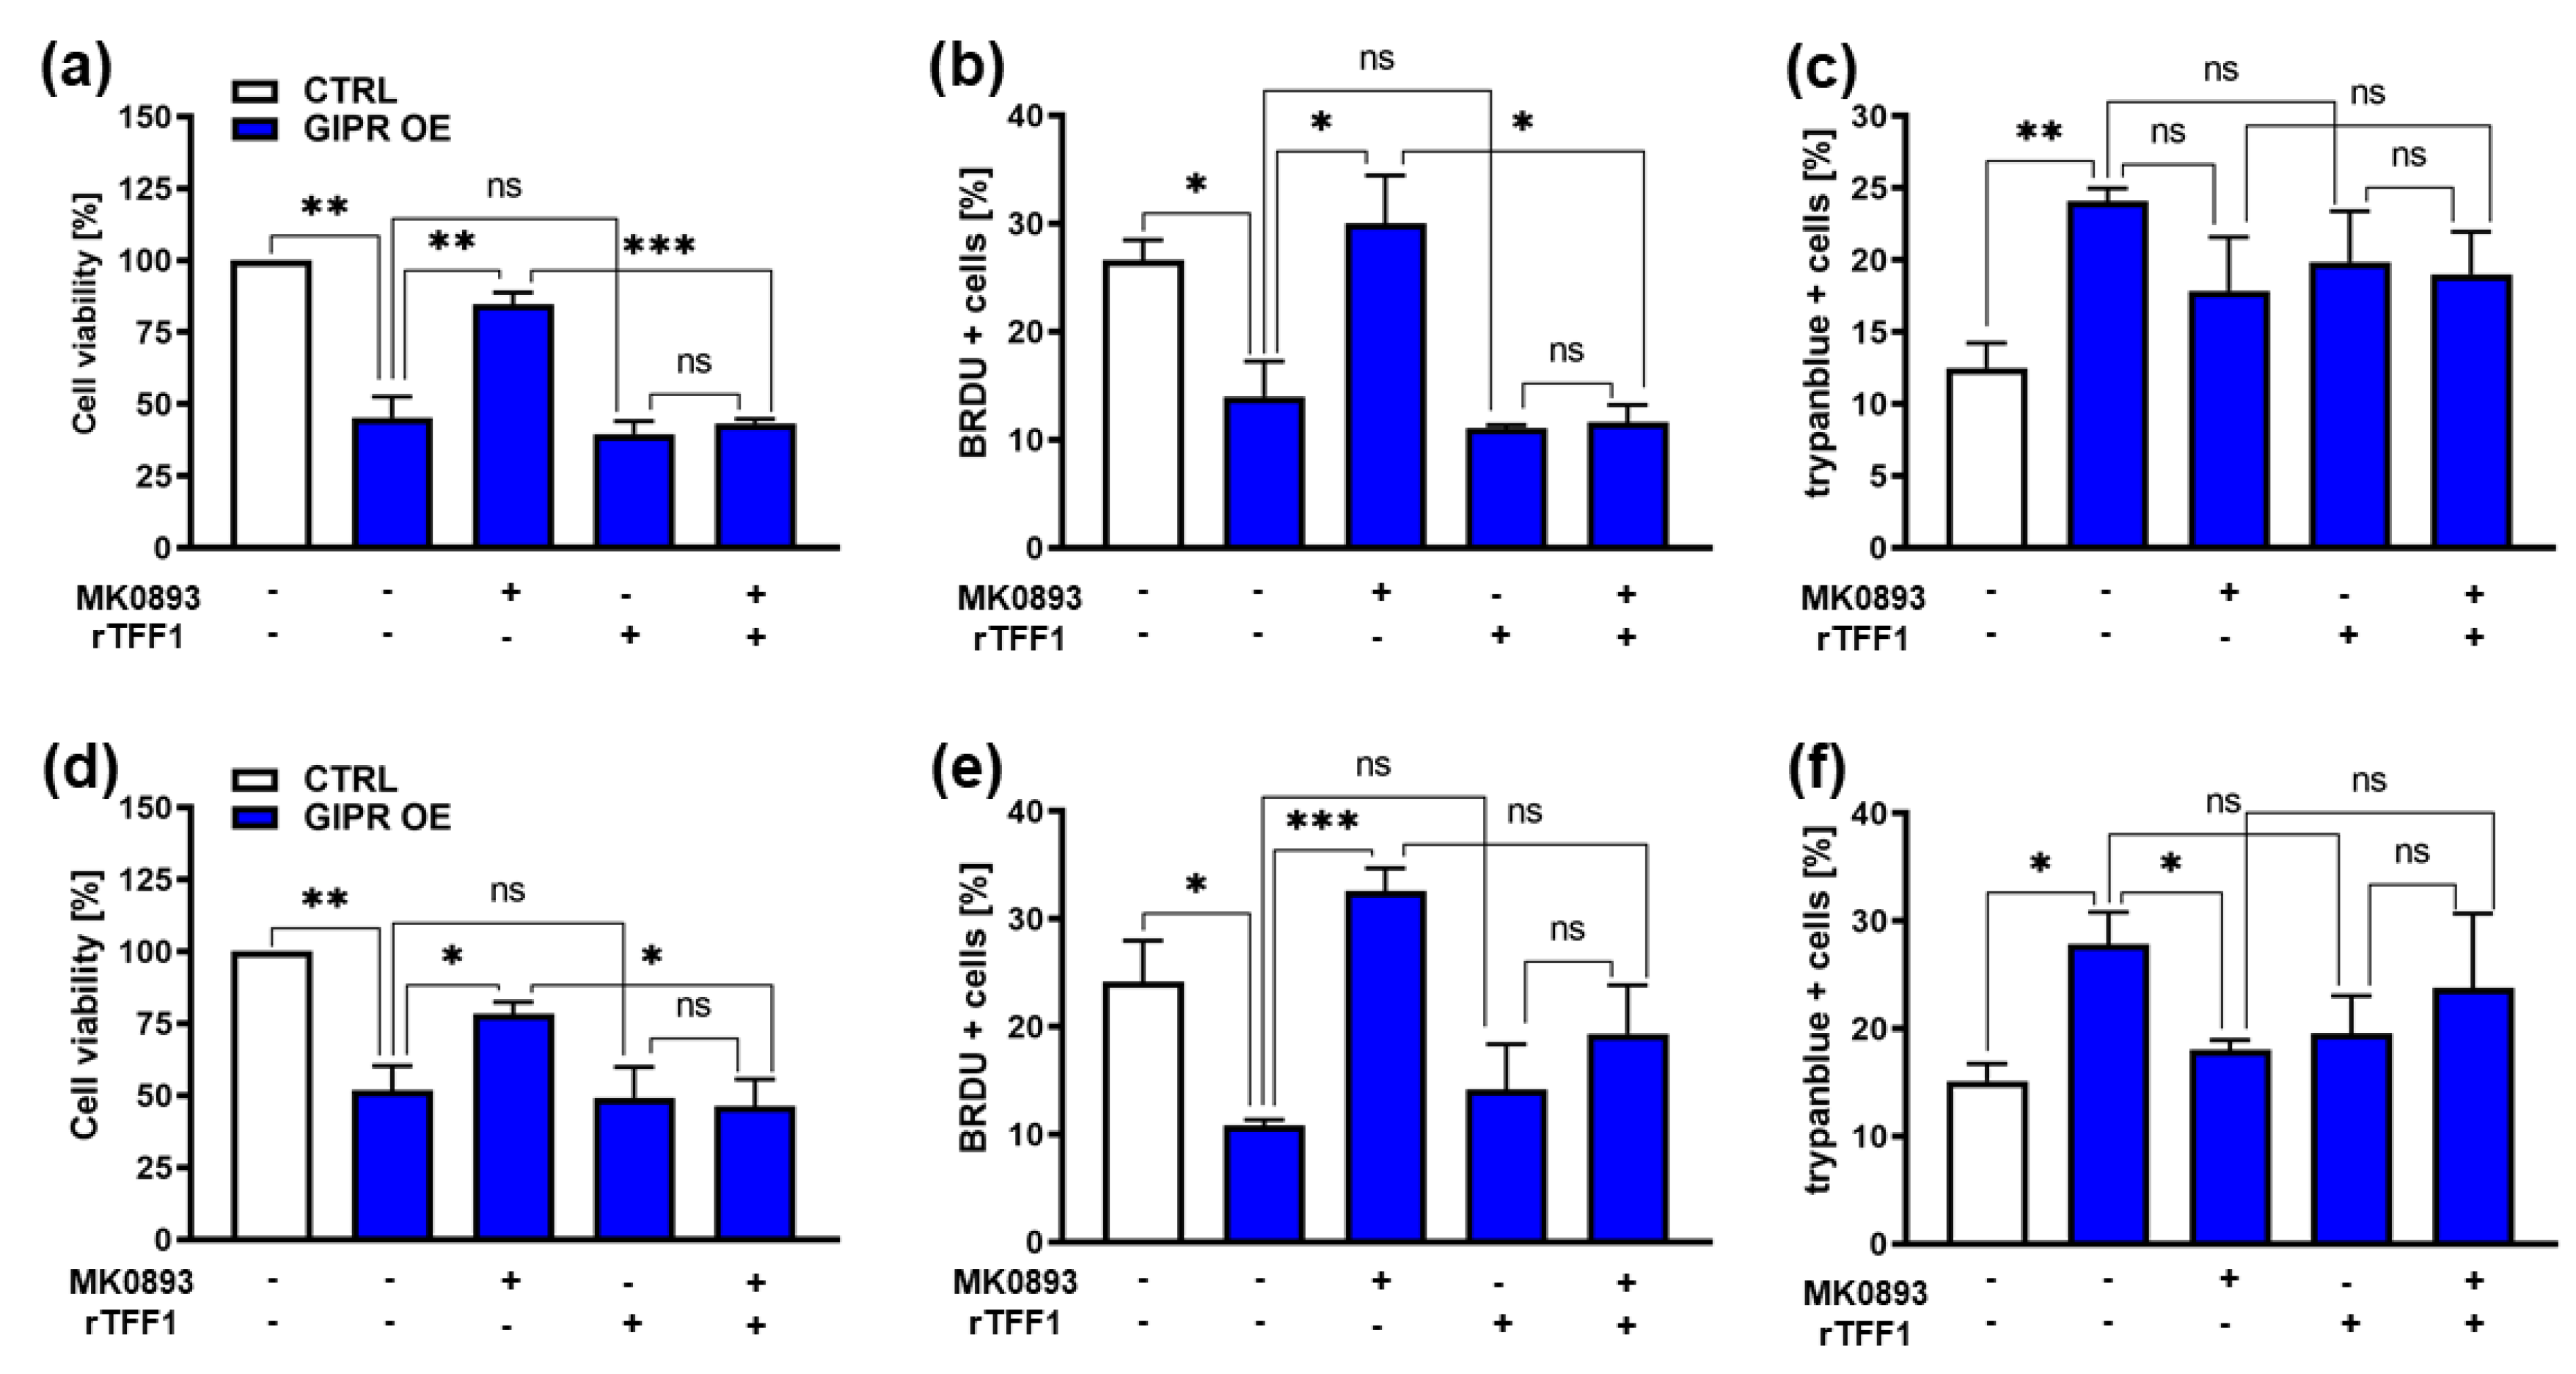
Figure 8.
Endogenous GIPR and miR-542-5p expression levels in RB cell lines and expression after miR-542-5p overexpression. (a, b) Compared to the healthy human retina (hRet), the RB cell lines Weri and Y79 display increased GIPR (a; blue bars) and decreased miR-542-5p (b; green bars) mRNA expression levels as revealed by Real-Time PCR. (c, d) After successful miR-542-5p overexpression (grey bars; c) verified by Real-Time PCR, the RB cell lines displayed significantly decreased GIPR mRNA expression levels (d). CTRL= cells transduced with control vector. miR-542-5p OE= miR-542-5p overexpression. Values represent means ± SEM; not significant p-values are not shown. *p<0.05 **p<0.01; ***p<0.001; ****p<0.0001.
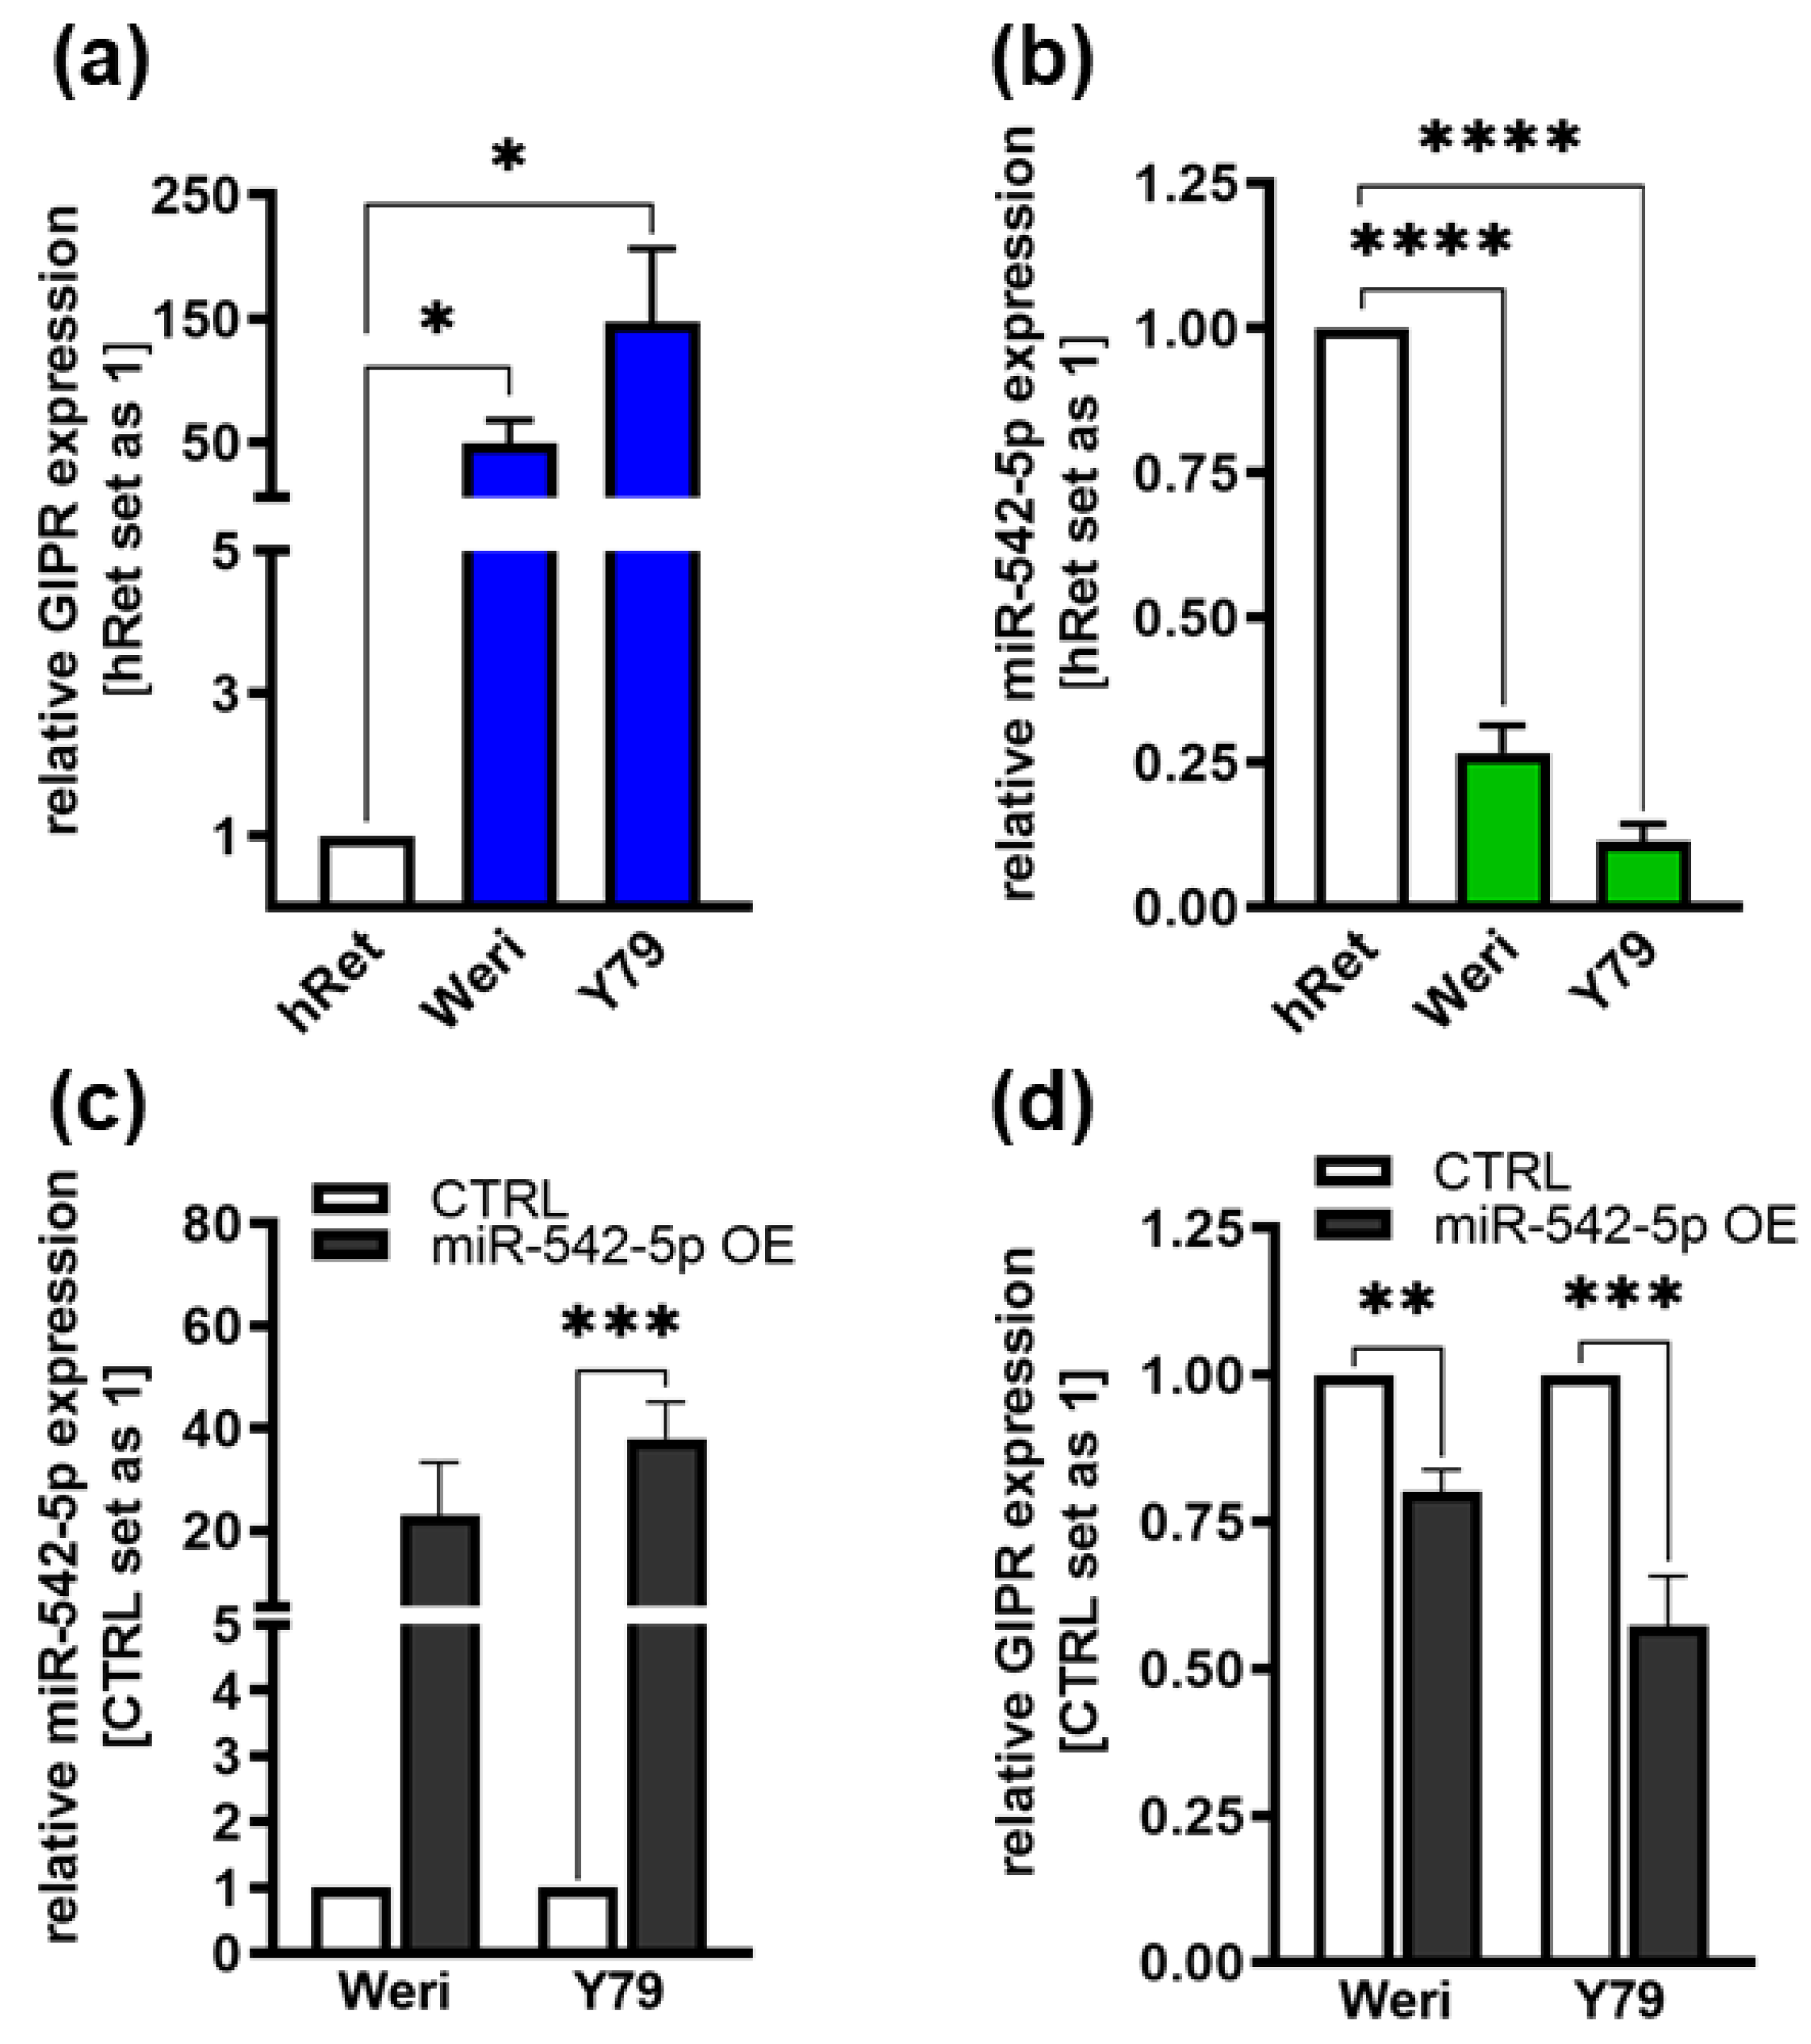
Figure 9.
Binding studies of miR-542-5p to the 3’-UTR region of GIPR. (a) Depiction of potential binding sites of miR-542-5p at the 3’-UTR region of the GIPR gene. The GIPR 3’-UTR region contains a potential binding site for miR-542-5p adjacent to the open reading frame (GIPR ORF). MiR-542-5p can bind to the potential binding site (BS), whereas it cannot bind to the mutant binding site (MUT BS). (b) For luciferase binding studies, HEK293T cells were co-transfected with a miR-542-5p expression vector (pSG5-miR542-5p) in addition to either a wild type (pmiR-GIPR-BS) or mutant (pmiR-GIPR-MUT) vector containing the binding sequence of the GIPR 3´-UTR. Empty vectors (pSG5 and pmiR) served as controls. After 48 hours, decreased luciferase activity indicated binding of miR-542-5p to the 3‘-UTR of the GIPR gene (pmiR-GIPR-BS). No binding was observed for the mutant GIPR binding site (pmiR-GIPR-MUT). Values are means of at least 3 independent experiments ± SEM; significances were calculated by unpaired Student`s t-test. Not significant p-value calculations are not shown. **p<0.01.
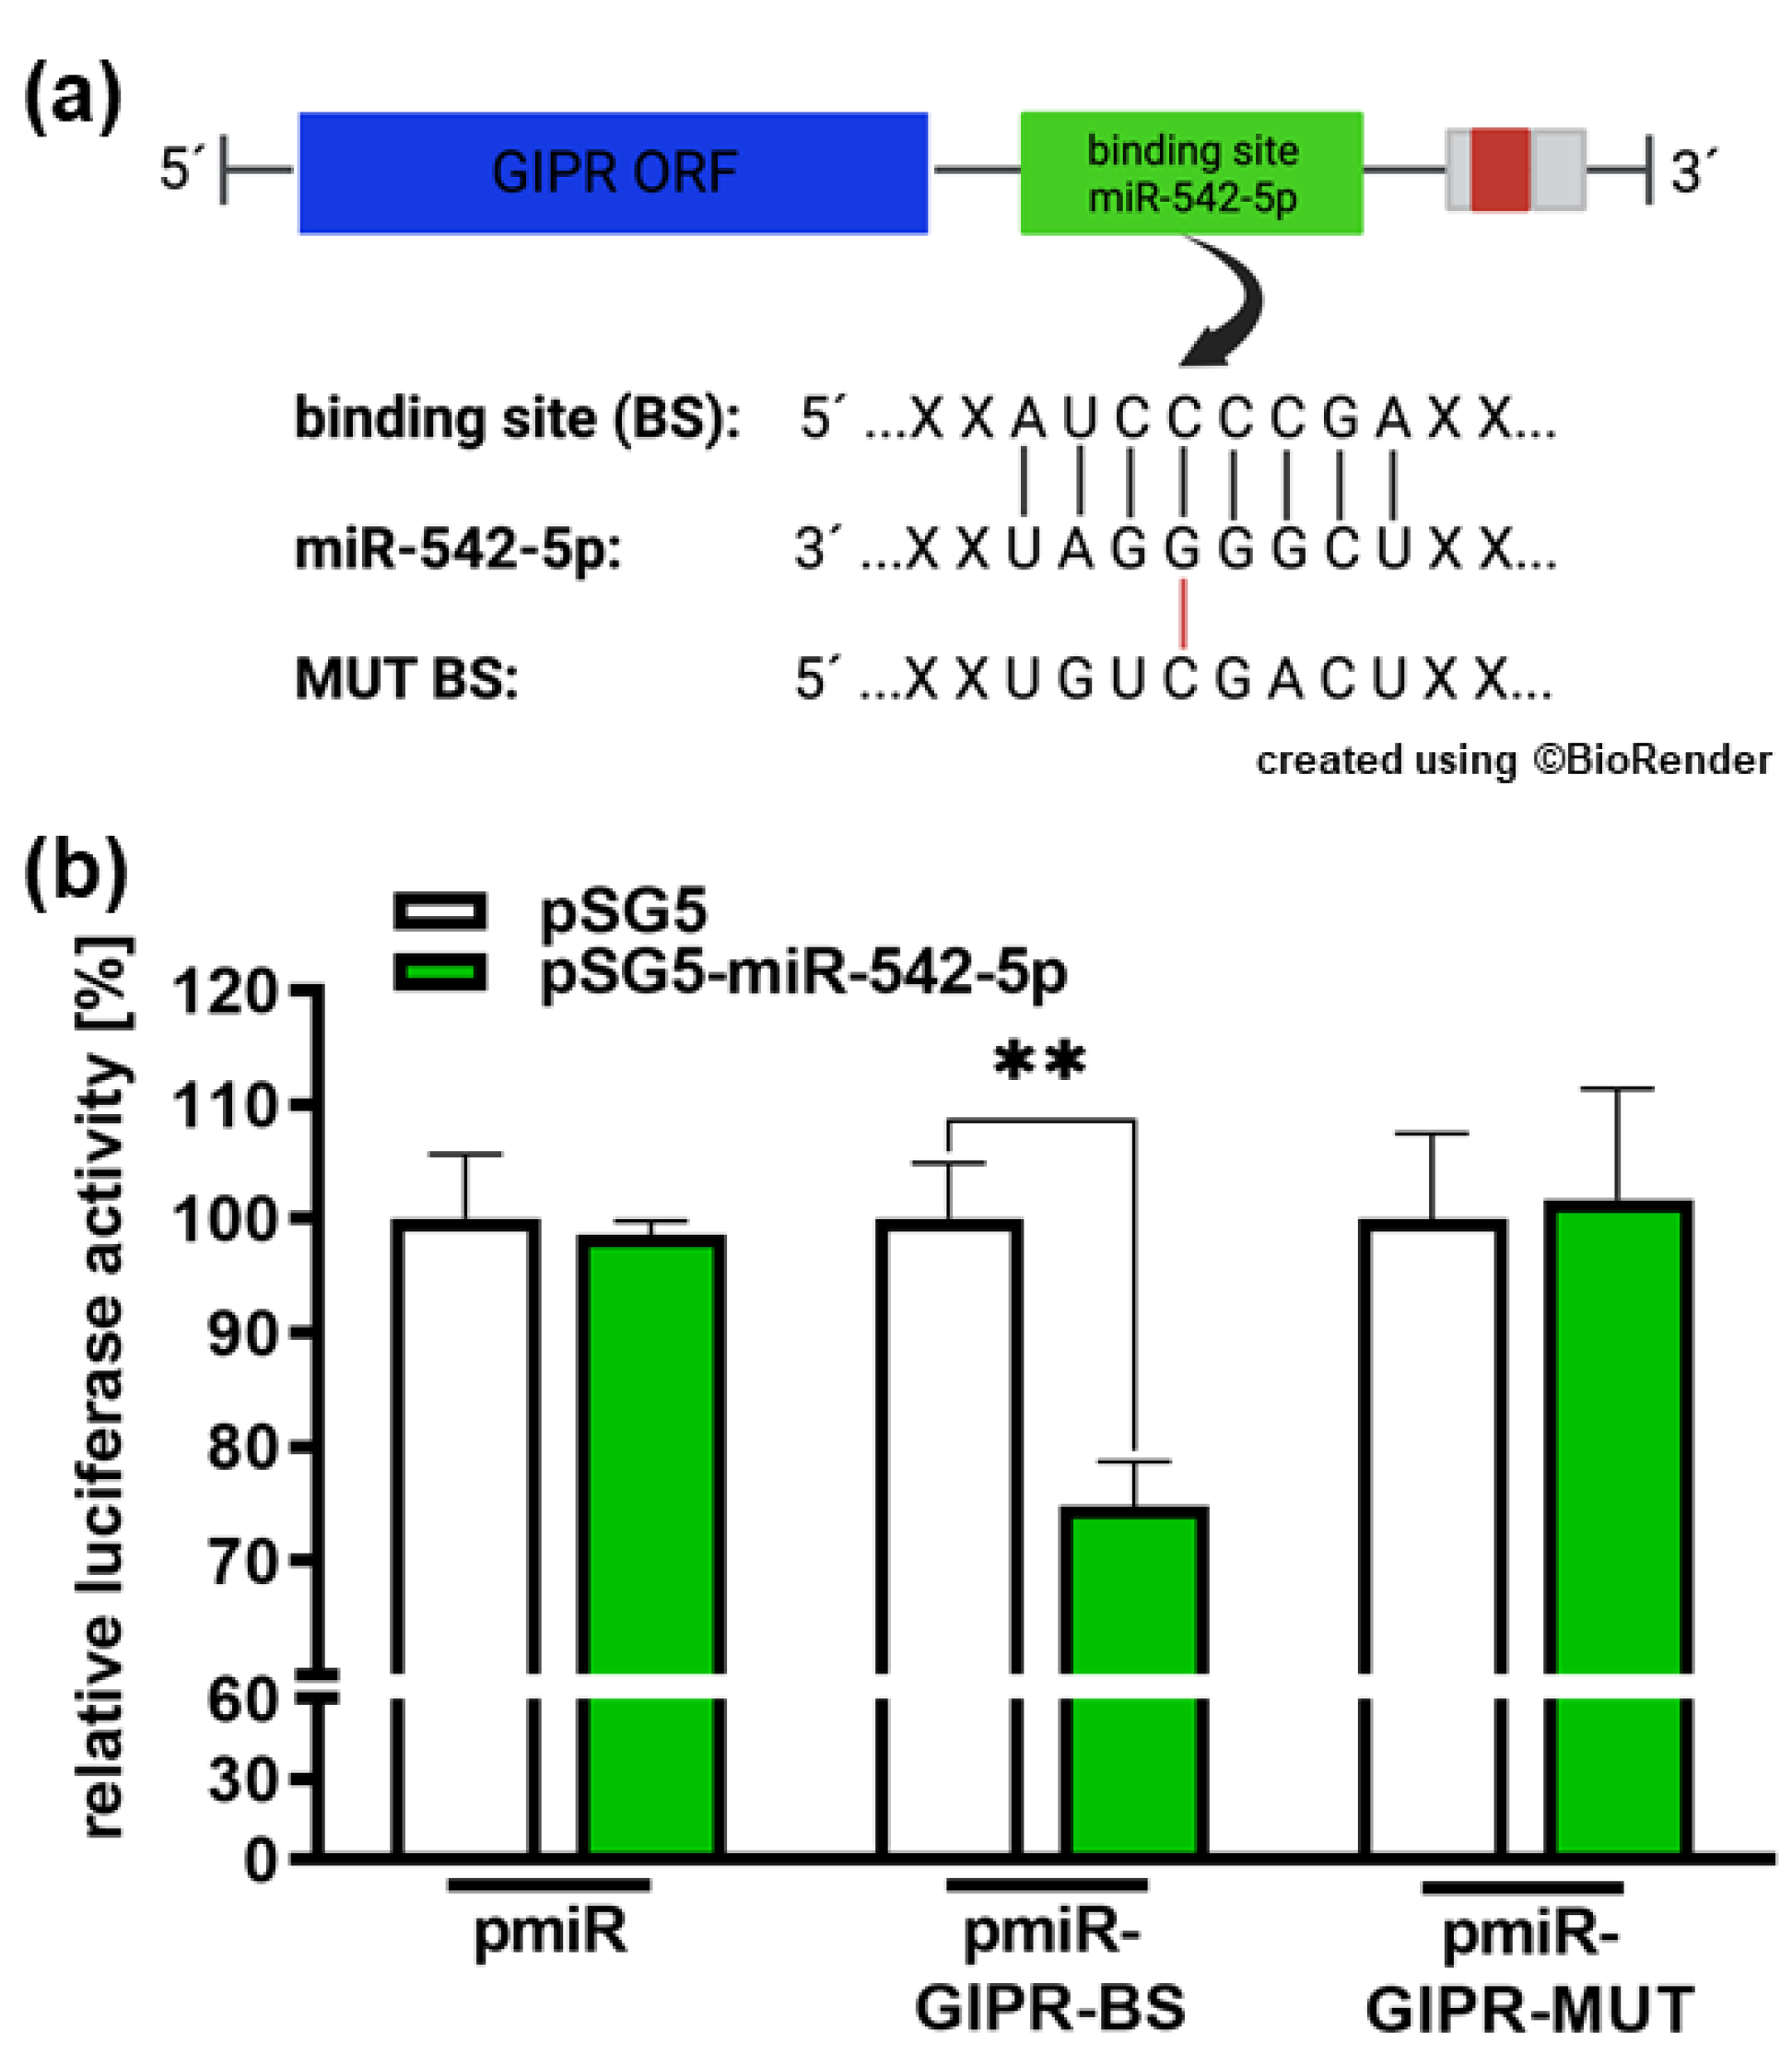
Figure 10.
Expression of tumor related proteins after GIPR overexpression in Weri cells as revealed by human oncology array. Duplicate spots of differentially expressed proteins are shown. Grey-scale intensities were recorded and ratios for control cells vs GIPR overexpressing cells were calculated. CTRL = cells transduced with control vector. GIPR OE = GIPR overexpressing cells.
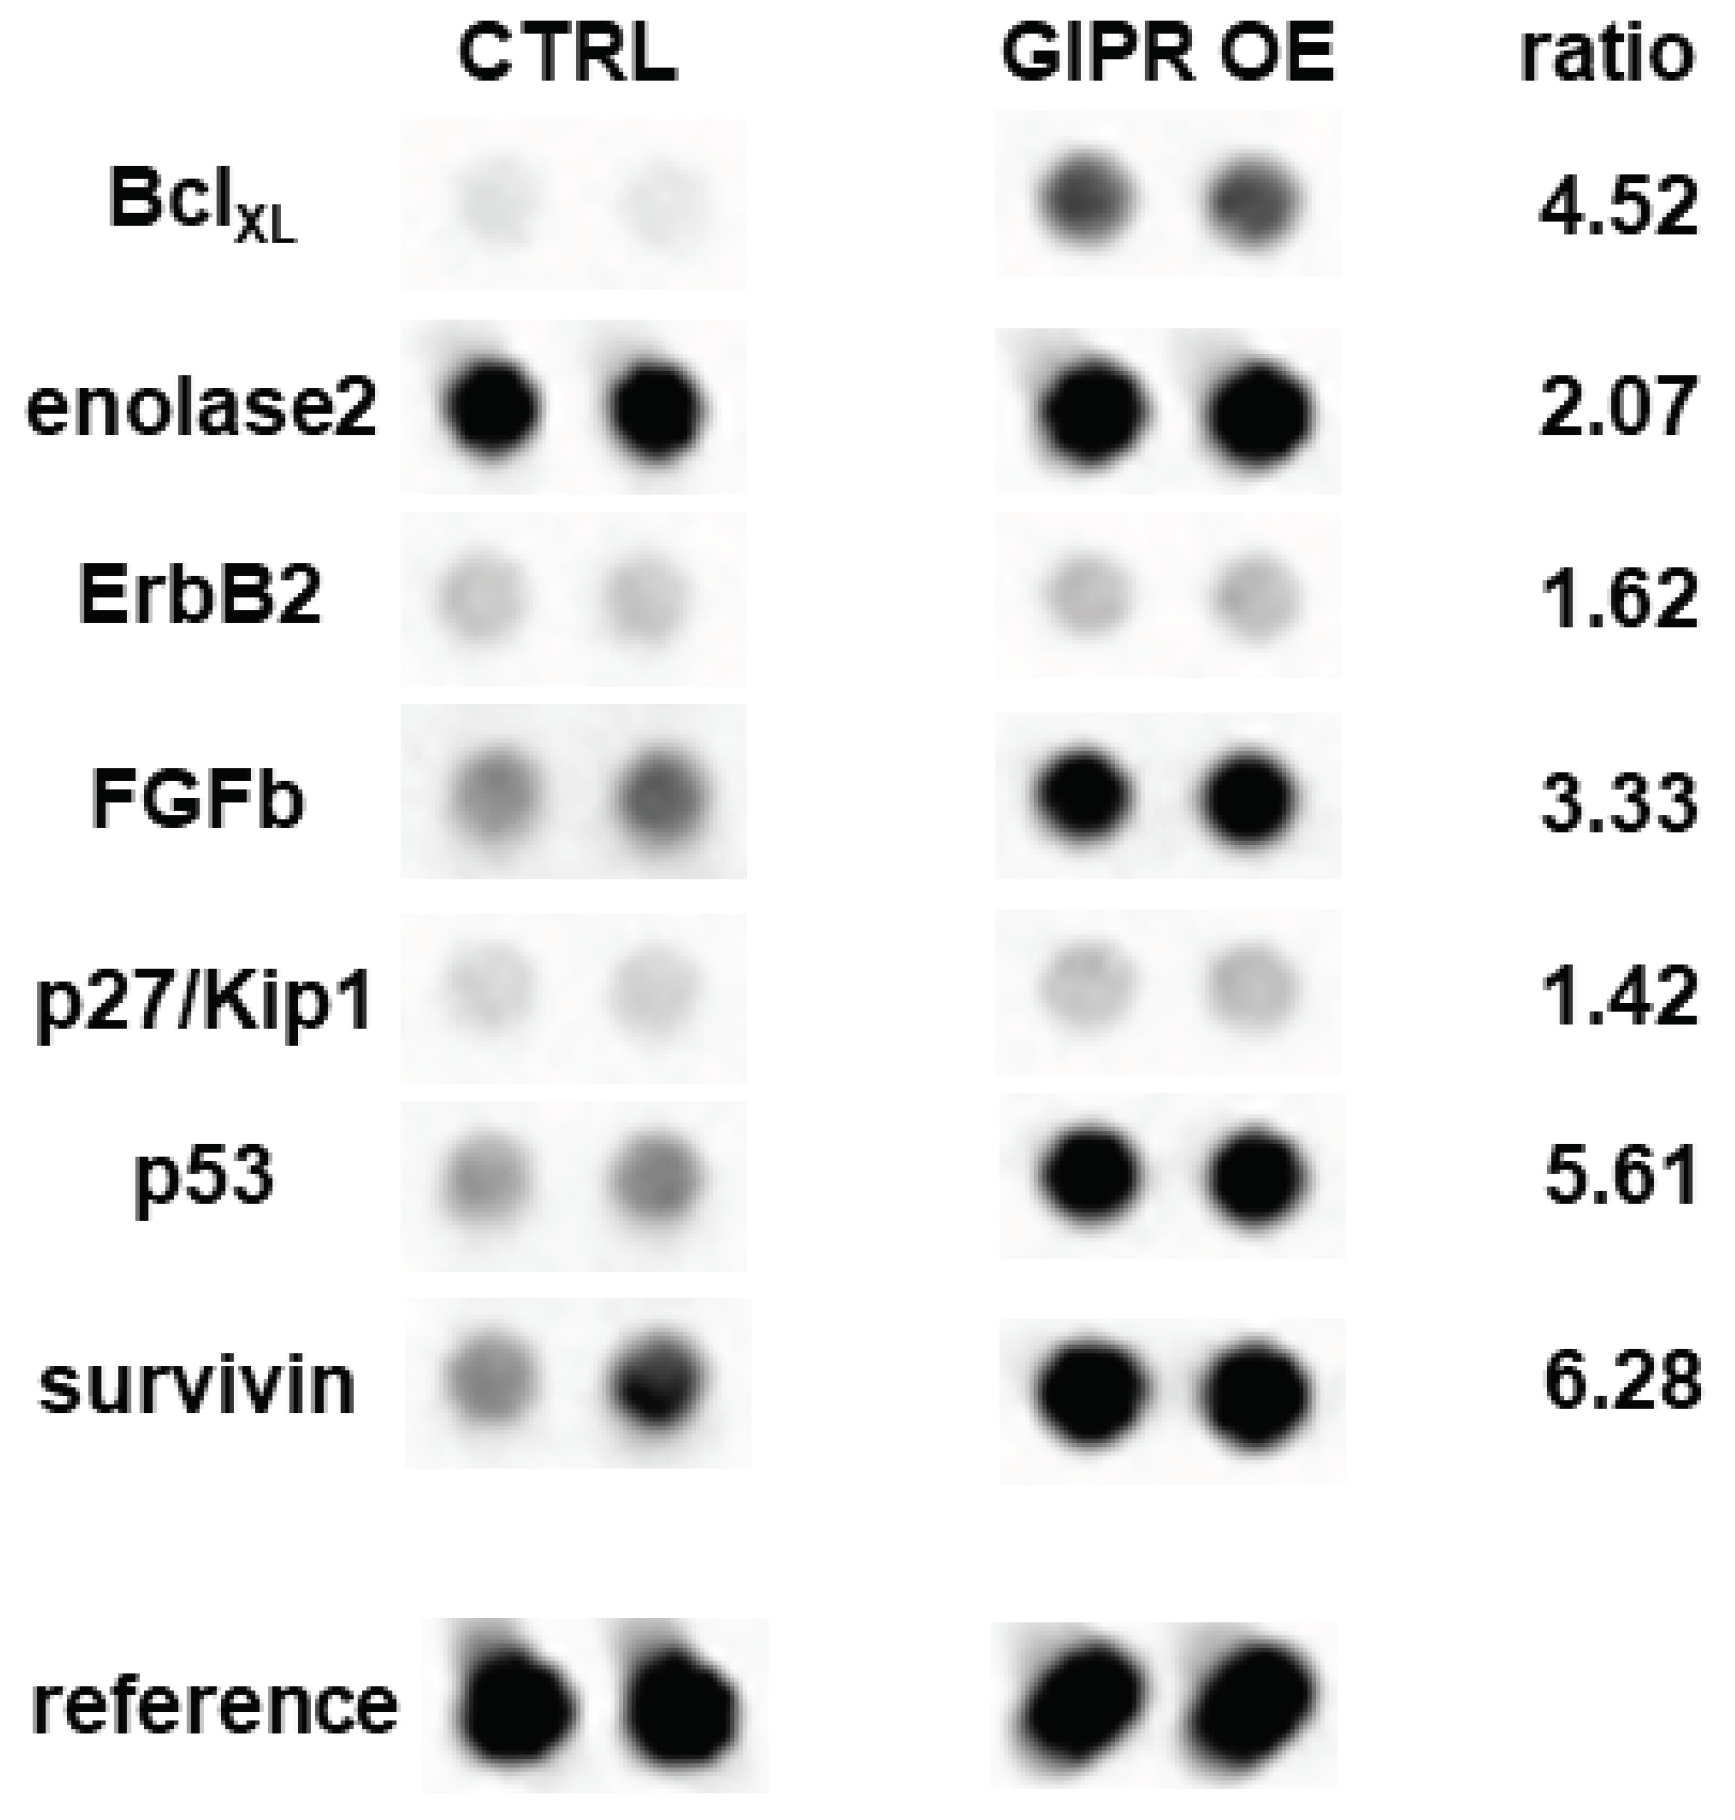

Table 1.
Real-Time PCR primers for GIPR downstream signaling analyses.
| Primer | 5´- 3´ Sequence |
|---|---|
| ENO2 FW | CTACCACCGTCTGAGTCTGC |
| ENO2 RV | CCTTCAGGACACCTTTGCCT |
| ERBB2 FW | GTTCCCGGATTTTTGTGGGC |
| ERBB2 RV | GTGGTACTTCAATTGCGACTCA |
| p27 FW | CTGCAACCGACGATTCTTCT |
| p27 RV | GCATTTGGGGAACCGTCTGA |
| p53 FW | TGTGACTTGCACGTACTCCC |
| p53 RV | ACCATCGCTATCTGAGCAGC |
| survivin FW | TGAGAACGAGCCAGACTTGG |
| survivin RV | TGGTTTCCTTTGCATGGGGT |
| FGFb FW | CCGTTACCTGGCTATGAAGG |
| FGFb RV | AAAGAAACACTCATCCGTAACACA |
Disclaimer/Publisher’s Note: The statements, opinions and data contained in all publications are solely those of the individual author(s) and contributor(s) and not of MDPI and/or the editor(s). MDPI and/or the editor(s) disclaim responsibility for any injury to people or property resulting from any ideas, methods, instructions or products referred to in the content. |
© 2024 by the authors. Licensee MDPI, Basel, Switzerland. This article is an open access article distributed under the terms and conditions of the Creative Commons Attribution (CC BY) license (http://creativecommons.org/licenses/by/4.0/).
Copyright: This open access article is published under a Creative Commons CC BY 4.0 license, which permit the free download, distribution, and reuse, provided that the author and preprint are cited in any reuse.


