
Submitted:
22 March 2024
Posted:
25 March 2024
You are already at the latest version
Abstract
Efficient triaging and referral assessment are critical in ensuring prompt medical intervention in the Community Health Care (CHC) system. However, the existing triaging systems in many Community Health Services are an intensive, time-consuming process and often lack accuracy, particularly for various symptoms that might represent heart failure or other health-threatening conditions. There is a noticeable limit of research papers describing AI technologies for triaging patients. This paper proposes a novel quantitative data-driven approach using machine learning (ML) modelling to improve the community clinical triaging process. Furthermore, this study aims to employ the feature selection process and machine learning power to reduce the triaging process’s waiting time and increase accuracy in clinical decision-making. The model was trained on medical records of “Heart Failure” patients’ dataset, which included demographics, past medical history, vital signs, medications, and clinical symptoms. A comparative study was conducted using the list of machine learning algorithms where XGBoost demonstrated the best performance among other ML models. The triage levels of 2,35,982 patients achieved an accuracy of 99.94%, precision of 0.9986, recall of 0.9958, and f1-score of 0.9972 within 0.059 seconds. The proposed diagnostic model can be implemented for the CHC decision system and be developed further for other medical conditions.
Keywords:
clinical triaging
; machine learning
; community health care triaging
; prediction
; classification
; artificial intelligence
1. Introduction
The healthcare framework in the UK, the National Health Service (NHS), is structured into two overarching components. The first component is responsible for formulating strategies, setting policies, and managing the system, whereas the second primarily focuses on providing medical services [1]. This latter component is further subdivided into three distinct tiers. Primary care encompasses General Practitioners (GPs), Community Health Services, Pharmacists, etc. Secondary care involves hospital-based healthcare accessible through primary care providers. Specialised hospitals provide tertiary care. Primary care professionals have the discretion to refer a patient to another healthcare provider within the primary care (Community Health Services) or to secondary care (Hospitals) if the patient's medical condition demands more specialised treatment or further investigation.
Community health service aims to provide a wide range of services to improve the health and wellness of people from birth to the end of life and allow them to live independently in their own homes by bringing those care closer to home [2]. Therefore, community services work closely with all the primary, secondary, and tertiary care system providers, such as GPs, Pharmacies, and Hospitals. For instance, the hospital determines when it is safe to discharge a person and implements a discharge plan. During this decision-making process, the hospital staff is required to determine whether the person needs to be referred for ongoing care in the community setting after discharge. The community care teams accept referrals from 111, Ambulance service, Rapid access therapy team, falls pickup, GPs, and acute hospitals after discharging patients [3].
Variations in the delivery of services seemed to be proportional to an imbalance between the available capacity and the demand in healthcare systems such as community health services, resulting in extended waiting periods [4]. Efficient triage and referral assessment play a crucial role in ensuring prompt medical intervention to prevent fatalities and disabilities [5]. Nevertheless, the existing manual referral assessment method is time-consuming, and referrals from general practitioners for specific disease conditions, such as heart failure, often lack accuracy due to ambiguous initial symptoms.
According to Kim et al. [6], heart failure (HF) impacts over 900,000 individuals in the United Kingdom, leading to substantial morbidity and mortality, frequent hospital admissions, and a diminished quality of life. Machine learning for heart failure patient triage can provide clinical benefits by improving decision-making in individual care, assessing disease severity [7], and minimising waiting times. The American College of Cardiology suggests crucial in-hospital data components for determining the care and results of heart failure patients [8]. These include demographic information, medical history, current home medications, clinical presentation details, hospitalisation course, laboratory test results, imaging studies, cardiac catheterisation information, administered treatments, and any complications arising during the hospital stay. Primary care professionals record this information in Electronic Health Records using various formats, such as digital notes, handwritten notes, images, videos, emails, and other mediums [9]. The patient records mentioned above can be optimally utilised for training machine learning models to perform the triaging for heart failure patients in community settings through a streamlined feature engineering process, enhancing the data’s quality and relevance for comprehensive analysis.
This study aimed to develop a quantitative data-driven machine learning approach to analyse, sort, and categorise patients according to their medical condition using streamlined feature engineering methods. Also, this research employs three distinct classification algorithms to forecast triaging outcomes, and a retrospective examination is conducted to analyse the predictive performance of these algorithms. The research stages included data preprocessing and feature engineering techniques such as data imputation and normalization, correlation analysis and feature encoding and ranking. The predictive modelling employed several machine learning algorithms for triaging heart failure patients in community health care services.
This paper is conscientiously structured in a way that the readers can logically progress through the research. Section 2 presents the related works discussing the human-based, online, or platform-based, and machine learning-based triaging approaches. Section 3 provides a detailed description of the dataset, data preprocessing techniques and the feature engineering methods used to perform the research. Section 4 is a comprehensive analysis of the outcomes of various classification algorithms where XGBoost demonstrated the highest efficiency in triaging heart failure patients. Section 5 completes the paper with a discussion and future work.
2. Related Works
The research on systematic methods used for triaging patients from prior studies helps categorise those methods into traditional human-based, telephone or online platform-based, and machine learning-based methods. After differentiating these systems, a retrospective survey supports identifying the current gap within each system. This study addresses the identified gaps and contributes valuable insights to the field.
2.1. Human-Based Triage
Health professionals use numerous methods, especially triage nurses across the globe, to prioritize patients at various levels of the treatment process. For example, the Emergency Severity Index is used in the United States of America. The Canadian Triage Acuity Scale is followed in Canada, the Australasian Triage Scale by Australia, and the Manchester Triage Scale is used by many European countries, especially the United Kingdom and Germany [10].
Moxham and McMahon-Parkes [11] conducted a study to estimate the effect of triaging patients referred to an Acute National Health Service Hospital by an advanced nurse practitioner. The study aims to identify whether the waiting time and hospital admissions are reduced after that. Also, the study examines whether it accelerated the critical investigation and treatments through the triaging process performed by an advanced nurse practitioner. The research undertaken by Jennings [12] and Woo, Lee, and Tam [13] discuss the efficacy of employing advanced nurse practitioners to fulfil service requirements. The triage role of advanced nurse practitioners was directed and structured in accordance with the Revised Standards for Quality Improvement Reporting Excellence guidelines [14]. The introduction of advanced nurse practitioners in patient triage roles resulted in a statistically notable decrease in the waiting time for patient evaluation. The limitations include the generalisability of the results as the study is based on the retrospective data collected from the medical records, which also contains heterogeneous samples. Furthermore, the variations in skills and experience of the advanced nurse practitioners who participated in the study are also a limitation. According to Göransson, Persson, and Abelsson [15], experience and knowledge in primary care can vary among nurses, depending on their experience in the field. The research sought to delineate the background of nurses involved in triaging patients at walk-in clinics within primary healthcare centres in Sweden. Most medical professionals can gain expertise through long-term work. In contrast, Machine Learning models can identify patterns and gain understanding quickly, significantly speeding up the decision-making process.
The human-based triage method does have some crucial drawbacks, which include the increase in triage workload when a patient needs to be referred to speciality care. Usually, in a community setting, a specially trained triage nurse is assigned to read and analyse the past medical history, current medications, test/lab results, together with current symptoms of the patient to refer him to special services. The lack of experienced triage nurses and the exponential growth in time needed to assess the patient’s past medical history for decision-making underline the necessity for the implementation of automated, AI-supported triaging systems.
2.2. Telephone or Online Platform-Based Triage
The NHS introduced various methods, such as phone, email, and online triage systems, as an alternative to face-to-face consultation, which indeed increases the workload. Patients can describe their problems through online triage systems, email, or phone. Afterwards, a general practitioner contacts the patient for a telephone consultation or to schedule an in-person appointment if required.
The study conducted by Eccles [16] aimed to investigate usage patterns and gather insights into patients' encounters with an online triage system. In this retrospective study, data routinely collected from all practices utilising the 'askmyGP' platform throughout the study period were analysed using a combination of quantitative and qualitative methods. Patients commonly use the platform for inquiries about medications, reporting specific symptoms, and administrative requests. The number of users registered to the platform is broad. The highest level of users is young patients, which points to the difficulty of elderly people using online platforms.
2.3. Machine Learning-Based Triage
In the study conducted by Raita [17], they employed various machine learning models, including lasso regression, random forest, gradient-boosted decision tree, and deep neural network to predict clinical outcomes. They assessed the outcomes by comparing them qualitatively with the performance of the conventional human-based triaging called Emergency Severity Index (ESI) in the USA. The research concludes that machine learning models displayed excellent predictive performance for hospitalisations and critical care outcomes compared to the conventional reference model.
Levin [18] introduced e-triaging, employing a machine learning model for triage data to predict critical care necessity, emergency procedures, and hospitalisation. The study affirmed the model's accuracy in categorising level 3 patients based on the Emergency Severity Index (ESI). Machine learning's utility in clinical settings allows the classification of patients’ subgroups according to predicted outcomes [19]. The proposed approach ensured stable predictions [20] and facilitated variable selection during model construction, especially for digital health record applications. The model demonstrated superior accuracy in classifying ESI level 3 patients compared to conventional methods, underscoring the potential of predictive analysis in triage decision-making. However, limitations include potential retrospective data entry errors and dependence on a robust and precise electronic health record system.
Few studies have used machine learning in emergency departments in a hospital setting [17]. However, machine learning applications for triaging in community care remain undiscovered. This study concentrates explicitly on triaging heart failure patients in community care. It gives additional perspective to implementing AI-supported triaging technologies for a wider range of diseases.
3. Computational Framework for Processing and Triaging Using Patient Data
The proposed framework with various stages of data processing is represented in Figure 1.
In the initial stage, qualitative research data interpretation [21] was adopted to determine the most necessary variables from the collected dataset, whereas quantitative research, which involved computational and statistical methods [22] for data analysis, was performed through the study. A more detailed description of the implementation stages is provided in the following subsections.
3.1. Medical Dataset
The dataset used for the current study was primarily utilized by Hong [23] for the prediction of hospital admissions to the emergency department. The dataset consists of 560,486 patients recorded that were collected during their hospital visits. The 972 variables in the dataset contain the past medical history, vitals, signs and symptoms, test results and medications.
Variable selection is one of the most critical tasks in the study because the probability of heart failure and other cardiological problems can be determined by multiple factors. The choice of the most powerful variables can increase the heart failure prediction rate and speed up the diagnostic process. The study incorporated several qualitative research techniques to select the majority of informative features and utilize them for predictive modelling.
The feature and model selection steps are explained below.
3.2. Variable Selection Using Qualitative Analysis
The variables from the raw data were grouped into five categories such as “Demographics”, “Past Medical History”, “Vitals”, “Medications” and “Symptoms”. The demographics included age and gender variables. According to Edelmann [24], multiple chronic conditions and death rates in case of heart failure increase with age. The study presented by Coats [25] states that the typical pathophysiology leading to heart failure occurs in older patients. A group of disease conditions that can affect both heart and blood vessels are classified as cardiovascular disease (CVD), thereby including coronary heart disease (CHD), coronary artery disease (CAD), Acute Coronary Vascular Disease (Acute CVD) and many other conditions [26]. As specified by Boateng and Sanborn [27], an Acute Myocardial Infarction (AcuteMI) is a subset of acute coronary syndrome that affects blood vessels and the heart. Also, multiple myeloma [28], hypothyroidism [29], rheumatoid arthritis [30], and hypertension [31] may contribute to heart failure. The Vital signs such as heart rate [32], systolic blood pressure [33], diastolic blood pressure [34], respiratory rate [35], oxygen saturation levels [36] and temperature, respectively, need to be taken into account while diagnosing and triaging a heart failure patient. In compliance with NHS England [37], shortness of breath, breathing difficulty, hypertension, and edema are some of the main symptoms of heart failure, whilst cough, wheezing, and palpitations are less common symptoms. Therefore, the variables related to all the above-mentioned categories were selected to create a “Heart Failure” dataset, which was used in further steps.
3.3. Variable Selection Using Quantitative Analysis
A quantitative analysis method was used to identify more correlated variables among the selected variables. This step involves a correlation matrix to identify the columns that are related to each other. In this study, Spearman’s correlation coefficient, which belongs to a distribution-free rank statistic, was used to measure the strength of the monotonic association between the two [38].
The correlation matrix helped to identify the most correlated variables and create the heart failure dataset from the raw data. It is important to note that the newly created dataset does not include a particular column describing whether the patient has a heart failure or not, or any other columns containing the triage values of a heart failure patient. Thus, only parameters highly correlated and contributing to the development of cardiological problems were included in the dataset. For instance, the column age has a positive correlation with hypertension with a value of 0.53, which is evident that hypertension increases progressively with age [39].
After removing weakly correlated variables using qualitative and quantitative methods, the final heart failure dataset was represented by 25 columns. After the additional feature engineering procedure, these columns were used for the training and testing of the machine learning models.
3.4. Feature Engineering
Nargesian [40] stated that feature engineering involves enhancing the performance of predictive models on a dataset by modifying or transforming its set of features. In this study, the dataset lacks the triage column, which would have given the values after triaging heart failure patients. Therefore, we use feature engineering techniques to create the missing triage column from existing data and then train the machine learning models with the feature-enriched dataset. Prior to the feature engineering, the null value imputation technique was applied to the heart failure dataset. The missing values were imputed using the K-Nearest Neighbour approach. The process of generation of a triage column using the existing variables of different categories of features can be described in the following steps.
3.4.1. Generating Triage Values from Different Categories
In this step, a column for each category was created using a scoring system in each category variable such as “Past Medical History”, “Medication”, and “Symptoms”. Every variable in these categories is based on the Boolean principle. If the patient records show past medical history, medication intake, or indicate any symptom related to cardio-vascular problems, the value of 1 was imputed in the column. Alternatively, the value of 0 demonstrates the absence of the parameters in medical records. The method of assigning scores depends on the number of variables in the category.
Therefore, the score for each variable can be represented with the following equation:
where n is the total number of variables and np is the number of variables with value 1.
sv = 1/n * np
For instance, the “Past Medical History” category consists of four columns with Boolean values. Using the above formula, the triage column for past medical history generates a value of 0.25 if the patient has one medical condition in their past medical history records. If the patient has two medical conditions in the past medical history, then the score calculated will be 0.5. Thus, the output of the feature generation process shows three new columns with triage scores for the categories of past medical history, medications, and symptoms for every patient.
3.4.2. Generating Triage Values Using NEWS2 Score
The National Early Warning Score 2 (NEWS2) serves as the established track and trigger system for evaluating the severity of illness and the potential risk of deterioration in patients undergoing acute health conditions. This system is adopted within the United Kingdom and internationally [41]. It is used as an assessment tool for illness severity and deterioration risk. According to the Royal College of Physicians [42], the NEWS2 is based on a straightforward aggregating approach, which scores the physiological measurements during a routine healthcare check when patient visits a hospital. The scoring system is grounded in six basic physiological parameters including Respiratory Rate, Oxygen Saturation, Systolic Blood Pressure, Pulse Rate, Level of Consciousness, and Temperature.
Each parameter is assigned a score based on its measured value, with the score magnitude indicating the degree of deviation from the norm. For individuals who receive supplemental oxygen to achieve a certain level of oxygen saturation, an additional 2 points are added to the aggregated score. This pragmatic approach highlights a central focus on standardised practices across the entire healthcare system. It underscores the utilisation of physiological parameters that are already routinely assessed in NHS hospitals and prehospital care, documented on a standardised clinical chart known as the NEWS2 chart.
Figure 2 represents the chart of the NEWS2 scoring system consisting of the scores and values of all six parameters. The scoring system is divided into four levels of severity, scoring from 0 to 3. The “vitals” category of the heart failure dataset used in this study contains respiratory rate values, SpO2 Scale values, Air or Oxygen values, systolic blood pressure values, pulse values and temperature. The dataset does not have consciousness values in the vitals category, which is considered one of the dataset’s limitations. However, the dataset includes all six critical parameters used in the NEWS2 scoring system to get better triage results.
Figure 3 represents the clinical response and frequency of monitoring patients depending on the NEWS2 score. If the patient's NEWS2 score is 0, then the patient needs to continue routine NEWS2 monitoring at a frequency of a minimum of 12 hours and needs no triaging at this stage. If the patient's NEWS2 score is between 1 and 4, then the patient needs attention within 4-6 hours. If any single parameter in NEWS2 has a score of 3, then the patient needs to be attended to within 1 hour. Also, a score of a total of 5 needs attention in less than 1 hour. If the NEWS2 score is 7 or more, then the patient needs immediate attention. In such a situation, the registered nurse must report the case to the medical team immediately, and the patient must be continuously monitored for vital signs.
This current research used the NEWS2 scoring system to generate a new column. Subsequently, we compared this column with others created using the scoring system for different categories, aiming to estimate the final triage column. As a result, the final triage column contains three values: a value of 0 indicates the patient as a “low” priority case; a value of 1 shows a “moderate” priority and a value of 2 points to a “high“priority case. The final triage value for each row is determined using four conditions represented below.
- If the value is 1 in any of the three columns, then that patient will be considered a “high” priority case, and the triage_target value will be 1.
- If the total value of three columns is between 0 and 0.25, the patient will be considered a “low” priority case, and the triage_target will be 0.
- If the estimated value of three columns is between 0.25 and 0.75, the patient will be considered a “moderate” priority case, and the triage_target value will be assigned as 1.
- If the estimated value of three columns is greater than 0.7, the patient will be considered a “high” priority case, and the triage_target value will be 2.
3.4.3. Normalisation
Normalisation, the final step of feature engineering, transforms individual features to a unit norm scale to improve a model's performance and stability in training [43]. Using the normalisation technique in feature engineering ensures that all features contribute equally to the model's training process and eliminates the dominance of features with larger values.
In this study, the dataset of 26 variables, including the triage column, created using the feature engineering process undergoes normalisation. Normalisation scales all the numerical values in the column within the range between 0 and 1. It helps to avoid biased model performances and difficulties in the learning process.

Table 1.
Derived heart failure dataset.
| Variable Name | Description | DataType |
|---|---|---|
| age | Age of the patient (Demographics) | float64 |
| gender | Gender of the patient (Demographics) | int64 |
| acutecvd | Acute Coronary Vascular Diseases (PMH*) | int64 |
| acutemi | Acute Myocardial Infraction (PMH) | int64 |
| coronathero | Coronary Atherosclerosis (PMH) | int64 |
| htn | Hypertension, high blood pressure in patient’s medical history (PMH) | int64 |
| triage_vital_hr | Heart Rate, a vital sign for triaging (Vitals) | int64 |
| triage_vital_sbp | Systolic Blood Pressure (Vitals) | int64 |
| triage_vital_dbp | Diastolic Blood Pressure (Vitals) | float64 |
| triage_vital_rr | Respiratory Rate (Vitals) | int64 |
| triage_vital_o2 | Oxygen levels in Blood (Vitals) | int64 |
| triage_vital_o2_device | Oxygen device needed for patient, Boolean Field (Vitals) | int64 |
| triage_vital_temp | Temperature value of patient (Vitals) | float64 |
| meds_cardiacdrugs | Cardiac drugs used by patients (Medications) | int64 |
| meds_cardiovascular | Cardiovascular drugs used by patients (Medications) | int64 |
| meds_diuretics | Diuretics medicines used by patients (Medications) | int64 |
| cc_chesttightness | Chest Tightness, a symptom of heart failure (Symptoms) | int64 |
| cc_cough | Cough, a symptom of heart failure (Symptoms) | int64 |
| cc_dyspnea | Dyspnea, a sensation of running out of air or shortness of breath (Symptoms) | int64 |
| cc_edema | Edema, swelling caused by fluid inside body tissues (Symptoms) | int64 |
| cc_hypertension | Hypertension, high blood pressure as symptoms (Symptoms) | int64 |
| cc_legswelling | Leg swelling caused by fluid build-up (Symptoms) | int64 |
| cc_palpitations | Heart Palpitations, feelings of having a fast-beating or pounding heart (Symptoms) | int64 |
| cc_tachycardia | Tachycardia, increased heart rate (Symptoms) | int64 |
| cc_wheezing | Wheezing is a sign of a breathing problem (Symptoms) | int64 |
| triage_target | Target columns with triage values derived from the above fields. | int64 |
* PMH is Past Medical History.
Furthermore, after normalisation, the dataset was divided into training and testing parts. The training part included two categories of data: train_data, of 26 columns and target_data with the final triage column. Some classification algorithms do not accept decimal values as classes; therefore, the final triage column was labelled. After the label encoding process, the train_data and target_data were split into two different datasets, where 80% of the data was used for training and 20% was used for testing.
3.5. Model Selection and Training
This study can be considered in the classification problem category because it aimed to classify the patients with three stages of triaging depending on the severity of the condition. Therefore, the model learned how to separate new observations into three stages of triaging with low, medium, and high priorities. Extreme Gradient Boosting (XGBoost) machine learning algorithm was chosen as the classification approach for the current cardiological problem. XGBoost is a gradient-boosting technology that utilises an inclination-boosting system based on a decision tree [44]. The choice of the algorithm was based on the state-of-the-art literature applied to similar problems [45]. For the performance comparison, the additional tests were utilized with K-Nearest Neighbour (KNN), Gaussian Naïve Bayes (GNB), and Decision Tree (DTC) classification algorithms.
4. Results and Analysis
This chapter presents a comparative study of the results generated by XGBoost and other algorithms for multi-class classification. The performance metrics such as accuracy, precision, f1-score, and recall were calculated from the confusion matrix.
The predicated and test data have three classes that represent “low”, “medium”, and “high” priorities in triaging outputs. The “low” priority is represented by a value of 0, the “medium” priority has a value of 1, and the “high” priority is denoted by a value of 2, respectively.
4.1. Analysing Results of XGBoost
As mentioned above, the XGBoost machine learning model was chosen to triage patients with cardiological conditions.
Table 2 describes the evaluation measures, which help identify the machine learning model's efficiency in predicting Class 0, 1, and 2 patients.
For Class 0, the sensitivity of the model is 1.000, and the specificity is 0.9970. The precision, accuracy, and F1-score are 0.9996, 0.9996 and 0.9998, respectively. The other values, such as Negative Predictive value, False Positive Rate, False Discovery rate and False Negative rate, are 0.9998, 0.0030, 0.0004 and 0.0000, respectively. The False Positive rate, False Discovery rate and False Negative rate are close to zero, which indicates the high model’s performance in predicting class 0.
The sensitivity and specificity for Class 1 prediction are 0.9966 and 0.9998, respectively. The precision, accuracy and F1-score are 0.9987, 0.9995 and 0.9976. Finally, the Negative Predictive value, False Positive Rate, False Discovery Rate and False Negative Rate are 0.9996, 0.0002, 0.0013 and 0.0034 respectively. The values False Discovery Rate, False Negative Rate, and False Positive Rate in predicting Class 1 are close to zero and indicate a very high precision for the detection of Class 1.
The sensitivity and specificity metrics for Class 2 prediction are 0.9909 and 1.0000. The precision, accuracy and F1-score calculated from the confusion matrix of Class 2 are 0.9977, 0.9998 and 0.9943, respectively. Finally, the Negative Predictive Value, False Positive Rate and False Discovery Rate derived from the confusion matrix of Class 2 are 0.9998, 0, 0.0023 and 0.0091. Here, the False Positive Rate, False Discovery Rate and False Negative Rate are close to zero or have zero value. It demonstrates the efficiency of XGBoost classified in the detection of “high” priority Class 2.
The performance metrics obtained for the above three classes prove the efficiency of the XGBoost classification model in triaging cardiological patients into “low”, “medium”, and “high” priority groups.
4.2. Comparison of XGBoost Results with Other Classification Algorithms
In this chapter, a comparative analysis was performed, contrasting the outcomes of XGBoost with those of other classification algorithms such as KNN, GNB, and DTA.
The KNN is a non-parametric, supervised learning classifier [46]. It relies on proximity to categorise or forecast the grouping of a given data point. The KNN algorithm exhibits an accuracy of 96.84%, indicating its effectiveness in correctly predicting outcomes. The precision of 0.9068 indicates the model's efficiency in identifying positive instances among its predictions, and the recall of 0.7084 demonstrates its capability to capture a substantial portion of actual positive instances. The F1-score of 0.7602, combining the precision and recall, further signifies the overall balanced performance of the KNN algorithm in classifying the priorities in the “Heart Failure” data. However, the XGBoost algorithm showcases even higher accuracy, precision, recall and F1-score values than the KNN algorithm.
The Naïve Bayes (NB) algorithm, a probabilistic machine learning technique rooted in Bayes' theorem, finds extensive use in various classification tasks. GNB serves as an extension of the original NB algorithm. The GNB predicted the results with an accuracy of 89.41%, which is lower than the accuracy of the XGBoost. Likewise, the precision, recall, and f1-score metrics, which are 0.6122, 0.7675, and 0.6612, respectively, also fall below the corresponding values achieved by XGBoost.
A DTA is a non-parametric supervised learning algorithm applicable to both classification and regression tasks. It adopts a hierarchical structure resembling a tree, encompassing a root node, branches, internal nodes, and leaf nodes. The output produced by Decision Tree obtained an accuracy of 99.68, closely approaching the accuracy achieved by XGBoost, which is 99.94%. In addition to that, evaluation parameters such as precision (0.9756), recall (0.9704), and f1 score (0.9730) fall behind the corresponding values attained by XGBoost.
Table 3 summarizes the Specificity, Sensitivity, Precision, Negative Prediction value, False Positive Rate, False Discovery rate, False Negative rate, Accuracy and F1-score of individual classes of the classification algorithm used for the comparative study.
Figure 4 provides a graphical comparison of 4 classification models in terms of the accuracy, precision, recall, and f1-score.
Consequently, based on the assessment, XGBoost's predictions outperformed the performance of all other machine learning models used for comparison. The evaluation indicates that the predictions generated by GNB and KNN exhibited relatively poor performance. In contrast, the DTA approach demonstrated performance closely resembling that of XGBoost.
5. Discussion and Conclusion
There is a significant need to implement AI-driven triaging systems in local healthcare services. In the community, triaging is a routine event that health workers follow at every level. It occurs when a new patient is discharged and transferred to a community setting or when a nurse visits a patient.
The study aimed to classify cardiological patients into certain levels of triaging using machine learning methods. The quantitative variable selection method involved utilising the correlation matrix with the data pre-processing stage, including null value imputation techniques and a data normalization approach.
Subsequently, the pre-processed dataset underwent feature engineering stages to establish the triage column and was prepared for training using the XGBoost algorithm. The trained model's outcomes were evaluated against those of other classification algorithms trained on the same dataset.
The examination of evaluation metrics led to the conclusion that the XGBoost machine learning algorithm yields the most favourable outcomes in triaging cardiological patients, including the “high” priority class with symptoms of heart failure. Moreover, the computed evaluation parameters for each class, specifically for “low”, “medium”, and “high” levels of triaging, demonstrated the superior performance of XGBoost compared to other machine learning algorithms.
The approach used in this study can help healthcare professionals reduce triage time and focus on the immediate treatment of patients. XGBoost's processing time for triaging 2,35,982 patients is remarkably swift, at 0.059 seconds, showcasing a level of efficiency that far surpasses that achievable by a human-based triage model.
The study’s findings can be adapted not only to emergency healthcare services but also to be implemented wider in healthcare communities. While several studies described machine learning for triaging patients in emergency departments, there is a noticeable lack of research using machine learning for triaging patients in local community health care providers. Limited studies represented a triaging approach joining primary and secondary healthcare. For instance, Wang et al. [5] performed a study on unstructured data to improve triaging of early inflammatory arthritis (EIA) patients from primary care to secondary care using a heterogeneous machine learning model. The research team used a data-driven hybrid approach to triage EIA patients using the referral letters from the GPs and blood test results.
However, the primary limitation in this study pertained to the dataset, as the dataset used in this study encompasses 970 variables of clinical data from patients, which is not specifically tailored to heart failure patients. Furthermore, the derived dataset for heart failure patients from the raw dataset, which has 970 variables, contains a wide range of null values and impurities. Certain crucial variables, such as test results, could not be considered in the study due to a substantial number of null values and impurities associated with them. The second major limitation is the absence of a triage column in the dataset. Thus, creating a triage column was one of the main stages of the current study.
Thus, we can conclude that the study successfully accomplished its stated objective by addressing various challenges encountered. Depending on access to the appropriate datasets, the proposed approach can be iterated to various medical conditions. Moreover, the calculation of the NEWS2 score, along with other approaches used in this study, can be used together to classify and triage other medical conditions. The XGBoost algorithm can be a method of choice for triaging purpose.
Author Contributions
Conceptualization, B.S..; methodology, B.S and N.H.; software, B.S.; validation, B.S.; formal analysis, B.S.; investigation, B.S.; resources, B.S.; data curation, B.S.; writing—original draft preparation, B.S.; writing—review and editing, N.H.; visualization, B.S. and N.H.; supervision, N.H.; project administration, N.H. All authors have read and agreed to the published version of the manuscript.
Funding
This research received no external funding.
Data Availability Statement
Data supporting reported results can be found via the following link: https://www.kaggle.com/datasets/maalona/hospital-triage-and-patient-history-data.
Conflicts of Interest
The authors declare no conflicts of interest.
References
- Grosios, K.; Gahan, P. B.; Burbidge, J. Overview of Healthcare in the UK. EPMA Journal 2010, 1 (4), 529–534. [CrossRef]
- NHS England. What are community health services. Available online: https://www.england.nhs.uk/community-health-services/what-are-community-health-services/ (accessed on 23 October 2023).
- The Community Network. Aligning primary and community care Bromley Healthcare. Available online: https://www.nhsconfed.org/case-studies/aligning-primary-and-community-care (accessed on 23 October 2023).
- Kay, L.; Lanyon, P. Rheumatology GRIFT Programme National Specialty Report Available online: https://gettingitrightfirsttime.co.uk/medical_specialties/rheumatology/ (accessed on 23 October 2023).
- Wang, B.; Li, W.; Bradlow, A.; Bazuaye, E.; Chan, A. T. Y. Improving Triaging from Primary Care into Secondary Care Using Heterogeneous Data-Driven Hybrid Machine Learning. Decision Support Systems 2022, 113899. [CrossRef]
- Kim, D.; Hayhoe, B.; Aylin, P.; Bottle, A. Health Service Use by Community-Dwelling Patients with Heart Failure in Northwest London, 2015–18: A Retrospective Cohort Analysis. The Lancet 2019, 394, S64. [CrossRef]
- Battineni, G.; Sagaro, G. G.; Chinatalapudi, N.; Amenta, F. Applications of Machine Learning Predictive Models in the Chronic Disease Diagnosis. Journal of Personalized Medicine 2020, 10 (2). [CrossRef]
- Cannon, C. P.; Battler, A.; Brindis, R. G.; Cox, J. L.; Ellis, S. G.; Every, N. R.; Flaherty, J. T.; Harrington, R. A.; Krumholz, H. M.; Simoons, M. L.; et al. American College of Cardiology Key Data Elements and Definitions for Measuring the Clinical Management and Outcomes of Patients with Acute Coronary Syndromes A report of the American College of Cardiology Task Force on Clinical Data Standards (Acute Coronary Syndromes Writing Committee) Endorsed by the American Association of Cardiovascular and Pulmonary Rehabilitation, American College of Emergency Physicians, American Heart Association, Cardiac Society of Australia & New Zealand, National Heart Foundation of Australia, Society for Cardiac Angiography and Interventions, and the Taiwan Society of Cardiology. Journal of the American College of Cardiology 2001, 38 (7), 2114–2130. [CrossRef]
- NHS England. Purpose of the GP Electronic Health Records Available online: https://www.england.nhs.uk/long-read/purpose-of-the-gp-electronic-health-record/ (accessed on 26 October 2023).
- Peta, D.; Day, A.; Lugari, W. S.; Gorman, V.; Ahayalimudin, N.; Pajo, V. M. T. Triage: A Global Perspective. Journal of Emergency Nursing 2023, 49 (6), 814–825. [CrossRef]
- Moxham, L.; McMahon-Parkes, K. An Evaluation of the Impact of Advanced Nurse Practitioner Triage and Clinical Intervention for Medically Expected Patients Referred to an Acute National Health Service Hospital. Journal of Clinical Nursing 2020, 29 (19-20), 679–3686. [CrossRef]
- Jennings, N.; Clifford, S.; Fox, A. R.; O’Connell, J.; Gardner, G. The Impact of Nurse Practitioner Services on Cost, Quality of Care, Satisfaction and Waiting Times in the Emergency Department: A Systematic Review. International Journal of Nursing Studies 2015, 52 (1), 421–435. [CrossRef]
- Woo, B. F. Y.; Lee, J. X. Y.; Tam, W. W. S. The Impact of the Advanced Practice Nursing Role on Quality of Care, Clinical Outcomes, Patient Satisfaction, and Cost in the Emergency and Critical Care Settings: A Systematic Review. Human Resources for Health 2018, 15 (1), 1–22. [CrossRef]
- SQUIRE. Revised Standards for Quality Improvement Reporting Excellence SQUIRE 2.0. Available online: https://www.squire-statement.org/index.cfm?fuseaction=Page.ViewPage&PageID=471 (accessed on 28 October 2023).
- Göransson, M.; Persson, A.-C.; Abelsson, A. Triage in Primary Healthcare. Nordic Journal of Nursing Research 2020, 40 (4), 213–220. [CrossRef]
- Eccles, A.; Hopper, M.; Turk, A.; Atherton, H. Patient Use of an Online Triage Platform: A Mixed-Methods Retrospective Exploration in UK Primary Care. British Journal of General Practice 2019, 69 (682), e336–e344. [CrossRef]
- Raita, Y.; Goto, T.; Faridi, M. K.; Brown, D. F. M.; Camargo, C. A.; Hasegawa, K. Emergency Department Triage Prediction of Clinical Outcomes Using Machine Learning Models. Critical Care 2019, 23 (1). [CrossRef]
- Levin, S.; Toerper, M.; Hamrock, E.; Hinson, J. S.; Barnes, S.; Gardner, H.; Dugas, A.; Linton, B.; Kirsch, T.; Kelen, G. Machine-Learning-Based Electronic Triage More Accurately Differentiates Patients with Respect to Clinical Outcomes Compared with the Emergency Severity Index. Annals of Emergency Medicine 2018, 71 (5), 565-574.e2. [CrossRef]
- Rokach, L. Ensemble-Based Classifiers. Artificial Intelligence Review 2009, 33 (1-2), 1–39. [CrossRef]
- Austin, P. C.; Tu, J. V.; Ho, J. E.; Levy, D.; Lee, D. S. Using Methods from the Data-Mining and Machine-Learning Literature for Disease Classification and Prediction: A Case Study Examining Classification of Heart Failure Subtypes. Journal of Clinical Epidemiology 2013, 66 (4), 398–407. [CrossRef]
- Gelo, O.; Braakmann, D.; Benetka, G. Quantitative and Qualitative Research: Beyond the Debate. Integrative Psychological and Behavioral Science 2008, 42 (3), 266–290. [CrossRef]
- Ahmad, S.; Wasim, S.; Irfan, S.; Gogoi, S.; Srivastava, A.; Farheen, Z. Qualitative V/S. Quantitative Research - a Summarized Review. Journal of Evidence Based Medicine and Healthcare2019, 6 (43), 2828–2832. [CrossRef]
- Hong, W. S.; Haimovich, A. D.; Taylor, R. A. Predicting Hospital Admission at Emergency Department Triage Using Machine Learning. PLOS ONE 2018, 13 (7), e0201016. [CrossRef]
- Edelmann, F. Epidemiology and prognosis of heart failure. Herz 2015, 40 (2), 176–184. [CrossRef]
- Coats, A. J. S. Ageing, Demographics, and Heart Failure. European Heart Journal Supplements 2019, 21 (Supplement_L), L4–L7. [CrossRef]
- Sanchis-Gomar, F.; Perez-Quilis, C.; Leischik, R.; Lucia, A. Epidemiology of Coronary Heart Disease and Acute Coronary Syndrome. Annals of Translational Medicine 2016, 4 (13), 256–256. [CrossRef]
- Boateng, S.; Sanborn, T. Acute Myocardial Infarction. Disease-a-Month 2013, 59 (3), 83–96. [CrossRef]
- Plummer, C.; Driessen, C.; Szabo, Z.; Mateos, M.-V. Management of Cardiovascular Risk in Patients with Multiple Myeloma. 2019, 9 (3). [CrossRef]
- Udovcic, M.; Pena, R. H.; Patham, B.; Tabatabai, L.; Kansara, A. Hypothyroidism and the Heart. Methodist DeBakey Cardiovascular Journal 2017, 13 (2), 55–59. [CrossRef]
- Ahlers, M. J.; Lowery, B. D.; Farber-Eger, E.; Wang, T. J.; Bradham, W.; Ormseth, M. J.; Chung, C. P.; Stein, C. M.; Gupta, D. K. Heart Failure Risk Associated with Rheumatoid Arthritis–Related Chronic Inflammation. Journal of the American Heart Association 2020, 9 (10). [CrossRef]
- Lalande, S.; Johnson, D. B. Diastolic Dysfunction: A Link between Hypertension and Heart Failure. Drugs of Today 2008, 44 (7), 503. [CrossRef]
- Komajda, M. Heart Rate in Chronic Heart Failure: An Overlooked Risk Factor. European Heart Journal 2014, 36 (11), 648–649. [CrossRef]
- Raphael, C. E.; Whinnett, Z. I.; Davies, J. E.; Fontana, M.; Ferenczi, E. A.; Manisty, C. H.; Mayet, J.; Francis, D. P. Quantifying the Paradoxical Effect of Higher Systolic Blood Pressure on Mortality in Chronic Heart Failure. Heart 2009, 95 (1), 56–62. [CrossRef]
- Tsujimoto, T.; Kajio, H. Low Diastolic Blood Pressure and Adverse Outcomes in Heart Failure with Preserved Ejection Fraction. International Journal of Cardiology 2018, 263, 69–74. [CrossRef]
- Forleo, G. B.; Santini, L.; Campoli, M.; Malavasi, M.; Scaccia, A.; Menichelli, M.; Riva, U.; Lamberti, F.; Carreras, G.; Orazi, S.; et al. Long-Term Monitoring of Respiratory Rate in Patients with Heart Failure: The Multiparametric Heart Failure Evaluation in Implantable Cardioverter-Defibrillator Patients (MULTITUDE-HF) Study. Journal of Interventional Cardiac Electrophysiology: An International Journal of Arrhythmias and Pacing 2015, 43 (2), 135–144. [CrossRef]
- Masip, J.; Gayà, M.; Páez, J.; Betbesé, A.; Vecilla, F.; Manresa, R.; Ruíz, P. Pulse Oximetry in the Diagnosis of Acute Heart Failure. Revista Española de Cardiología (English Edition) 2012, 65(10), 879–884. [CrossRef]
- NHS England. Symptoms Heart Failure. Available online: https://www.nhs.uk/conditions/heart-failure/symptoms/ (accessed on 28 October 2023).
- Hauke, J.; Kossowski, T. Comparison of Values of Pearson’s and Spearman’s Correlation Coefficients on the Same Sets of Data. Quaestiones Geographicae 2011, 30 (2), 87–93. [CrossRef]
- Borzecki, A.; Glickman, M.; Kader, B.; Berlowitz, D. The Effect of Age on Hypertension Control and Management. American Journal of Hypertension 2006, 19 (5), 520–527. [CrossRef]
- Nargesian, F.; Samulowitz, H.; Khurana, U.; Khalil, E. B.; Turaga, D. Learning Feature Engineering for Classification. Proceedings of the Twenty-Sixth International Joint Conference on Artificial Intelligence 2017, 17, 2529-2535. [CrossRef]
- Welch, J.; Dean, J.; Hartin, J. Using NEWS2: An Essential Component of Reliable Clinical Assessment. Clinical Medicine 2022, 22 (6), 509–513. [CrossRef]
- Royal College of Physicians. National Early Warning Score (NEWS) 2. Available online: https://www.rcplondon.ac.uk/projects/outputs/national-early-warning-score-news-2 (accessed on 3 November 2023).
- Scikit Learn. Preprocessing Data. Available online: https://scikit-learn.org/0.15/modules/preprocessing.html#normalization (acccessed on 5 November 2023).
- Azmi, S.S.; Baliga, S. An overview of boosting decision tree algorithms utilising AdaBoost and XGBoost boosting strategies, Int. Res. J. Eng. Technol, 2020, 7(5).
- Swaminathan, S.; Qirko, K.; Smith, T.; Corcoran, E.; Wysham, N. G.; Bazaz, G.; Kappel, G.; Gerber, A. N. A Machine Learning Approach to Triaging Patients with Chronic Obstructive Pulmonary Disease. PloS One 2017, 12 (11), e0188532. [CrossRef]
- IBM. What is the k-nearest neighbors (KNN) algorithm? Available online: https://www.ibm.com/topics/knn (accessed on 10 November 2023).
Figure 1.
Framework of clinical triaging using machine learning.
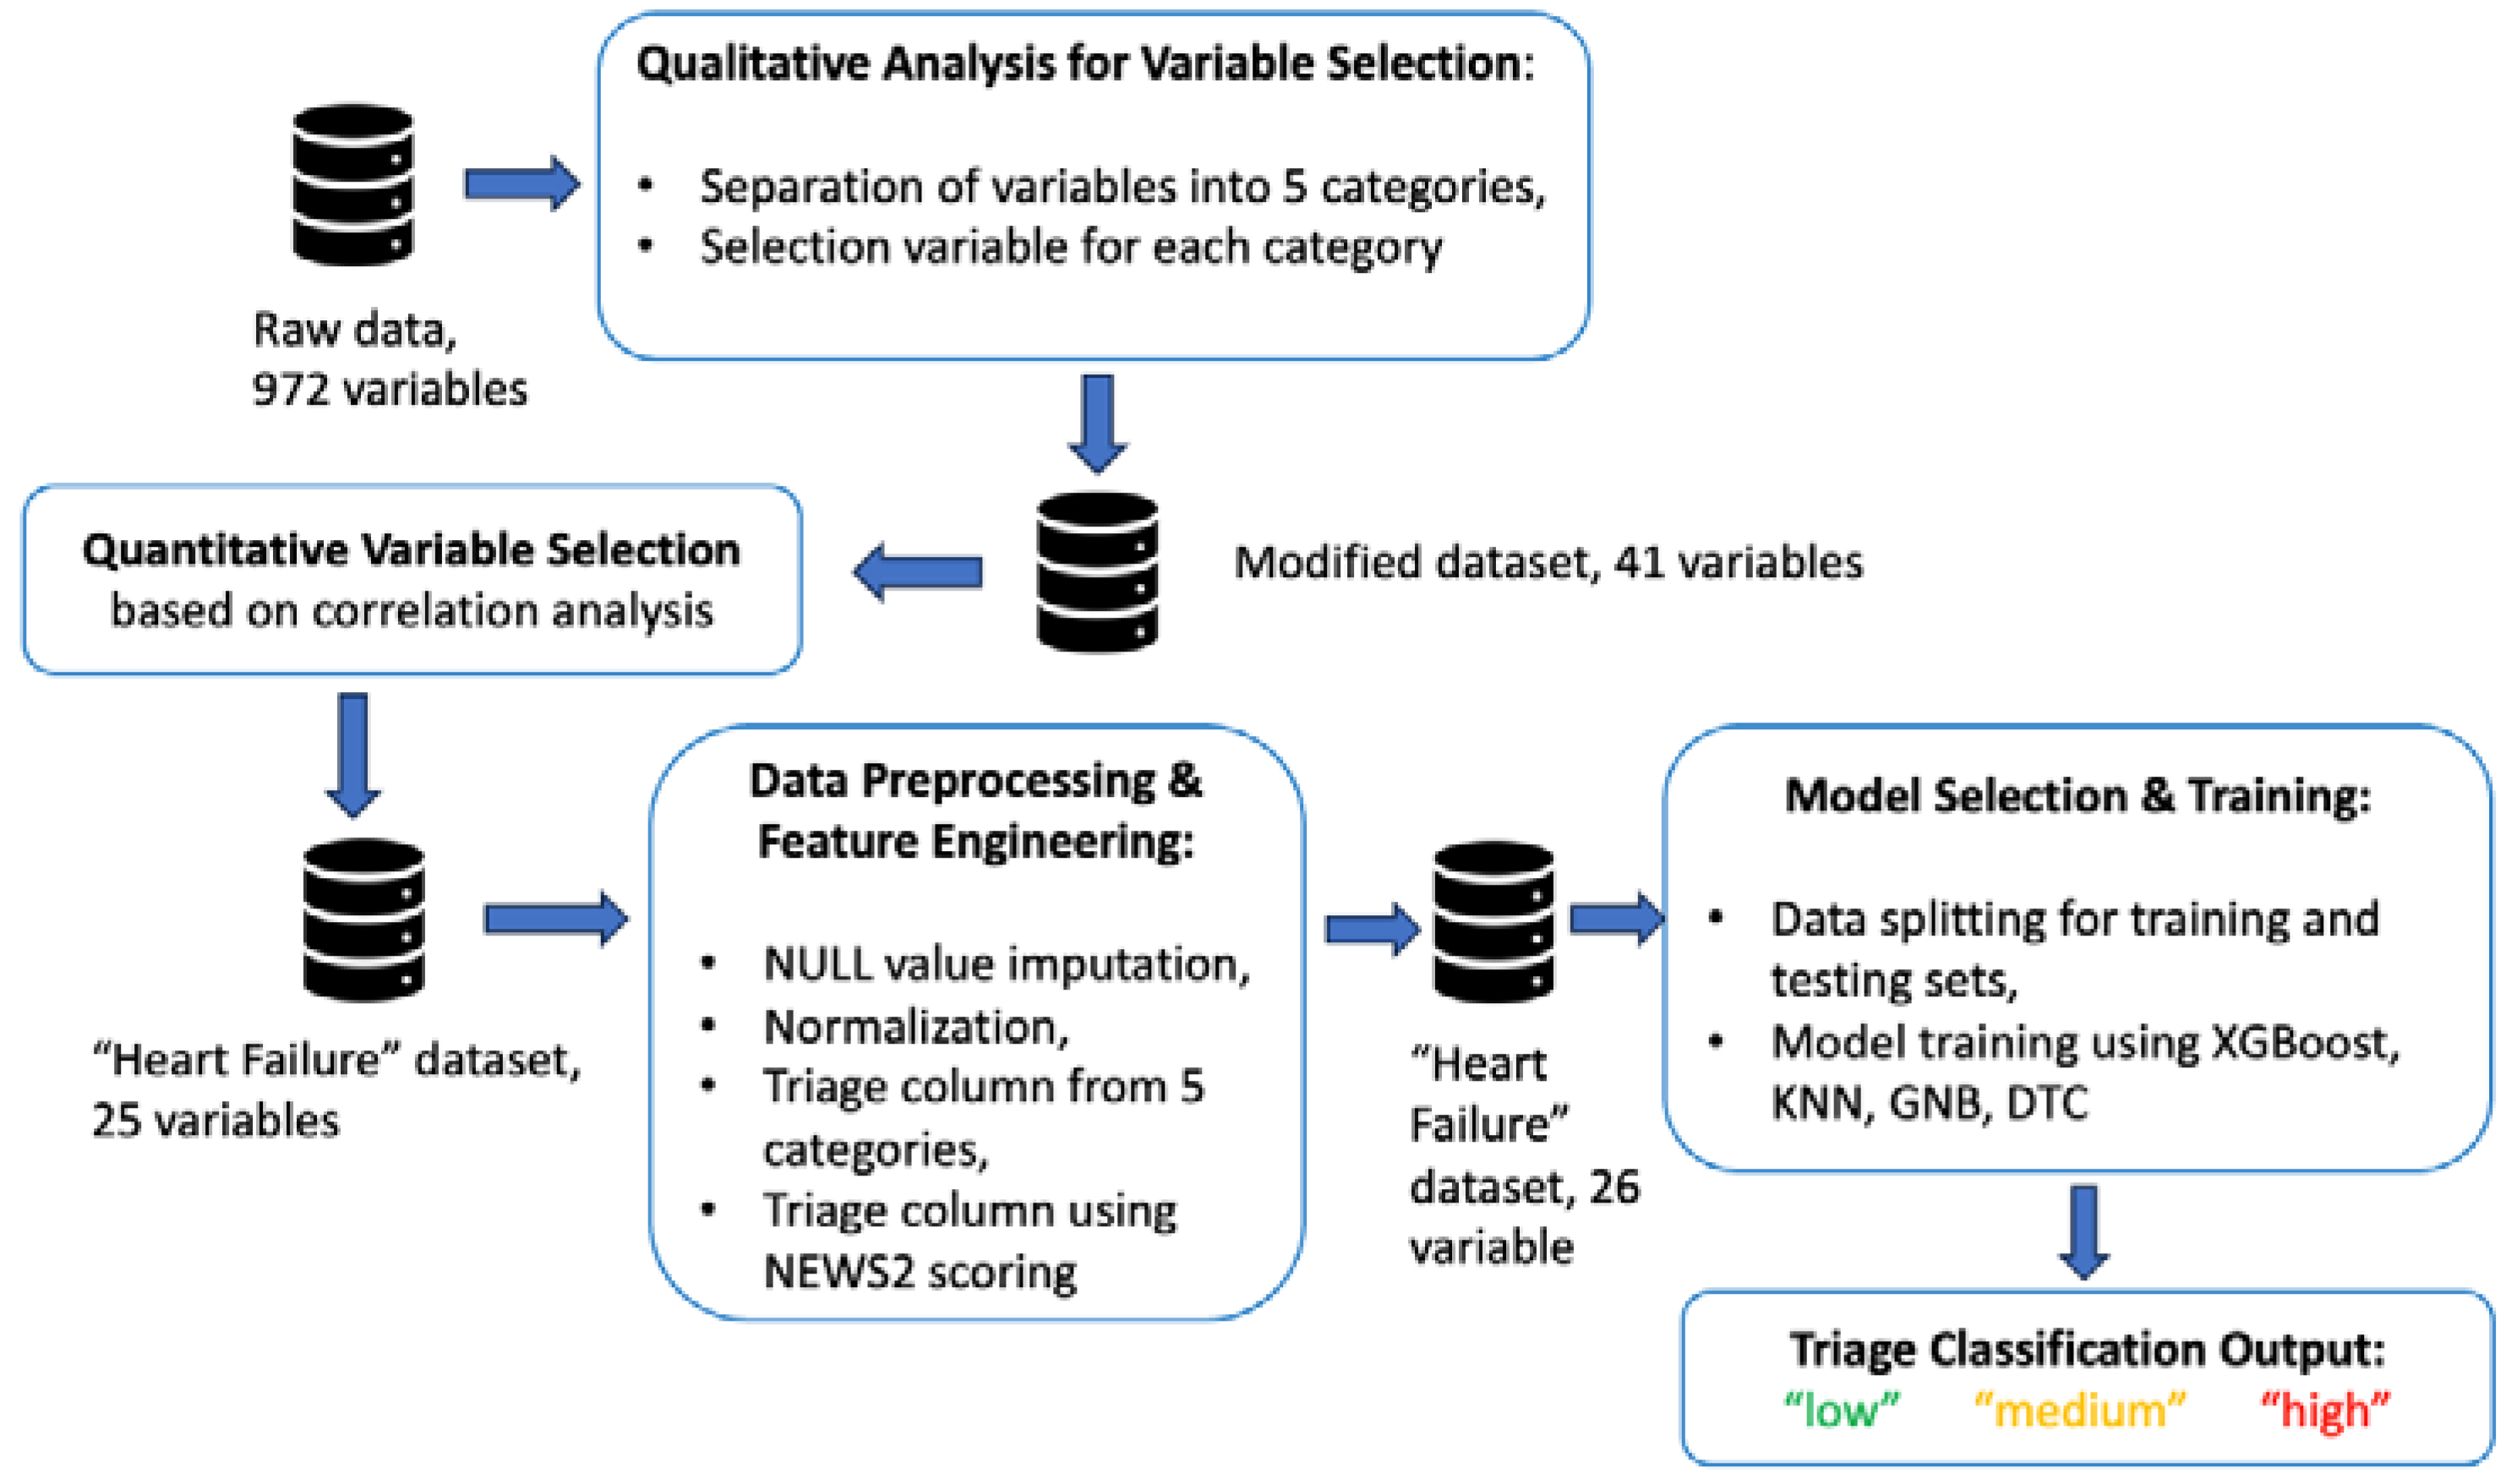
Figure 2.
The chart of the NEWS2 Scoring System (Source: National Early Warnings Score (NEWS) 2, 2017).
Figure 2.
The chart of the NEWS2 Scoring System (Source: National Early Warnings Score (NEWS) 2, 2017).
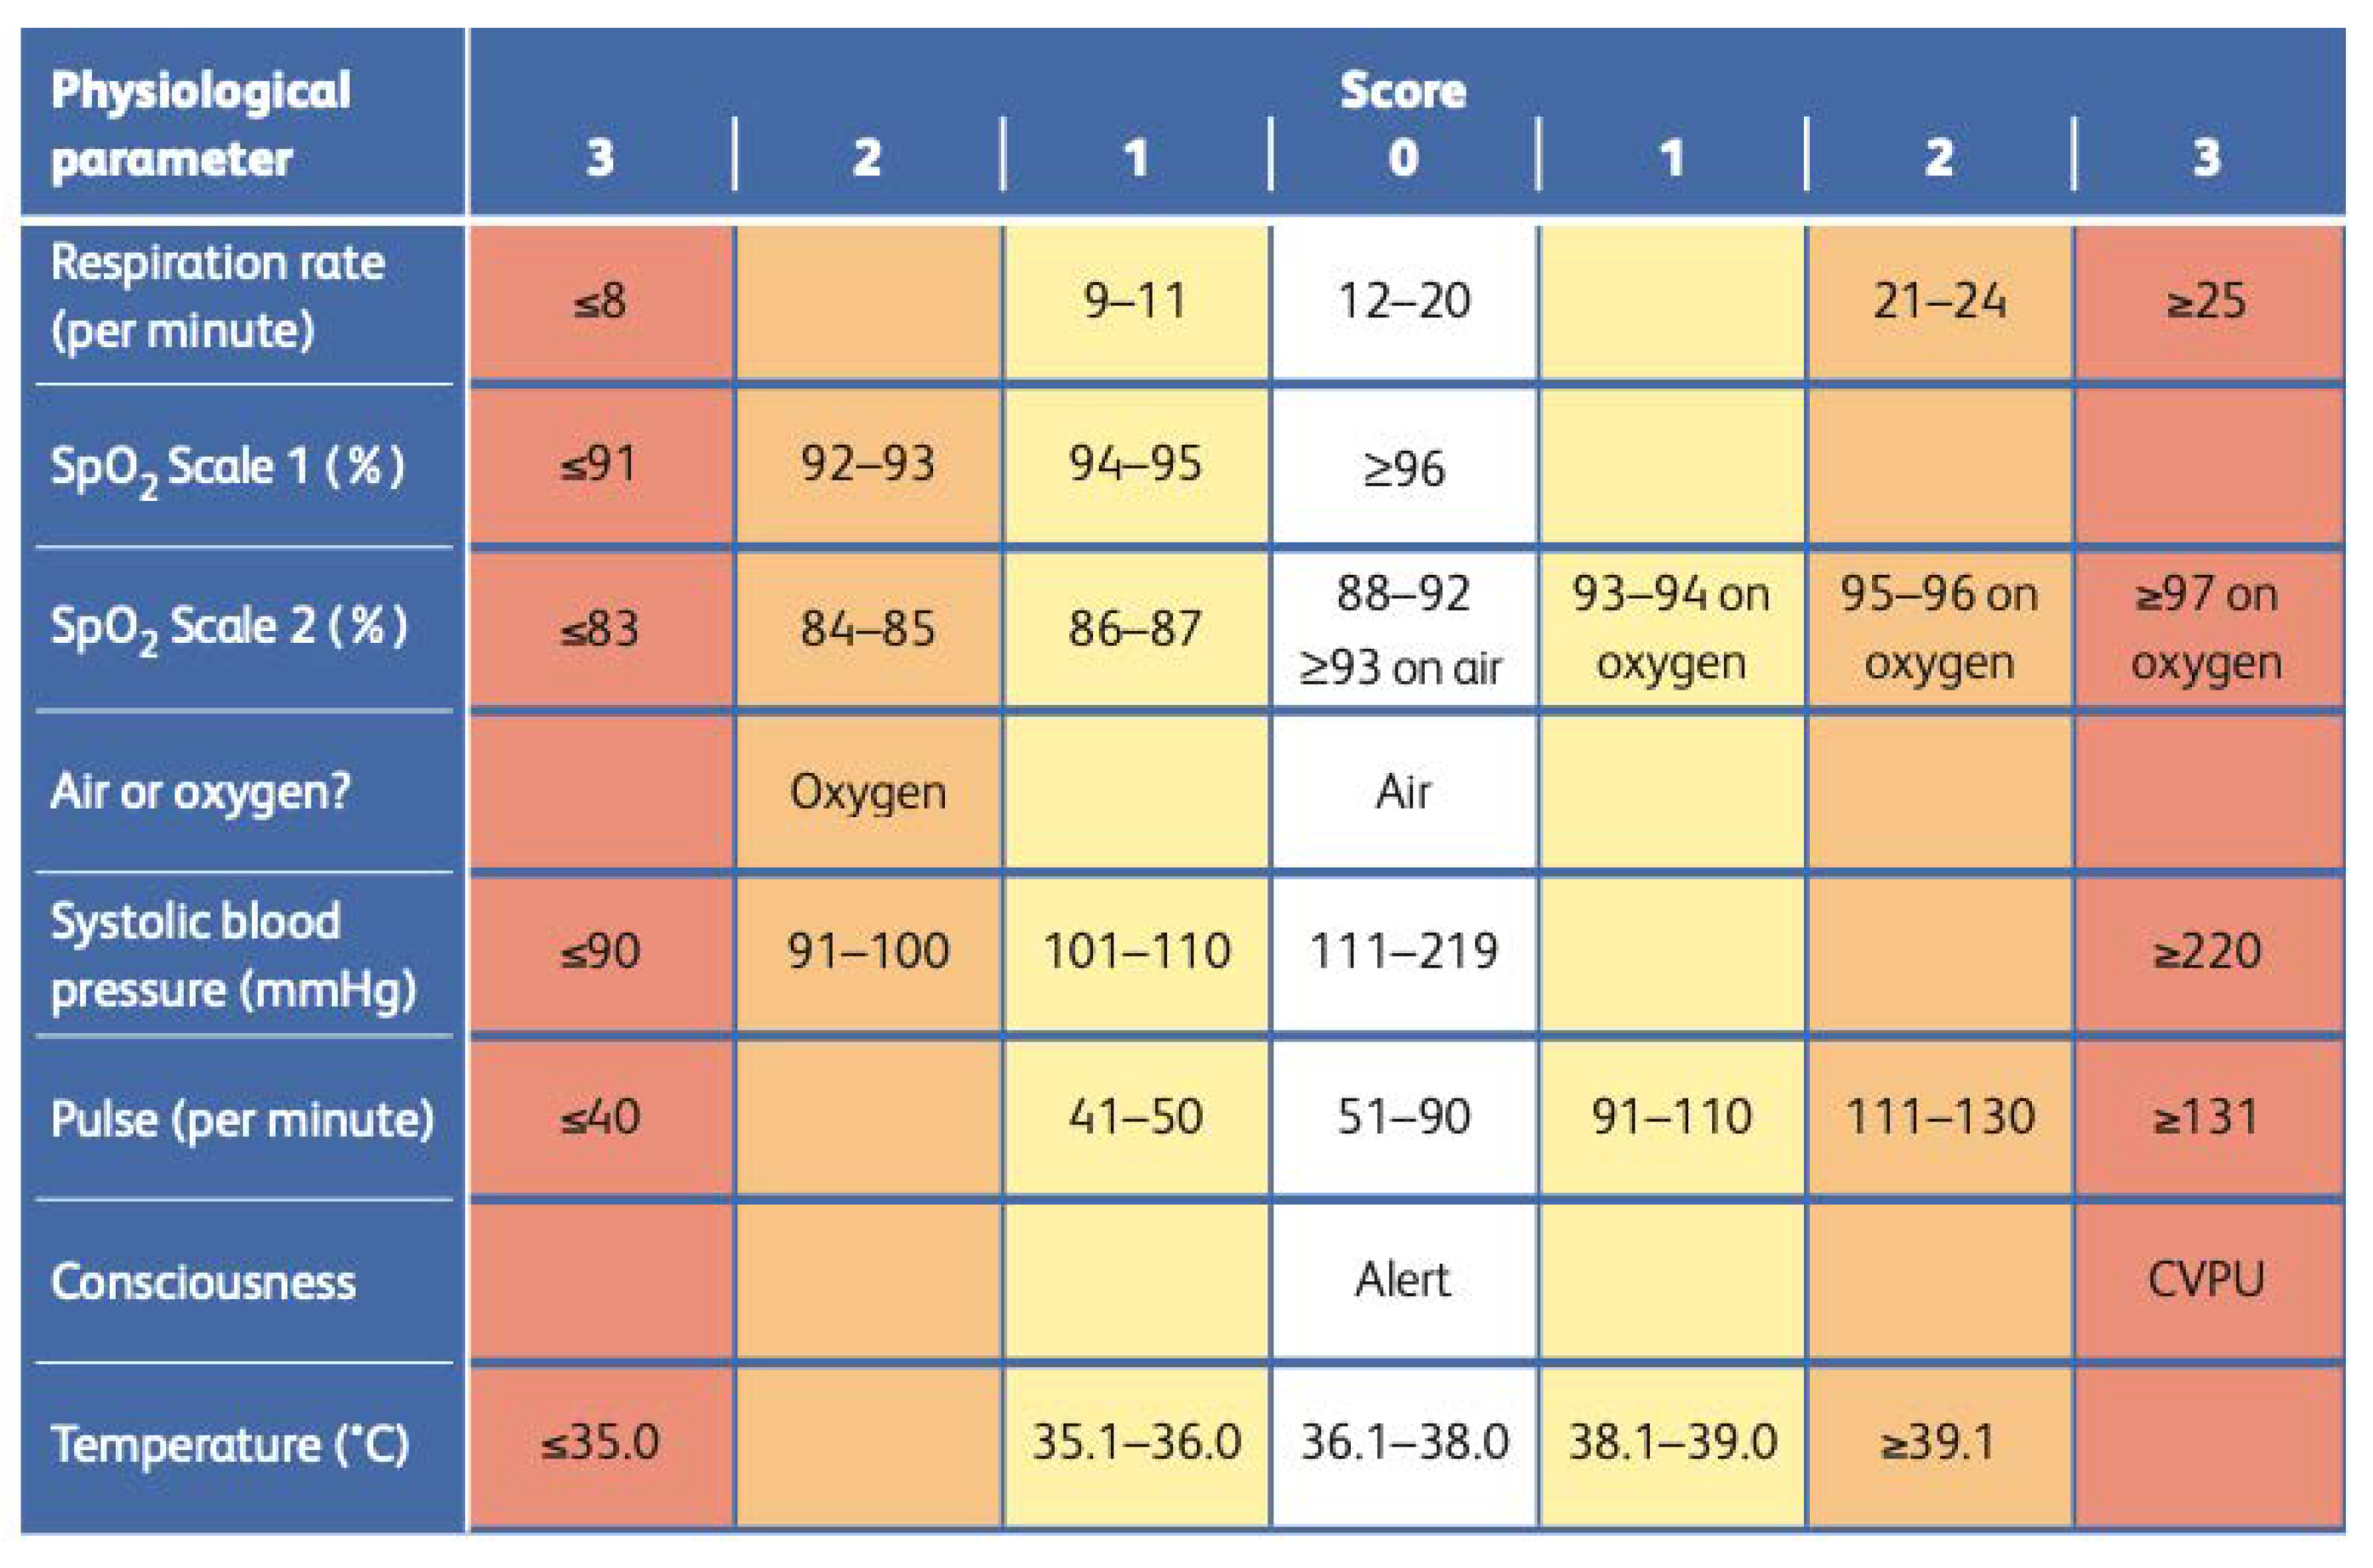
Figure 3.
The chart for clinical response and frequency of monitoring patients (Source: National Early Warnings Score (NEWS) 2, 2017).
Figure 3.
The chart for clinical response and frequency of monitoring patients (Source: National Early Warnings Score (NEWS) 2, 2017).
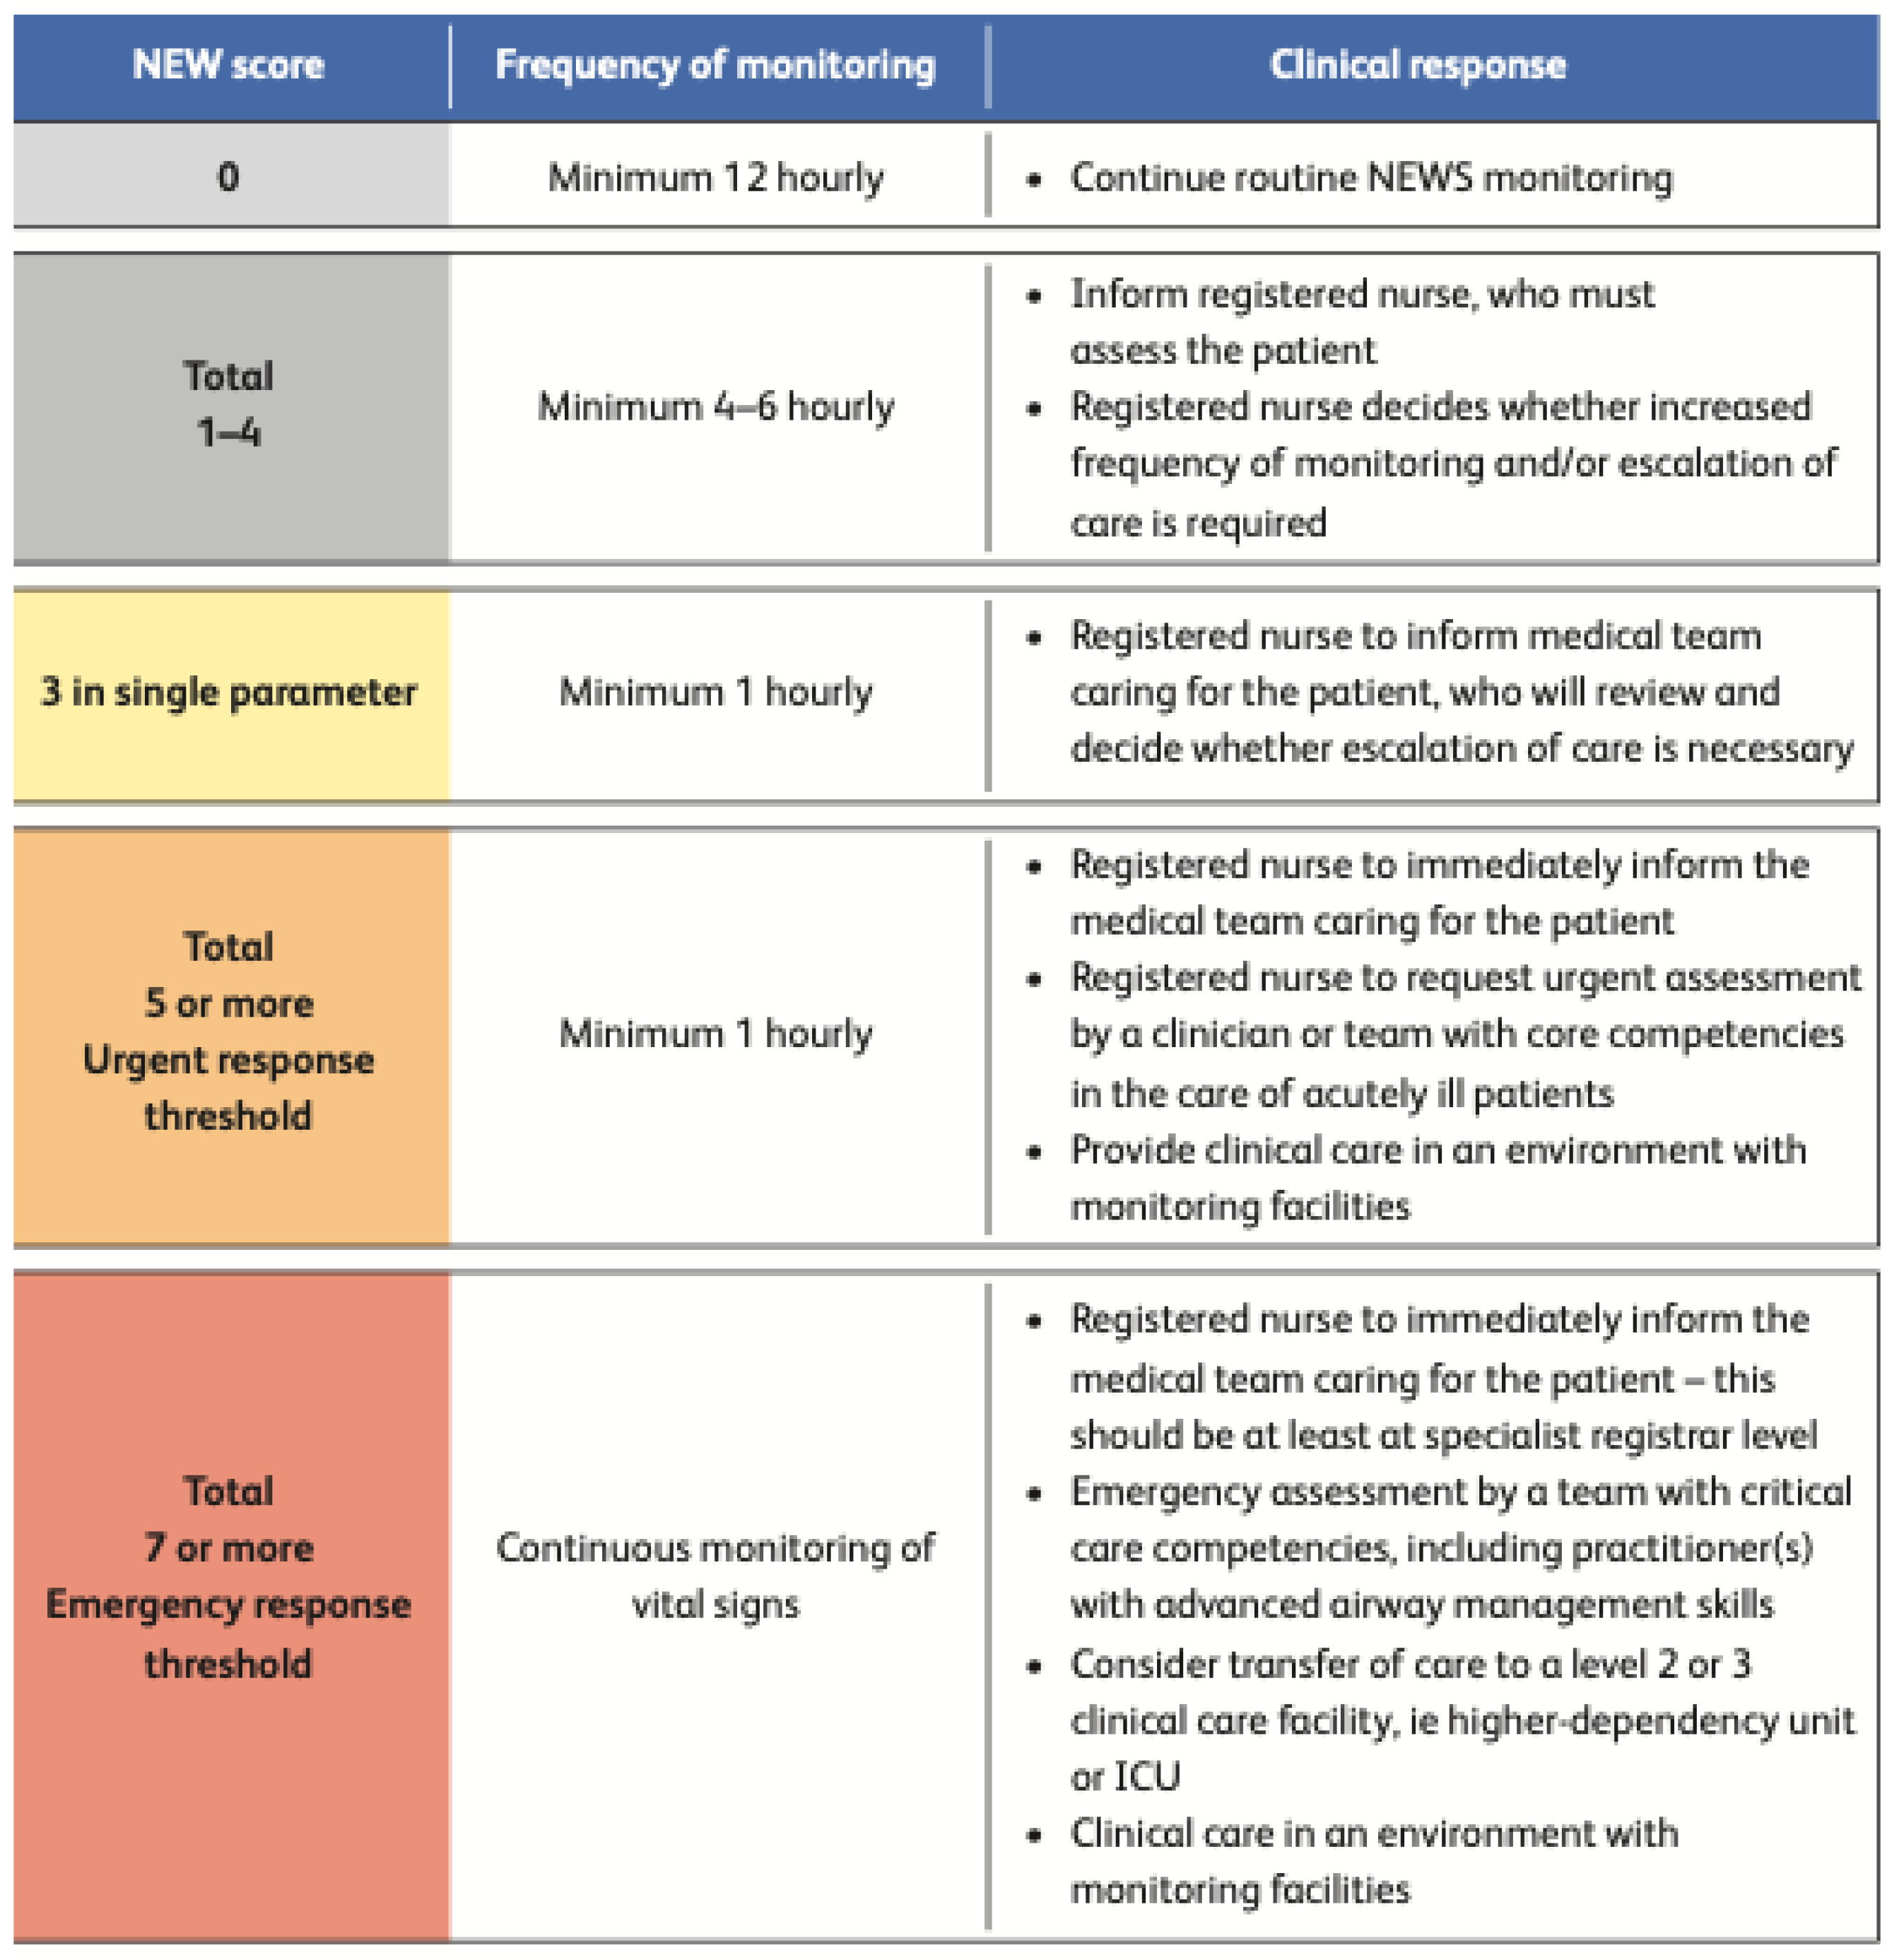
Figure 4.
Bar chart of Evaluation Metrics of each Algorithm.
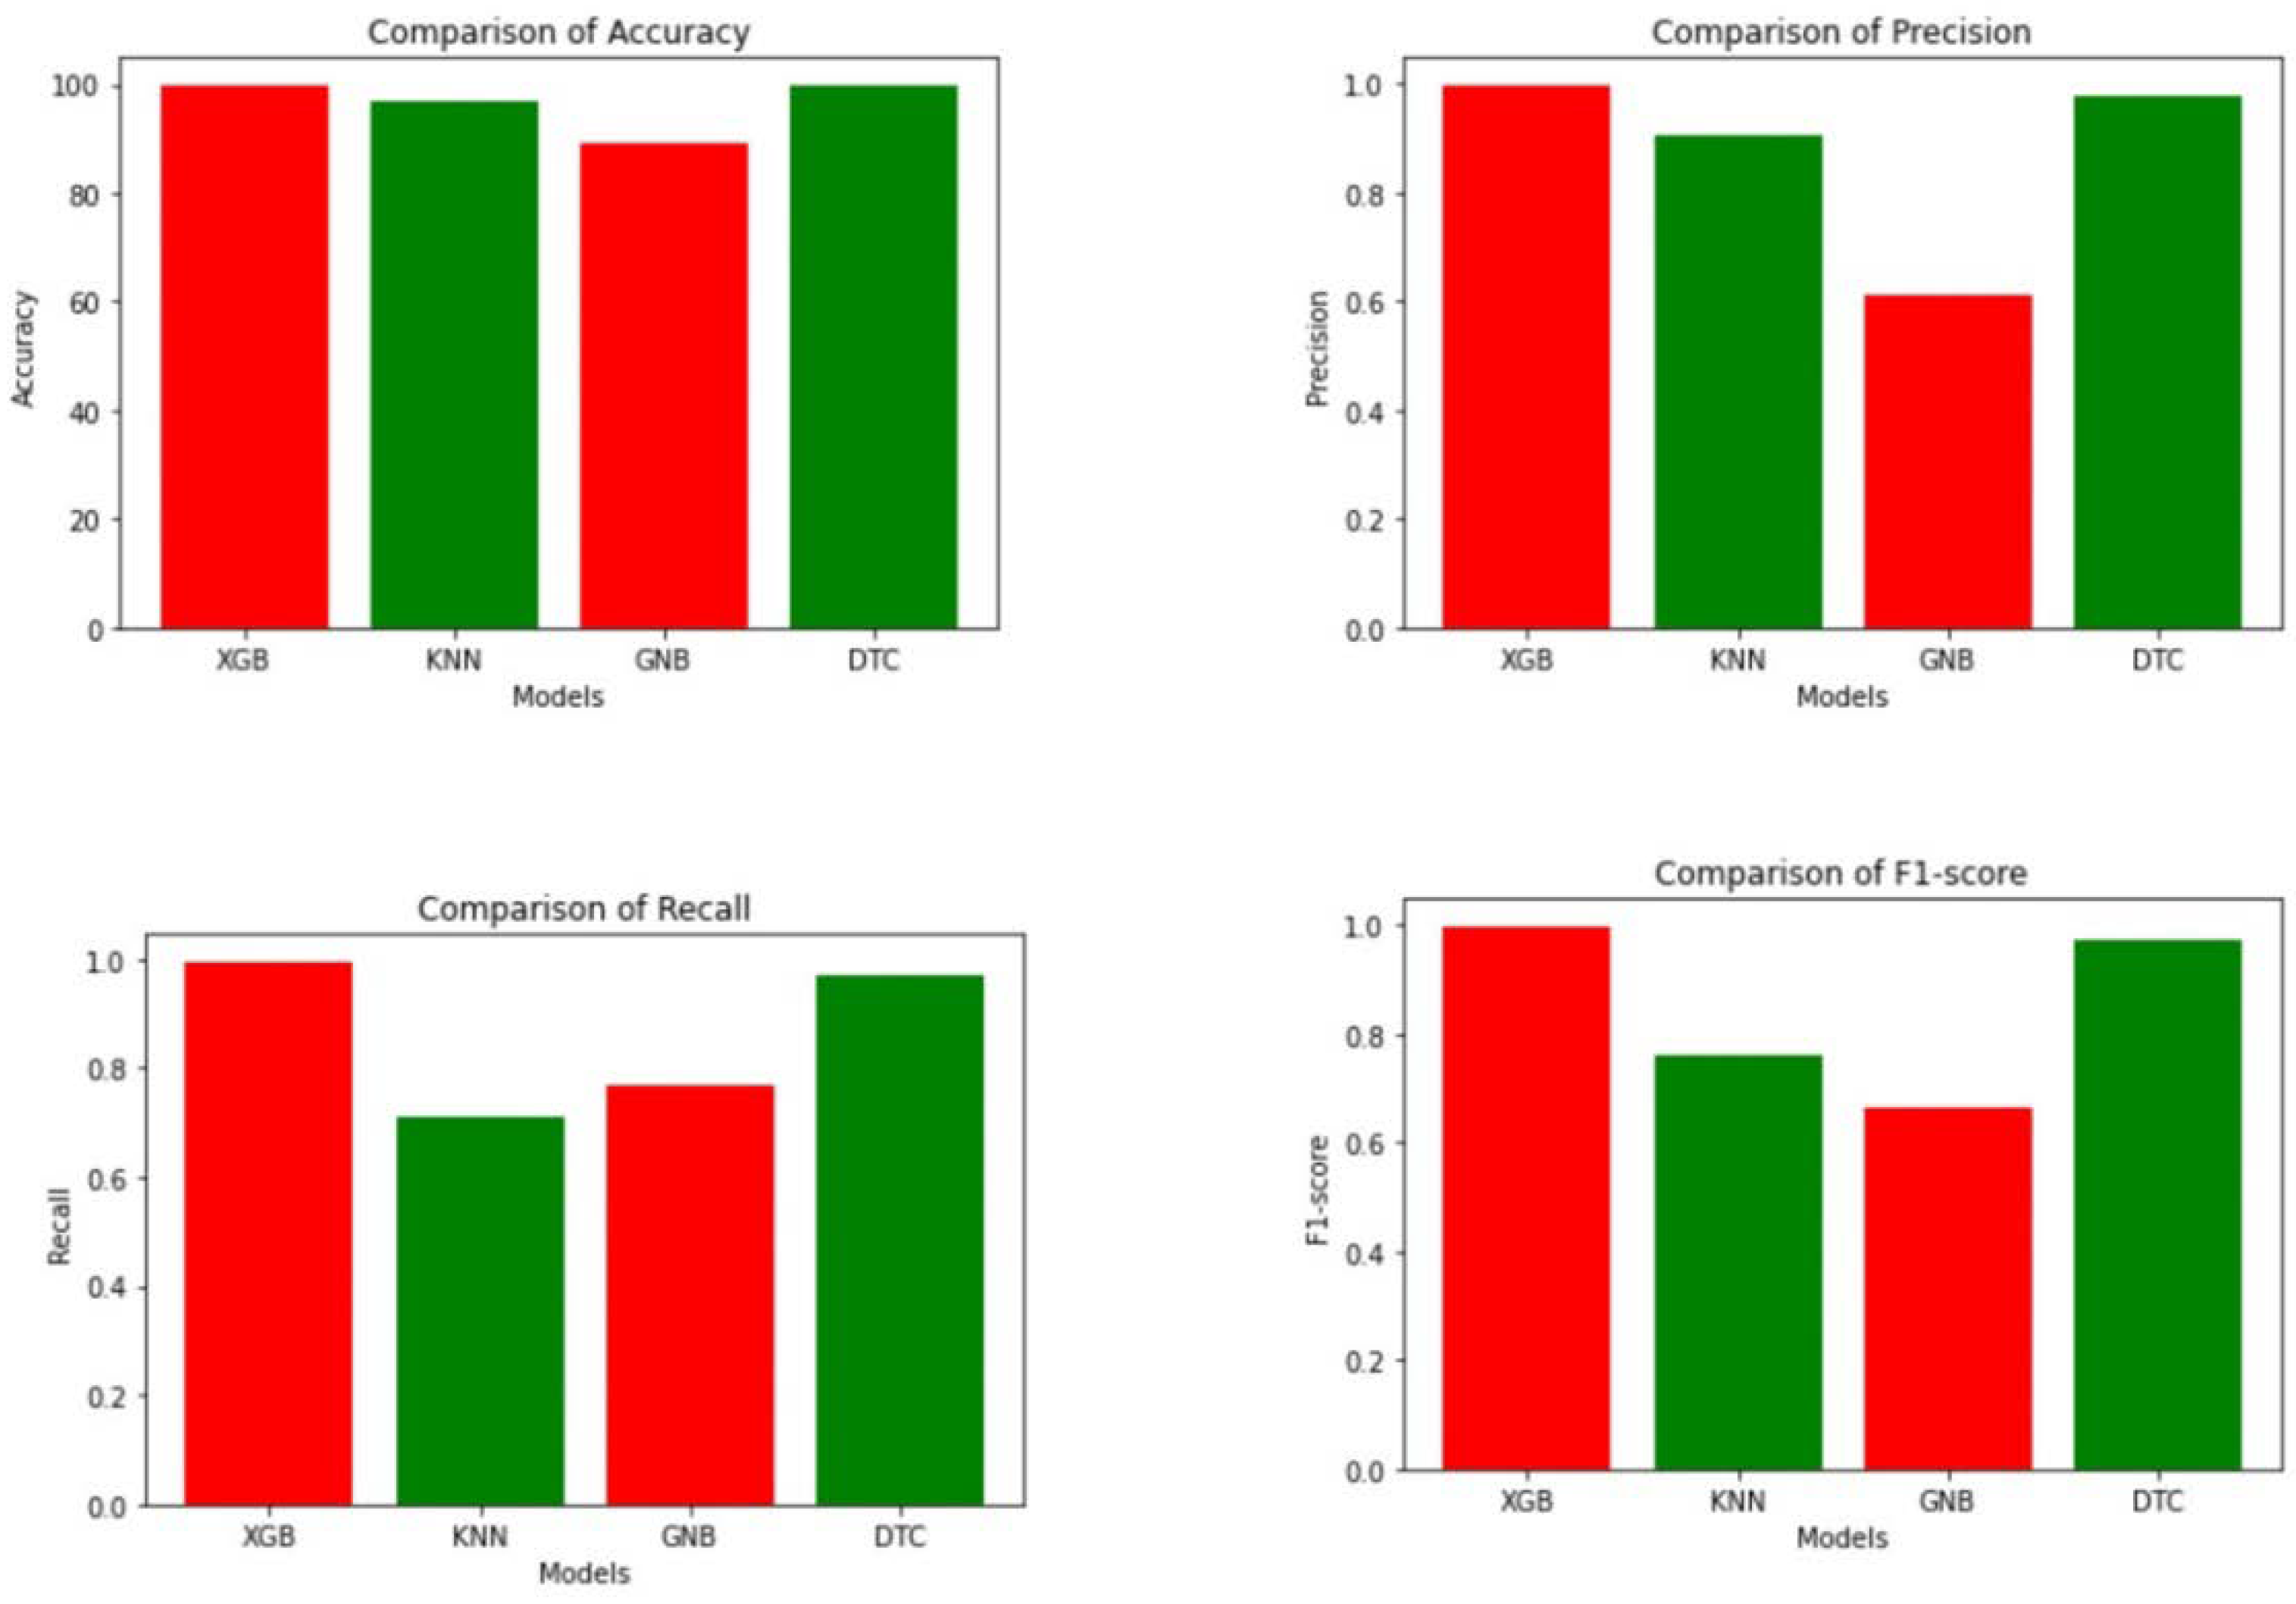
Table 2.
Evaluation metrics of Classes 0, 1 and 2 of XGBoost.
| Measure | Class 0 | Class 1 | Class 2 | Derivations |
|---|---|---|---|---|
| Sensitivity | 1.0000 | 0.9966 | 0.9909 | TPR = TP / (TP + FN) |
| Specificity | 0.9970 | 0.9998 | 1.0000 | SPC = TN / (FP + TN) |
| Precision | 0.9996 | 0.9987 | 0.9977 | PPV = TP / (TP + FP) |
| Negative Predictive Value | 0.9998 | 0.9996 | 0.9998 | NPV = TN / (TN + FN) |
| False Positive Rate | 0.0030 | 0.0002 | 0.0000 | FPR = FP / (FP + TN) |
| False Discovery Rate | 0.0004 | 0.0013 | 0.0023 | FDR = FP / (FP + TP) |
| False Negative Rate | 0.0000 | 0.0034 | 0.0091 | FNR = FN / (FN + TP) |
| Accuracy | 0.9996 | 0.9995 | 0.9998 | ACC = (TP + TN) / (P + N) |
| F1-score | 0.9998 | 0.9976 | 0.9943 | F1 = 2TP / (2TP + FP + FN) |
Table 3.
Class-wise Measures of Algorithms.
| Measure | KNN | GNB | DTC | ||||||
|---|---|---|---|---|---|---|---|---|---|
| Class 0 | Class 1 | Class 2 | Class 0 | Class 1 | Class 2 | Class 0 | Class 1 | Class 2 | |
| Sensitivity | 0.9973 | 0.8582 | 0.2699 | 0.9100 | 0.8245 | 0.5683 | 0.9995 | 0.9883 | 0.9237 |
| Specificity | 0.8278 | 0.9907 | 0.9989 | 0.8748 | 0.9388 | 0.9641 | 0.9951 | 0.9984 | 0.9989 |
| Precision | 0.9750 | 0.9197 | 0.8258 | 0.9800 | 0.6260 | 0.2308 | 0.9993 | 0.9870 | 0.9408 |
| Negative Predictive Value | 0.9787 | 0.9825 | 0.9863 | 0.5903 | 0.9773 | 0.9916 | 0.9966 | 0.9985 | 0.9986 |
| False Positive Rate | 0.1722 | 0.0093 | 0.0011 | 0.1252 | 0.0612 | 0.0359 | 0.0049 | 0.0016 | 0.0011 |
| False Discovery Rate | 0.0250 | 0.0803 | 0.1742 | 0.0200 | 0.3740 | 0.7692 | 0.0007 | 0.0130 | 0.0592 |
| False Negative Rate | 0.0027 | 0.1418 | 0.7301 | 0.0900 | 0.1755 | 0.4317 | 0.0005 | 0.0117 | 0.0763 |
| Accuracy | 0.9754 | 0.9760 | 0.9854 | 0.9054 | 0.9261 | 0.9567 | 0.9989 | 0.9973 | 0.9975 |
| F1-score | 0.9860 | 0.8879 | 0.4069 | 0.9437 | 0.7117 | 0.3283 | 0.9994 | 0.9876 | 0.9322 |
Disclaimer/Publisher’s Note: The statements, opinions and data contained in all publications are solely those of the individual author(s) and contributor(s) and not of MDPI and/or the editor(s). MDPI and/or the editor(s) disclaim responsibility for any injury to people or property resulting from any ideas, methods, instructions or products referred to in the content. |
© 2024 by the authors. Licensee MDPI, Basel, Switzerland. This article is an open access article distributed under the terms and conditions of the Creative Commons Attribution (CC BY) license (http://creativecommons.org/licenses/by/4.0/).
Copyright: This open access article is published under a Creative Commons CC BY 4.0 license, which permit the free download, distribution, and reuse, provided that the author and preprint are cited in any reuse.


