
Submitted:
21 March 2024
Posted:
25 March 2024
You are already at the latest version
Abstract
Gamba grass (Andropogon gayanus Kunth) is a tussock-forming forage species adapted to acid soils of Brazilian savannas and cultivated for grazing pastures. Four decades since its releasing, Planaltina prevails as the most commercialized cultivar of the species, even though the new cultivar BRS Sarandi could be a better alternative for Gamba grass-based farms by presenting greater leaf:stem ratio. The objective of this study was to evaluate the average daily live weight gain (ADG) of Nellore bulls (Bos indicus) for two Gamba grass cultivars – Planaltina and Sarandi. The experiment was conducted in Planaltina, Federal District, Brazil, during 3 years, namely 2018, 2018-2019 and 2020. The experimental design was completely randomized block with two treatments and three replicates, each one continuously stocked at three stocking rates (SR) - 1.3, 2.6 and 4 young bulls/ha. Canopy height (CH), forage mass (FM), plant-part proportion (leaf, stem and dead material) and nutritive value were evaluated. In 2018, mean ADG for Sarandi pastures was greater (0.690 kg/bull/d) than Planaltina (0.490 kg/bull/d) (P=0.0839). In the subsequent year (2018-2019), there was no effect of cultivar (P = 0.4089), while in 2020 the ADG was again affected by cultivar (P=0.0412), confirming the advantage of Sarandi (0.790 kg/bull/d) over Planaltina (0.650 kg/bull/d). In 2018 and 2020, the percentage of stems for Sarandi was about 3-6 pp lesser than for Planaltina (P
Keywords:
Andropogon gayanus
; Cerrado
; leaf
; stem
; Planaltina
; BRS Sarandi
Introduction
Livestock production in Brazilian savannas (i.e., biome Cerrado) is mainly carried out on pasture-based systems (Parente et al. 2019; Martha Jr. et al. 2012). Even considering the strong seasonality of forage production in these areas, livestock is raised nearly exclusively in pastures of exotic warm season grasses like Palisade grass (Urochloa brizantha (Hochst. ex A. Rich.) R. Webster) and Guinea grass (Urochloa maxima (Jacq.) R. Webster) (Jank et al. 2014). In the same way, Gamba grass (Andropogon gayanus Kunth) is an important forage in pasture-based farms, especially in the Brazilian states of Goiás and Tocantins. Gamba grass is an erect, tussock-forming perennial grass, native of tropical Africa (CIAT 1990) and has lower soil nutrient requirement and greater tolerance to high levels of aluminum (Al) than Palisade and Guinea grass, so it is traditionally used in extensive cow-calf operations in savannahs of South America (McManus et al. 2011, Ramírez-Restrepo and Vera 2019). On the other hand, it is considered a noxious weed in Australia (Csurhes and Edwards 1998; Rossiter-Rachor et al. 2009).
Released in 1980, Planaltina is the first and predominant cultivar of Gamba grass in Brazil, succeeded by the cultivar Baetí in 1993 (Thomas et al. 1981; Ferguson and Andrade 1997). Farmers immediately adopted Planaltina due its adaptation to low soil fertility and the absence of grasses resistant to spittlebugs (e.g., Zulia entreriana, Deois flavopicta) at that time. However, after the release of the spittlebug resistant Palisade grass cv. Marandu, Planaltina became more restricted to poor soil fertility areas and low-input production systems. Gamba grass is known for presenting tall reproductive stems during flowering (April-May), reducing canopy leafiness and nutritive value (Sousa et al. 2010). Thus, the breeding of the species has focused in a greater leaf:stem ratio, but still with no documented positive impact on animal performance (Lascano and Thomas 1990). In 2020, the Brazilian Agricultural Research Corporation (EMBRAPA) registered the cv. BRS Sarandi, selected for greater leaf:stem ratio, tiller number, and semi-erect plant architecture. For instance, Sarandi has short and thin tillers and approximately 13% more leaves than Planaltina (Carvalho et al. 2021). Therefore, it is expected that the performance of cattle grazing Sarandi will be improved due to the greater intake of more digestible leaves opposed to rank stems.
Despite the importance of Gamba grass for livestock production systems in Brazilian savannas, information about cattle weight gain under grazing are limited, even for the older cultivars like Planaltina. The objective of this study was to evaluate the average daily live weight gain (ADG) of young Nellore bulls in Gamba grass pastures of cv. Planaltina and cv. Sarandi.
Material and Methods
Experimental Site
The experiment was carried out in Planaltina, FD, Brazil (15°35’ S, 47°42´ W; 993 m above sea level) in a clayed soil (Rhodic Haplustox Oxisol) during three consecutive years (2018-2020). The climate at the experimental site is a tropical dry-winter Aw, according to the Köppen’s classification (Alvares et al. 2013). Monthly rainfall and mean daily air temperatures were recorded 1,400 m from the experimental area (Table 1). The rainy season lasts from October to April and, for the purposes of this study, the period from April to July will be named early dry season. Before planting Gamba grass pastures, the soil of the experimental area had pH (CaCl2) 5.5, K concentration of 134 mg/kg and P concentration of 4.2 mg/kg (Mehlich-I extractable P).
After plowing and disking the experimental area, both cv. Planaltina and cv. BRS Sarandi (Andropogon gayanus Kunth) were seeded in a clean-tilled seedbed on 12 December 2016, each one in three experimental units of 1.5 ha. The equivalent of 50 kg of pelleted seeds per hectare (~ 15 kg of pure live seeds/ha) and 278 kg of simple superphosphate per hectare was mixed and spread with a pendulum spinner Vicon®. Immediately after distribution, seeds were lightly pressed into the soil surface using a tire roller. Along 2017, paddocks were prepared with fences and water tanks, while weeds and invasive forage species (e.g., Guinea grass) were eradicated using directed application of glyphosate.
Experimental Design and Grazing Management
Planaltina and Sarandi treatments were distributed in a completely randomized block design with three replicates. Each one of the three blocks was managed at one fixed stocking rate (SR) – 1.3, 2.6 and 4 bulls/ha (2, 4 and 6 bulls per paddock), namely low, medium and high SR, respectively. From April 2018 to June 2020, successive grazing periods including rainy and early dry season comprehended three years (2018, 2018-2019 and 2020) (Table 2). The equivalent of 50 kg N/ha/yr as ammonium sulfate was applied to the pastures after mechanical cutting at about 30 cm of canopy height. Nitrogen fertilizer was applied every year approximately one month before the first grazing period.
Animal Performance
Young Nellore bulls (Bos taurus indicus) aged between 14–19 months were evaluated for average daily live weight gain (ADG). The mean initial live weight (LW) (± standard deviation) of successive groups of bulls for 2018, 2018-2019 and 2020 were 331 (±38), 335 (±76) and 244 (±23) kg, respectively. A complete mineral salt mix was supplied ad libitum throughout the experimental period. Bulls were weighed after a 16-h fasting time at the beginning of each year and at the end of each grazing period. Annual live weight gain per area (GA) was calculated multiplying ADG by the SR and by the days of grazing. The experiment met the requirements of the Ethics Committee for the Use of Animals of the Embrapa Cerrados at protocol 818-4561-1/2020.
Canopy Attributes
Forage mass (FM) was evaluated at soil level using metallic frames of 2 × 0.5 m to delimitate the sampling points. Twelve points were distributed in three transects per paddock with four samplings per transect. Six subsamplings (each one comprising two FM samples) were taken to separate leaf (i.e., green leaf blade), stem (i.e., stem and leaf sheath) and dead material. Dead material was visually defined as senescent leaves and stems with 50% or more area of yellow or dry tissue. All samples were dried in an air-forced oven at 55°C for 72 h. Canopy height (CH) was evaluated in 100 sampling points per paddock in a zigzag line pattern. Pasture evaluations describing CH, FM and plant-part composition were made every grazing period. Leaf:stem ratio, leaf bulk density (kg DM/ha/cm) and leaf allowance (LA) (kg DM/kg LW) (Sollenberger et al. 2005) were estimated.
Nutritive Value Attributes
Forage analyzed for nutritive value was sampled by the hand-plucking method described by Sollenberger and Cherney (1995). The samples were dried in an air-forced oven at 55°C for 72 h, and milled to a 1-mm particle size (Wiley mill). Crude protein (CP) (AOAC 1990), neutral detergent fiber (NDF), acid detergent fiber (ADF) (Van Soest et al. 1991), and in vitro dry matter digestibility (IVDMD) (Tilley and Terry 1963, and modified by Moore and Mott 1974) were analyzed by near-infrared spectroscopy (NIRS) (FOSS®) using calibrated models based on the mentioned methods. The models used to predict the nutritive value presented determination coefficient (R2) ranging from 0.87 to 0.95 (Fonseca et al. 2020).
Data Analysis
Data were analyzed by year using the Mixed procedure of SAS (SAS Institute 2020). The effect of cultivar, block, grazing period and cultivar × grazing period were assigned as fixed by analysis of repeated measures over time. The studentized residual data outside ±3 were considered outliers. Results from main effects at P<0.10 by the t test were presented as LSMEANS. The effects of interaction at P>0.10 were not mentioned. The correlation coefficients (r) of canopy and nutritive value attributes with ADG were estimated by using the Corr procedure of SAS (SAS Institute 2020).
Results
In the first year of the experiment (2018), ADG was affected by cultivar (P=0.0839) and grazing period (P=0.0003). Bulls gained 0.670 kg/bull/d in Sarandi pastures and 0.490 kg/bull/d in Planaltina pastures (Table 3). In the second year (2018-2019), there was no effect for cultivar on ADG (P=0.4089) (mean = 1.000 kg/bull/d), only for grazing period (P<0.0001). In 2020, there was an effect of grazing period (P<0.0001) and results also supported Sarandi as promoting more ADG (0.790 kg/bull/d) compared to Planaltina (0.650 kg/bull/d) (P=0.0412). As a direct effect of ADG and weighted average of grazing days, mean GA for Sarandi pastures was 151, 492 and 276 kg/ha in 2018, 2018-2019 and 2020, respectively, while GA for Planaltina pastures was 115, 517 and 229 kg/ha for 2018, 2018-2019 and 2020, respectively.
There was no effect of cultivar on FM (P>0.10) (Table 4), only for grazing period (P<0.10) (Table 5). However, morphological composition of the plant differed between Sarandi and Planaltina cultivars. In the first (2018) and third (2020) years, there was an effect of cultivar on stem percentage (P<0.10) with greater values for Planaltina (Table 4). Concurrently, the dead material percentage in these same years was superior for Sarandi (P<0.10), while the leaf percentage was not affected by cultivar (P>0.10). All morphological components were affected by the grazing period (P<0.10), except stem in the 2018-2019 (P>0.10) (Table 5). In general, with advance of grazing season there was a continuous leaf decrease concomitantly to the dead material increase, while stem remained more stable. As well as stem percentage, Planaltina pastures presented greater CH than Sarandi in 2018 and 2020 (P<0.10). In 2018-2019, there was no effect of cultivar on plant-part composition (P>0.10) and CH (P=0.4936). Canopy height was affected by the grazing period in 2018 and 2018-2019 (P<0.10) (Table 5).
None nutritive value attribute (e.g., CP, IVDMD, NDF and ADF) was affected by cultivar (P>0.10) (Table 4). However, these same variables were affected by the grazing period (P<0.10), decreasing values for CP and IVDMD with the advance of season and concomitant increase in NDF and ADF, particularly for 2018 and 2018-2019 years (Table 5).
Average daily gain was strongly and positively correlated (r>|0.7|) with leaf percentage (r=0.73; P<0.0001) and leaf:stem ratio (r=0.70; P<0.0001) while leaf bulk density (r=0.64; P<0.0001) and CP (r=0.63; P<0.0001) were moderately correlated (|0.7|>r>|0.5|) with ADG. Stem percentage was weakly correlated (|0.5|>r> |0.3|) with ADG (r=-0.48; P=0.0003), as well as LA (r=0.45; P=0.0008), NDF (r=-0.42; P=0.0020), dead material percentage (r=-0.39; P=0.0037) and IVDMD (r=0.37; P=0.0078). Canopy height (r=0.20; P=0.1490), FM (r=-0.10; P=0.4617) and ADF (r=-0.04; P=0.7619) were not correlated with ADG (r< |0.3|). The strength and direction of these correlations highlighted the positive linear association of leaf percentage, leaf:stem ratio, leaf bulk density and CP with ADG (Figure 1).
In general, ADG decreased as the advance of the rainy season (November-April) until the early dry season (April-July), when the experimental period for each year ended (Figure 2). For different blocks and their respective SRs, the ADG was greater for the low SR and lesser for the high SR, which by the way had the experimental period shortened to avoid weight loss of bulls and pasture depletion. On the other hand, low and medium SR blocks were grazed by the entire experimental period during the three years. The ADG superiority of Sarandi over Planaltina was more or less evident depending of the grazing period, with greater evidence in the first and third years. As well as ADG, the descending trend over time occurred for the leaf:stem ratio and an apparent advantage of Sarandi excelled especially in grazing periods of the years 2018 and 2020, although it was not evident for all of them (Figure 3).
Discussion
Average daily gain over the three years of the current study (0.490-1.020 kg/bull/d) was considerably greater to the mean observed in Gamba grass pastures grazed for 6 months in the well-drained savannahs of Colombia, with daily live weight gains of 0.570 kg/head/d (Thomas et al. 1981). When limited to the rainy season (Nov-Apr), ADG was within the range observed for Nellore cattle in fertilized Palisade and Guinea grass pastures grazed in this same season in Brazil Central (0.750 to 1 kg/head/d) (Delevatti et al. 2019; Maciel et al. 2018; Herling et al. 2011). Actually, ADG even reached above 1 kg/bull/d, especially for low and medium SR (Figure 2), demonstrating an unexplored potential of Gamba grass for finishing beef cattle in more intensive pasture-based systems. The preceding mechanical cut eliminated the old rank tussocks favoring the leaf intake, as well as the high forage CP concentration, within the range observed in N-fertilized Gamba grass leaves at different regrowth ages (70-180 g/kg) (Lascano and Thomas 1990), and very close to observed in N-fertilized Palisade grass in the rainy season (136-168 g/kg) (Delevatti et al. 2019). In Palisade and Guinea grass pastures in Araguaína, TO, Brazil, Nellore bulls gained 0.360 kg/head/d in the early dry season (April to June) with 2 animal units per ha (1 animal unit = 450 kg LW) (Feitosa et al. 2022). It was lesser to the mean ADG observed in the current study in this same season (~ 550 kg/bull/d). As a likely cause for this, mean CP of Gamba grass during early dry season (110 g/kg) was considerably greater than observed by Feitosa et al. (2022) (82 g/kg), when Gamba grass begins its reproductive phase.
Leaf percentage dropped with the advance of the season, reaching values between 5 and 8%, lesser to observed in Signal grass (Urochloa decumbens) and Palisade grass pastures (13-21%) grazed at continuous stocking in Campo Grande, MS, Brazil (Euclides et al. 2000; Paula et al. 2012). Bönert et al. (1985) also observed a dropped proportion of leaves in the canopy during dry season (10%), even though the exclusive Gamba grass grazed diet contained 37% of leaves. Since leaf percentage was unexpectedly similar for Planaltina and Sarandi, the greater proportion of stems for Planaltina seems to have negatively influenced the ADG, probably for their effects on foraging cattle behavior and on nutritive value (Mganga et al. 2021, Benvenutti et al. 2008). The advantages of lesser stem proportion of Sarandi may have had consequences on ADG precisely in the two years (2018 and 2020) where this effect was more evident, while the well below average rainfall may have influenced the lack of cultivar effect in 2018-2019 (Table 1). As seen, the lesser proportion of stems of Sarandi did not resulted in a greater proportion of leaves, but essentially of dead material (mainly dead leaves), demanding more precise and efficient grazing targets (e.g., CH, FM, etc.) to maximize this advantage.
Canopy attributes like leaf percentage, leaf:stem ratio and leaf bulk density presented straight association with ADG over the experimental period (Figure 1). Average daily gain was more associated with canopy attributes derived from leaves than CH, FM, stem and nutritive value. Garay et al. (2004) verified in Stargrass pastures that ADG presented a quadratic fit with FM and forage allowance (R2 > 0.75). On the other hand, for high-tufted Guinea grass, ADG appears more correlated with leaves (Euclides et al. 1999, Euclides et al. 2007), similar to Gamba grass. When FM becomes excessive, there may be no relationship between canopy attributes and ADG, but nutritive value may explain more than 50% of the variation in ADG (Sollenberger and Vanzant 2011). In this context, the high-tufted Guinea grass cv. Zuri managed constantly at 8 kg DM/100 kg LW/d of forage allowance presented leaf:stem ratio moderately correlated with ADG (0.64), while CP and IVDMD correlated strongly (r>0.72) (Maciel et al. 2018). For tropical grasses, the live weight gain seems to be more correlated with LA than forage allowance (Machado et al. 2008), although LA correlated weakly with ADG due to a ceiling response (Figure 1) as already observed for forage allowance (Inyang et al. 2010; Rouquette 2016). A steady-state canopy by controlling CH has been recommended for grazing management of tropical grasses (Euclides et al. 2010), otherwise the occurrence of very tall canopies (> 150 cm) in the current study have a negative impact on ADG (Figure 1), because of the simultaneous decrease of leaf:stem ratio and leaf bulk density and their negative effects on forage intake. In a plot cut experiment oriented to minimize the growth of stems, it was recommended that CH of cv. Planaltina not exceed 50 cm, when there is about 95% of canopy light interception (Sousa et al. 2010), even though none data from grazing experiments were obtained yet.
The expected deficit in rainfall from April onwards (Table 1) along with the reproductive phase of Gamba grass increased stem and dead material percentage in detriment of more nutritive green leaves (Sousa et al. 2010, Grof and Thomas 1990). In a similar way, ranging SR in the blocks produced distinct canopies affecting differently the plant-part composition of gamba grass, and providing a wider perspective about the potential advantages of Sarandi over Planaltina in terms of canopy leafiness (Figure 2). The leaf:stem ratio emerged as one of the causes for the advantage of Sarandi over Planaltina, in terms of individual weight gain of bulls. Regardless of the SR and their consequences on canopy, the bulls in Sarandi pastures had access to a canopy that favored forage intake and their greater performance (Figure 3). In addition to the leaf:stem ratio, a more homogeneous canopy provided by Sarandi may also have contributed to this advantage, moreover the CH in Sarandi pastures was lesser compared to Planaltina, at least in 2018 and 2020. The lesser the CH greater the leaf bulk density, that probably affected the ingestive behaviour (e.g., bite weight and bite rate) of the bulls, with positive consequences on ADG (Sollenberger and Burns 2001).
According to Thomas et al. (1981), Planaltina pastures produced 457 kg LW/ha/yr in the Colombian savannas grazed with 3.6 head/ha, lesser to the mean GA observed in the current study in the longest grazing year (2018-2019) for Sarandi and Planaltina pastures (505 kg LW/ha/yr). Pasture carrying capacity is influenced by the grazing days, and the grazing year had to be abbreviated for the high-SR block of the current study, affecting negatively the weighted average GA. In Palisade grass pastures fertilized with 200 kg N/ha/yr, mean GA was 565 kg LW/ha/yr (Herling et al. 2011), while in Guinea grass pastures with 100 kg N/ha/yr, mean GA was 324 kg LW/ha/yr according to Braga et al. (2019) and 399 kg LW/ha/yr according to Canto et al. (2009). Considering the minor N fertilization of 50 kg N/ha/yr, cattle production for Gamba grass pastures in the current study can be considered remarkable since it is predominantly destined for low-input production systems by presenting lesser forage yield potential than Guinea grass pastures for example.
Cattle performance observed in the current study revealed Sarandi as promising Gamba grass cultivar since the advantages over Planaltina observed at least in two of the three years. As Sarandi maintains the adaptive advantages of Planaltina in the Brazilian savannas (i.e., Al tolerance), it may also be recommended for low soil fertility areas and extensive cow-calf grazing systems. Calf weaning takes place in March–April in Brazilian savannas, and Sarandi cultivar may improve this weaning weight performance, resulting in a shorter livestock cycle until the slaughter. Results obtained in the current study, however, indicated the great productive potential of Gamba grass when mechanical cutting of no grazed leftover tussocks and nitrogen fertilization are combined, giving also the opportunity for raising and finishing beef cattle. The lesser proportion of stems supports Sarandi as more suitable cultivar to minimize the undesirable effects of flowering and mismanagement on canopy and cattle performance, even when leaves are not the main plant component of the diet. Even so, Sarandi preserves characteristics of the species that makes grazing management more difficult, such as the fast growth of the stems during flowering from April onwards, condition that prevents it to use as stockpiled forage for dry season.
Gamba grass BRS Sarandi provided greater live weight gain for young Nellore bulls compared to predominant cv. Planaltina. This advantage is consequence of the less proportion of stems, characteristic of this cultivar, affecting the quality of grazed diet especially when nutritive value and canopy structure deteriorate quickly. More effort must be made aiming to define grazing management targets for gamba grass, both for Sarandi and for Planaltina.
Acknowledgements
To UNIPASTO (Association for the Promotion of Forage Breeding Research) for supporting part of the financial resources.
References
- Alvares CA; Stape JL; Sentelhas PC; Gonçalves JLM; Sparovek G. Köppen’s climate classification map for Brazil. Meteorologische Zeitschrift 2013, 22, 711–728. [Google Scholar] [CrossRef]
- AOAC (Association of Official Analytical Chemists). 1990. Official methods of analysis, 15th ed.
- Benvenutti MA; Gordon, IJ; Poppi DP; Crowther R; Spinks W. Foraging mechanics and their outcomes for cattle grazing reproductive tropical swards. Applied Animal Behaviour Science 2008, 113, 15–31. [Google Scholar] [CrossRef]
- Böhnert E; Lascano C; Weniger JH. Botanical and chemical composition of the diet selected by fistulated steers under grazing on improved grass-legume pastures in the tropical savannas of Colombia, I: botanical composition of forage available and selected. Journal of Animal Breeding and Genetics 1985, 102, 385–394. [Google Scholar] [CrossRef]
- Braga GJ; Maciel GA; Guimarães Jr R; Ramos AKB; Carvalho MA; Fernandes FD; Fonseca CEL; Jank L. Performance of young Nellore bulls on guineagrass pastures under rotational stocking in the Brazilian Cerrado. Tropical Grasslands-Forrajes Tropicales 2019, 7, 214–222. [Google Scholar] [CrossRef]
- Canto MW; Bona Filho A; Moraes A; Hoeschl AR; Gasparino E. Animal production in Tanzania grass swards fertilized with nitrogen. Revista Brasileira de Zootecnia 2009, 38, 1176–1182. [Google Scholar] [CrossRef]
- Carvalho MA; Fonseca CEL; Ramos AKB; Braga GJ; Fernandes FD; Pessoa Filho MACP. BRS Sarandi: a new Andropogon gayanus cultivar for tropical pastures. Crop Breeding and Applied Biotechnology, 2021, 21, 1–6. [CrossRef]
- CIAT (Centro Internacional de Agricultura Tropical). 1990. Andropogon gayanus Kunth: A grass for tropical acid soils. In Toledo, J. M., Vera, R., Lascano, C, & Lenné, J. M. (Eds.). (pp. 382).
- Csurhes S; Edwards R. 1998. Potential environmental weeds in Australia: Candidate species for preventative control. Canberra, Australia. Biodiversity Group, Environment Australia.
- Delevatti LM; Cardoso AS; Barbero RP; Leite RG; Romanzini EP; Ruggieri AC; Reis RA. Effect of nitrogen application rate on yield, forage quality, and animal performance in a tropical pasture. Scientific Report 2019, 9, 7596. [Google Scholar] [CrossRef] [PubMed]
- Euclides VPB; Costa FP; Macedo MCM; Flores R; Oliveira MP. Eficiência biológica e econômica de pasto de capim-tanzânia adubado com nitrogênio no final do verão. Pesquisa Agropecuária Brasileira 2007, 42, 1345–1355. [Google Scholar] [CrossRef]
- Euclides VPB; Thiago LRLS; Macedo MCM; Oliveira MP. Consumo voluntário de forragem de três cultivares de Panicum maximum sob pastejo. Revista Brasileira de Zootecnia 1999, 28, 1177–1185. [Google Scholar] [CrossRef]
- Euclides VPB; Cardoso EGC; Macedo MCM; Oliveira MP. Voluntary intake of Brachiaria decumbens cv. Basilisk and Brachiaria brizantha cv. Marandu under grazing. Revista Brasileira de Zootecnia 2000, 29, 2200–2208. [Google Scholar]
- Euclides VPB; Valle CB; Macedo MCM; Almeida RG; Montagner DB; Barbosa RA. Brazilian scientific progress in pasture research during the first decade of XXI century. Revista Brasileira de Zootecnia 2010, 39, 151–168. [Google Scholar] [CrossRef]
- Feitosa OS; Leite RC; Alexandrino E; Pires TJS; Oliveira LBT; Paula Neto JJ; Santos AC. Forage performance and cattle production as a function of the seasonality of a Brazilian tropical region. Acta Scientiarum. Animal Sciences 2022, 43, e53779. [Google Scholar] [CrossRef]
- Ferguson JE; Andrade RP. 1999. Andropogon gayanus in Latin America. In: D. S. Loch & J.E. Ferguson (Eds.), Forage Seed Production. Volume 2: Tropical and Subtropical Species. (pp. 381-386). CABI Publishing.
- Fonseca CEL; Pessoa Filho M; Braga GJ; Ramos AKB; Carvalho MA; Fernandes FD; Karia CT; Maciel GA; Athayde NB; Dessaune SN; Thomé SP; Garcia ACC. Near-infrared reflectance spectroscopy as a tool for breeding Andropogon gayanus Kunth for forage quality. Journal of Agriculture and Veterinary Science 2020, 13, 57–66. [Google Scholar] [CrossRef]
- Garay AH; Sollenberger LE; McDonald DC; Ruegsegger GJ; Kalmbacher RS; Mislevy P. Nitrogen fertilization and stocking rate affect stargrass pasture and cattle performance. Crop Science 2004, 44, 1348–1354. [Google Scholar] [CrossRef]
- Herling VR; Pedreira CGS; Luz PHC; Braga GJ; Marchesin WA; Macedo FB; Lima CG. Performance and productivity of Nellore steers on rotationally stocked palisadegrass (Brachiaria brizantha) pastures in response to herbage allowance. Journal of Agricultural Science 2011, 149, 761–768. [Google Scholar] [CrossRef]
- Inyang U; Vendramini JMB; Sollenberger LE; Sellers B; Adesogan A; Paiva L; Lunpha A. Forage species and stocking rate effects on animal performance and herbage responses of ‘Mulato’ and Bahiagrass pastures. Crop Science 2010, 50, 1079–1085. [Google Scholar] [CrossRef]
- Jank L; Barrios SC; Valle CB; Simeão RM; Alves GF. The value of improved pastures to Brazilian beef production. Crop and Pasture Science 2014, 65, 1132–1137. [Google Scholar] [CrossRef]
- Lascano, C. Thomas D. 1990. Quality of Andropogon gayanus and animal productivity. In J. M. Toledo, R. Vera, C. Lascano, & J. M. Lenné (Eds.), Andropogon gayanus Kunth. A grass for tropical acid soils. (pp. 247–276). CIAT.
- Machado LAZ; Fabrício AC; Gomes A; Assis PGG; Lempp B; Maraschin GE. Desempenho de animais alimentados com lâminas foliares em pastagem de capim-marandu. Pesquisa Agropecuária Brasileira 2008, 43, 1609–1616. [Google Scholar] [CrossRef]
- Maciel GA; Braga GJ; Guimarães Jr R; Ramos AKB; Carvalho MA; Fernandes FD; Fonseca CEL; Jank L. Seasonal liveweight gain of beef cattle on guineagrass pastures in the Brazilian Cerrados. Agronomy Journal 2018, 110, 480–487. [Google Scholar] [CrossRef]
- Martha Jr GB; Alves E; Contini E. Land-saving approaches and beef production growth in Brazil. Agricultural Systems 2012, 110, 173–177. [Google Scholar] [CrossRef]
- McManus C; Louvandini H; Carneiro HC; Lima PRM; Braccini Neto J. Production indices for dual purpose cattle in central Brazil. Revista Brasileira de Zootecnia, 2011, 40, 1576–1586. [CrossRef]
- Mganga KZ; Ndathi AJN; Wambua SM; Bosma L; Kaindi EM; Kioko T; Kadenyi N; Musyoki GK; van Steenbergen F; Musimba NKR. Forage value of vegetative leaf and stem biomass fractions of selected grasses indigenous to African rangelands. Animal Production Science 2021, 61, 1476–1483. [Google Scholar] [CrossRef]
- Moore JE; Mott GO. Recovery of residual organic matter from in vitro digestion of forages. Journal of Dairy Science 1974, 57, 1258–1259. [Google Scholar] [CrossRef]
- Parente L; Mesquita V; Miziara F; Baumann L; Ferreira L. Assessing the pasturelands and livestock dynamics in Brazil, from 1985 to 2019, A novel approach based on high spatial resolution imagery and Google Earth Engine cloud computing. Remote Sensing of Environment 2017, 232, 1–11. [Google Scholar] [CrossRef]
- Paula CCL; Euclides VPB; Montagner DB; Lempp B; Difante GS; Carloto MN. Sward structure, herbage intake and animal performance on marandu palisadegrass pastures subjected to continuous stocking. Arquivo Brasileiro de Medicina Veterinária e Zootecnia 2012, 64, 169–176. [Google Scholar] [CrossRef]
- Pereira JM; Tarré RM; Macedo R; Rezende CP; Alves BJR; Urquiaga S; Boddey RM. Productivity of Brachiaria humidicola pastures in the Atlantic forest region of Brazil as affected by stocking rate and the presence of a forage legume. Nutrient Cycling Agroecosystems 2009, 83, 179–196. [Google Scholar] [CrossRef]
- Ramírez-Restrepo CA; Vera RR. Bodyweight performance, estimated carcass traits and methane emissions of beef cattle categories grazing Andropogon gayanus, Melinis minutiflora and Stylosanthes capitata mixed swards and Brachiaria humidicola pasture. Animal Production Science 2019, 59, 729–740. [Google Scholar] [CrossRef]
- Rossiter-Rachor NA; Setterfield SA; Douglas MM; Hutley LB; Cook GD; Schimidt S. Invasive Andropogon gayanus (gamba grass) is an ecosystem transformer of nitrogen relations in Australian savanna. Ecological Applications 2009, 19, 1546–1560. [Google Scholar] [CrossRef]
- Rouquette Jr, FM. Invited Review: The roles of forage management, forage quality, and forage allowance in grazing research. The Professional Animal Scientist 2016, 32, 10–18. [Google Scholar] [CrossRef]
- SAS Institute Inc. 2020. SAS® Studio: Task Reference Guide. Cary, NC: SAS Institute Inc.
- Sollenberger LE; Cherney DJR. 1995. Evaluating forage production and quality. In RF Barnes, DA Miller; CJ Nelson (Eds.), Forages: The science of grassland agriculture (pp. 97–110). Ames, IA: Iowa State Univ. Press.
- Sollenberger LE; Moore JE; Allen VG; Pedreira CGS. Reporting forage allowance in grazing experiments. Crop Science 2005, 45, 896–900. [Google Scholar] [CrossRef]
- Sollenberger LE; Burns JC. Canopy characteristics, ingestive behaviour and herbage intake in cultivated tropical grasslands. International Grassland Congress 2001, 19, 321–327. [Google Scholar]
- Sollenberger LE; Vanzant ES. Interrelationships among forage nutritive value and quantity and individual animal performance. Crop Science 2011, 51, 420–432. [Google Scholar] [CrossRef]
- Sousa BML; Nascimento Júnior D; da Silva SC; Monteiro HCF; Rodrigues CS; Fonseca DM; Silveira MCT; Sbrissia AF. Morphogenetic and structural characteristics of andropogon grass submitted to different cutting heights. Revista Brasileira de Zootecnia 2010, 39, 2141–2147. [Google Scholar] [CrossRef]
- Thomas D; Andrade RP; Couto W; Rocha CMC; Moore P. Andropogon gayanus var. Bisquamulatus cv. Planaltina: principal forage characteristics. Pesquisa Agropecuária Brasileira 1981, 16, 347–355.
- Tilley JMA; Terry RA. A two-stage technique for the in vitro digestion of forage crops. Grass and Forage Science 1963, 18, 104–111. [Google Scholar] [CrossRef]
- Van Soest PJ; Robertson JB; Lewis BA. Methods for dietary fiber, neutral detergent fiber, and nonstarch polysaccharides in relation to animal nutrition. Journal of Dairy Science 1991, 74, 3583–3597. [Google Scholar] [CrossRef]
- Zimmer AH; Pimentel DM; Valle CB; Seiffert NF. 1983. Practical aspects in pastures formation. (In portuguese). Technical circular no. 12. Empresa Brasileira de Pesquisa Agropecuária (EMBRAPA) at the Centro Nacional de Pesquisa de Gado de Corte (CNPGC), Campo Grande, Brazil.
Figure 1.
Scatter plots of forage mass (FM, kg MS/ha); canopy height (CH, cm); leaf (%); stem (%); dead material (%); leaf-stem ratio; leaf bulk density (kg MS/ha/cm); leaf allowance (LA, kg MS of leaves/kg live weight); crude protein (CP, g/kg); in vitro dry matter digestibility (IVDMD, g/kg); neutral detergent fiber (NDF, g/kg) and acid detergent fiber (ADF, g/kg) with average daily gain (ADG, kg/bull/d) of Nellore bulls in pastures of Andropogon gayanus Kunth cv. Sarandi (SAR) and cv. Planaltina (PLA), Planaltina, FD, Brazil. Each point represents the mean value of each experimental unit (paddock). The ellipse represents the confidence limits at 90%.
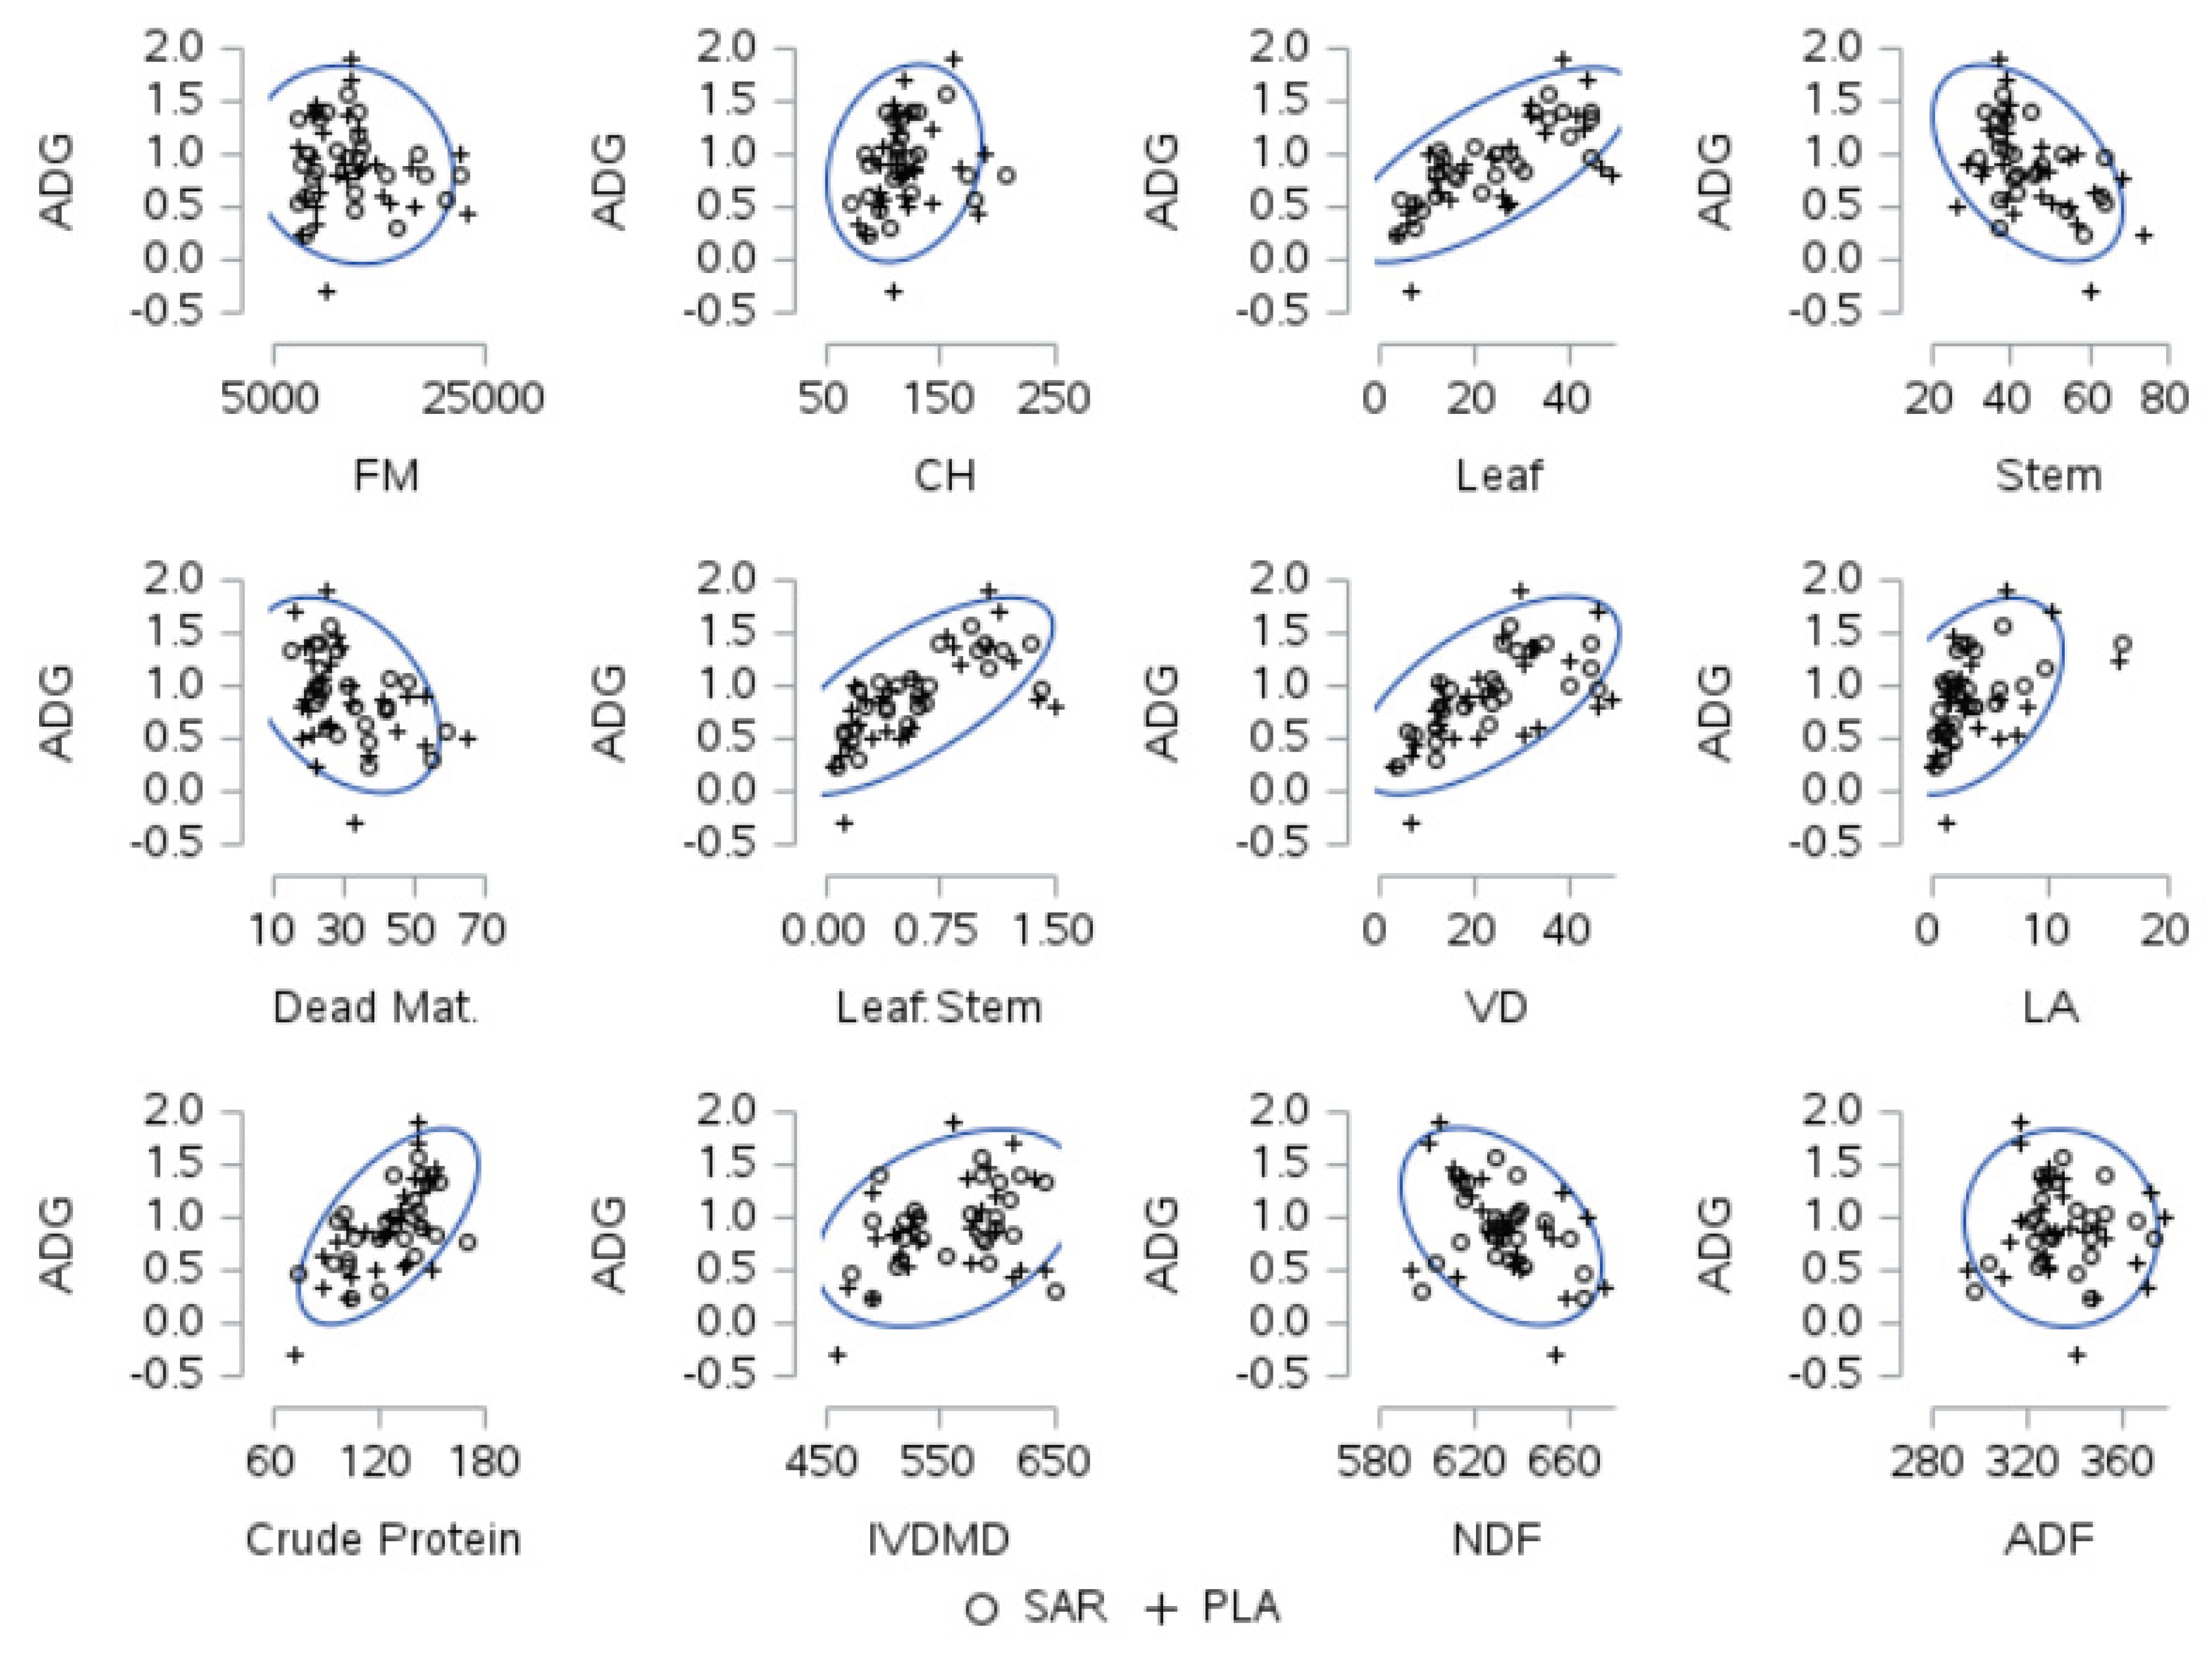
Figure 2.
Average daily live weight gain (ADG, kg/bull/d) of Nellore bulls in Andropogon gayanus Kunth pastures of cv. Sarandi (SAR) and cv. Planaltina (PLA) for low, medium and high stocking rates (SR) during three years (2018, 2018-2019 and 2020). Bars represent ± s.e. (standard error of the mean).
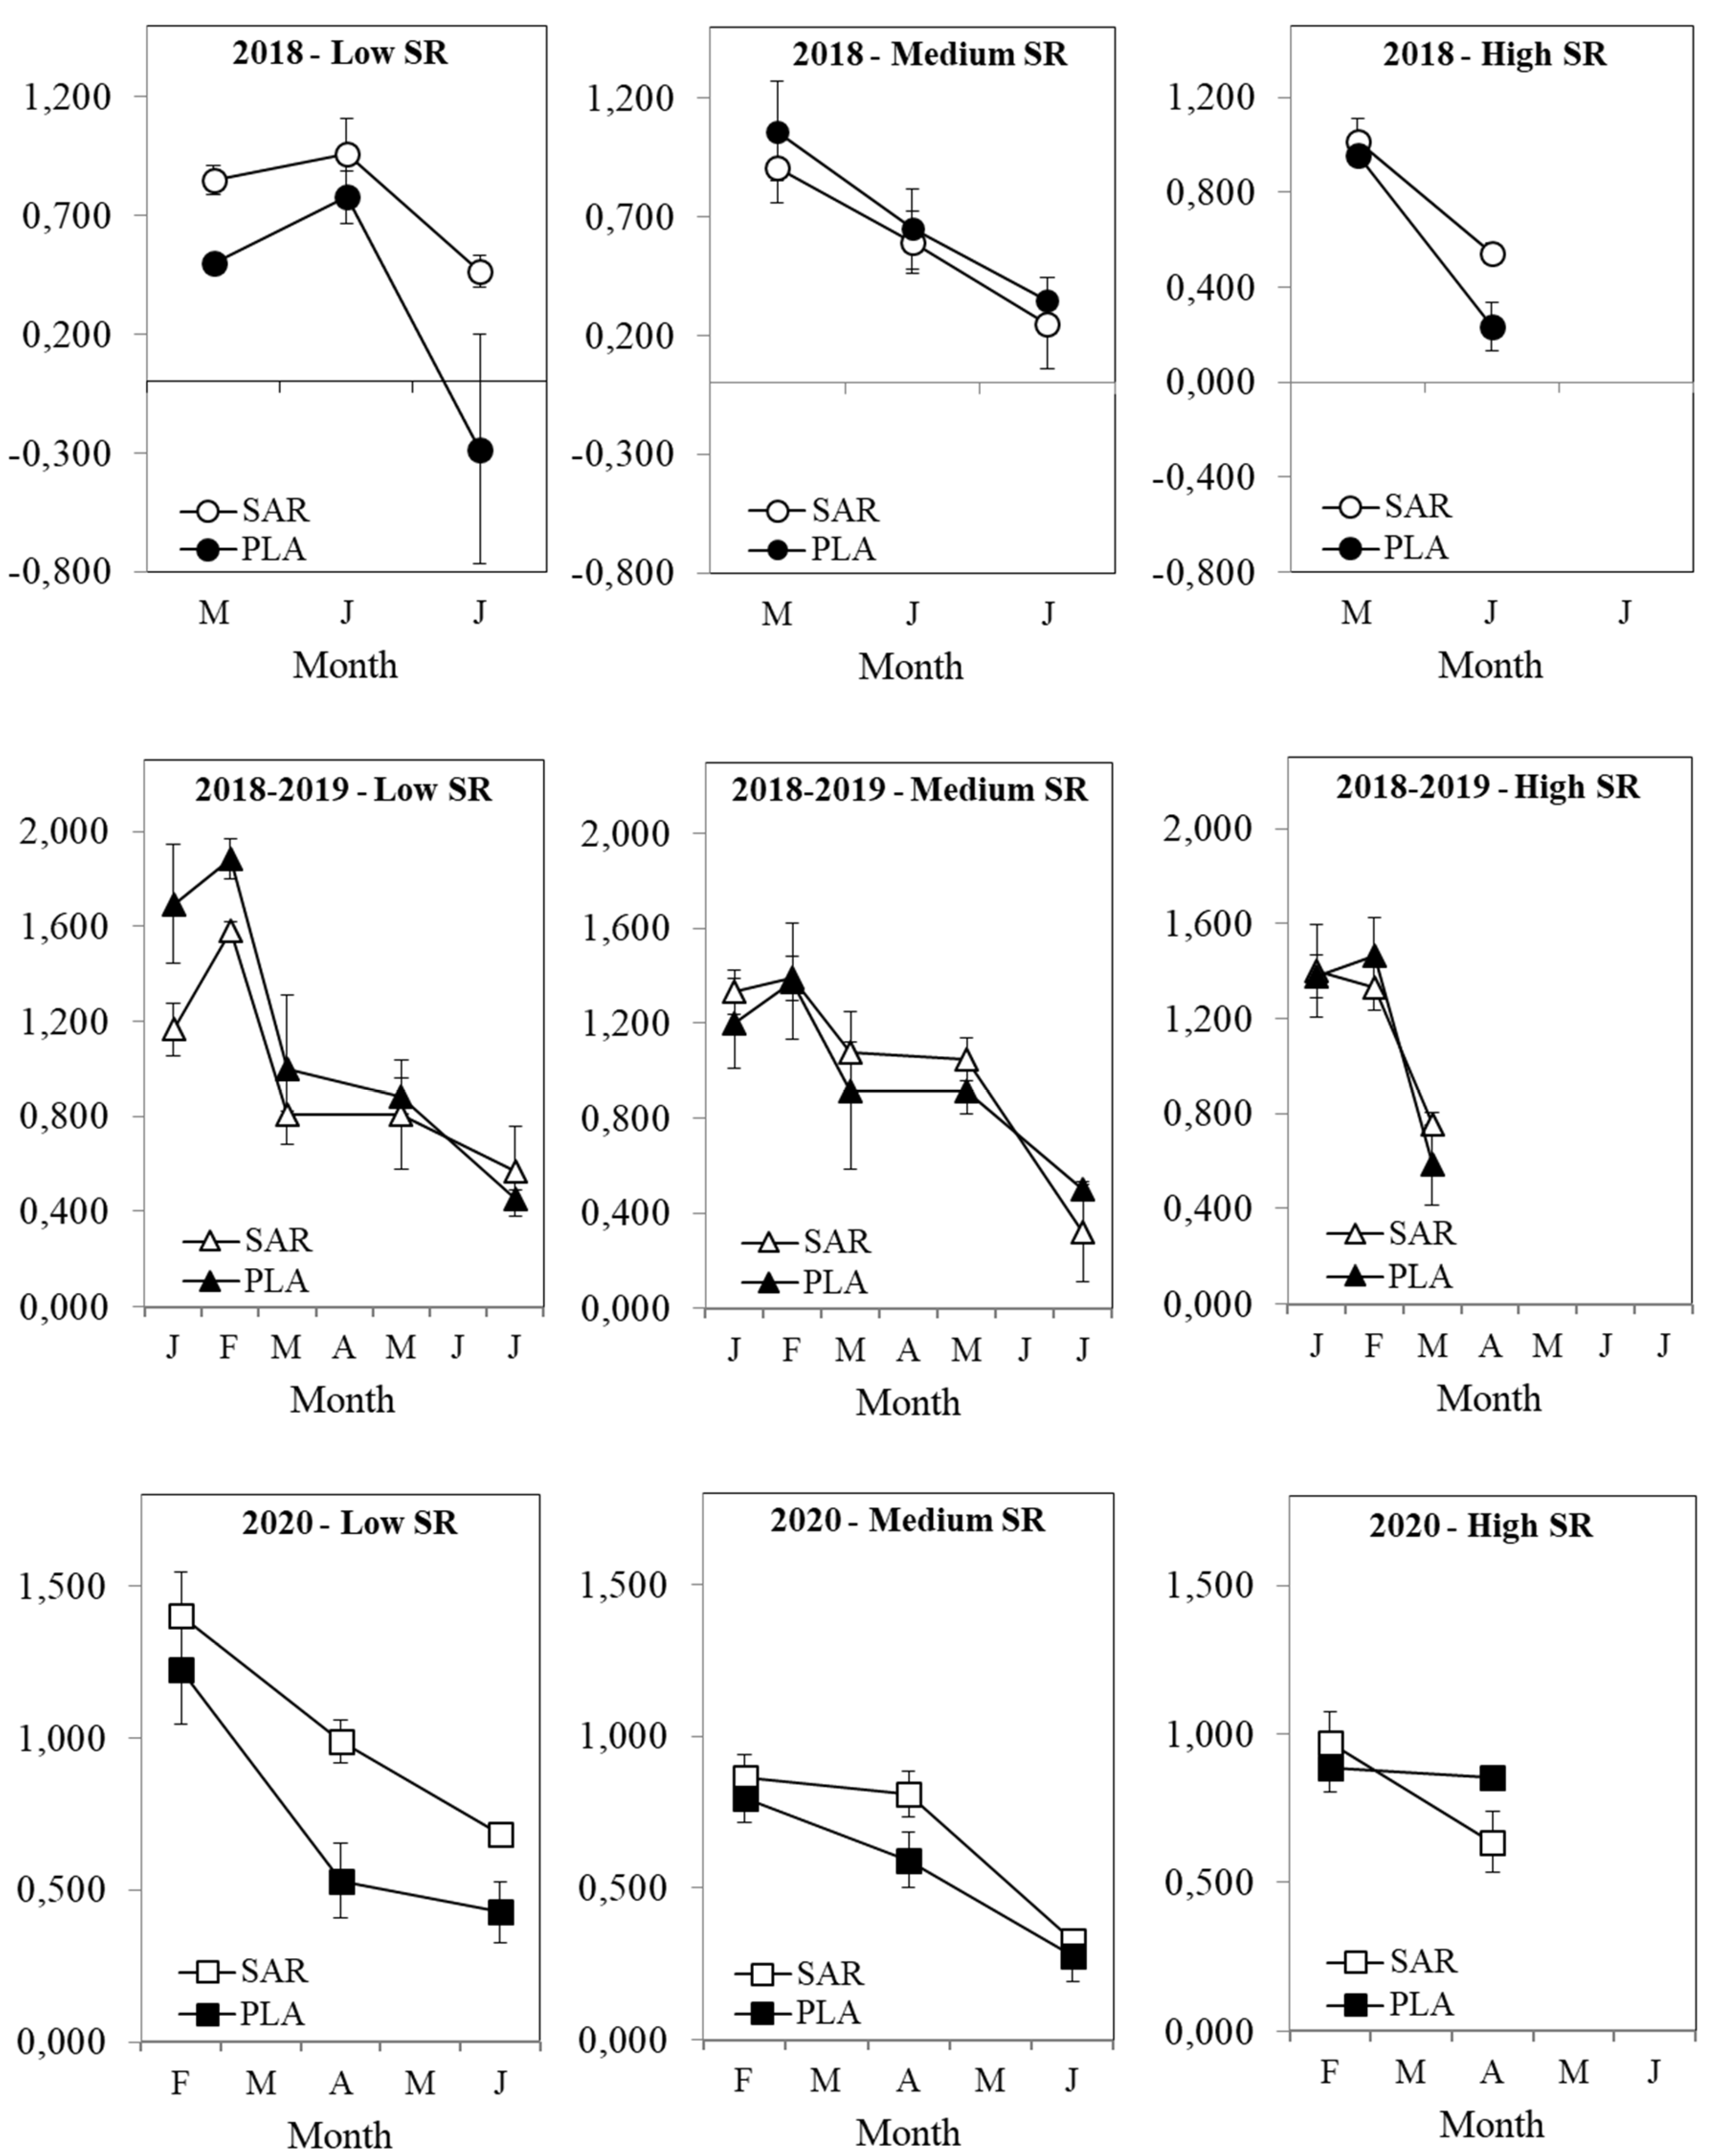
Figure 3.
Leaf:stem ratio of Andropogon gayanus Kunth cv. Sarandi (SAR) and cv. Planaltina (PLA) for low, medium and high stocking rates (SR) during three years (2018, 2018-2019 and 2020). Bars represent ± s.e. (standard error of the mean).
Figure 3.
Leaf:stem ratio of Andropogon gayanus Kunth cv. Sarandi (SAR) and cv. Planaltina (PLA) for low, medium and high stocking rates (SR) during three years (2018, 2018-2019 and 2020). Bars represent ± s.e. (standard error of the mean).
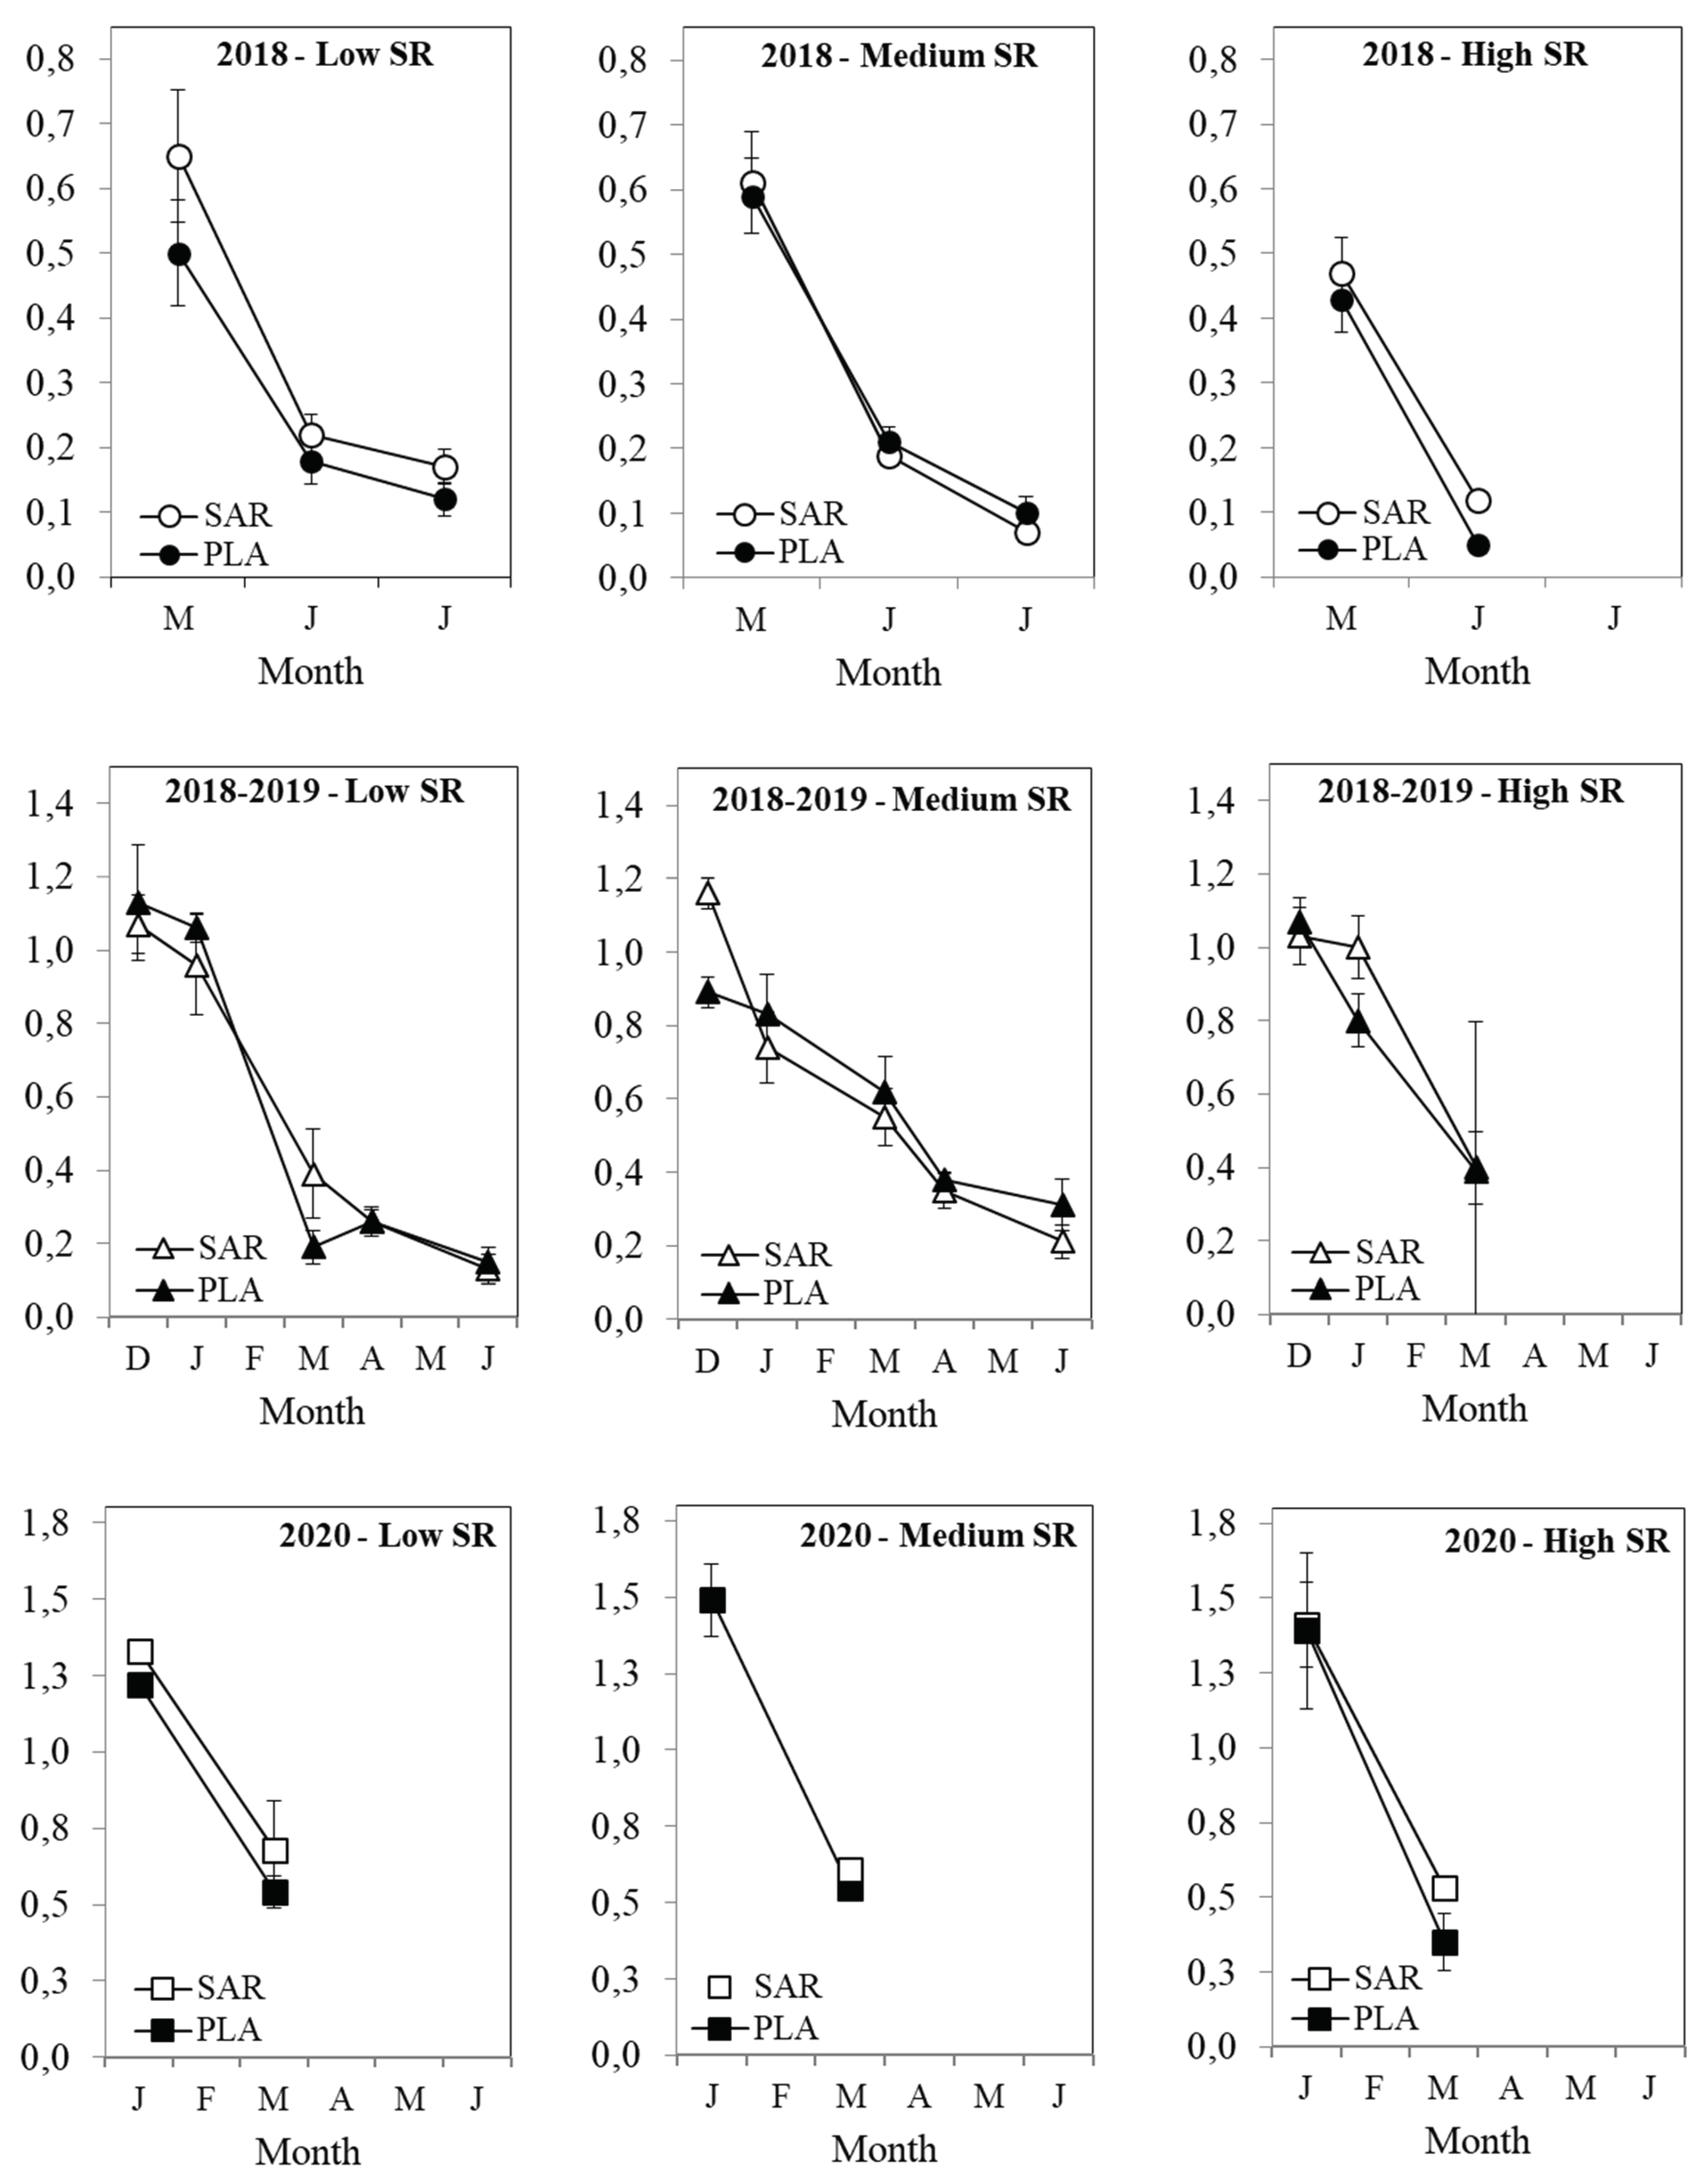

Table 1.
Monthly rainfall and daily mean air temperature of the experimental site1. Data comprised three experimental years (2018-2020) and historical series (1974-2013) of the site. Planaltina, FD, Brazil.
Table 1.
Monthly rainfall and daily mean air temperature of the experimental site1. Data comprised three experimental years (2018-2020) and historical series (1974-2013) of the site. Planaltina, FD, Brazil.
| Month | Rainfall (mm) | Mean air temperature (oC) | |||||||
| 2018 | 2019 | 2020 | 1974-2013 | 2018 | 2019 | 2020 | 1974-2013 | ||
| January | 150 | 27 | 365 | 239 | 22 | 23 | 22 | 22 | |
| February | 243 | 108 | 162 | 183 | 22 | 23 | 22 | 22 | |
| March | 194 | 270 | 263 | 201 | 22 | 22 | 22 | 23 | |
| April | 104 | 119 | 100 | 94 | 21 | 22 | 22 | 22 | |
| May | 4 | 35 | 29 | 24 | 20 | 22 | 20 | 21 | |
| June | 0 | 0 | 0 | 5 | 20 | 20 | 19 | 20 | |
| July | 0 | 0 | 0 | 4 | 20 | 19 | 19 | 20 | |
| August | 21 | 0 | 0 | 15 | 22 | 22 | 21 | 22 | |
| September | 36 | 0 | 45 | 37 | 23 | 25 | 23 | 23 | |
| October | 130 | 23 | 138 | 126 | 24 | 25 | 23 | 23 | |
| November | 333 | 179 | 240 | 189 | 21 | 23 | 22 | 22 | |
| December | 135 | 240 | 230 | 227 | 22 | 23 | 22 | 22 | |
1 data collected about 1,400 m from the experimental site.
Table 2.
Grazing periods over three years for cv. Sarandi and cv. Planaltina (Andropogon gayanus Kunth) pastures. Planaltina, FD, Brazil.
Table 2.
Grazing periods over three years for cv. Sarandi and cv. Planaltina (Andropogon gayanus Kunth) pastures. Planaltina, FD, Brazil.
| Year | Grazing Period |
| 2018 | 1) April 06 – May 09 |
| 2) May 09 – June 05 | |
| 3) June 05 – July 051 | |
| 2018-2019 | 1) Nov 27 – Jan 03 |
| 2) Jan 03 – Feb 14 | |
| 3) Feb 14 – Mar 18 | |
| 4) Mar 18 – May 091 | |
| 5) May 09 – July 021 | |
| 2020 | 1) Jan 07 – Feb 18 |
| 2) Feb 18 – Apr 07 | |
| 3) Apr 07 – June 011,2 |
1 High stocking rate block was not evaluated. 2 Forage mass, plant-part composition, canopy height and nutritive value samplings were not evaluated.
Table 3.
Average daily live weight gain (ADG) of young Nellore bulls in Gamba grass (Andropogon gayanus Kunth) pastures of cv. Sarandi and cv. Planaltina for three consecutive years. Planaltina, FD, Brazil.
Table 3.
Average daily live weight gain (ADG) of young Nellore bulls in Gamba grass (Andropogon gayanus Kunth) pastures of cv. Sarandi and cv. Planaltina for three consecutive years. Planaltina, FD, Brazil.
| Year | Cultivar | P | |
| Sarandi (mean±s.e.) | Planaltina (mean±s.e.) | ||
| kg/bull/d | |||
| 2018 | 0.670±0.066A | 0.490±0.066B | 0.0839 |
| 2018-2019 | 0.980±0.038 | 1.020±0.038 | 0.4089 |
| 2020 | 0.790±0.045A | 0.650±0.045B | 0.0412 |
Means followed by different capital letters in the row differ by the t test (P<0.10).
Table 4.
Forage mass (FM), plant-part composition (leaf, stem and dead material), canopy height (CH), crude protein (CP), in vitro dry matter digestibility (IVDMD), neutral detergent fiber (NDF) and acid detergent fiber (ADF) of gamba grass (Andropogon gayanus Kunth) cv. Sarandi and cv. Planaltina for three consecutive years. Planaltina, FD, Brazil.
| Variable | Cultivar (2018) | P | ||
| Sarandi (mean±s.e.) | Planaltina (mean±s.e.) | |||
| Canopy attributes | ||||
| FM (kg/ha) | 9231±315 | 9136±315 | 0.8309 | |
| Leaf (%) | 15±0.4A | 14±0.4B | 0.0558 | |
| Stem (%) | 57±0.8B | 60±0.8A | 0.0166 | |
| Dead Material (%) | 28±0.5A | 26±0.5B | 0.0134 | |
| CH (cm) | 91±1.3B | 96±1.3A | 0.0045 | |
| Nutritive value attributes | ||||
| CP (g/kg) | 114±3.4 | 109±3.4 | 0.2943 | |
| IVDMD (g/kg) | 540±7.8 | 535±7.8 | 0.6607 | |
| NDF (g/kg) | 640±3.5 | 643±3.5 | 0.5842 | |
| ADF (g/kg) | 331±3.2 | 334±3.2 | 0.5307 | |
| Variable | Cultivar (2018-2019) | P | ||
| Sarandi (mean±s.e.) | Planaltina (mean±s.e.) | |||
| Canopy attributes | ||||
| FM (kg/ha) | 13392±561 | 13984±561 | 0.4494 | |
| Leaf (%) | 23±0.6 | 22±0.6 | 0.3638 | |
| Stem (%) | 40±1.4 | 41±1.4 | 0.8953 | |
| Dead Material (%) | 37±1.4 | 37±1.4 | 0.8271 | |
| CH (cm) | 130±4.4 | 126±4.4 | 0.4936 | |
| Nutritive value attributes | ||||
| CP (g/kg) | 132±1.9 | 128±1.9 | 0.2021 | |
| IVDMD (g/kg) | 599±3.7 | 592±3.7 | 0.2032 | |
| NDF (g/kg) | 622±2.3 | 624±2.3 | 0.5960 | |
| ADF (g/kg) | 330±2.7 | 331±2.7 | 0.7376 | |
| Variable | Cultivar (2020) | P | ||
| Sarandi (mean±s.e.) | Planaltina (mean±s.e.) | |||
| Canopy attributes | ||||
| FM (kg/ha) | 14501±1011 | 13689±968 | 0.3433 | |
| Leaf (%) | 36±7.7 | 35±7.7 | 0.8602 | |
| Stem (%) | 36±4.6B | 42±4.6A | 0.0020 | |
| Dead Material (%) | 28±3.1A | 23±3.1B | 0.0056 | |
| CH (cm) | 122±1.3B | 130±0.9A | 0.0005 | |
| Nutritive value attributes | ||||
| CP (g/kg) | 127±2.8 | 129±2.8 | 0.5804 | |
| IVDMD (g/kg) | 515±10.8 | 508±10.8 | 0.4064 | |
| NDF (g/kg) | 639±4.8 | 641±4.8 | 0.6938 | |
| ADF (g/kg) | 350±8.2 | 343±8.2 | 0.2985 | |
Means followed by different capital letters in the row differ by the t test (P<0.10).
Table 5.
Forage mass (FM), plant-part composition (leaf, stem and dead material), canopy height (CH), crude protein (CP), in vitro dry matter digestibility (IVDMD), neutral detergent fiber (NDF) and acid detergent fiber (ADF) of gamba grass (Andropogon gayanus Kunth) cv. Sarandi and cv. Planaltina for grazing periods in three consecutive years. Planaltina, FD, Brazil.
| Variable | Period (2018) | P | Period (2018-2019) | P | Period (2020) | P | |||||||
| May 3 | Jun 5 | Jul 41 | Dec 17 | Jan 15 | Mar 20 | Apr 301 | Jun 241 | Jan 28 | Mar 12 | ||||
| Canopy attributes | |||||||||||||
| FM (kg/ha) | 8469 | 9525 | 9555 | • | 10151 | 10874 | 14638 | 14353 | 18424 | *** | 12735 | 15343 | ** |
| ±351 | ±351 | ±464 | ±788 | ±788 | ±788 | ±1017 | ±1017 | ±554 | ±480 | ||||
| Leaf (%) | 27 | 11 | 5 | *** | 41 | 35 | 16 | 13 | 8 | *** | 46 | 25 | *** |
| ±0.5 | ±0.5 | ±0.6 | ±1.0 | ±1.0 | ±1.0 | ±1.2 | ±1.0 | ±1.1 | ±1.0 | ||||
| Stem (%) | 51 | 65 | 59 | *** | 39 | 39 | 41 | 44 | 41 | NS | 33 | 46 | *** |
| ±0.9 | ±0.9 | ±1.2 | ±2.1 | ±2.1 | ±2.1 | ±2.7 | ±2.1 | ±0.3 | ±0.3 | ||||
| Dead Mat. (%) | 22 | 24 | 36 | *** | 20 | 26 | 43 | 43 | 51 | *** | 21 | 29 | *** |
| ±0.6 | ±0.6 | ±0.7 | ±2.1 | ±2.1 | ±2.1 | ±2.7 | ±2.1 | ±1.0 | ±0.8 | ||||
| CH (cm) | 100 | 95 | 86 | *** | 112 | 132 | 138 | 127 | 133 | • | 126 | 126 | NS |
| ±1.4 | ±1.4 | ±1.8 | ±6.1 | ±6.1 | ±6.1 | ±7.9 | ±7.9 | ±1.1 | ±1.1 | ||||
| Nutritive value attributes | |||||||||||||
| CP (g/kg) | 142 | 98 | 95 | *** | 144 | 146 | 143 | 105 | 112 | *** | 127 | 127 | NS |
| ±4.2 | ±4.2 | ±4.2 | ±2.9 | ±2.9 | ±2.9 | ±2.9 | ±3.6 | ±2.5 | ±2.5 | ||||
| IVDMD (g/kg) | 599 | 514 | 500 | *** | 619 | 584 | 547 | 595 | 634 | *** | 495 | 523 | *** |
| ±9.5 | ±9.5 | ±9.5 | ±5.6 | ±5.6 | ±5.6 | ±5.6 | ±7.1 | ±3.9 | ±3.9 | ||||
| NDF (g/kg) | 630 | 639 | 655 | ** | 613 | 617 | 643 | 639 | 600 | *** | 646 | 635 | * |
| ±4.3 | ±4.3 | ±4.3 | ±3.5 | ±3.5 | ±3.5 | ±3.5 | ±4.5 | ±3.5 | ±3.5 | ||||
| ADF (g/kg) | 326 | 328 | 343 | ** | 327 | 330 | 354 | 342 | 301 | *** | 356 | 335 | *** |
| ±3.9 | ±3.9 | ±3.9 | ±4.1 | ±4.1 | ±4.1 | ±4.1 | ±5.2 | ±3.4 | ±3.4 | ||||
1 High stocking rate block was not evaluated for canopy and nutritive value attributes in this grazing period. Means are followed by the ± s.e. (standard error of mean) in italic. NS non-significant, • P<0.10, * P<0.05, ** P<0.01, *** P<0.001.
Disclaimer/Publisher’s Note: The statements, opinions and data contained in all publications are solely those of the individual author(s) and contributor(s) and not of MDPI and/or the editor(s). MDPI and/or the editor(s) disclaim responsibility for any injury to people or property resulting from any ideas, methods, instructions or products referred to in the content. |
© 2024 by the author. Licensee MDPI, Basel, Switzerland. This article is an open access article distributed under the terms and conditions of the Creative Commons Attribution (CC BY) license (https://creativecommons.org/licenses/by/4.0/).
Copyright: This open access article is published under a Creative Commons CC BY 4.0 license, which permit the free download, distribution, and reuse, provided that the author and preprint are cited in any reuse.


