
Submitted:
22 March 2024
Posted:
25 March 2024
You are already at the latest version
Abstract
The bioactive marine sulfated polysaccharides ulvan and carrageenan, formulated in gels at 1.5, 5.0 and 10% w/w concentrations, were evaluated for their wound healing potential on second-degree burn wounds. The polysaccharide-based gels were administered on the burn-inflamed skin of hairless female SKH-hr2 mice, and the therapeutic effect of the various treatments was assessed based on histopathological analysis, the clinical condition of mice, photo-documentation, evaluation of biophysical skin parameters, and FT-IR spectroscopy.Clinical and histopathological assessment, as well as the reduction rate of the burn wound area, indicated that the 10% w/w carrageenan gel significantly enhanced wound healing, especially at the early stages of the healing process, recovering both the α-helix of collagen and the glycosaminoglycans configuration as evidenced by the FT-IR absorption bandsof skin in vivo and ex vivo. At later stages, the healing effect of the 5% w/w ulvan gel was also notably significant, indicating that carrageenan and ulvan wound dressing gels could potentially contribute to the efficient wound healing of burn wounds.
Keywords:
second-degree burn
; mice
; carrageenan
; ulvan
; wound healing
1. Introduction
Burn wounds represent a major public health issue with significant morbidity and mortality. They are associated with prolonged hospitalization, disfigurement, disability, and social stigma, while in severe cases their outcome can be fatal, as according to the World Health Organization (WHO) approximately 11 million burn injuries and 180,000 deaths related to severe burns is estimatedtooccur annually worldwide [1,2,3,4]. They are among the most common injuries of the skin and depending on the depth of skin injury, they are classified as superficial/epidermal (1st degree), partial-thickness (2nd degree), and full-thickness (3rd degree) burns [5].
Wound healing occurs as a natural response of the body to restore its injured tissues. It is a dynamic and complex process consisting of four interconnected and often overlapping phases that include haemostasis, inflammation, proliferation, and remodeling. Characterized by various biophysiological functions and different predominant cells, the proper sequence, duration, and intensity of these phases are crucial for the complete healing of the wounds [6].With several biological events and biochemical components involved in each phase, the breakdown of this well-coordinated sequence results in incomplete wound healing, affecting ultimately the functional recovery of the wound [6].
To facilitate the healing process, various wound dressings have been developed over the years. Wound dressings should have the ability to restore theskin barrier function, prevent infection, manage fluid loss, control the excess of exudates, and reduce scar formation [7]. The selection of suitable materials that can promote wound healing is of high importance for designing effective wound dressings.
Recently, marine polysaccharides have emerged as valuable biomaterials for the development of advanced wound dressing systems [8,9,10,11]. Marine polysaccharides are highly biocompatible, biodegradable, and abundant biopolymers with diverse structures and functionalities [12,13]. Exhibiting unique physicochemical properties and a broad spectrum of biological activities, they are attracting considerable attention for their utilization as safe biomaterials in various novel biomedical systems [14,15,16,17,18,19]. Due to their ability to absorb wound fluids and maintain a moist environment in the wound area, they are considered ideal wound dressing components promoting various phases of endogenous wound healing in different types of wounds when formulated in films, fibers, and hydrogels [9,20].
Among them, ulvans, amply present in the cell walls of green macroalgae of the order Ulvales,arecomplex anionic sulfated polysaccharides that are mainly composed of sulfated rhamnose, glucuronic and iduronic acids, and xylose [21,22,23]. Exhibiting chemical analogy to glycosaminoglycans, intrinsic cytocompatibility, and significant antioxidant, anti-inflammatory, antiviral, antihyperlipidemic, and antitumor activity, ulvansare attractiveas biomaterial for the development of hybrid composites, particles, nanofibrous matrices, hydrogels, multilayer films, membranes, and polyelectrolyte complexes [24,25,26,27,28,29,30,31,32,33,34,35,36]. Due to the presence of rare sugars, such as sulfated rhamnose and iduronic acid that may enhance their wound healing potential, theyare considered a promising biopolymer for the development of novel wound dressing systems for the treatment of various skin inflammations [11,37,38].
Carrageenans are the main components of the cell walls of many red seaweeds. They are anionic sulfated polysaccharides composed of alternating units of D-galactose and 3,6-anhydro-D-galactose linked by α-(1,3) and β-(1,4) glycosidic bonds and depending on the sulfation degree and the 3,6-anhydro-D-galactose content, they are classified into three principal forms, namely kappa (κ)-, iota (ι)-, and lambda (λ)-carrageenans[10,15,39,40,41,42,43]. Due to their low cost, resemblance to native glycosaminoglycans, and significant biological activities (antioxidant, anti-hyperlipidemic, anticoagulant, antiviral, antitumor, and immunomodulatory), they are widely used in the food, cosmetics, and pharmaceutical sectors [39,40,44,45]. Among them, κ-carrageenansexhibiting enhanced gelling properties, are considered a promising biopolymer for tissue regeneration and wound healing applications [10,44,46,47].
Carrageenans at concentrations ranging from 0.5 to 1.5% w/w haveshown potential wound healing enhancement both in vivo [48,49] and in vitro [50]. However, carrageenans have never been tested at higher doses. Additionally, ulvans have shown in vitro antioxidant and antibacterial properties at concentrations of 5%, 7.5% and 10% w/w [33].
The aim of the present study was to investigate the healing efficacy of ulvan and carrageenan at concentrations between 1.5 to 10% w/w, to define the optimal beneficial dose for the successful treatment of second-degree burns in mice and compare the healing potential of the two polysaccharides.
Thus, in the present work, we have investigated the burn wound healing potential of ulvan and carrageenan, formulated in gels for topical application on second-degree burn wounds. Gels of 4% polyacrylamide, C13-14 isoparaffin and laureth-7, incorporatingulvan or carrageenan at 1.5, 5.0, and 10% w/w, were prepared and evaluated for their wound healing efficacy on the burn-inflamed skin of SKH-hr2 hairless female mice. To evaluate and compare the therapeutic effect of the two polysaccharides, histopathological analyses and clinical evaluation of the skin were performed. Wound area, skin texture, and hemoglobin levels were determined using photo-documentation, while biophysical skin parameters, such as transepidermal water loss (TEWL), hydration, and skin thickness, were also assessed. Moreover, the wound healing efficacy of the biopolymer-based gels was evaluated by recording in vivo the changes in the skin of mice before, during, and at the end of the treatment, by FT-IR spectroscopy.
2. Materials and Methods
2.1. Materials
PIL (Polyacrylamide, C13-14 Isoparaffin and Laureth-7) (Seppic, France) was used for the preparation of the gels, as increasing viscosity factor.
2.2. Isolation and Characterization of Marine Polysaccharides
Specimens of the green alga Ulva rigida were collected from the island of Kefalonia, Greece. After cleaning thoroughly from foreign materials, the algal specimens were washed under seawater and fresh water, air dried, and finally milled in small pieces. For the extraction of ulvan,100g of the milled algal biomass were soaked in 2 L of distilled H2O and heated in an autoclave for 20 min at 121 ℃. Subsequently, the hot aqueous extract was filtered through a cotton cloth, and the resulting filtrate was left to cool at room temperature. For the precipitation of the polysaccharide, ethanol (96% v/v) was added to the filtrate (four times the volume of the filtrate) and the suspension was stored overnight at 4 ℃. Finally, the resulting precipitate was filtered through a cotton cloth, washed with ethanol, sonicated for 60 min in an ultrasonic bath, filtered under vacuum, and lyophilized overnight to afford ulvan in the form of an off-white powder, which was milled before use. The characterization of ulvan was performed as previously described [37]. The isolatedulvan had a molecular weight distribution centered at approx. 1,080 kDa and a sulfate content of 48.2% on a dry weight basis. The FT-IR spectrum of ulvan exhibited characteristic absorption bands at 3350, 1610 and 1030 cm-1 attributed to the stretching vibrations of -OH, –C=O and C–O–C groups, respectively, while the characteristic absorption bands of the S=O and C-O-S groups were observed at 1208 and 845 cm-1, respectively.
Specimens of the red algaHypneamusciformis were collected from the island of Ithaca, Greece. After cleaning thoroughly from foreign materials, the algal specimens were washed under seawater and fresh water, air dried, ground into powder, and finally subjected to Soxhlet extraction with methanol for the removal of pigments. For the extraction of carrageenan, 100g of the depigmented, dried algal biomass were soaked in 15 L NaOH (1 M) and heated for 3 h at 90 ℃ under stirring. After the adjustment of the pH to 8 by the addition of HCl,the hot aqueous extract was filtered through a cotton cloth,and the filtrate was concentrated under reduced pressure to half of its volume.For the precipitation of the polysaccharide, ethanol 96% (v/v) was added to the filtrate (twice the volume of the concentratedfiltrate) and the suspension was stored overnight at 4 ℃. Following centrifugation (5,000 rpm, 20 min) of the suspension at room temperature, the precipitate was washed with ethanol, sonicated for 60 min in an ultrasonic bath, filtered under vacuum, and lyophilized overnight. Subsequently, the obtained crude polysaccharide after being dissolved in distilled H2O, was dialyzed using cellulose membranefor 24 hagainst dd. H2O, and finally lyophilized overnight to afford pure carrageenan in the form ofoff-white flakes. The isolated carrageenan,which was identified as κ-carrageenan, had a molecular weight distribution centered at approx. 290kDa, and a sulfate content of 29.6% on a dry weight basis.The FT-IR spectrum of κ-carrageenan displayed characteristic absorption bands at 3369, 1224 and 1036 cm-1 attributed to the stretching vibrations of -OH, -S=O and C-O-C groups, respectively. The absorption bands at 928 cm-1 and 845 cm-1 indicated the presence of 3,6-anhydro-D-galactose and D-galactose-4-sulphate, respectively [46,51,52,53].
2.3. Preparation of Topical Gels
The topical gels were prepared by dissolving ulvan or carrageenan at concentrations of 1.5%, 5% and 10% w/w in water for injection (Demo, Greece) followed by gradual addition of PIL(4% w/w). Subsequently, the obtained formulations were homogenized using VirTis TEMPEST VirTishearhomogenizer (Gardiner, USA) and stored at 2-6°C.
2.4. Animals
The experimental procedures were performed in accordance with the animal care guidelines established by the European Council Directive 2010/63/EU. The experiment was carried out after the positive opinion of the Animal Protocols Evaluation Committee and the approval from the Greek Peripheral Veterinary Authority (Protocol Number:775329/09-08-22). Female SKH-hr2 hairless mice (2–5 months, 25-30g) were obtained from the Small Animal Laboratory of the Section of Pharmaceutical Technology, Department of Pharmacy, National and Kapodistrian University of Athens. The animals were housed under laboratory conditions in a controlled environment (temperature 22-25 °C and humidity 30-55%) with12 h light–12 h dark cycle with food (Nuevo S.A., Greece) and water available ad libitum.
2.5. Burn Wound Model and Study Design
Mice were anaesthetized by intraperitoneal administration of 100 mg/kg ketamine (Narketan 10, 100 mg/ml, France) and 7 mg/kg xylazine (Xylapan 20 mg/ml, France). Burn wounds were induced on the upper dorsal skin of the mice, 2 cm below the ears, as previously described [54]. This procedure, according to prior histopathological assessment of the burn wound severity, induces second-degree burns [54]. All animals received paracetamol (Vianex, Greece) dissolved in their water for 3 days to relieve pain. The gels were applied once per day and the burn wound was covered by Fixomull Stretch Self Adhesive Gause (BSN Medical, Germany) combined with Medicomp non-woven gauze (Hartmann, Germany). The adhesive was cut in a hexagon shape to prevent restricting the movement of the mice. The experiment was terminated when complete wound closure was achieved for 80% of mice in one of the treatments. For the wound healing evaluation, the animals were divided according to the administered gel in eight groups with seven animals in each group (n=7) (Table 1).
2.6. Burn Wound Healing Assessment
2.6.1. Clinical Evaluation and Assessment of Wound Area, Skin Texture and Haemoglobin
The mice were subjected daily to macroscopic examination, and photo-documentation was conducted using a Nikon D5100 digital camera equipped with an AF-S Micro Nikkor 60 mm f/2.8 G ED lens (Nikon, Japan) on the first and every two days. The digital camera was positioned at a fixed distance of 20 cm perpendicular to the subject.
An Antera 3D camera (Miravex, Ireland) was used at the beginning, every other day and the end of the experiment to measure the wound area (mm²) and evaluate skin texture and haemoglobin levels. The Antera 3D image analysis system usedlight-emitting diodes (LEDs) in order to achieve high-precision analysis [55].
2.6.2. Assessment of Biophysical Skin Parameters
Non-invasive biophysical methods were used to evaluate transepidermal water loss (TEWL), hydration and skin thickness, before the burn induction and after treatment. TEWL (g/m 2/h) and hydration (AU) were measured using Tewameter TM 300 (Courage + Khazaka Electronic GmbH, Germany) and Corneometer CM820 (Courage + Khazaka Electronic GmbH, Germany), respectively. Skin thickness (mm) was measured using an electronic digital caliper (Powerfix Prof Milomex Ltd., Great Britain). Before every measurement the skin was thoroughly cleaned by wiping with sterilized gauze.
2.6.3. Histopathological Analysis
At the end of the experiment, the mice were sacrificed by cervical dislocation and skin samples of the burn wound area were obtained and evaluatedhistopathologically. The skin samples were immersed in 37% formaldehyde solution, embedded in paraffin wax, and sectioned at 5 µm thickness. Sections were stained by hematoxylin-eosin and photographed under 100x magnification, to blindly evaluate the extent of inflammation, oedema, hyperkeratosis, wound thickness, as well as the presence of ulceration, necrosis, and parakeratosis. The evaluation was based on the criteria shownin Table 2.
2.6.4. Measurement of FT-IR Spectra
Fourier transform infrared (FT-IR) spectroscopy is considered a valuable, sensitive, low-cost, fast, and non-invasive technique forthe characterization and identification of the molecular structures of human skin tissues and other complex systems. FT-IR can provide information for all components of biological tissues or liquid samples. The advantage of FT-IR spectroscopy is that all components of the samples are recorded simultaneously. Additionally, biological samples do not require any special preparation, such as coloring or demineralization, as needed in classical histopathology [56]. The FT-IRspectra were recorded in vivowith a 4300 handheld FT-IR spectrometer (Agilent Technologies, Malaysia) equipped with an attenuated total reflection (ATR) crystal, with a resolution of 4 cm-1 and 60 scans/spectrum.
2.6.5. Statistical Analysis
All data were tested concerning normality using the Sapiro-Wilk test. The statistical significance between the groups was determined by Student’s t-test, one-way analysis of variance (ANOVA) and their non-parametric equivalents Wilcoxon-rank test and Kruskal-Wallis test, respectively. A p-value of0.05 was considered statistically significant. Statistical analysis and graph creation were conducted using GraphPad Prism 8.4.3 (GraphPad Software, Inc.).
3. Results
3.1. Clinical Evaluation
Representative digital images of burn wound areas of mice receiving different medications, at various concentrations, are presented for days 1, 3, 6, 15, 21, 23, and 26 of treatment in Figure 1. A comparison among these images revealed that mice treated with the 10% w/w carrageenan gel and the 5% w/wulvan gel exhibited the highest healing efficacy.
From these images, it was observed that on day 21,the 10 % w/w carrageenan gelshowed full wound closure in most of the mice, while 1.5 and 5%w/w carrageenan gels showed comparatively no particular healing effect.
Ulvan gel at the concentration of 5% w/w also exhibited significant healing efficacy. On day 23, the 5% w/wulvan gel showed full wound closure in most of the mice, while ulvan gels at concentrations of 1.5 and 10% w/w showed no healing effect.
The vehicle, in relation to the control, appeared to be slightly toxic, showing intense erythema and oedema at the period of days 8-13 and hypertrophic scar formation.
3.2. Assessment of Burn Wound in Relation to the Recovery of the Damaged Area
Figure 2(A) depicts the histograms of wound area reduction, while Figure 2 (B) shows the rate of reduction in the damaged wound area resulting from linear regression analysis (Table 3).
Figure 2A indicates that on day 6, the 10% w/w carrageenan gel significantly decreased the wound area in relation to the control and the other treatments (p0.05).On day 23, mice receiving the 10% w/w carrageenan gel still had significantly smaller wounds than those treated with the gel consisting only of the excipients.
Linear regression analysis data revealed that,during the first half of the healing process (days 1–15), the 10% w/w carrageenan gel exhibited the highest healing rate (Table 3). Ulvan appeared to have a beneficial impact during the latter half of the healing process (days 15–26).
3.3. Histopathological Evaluation
The results of skin biopsies concerning inflammation (Infl), oedema (Oed), hyperkeratosis (HPKe), wound thickness (WTh), ulceration &necrosis (Ulce&Ne) and parakeratosis (PKe) are presented in Figure 3 and Table 4. Based on these data, it was concluded that treatment with the 10% w/w carrageenan (score 4.6) and the 5% w/w ulvan (score 6.4) gels reduced inflammation, and no significant hyperkeratosis of the overlying epidermis was observed.
On the contrary, treatments with the 1.5% w/wulvan(score 9.2) and 10% w/w ulvan (score 8.7), 1.5%w/w carrageenan (score 10.0) and 5% w/w carrageenan (score 12.0) gels gave slightly better histological evaluation than the control (score 12.0), showing moderate inflammation, oedema, and hyperaemic vessels. In the case of the vehicle (score 12.4), severe inflammation, with intense dilatation, hyperaemia of the vascular branches, as well as intense inflammatory infiltrations with the presence of lymphocytes, plasma cells and numerous polymorphonuclear leukocytes was detected. According to the scoring system described in Table 2, the 10% w/w carrageenan gel achieved the lowest score and the vehicle the highest (Figure 3).
3.4. Assessment of Haemoglobin Levels and Skin Texture
The histograms of haemoglobin and skin texture of mice, receiving different treatments in relation to time, are presented in Figure 4. Analysis of haemoglobin levels showed that on day 6, when the wounds attained their maximum size, the vehicle group had significantly higher haemoglobin values compared to the 5% ulvan and 10% carrageenan groups, which was associated with intense inflammation. The haemoglobin levels of the various treatments presented no statistically significant differences between the first and last day of the experiment (Figure 4A).
Concerning the skin texture, on the last day of the experiment, all treatments returned to their initial values (Figure 4B).
3.5. Evaluation of Biophysical Parameters
The biophysical parameters of skin hydration, TEWL, and thickness in relation to time, are presented in Figure 5.
- Analysis showed that on day 26, the hydration of the mice skin treatedwith the 5% w/w ulvan and 10% w/w carrageenan gels was significantly higher compared to day 0, while in all other cases the hydration returned to normal (Figure 5A). TEWL didnot recover to normal with any of the treatments, which indicates that the skin barrier did not return to its normal structure (Figure 5B). Skin thickness was significantly increased in all cases, which is justified after the burn injury (Figure 5C).
3.6. FT-IR Spectroscopic Analysis of Mice Skin
To identify the changes in skin tissue biological components at a molecular level after therapeutic application, FT-IR spectra were recorded in all mice, using a handheld FT-IR spectrometer, whichprovided the advantageto record,in vivo, the skin changes before, during, and at the end of the therapeutic schemes. Figure 6presents representative FT-IR spectra of the skin before and at the end of treatment with carrageenan and ulvanat various concentrations.
The FT-IR spectrashowed animportant band intensity and shift differences across the entire spectral region between 4000-800 cm-1. It was also observed that the mice did not react to the wound healing treatmentin the same way.
Since the clinical and histological results showed that the 10% w/w carrageenan and 5% w/w ulvan gels significantly enhanced the wound healing process, we compared the FT-IR spectra of the skin of mice treated with the corresponding gels (Figure 7).
The observed positive absorption bandsin the subtracted spectrum indicated that, in skin treated with the 10% w/w carrageenan gel, the α-helix conformation of protein secondary structure predominates. The shift of thevNH absorption bands of proteins in the spectrum of skin treated withthe 5% w/w ulvangel from about 3300 cm-1, typical for normal protein secondary structure, to a lower frequency at3237 cm-1, combined with the increased intensity at 2922 cm-1and 2858 cm-1 assigned to vasCH2 and vsCH2, respectively, indicated that after treatment, cell membranes became more lipophilic. This lipophilic environment promoted the production of aggregates, leading to protein misfolding and the adoption of a β-sheet secondary conformation by the proteins [56,57]. These observations were confirmed by the other measurements where it was found that the skin was dehydrated. The negative peaks in the amide I and amide II absorption bands of the subtracted spectrum confirm that the skin of the mice treated with the 5% w/w ulvangel exhibits the formation of protein β-sheets, attributed to the wound and inflammation of the skin. This was further confirmed by the “diagnostic band” at approximately 1740 cm-1. The most important indicator of the curative effect of the 10% w/w carrageenan gel was the appearance of the band in the region 1230-1000 cm-1, which is assigned to vC-O-C attributed to aminoglycans, indicating the formation ofcollagen and elastin.
4. Discussion
Clinical evaluation demonstrated that the mice treated with the 10% w/wcarrageenan gel showed significantly enhanced wound healing in comparison to all other groups. The mice in this group approached almost complete wound closure, earlier than the other groups, from day 21 (Figure 1). Mice treated with the 5% w/w ulvan gel also demonstrated a significant healing effect, ranking second to the group which was treated with the 10% w/w carrageenan gel, asthey approached total wound healing on day 23 (Figure 1).
During the experiment, the wound area was measured on various days and the healing rate was calculated. The measurement of wound areas revealed that mice treated with the 10% w/w carrageenan gel exhibited significantly smaller wounds compared to all other groups starting from day 6.This statistically significant difference in wound area was maintained for the vehicle group until the end of the experiment (Figure 2A).
The 10% w/w carrageenan gel accelerated the healing process significantly in the first 15 days of the experiment, having the greatest slope compared to all other treatments (Figure 2B, Table 2). The 5% w/w ulvan gel appeared to accelerate the healing process during the second period, from day 15 to 26 (Figure 2B). It seems that the process of wound healing can be divided into two distinct phases, each progressing at a different rate. The initial phase is characterized by a faster rate (days 1-15), followed by the second phase, which exhibits a slightly slower progression (days 15-26).
Histopathological examination and haemoglobin measurements indicated that mice treated with the 10% w/w carrageenan gel and the 5% w/w ulvan gel exhibited reduced inflammation levels compared to the other groups. This observation highlights the significance of dosage in relation to therapeutic effectiveness. The excipient, on the other hand, displayed more intense inflammation than all the other treatments, including the control. It is, therefore, not unlikely, that the utilization of this gelling agent might have attenuated the therapeutic efficacy of the polysaccharides (Figure 3 and Figure 4, Table 4).
Concerning the biophysical parameters, the 10% w/w carrageenan and the 5% w/w ulvan treatments resulted in significantly higher hydration values, whereas TEWL and skin thickness were not restored to their initial levels in any of the groups(Figure 5).
The optimum efficacy of the 10% carrageenan gel compared to the 5%ulvan gel was also observed in the FT-IR spectra of the mice skin. As noted in the spectrum of the mice treated with the 10% carrageenangel (Figure 7),the increase in the intensity of the vNH and vOHabsorption bands at approximately 3500 cm-1 and 3300 cm-1 indicated the formation of aminoglycans. Additionally, the band at 1772 cm-1, assigned to Ig-COO-, suggested the presence of inflammation. Negative peaks of amide I and amide II bands in the subtractive spectrum revealed that, although the histopathological data were similar, the proteins did not attain the natural α-helix secondary conformation after the application of the 5% ulvan gel.A crucial observation was the increased intensity of the band in the spectral region between 1200-1000 cm-1, where the vC-O-C of sugar rings and bridges absorb, confirming the development of collagen and elastin (Figure 6 and Figure 7).
Apparently, the dosage is closely related to the therapeutic effectiveness. Carrageenan exhibited optimal performance at the highest of the tested concentrations (10% w/w), while ulvan at an intermediate concentration (5% w/w) (Figure 1, Figure 2 and Figure 3 and 7, Table 3 and Table 4).
It has been suggested that carrageenan could be used in films as a wound healing agent [10],and its wound healing efficacy has been proven byvariousin vitro [50,58] and in vivo studies [48,49]. The beneficial effects of ulvan in burn wounds have been also reported in anin vivo study where the combination of ulvan with gelatin formulated in electrospunnanofibers showed a significant burn healing effect [54].
Despite the uniform burns inflicted at the beginning of the experiment, mice treated with the vehicle exhibited a poorer clinical outcome compared to the control. With the vehicle, keloids and oedema were developed during the healing process, a fact that complicated the removal of necrotic tissue. Apparently, the gelling agent (polyacrylamide, C13-14 isoparaffin, and laureth-7) is responsible for the observed secondary effects.It seems that the use of polyacrylamide, C13-14 isoparaffin, and laureth-7 on an open wound may cause this reaction. According to the literature, the gelling agent is not toxic to normal skin, except for a single case of allergic contact dermatitis [59].
In a future study, the efficacy of the optimal dose of the carrageenan gel could be examined using an alternative gelling agent. It may also be important to explore the potential synergistic effects of the two polysaccharides, carrageenan at 10% w/w and ulvan at 5% w/w, either in combination or not, with a therapeutic drug.
5. Conclusions
Based on the results derived from the clinical observations, the histopathological data, photo-documentation, and the measurement of biophysical parameters, the 10% w/w carrageenan gel significantly improved burn wound healing, especially in the early stages. Following closely was the 5% w/w ulvan gel, which showed a significant effect especially at the second half of the healing process. The gelling agent (polyacrylamide, C13-14 isoparaffin and laureth-7) exhibited moderate topical toxicity in burns. The FT-IR spectra confirmed the elastin and collagen formation upon the application of the 10% w/w carrageenan gel on skin.The present study revealed that the 10% w/w carrageenan gel, and secondarily, the 5% w/w ulvan gel, can enhance the healing process of second-degree burns.
Author Contributions
Conceptualization, J.A., E.I., V.R. and MCR.; methodology, D.S., A.V., S.K.; investigation, D.S., A.P., M.K., I.S.,A.V. and S.K.; resources, E.I., V.R. and M.R.; writing—original draft preparation, D.S, A.P., A.V., J.A, S.K. and MCR; writing—review and editing, D.S., E.I., V.R. and MCR.; visualization, D.S., J.A. and M.K.; supervision, J.A. and MCR.; project administration, D.S..; All authors have read and agreed to the published version of the manuscript.
Funding
This research received no external funding.
Institutional Review Board Statement
The animal study protocol was approved by the Animal Protocols Evaluation Committee and the Greek Peripheral Veterinary Authority (protocol number 775329, date of approval 09-08-22) for studies involving animals.
Data Availability Statement
The data that support the findings of this study are available from the corresponding authors upon request.
Acknowledgments
Access to the infrastructure obtained by the research project “Center for the study and sustainable exploitation of Marine Biological Resources” (CMBR, MIS 5002670) in the framework of the National Roadmap for Research Infrastructures is gratefully acknowledged. We would like to express our gratitude to Nuevo S.A. Company and in particular to Ioannis Karvelis, for the assistance in the nutritional care of the animals.
Conflicts of Interest
The authors declare no conflicts of interest.
References
- World Health Organization. Burns. Available online: https://www.who.int/en/news-room/fact-sheets/detail/burns (accessed on 13 October 2023).
- Jeschke, M.G.; van Baar, M.E.; Choudhry, M.A.; Chung, K.K.; Gibran, N.S.; Logsetty, S. Burn injury. Nat. Rev. Dis. Primers 2020, 6, 11. [Google Scholar] [CrossRef] [PubMed]
- Wang, Y.; Beekman, J.; Hew, J.; Jackson, S.; Issler-Fisher, A.C.; Parungao, R.; Lajevardi, S.S.; Li, Z.; Maitz, P.K.M. Burn injury: Challenges and advances in burn wound healing, infection, pain and scarring. Adv. Drug Deliv. Rev. 2018, 123, 3–17. [Google Scholar] [CrossRef] [PubMed]
- Markiewicz-Gospodarek, A.; Kozioł, M.; Tobiasz, M.; Baj, J.; Radzikowska-Büchner, E.; Przekora, A. Burn wound healing: Clinical complications, medical care, treatment, and dressing types: The current state of knowledge for clinical practice. Int. J. Environ. Res. Public Health 2022, 19, 1338. [Google Scholar] [CrossRef] [PubMed]
- Warby, R.; Maani, C.V. Burn Classification. 2023. In: StatPearls. Treasure Island (FL): StatPearls Publishing; 2024 Jan. Available from: https://www.ncbi.nlm.nih.gov/books/NBK539773/(Updated 2023 Sep 26).
- Abazari, M.; Ghaffari, A.; Rashidzadeh, H.; Badeleh, S.M.; Maleki, Y. A systematic review on classification, identification, and healing process of burn wound healing. Int. J. Low Extrem. Wounds. 2022, 21, 18–30. [Google Scholar] [CrossRef] [PubMed]
- Shu, W.; Wang, Y.; Zhang, X.; Li, C.; Le, H.; Chang, F. Functional hydrogel dressings for treatment of burn wounds. Front. Bioeng. Biotechnol. 2021, 9, 788461. [Google Scholar] [CrossRef] [PubMed]
- Zhang,H. ; Lin,X.; Cao,X.; Wang,Y.; Wang,J.; Zhao, Y. Developing natural polymers for skin wound healing. Bioact. Mater. 2024, 33, 355–376. [Google Scholar] [CrossRef]
- Liu, Q.; Hu, L.; Wang, C.; Cheng, M.; Liu, M.; Wang, L.; Pan, P.; Che, J. Renewable marine polysaccharides for microenvironment-responsive wound healing. Int. J. Biol. Macromol. 2023, 225, 526–543. [Google Scholar] [CrossRef] [PubMed]
- Neamtu, B.; Barbu, A.; Negrea, M.O.; Berghea-Neamțu, C.Ș.; Popescu, D.; Zăhan, M.; Mireșan, V. Carrageenan-based compounds as wound healing materials. Int. J. Mol. Sci. 2022, 23, 9117. [Google Scholar] [CrossRef]
- Andryukov, B.G.; Besednova, N.N.; Kuznetsova, T.A.; Zaporozhets, T.S.; Ermakova, S.P.; Zvyagintseva, T.N.; Chingizova, E.A.; Gazha, A.K.; Smolina, T.P. Sulfated polysaccharides from marine algae as a basis of modern biotechnologies for creating wound dressings: Current achievements and future prospects. Biomedicines 2020, 8, 301. [Google Scholar] [CrossRef]
- Fu, Y.; Jiao, H.; Sun, J.; Okoye, C.O.; Zhang, H.; Li, Y.; Lu, X.; Wang, Q.; Liu, J. Structure-activity relationships of bioactive polysaccharides extracted from macroalgae towards biomedical application: A review. Carbohydr. Polym. 2024, 324, 121533. [Google Scholar] [CrossRef]
- Zhang, H.; Wu, X.; Quan, L.; Ao, Q. Characteristics of marine biomaterials and their applications in biomedicine. Mar. Drugs 2022, 20, 372. [Google Scholar] [CrossRef] [PubMed]
- Sharma, A.; Kaur, I.; Dheer, D.; Nagpal, M.; Kumar, P.; Venkatesh, D.N.; Puri, V.; Singh, I. A propitious role of marine sourced polysaccharides: Drug delivery and biomedical applications. Carbohydr. Polym. 2023, 308, 120448. [Google Scholar] [CrossRef] [PubMed]
- Iliou, K.; Kikionis, S.; Ioannou, E.; Roussis, V. Marine biopolymers as bioactive functional ingredients of electrospun nanofibrous scaffolds for biomedical applications. Mar. Drugs 2022, 20, 314. [Google Scholar] [CrossRef] [PubMed]
- Zaitseva, O.O.; Sergushkina, M.I.; Khudyakov, A.N.; Polezhaeva, T.V.; Solomina, O.N. Seaweed sulfated polysaccharides and their medicinal properties. Algal Res. 2022, 68, 102885. [Google Scholar] [CrossRef]
- Wan, M.-c.; Qin, W.; Lei, C.; Li, Q.-h.; Meng, M.; Fang, M.; Song, W.; Chen, J.-h.; Tay, F.; Niu, L.-n. Biomaterials from the sea: Future building blocks for biomedical applications. Bioact. Mater. 2021, 6, 4255–4285. [Google Scholar] [CrossRef] [PubMed]
- Bilal, M.; Iqbal, H.M.N. Marine seaweed polysaccharides-based engineered cues for the modern biomedical sector. Mar. Drugs 2020, 18, 7. [Google Scholar] [CrossRef] [PubMed]
- Patel, S. Therapeutic importance of sulfated polysaccharides from seaweeds: updating the recent findings. 3 Biotech 2012, 2, 171–185. [Google Scholar] [CrossRef]
- Kumar, M.; Kumar, D.; Garg, Y.; Mahmood, S.; Chopra, S.; Bhatia, A. Marine-derived polysaccharides and their therapeutic potential in wound healing application - A review. Int. J. Biol. Macromol. 2023, 253, 12731. [Google Scholar] [CrossRef] [PubMed]
- Kidgell, J.T.; Magnusson, M.; de Nys, R.; Glasson, C.R.K. Ulvan: A systematic review of extraction, composition and function. Algal. Res. 2019, 39, 101422. [Google Scholar] [CrossRef]
- Tziveleka, L.-A.; Ioannou, E.; Roussis, V. Ulvan, a bioactive marine sulphated polysaccharide as a key constituent of hybrid biomaterials: A review. Carbohydr. Polym. 2019, 218, 355–370. [Google Scholar] [CrossRef]
- Sulastri, E.; Lesmana, R.; Zubair, S.; Elamin, K.M.; Wathoni, N.A. A comprehensive review on ulvan based hydrogel and its biomedical applications. Chem. Pharm. Bull. 2021, 69, 432–443. [Google Scholar] [CrossRef]
- Kikionis, S.; Ioannou, E.; Aggelidou, E.; Tziveleka, L.-A.; Demiri, E.; Bakopoulou, A.; Zinelis, S.; Kritis, A.; Roussis, V. The Marine polysaccharide ulvan confers potent osteoinductive capacity to PCL-based scaffolds for bone tissue engineering applications. Int. J. Mol. Sci. 2021, 22, 3086. [Google Scholar] [CrossRef] [PubMed]
- Tziveleka, L.-A.; Sapalidis, A.; Kikionis, S.; Aggelidou, E.; Demiri, E.; Kritis, A.; Ioannou, E.; Roussis, V. Hybrid sponge-like scaffolds based on ulvan and gelatin: Design, characterization and evaluation of their potential use in bone tissue engineering. Materials 2020, 13, 1763. [Google Scholar] [CrossRef]
- Dash, M.; Samal, S.K.; Bartoli, C.; Morelli, A.; Smet, P.F.; Dubruel, P.; Chiellini, F. Biofunctionalization of ulvan scaffolds for bone tissue engineering. ACS Appl. Mater. Interfaces 2014, 6, 3211–3218. [Google Scholar] [CrossRef]
- Gajaria, T.K.; Lakshmi, D.S.; Vasu, V.T.; Reddy, C.R.K. Fabrication of ulvan-based ionically cross-linked 3D-biocomposite: synthesis and characterization. Nanotechnol. Environ. Eng. 2022, 7, 455–459. [Google Scholar] [CrossRef]
- Gruskiene, R.; Kavleiskaja, T.; Staneviciene, R.; Kikionis, S.; Ioannou, E.; Serviene, E.; Roussis, V.; Sereikaite, J. Nisin-loaded ulvan particles: Preparation and characterization. Foods 2021, 10, 1007. [Google Scholar] [CrossRef] [PubMed]
- Hwang, P.-A.; Chen, H.-Y.; Chang, J.-S.; Fu-Yin Hsu, F.-Y. Electrospun nanofiber composite mat based on ulvan for wound dressing applications. Int. J. Biol. Macromol. 2023, 253, 126646. [Google Scholar] [CrossRef] [PubMed]
- Tziveleka, L.-A.; Kikionis, S.; Karkatzoulis, L.; Bethanis, K.; Roussis, V.; Ioannou, E. Valorization of fish waste: Isolation and characterization of acid- and pepsin-soluble collagen from the scales of mediterranean fish and fabrication of collagen-based nanofibrous scaffolds. Mar. Drugs 2022, 20, 664. [Google Scholar] [CrossRef]
- Toskas, G.; Hund, R.-D.; Laourine, E.; Cherif, C.; Smyrniotopoulos, V.; Roussis, V. Nanofibers based on polysaccharides from the green seaweed Ulva rigida. Carbohydr. Polym. 2011, 84, 1093–1102. [Google Scholar] [CrossRef]
- Chen, X.; Yue, Z.; Winberg, P.C.; Lou, Y.-R.; Beirne, S.; Wallace, G.G. 3D bioprinting dermal-like structures using species-specific ulvan. Biomater. Sci. 2021, 9, 2424–2438. [Google Scholar] [CrossRef]
- Sulastri, E.; Zubair, M.S.; Lesmana, R.; Mohammed, A.F.A.; Wathoni, N. Development and characterization of ulvan polysaccharides-based hydrogel films for potential wound dressing applications. Drug Des. Devel. Ther. 2021, 15, 4213–4226. [Google Scholar] [CrossRef] [PubMed]
- Toskas, G.; Heinemann, S.; Heinemann, C.; Cherif, C.; Hund, R.-D.; Roussis, V.; Hanke, T. Ulvan and ulvan/chitosan polyelectrolyte nanofibrous membranes as a potential substrate material for the cultivation of osteoblasts. Carbohydr. Polym. 2012, 89, 997–1002. [Google Scholar] [CrossRef] [PubMed]
- Moon, H.C.; Choi, H.; Kikionis, S.; Seo, J.; Youn, W.; Ioannou, E.; Han, S.Y.; Cho, H.; Roussis, V.; Choi, I.S. Fabrication and characterization of neurocompatible ulvan-based layer-by-layer films. Langmuir 2020, 36, 11610–11617. [Google Scholar] [CrossRef] [PubMed]
- Tziveleka, L.-A.; Pippa, N.; Georgantea, P.; Ioannou, E.; Demetzos, C.; Roussis, V. Marine sulfated polysaccharides as versatile polyelectrolytes for the development of drug delivery nanoplatforms: Complexation of ulvan with lysozyme. Int. J. Biol. Macromol. 2018, 118, 69–75. [Google Scholar] [CrossRef]
- Podolean, I.; Coman, S.M.; Bucur, C.; Teodorescu, C.; Kikionis, S.; Ioannou, E.; Roussis, V.; Primo, A.; Garcia, H.; Parvulescu, V.I. Catalytic transformation of themarine polysaccharide ulvan into rare sugars, tartaric and succinic acids. Catal. Today 2022, 383, 345–357. [Google Scholar] [CrossRef]
- Ribeiro, D.M.L.; Carvalho Júnior, A.R.; Vale de Macedo, G.H.R.; Chagas, V.L.; Silva, L.d.S.; Cutrim, B.d.S.; Santos, D.M.; Soares, B.L.L.; Zagmignan, A.; de Miranda, R.d.C.M.; et al. Polysaccharide-based formulations for healing of skin-related wound infections: Lessons from animal models and clinical trials. Biomolecules 2020, 10, 63. [Google Scholar] [CrossRef] [PubMed]
- Udayakumar, S.; Girigoswami, A.; Girigoswami, K. Biological activities of carrageenan from red algae: a mini review. Curr. Pharmacol. Rep. 2024, 10, 12–26. [Google Scholar] [CrossRef]
- Mirzaei, A.; Esmkhani, M.; Zallaghi, M. Nezafat, Z.; Javanshir, S. Biomedical and environmental applications of carrageenan-based hydrogels: A review. J. Polym. Environ. 2023, 31, 1679–1705. [Google Scholar] [CrossRef]
- Akbar, A; Ahmed, S. Carrageenans: structure, properties and applications. InMarine Polysaccharides. Ahmed, S., Soundararajan, A., Eds.; Jenny Stanford Publishing: Singapore, 2018; pp. 29–52. [Google Scholar]
- Zia,K. M.;Tabasum,S.;Nasif,M.;Sultan,N.;Aslam,N.;Noreen,A.;Zuber M. A review on synthesis, properties and applications of natural polymer based carrageenan blends and composites. Int. J. Biol. Macromol. 2017, 96, 282–301. [Google Scholar] [CrossRef]
- Campo, V.L.; Kawano, D.F.; da Silva Jr, D.B.; Carvalho, I. Carrageenans: Biological properties, chemical modifications and structural analysis–A review. Carbohydr. Polym. 2009, 77, 167–180. [Google Scholar] [CrossRef]
- Pradhan, B.; Ki, J.-S. Biological activity of algal derived carrageenan: A comprehensive review in light of human health and disease. Int. J. Biol. Macromol. 2023, 238, 124085. [Google Scholar] [CrossRef] [PubMed]
- Pacheco-Quito, E.-M.; Ruiz-Caro, R.; Veiga, M.-D. Carrageenan: Drug delivery systems and other biomedical applications. Mar. Drugs 2020, 18, 583. [Google Scholar] [CrossRef] [PubMed]
- Kikionis, S.; Iliou, K.; Karra, A.G.; Polychronis, G.; Choinopoulos, I.; Iatrou, H.; Eliades, G.; Kitraki, E.; Tseti, I.; Zinelis, S.; et al. Development of bi- and tri-Layer nanofibrous membranes based on the sulfated polysaccharide carrageenan for periodontal tissue regeneration. Mar. Drugs 2023, 21, 565. [Google Scholar] [CrossRef] [PubMed]
- Yegappan, R.; Selvaprithiviraj,V. ; Amirthalingam,S.; Jayakumar, R. Carrageenan based hydrogels for drug delivery, tissue engineering and wound healing. Carbohydr. Polym. 2018, 198, 385–400. [Google Scholar] [CrossRef]
- Jaiswal, L.; Shankar, S.; Rhim, J.-W. Carrageenan-based functional hydrogel film reinforced with sulfur nanoparticles and grapefruit seed extract for wound healing application. Carbohydr. Polym. 2019, 224, 115191. [Google Scholar] [CrossRef] [PubMed]
- Khaliq, T.; Sohail, M.; Minhas, M.U.; Ahmed Shah, S.; Jabeen, N.; Khan, S.; Hussain, Z.; Mahmood, A.; Kousar, M.; Rashid, H. Self-crosslinked chitosan/κ-carrageenan-based biomimetic membranes to combat diabetic burn wound infections. Int. J. Biol. Macromol. 2022, 197, 157–168. [Google Scholar] [CrossRef] [PubMed]
- Ditta, L.A.; Rao, E.; Provenzano, F.; Sánchez, J.L.; Santonocito, R.; Passantino, R.; Costa, M.A.; Sabatino, M.A.; Dispenza, C.; Giacomazza, D.; et al. Agarose/κ-carrageenan-based hydrogel film enriched with natural plant extracts for the treatment of cutaneous wounds. Int. J. Biol. Macromol. 2020, 164, 2818–2830. [Google Scholar] [CrossRef] [PubMed]
- Pereira, L.; Mesquita, J.F. Population studies and carrageenan properties of Chondracanthus teedei var. (lusitanicus Gigartinaceae,Rhodophyta). J. Appl. Phycol. 2004, 16, 369–383. [Google Scholar] [CrossRef]
- Correa-Diaz, F.; Aguilar-Rosas, R.; Aguilar-Rosas, L.E. Infrared analysis of eleven carrageenophytes from Baja California, Mexico. Hydrobiologia 1990, 204, 609–614. [Google Scholar] [CrossRef]
- Pereira, L.; Amado, A.M.; Critchley, A.T.; van de Velde, F.; Ribeiro-Claro, P.J.A. Identification of selected seaweed polysaccharides (phycocolloids) by vibrational spectroscopy (FTIR-ATR and FT-Raman). Food Hydrocoll. 2009, 23, 1903–1909. [Google Scholar] [CrossRef]
- Terezaki, A.; Kikionis, S.; Ioannou, E.; Sfiniadakis, I.; Tziveleka, L.-A.; Vitsos, A.; Roussis, V.; Rallis, M. Ulvan/gelatin-based nanofibrous patches as a promising treatment for burn wounds. J. Drug Deliv. Sci. Technol. 2022, 74, 103535. [Google Scholar] [CrossRef]
- Tanizaki, H.; Tanioka, M.; Yamashita, Y.; Hayashi, N. Quantitative evaluation of atrophic acne scars using 3D image analysis with reflected LED Light. Skin Res. Technol. 2020, 26, 20–24. [Google Scholar] [CrossRef] [PubMed]
- Anastassopoulou, J.; Mamarelis, I.; Theophanides, T. Study of the development of carotid artery atherosclerosis upon oxidative stress using infrared spectroscopy and scanning electron microscopy. OBM Geriatr. 2021, 5, 1–22. [Google Scholar] [CrossRef]
- Anastassopoulou, J.; Kyriakidou, M.; Malesiou, E.; Rallis, M.; Theophanides, T. Infrared and raman spectroscopic studies of molecular disorders in skin cancer. In Vivo 2019, 33, 567–572. [Google Scholar] [CrossRef]
- Biranje, S.S.; Madiwale, P.V.; Patankar, K.C.; Chhabra, R.; Bangde, P.; Dandekar, P.; Adivarekar, R.V. Cytotoxicity and hemostatic activity of chitosan/carrageenan composite wound healing dressing for traumatic hemorrhage. Carbohydr. Polym. 2020, 239, 116106. [Google Scholar] [CrossRef]
- Berenguer, D.; Alcover, M.M.; Sessa, M.; Halbaut, L.; Guillén, C.; Boix-Montañés, A.; Fisa, R.; Calpena-Campmany, A.C.; Riera, C.; Sosa, L. Topical amphotericin B semisolid dosage form for cutaneous leishmaniasis: Physicochemical characterization, ex vivo skin permeation and biological activity. Pharmaceutics 2020, 12, 149. [Google Scholar] [CrossRef]
Figure 1.
Representative images of mice burn wound areas receiving the different treatmentson days 1, 3, 6, 15, 21, 23 and 26.
Figure 1.
Representative images of mice burn wound areas receiving the different treatmentson days 1, 3, 6, 15, 21, 23 and 26.
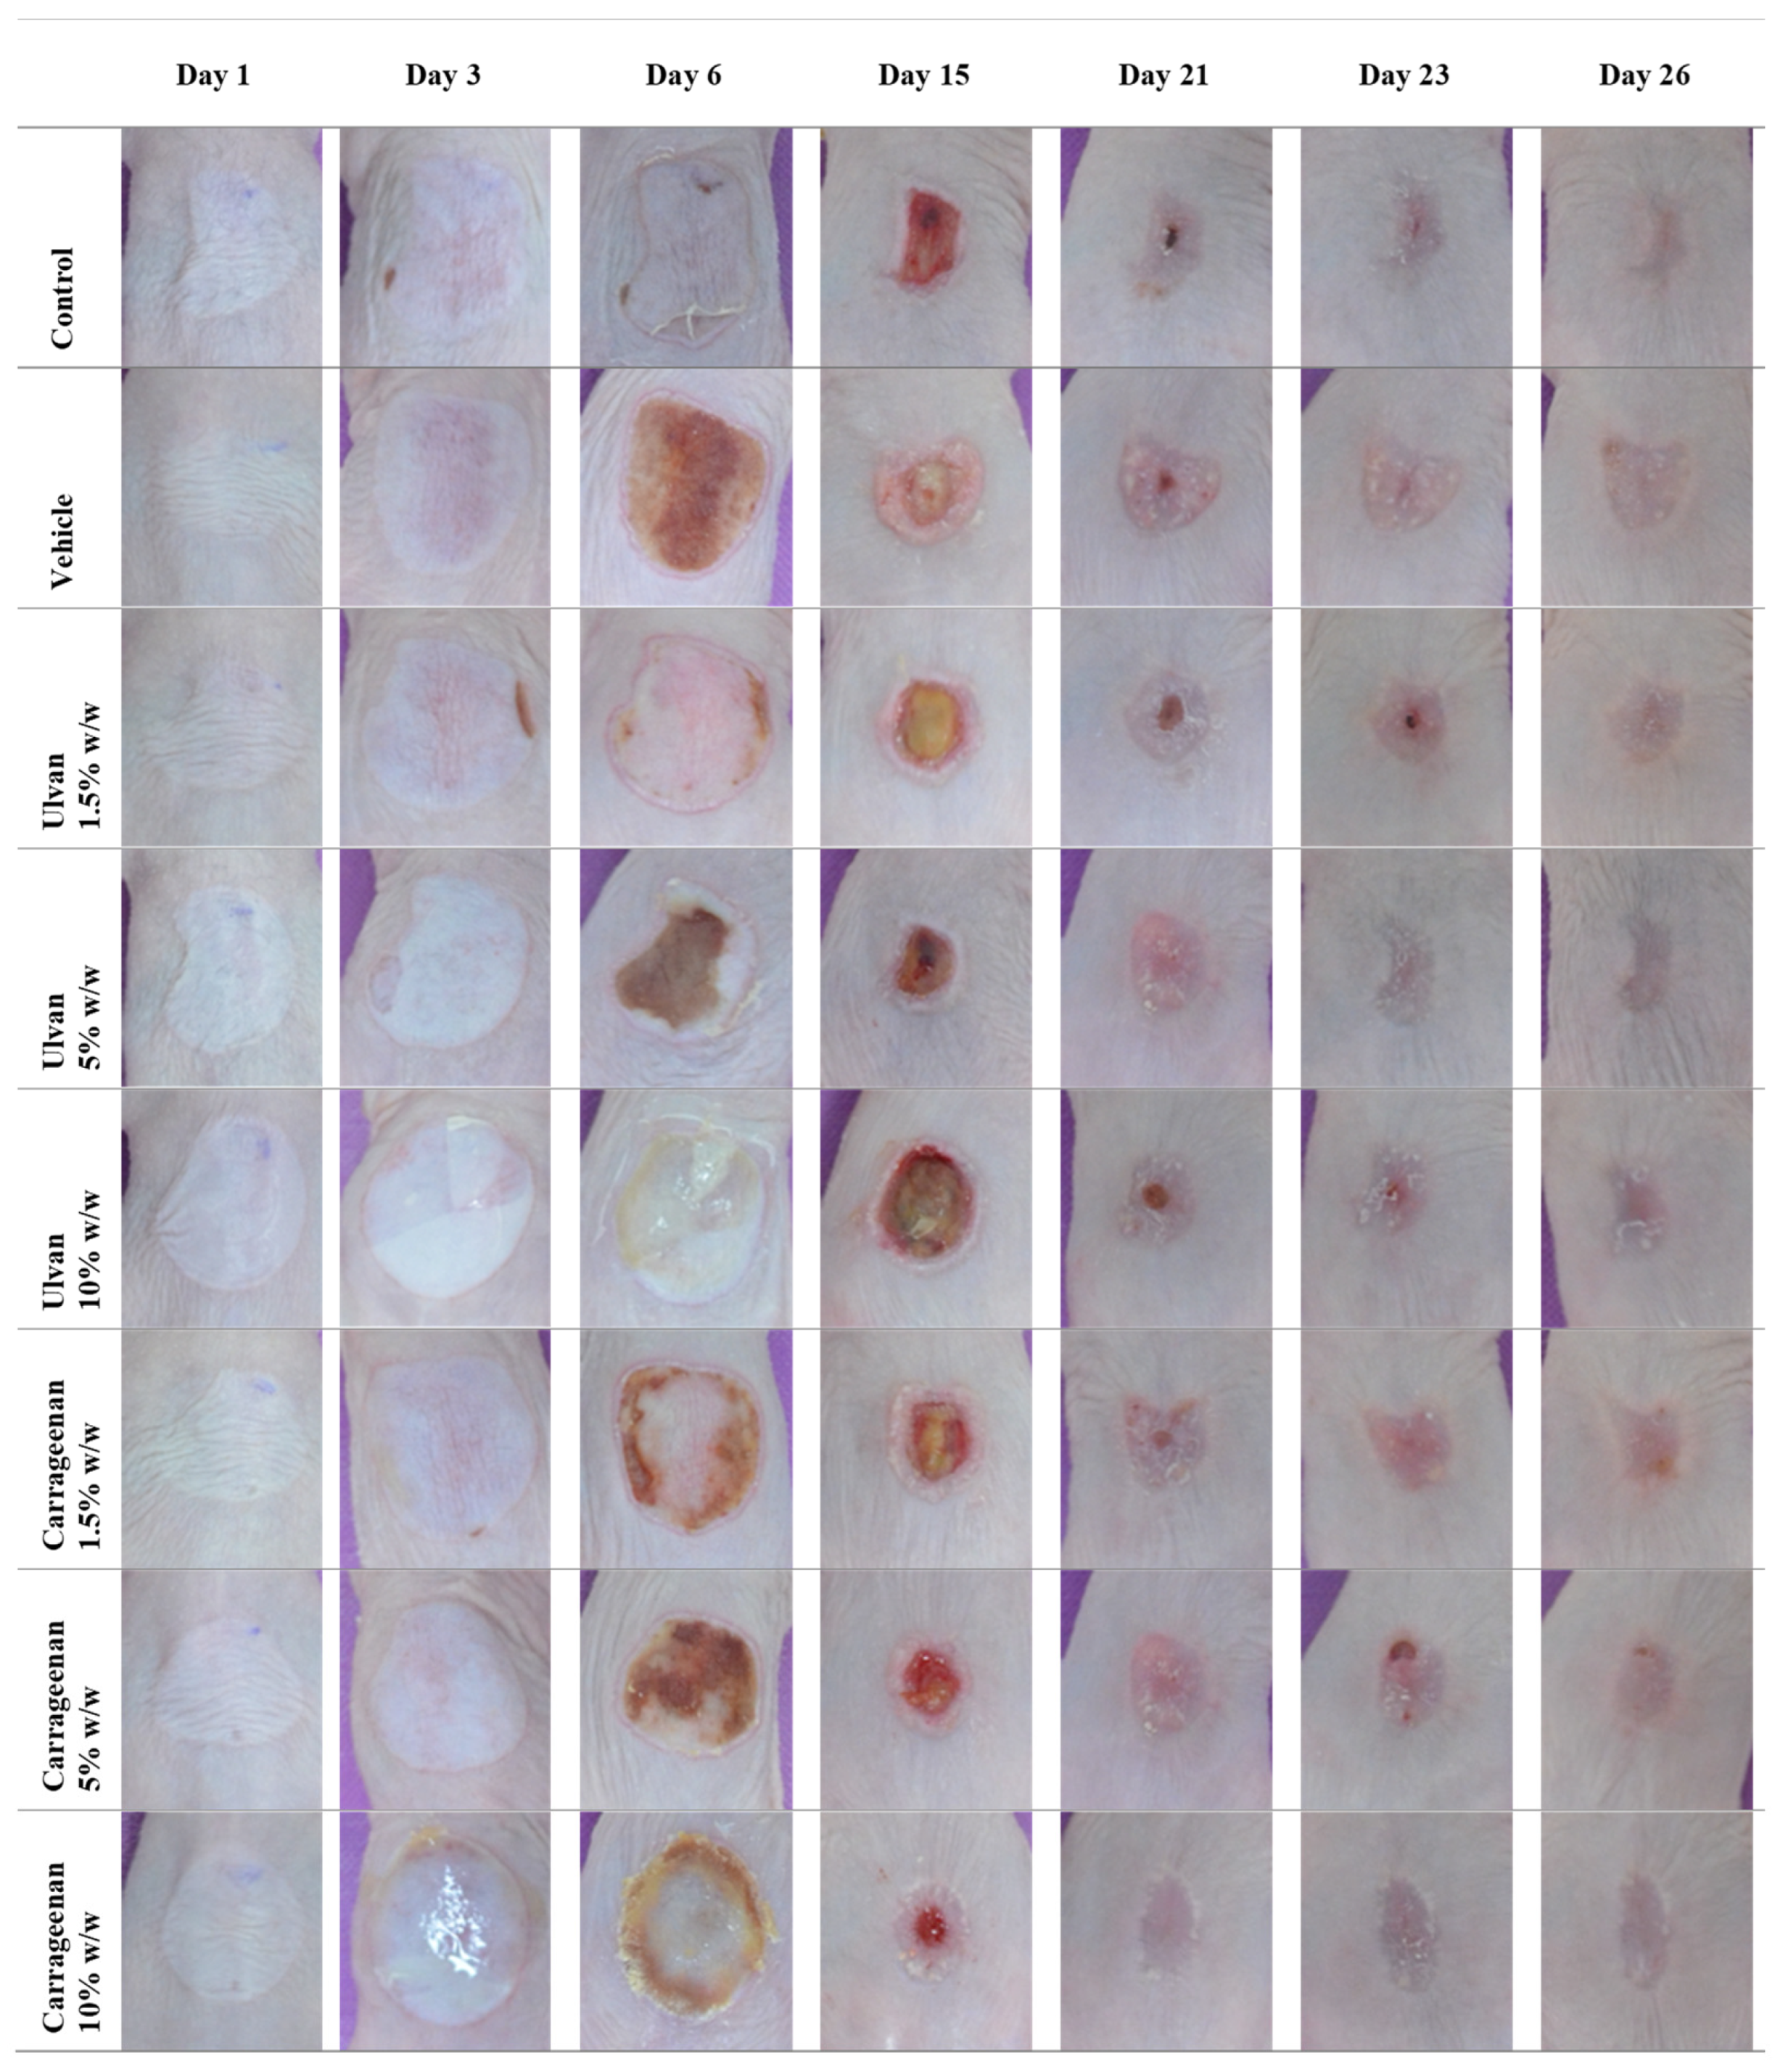
Figure 2.
(A) Histogram of wound area reduction in relation to time. (B) Wound healing rate(*p0.05, **p0.01, ***p0.001).
Figure 2.
(A) Histogram of wound area reduction in relation to time. (B) Wound healing rate(*p0.05, **p0.01, ***p0.001).
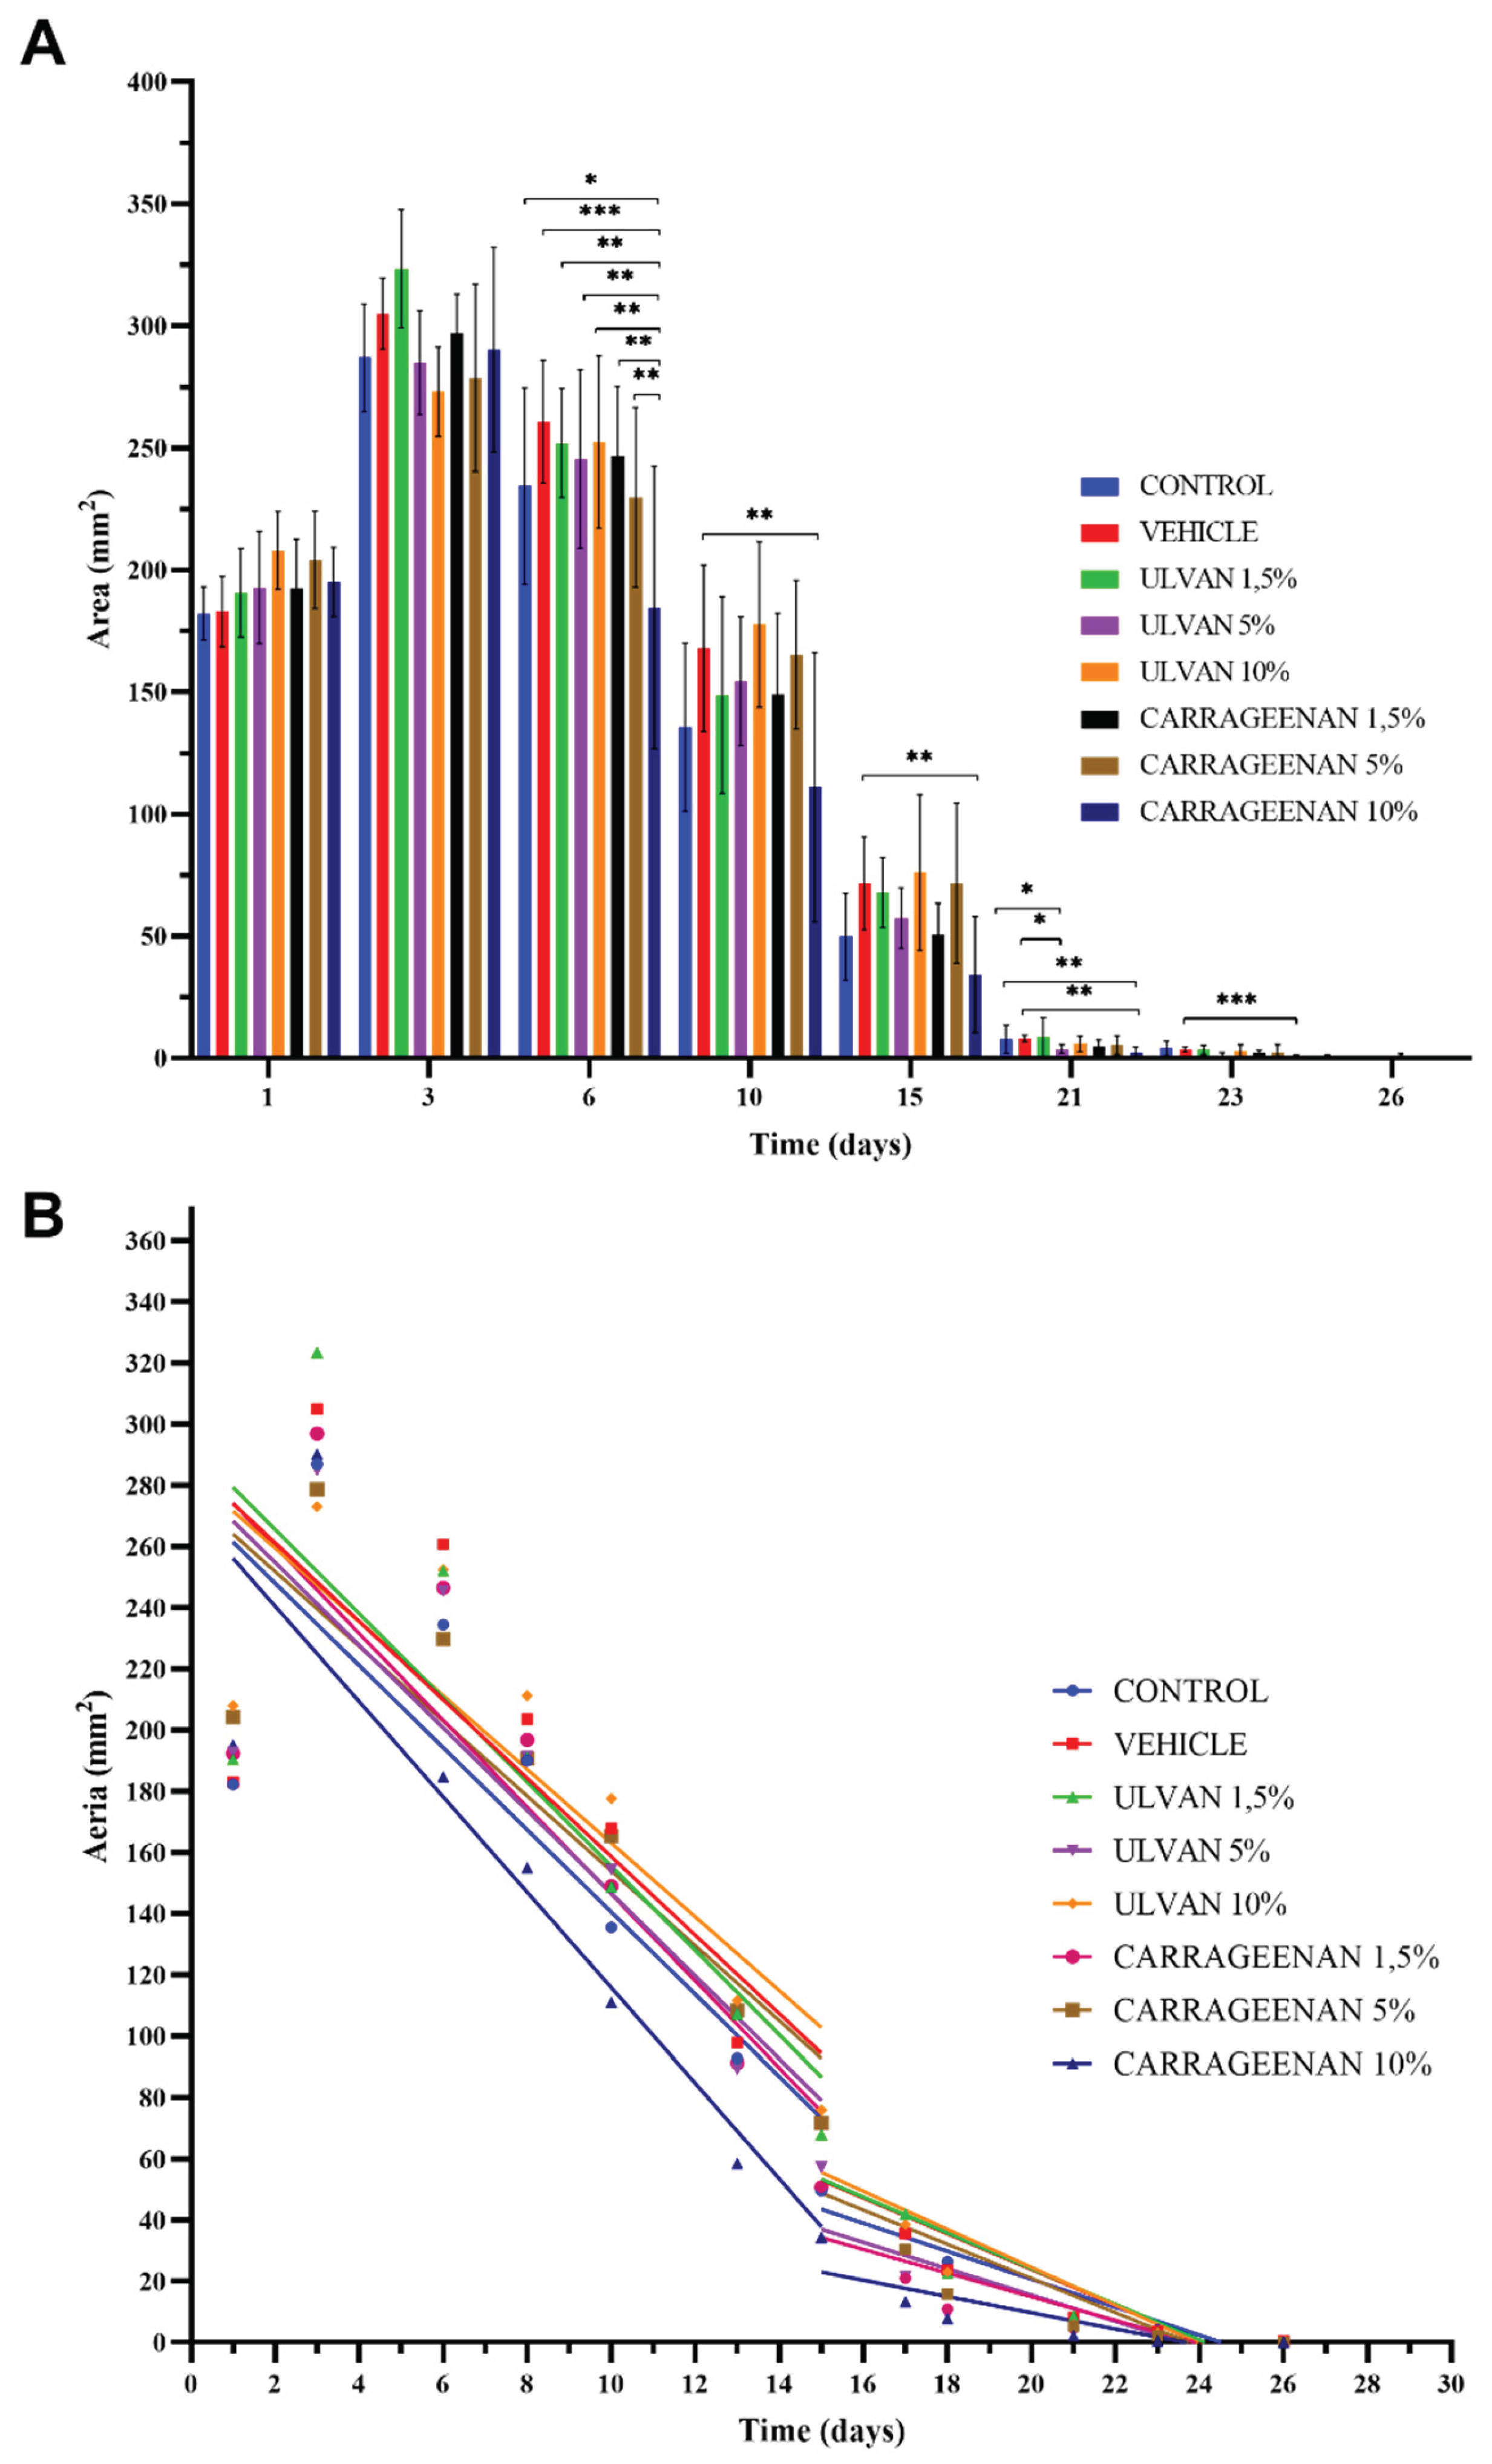
Figure 3.
Hematoxylin and eosin-stained sections of mice skin at the burn wound area for mice receiving different treatments (100 x).
Figure 3.
Hematoxylin and eosin-stained sections of mice skin at the burn wound area for mice receiving different treatments (100 x).
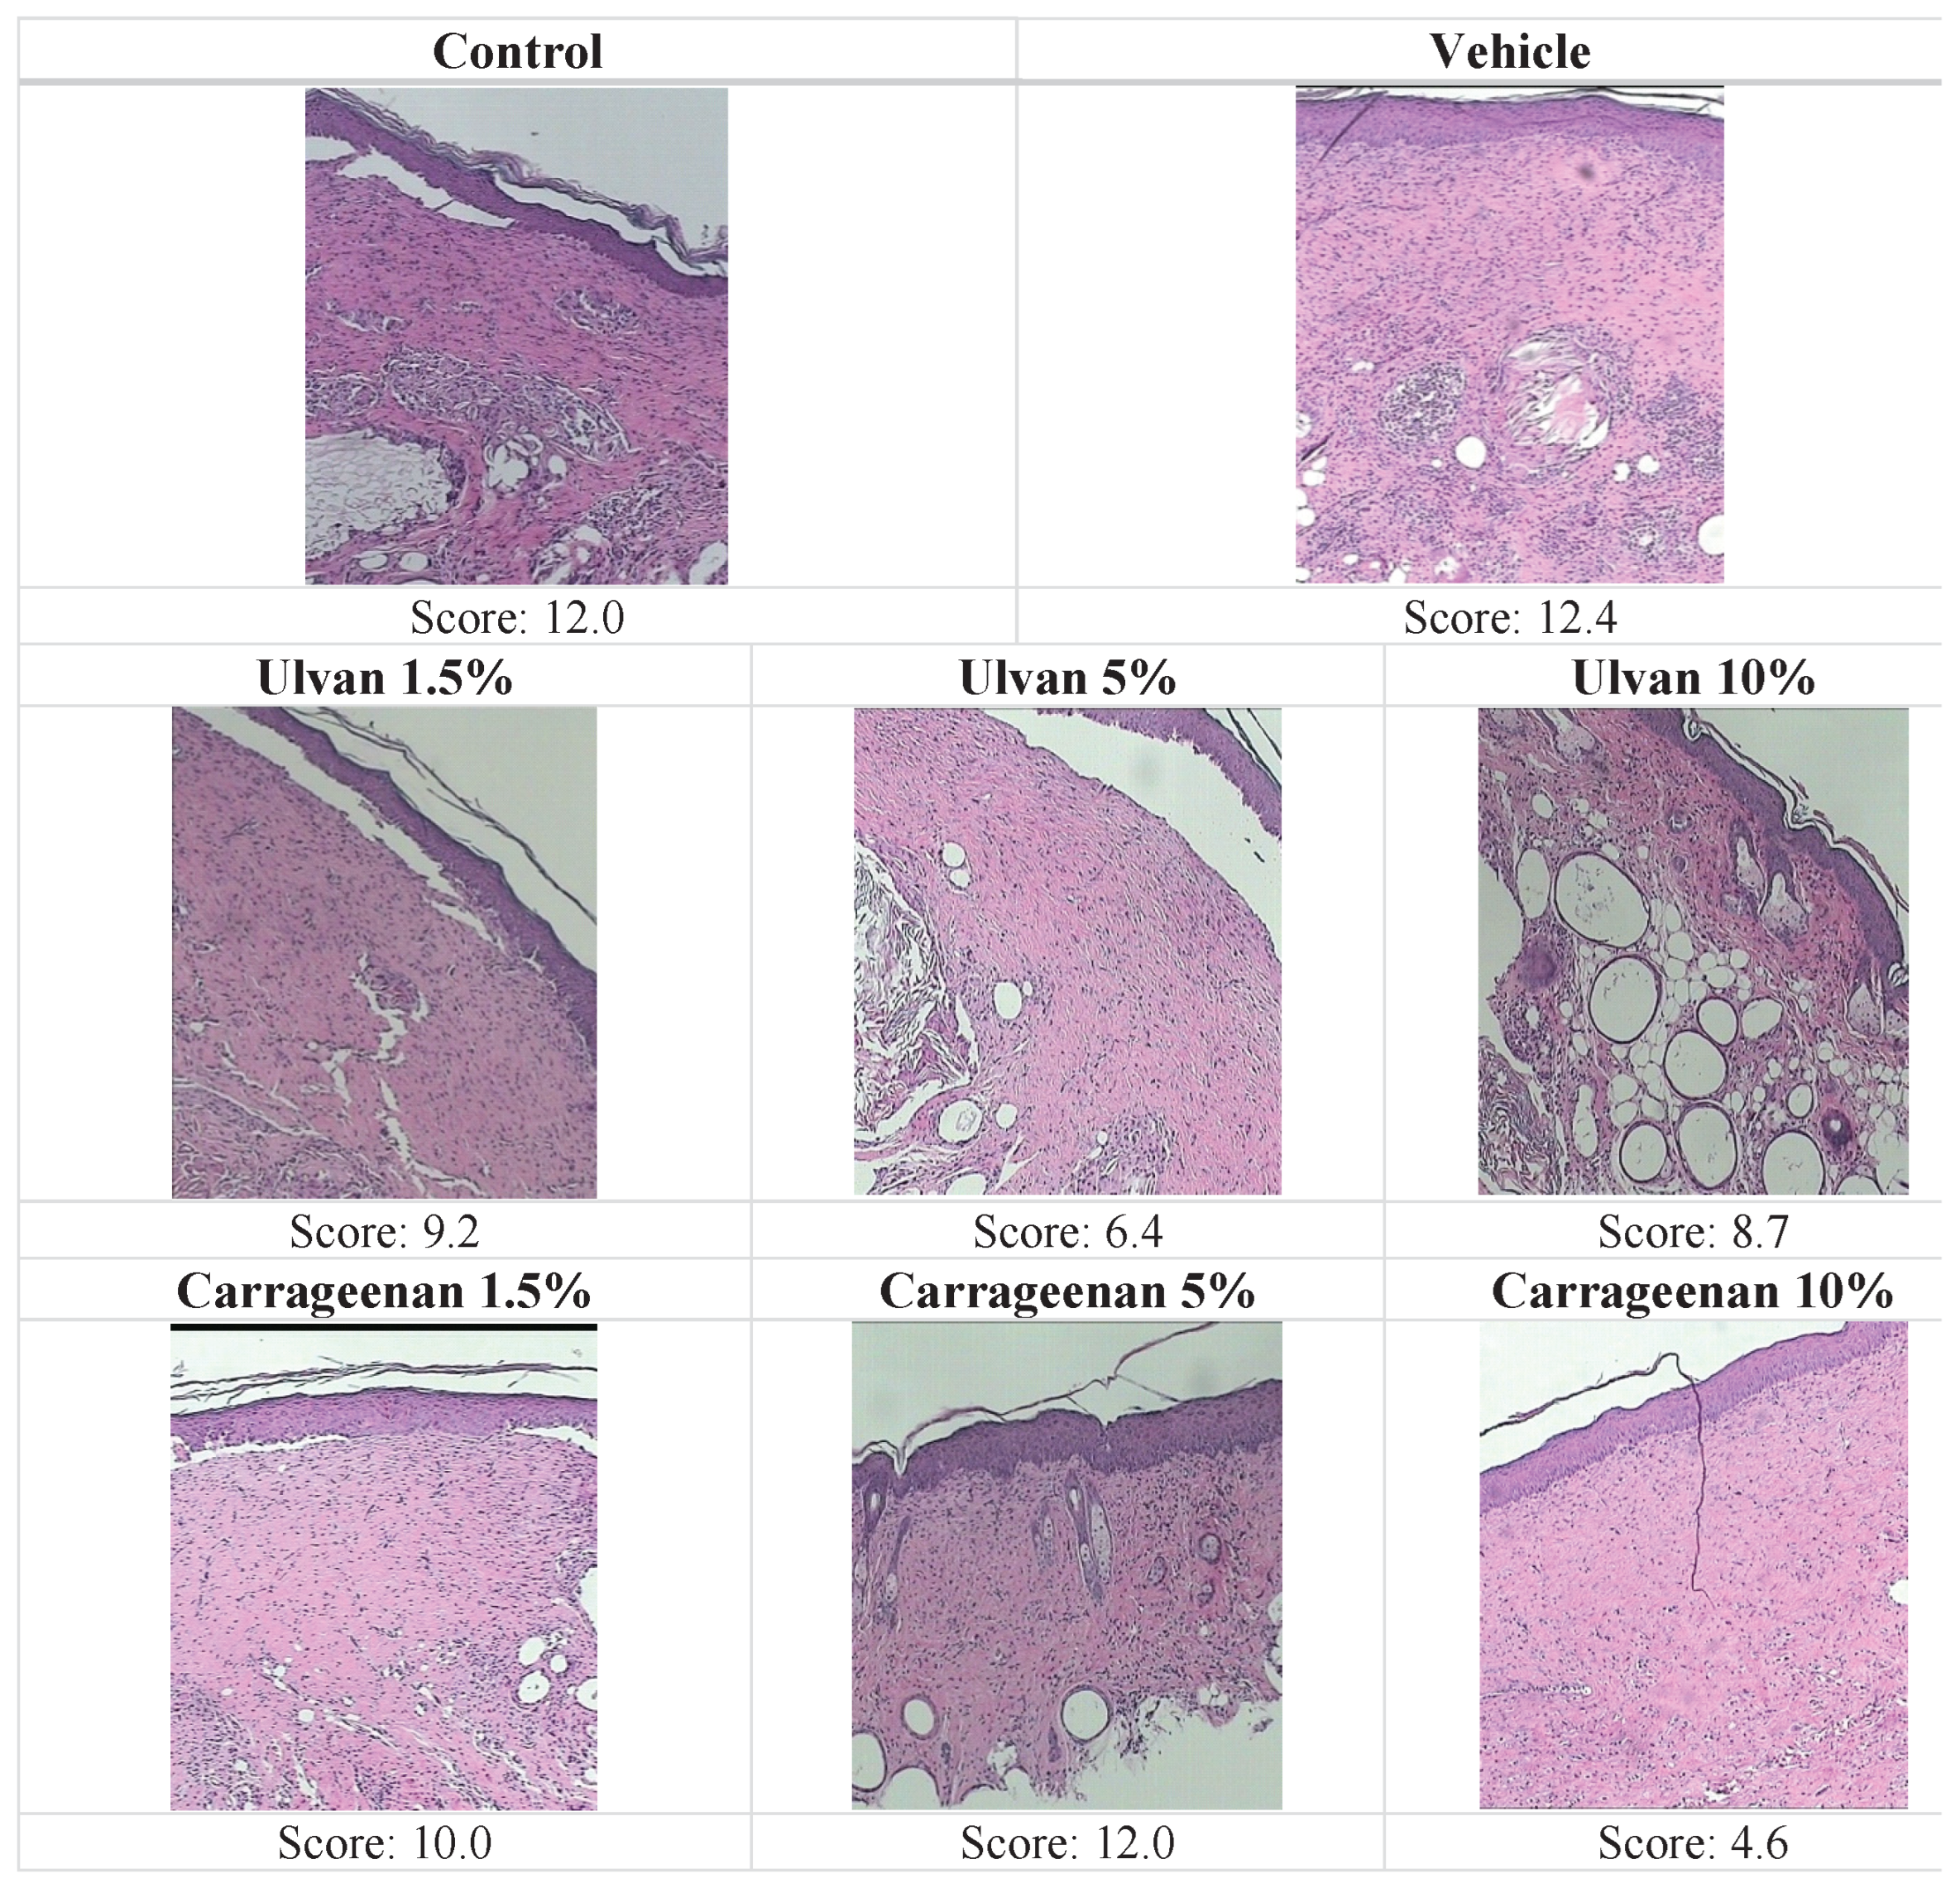
Figure 4.
Histograms of (A) haemoglobin, and (B) skin texture of mice receiving different treatments in relation to time (*p0.05, **p0.01).
Figure 4.
Histograms of (A) haemoglobin, and (B) skin texture of mice receiving different treatments in relation to time (*p0.05, **p0.01).
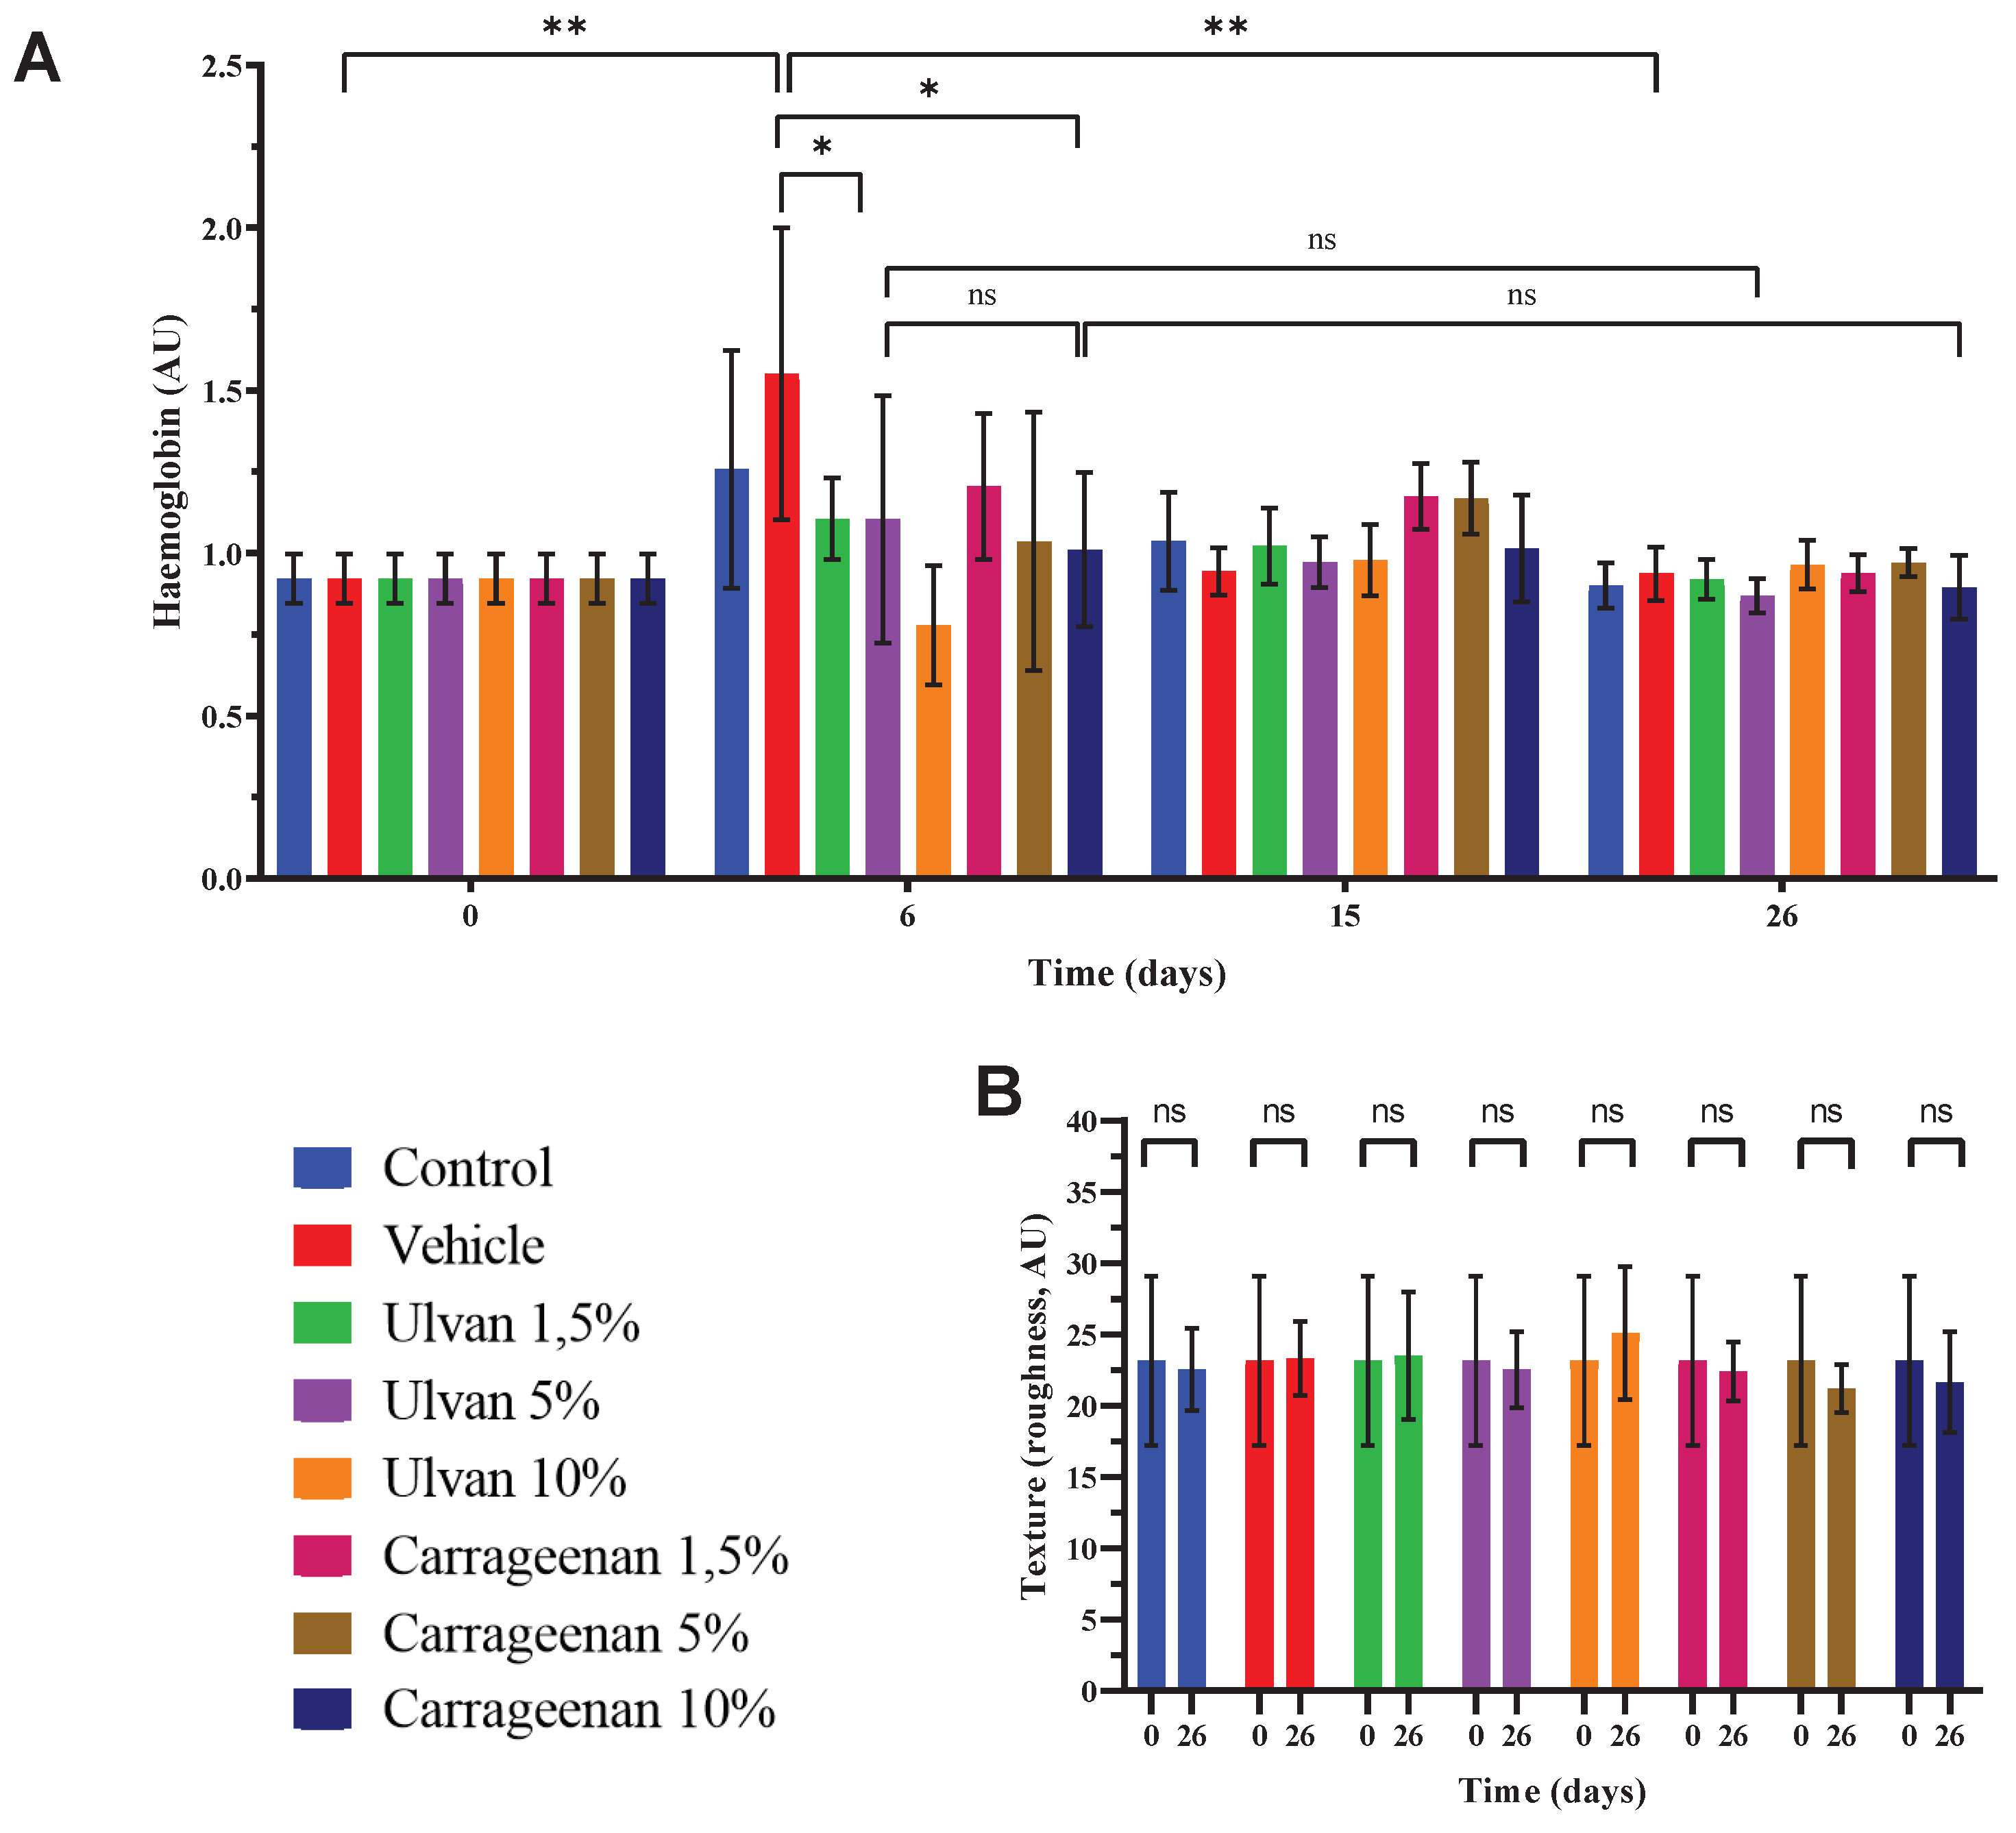
Figure 5.
Histograms of (A) hydration, (B) transepidermal water loss (TEWL), and (C) skin thickness of different treatments at the beginning and the end of the experimental procedure (*p0.05, **p0.01, ***p0.001, ****p0.0001).
Figure 5.
Histograms of (A) hydration, (B) transepidermal water loss (TEWL), and (C) skin thickness of different treatments at the beginning and the end of the experimental procedure (*p0.05, **p0.01, ***p0.001, ****p0.0001).
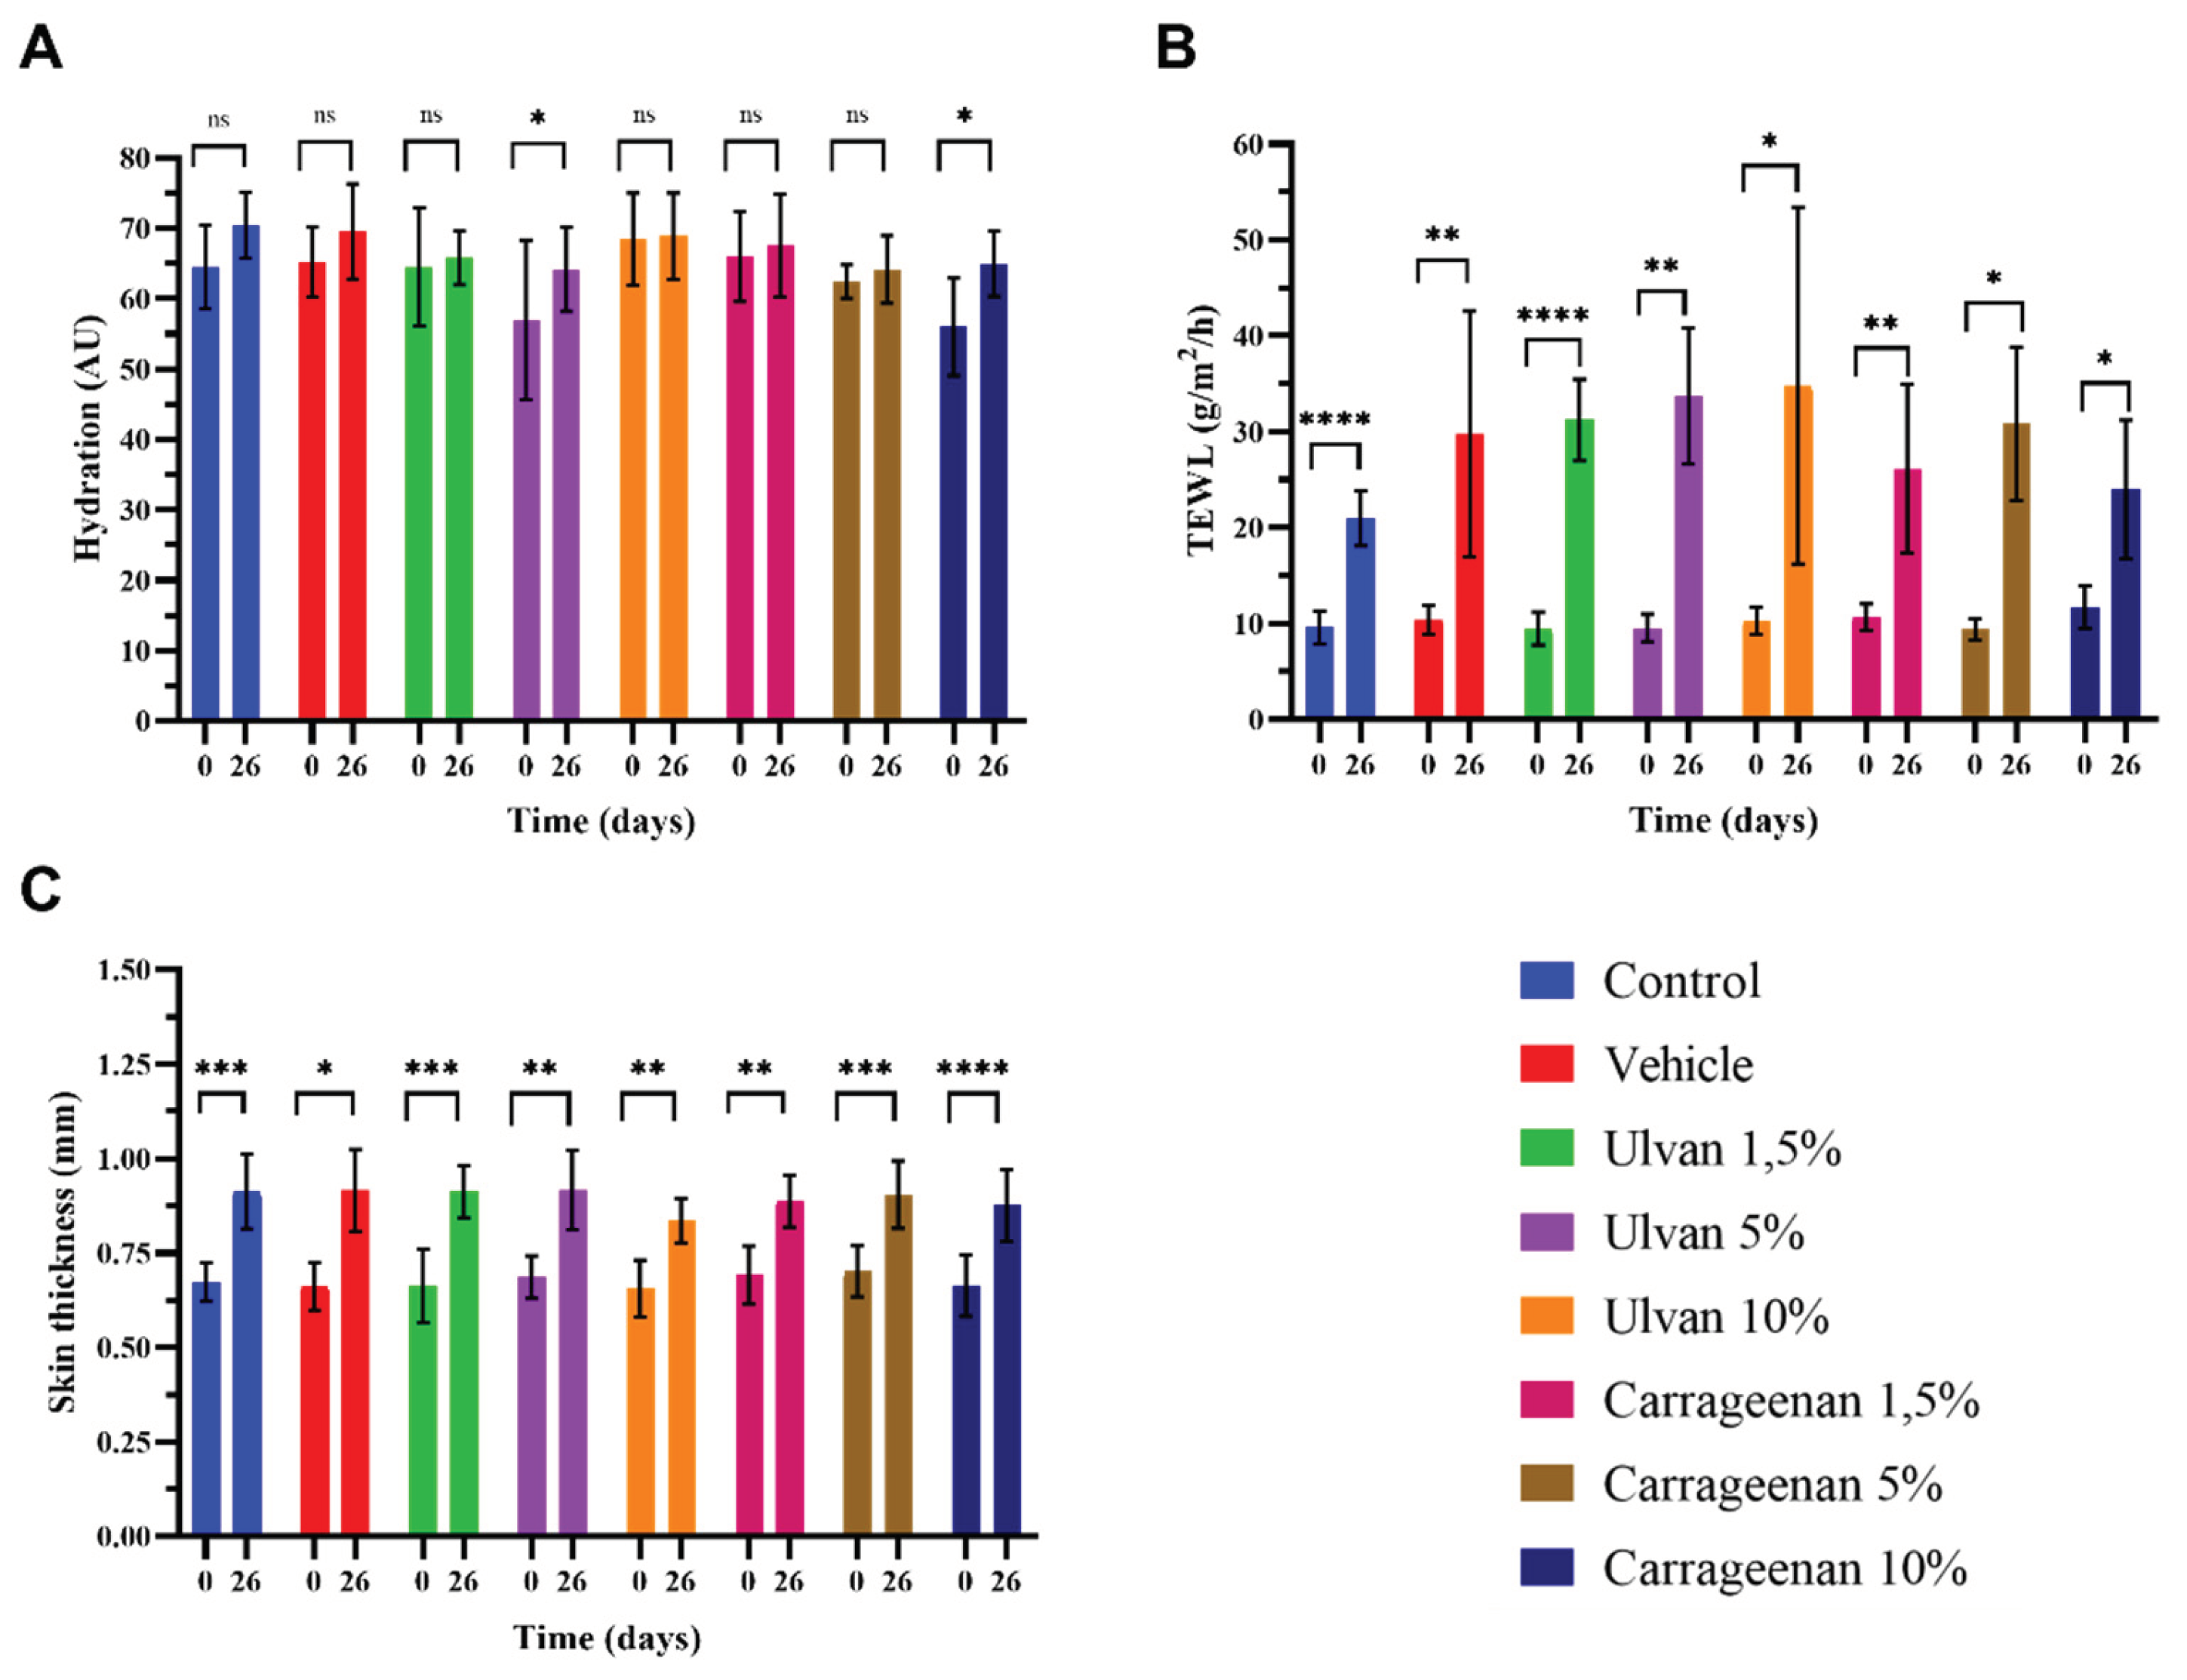
Figure 6.
FT-IR spectra of mice skin treated with carrageenan and ulvan at various concentrations during the final stage of wound healing.
Figure 6.
FT-IR spectra of mice skin treated with carrageenan and ulvan at various concentrations during the final stage of wound healing.
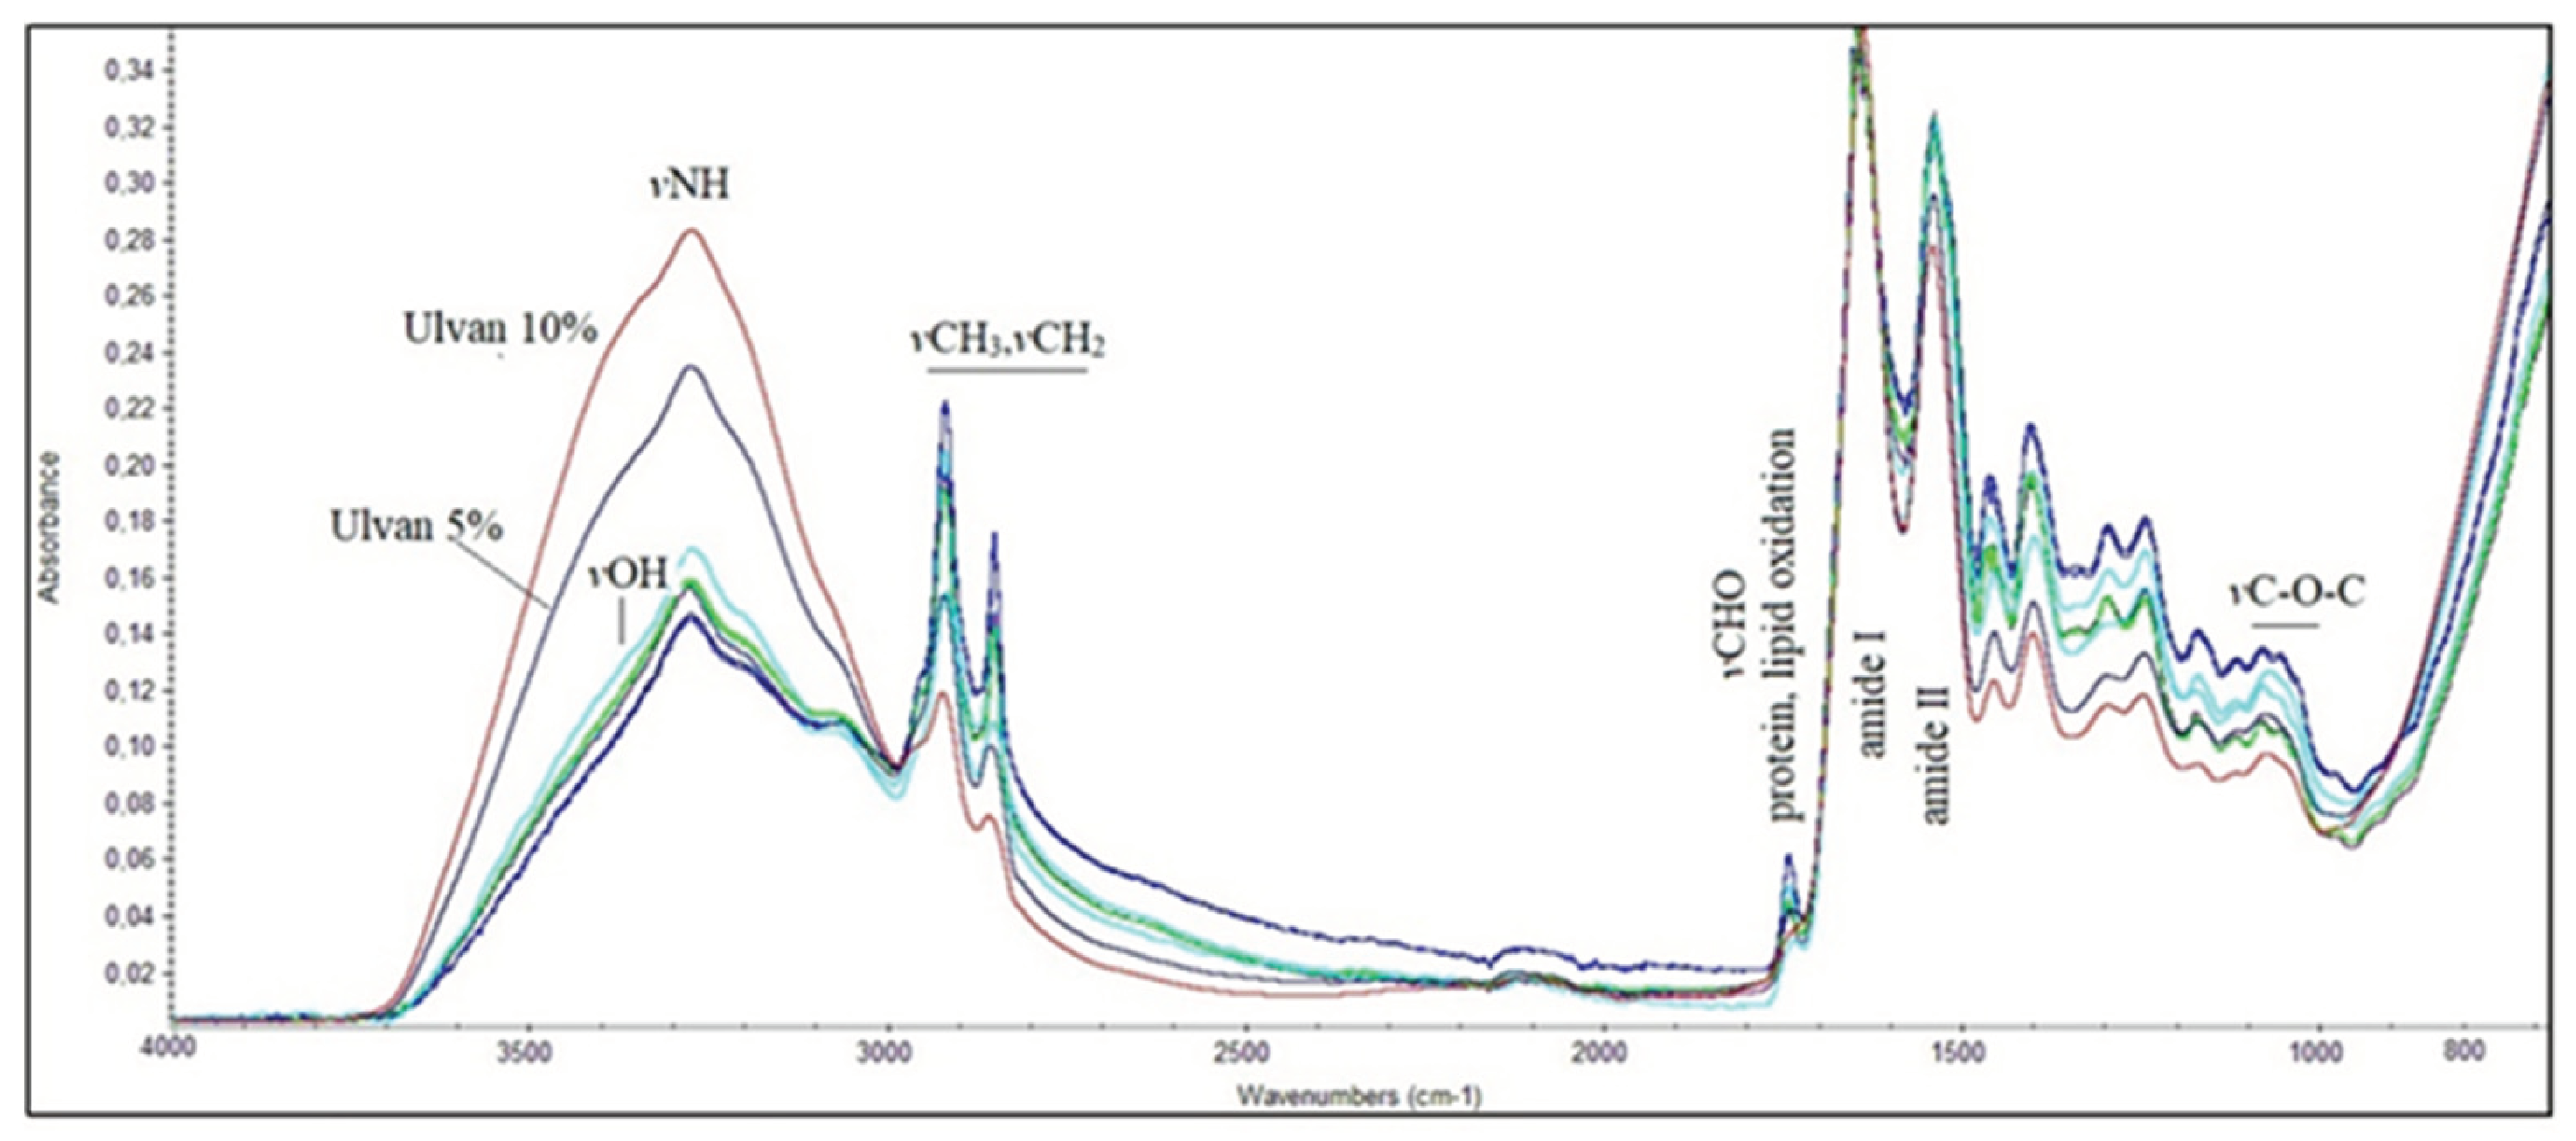
Figure 7.
FT-IR spectra of miceskin during wound healing: (1) spectrum of miceskin treated with the 5% w/w ulvan gel, (2) spectrum of miceskin treated with the 10% w/w carrageenan gel, and (3) spectrum resulting from the subtraction of spectrum 1 from spectrum 2.
Figure 7.
FT-IR spectra of miceskin during wound healing: (1) spectrum of miceskin treated with the 5% w/w ulvan gel, (2) spectrum of miceskin treated with the 10% w/w carrageenan gel, and (3) spectrum resulting from the subtraction of spectrum 1 from spectrum 2.
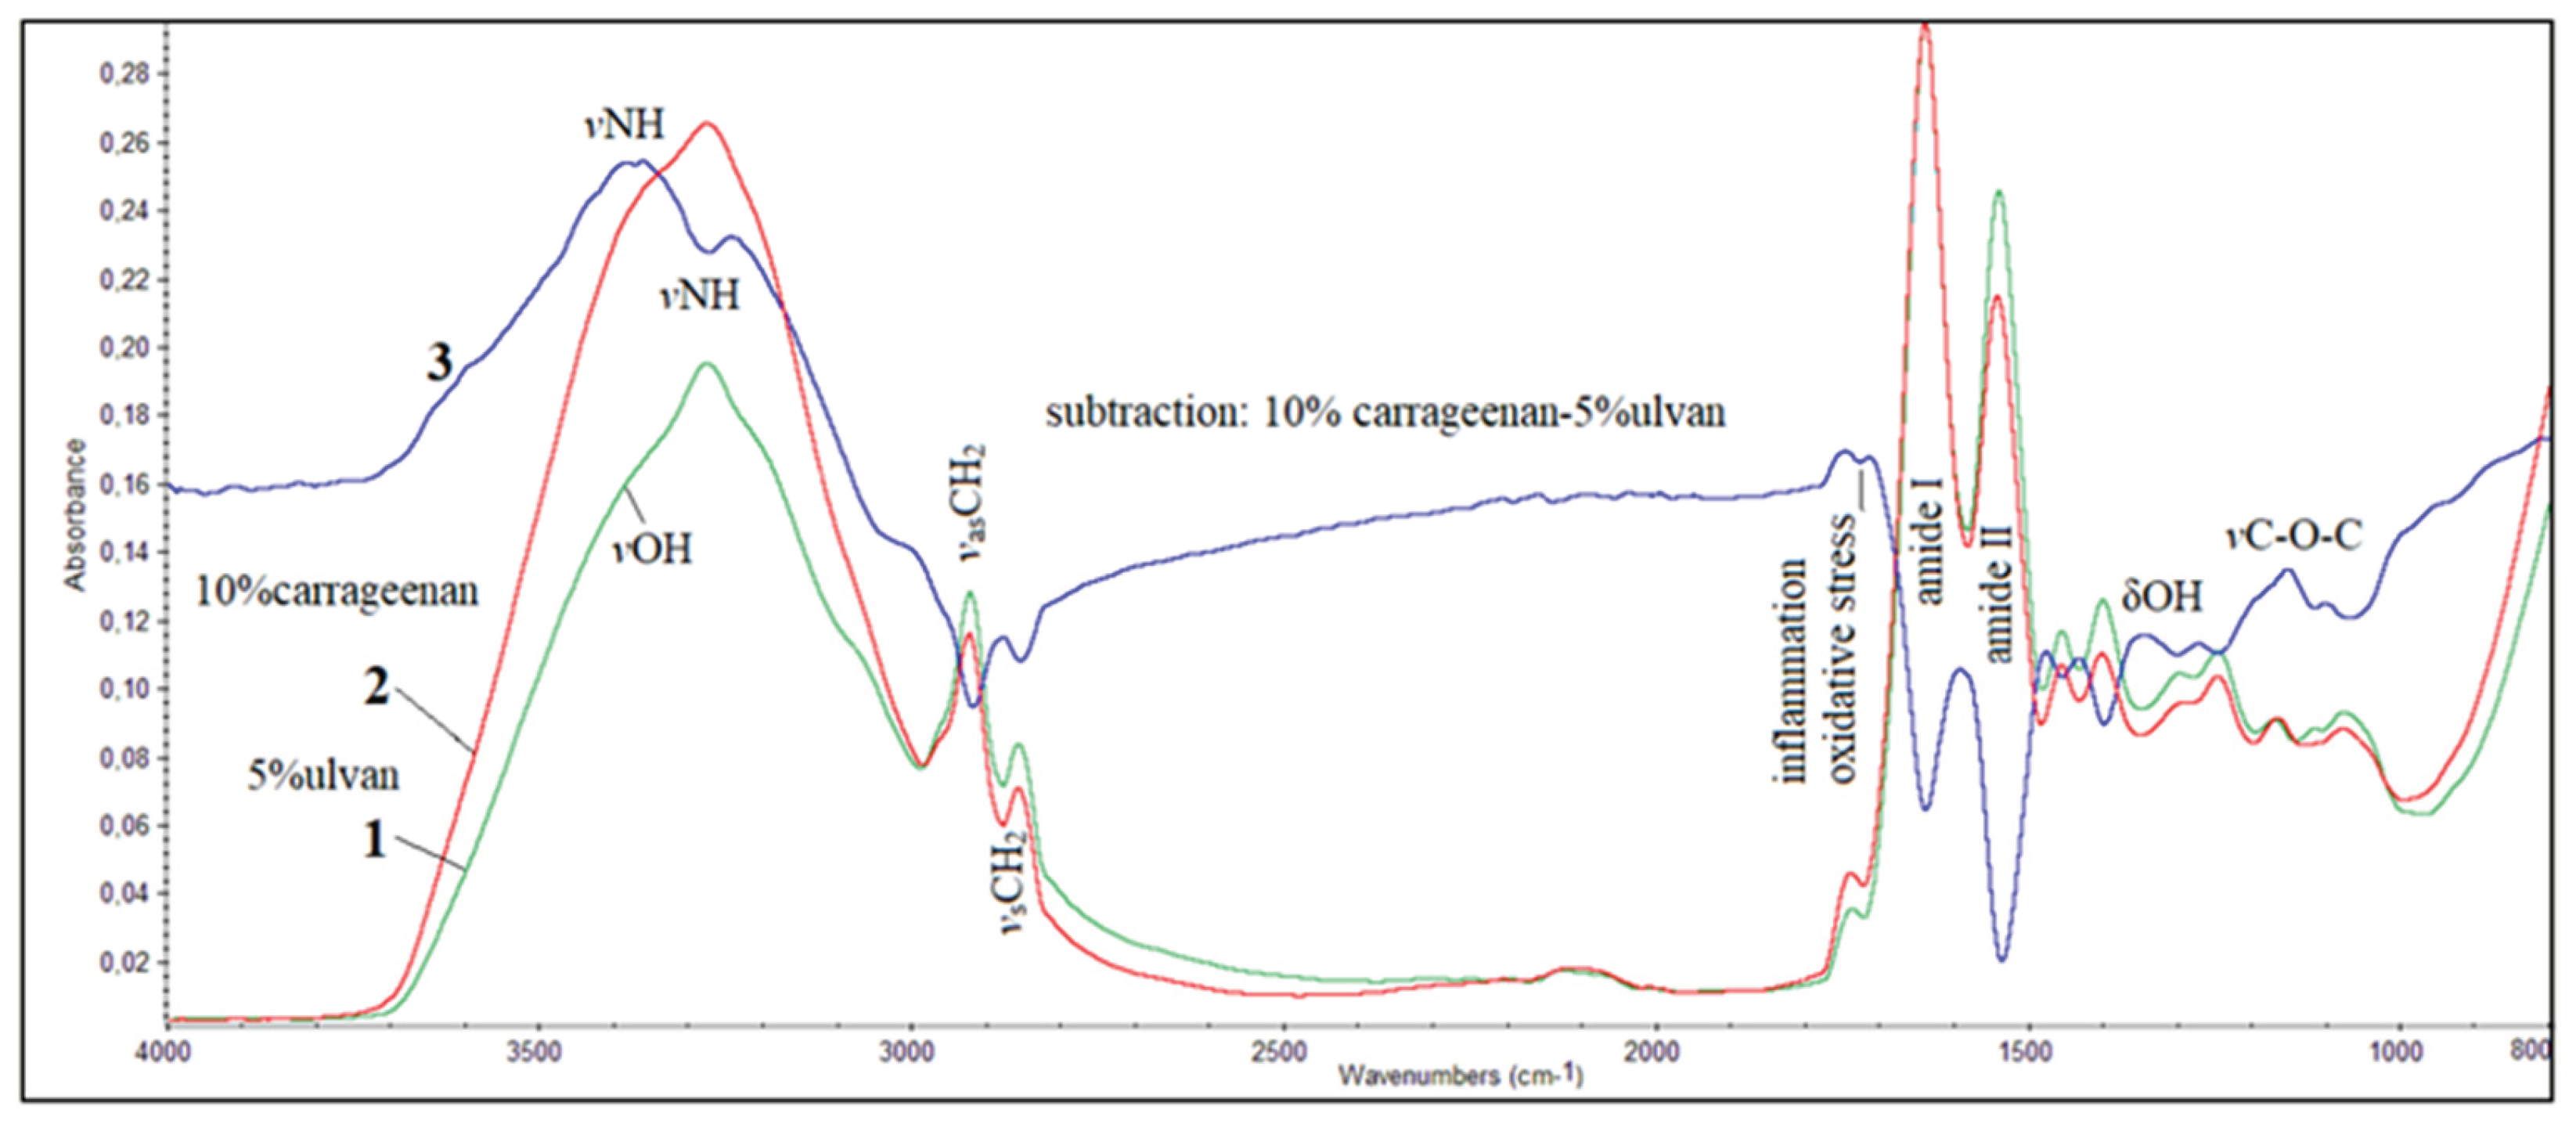

Table 1.
Classification of mice according to the administeredgels and their concentrations (w/w).
| Mice classification | Treatment |
|---|---|
| Control | no treatment |
| Vehicle | Pure gel with the excipients (gel with PIL) |
| Ulvan 1.5% | 1.5% ulvan gel |
| Ulvan 5% | 5% ulvan gel |
| Ulvan 10% | 10% ulvan gel |
| Carrageenan 1.5% | 1.5% carrageenan gel |
| Carrageenan 5% | 5% carrageenan gel |
| Carrageenan 10% | 10% carrageenan gel |
Table 2.
Scoring system for the histopathological evaluation of burn wound healing.
| absence | mild | moderate | heavy | |
|---|---|---|---|---|
| Inflammation | 0 | 1 | 2 | 3 |
| Oedema | 0 | 1 | 2 | 3 |
| Hyperkeratosis | 0 | 1 | 2 | 3 |
| Wound thickness | 0 | 1 | 2 | 3 |
| Ulceration | 0 | 1 | 2 | 3 |
| Necrosis | 0 | 1 | 2 | 3 |
| Parakeratosis | 0 | 1 | 2 | 3 |
Table 3.
Wound reduction equations, as derived from linear regression analysis, for the different treatments and concentrations (w/w) regarding the first half (days 1-15) and the second half (days 15-26) of the healing process.
Table 3.
Wound reduction equations, as derived from linear regression analysis, for the different treatments and concentrations (w/w) regarding the first half (days 1-15) and the second half (days 15-26) of the healing process.
| Day 1–Day 15 | Day 15–Day 26 | |
|---|---|---|
| Control Vehicle Ulvan 1.5% Ulvan 5% Ulvan 10% Carrageenan 1.5% Carrageenan 5% Carrageenan 10% |
Y = -13.44*X + 274.8 | Y = -4.574*X + 112.1 |
| Y = -12.83*X + 286.8 | Y = -5.839*X + 140.6 | |
| Y = -13.76*X + 293.0 | Y = -5.841*X + 140.9 | |
| Y = -13.51*X + 281.8 | Y = -4.301*X + 101.5 | |
| Y = -12.06*X + 283.6 | Y = -6.215*X + 148.8 | |
| Y = -14.20*X + 288.3 | Y = -3.866*X + 92.23 | |
| Y = -12.23*X + 276.3 | Y = -5.588*X + 132.6 | |
| Y = -15.59*X + 271.6 | Y = -2.656*X + 62.78 |
Table 4.
Histopathological results according to different treatments: evaluationof inflammation (Inf), oedema (Oed), hyperkeratosis (HPKe), wound thickness (WTh), ulceration &necrosis (Ulce&Ne) and parakeratosis (PKe).
Table 4.
Histopathological results according to different treatments: evaluationof inflammation (Inf), oedema (Oed), hyperkeratosis (HPKe), wound thickness (WTh), ulceration &necrosis (Ulce&Ne) and parakeratosis (PKe).
| Treatment | Inf | Oed | HPKe | WTh | Ulce&Ne | PKe | Total Score |
|---|---|---|---|---|---|---|---|
| Control | 2.0 | 3.0 | 3.0 | 3.0 | 0 | 1.0 | 12.0 |
| Vehicle | 3.0 | 3.0 | 2.7 | 3.0 | 0 | 0.7 | 12.4 |
| Ulvan 1.5% | 2.0 | 2.3 | 2.3 | 2.3 | 0 | 0.3 | 9.2 |
| Ulvan 5% | 1.7 | 1.0 | 2.0 | 1.7 | 0 | 0 | 6.4 |
| Ulvan 10% | 2.7 | 2.0 | 2.0 | 2.0 | 0 | 0 | 8.7 |
| Carrageenan 1.5% | 3.0 | 3.0 | 2.0 | 2.0 | 0 | 0 | 10.0 |
| Carrageenan 5% | 3.0 | 3.0 | 3.0 | 3.0 | 0 | 0 | 12.0 |
| Carrageenan 10% | 1.3 | 1.0 | 1.0 | 1.3 | 0 | 0 | 4.6 |
Disclaimer/Publisher’s Note: The statements, opinions and data contained in all publications are solely those of the individual author(s) and contributor(s) and not of MDPI and/or the editor(s). MDPI and/or the editor(s) disclaim responsibility for any injury to people or property resulting from any ideas, methods, instructions or products referred to in the content. |
© 2024 by the authors. Licensee MDPI, Basel, Switzerland. This article is an open access article distributed under the terms and conditions of the Creative Commons Attribution (CC BY) license (http://creativecommons.org/licenses/by/4.0/).
Copyright: This open access article is published under a Creative Commons CC BY 4.0 license, which permit the free download, distribution, and reuse, provided that the author and preprint are cited in any reuse.


