
Submitted:
21 March 2024
Posted:
21 March 2024
You are already at the latest version
Abstract
The growing importance of hydrogen as an energy carrier in a future decarbonized energy system has led to a surge in its production plans. However, the development of infrastructure for hydrogen delivery, particularly in the hard-to-abate sectors, remains a significant challenge. While the construction of new pipelines entails substantial investment, repurposing existing pipelines offers a cost-effective approach to jump-starting hydrogen networks. Many European countries are exploring the possibility of utilizing their current pipeline infrastructure for hydrogen transport. Yet, a critical aspect requiring extensive research is the expansion planning of these networks to accommodate increased capacity in the future. This study investigates the utilization of existing natural gas pipeline infrastructure for hydrogen transportation as a cost-saving measure. It explores two expansion strategies, namely pipeline looping and compression, for repurposing a segment of a 342 km x 36inch existing pipeline, from the Escravos – Lagos gas pipeline system (ELPS) in Nigeria, for hydrogen transport. Employing the Promax® process simulator tool, the study assesses compliance with the API RP 14E and ASME B31.12 standards for hydrogen and hydrogen-methane blends. Both expansion strategies demonstrate acceptable velocity and pressure drop characteristics for hydrogen blends of up to 40%. Additionally, the increase in hydrogen content leads to heightened compression power requirements until approximately 80% hydrogen in the blends for compression, and a corresponding extension in looping length until around 80% hydrogen in the blend for looping. Moreover, the compression option proves to be more economically viable for all investigated proportions of hydrogen blends for the PS1-PS5 segment of the Escravos – Lagos gas pipeline case study. The percentage price differentials between the two expansion strategies reach as high as 495% for a 20% hydrogen proportion in the blend. This study offers valuable insights into the technical and economic implications of repurposing existing natural gas infrastructure for hydrogen transportation.
Keywords:
Gas pipeline expansion
; Hydrogen
; compressor station
; looping
; pipeline economics
1. Introduction
In recent times, the potential of hydrogen as a major player in the future energy mix has been continuously reiterated by major stakeholders in the global energy industry. Some have made plans to transport it in the existing natural gas pipelines through progressive blending with methane in the short term, and the eventual flow of pure hydrogen in gas pipelines in the long term [1]. While many studies have explored the management of pipeline embrittlement in the most commonly used pipeline types for natural gas transportation – the API X52, for instance [2,3,4] – as an enabler for the profitability and viability of transporting hydrogen in existing natural gas networks [5], there is a paucity of information and understanding on the capacity expansion requirements of repurposing natural gas pipelines for hydrogen transportation. The considerable challenge for gas operators is that delivering hydrogen using existing gas networks requires either a reduction in the energy content delivered or expanding the gas network (by compression or looping) to meet the three times volume increase in hydrogen pipelines required to meet the same energy content from a typical natural gas network [6]. The former option is deemed undesirable, and the latter option begs for a feasibility study or an evaluation of the technical and cost implications of expanding existing natural gas pipelines to meet the volumetric requirements of delivering the same energy value as hydrogen. This paper, therefore, examines the use of two common pipeline expansion schemes – pipeline looping and compression [7] – to ascertain the technical and commercial suitability of expanding an existing 342 km, 36-inch natural gas pipeline network, the PS1-PS5 section of the ELPS, which stretches from the Escravos area, Niger Delta to Lagos, Nigeria for the transportation of hydrogen and blends of hydrogen and natural gas.
2.2. Introduction to Pipeline Expansion
Gas delivery through pipelines is achieved through a network design/planning process which takes cognisance of the consumer requirements, Q, the distance between the inlet and delivery point, L, the inlet pressure, P1, the outlet pressure P2, the pipe diameter, D, and associated properties of the gas itself including viscosity, compressibility factor, temperature, T, and ambient standard conditions for the location, Pb, and Tb. These variables are formulated into well-established equations/models that describe the flow process. They include the general flow equation, Weymouth equation, and Panhandle equation amongst many others. The Modified Panhandle equation is one of the most suitable models for the design of natural gas transportation through pipelines [8]. The Modified Panhandle equation is shown in Equation (1).
Where:
Q = volume flow rate, scfd (standard cubic feet per day)
E = pipeline efficiency, E<1.0
Pb = base pressure, psia
Tb = base temperature, °R ((°C × 9/5) + 32) + 460
P1 = upstream pressure, psia
P2 = downstream pressure, psia
= gas gravity (air = 1.00)
T = average gas flow temperature, °R ((°C × 9/5) + 32) + 460
L = equivalent length of pipe segment, mi
Z = gas compressibility factor, dimensionless
D = pipe internal diameter, in.
A gas network, therefore, connects pipelines and equipment to transport natural gas between designated facilities and locations. Pressure, which is the energy that drives the flow of gas in a network is rarely constant along a pipeline network. Factors such as friction along pipe internals, flow through bends and elbows, changes in flow diameter and elevations along a network alter the pressure in a network. When the pressure is reduced, it is called head loss [9]. When head losses occur, gas networks may not achieve their objectives such as transporting natural gas to the desired destination at a specified discharge pressure or keeping the flow velocity below contractual or recommended design limits. Gas network expansion is a way to remedy this. It is achieved by adding new assets such as pipes, compressors, and storage facilities to the gas network, to reduce head losses across the network [10,11].
Fundamentally, gas network expansion by pipeline looping works by conserving the pressure in a network across a given distance. A ‘loop’ begins and ends at the same point and thus, has a pressure differential of zero [9]. So, while distance is covered by the network, there is an overall head loss of zero across the loop. In practice, looping is done by connecting a pipeline section in parallel to (and with) the main gas pipeline. When looped, the section of the main gas pipeline in the loop experiences a reduction in the flow rate of the flow stream. Consequently, the total head loss for overcoming flow is a direct function of the looping length [7,12].
Similarly, gas network expansion by the introduction of compression stations increases the efficiency of the pipeline network by boosting the energy of flow at desired point(s) along the length of the pipeline or strategic/desired points on the network. A compressor station is a set of facilities and equipment designed to achieve the reduction of head losses in a gas network by performing this task.
Macroeconomic and socioeconomic factors affect the design of pipelines and gas networks. Such factors include the increasing energy demand due to economic growth and industrialization [13] and the rising clamour for decarburization of the energy system as part of the overall energy transition campaign. The latter has forced stakeholders in the energy industry to consider blending hydrogen with natural gas or using pure hydrogen as the future energy [14,15,16]. In line with that, several studies have been undertaken to understand the behaviour of hydrogen and blends of natural gas and hydrogen in natural gas pipelines.
For instance, a study by Abbas et al. in 2021 showed that because the calorific value of hydrogen is about one-third that of natural gas, there is an increased volume requirement for hydrogen transportation to meet the same energy requirements as natural gas. Also, due to the high compressibility of hydrogen relative to natural gas, the former requires far less energy to transport; thereby providing a potential for compressor energy savings. Thirdly, the study revealed that transporting hydrogen in natural gas pipelines could create high-velocity profiles such that conventional gas pipelines’ internal erosional velocity limits are exceeded. To remedy this, pipeline expansion using pipe looping and compressor stations [17] was recommended. This work will explore these recommendations and assess their suitability, economics, and applicability to Nigeria’s Escravos – Lagos pipeline.
Like this study, Klopcic et al. 2022 assessed the impact of hydrogen content in natural gas on various technical parameters related to pipeline transport, such as pressure drop, compressor power, and energy storage capacity. Through thermodynamic analysis and CFD simulations, the researchers validated their analytical approach and investigated factors including wall roughness, operating pressure, and pipeline diameter. Results show that while transporting the same energy content as pure natural gas is feasible with hydrogen blends, higher hydrogen concentrations require additional compressor stations and result in decreased transport efficiency over long distances. The study emphasizes the need for off-grid storage options due to the reduced line pack with hydrogen. Further research is suggested to analyse hydrogen quality during transport and assess the compatibility of pipeline components with hydrogen [18]. As a complement to their work, this study will also quantify the extent to which hydrogen presence in natural gas streams increases the logistical expenses (specifically, compressors and reinforcement pipeline materials) when an expansion of the gas pipeline is desired for it to be repurposed for hydrogen transportation, using the ELPS shown in Figure 4 as the case study.
While our case study is in the Nigerian market, Lipiainen et al. in 2023 examines the potential of repurposing existing natural gas pipelines for hydrogen transport in Europe, with a focus on Finland, amidst increasing clean hydrogen production. Through a literature review and a fatigue life assessment tool development, they evaluated the feasibility and challenges of this approach. Their results suggest that blending hydrogen into the gas grid offers a transitional solution, but significant hurdles exist, including material compatibility and infrastructure costs. Also, they reiterated that while repurposing gas pipelines for 100% hydrogen transportation is possible, unresolved issues like the infrastructure-production scale-up dilemma remain. They also buttressed the fact that further research is needed to validate pipeline compatibility with hydrogen and explore alternative transport options [19].
A good understanding of the regional differences in technical and cost implications of the adoption of gas lines for hydrogen, as well as the regional gas network coverage and usage profiles, such as those reported in Finland, is crucial for the development of tailored strategies for regional and subsequent global transition into a hydrogen economy. In line with that, this study provides unprecedented insights into the technical and economic implications of an intended repurposing of a segment of the Nigerian Escravos-Lagos natural gas network for hydrogen transportation.
2.1. Pipeline Expansion by Compression
Pipeline compression increases pipeline capacity while shortening the pipeline length required for pressure drop – say from P1 to P2 in the Modified Panhandle equation (Equation 1). When compression is used, Equation 1 gives the gas volumetric flow rate as shown in Equation 2.
where is the number of compressors; the other variables are as defined in Equation 1.
The number of compressors required to transport a given volume of gas, therefore, depends on the pipe size, allowable pressure, and environmental factors among others [8].
In some cases, increasing the inlet pressure as shown in Figure 1 can boost pipeline capacity, thereby avoiding additional compressors. This, however, is not the case for most installed pipelines as they have pressure rating restrictions and are usually buried with fixed diameters. For such scenarios, the common option is the installation of additional compressor stations. As shown in Equation 2, additional compressor stations reduce the length required to achieve the desired/allowable pressure drop; allowing additional capacity to be added to the network, as shown in Figure 2.
The increasing potential of hydrogen blending and transportation in the existing gas network calls for increased research studies on gas network capacity increment due to the low calorific value of hydrogen compared to natural gas. Therefore, this study partly examines the use of compressor stations for the expansion of existing gas networks for the transportation of hydrogen and blends of hydrogen and methane.
2.2. Pipeline Expansion by Looping
Due to the limitations of pipeline expansion by compression discussed in Section 2.1 – the constraint of not increasing pressure beyond allowable and operable values, pipeline looping has continued to gain widespread application in gas transportation [17]. As mentioned previously, pipeline looping involves the splitting of flow with another pipe parallel to the main line, resulting in reduced pressure drop in the original pipe without the need to reduce the volumetric flow rate. For a network/pipeline of uniform size and volumetric flow. Figure 3 provides a schematic for computing the looping length for a desired capacity increase.
The total pressure drop across the pipeline AB (is the sum of the pressure drop across section AC () and the pressure drop across CB (). This is shown in Equation 3.
Also, can be expressed in the general form of the low-pressure gas flow equation as shown in Equation 4 [20]
where K = resistant factor; L = total pipe length and Q = pipe flow capacity.
While for section CB,
Substituting Equations 5 and 6 in Equation 3 results in the expression:
If we input the values for the flow rate for each section as shown in Figure 3, we have:
Where is the amount by which we intend to increase the pipeline capacity.
Equation 7 gives the general expression for the length of the reinforcement pipe needed to increase the pipeline capacity by a factor of. Therefore, for a 50% capacity increase (where), the minimum reinforcement length, required would be 74% of the original length, L.
2.3. Gas Network Modelling
Gas network modelling can be defined as the simulation of fluid movement and pressure within pipelines, alongside the steps taken to ensure that a gas network can fulfil its designated operational tasks and adhere to the outlined design standards [9]. Gas network modelling can also be used to improve the operations of gas transmission and distribution networks or optimise desired objectives or Key Performance Indicators (KPI) in the network [21,22]. Conventional gas network models use analytical and numerical tools to solve non-linear pipe flow equations that consist of flow parameters (e.g., flow rate, pressure, temperature, etc.), flow stream properties and physical network parameters (like elevations and inclinations) [7,23]. In addition to these variables, state-of-the-art gas network models incorporate the gas demand (or load), uncertainty estimations, and seasonal fluctuations in demand and also, provide the flexibility of incorporating the gas network models and simulation with those of the facilities at the users’ end (such as electric grid models) [24,25,26].
The input parameters of a gas network ensure that the physical parameters of the network are represented. They include pipe parameters (length, diameter, condition, material of pipe construction), load data, source pressure, and operating characteristics of pressure regulation equipment [20]. They are related as shown in the general flow equation for gas flow in circular pipes provided in Equation 12 [17].
where is the gas velocity (); is the pressure at standard conditions, (; is the inlet pressure, ; is the pipe diameter (; is the volumetric flow rate (; is the Fanning friction factor (); is the specific gravity of gas ( and is the pipe length (.
The fundamental requirement of any gas network analysis model (and of most simulation models) is the close representation of the actual network. To achieve this, it is expedient to use accurate input data and model the input parameters accurately, effectively carry out the load monitoring and pressure surveys, and efficiently use the data from the flow/load monitoring and the pressure surveys [9,27].
3. Study Methodology
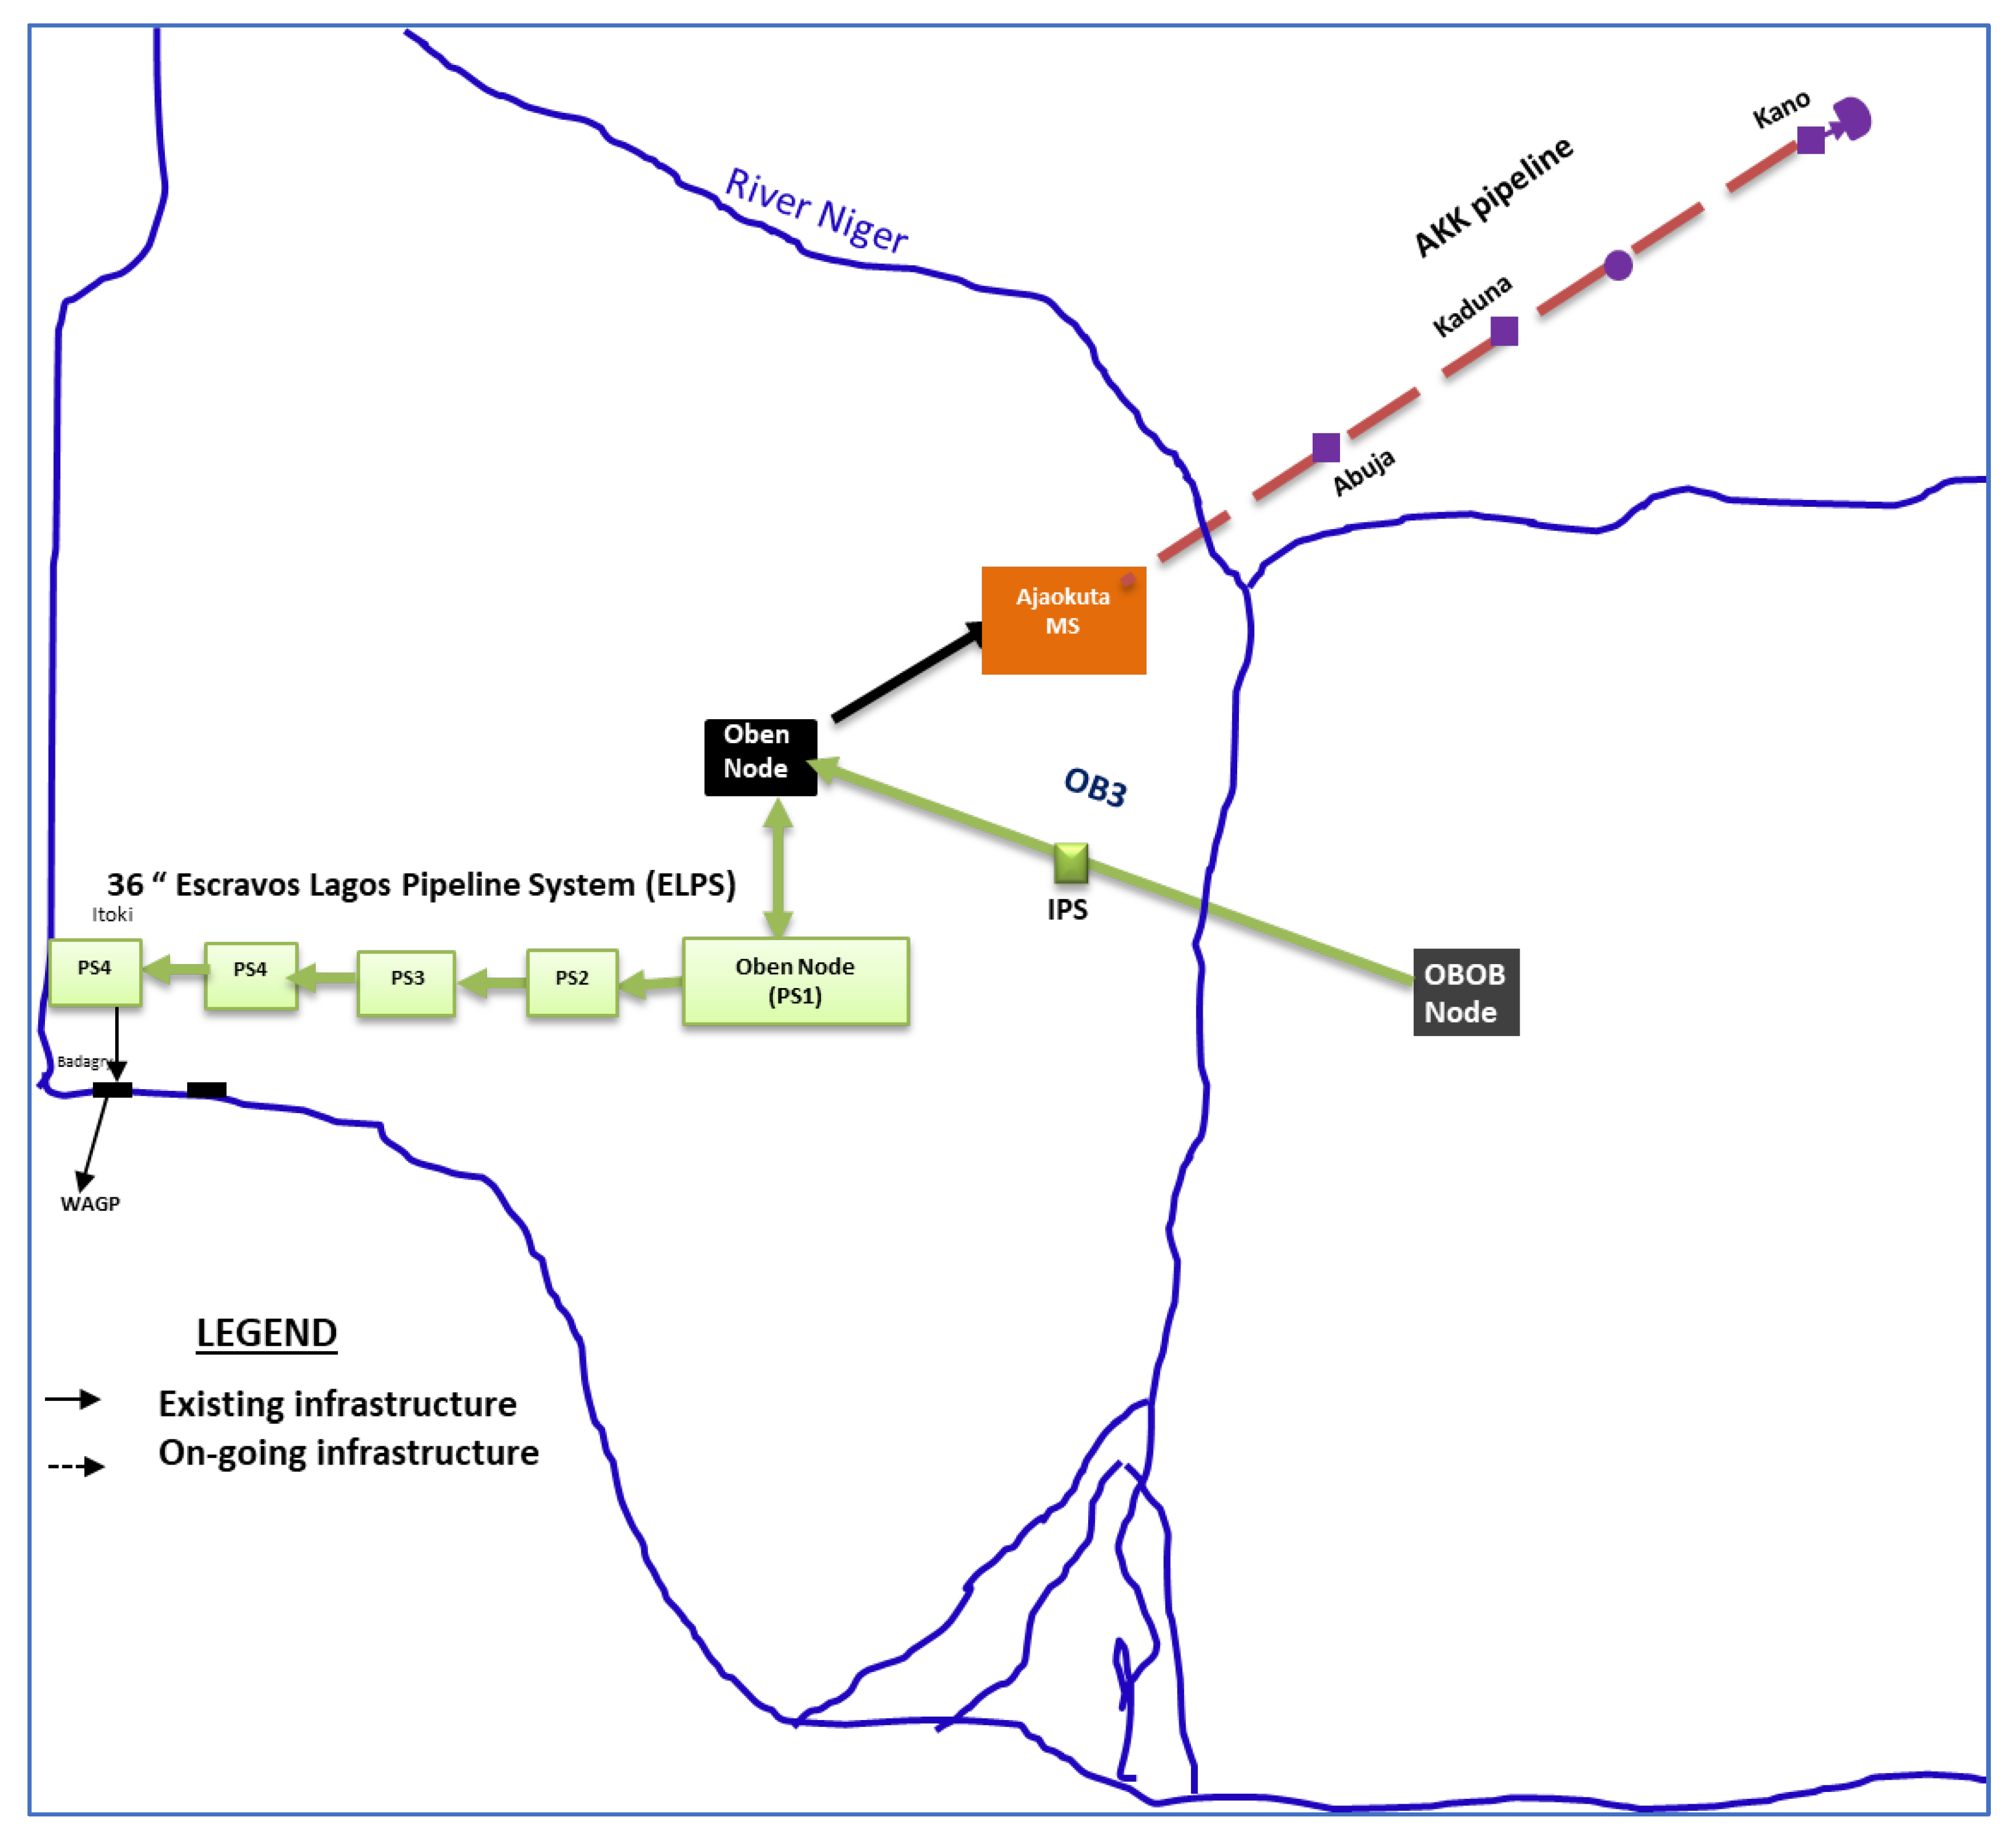
This study models a section of an existing 36-inch pipeline network, 342 km in length, from PS1-PS5 of the ELPS, stretching from the Escravos area, Niger Delta, Nigeria to Lagos. The gas network supplies natural gas to major industrial clusters and power plants along the path and also provides interconnection to flow gas to the Northern gas markets, as shown in Figure 4. The current network transports natural gas up to 580 MMSCFD. There are however plans to introduce and transport hydrogen in the network for power generation and other industrial applications. Therefore, this study will provide an initial feasibility assessment and first-pass decision-making regarding the planned introduction of hydrogen into the Escravos–Lagos gas network.
Figure 4.
Escravos - Lagos Pipeline Network Map.
The natural gas phase used throughout this work, Nigeria’s domestic gas composition which is the gas composition in the ELPS network, has the properties and compositions specified in Table 1 and Table 2 respectively. While the Methane (C1) composition range from 85% to 95%, the high value of 95% has been chosen to capture the leanest/driest gas composition. This is to better capture the interactions between hydrogen and methane with less noise in the experimental results from the effects of heavier hydrocarbon fractions that would characterize a rich gas blend and flow stream.
The gas network analysis tool used is the Promax® Process Simulator [28].
The model input parameters are provided in Table 3 for the single-pipe model shown in Figure 5 and the experimental workflow is presented in Figure 7.
3.1. Gas Network Expansion Options Analysis
The study approach utilises the pressure drop, velocity and reinforcement/compression parameters and also considers the cost of the two expansion options to understand the performance and economic implications of adopting the existing natural gas network (Figure 4) for use in hydrogen transportation.
Throughout the analysis, the Esmaeilzadeh–Roshanfekr Equation of States (ER–EOS) was employed for the P–V–T–Z (pressure–volume–temperature–composition) modelling because the ER-EOS is more suitable for modelling lighter hydrocarbons relative to the PR-EOS and the SRK-EOS [29,30] and also, more efficient in representing individual property interactions of the two phases in the natural gas and hydrogen blends [17]. The Beggs and Brill multiphase flow model was used for the pressure gradient modelling throughout the study “for its versatility and suitability for gas modelling” [17,31].
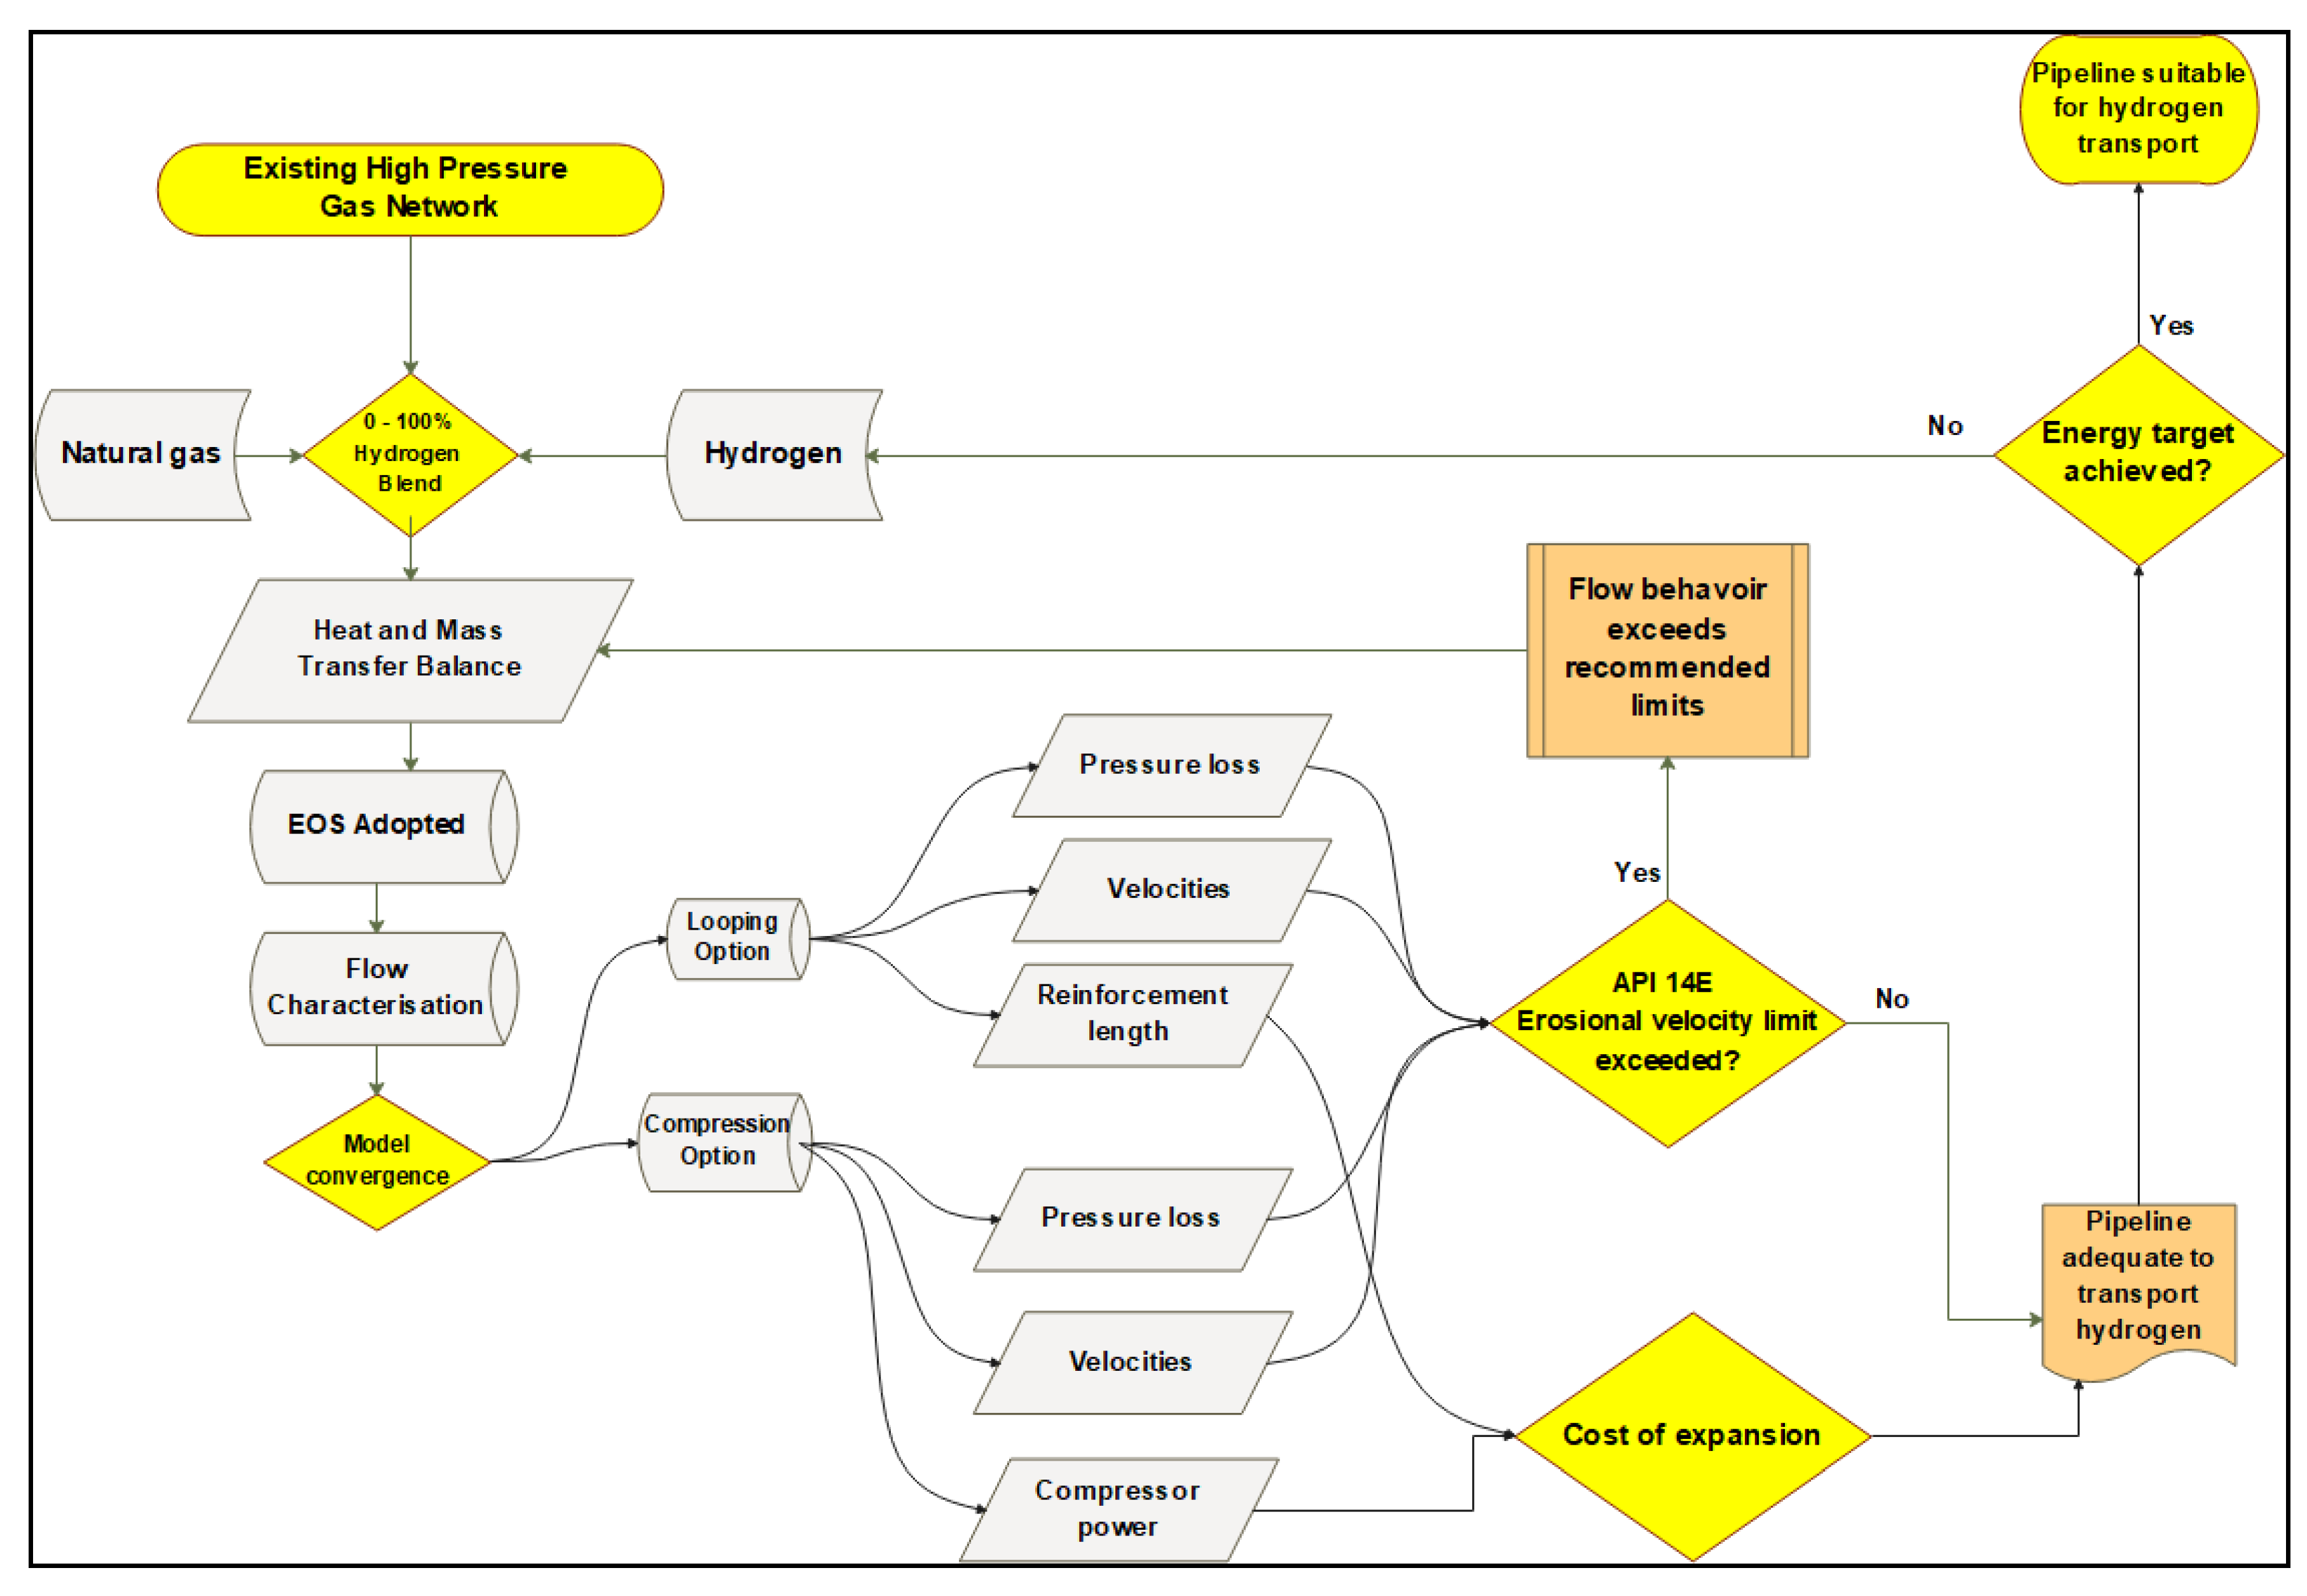
The experimental workflow (Figure 7) involves a process simulation and cost analysis. The former entails blending the natural gas stream with 0, 20, 40, 60, 80 and 100% hydrogen, then performing modelling convergence to obtain the material and energy balances. Following that, a comparison of the two expansion options was undertaken considering limiting velocity, pressure loss, compressor power, reinforcement length and the cost of required compressor stations or loop pipeline length. These are compared to the acceptable range as per API RP 14E while ensuring that the contractual delivery pressure requirement is met.
3.1.1. Gas Network Expansion with Looping/Pipeline Reinforcement
In Section 2.2, a method for expanding gas networks called the “pipeline reinforcement approach” was presented. This method involved adding a new pipe, known as the “reinforcement” or “loop” pipe, parallel to the original pipe to allow for flow splitting. When the flow is divided between the two pipes, the pressure drop decreases in the original pipeline. As the flow is combined again after the loop or reinforcement section, the pressure and velocity profile are reduced by the effect of the preceding loop.
For each simulation run, the inlet pressure is maintained at 60 bar while the pipeline is reinforced from the inlet up to a reinforcement length that will deliver the gas at the contractual delivery pressure while keeping the flow stream velocity below the recommended erosional velocity limit [17] for the flow as per API RP 14E.
The important factors to consider for this scheme are the pipe section flow characteristics and the reinforcement length. Figure 6 shows the process diagram for this option while the analysis of the flow behaviour and effect of the introduction of the reinforcement is provided in Section 4.1.
Figure 6.
Process diagram of Pipeline Expansion with Looping/Pipe Reinforcement.
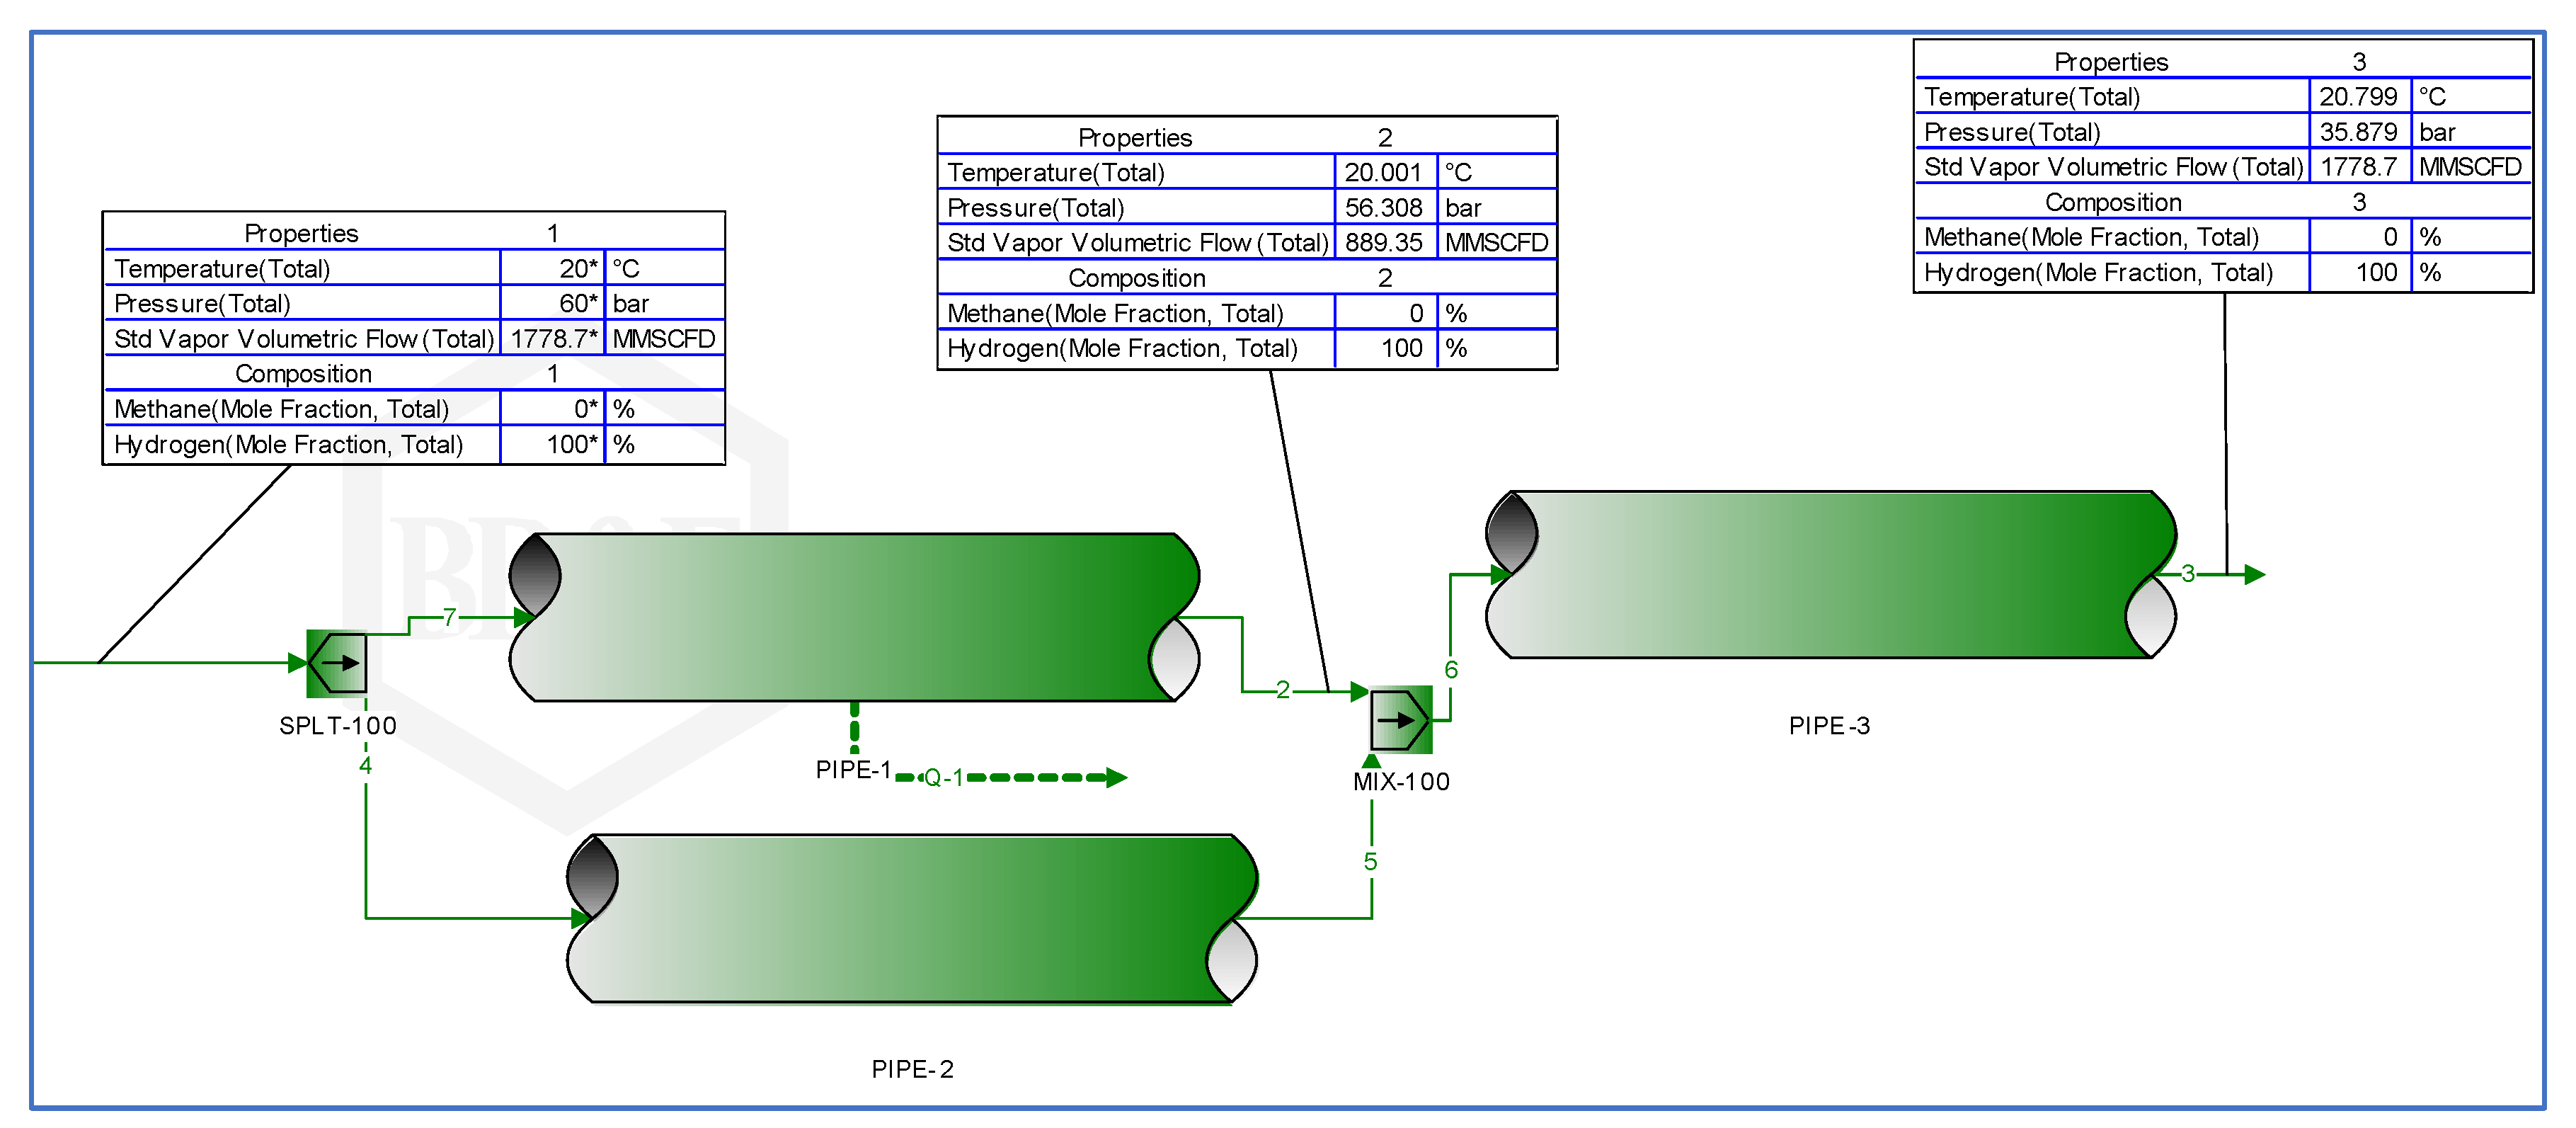
Figure 7.
Experimental Workflow.
3.1.2. Gas Network Expansion through Compression
Increasing the capacity of an existing gas network to transport hydrogen can also be achieved through the introduction of compressor stations at strategic points in the network [17]. This scenario analyses the compressional power, cooling utility and cost associated with the expansion of the existing gas network to transport hydrogen with the expansion option of using compressor stations as shown in Figure 8.
As discussed in Section 2, compressors increase pipeline capacity by reducing the length required to achieve a desired pressure drop. The existing network, as originally designed for natural gas transportation, requires no compression (See Figure 12, Section 4.2). To expand, and subsequently adopt the network for hydrogen transportation, the use of compressor stations is investigated. The compressor station is positioned 150 km from the inlet. The 150 km expansion point was chosen after several preliminary runs indicating that the estimated maximum internal velocity limit was always exceeded, even with blends with low hydrogen proportions at this length. With the inlet pressure maintained at 60 bar, the experimental runs were performed to select the optimal compressor horsepower that would deliver the gas to the exit at the minimum contractual exit pressure of 17.34 barg at Lagos, such that the velocity profile in the pipeline falls within the recommended range as per API RP 14E. The natural gas phase was progressively blended with hydrogen in increments of 20% up to 100% hydrogen. The results of the analysis from this section are presented in Section 4.2.
4. Results and Discussion
4.1. Pipe Looping/Reinforcement Expansion Option Analysis
4.1.1. Flow Characteristics
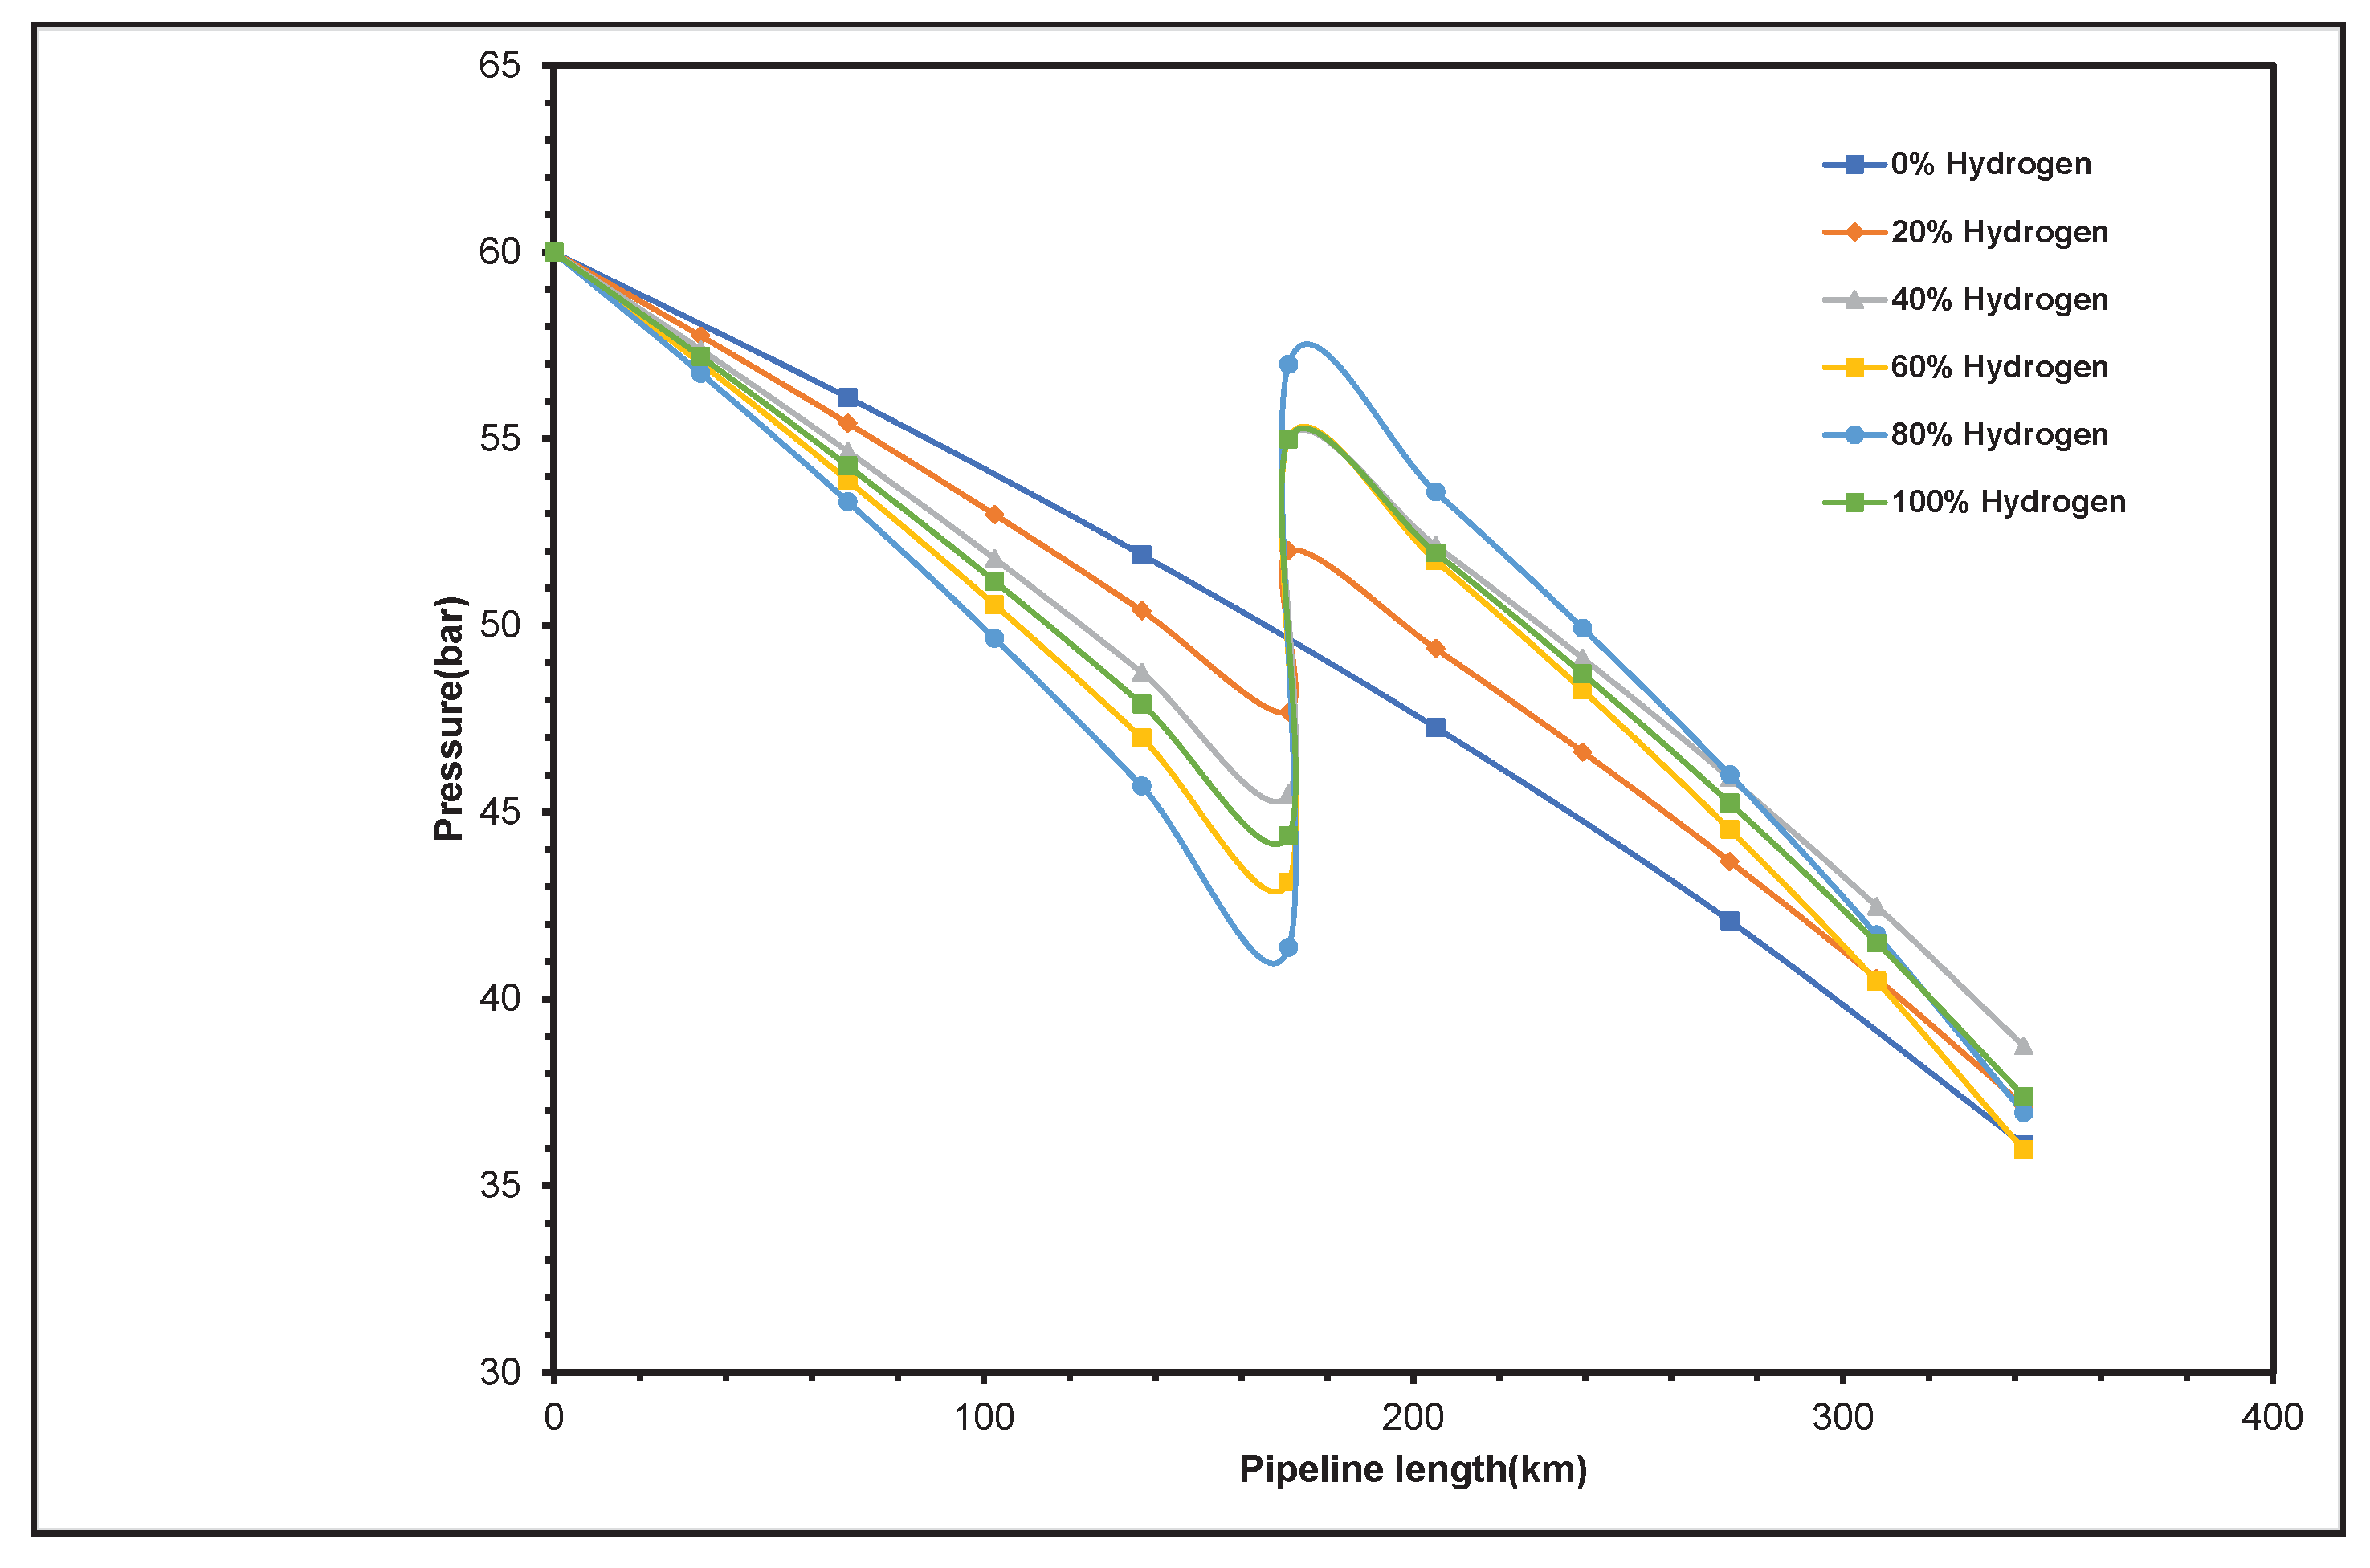
The flow behaviour of gases under the reinforcement scheme differs significantly from that under the compression expansion option; the former is characterized by two pressure regimes, as shown in Figure 9.
Although gradual pressure declines were witnessed in both the reinforced and original pipe sections, steeper pressure losses were experienced in the latter due to the volumetric flow increase that resulted from the comingling of the flow from the reinforcement/loop pipes at the end of the loop. As shown in Figure 9, a decline in pressure (or increase in pressure drop) was experienced in the pipeline with increasing pipe length due to the resistance to flow imposed by viscous and frictional drags. Also evident in the flow behaviour is the continuous reduction in the rate of pressure loss along the reinforced and non-reinforced sections of the pipe with increasing hydrogen proportion in the blends. This is because the introduction of hydrogen in the flow stream reduces the density of the flow stream; so that, lower pressure losses are encountered with increasing hydrogen content relative to the flow of only the natural gas phase.
Furthermore, the introduction of hydrogen in the pipeline created higher pressure regimes in the network relative to the pressure profile for the flow of only the natural gas phase. With only 20% hydrogen in the blend, this was stepped down early at about 80 km and for higher hydrogen blends, the high pipeline pressure values were sustained even beyond the reinforcement/loop length. This observation underscores the need for modifications in pressure vessels, instrumentations, valves, connections, etc., in existing natural gas networks intended to be repurposed for hydrogen transportation to avoid failures from the increase in pressure that the introduction of hydrogen creates.
Besides the pressure behaviour, another significant flow characteristic to be mindful of is the velocity profile in the network. Figure 10 reveals that the velocity of the flow stream rises gradually within the extent of the loop/reinforcement.
Beyond the 150 km loop, the rate of increase of the velocity rose sharply (at different points depending on the amount of hydrogen in the blend) and then steadied at a higher rate than that of the reinforcement section. This trend is noticed in the blends with 20 – 100% hydrogen content but not in the natural gas stream without hydrogen. This is due to the excessive pressure loss and the consequent density changes in the non-reinforced section of the pipeline relative to the first 150 km reinforced section. It shows that the original pipeline design would not require reinforcement for pure natural gas flow.
In other words, the natural gas stream (with 0% hydrogen) in the pipeline region without reinforcement follows a usual trend of increasing velocity in a near-straight-line pattern with a positive slope. Blends with increasing hydrogen contents from 20, 40, 60, 80 and 100% followed a similar pattern in the reinforced pipe section up to 90 km, 150 km, 180 km, 210 km, and 150 km length of the pipeline, respectively. Following that, a sudden rise in velocity is witnessed for every hydrogen-natural gas blend. The 100% hydrogen curve is characterized by a higher rise in the flow stream velocity in the non-reinforced section because of the significant density difference between the blends and the pure hydrogen system.
4.1.2. Reinforcement (or Loop Pipe) Length
The distinctive parameter during pipeline reinforcement is the reinforcement length. According to Equation 7, increasing the pipeline capacity by a factor of ‘ increases the value of reinforcement length where is the original length of the pipeline. This is valid only for a uniform-density gas such as natural gas and will differ when natural gas and hydrogen blends are considered.
In this study, the required length to achieve equivalent pressure drop for different hydrogen blends was studied and presented in Figure 11.
The required reinforcement length was the least for the 20% hydrogen blend. This can be explained by the closeness of natural gas and 20% hydrogen blends in terms of their energy contents and the Wobbe indices. As the hydrogen composition continues to increase in the blends, significant capacity changes (needed to meet the energy output requirements of the network) necessitate longer pipe lengths to meet the pressure drop requirements in the reinforced section. This persisted up to 80% hydrogen in the blends. However, at 100% hydrogen, its low density and high compressibility characteristics caused lesser pressure loss and an eventual decrease in the reinforcement length required despite the increasing capacity constraint.
4.2. Gas Network Expansion with Compression Option
4.2.1. Flow Characteristics
Like the looping/reinforcement option discussed earlier, the pressure profile of the flow stream under this expansion scheme shown in Figure 12 reveals that no additional compression station is required for the original network for the transport of natural gas, as was intended. However, as the hydrogen proportion increases in the blends from 20%, the pressure loss increases, necessitating additional compressor power to meet the arrival/outlet pressure requirement. The maximum pressure loss was seen at 60% and 80% hydrogen blends due to the combination of increased capacity and high compressibility factor for hydrogen at such blends [17]. Like the reinforcement option, at 100% hydrogen flow, the low-density and high compressibility characteristics of the flow stream caused lesser pressure losses (and consequent higher pressure drops) relative to the 60% and 80% hydrogen cases despite a higher capacity requirement.
Figure 12.
Compression option pressure profile.
Similar trends can be observed by the velocity plots across the network; with natural gas experiencing the lowest (and near linear) velocity increase across the length of the pipeline, as shown in Figure 13. As the composition of hydrogen increases up to (and beyond) 20%, velocity continues to increase due to the reduction in the density of the flow stream. With the introduction of compression, the flow velocity is boosted again such that the fluid gets to the desired outlet with a velocity value that does not exceed the acceptable range as per API RP 14E standard.
4.2.2. Estimating Compressors Horsepower for Pipeline Expansion via Compressor Stations
Values of the compressor Horsepower (HP) needed to expand existing gas networks by the installation of compressor stations were also obtained for different blends of hydrogen and natural gas. The results (Figure 14) show a similar trend with the length of loop pipes needed for pipeline expansion by looping (Figure 11). That is, the higher the proportion of hydrogen in the blend/flow stream, the higher the HP of compressors that are needed to maintain the desired pressure drop through the simulation run (or gas delivery). Although the smaller hydrogen molecules should lighten up the flow stream and require lesser compressors with increasing hydrogen proportion, this is not the case. That is because the introduction of hydrogen reduces the energy content of the flow stream and more volumetric flow is needed to compensate for that. This increase causes an overall increase in the pressure loss of the system that necessitated higher compressor ratings with increasing hydrogen proportions in the blend. While over 45,000 hp compressors are needed for the 80:20% methane-hydrogen blend, the compressor hp needed for pure hydrogen is slightly below that because pure hydrogen offers less resistance to flow (frictional and viscous drags) than blends of hydrogen and methane owing to its low density and high compressibility combination. This is consistent with the estimate of the number of compressor stations required for the pipeline transportation of varying blends of methane and hydrogen over 6000km results of similar investigations by Klopcic et al. in 2022 [18].
4.3. Cost Analysis
4.3.1. Cost of Natural Gas Pipeline Expansion Projects
The cost of pipelines and compressor stations contributes the most to a typical pipeline project’s expense [8]. It is, therefore, crucial to analyze and compare the costs of expanding an existing network since the purchase and installation of additional pipelines and compressor stations constitute the major operations in pipeline expansion projects by looping and the use of compressor stations, respectively. Since the cost of this equipment is based on several variables including quotations from vendors, the location of the project, the prevailing economic indices, etc., it is difficult to put a price tag on the cost of looping or compressor stations. However, for this cost analysis, the authors referred to two expedient pipeline looping projects from the US Energy Administration Agency’s inventory of US gas pipeline expansion projects: the 2022 Big Bend Natural Gas Loop Extension project in Florida and the 2021 Columbia Gas Northern Loop Project. From these projects, the average cost of gas pipeline expansion by looping was calculated at $5,170,000 per kilometre of reinforcement length [32].
In the same fashion, an acceptable cost of pipeline expansion with compressor stations can be roughly estimated from the Transcontinental Gas Pipeline Southeast Energy Corridor Project – a $155 million expansion project involving 3.22 km of looping and an 11,110 hp compressor station installation [32]. If the cost of the reinforcement section ($16.65 million, using the estimate from the last paragraph) is subtracted from the project cost, then the cost of the compressor station can be approximated to $12,453 per hp.
4.3.1.1. Estimating the Cost of Pipeline Expansion by Looping for the Escravos – Lagos, Nigeria Pipeline
The estimate of the pipeline looping project from Section 4.3.1 can be divided into material, labour, right-of-way (ROW) and miscellaneous expenses in this proportion [33]:
Given cost in the US: $5,170,000 per km of loop/reinforcement.
- Material cost: $1,706,100 per km (33%)
- Labor cost: $2,533,300 per km (49%)
- Right of way cost: $310,200 per km (6%)
- Miscellaneous cost: $620,400 per km (12%)
To estimate the cost of pipeline reinforcement for our case study, the Escravos – Lagos pipeline, the following adjustments are made to, more closely, reflect the Nigerian market.
Adjustment 1: Material costs.
It is assumed that material costs in Nigeria are higher than in the US due to the need to import pipelines and associated materials. According to the United Nations COMTRADE database on international trade, Nigeria’s imports of iron and steel was US$930.41 Million in 2021 [34]. Also, The Guardian reported in 2018 that Nigeria still imports an estimated $3.3 billion worth of steel and associated derivatives annually [35]. Furthermore, Nigeria’s imports of items made from iron or steel increased by 22.3% in 2021 according to World’s Top Exports [35]. Since Nigeria relies heavily on imported pipeline construction materials due to the limited availability of locally sourced materials. Import duties and transportation costs can significantly increase the cost of pipeline construction materials in Nigeria. Therefore, material costs for pipeline looping projects in Nigeria can be 50-100% higher than in the US. For this estimate, we will assume a 75% increase in material costs.
So, adjusted material cost: $1,706,100.00 x 1.75 = $2,985,675.00 per km.
Adjustment 2: Labour costs
While labour costs in Nigeria are generally lower than in the US, skilled labour required for pipeline construction may be more expensive due to the engagement of expatriates and the frequent farming out of such projects to (usually) foreign companies. For this estimate, therefore, we will assume a 25% increase in labour costs.
So, adjusted labour cost: $2,533,300 x 1.25 = $3,166,625 per km.
Adjustment 3: Right-of-way-costs
Right-of-way costs may vary depending on the specific location and conditions of the project. Nonetheless, for this estimate, the authors will assume a 50% increase in right-of-way costs. The cost of obtaining the right of way for pipeline construction in Nigeria is assumed to be higher than in the US due to the complexity of the land acquisition process and the need to compensate various stakeholders in the former.
Hence, adjusted right-of-way cost: $310,200 x 1.5 = $465,300 per km.
Adjustment 4: Miscellaneous costs
Miscellaneous costs may include expenses such as permits, taxes, and insurance. These costs may vary depending on the specific conditions of the project. For this estimate, we will assume a 25% increase in miscellaneous costs relative to the US situation.
So, adjusted miscellaneous cost: $620,400 x 1.25 = $775,500 per km
The total estimated cost of pipeline expansion by looping in Nigeria, adjusted from the US market:
Adjusted material cost: $2,985,675 per km
Adjusted labour cost: $3,166,625 per km
Adjusted right-of-way cost: $465,300 per km
Adjusted miscellaneous cost: $775,500 per km.
Total estimated cost in Nigeria (without contingency): $7,393,100.00 per km
Contingency:
As with any construction project, it is important to add a contingency to the estimated cost to account for unexpected expenses. For this estimate, we will add a 10% contingency.
Therefore, the total estimated cost of pipeline expansion by looping in Nigeria, adjusted from the US market (including contingency): is $8,132,410.00 per km.
4.3.1.2. Estimating the Cost of Pipeline Expansion with Compressor Stations for the Escravos – Lagos, Nigeria Pipeline
In a similar fashion to the analysis of the last section, the estimate of pipeline expansion by compression from Section 4.3.1 of $12,453 per hp of compressor power can be divided into the material, labour, right-of-way (ROW) and miscellaneous expenses in this proportion [33]: (i) Labour: 31%; (ii) Right of way: 1%; (iii) Materials: 51% and ; (iv) Miscellaneous: 17%
Adjustments for Nigeria:
- Labour: 31% higher due to expatriate engagement and contracting to international firms.
- Right of way: 50% higher due to the complexity of the land acquisition process and the need to compensate various stakeholders.
- Materials: 25% higher due to Nigeria importing most of its materials.
- Miscellaneous: 10% higher due to additional costs associated with doing business in Nigeria.
Calculations:
Labour cost = 0.31 * 1.31 * $12,453 = $5,057.16 per hp
Right of way cost = 0.01 * 1.5 * $12,453 = $186.80 per hp
Materials cost = 0.51 * 1.25 * $12,453 = $7,938.79 per hp
Miscellaneous cost = 0.17 * 1.1 * $12,453 = $2,328.71 per hp
Total cost per hp of compressor power in Nigeria:
$5,057.16 + $186.80 + $7,938.79 + $$2,328.71 = $15,511.46
Adding the 10% contingency cost to the total cost per hp of compressor power in Nigeria gives:
Total cost per hp of compressor power in Nigeria with contingency cost:
$15,511.46×1.1 = $17,062.60
Therefore, it would cost approximately $17,062.60 per hp of compressor power to expand a gas pipeline with a compressor station in Nigeria with a 10% contingency cost.
Please note that this is only a general estimate, and the actual cost may vary depending on the specific prevailing conditions of the intended expansion of the Escravos project. While these cost estimates are adequate for the analysis intended in this section of the paper (i.e., to compare the cost of gas network expansion by looping versus by compression to repurpose them for hydrogen transportation, especially for the Escravos – Lagos pipeline network), it is important to conduct a detailed analysis of the project requirements and costs to generate a more accurate estimate.
4.3.2. Cost Comparison of Natural Gas Pipeline Expansion Options for Hydrogen Transportation
From Figure 11, the adequate length of reinforcement pipes needed for the desired capacity expansions for hydrogen flow in existing natural gas pipelines is provided. Similarly, Figure 14 shows the compressor ratings (in horsepower) that would serve the same purpose if the gas network expansion were to be with the use of compressor stations. Using the estimates of the costs of expansion by looping and compressions in the previous section (i.e., $8,132,410 per kilometre of reinforcement pipe and $17,062.60 per HP of the compressor station, respectively), the costs of the two expansion options for different hydrogen proportions in the blend are estimated and shown in Figure 15. For all proportions of hydrogen in the blend, the cost of expanding the Escravos – Lagos gas pipeline to suit its usage for hydrogen transportation by looping far exceeds the cost of achieving the same objective with the use of compressor stations. The percentage differences in the cost range from as high as 494% for 20% H2 in the flow stream to 64% in the flow of only hydrogen.
The table below summarises the cost implications of the two expansion options discussed.

Table 4.
Comparison of the Costs of Gas Pipeline Expansion Options for Different Methane-Hydrogen Blends.
Table 4.
Comparison of the Costs of Gas Pipeline Expansion Options for Different Methane-Hydrogen Blends.
| CH4-H2 Blend (%H2) |
Required loop pipe length (km) |
Required compressor power (hp) |
Unit Cost of Looping ($/km) |
Unit cost of Compression ($/hp) |
|---|---|---|---|---|
| 20 | 90 | 7,223 | 732 | 123 |
| 40 | 150 | 16,637 | 1,220 | 284 |
| 60 | 180 | 26,373 | 1,464 | 450 |
| 80 | 210 | 46,012 | 1,708 | 785 |
| 100 | 150 | 43,578 | 1,220 | 744 |
5. Conclusions
Key technical and economic implications of repurposing existing natural gas infrastructure have been investigated in this study. Specifically, the two prominent natural gas expansion approaches – pipeline looping and compressor stations – were technically analysed and compared economically. The need to study and understand the pipeline expansion options is born from the fact that an increased volumetric flow rate of hydrogen gas is required for hydrogen to deliver the same energy value as natural gas considering that the energy value of the former is one-third of the energy value of natural gas. The following points can be deduced from the study:
- The introduction of hydrogen in a natural gas flow stream increases the pressure of the system due to the increased expansion that the lighter hydrogen gas causes when blended with natural gas. It is therefore important to consider making changes to fittings, connection, pressure gauges, etc. to accommodate these changes when adopting a natural gas network for hydrogen processing and transportation.
- The use of pipeline looping and compressor station options effectively kept flow parameters within recommended and safe values/ranges. For the Excravos – Lagos natural gas pipeline studied, expanding the network via these options resulted in lowering the erosional velocity profiles of the flow stream. Such that, besides the flow of pure hydrogen, the internal velocity value was maintained below the 20m/s estimated for the maximum erosional velocity limit, as per the API 14E RP, across the entire 340km length of the pipeline.
- Generally, the amount of compression or extent of looping that is needed is in direct proportionality with the fraction of hydrogen in the blend. The higher the percentage of hydrogen in the blend, the higher the ratings of the compressor station that would be needed (for pipeline expansion with compressor station option), and the higher the pipe length that would be needed for pipe looping.
- The economic analysis shows that the use of compressor stations is more economical for pipeline expansion relative to pipe looping for all proportions of hydrogen in the natural gas blend. For the Escravos – Pipeline network, Figure 15 shows that the difference can be as high as a 495% increase in the cost of pipeline network expansion by looping that is required to repurpose the gas network over the cost of using compressor stations, for the flow of 20% hydrogen in the flow stream.
This study provides a way forward for cheaper energy prices in the future by reducing the capital expenditures that would be otherwise incurred in building new infrastructure for hydrogen. Therefore, it contributes to the achievement of net zero emissions while helping to guarantee future energy security.
Author Contributions
A.J.A.: literature review, conceptualisation, model development and simulations; S.K.H.: Conceptualisation, manuscript development, data analysis, results presentation, discussion; M.B.: manuscript development and editing, results analysis, discussion; I.J.J.: conceptualisation, experiment, literature review, results analysis, manuscript development. H.K.Y.: manuscript development, editing. All authors have read and agreed to the published version of the manuscript.
Funding
This research received no external funding.
Acknowledgements
The authors acknowledge the support of Bryan Research and Engineering for providing the Promax software used in conducting this study.
Conflicts of Interest
The authors declare no conflicts of interest.
References
- G. Di Lullo, A. O. Oni, and A. Kumar, “Blending Blue Hydrogen with Natural Gas for Direct Consumption: Examining the Effect of Hydrogen Concentration on Transportation and Well-To-Combustion Greenhouse Gas Emissions,” Int J Hydrogen Energy, vol. 46, no. 36, pp. 19202–19216, 2021. [CrossRef]
- E. Abohamzeh, F. Salehi, M. Sheikholeslami, R. Abbassi, and F. Khan, “Review of Hydrogen Safety during Storage, Transmission, and Applications Processes,” J Loss Prev Process Ind, vol. 72, no. June, p. 104569, 2021. [CrossRef]
- J. Capelle, J. Gilgert, I. Dmytrakh, and G. Pluvinage, “Sensitivity of pipelines with Steel API X52 to Hydrogen Embrittlement,” Int J Hydrogen Energy, vol. 33, pp. 7630–7641, 2008.
- S. Elaoud, Z. Hafsi, and L. Hadj-Taieb, “Numerical Modelling of Hydrogen-Natural Gas Mixtures FLOWS IN Looped Networks,” J Pet Sci Eng, vol. 159, no. December 2016, pp. 532–541, 2017. [CrossRef]
- F. Tabkhi, C. Azzaro-Pantel, L. Pibouleau, and S. Domenech, “A Mathematical Framework for Modelling and Evaluating Natural Gas Pipeline Networks under Hydrogen Injection,” Int J Hydrogen Energy, vol. 33, no. 21, pp. 6222–6231, 2008. [CrossRef]
- F. Bainier, R. Kurz, and P. Bass, “Managing the Pressure to Increase the H2 Capacity Through a Natural Gas Transmission Network,” Proceedings of the ASME Turbo Expo, vol. 9, no. 4, pp. 1–9, 2020. [CrossRef]
- D. Woldeyohannes and M. A. A. Majid, “Simulation Model for Natural Gas Transmission Pipeline Network System,” Simul Model Pract Theory, vol. 19, no. 1, pp. 196–212, 2011. [CrossRef]
- E. S. Menon, Gas Pipeline Hydraulics. 2005. [CrossRef]
- G. G. Nasr and N. E. Connor, Natural Gas Engineering and Safety Challenges: Downstream Process, Analysis, Utilization and Safety, vol. 9783319089. 2014. [CrossRef]
- K. Sundar, S. Misra, A. Zlotnik, and R. Bent, “Robust Gas Pipeline Network Expansion Planning to Support Power System Reliability,” Proceedings of the American Control Conference, vol. 2021-May, pp. 620–627, 2021. [CrossRef]
- M. Chaudry, N. Jenkins, M. Qadrdan, and J. Wu, “Combined Gas and Electricity Network Expansion Planning,” Appl Energy, vol. 113, pp. 1171–1187, 2014. [CrossRef]
- GAZPROM, “Looping,” Gazprom Informatorium. Accessed: Apr. 25, 2022. [Online]. Available: http://www.gazprominfo.com/terms/looping/.
- B. Rioux, R. Shabaneh, and S. Griffiths, “An Economic Analysis of Gas Pipeline Trade Cooperation in the GCC,” Energy Policy, vol. 157, p. 112449, 2021. [CrossRef]
- S. Scherer, “Canada Says Hydrogen Better Than LNG for German Needs,” Reuters, London, UK, p. 1, Aug. 19, 2022.
- IEA, “The Future of Hydrogen: Seizing today’s Opportunities,” IEA Publications, no. June, pp. 14, 37–64, 2019.
- J. Kestler-D’Amours, “Environmentalists Welcome New Canada-Germany Hydrogen Pact | Oil and Gas News,” Al Jazeera, Economy | Oil and Gas, Aug. 26, 2022.
- J. Abbas, H. Hassani, M. Burby, and I. J. John, “An Investigation into the Volumetric Flow Rate Requirement of Hydrogen Transportation in Existing Natural Gas Pipelines and Its Safety Implications,” Gases, vol. 1, no. 4, pp. 156–179, 2021. [CrossRef]
- N. Klopčič, T. Stöhr, I. Grimmer, M. Sartory, and A. Trattner, “Refurbishment of Natural Gas Pipelines towards 100% Hydrogen—A Thermodynamic-Based Analysis,” Energies (Basel), vol. 15, no. 24, Dec. 2022. [CrossRef]
- S. Lipiäinen, K. Lipiäinen, A. Ahola, and E. Vakkilainen, “Use of Existing Gas Infrastructure in European Hydrogen Economy,” Int J Hydrogen Energy, vol. 48, no. 80, pp. 31317–31329, Sep. 2023. [CrossRef]
- G. G. Nasr and N. E. Connor, Natural Gas Engineering and Safety Challenges. 2014. [CrossRef]
- W. Alliander, “Gas Distribution Network Modelling and Optimization - New Methods for Smarter Observation and Operation of Large-Scale Gas Networks,” Delft University of Technology (TUDelft), 2016. [CrossRef]
- Firooz Tabkhi, “Optimization of Gas Transmission Networks,” NATIONAL POLYTECHNIQUE INSTITUTE OF TOULOUSE, 2007.
- Herrán-González, J. M. De La Cruz, B. De Andrés-Toro, and J. L. Risco-Martín, “Modeling And Simulation of a Gas Distribution Pipeline Network,” Appl Math Model, vol. 33, no. 3, pp. 1584–1600, 2009. [CrossRef]
- Ekhtiari, I. Dassios, M. Liu, and E. Syron, “A Novel Approach to Model a Gas Network,” Applied Sciences (Switzerland), vol. 9, no. 6, 2019. [CrossRef]
- J. Zeng, C. Sun, Z. Zhu, J. Wu, and H. Chen, “Uncertainty Analysis for Natural Gas Transport Pipeline Network Layout: A New Methodology Based on Monte Carlo Method,” J Adv Transp, vol. 2018, 2018. [CrossRef]
- E. Fokken, S. Göttlich, and M. Herty, “Efficient Simulation of Coupled Gas and Power Networks under Uncertain Demands,” August 2021.
- J. André et al., “Design and Dimensioning of Hydrogen Transmission Pipeline Networks,” Eur J Oper Res, vol. 229, no. 1, pp. 239–251, 2013. [CrossRef]
- “ProMax - Wikipedia.” Accessed: Mar. 06, 2023. [Online]. Available: https://en.wikipedia.org/wiki/ProMax.
- M. Bonyadi, M. R. Rahimpour, and F. Esmaeilzadeh, “A New Fast Technique for Calculation of Gas Condensate Well Productivity by Using Pseudopressure Method,” J Nat Gas Sci Eng, vol. 4, pp. 35–43, 2012. [CrossRef]
- F. Esmaeilzadeh and M. Roshanfekr, “A New Cubic Equation of State for Reservoir Fluids,” Fluid Phase Equilib, vol. 239, no. 1, pp. 83–90, 2006. [CrossRef]
- H. D. Beggs and J. P. Brill, “A Study of Two-Phase Flow in Inclined Pipes,” Journal of Petroleum Technology, vol. 25, no. 05, pp. 607–617, 1973.
- EIA, “U.S. Natural Gas Pipeline Projects,” 2022.
- G. Molnar and G. Molnar, “Economics of Gas Transportation by Pipeline and LNG,” The Palgrave Handbook of International Energy Economics, pp. 23–57, 2022. [CrossRef]
- COMTRADE, “Nigeria Imports of Iron and Steel - 2023 Data 2024 Forecast 1996-2021 Historical.” Accessed: Apr. 02, 2023. [Online]. Available: https://tradingeconomics.com/nigeria/imports/iron-steel.
- Essen, “Nigeria Imports $3.3 Billion Steel Product,” The Guardian Nigeria News - Nigeria and World News, Nov. 30, 2018.
Figure 1.
Pipeline Expansion through Inlet Pressure Increase [8].
Figure 1.
Pipeline Expansion through Inlet Pressure Increase [8].
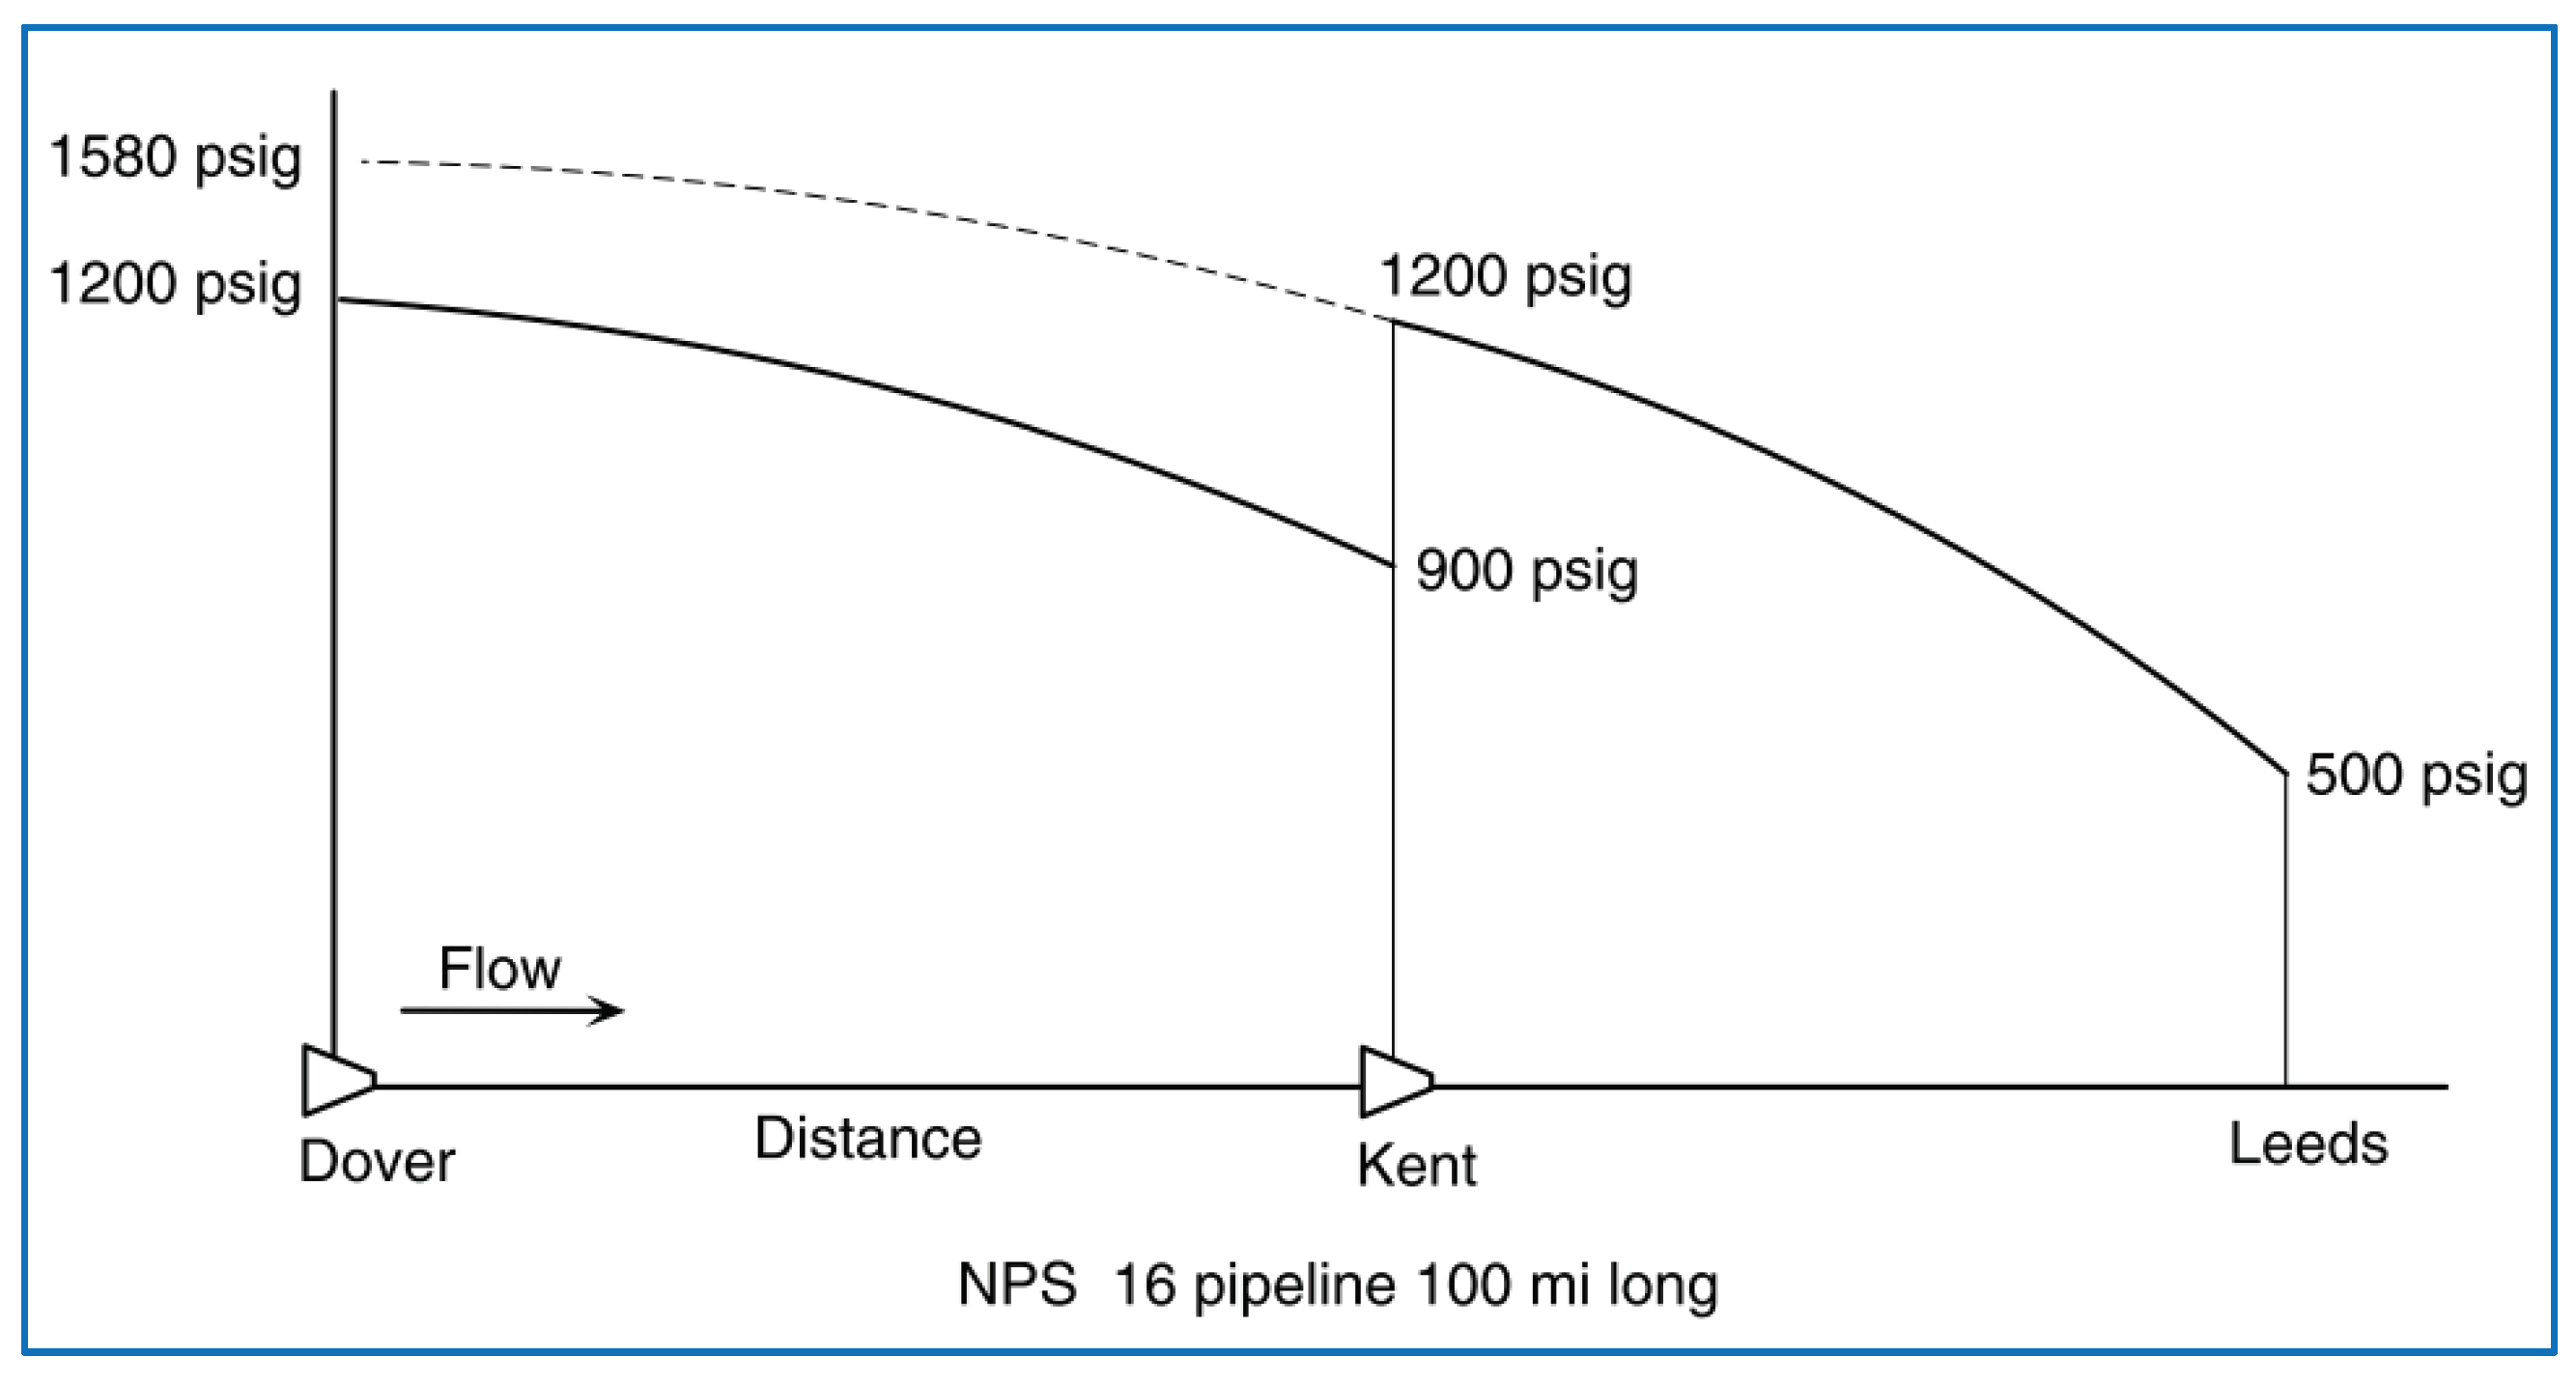
Figure 2.
An Illustration of Compressor Spacings in Pipeline Capacity Increment (Maximum Operating Pressure - MOP) [8].
Figure 2.
An Illustration of Compressor Spacings in Pipeline Capacity Increment (Maximum Operating Pressure - MOP) [8].
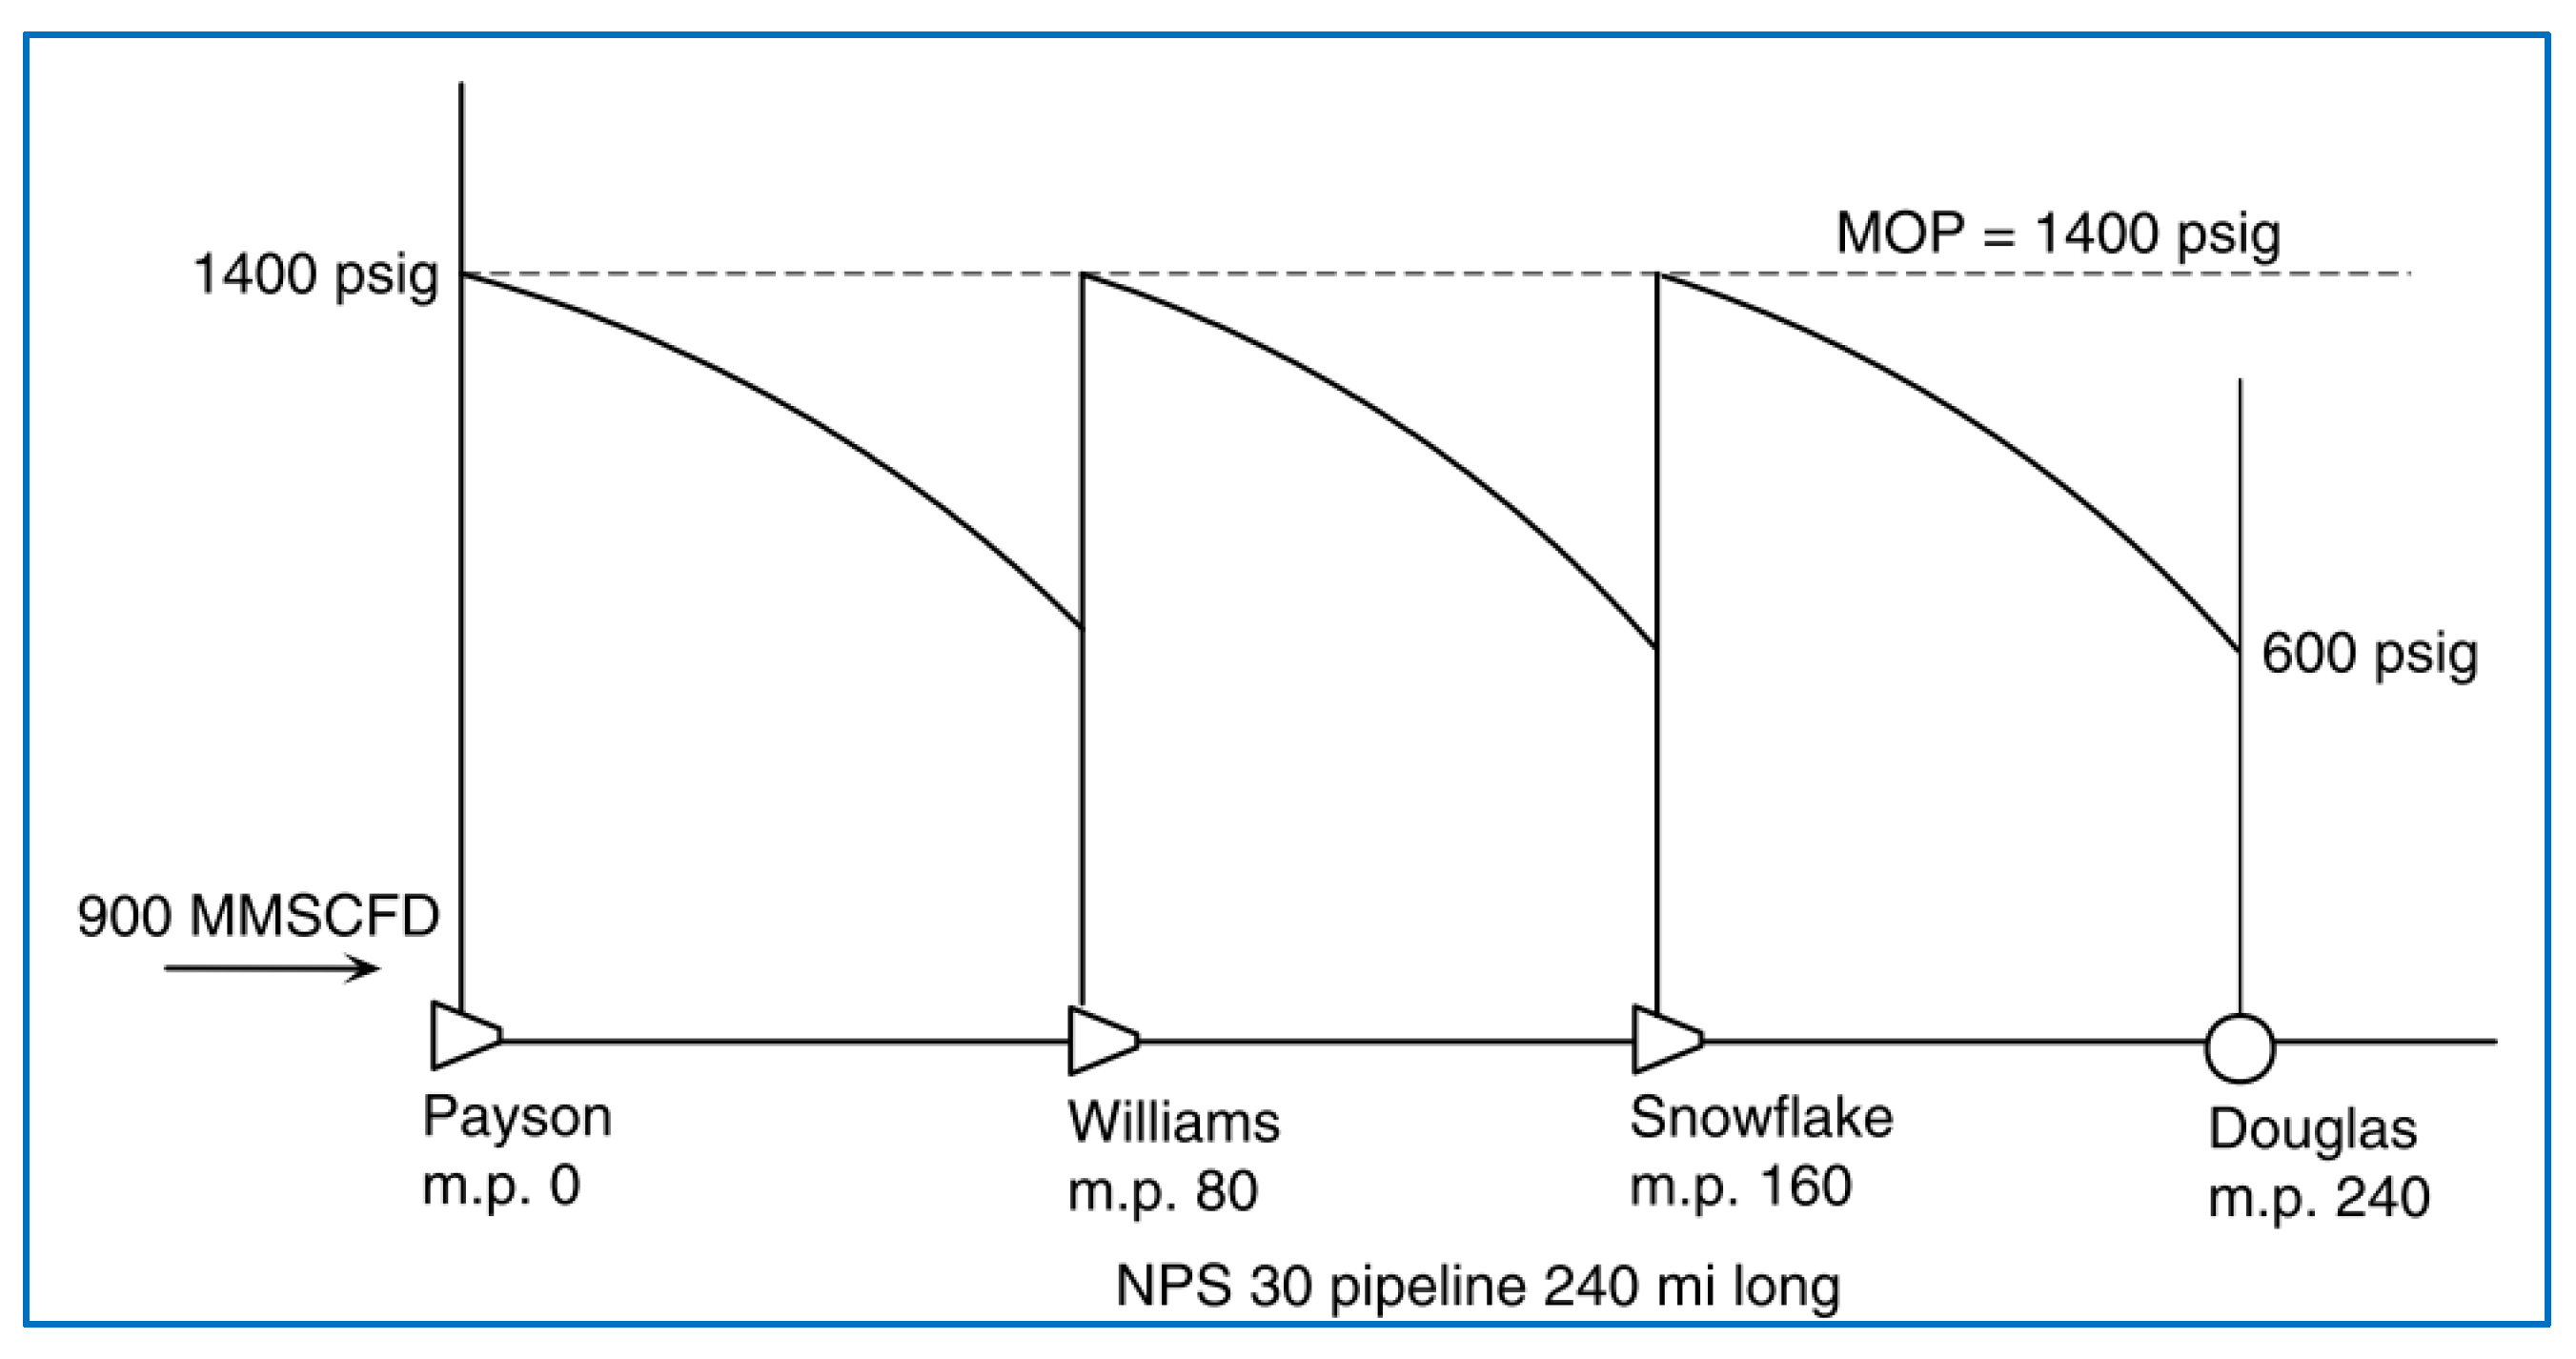
Figure 3.
Pipeline looping schematic for flow increase.
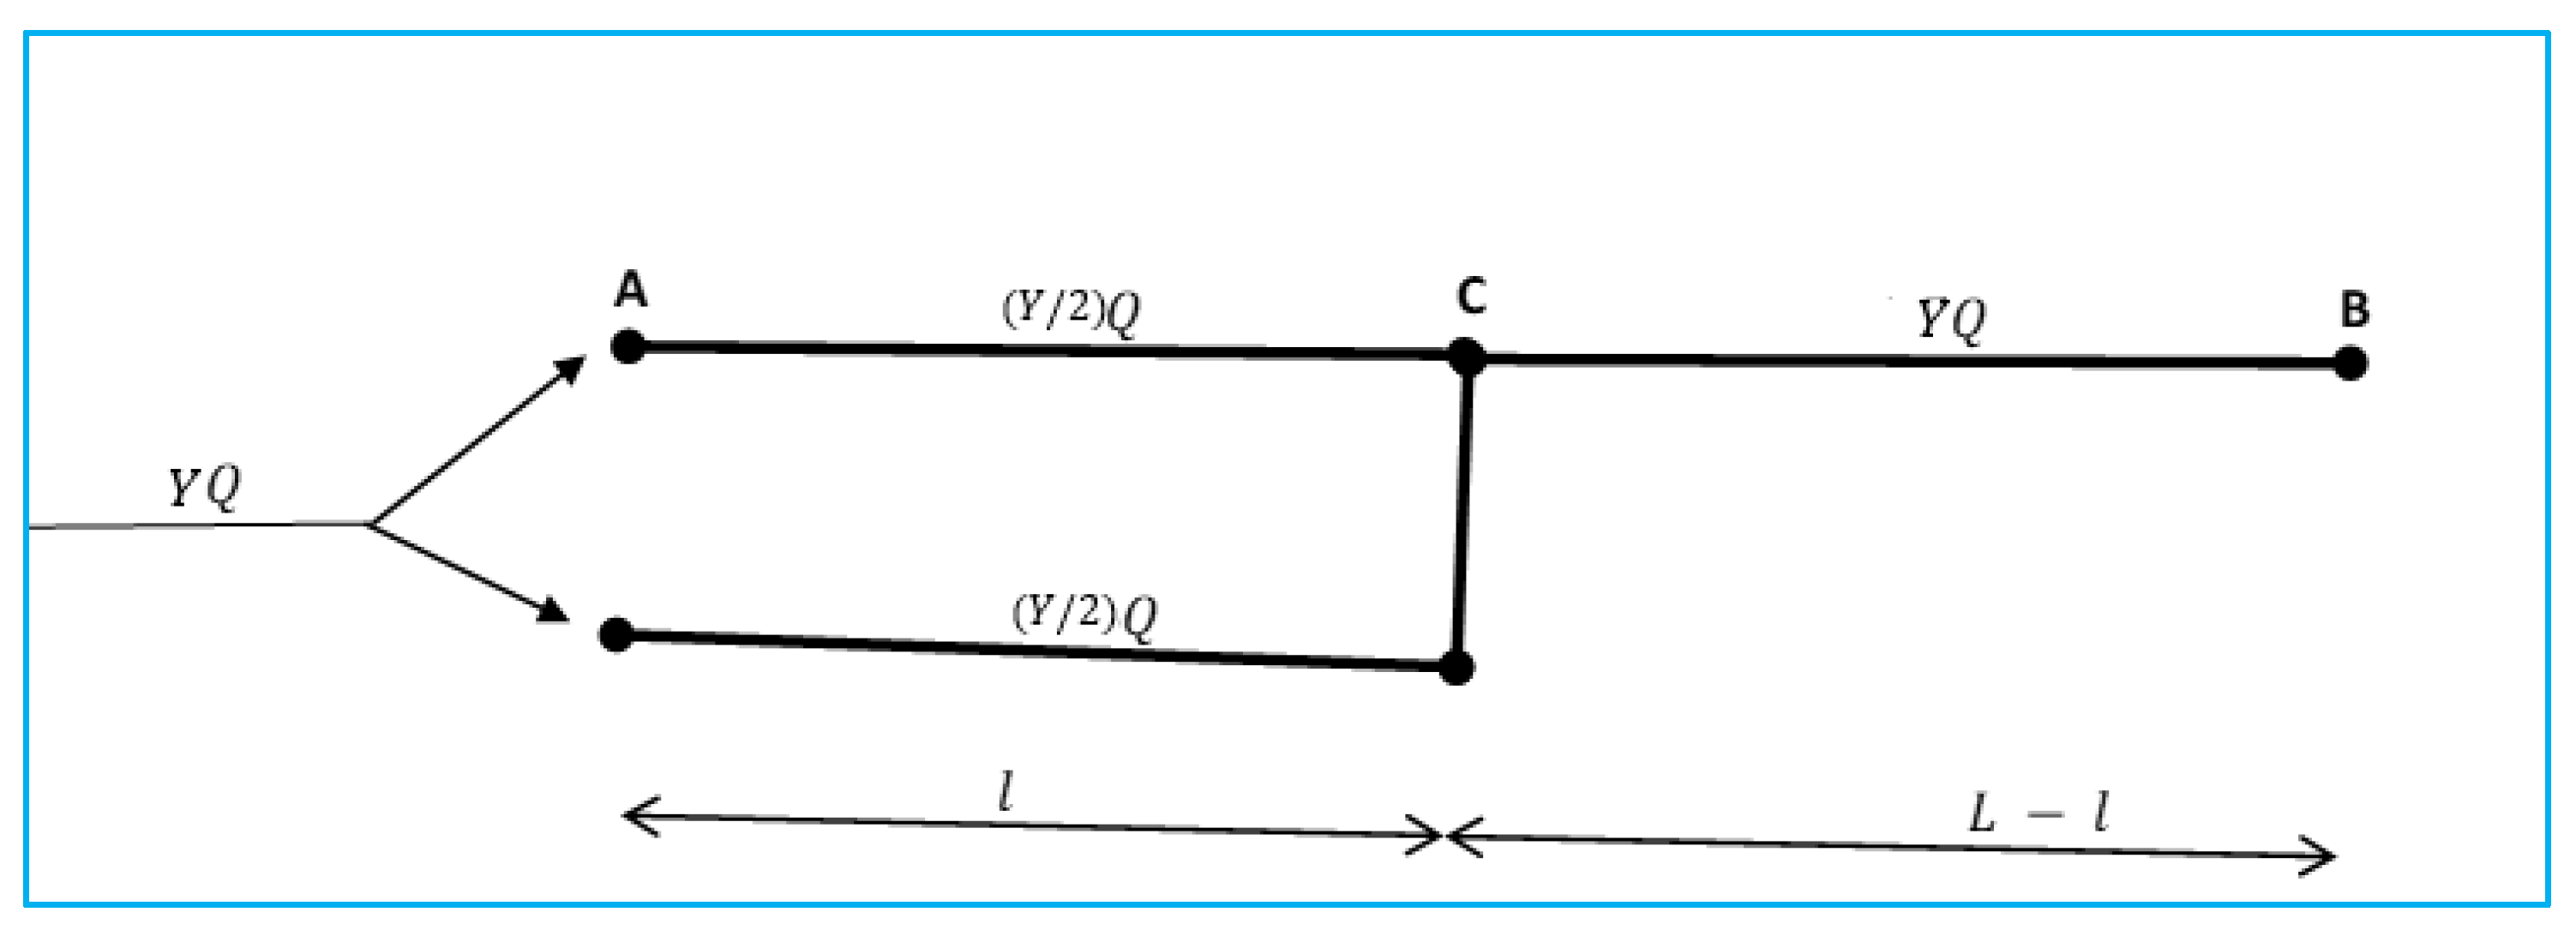
Figure 5.
Existing pipeline single-pipe model diagram.
Figure 8.
Process Diagram for Gas Network Expansion through Compression.
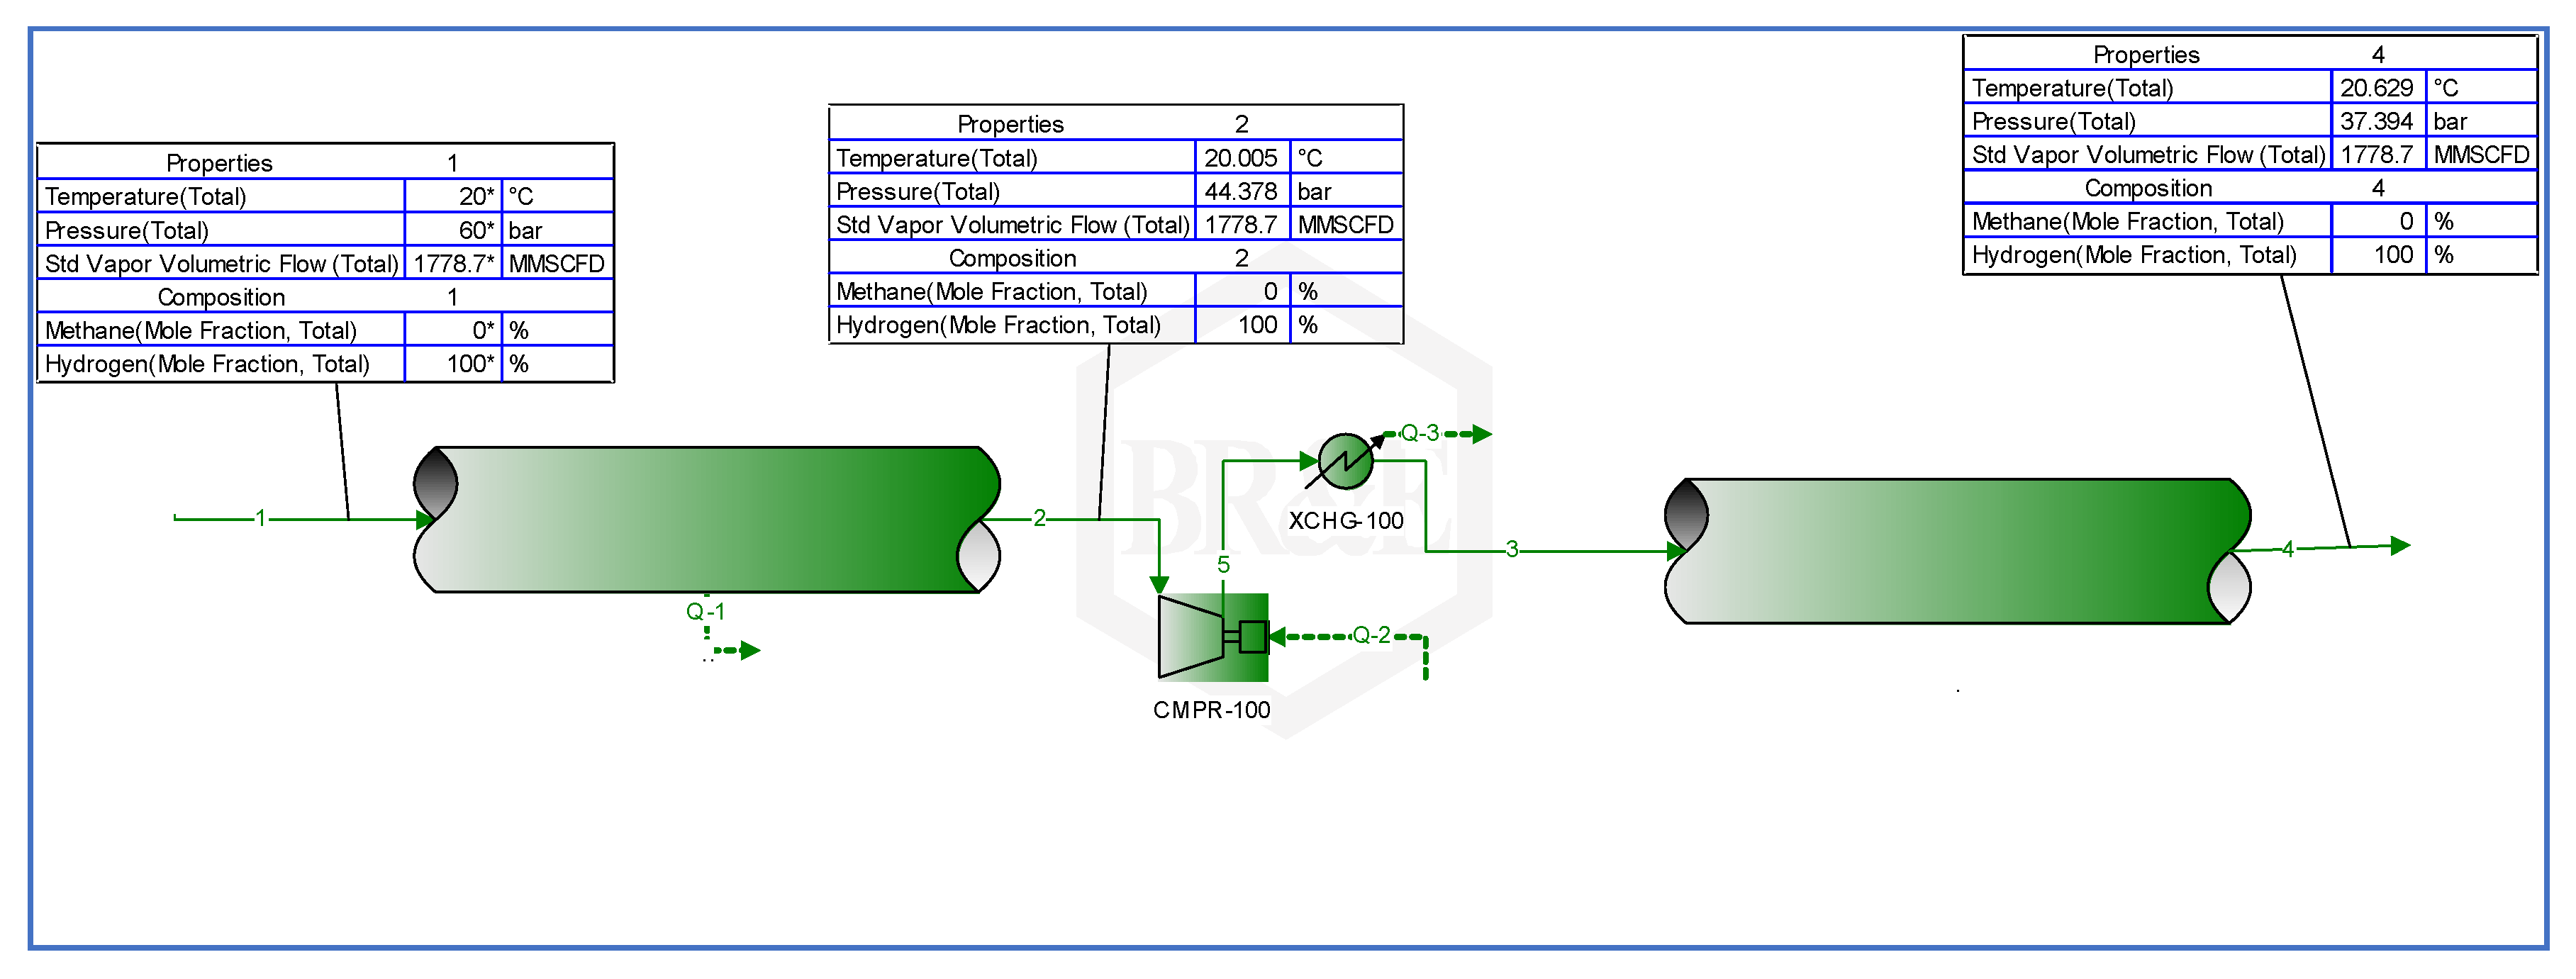
Figure 9.
Pressure profile of the reinforced pipeline.
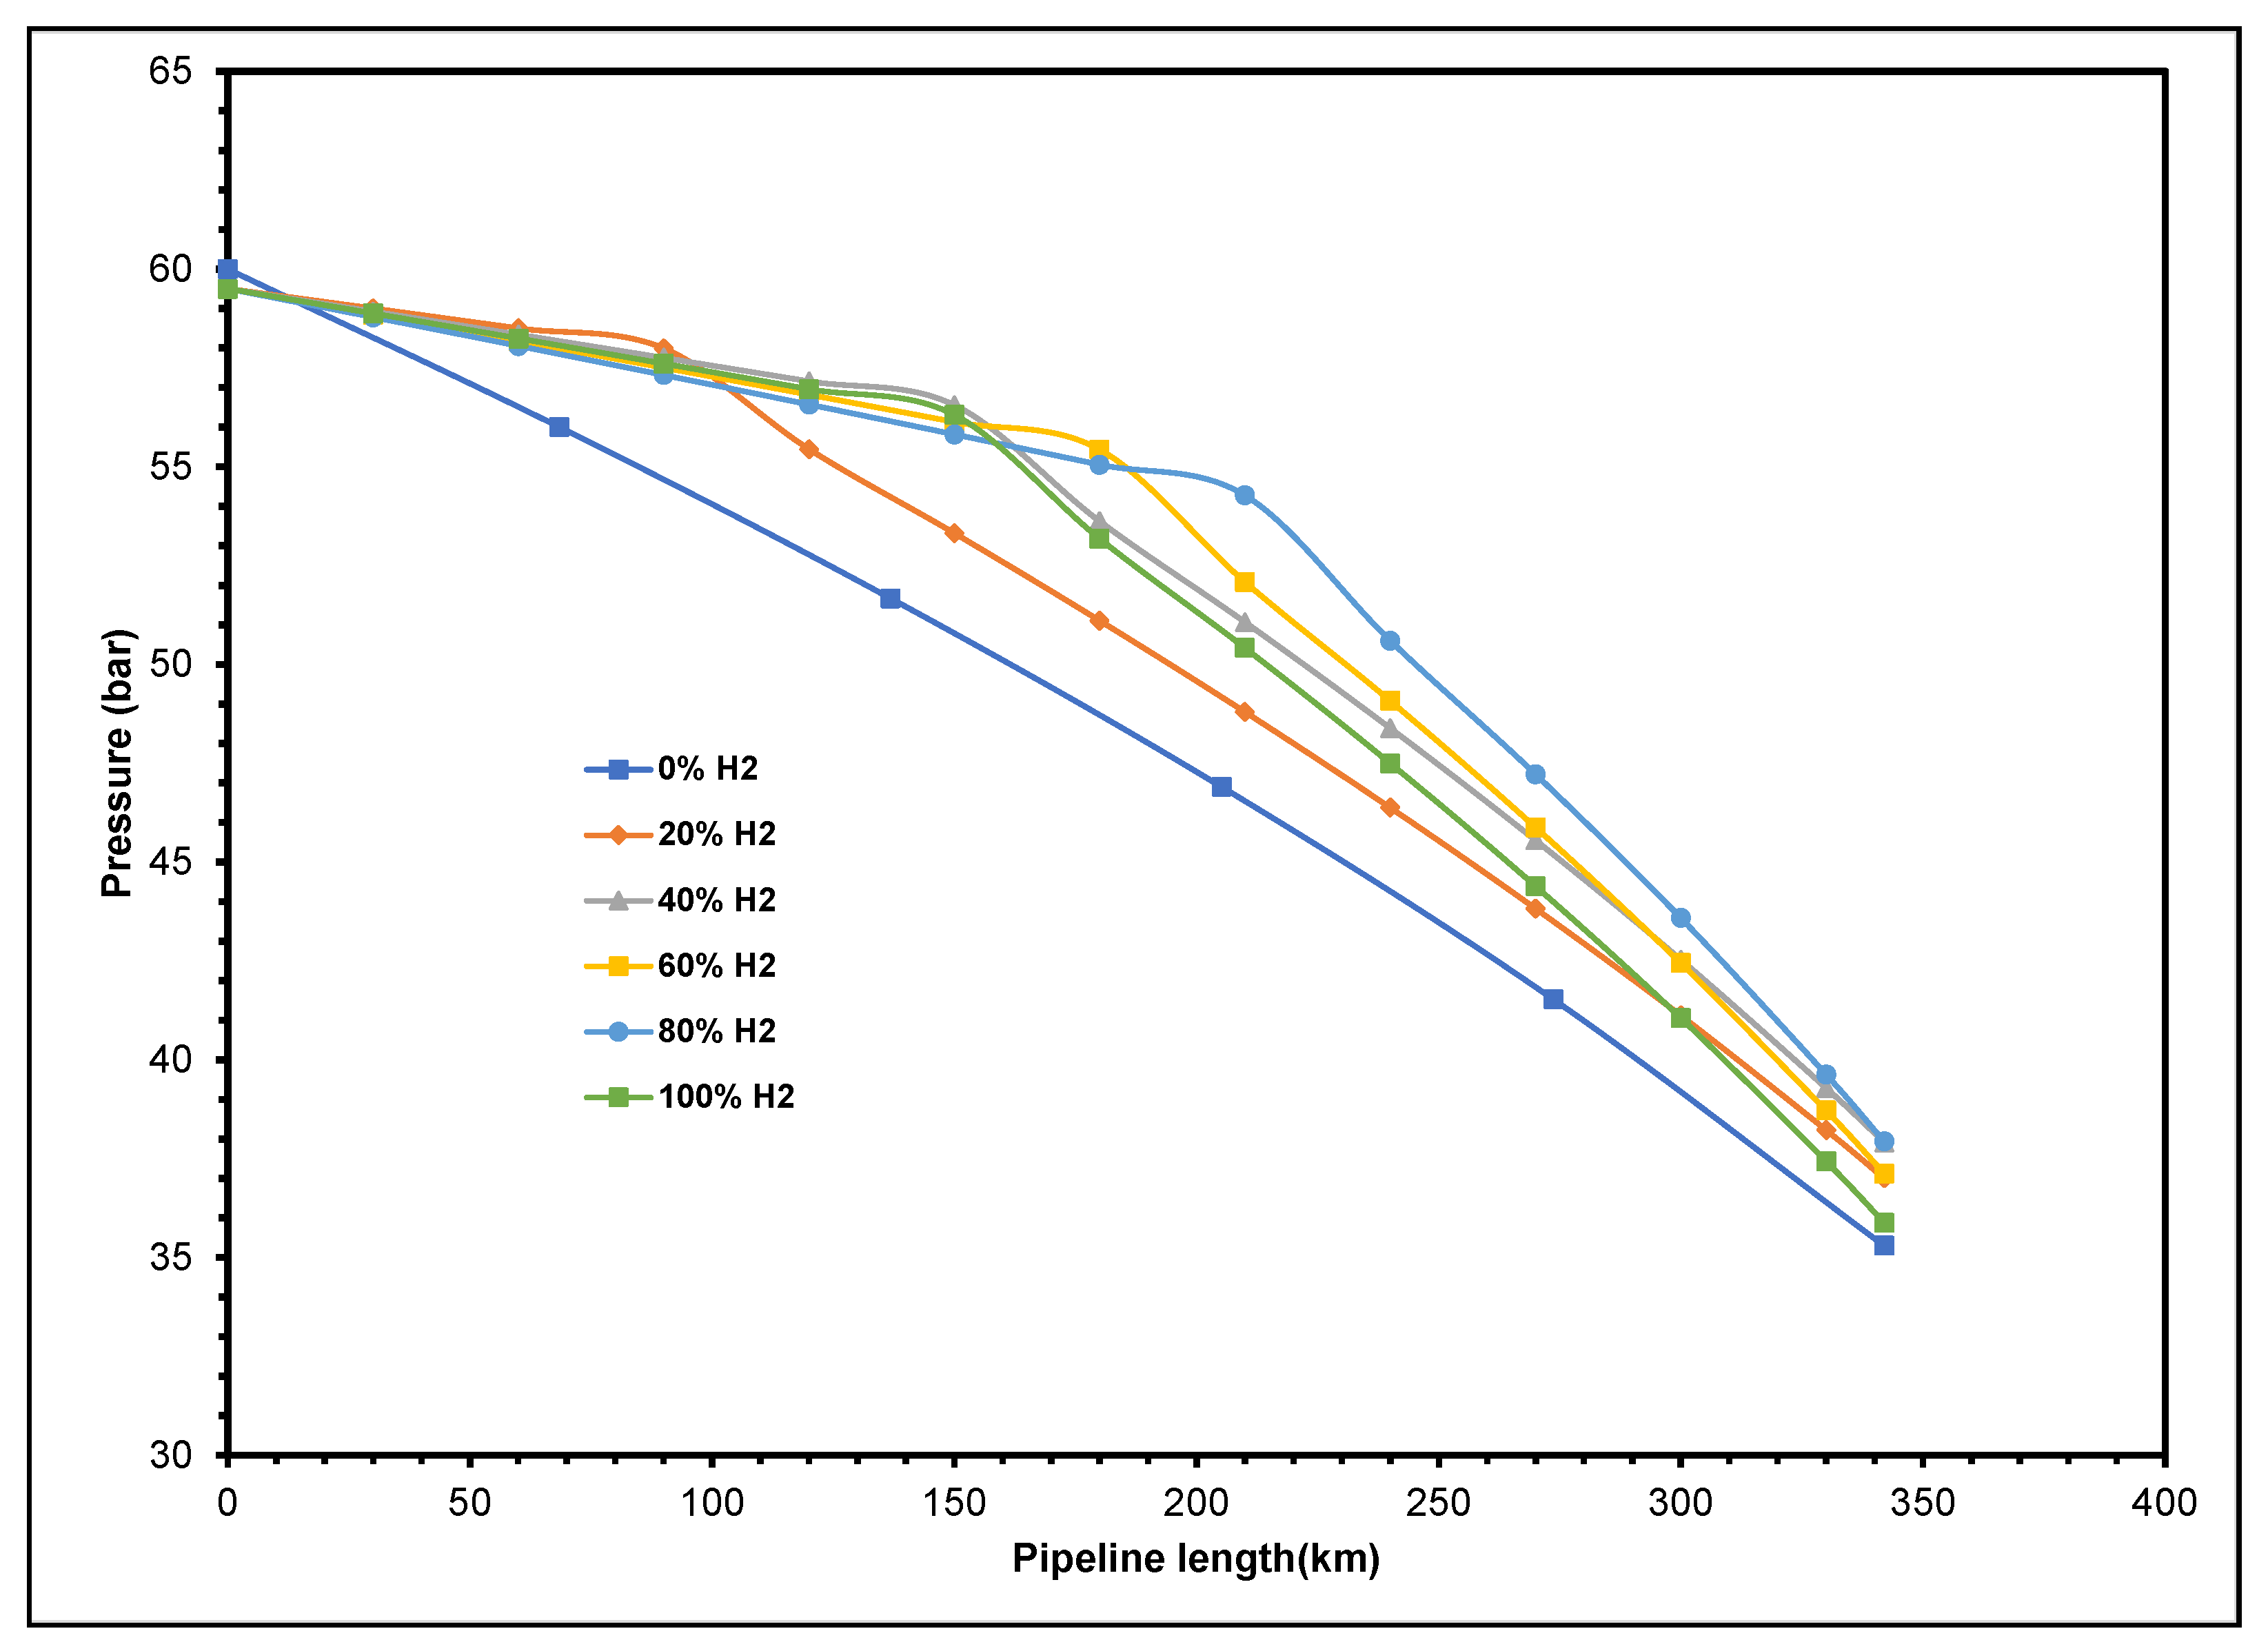
Figure 10.
Velocity Behaviour in the Reinforced and Non-reinforced Section.
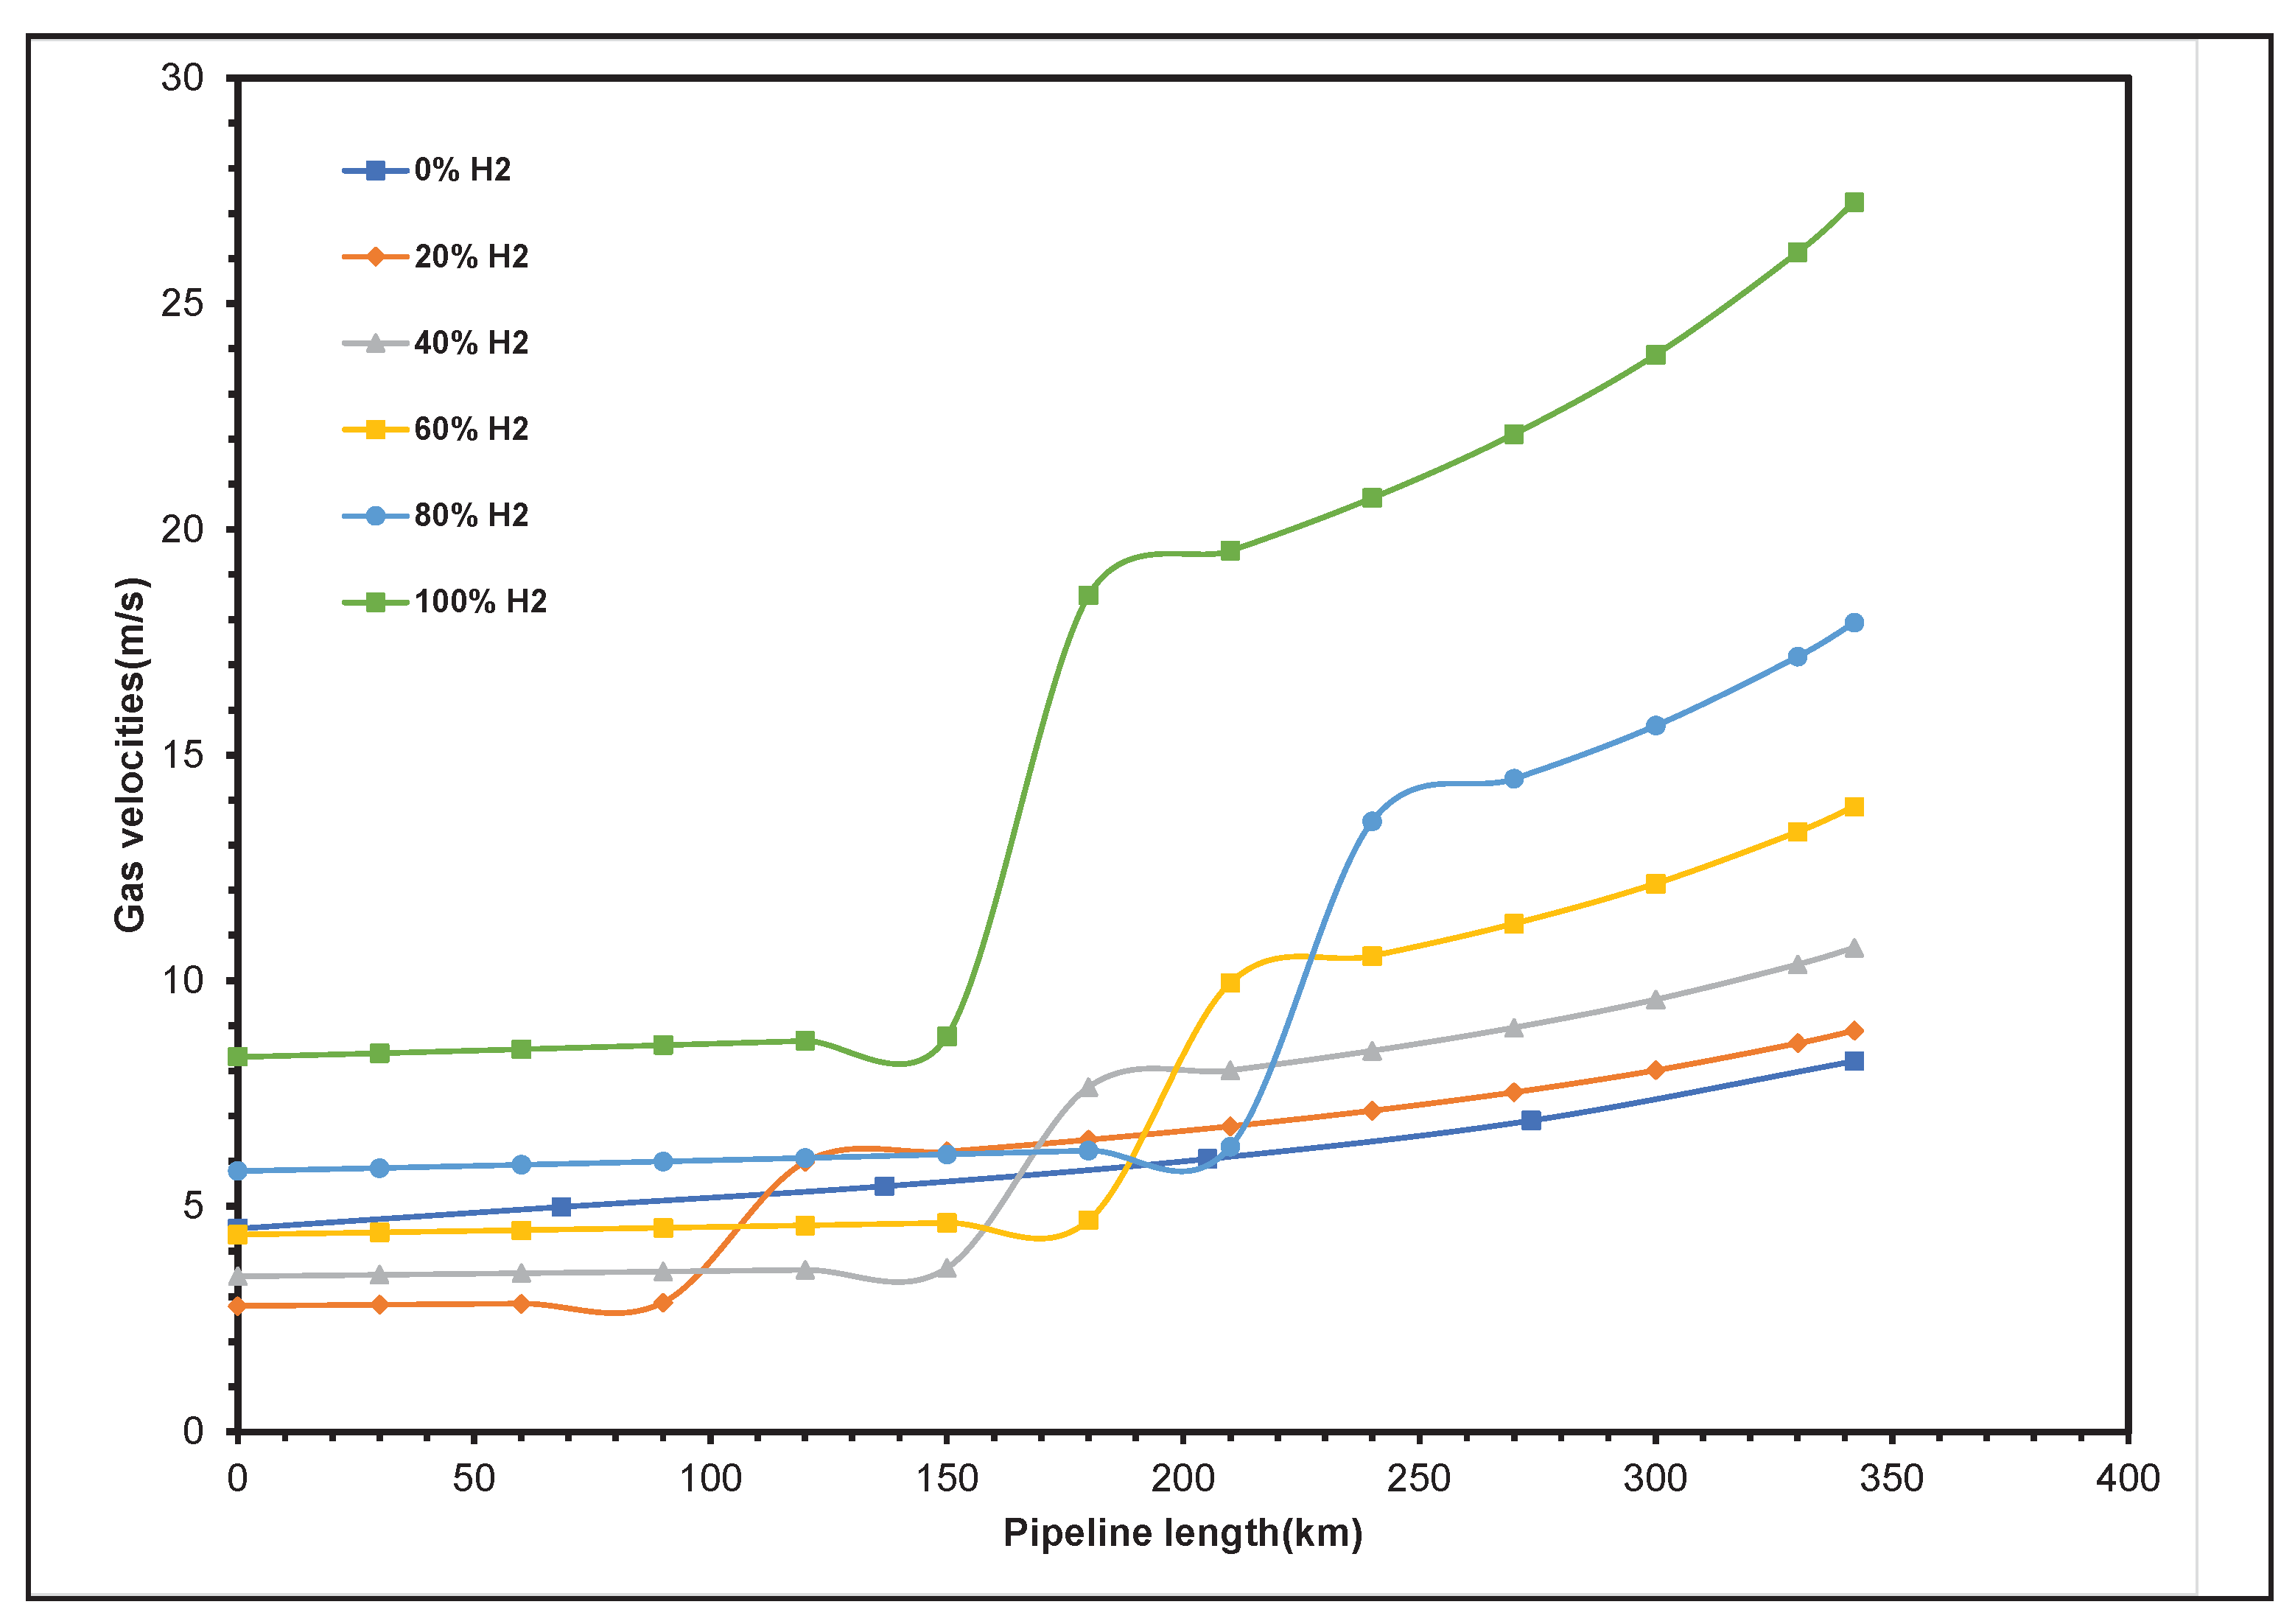
Figure 11.
Required Reinforcement Length for Equivalent and Desired Pressure Drop.
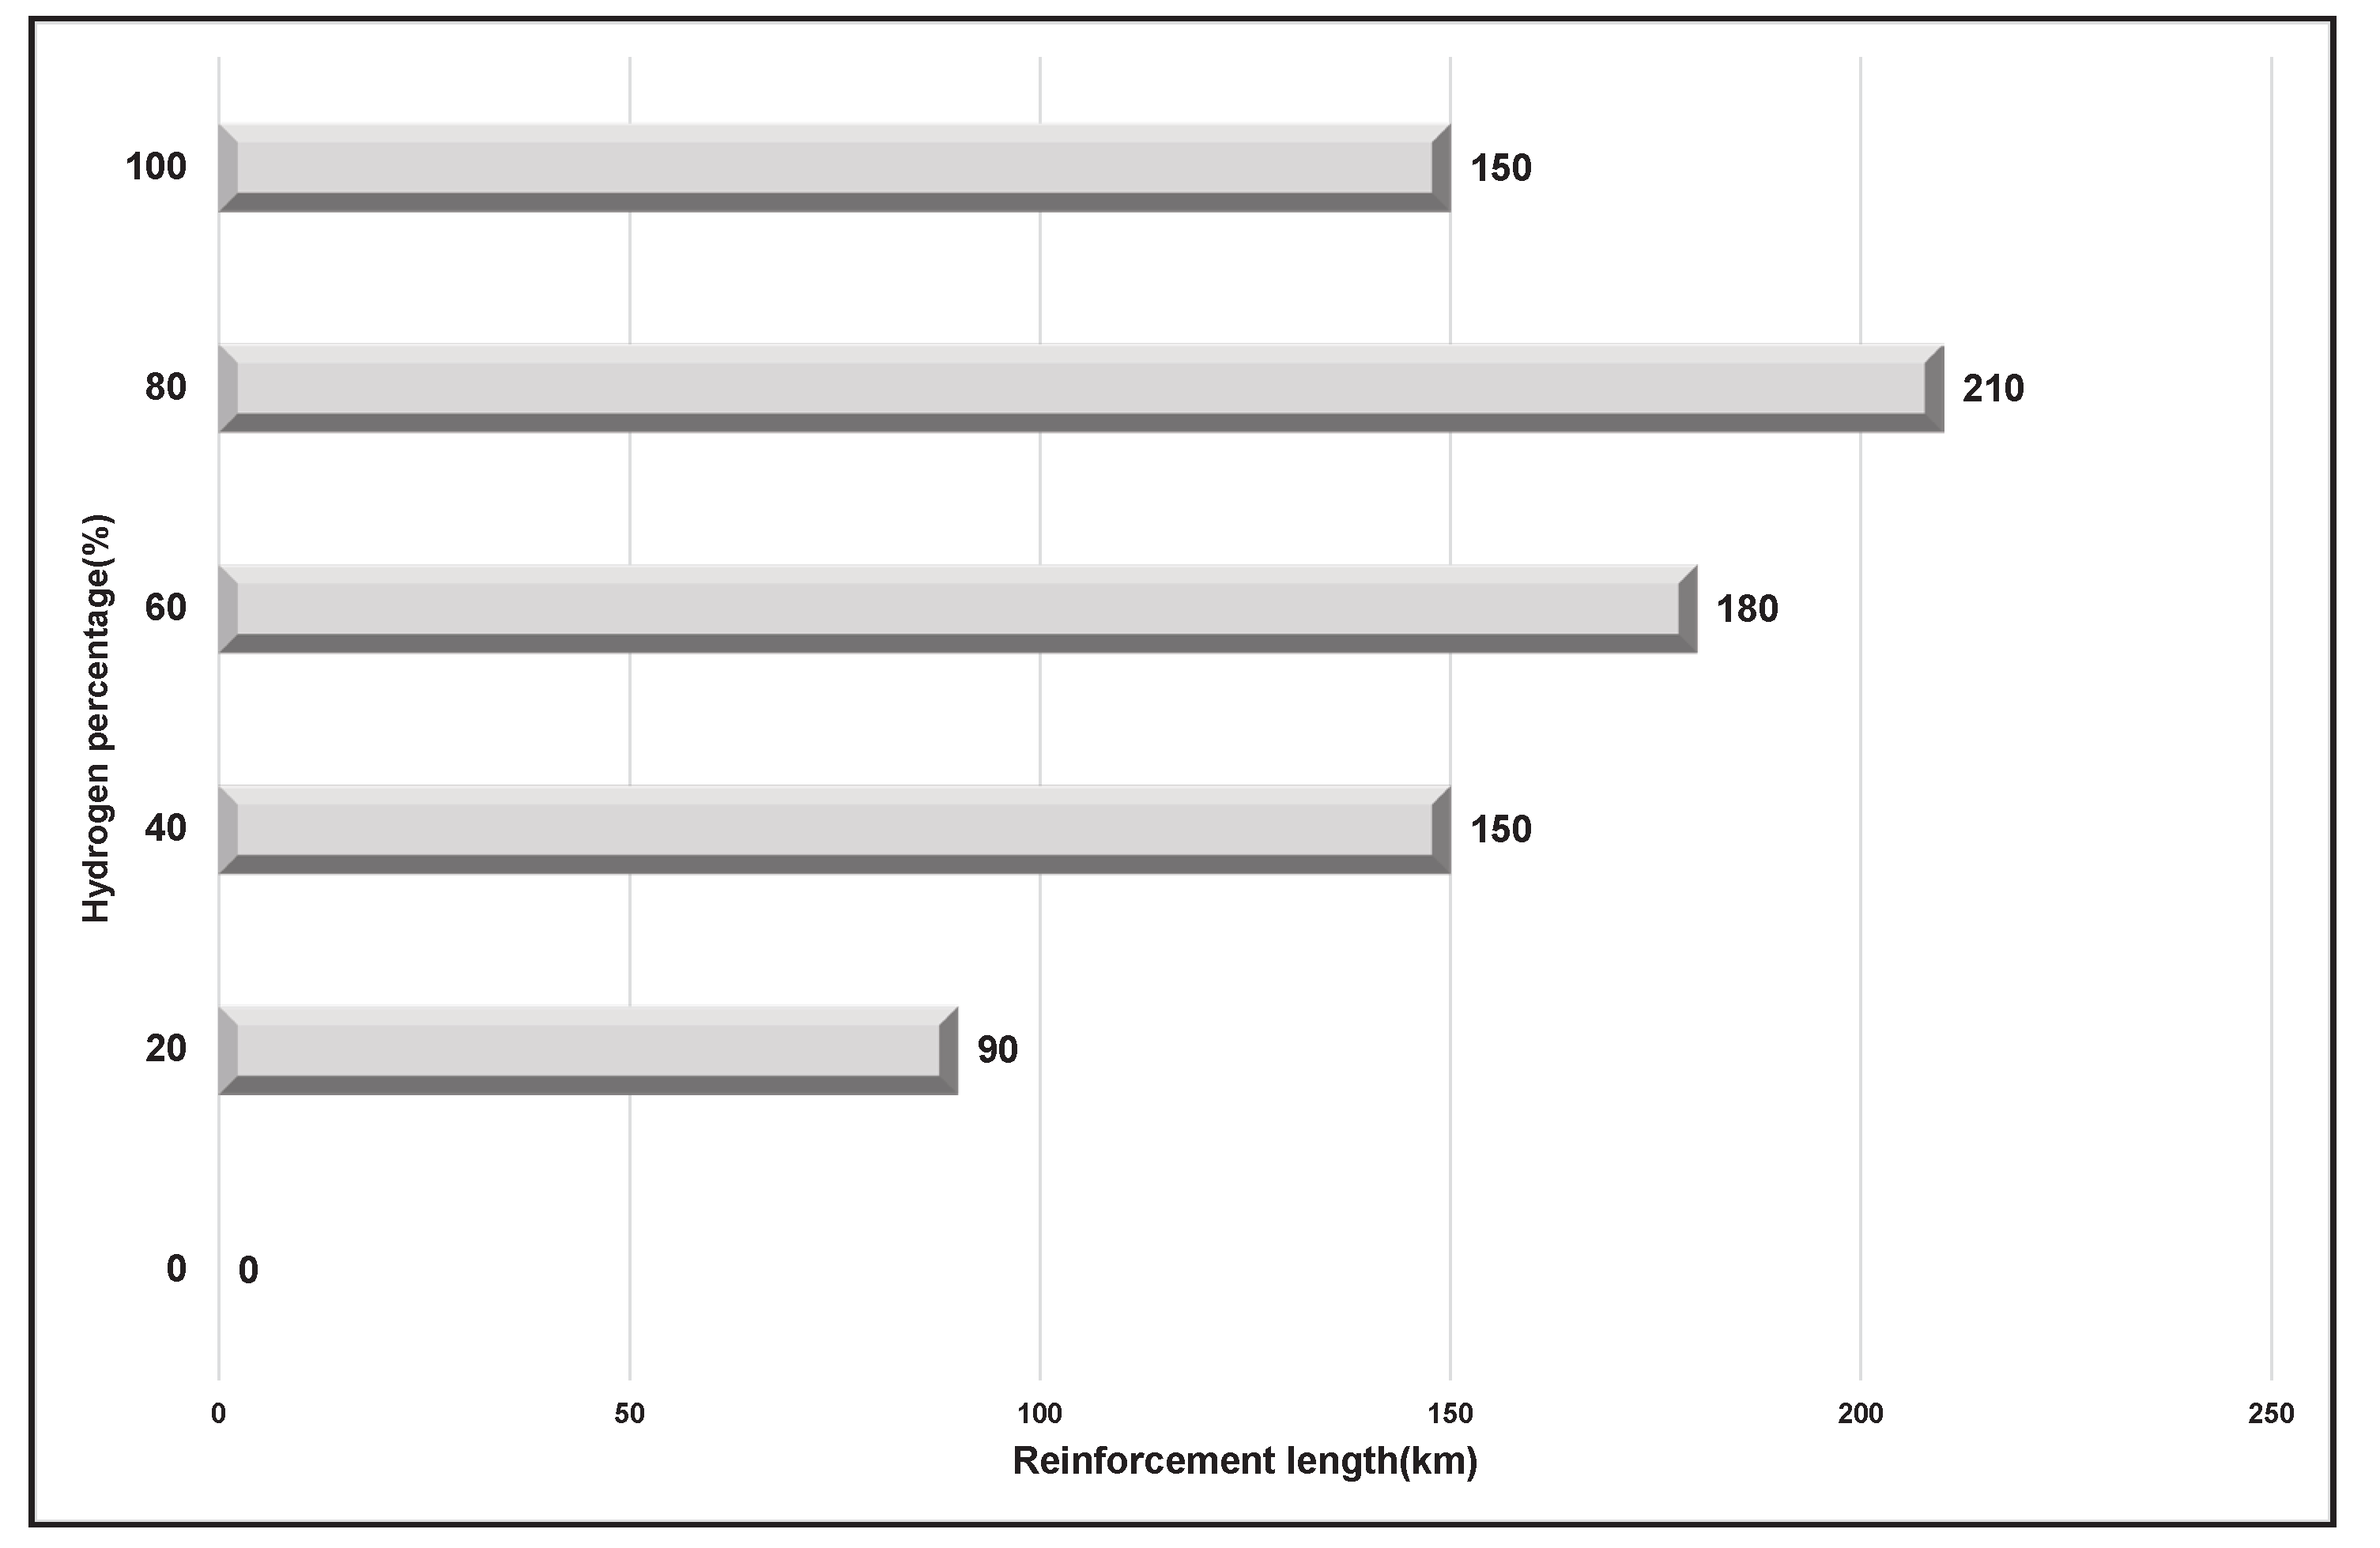
Figure 13.
Gas Velocities for Compression Option.
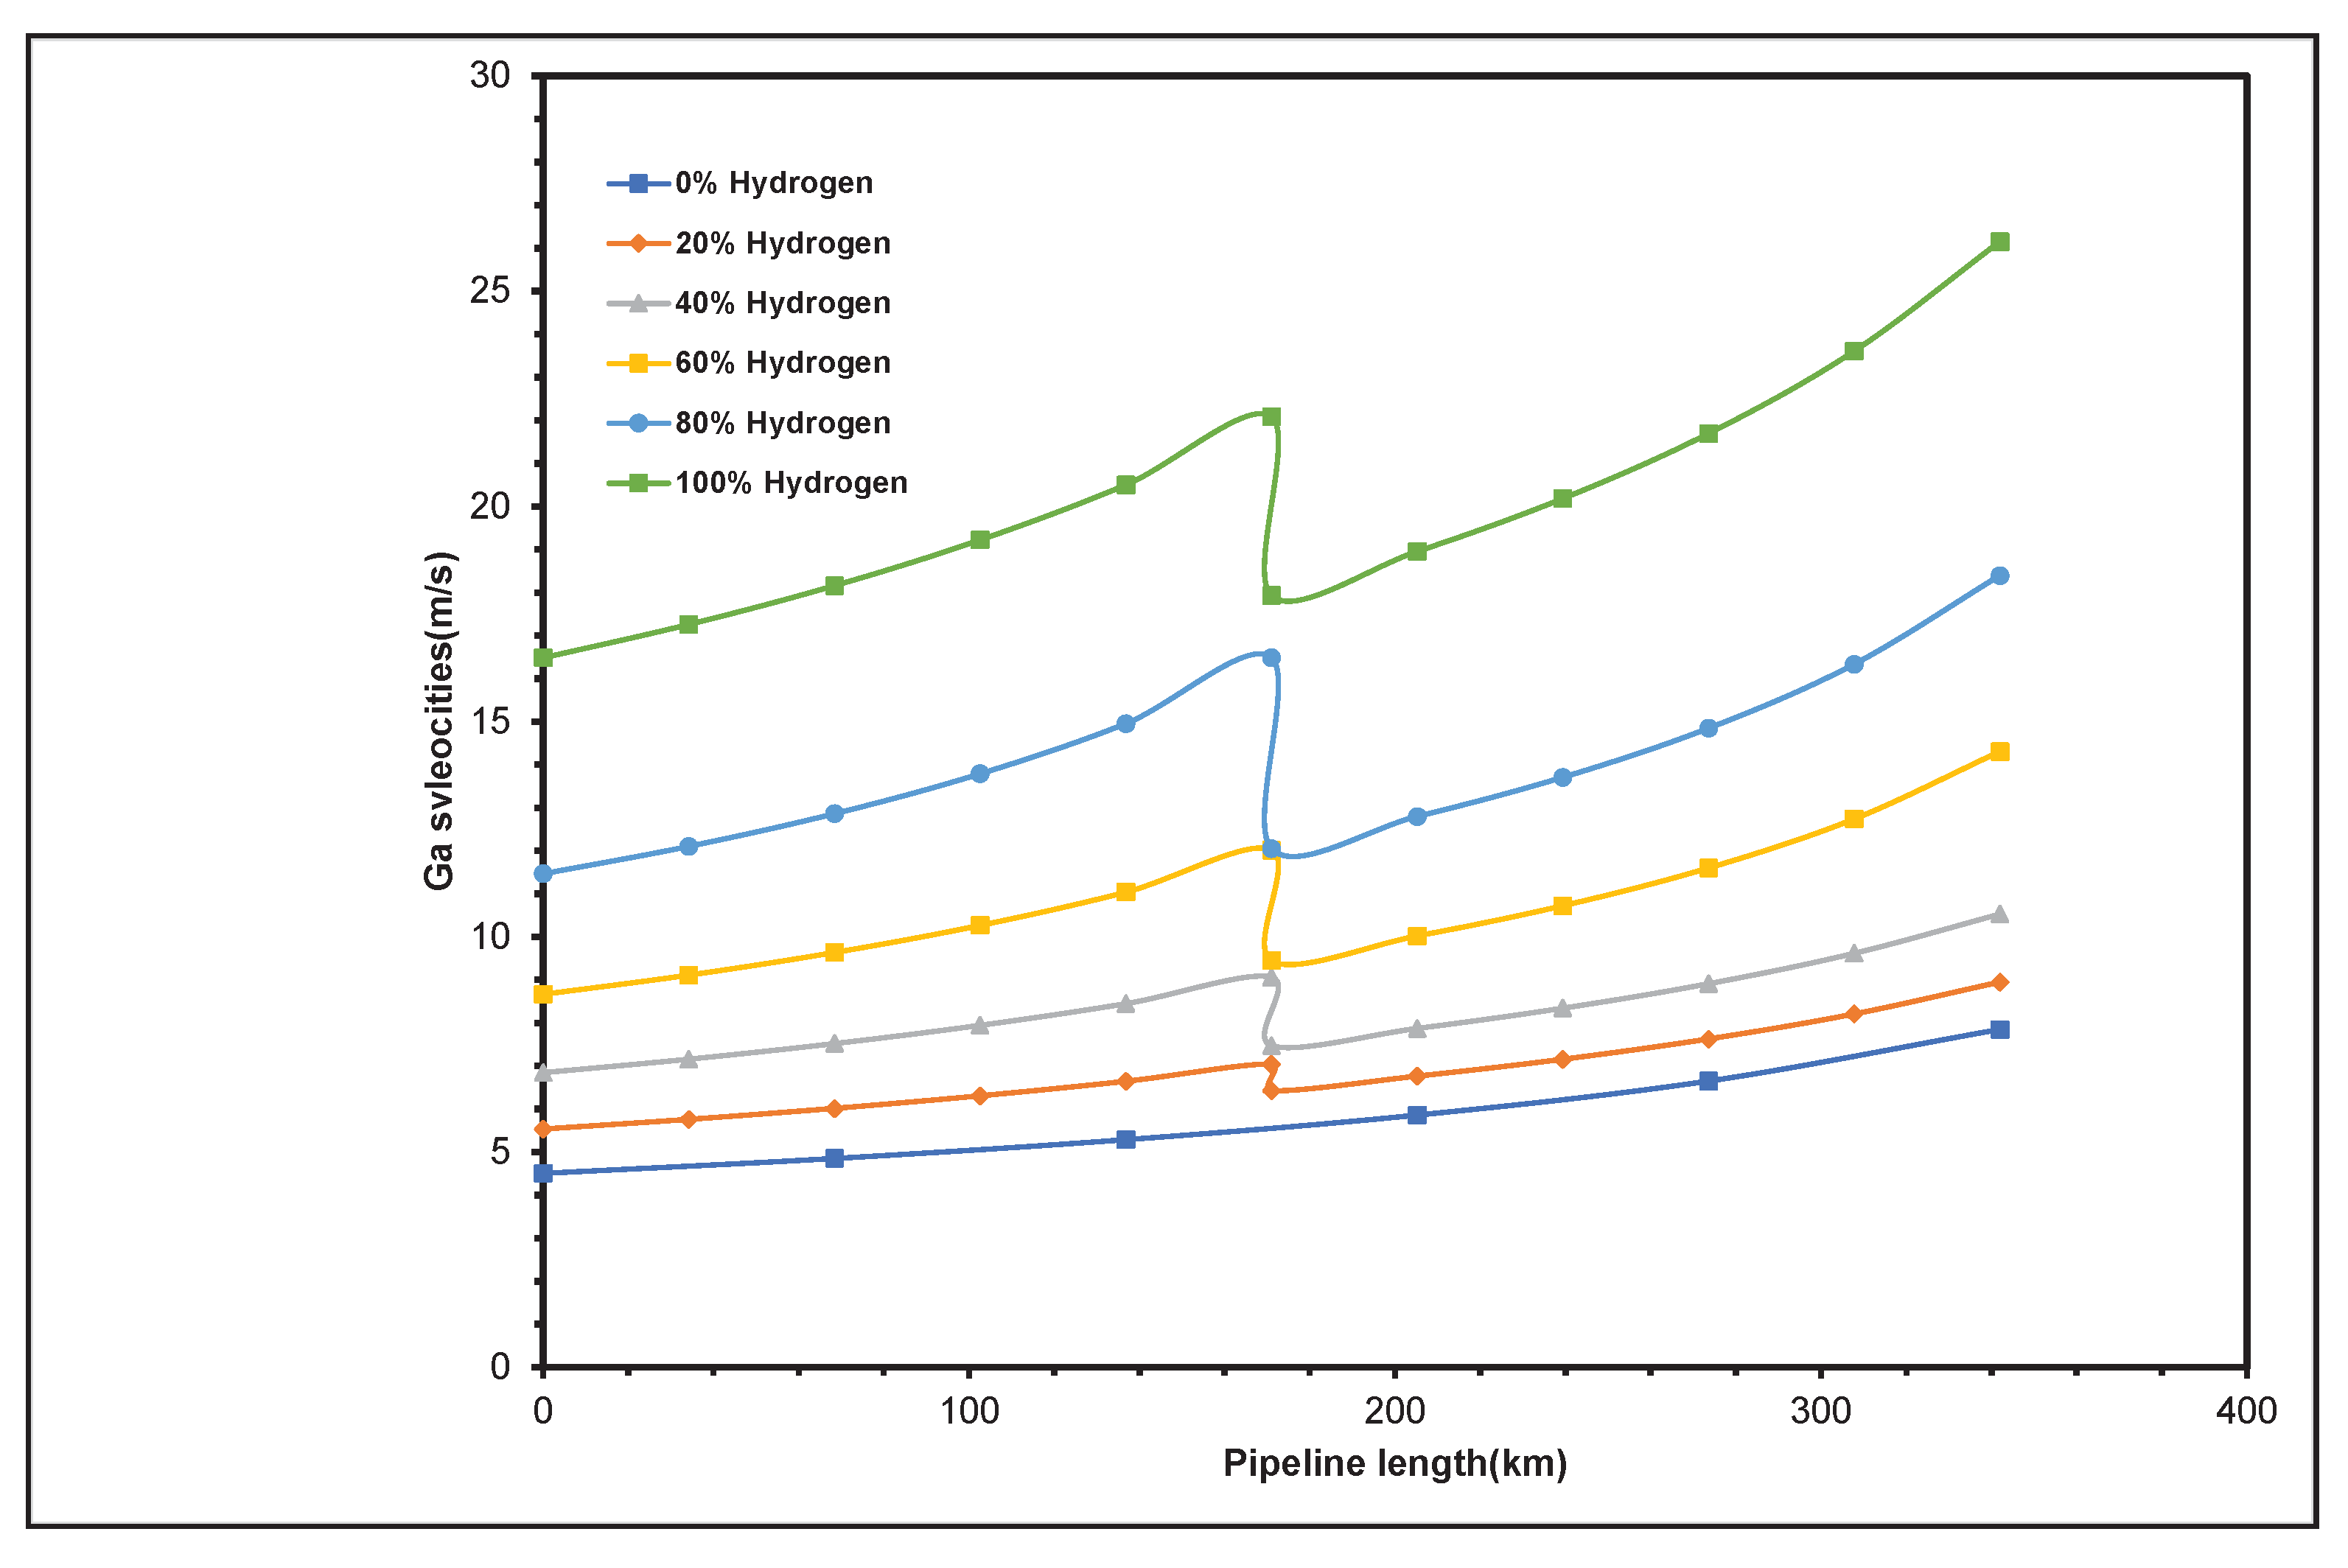
Figure 14.
Number of Compressor Stations Required for Equivalent and Desired Pressure Drop.
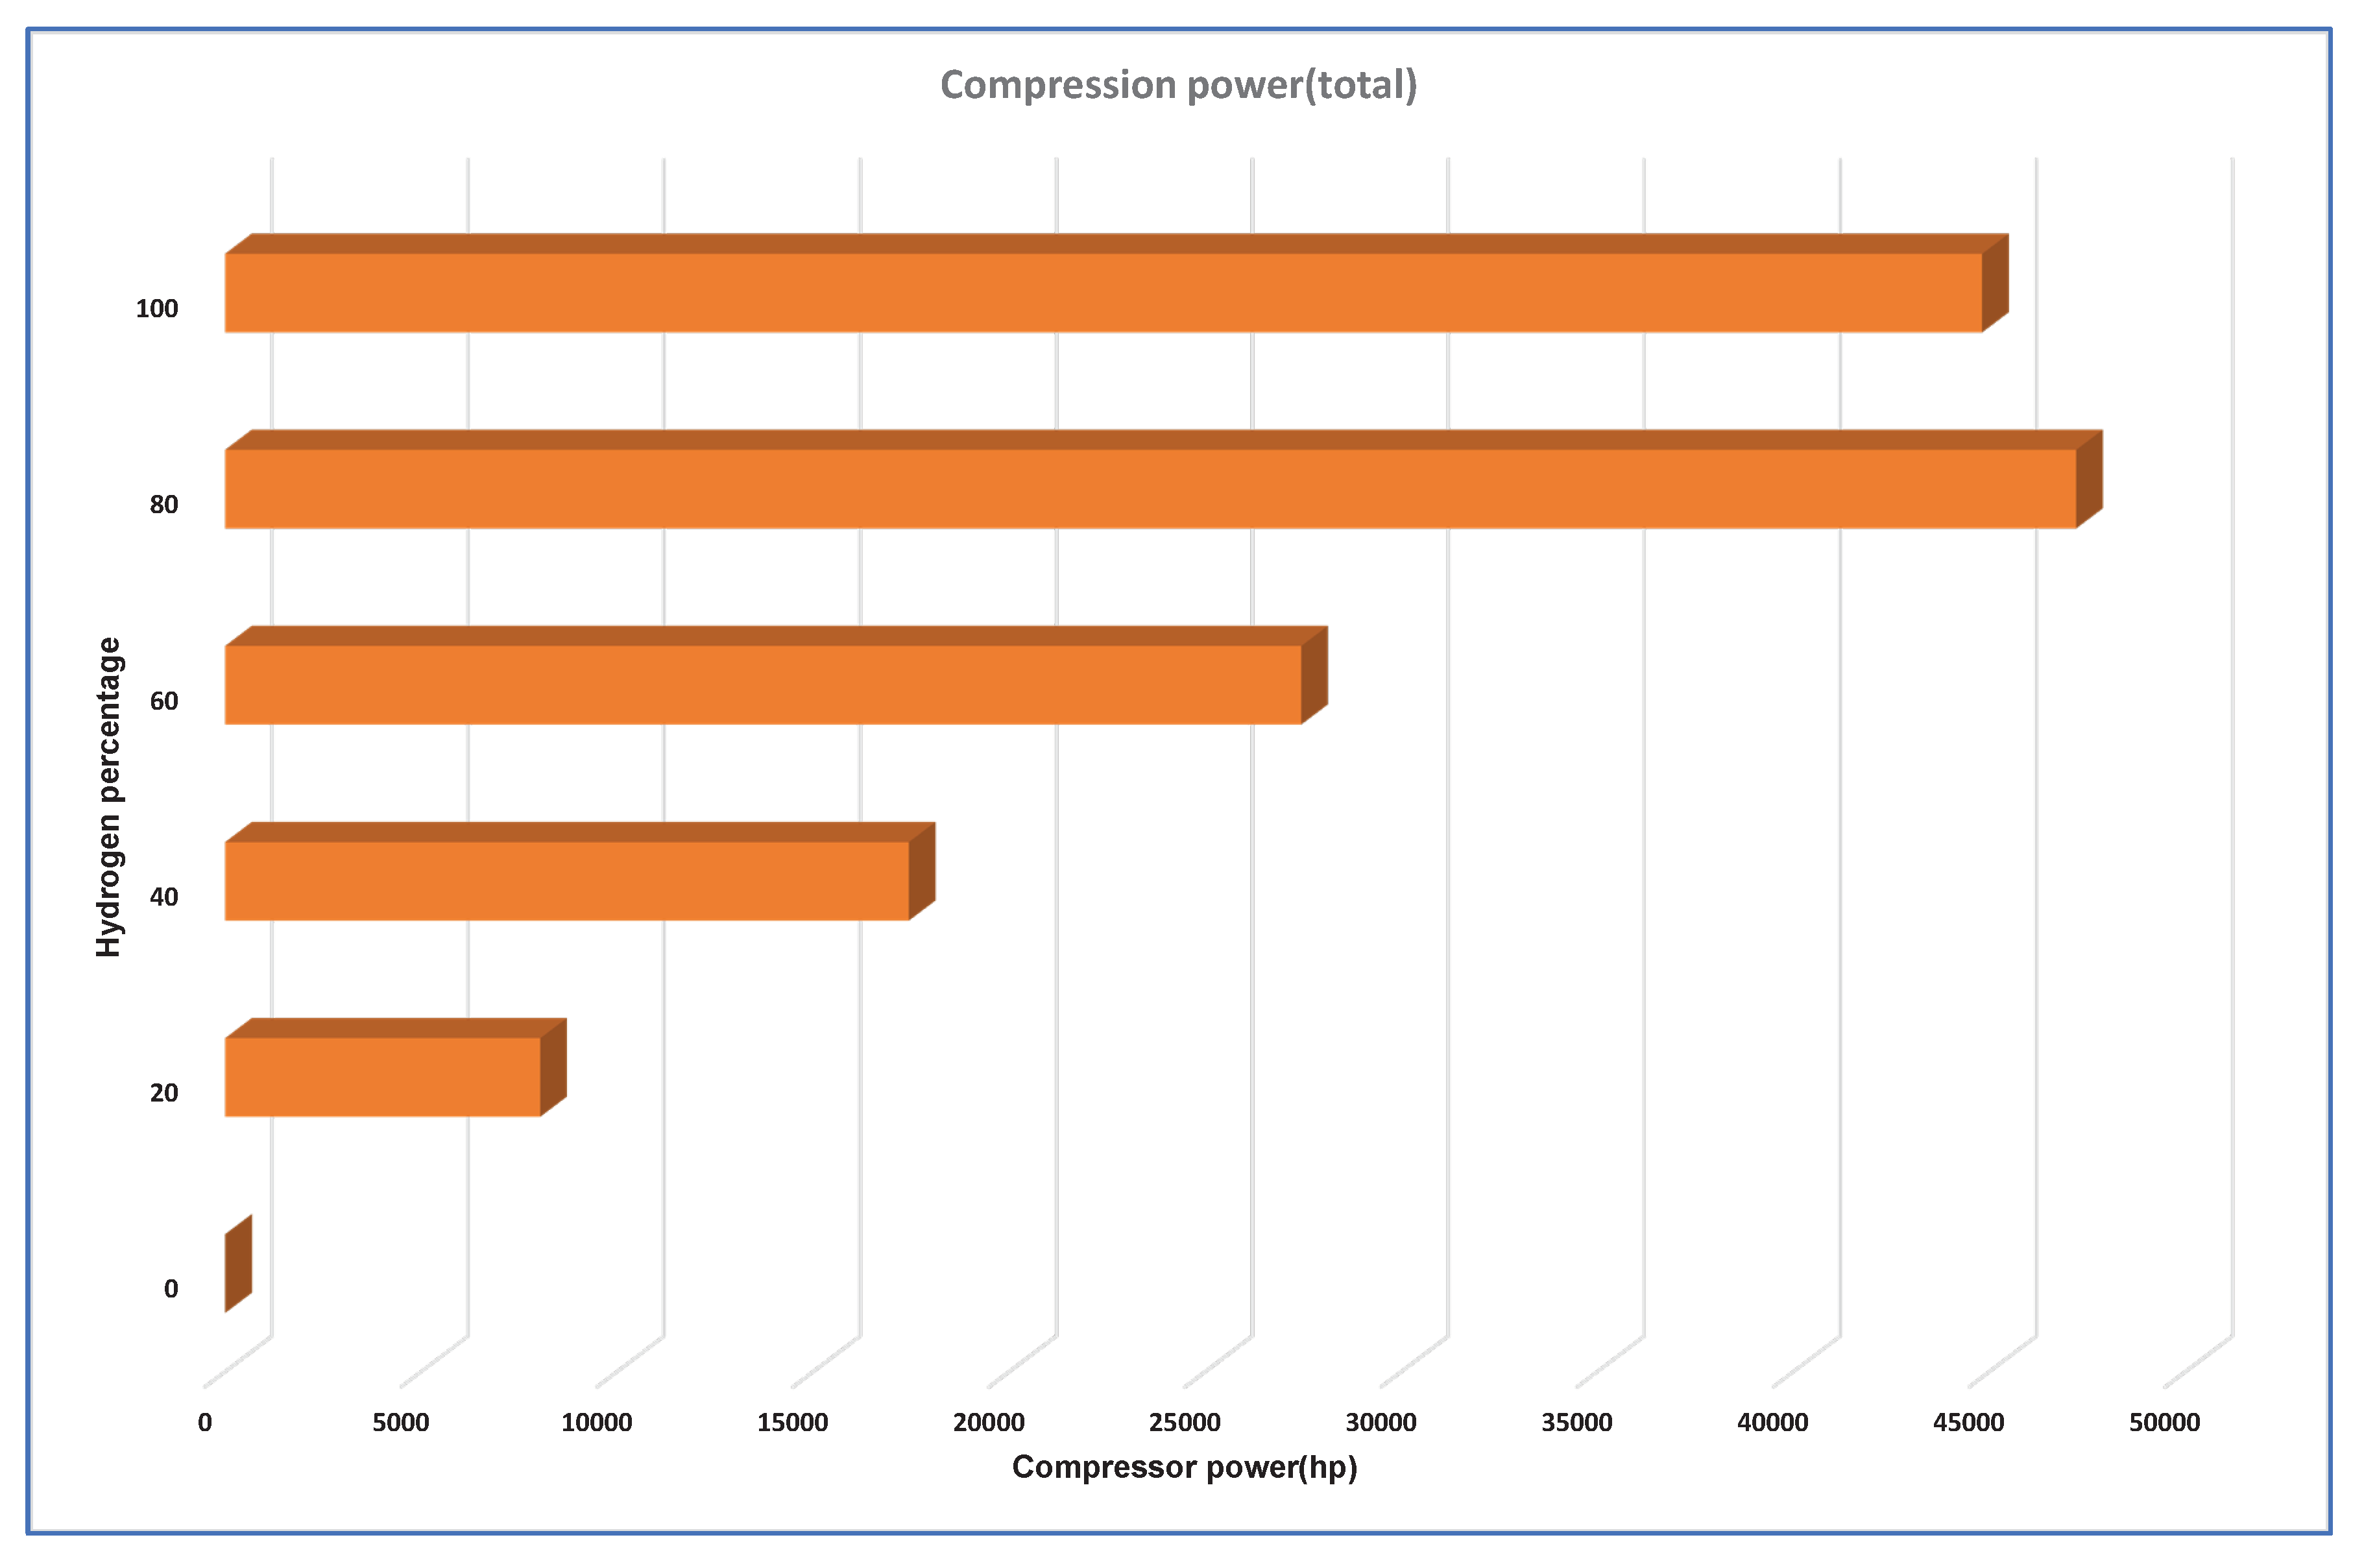
Figure 15.
Comparison of Pipeline Expansion Costs by Looping versus Compression.
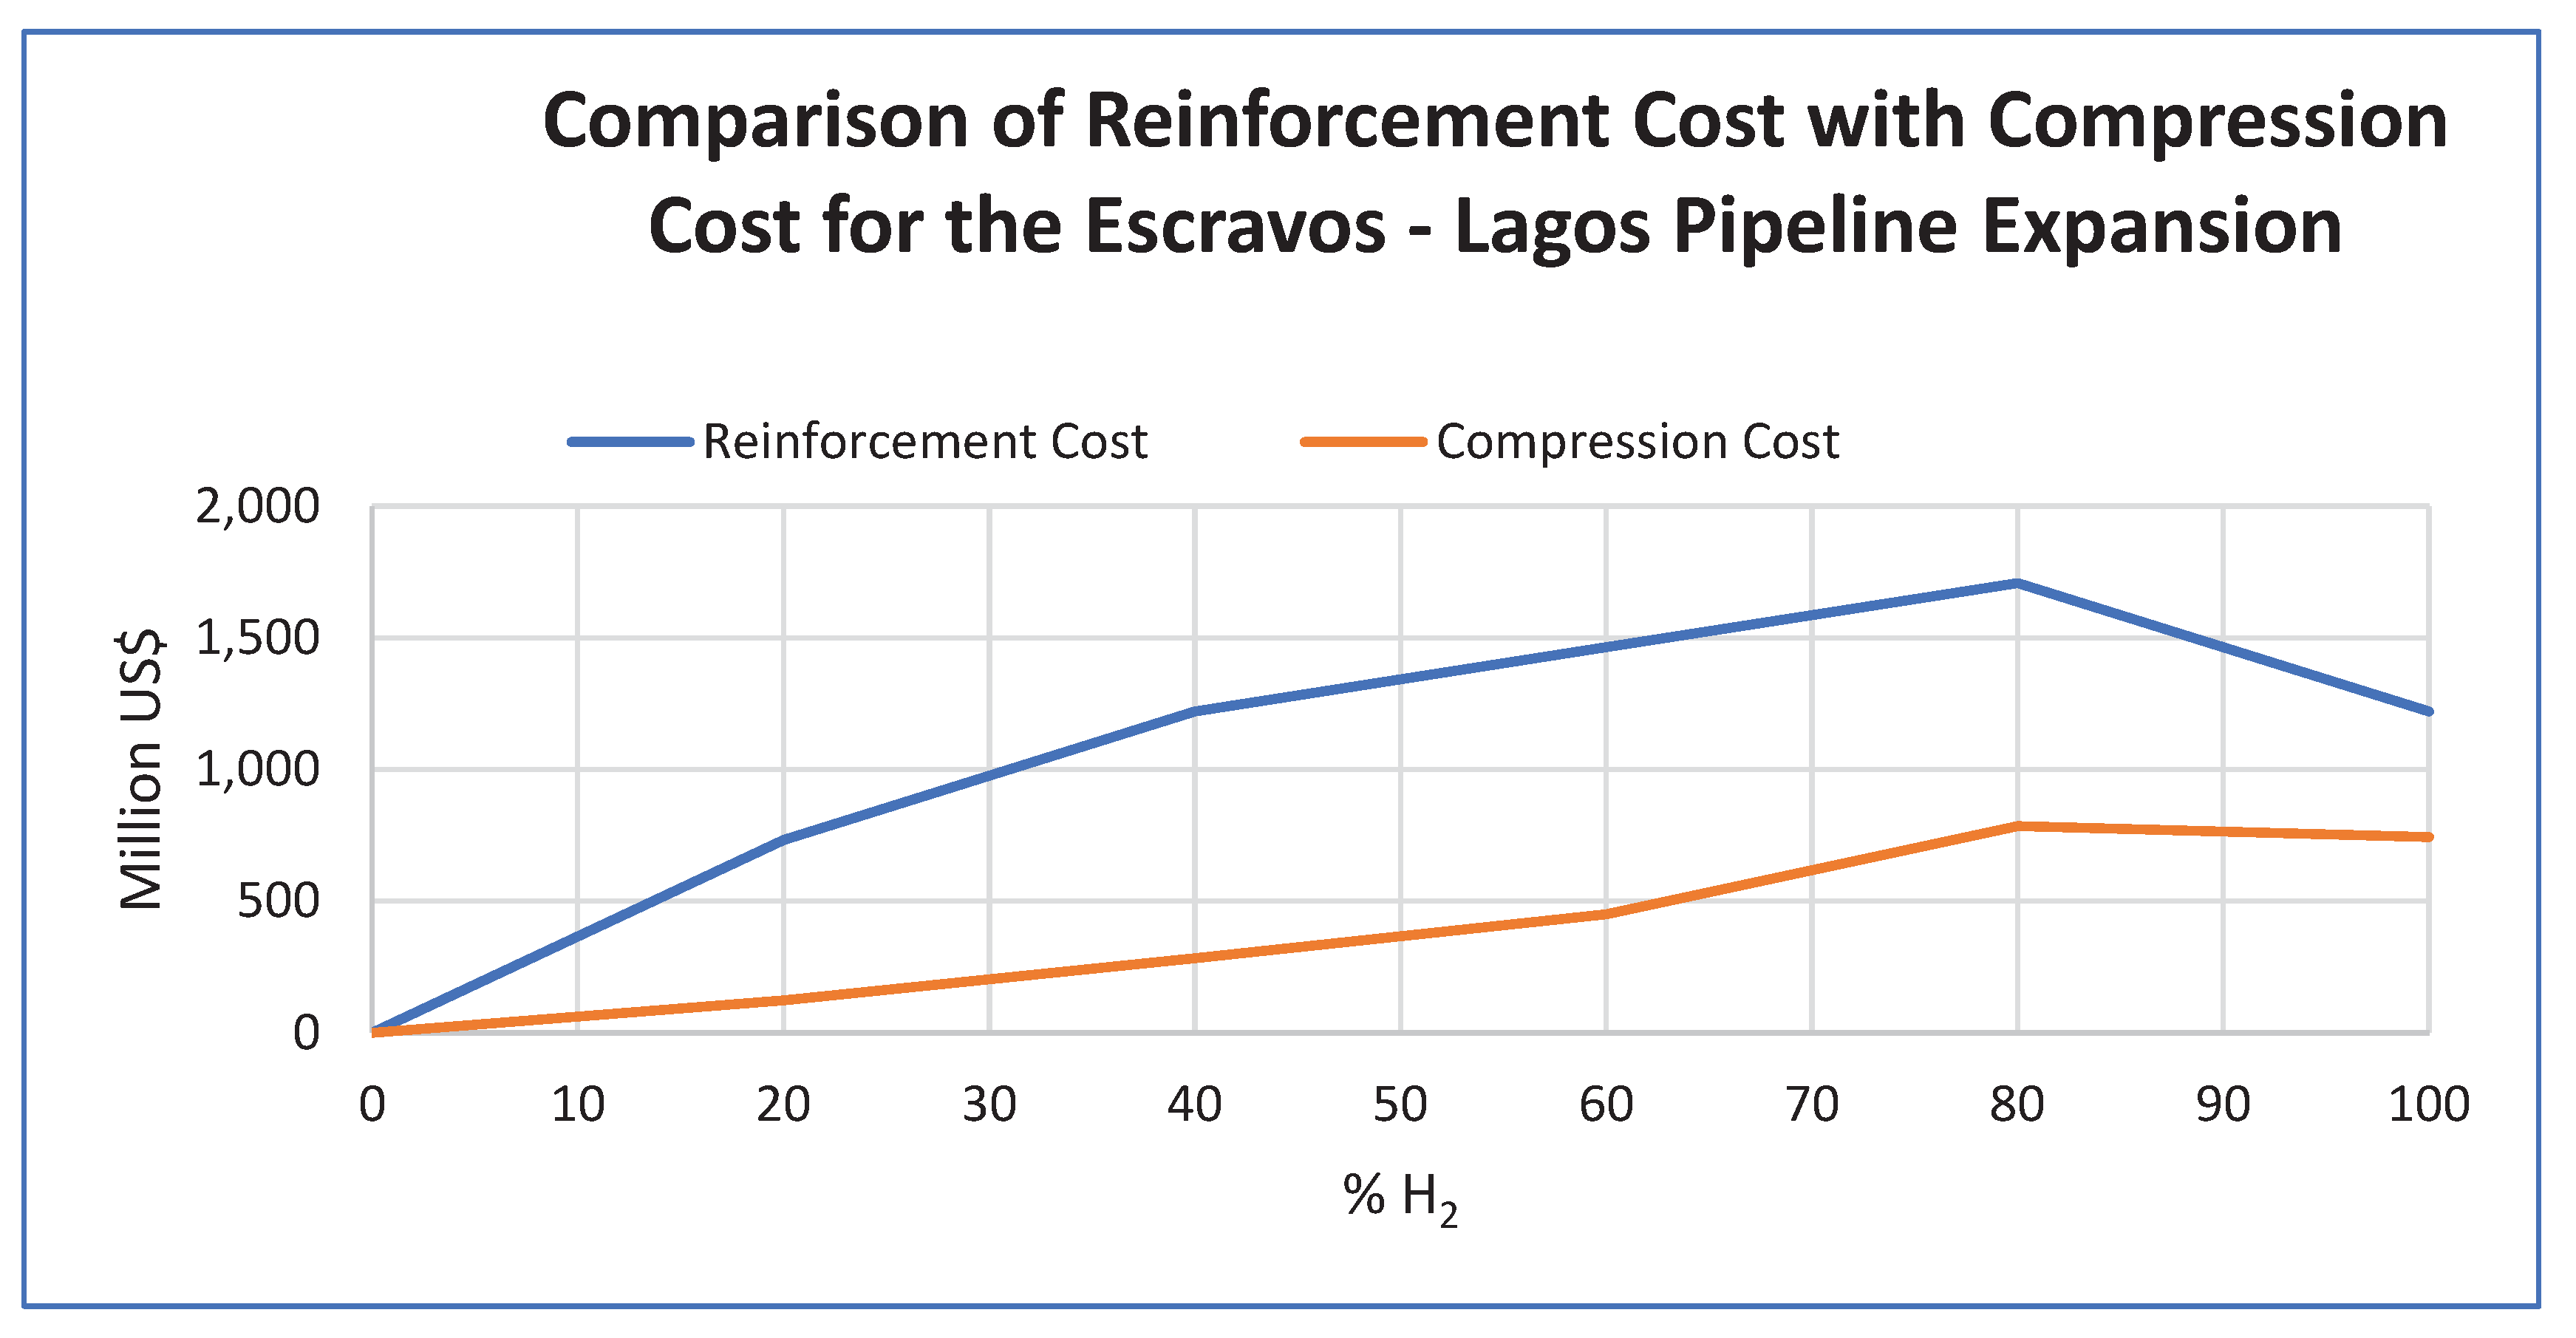
Table 1.
Properties of Natural Gas and Hydrogen at 100bar and 303K.
| Property | Methane | Hydrogen |
|---|---|---|
| Molecular weight (g/mol) | ||
| Density (kg/m3) | ||
| Specific gravity | ||
| Dynamic viscosity (Pa·s) | ||
| Kinematic viscosity (m2/s) | ||
| Gross heating value (MJ/m3) | ||
| Thermal conductivity(W/(m·K) |
Table 2.
Components of the Natural Gas Phase.
| Component | Mole fraction (%) |
|---|---|
| Methane (C1) | 95 |
| Ethane (C2) | 10 |
| Propane (C3) | 8 |
| Butane + Paraffine (C4+) | 5 |
| Nitrogen (N2) | 0.03 |
| Carbon Dioxide (CO2) | 0.04 |
Table 3.
Model Input Parameters.
| Input Variable | Value | Unit |
|---|---|---|
| Pipe length | 342 | km |
| Nominal pipe size, NPS | 36 | inch |
| Pipe wall thickness | 0.25 | inch |
| Maximum allowable operating pressure, MAOP (inlet) | 70 | bar (g) |
| Outlet pressure | 17.34 | bar (g) |
| Gas specific heat ratio | 1.4 | NA |
| Standard temperature | 15.5 | °C |
| Atmospheric pressure | 1.01325 | bar |
| Number of the length of pipe increment | 200 | NA |
| The material for pipe construction | Carbon steel | NA |
| Inclination angle | 0 | Degrees |
| Inlet pressure | 60 | bar (g) |
Disclaimer/Publisher’s Note: The statements, opinions and data contained in all publications are solely those of the individual author(s) and contributor(s) and not of MDPI and/or the editor(s). MDPI and/or the editor(s) disclaim responsibility for any injury to people or property resulting from any ideas, methods, instructions or products referred to in the content. |
© 2024 by the authors. Licensee MDPI, Basel, Switzerland. This article is an open access article distributed under the terms and conditions of the Creative Commons Attribution (CC BY) license (http://creativecommons.org/licenses/by/4.0/).
Copyright: This open access article is published under a Creative Commons CC BY 4.0 license, which permit the free download, distribution, and reuse, provided that the author and preprint are cited in any reuse.


