Submitted:
04 March 2024
Posted:
22 March 2024
You are already at the latest version
Abstract
The catastrophic failure of two dams in Libya in the night of 10th and 11th September 2023, resulted in a significant amount of water and debris destroying a large part of the city of Derna, which is located downstream of the two dams. The flood caused more than 6000 fatalities and the dis-placement of thousands of people from the city. The dams failed due to heavy rainfall caused by the Medicane Daniel, resulting in intense precipitation and the dams overspilling after reaching full capacity. This paper analyses the consequences of the dam breach by modelling the flow discharge and the flooding of the city of Derna. The analysis compares the computed quantities with the findings of the post-event satellite image analysis from UNOSAT and Copernicus, the field reports, and information gathered from the social media through AI detection. The results allows to better understand the dynamics of the dam breach, its initial parameters and an assessment of the accu-racy of the results.
Keywords:
Dam
; Dam Breach
; Flooding
; Modelling
; Early Warning Systems
; Digital Elevation Model
; Popu-lation Density
; Remote Sensing
1. Introduction
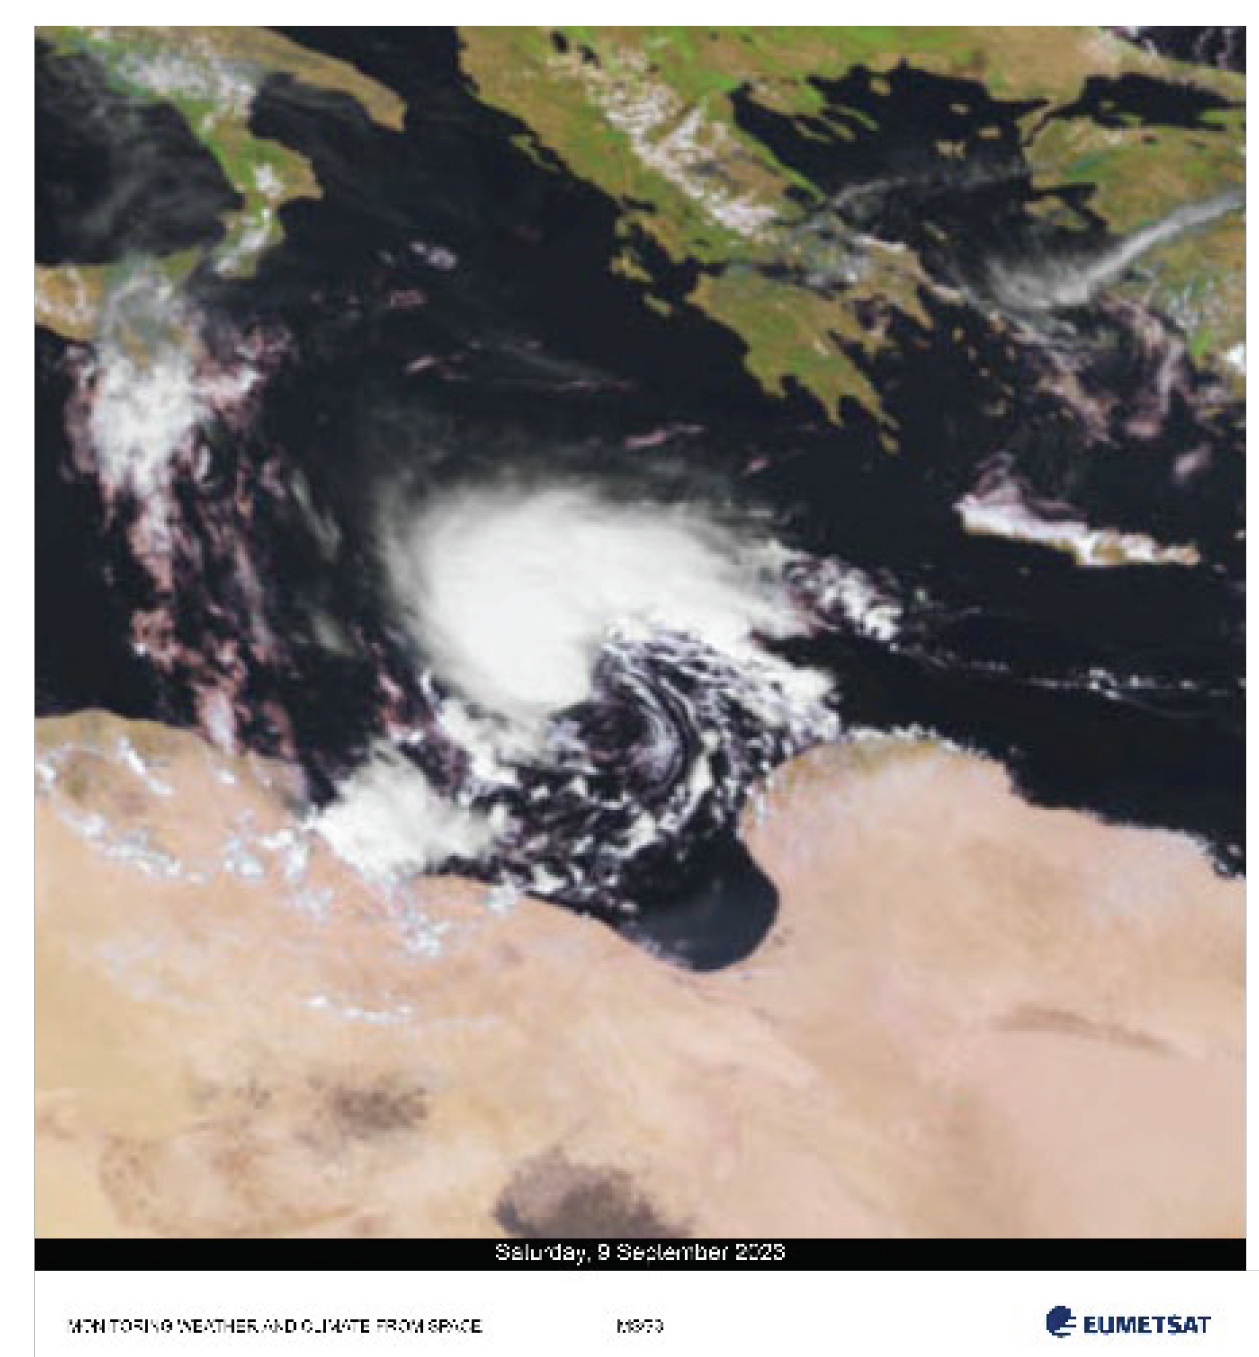
The Mediterranean Cyclone (or Medicane, referred to locally as ‘Storm Daniel’) hit the north-east Mediterranean in September. In its initial stages the storm produced extreme rainfall in Greece, southern Bulgaria, and parts of Türkiye. The storm then remained slow-moving in the eastern Mediterranean for several days before its major rainbands impacted north-eastern Libya on 10 and 11 September. Extreme rainfalls affected the coast and nearby mountains, with 414.1 mm falling in 24 hours at Al-Bayda on 10–11 September. The intense rainfalls resulted in extreme flooding in the region. The most extreme impacts were in the city of Derna (about 50 km east of Al-Bayda), where much of the central city was destroyed by flooding, exacerbated by the failure of two dams. At least 4 345 confirmed deaths and 8 500 people still missing (as of 21 November); approximately an additional 43 000 individuals were displaced in northeastern Libya [1,2], (see Figure 1).
On September 10, Storm Daniel made landfall in Libya, bringing strong winds and heavy rainfall. On September 11, two dams upstream of the coastal city of Derna collapsed due to the intense pressure caused by the heavy rain, releasing 30 million cubic meters of water that ripped through the city of 100,000 inhabitants, Figure 2, [1].
Derna’s vulnerability to flooding was well known, having experienced major floods in 1942, 1959, 1968 and 1986 [3]
Figure 3.
Satellite image showing Storm Daniel evolving in the Mediterranean Sea and affecting the northern areas of Libya ©EUMETSAT2023.
Figure 3.
Satellite image showing Storm Daniel evolving in the Mediterranean Sea and affecting the northern areas of Libya ©EUMETSAT2023.
2. The Dam Break Event
Two dams are involved in this event. The geographical position of the dams is indicated in Figure 4; the Derna dam is located about 12 km from the city and is the largest dam, while the Mansour dam is only 1 km from the city. Both dams are embankment dams with clay fill [5]. For long period of time the dams are at very low level or completely empty as it appears from several Google Earth historical images in the period 2009-2023; this is also confirmed by the Digital Elevation model adopted (SRTM). The sudden rise of water caused by high precipitation caused by the Storm Daniel, has probably caused the overfilling of the Derna dam and consequent sudden break of the earth filling.
The dams have been designed and built by the Hidroprojekt company from the former Yugoslavia Republic between 1973 and 1977. The construction of the dams was performed to irrigate surrounding fields and to provide drinking water to Derna and nearby communities. According to the web site of the company [4], the technical data of the dams are shown in the table below.

Table 1.
Dams design data [5].
Table 1.
Dams design data [5].
| Derna Dam | Mansour Dam | |
|---|---|---|
| Dam Height | 75 m | 45 m |
| Crest Length | 300 m | 130 m |
| Foundation width | 104 m | 56 m |
| Embankment | 735,000 m3 | 104,000 m3 |
| Storage capacity | 18 million m3 | 1.5 million m3 |
The objective of this analysis is the modelling of the break, the estimation of the flooding extent and its timeline using the methodology outlined in detail in [5]
In general, the analysis of a dam break by numerical modeling requires a number of input data and output quantities. The method described in [5] was aimed to develop a procedure that facilitates the preparation of the input deck and the derivation of the output quantities to allow a fast analysis of a dam break event using a shallow water model, NAMIDANCE, as the analysis tool [6,7]. This is particular important when, due to the pressure of understanding an ongoing or potential event, quick estimation of the possible consequences are necessary. In this particular case, in the aftermath of the event very few information was available to the international community to estimate the consequences of the large flooding and the meteorological conditions did not allow for a proper images acquisition and analysis. NAMIDANCE has been validated by several benchmark problems and applied to many tsunami events and modeling studies [7]. NAMIDANCE was never validated for a dam break calculation; although this was a tragedy for the dramatic consequences, it is a good opportunity to estimate the quality of dam break simulations because detailed satellite images analyses exist, produced by two independent expert teams from EU Copernicus EMS [8] and UNOSAT [9]; recently JRC published a report including an analysis based on field reports and social media images analysis which will improve the quality of the comparisons.
2.1. Previous Studies on Derna dam
Not many analyses of dam break risk assessment studies or specific analysis for this event, published before or after the time of the event have been identified, except the ones mentioned below.
A detailed study was conducted on the possible failure of the Derna dam by Abdalla [10]. According to this study, “Piping failure was considered the most predictable one for Dema dam. For the current study it was shown that dam break cause a potential danger towards Dema City, since flooding occurs in the city for all hypothetical scenarios. It was recommended to predict the routing of the flow after failure due to lowering the retained water surface elevation in the reservoir and due to the use of levees and increasing walls heights in the city area.”
A relevant report was found in relation to possible floods in Derna. The report by Ashoor [11] indicates data related to the possible flood risk in Derna caused by high precipitation. “As a result of the model applied, the annual runoff volume for forty years during 1960–2000 in the study area was estimated by 138.51 Mm3. Furthermore, a volume flood has been estimated, based on the flood of October 1945 and late November 1986. Those events called for average precipitation of 145 and 64.14mm respectively. The rainfall of 1945 produced a volume flood of 53.36 Mm3, which represents 40 % of annual runoff volume, while the flood of November 1986 was 14.8 Mm3, which is in good agreement with the recorded flood in the basin. The results demonstrated that the study area has a high potential for flood risk. Therefore, dams of Wadi Derna basin is needed periodic maintenance.”
JRC developed a comprehensive analysis of this event, using NAMIDANCE and comparing the findings with satellite images, field reports and social media [13]. Many of the findings are reported in this report in the section related to the validation.
A recent publication by Imran et al. [14] analyzed the inundation of Derna due to the destruction of the dam; their results are in agreement with what we have found even if a comparison with measured/observed quantities is not included.
2.2. Methodology of Current Analysis
According to the methodology described in [5], the data have been prepared in order to consider the level of the water reservoir upstream the dam at its maximum height. This is 215 m according to SRTM Digital Elevation Model (DEM) that is used to perform the computations [14] and 205 m according to Google Earth DEM; however, both according to SRTM as well as Google Earth, the dam at its extreme is higher than in the center (about 229 m), that is not possible as the crest of the dam is flat. For this reason, due to the uncertainty in the real absolute elevation of the dam crest4 water levels have been assumed: 205, 215, 225 and 230 m, Figure 5. The 230 m is considered as worst case because it is unlikely that the water level could be 10 m above the maximum expected dam height. The presence of the overflow discharge pipe (Figure 6) was not effective either because it was evidently insufficient to contain the excess water or because it was obstructed and therefore could not perform its function.
The calculations have been performed using the Dam Break Platform (see Appendix A), that allows to define the conditions and then performs the calculations using NAMIDANCE computer code. The Digital elevation model assumed for the calculations is the SRTM-30m [14], resampled at 7.5 m. Each calculation was carried out for 24 h to be sure that all the water was depleted from the lake and that the maximum flooding extent was reached; however, in general the maximum flooding extent is reached in less than 3h. Each run lasted about 1 h 20 min of calculation time and about 40 min to process the results. All the processing was done automatically through the platform and are available for consultation. The break was considered completely or partially destroyed even if from the published images most of it appears damaged and disappeared (Figure 8 and Figure 9).
It’s important to mention that the downstream dam was not factored into the modeling, either because it had already been destroyed or was immediately affected by the dam breach flood. Additionally, it was not identifiable in the SRTM.
3. Calculation Results
3.1. Results of Reference Case (WH=225m, BW=260m)
The nominal case is performed by considering a Lake level height of 225 m above sea level, i.e., 10m above the nominal elevation of the dam, according to the SRTM. The opening of the dam is instantaneous and involves a width of 260 m, i.e., 87% of the overall width of the crest (300 m). It will be shown in the sensitivity analyses that a width larger than 150 m does not substantially change the behavior because the narrow for of the upstream reservoirs limits the discharged flowrate. The assumed friction coefficient was 0.015 and the river downstream the dam was considered dry, as it was for most of the time, according to Google Earth historical images.
Nevertheless, the intense raining could have filled the river before the dam break; this will be the objective of a specific analysis in the next chapters.
The second dam was ignored and it was considered as if its break was instantaneous because the water height at the point of the dam was 17.5m and considering the initial flow rate of 43600 m3/s and even considering the lower reservoir of 1.5 Mm3completely dry (which probably was not the case), its overfilling would last take than 3 minutes. Therefore, the Mansour dam was ignored in the calculation.
The calculation is performed using SRTM topography (30m resolution), resampled to 7.5 m to improve the hydraulic description of the modelling. The bounding box of the analysis includes the following coordinates: from (22.528468,32.6370721) to (22.696805,32.77986) as bottom left and top right lon/lat respectively. The corresponding grid is 2425x2057 cells; for Courant number stability the assumed time step is 0.6 s. The calculations have been performed using a Windows server equipped with a NVIDIA GeForce RTX 3060 GPU card. The typical running time was in the order of 1h 25 min for 24h problem time.
The water progression after the break can be seen in Figure 8, showing the water displacement every 10 min. As it can be seen the water reaches the city of Derna in less than 30 min and a large part of the city is affected with water flooding.
The maximum extent of the inundation can be seen in the Figure 9. It is possible to note that a large part of the central area of Derna is affected by flow depth exceeding 5m. Also the sea in front of Derna appears risen with height ranging from 1 to 3 m. The east part of the coastal sea appears as high as 1.15m and therefore some coastal inundation could have occurred for a large part of the city on the east. The comparison with the Copernicus EMS [8] and UNOSAT [9] flood extent appears rather correct most areas. However, in the west part some areas appear unaffected in the calculation while are flooded in the satellite interpretations.
The reason is due to the presence in the SRTM digital elevation model of small elevation rise that prevent the water to enter in those areas. If these are artefacts of SRTM or real elevated areas is not possible to assess without a direct local investigation. On the other hand, the fact that those locations are marked ‘flooded’ or ‘affected’ by the interpreters of UNOSAT or Copernicus could also indicate the presence of wet portion of land, caused by the intense precipitation and not as an effect of the inundation due to the break. To be more precise on the first point, in the lower portion of Figure 10 it is possible to note the elevation of the small peaks that prevent the water from flowing in those areas. In any case SRTM does not take into account the presence of buildings that can change significantly the path of the water, creating channeling and higher velocities paths.
The travel time is illustrated in the Figure 11, which indicates the arrival time according to a number of time intervals. As it can be seen the wave arrival time to the first houses of Derna is in the order of 25 min and within 10 min most inundation is occurring.
The overall inundated surface can be appreciated from Table 2. UNOSAT and Copernicus indicate a similar overall surface, between 3.4 and 3.6 square km while the calculation shows a lower value of 2.6 square km.
The population affected by the event is shown in Table 3 which reports for classes of water height the amount of population. The overall population is in the order of 111 thousand for LANDSCAN 2014 model [15] and 71 thousand for GHSL [16].
All the results shown above can be accessed at the following: LINK
3.2. Sensitivity Analyses
Some details of the conditions at the time of the event are still not clear. For example, the rupture mode or the situation of the river downstream. About the rupture mode, was the rupture instantaneous r it took some minutes or hours to complete the opening? How large was the opening? What was the level in the reservoir before the rupture?
It is supposed that before the arrival of the storm Daniel, the reservoir and the river were completely empty and dry; then due to the rainfall the level started to raise in the reservoir; was the water able to leave the dam through the overflow discharge piping? If yes, the river downstream was not empty and also the downstream dam reservoir was filling and then releasing water through its overflow discharge pipe. However, it is a fact that the overflow pipe was insufficient or totally unable to control the level that overflow the dam and finally destroyed it. The situation of the river downstream can therefore range from completely dry to full of water. The level of the river downstream is unknown because it depends on the amount of water overflown from the overflow discharge pipe.
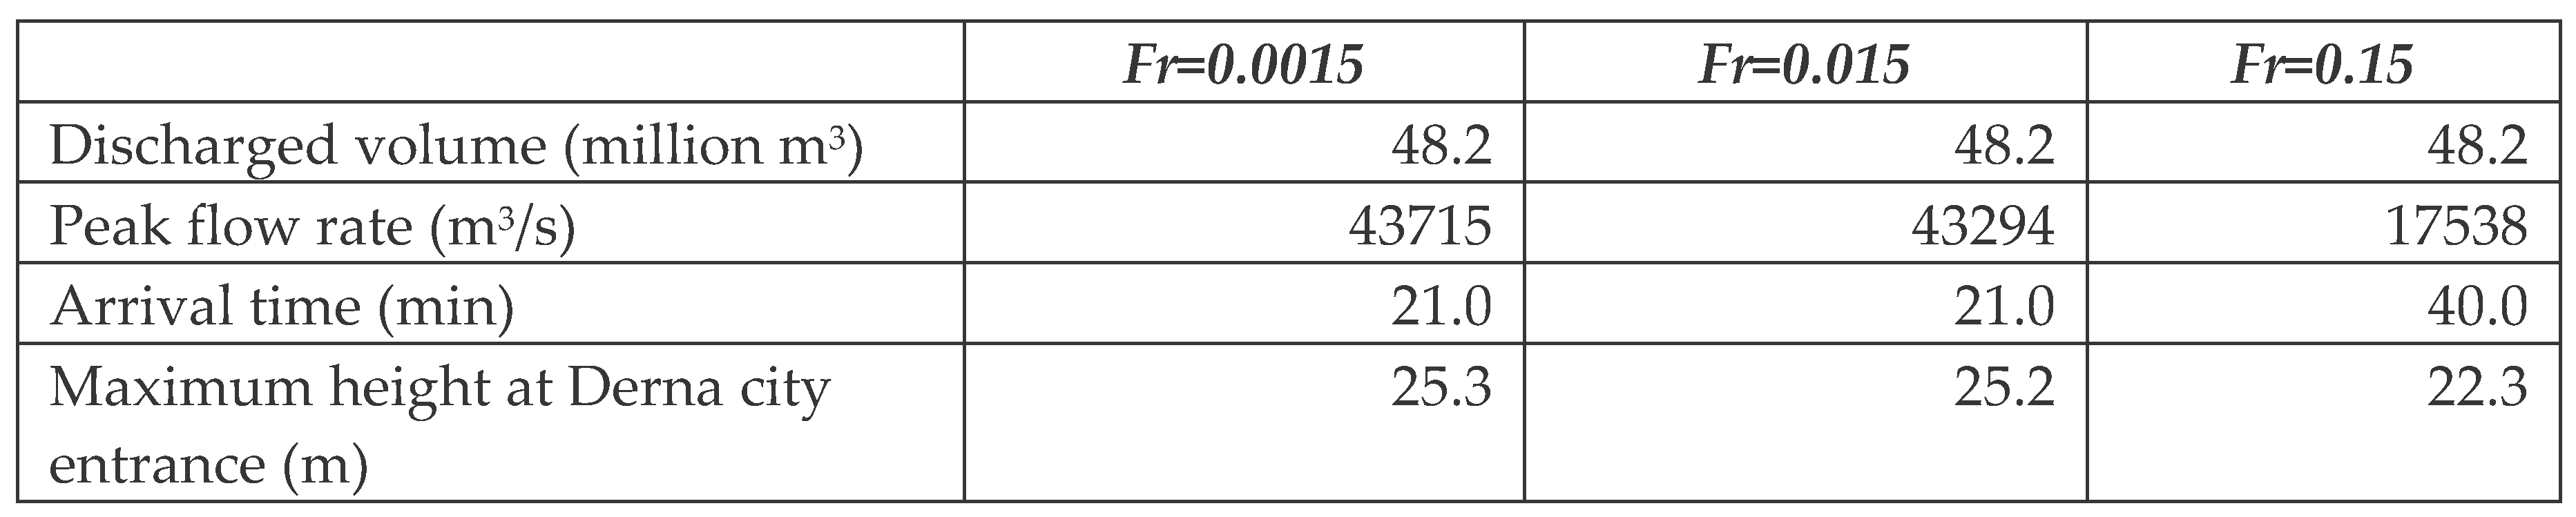
Given the uncertainties in this type of calculation, it was considered useful to perform a number of sensitivity analyses to try to include all the possible variations. In particular 4 parameters have been considered: the initial water level, the friction coefficient and the break width, the level of the river downstream the dam.
About the initial water level, we already indicated different hypotheses (205, 215 and 225 m above sea level). For the friction the standard coefficient is 0.015 but a lower vale (1/100) was also considered because at the beginning the surface was not dry but already wet for the heavy rainfall. About the break size, the nominal width of the dam is 300 m but analyzing the SRTM, it is possible to note that the maximum break size cannot be larger than 260m because any larger size would be limited by the valley itself, that, at the maximum height of 225m is about 260 m wide. Looking at the form of the break, Figure 7, at least 70-90% of the embankment appears missing and therefore a nominal break size width of 260 m was assumed and 200 m as minimum size, considering that is some section the break was not totally complete in height.
The calculation matrix can be summarized as follows:
Table 4.
Sensitivity analyses performed. The first column includes hyperlinks to the results of the calculations.
Table 4.
Sensitivity analyses performed. The first column includes hyperlinks to the results of the calculations.
| Case and hyperlink | Water Level (m) | Friction | Break size (m) | River depth/width (m/m) |
| Lake Water level (m) | ||||
| 4207 | 205 | 0.015 | 260 | |
| 4223 | 215 | “ | “ | |
| 4222 | 225 | “ | “ | |
| 4264 | 230 | “ | “ | |
| Friction coefficient (-) | ||||
| 4224 | 225 | 0.00015 | 260 | |
| 4222 | “ | 0.015 | “ | |
| 4225 | “ | 0.15 | “ | |
| Break width (m) | ||||
| 4217 | 225 | 0.015 | 30 | |
| 4216 | “ | “ | 75 | |
| 4218 | “ | “ | 100 | |
| 4219 | “ | “ | 150 | |
| 4220 | “ | “ | 200 | |
| 4222 | “ | “ | 260 | |
| Downstream River | ||||
| 4222 | 225 | 0.015 | 260 | Dry river |
| 4250 | “ | “ | “ | 0.0625 |
| 4251 | “ | “ | “ | 1.25 |
| 4249 | “ | “ | “ | 2.5 |
3.2.1. Effect of the Lake Water Height
The initial height was varied between 205 and 230 m, considering the different SRTM available for the area.
| 205 m | 215 m | 225m | 230m | |
|---|---|---|---|---|
| Discharged volume (million m3) | 4.3 | 20.14 | 48.2 | 61.7 |
| Peak flow rate (m3/s) | 2493 | 21524 | 43294 | 56480 |
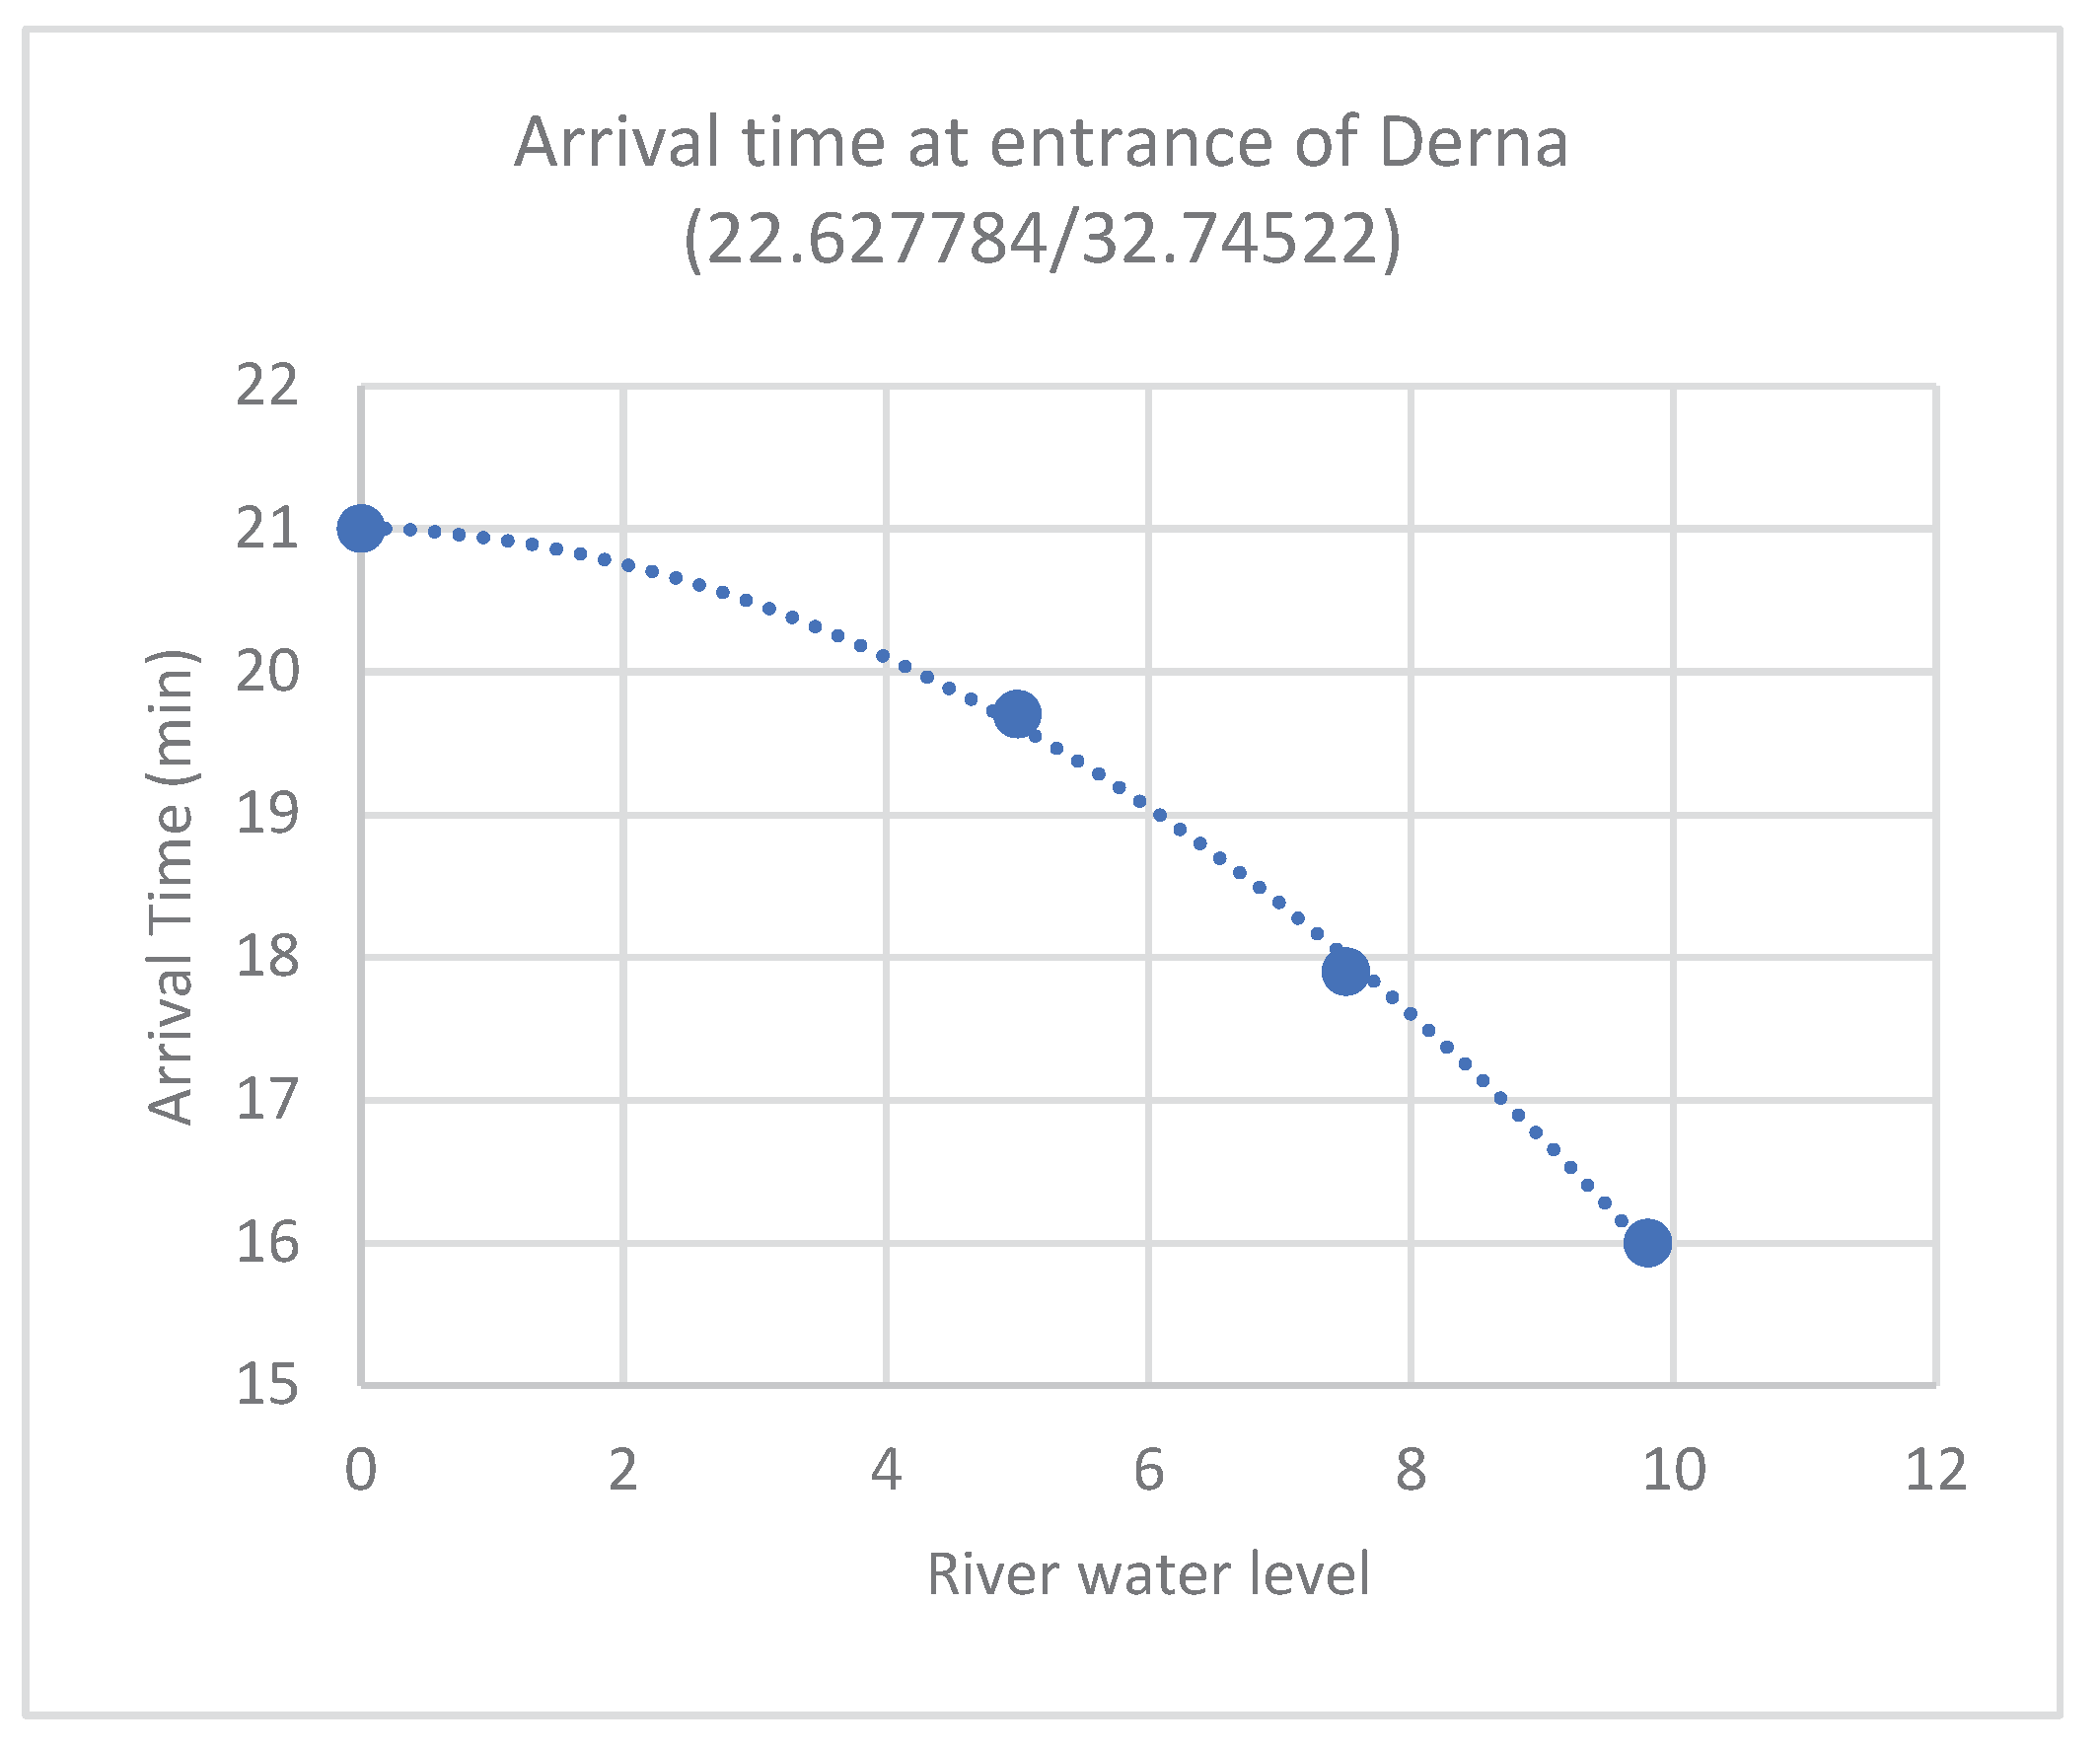
| Arrival time at Derna city entrance* (min) | 83 | 26.0 | 21.0 | 20.0 |
| Maximum height at Derna city entrance* (m) | 5.9 | 15.6 | 25.2 | 28.6 |
| *Lat/Lon: 22.62784 / 32.74522 | ||||
As the water height increases in the upstream level, the initial peak flow increases and for 225 m reaches a value of 43,000 m3/s. Consequently, Figure 12, the arrival time decreases from 80 min to 21 minutes, due to the much larger flow and depth in the river valley.
The increase of the lake water level causes an increase of the initial peak flow and, as a result the water level at the entrance of Derna increases notably from 5.2 to 28.6 m in the highest elevation case (Figure 13). The resulting inundation of Derna does not change as much as the peak (Figure 14). Nevertheless, an increase of the inundation extent is noticeable with the increase of the lake elevation.
3.2.2. Effect of Friction Coefficient
The effect of the friction coefficient on the impact can be seen in this section. All the calculations have been performed with 225 m initial height and 260 m break width.
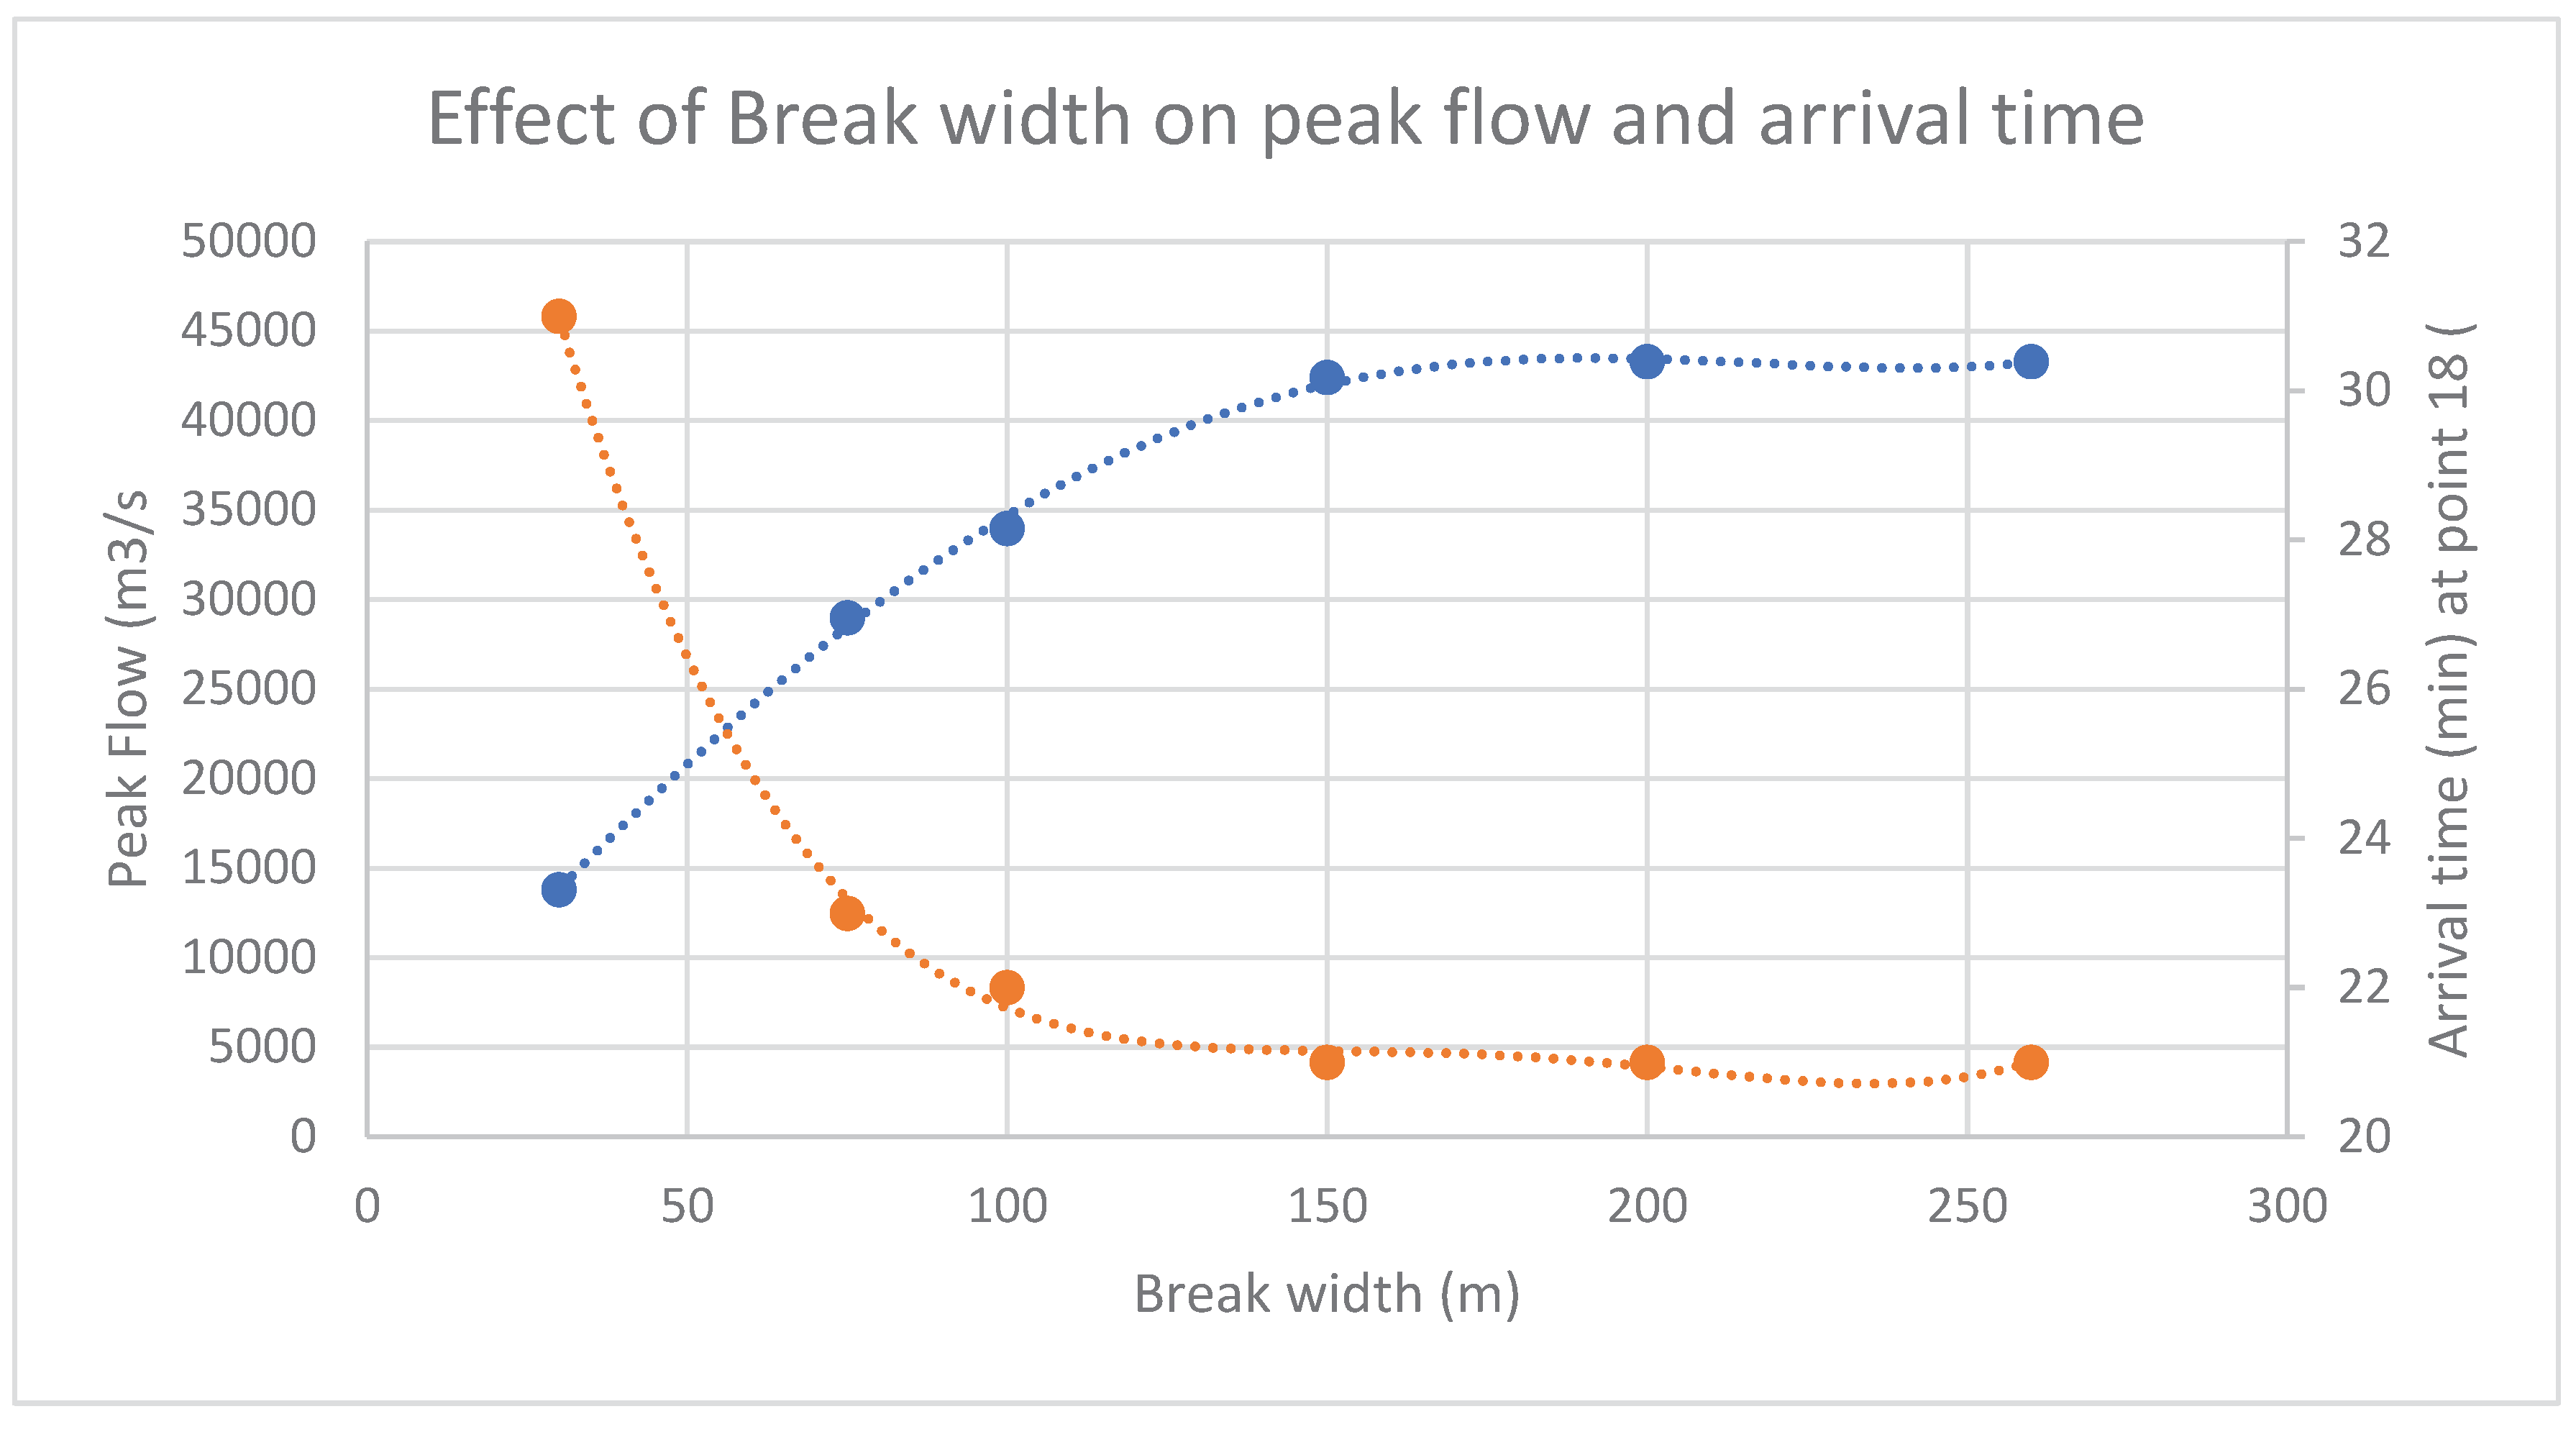
3.2.3. Effect of Break Width
The effect of the break width on the impact can be seen in this section. All the calculations have been performed with 225 m initial height and 0.015 as friction coefficient.
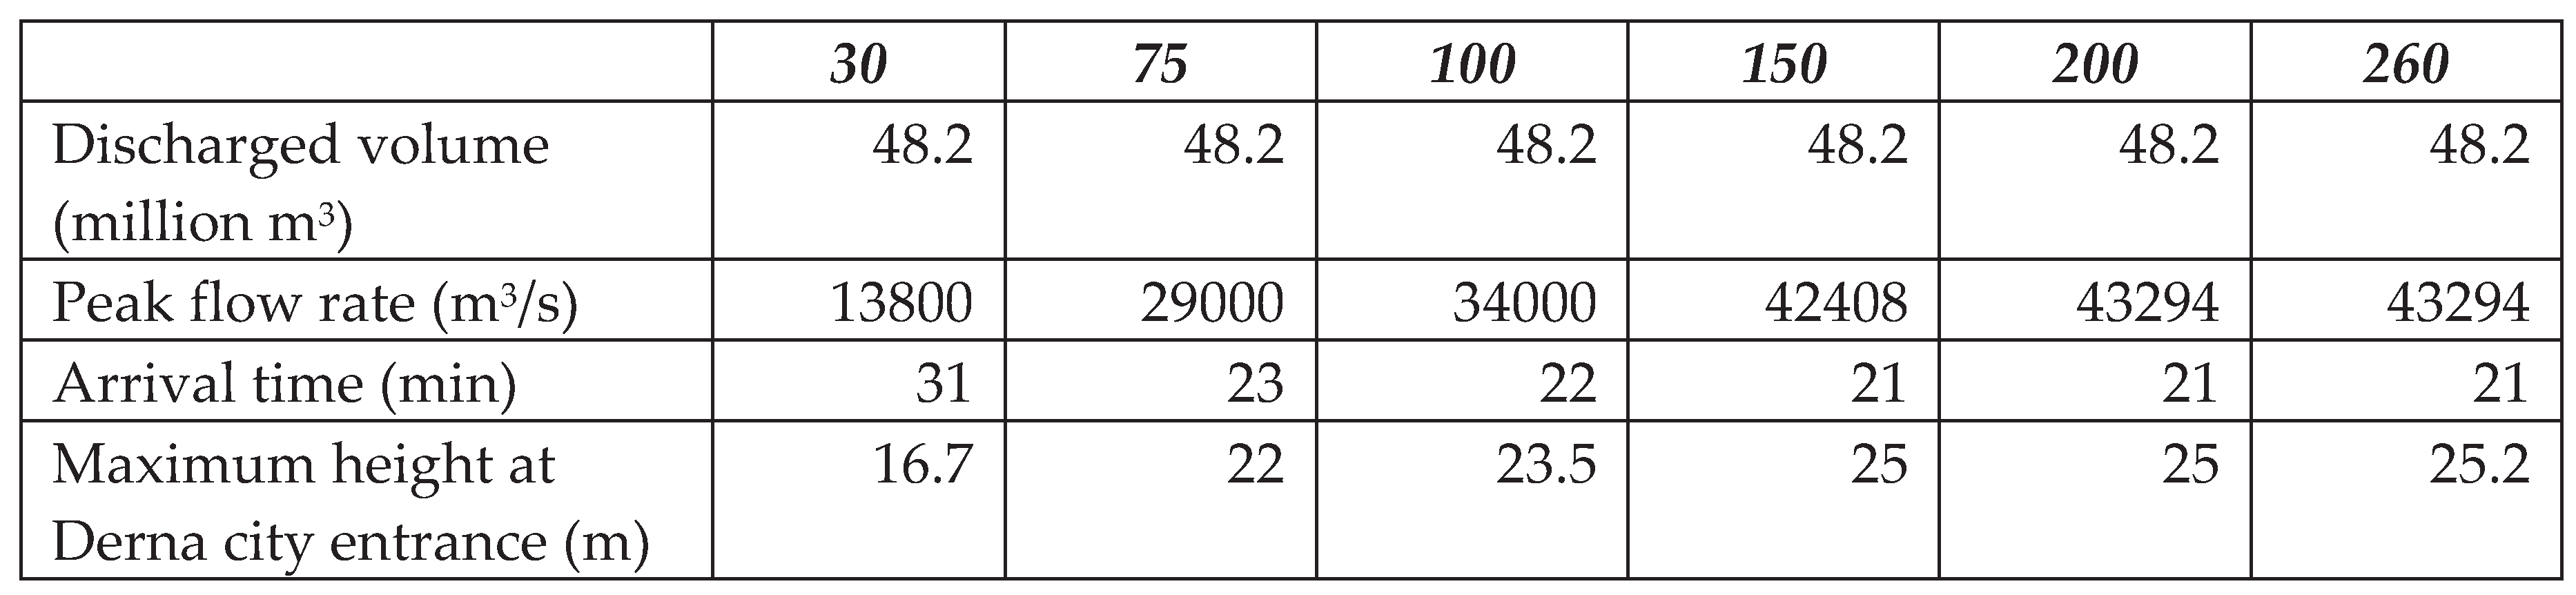
The peak flow and the arrival time respectively increase and decrease noticeable by increasing the break width up to 200 m; after this size the changes become very small. The reason is that the increase of the break size is no longer effective because some sections upstream the dam are smaller than 200 m
3.2.4. Presence of River Flow Downstream the Break
River flow calculations have been performed using a complicated technique because it is not easy to take into account of the condition during or just before the overspilling event. The overspilling was simulated by imposing a constant inlet flow in the lake upstream the dam. When the overspilling occurs, the flow starts displacing over the river flow plain; the river depth is variable along the path because it depends on the outlet flow rate and the slope of the river in that location
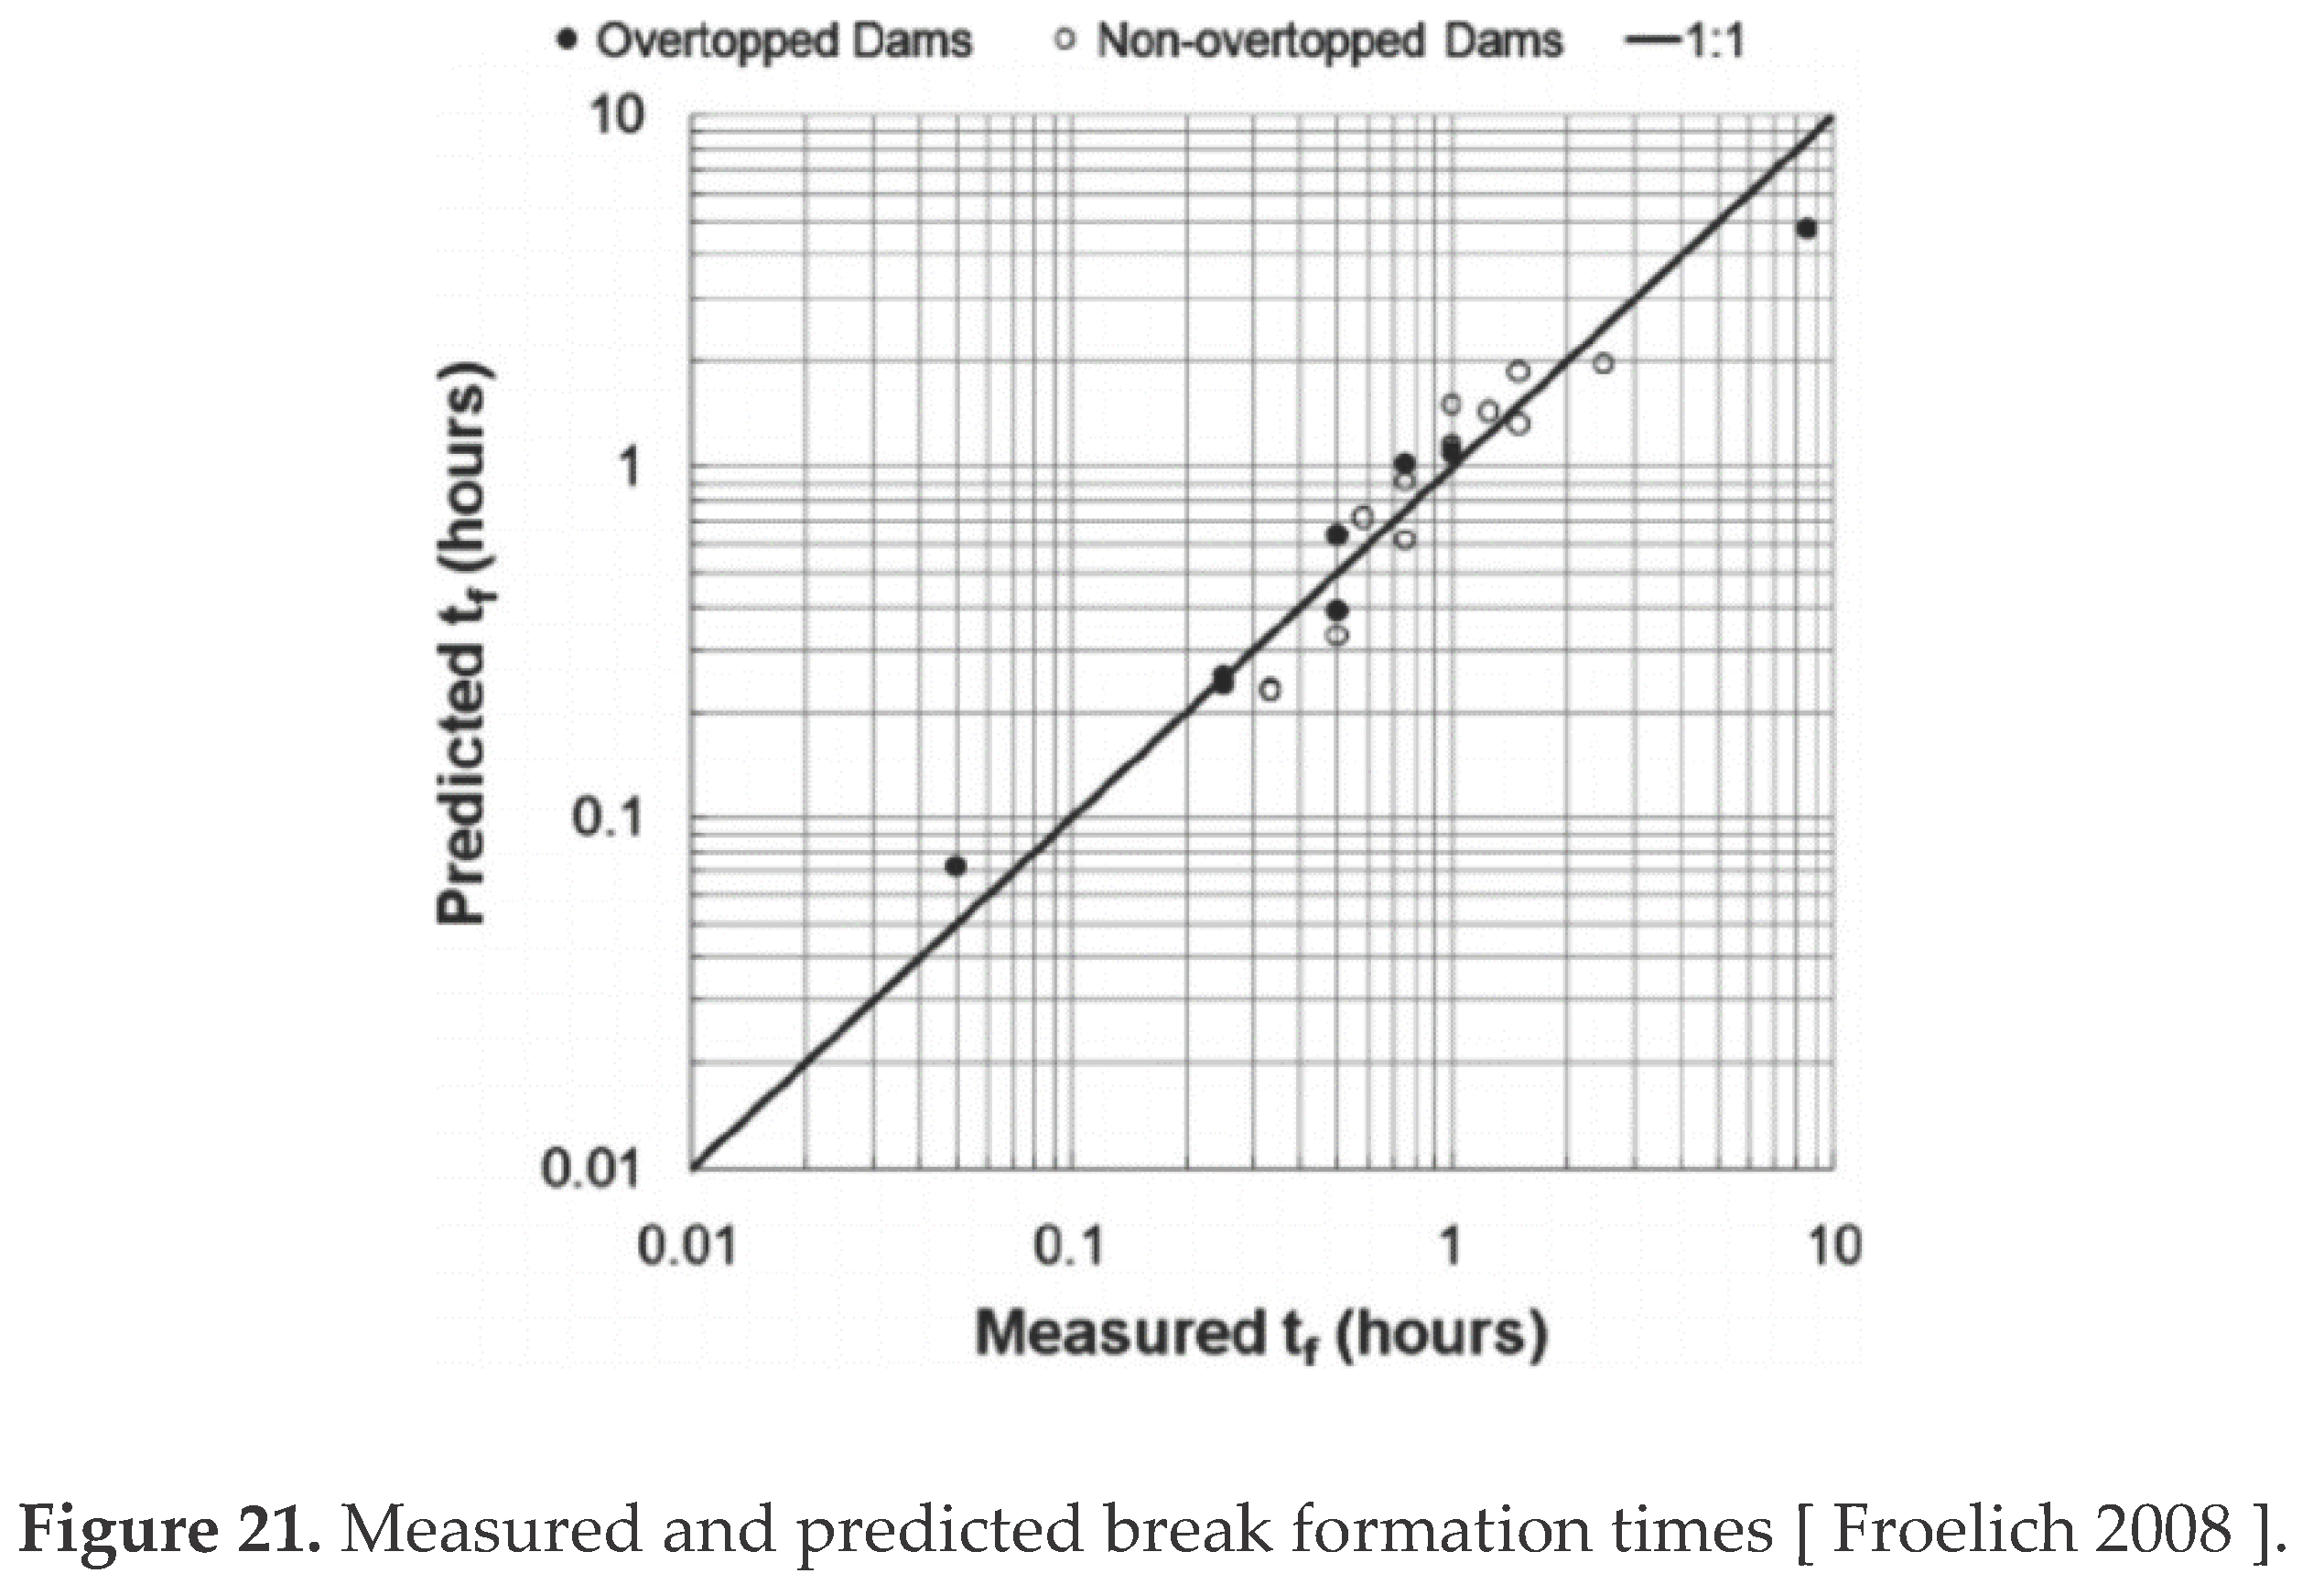
The overspilling has been considered for 7 hours that is the time to reach the lower dam. In principle the break could have occurred at any time during this period but in general it takes much less time. According to the analysis of Froelich [24] all the cases analyzed showed a break formation time less than 1 hour with only one exception of 8.5 hours for the Oros dam in Brazil. According to his experimental formula, the formation time can be expressed as
considering Vw=18 Mm3 and Hb=75m, the resulting time is 1.1 h. Therefore 7h is well beyond the expected breaking time.
Figure 21.
Arrival time as a function of initial water level in the river.
During the 7 hours of the preparation run, the lake was fed with 3 sets of arbitrary values of constant inlet flow and when the overtopping occurs the water is released to the river plane that starts filling up. The break is assumed to occur after 7 hours; the conditions reached in this simulation have been assumed as initial condition downstream the dam in the dam break calculation. The initial water level at the location close to the lower dam is for the 3 inflow cases, respectively 5.X m, 7.5 m and 9.8 m.
When the break occurs, the travel time is much smaller than in the normal dry case because the wave celerity is larger as the wave travels on top of a water layer. As a consequence, the arrival time decreases from 21 to 16 minutes, Figure 20. The maximum water level reached increases with the increase of the initial water level but the rise of the level is less pronounced, Figure 19.
Figure 19.
Effect of friction coefficient on Derna inundation. The red line represents the Copernicus EMSR696 flooding extent while the blue line is the same extent as deduced by UNOSAT FL20230912.
Figure 19.
Effect of friction coefficient on Derna inundation. The red line represents the Copernicus EMSR696 flooding extent while the blue line is the same extent as deduced by UNOSAT FL20230912.
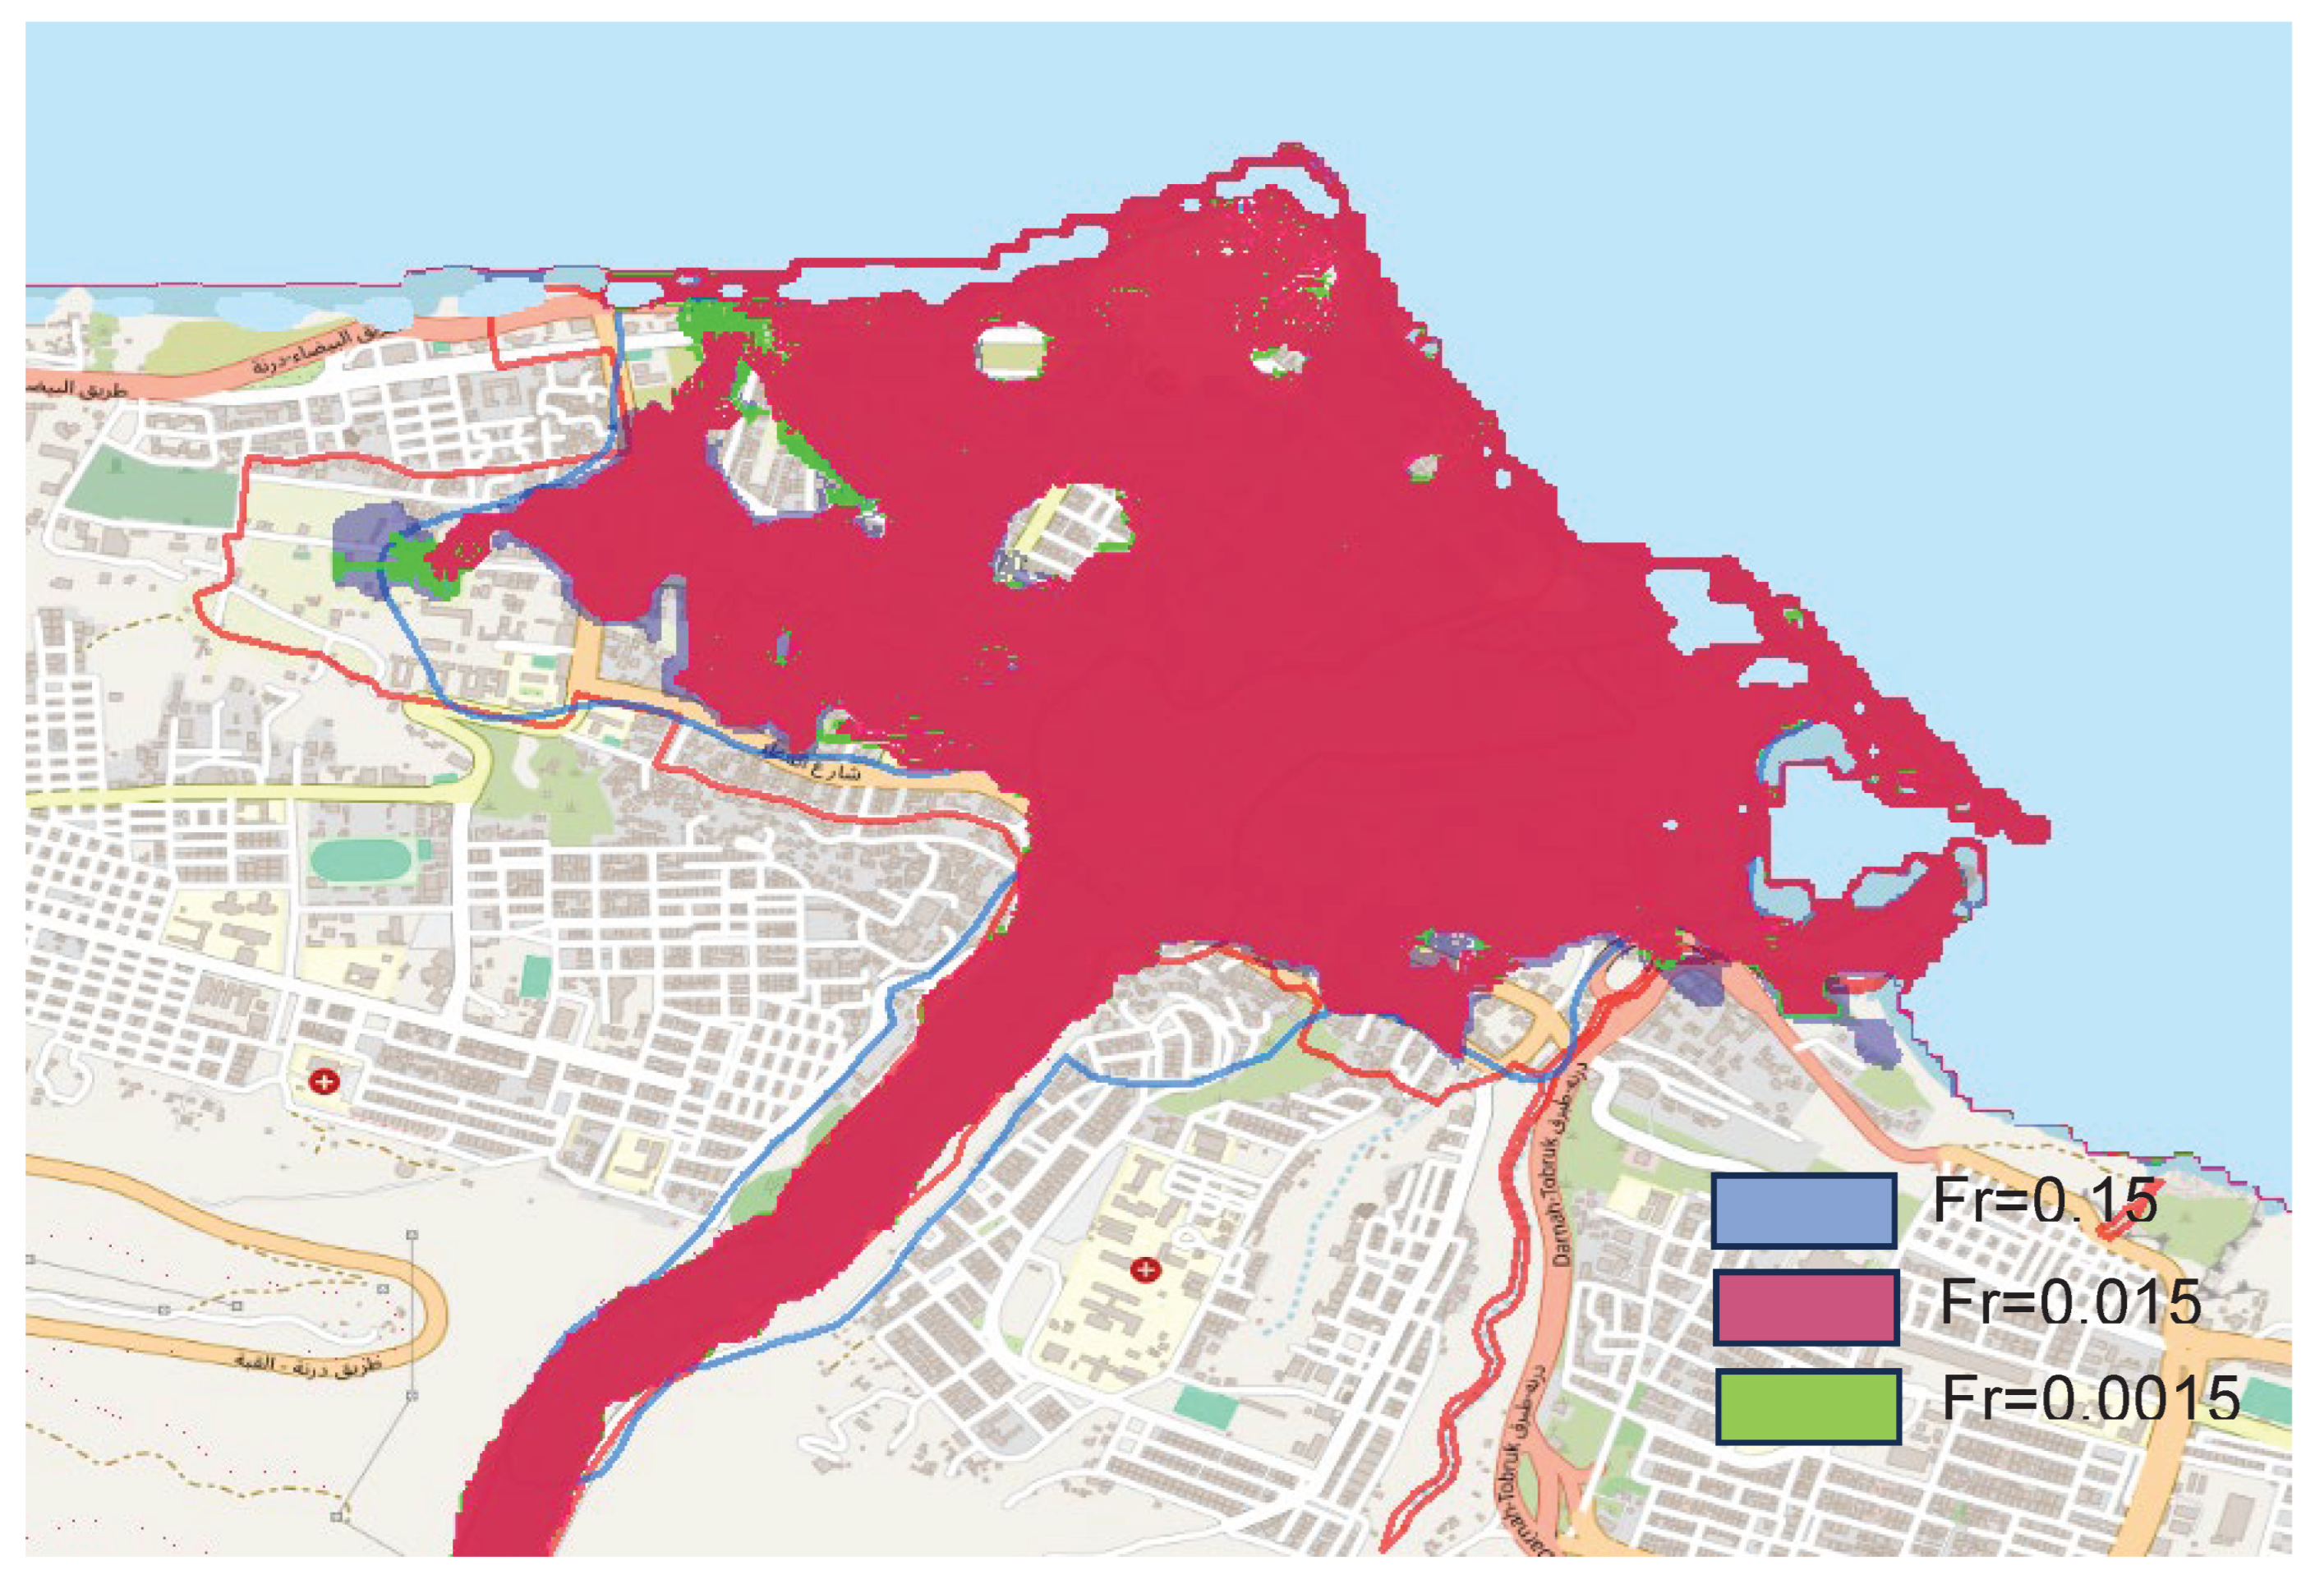
Figure 20.
Effect of break width on the peak flow and the arrival time at Derna city entrance.
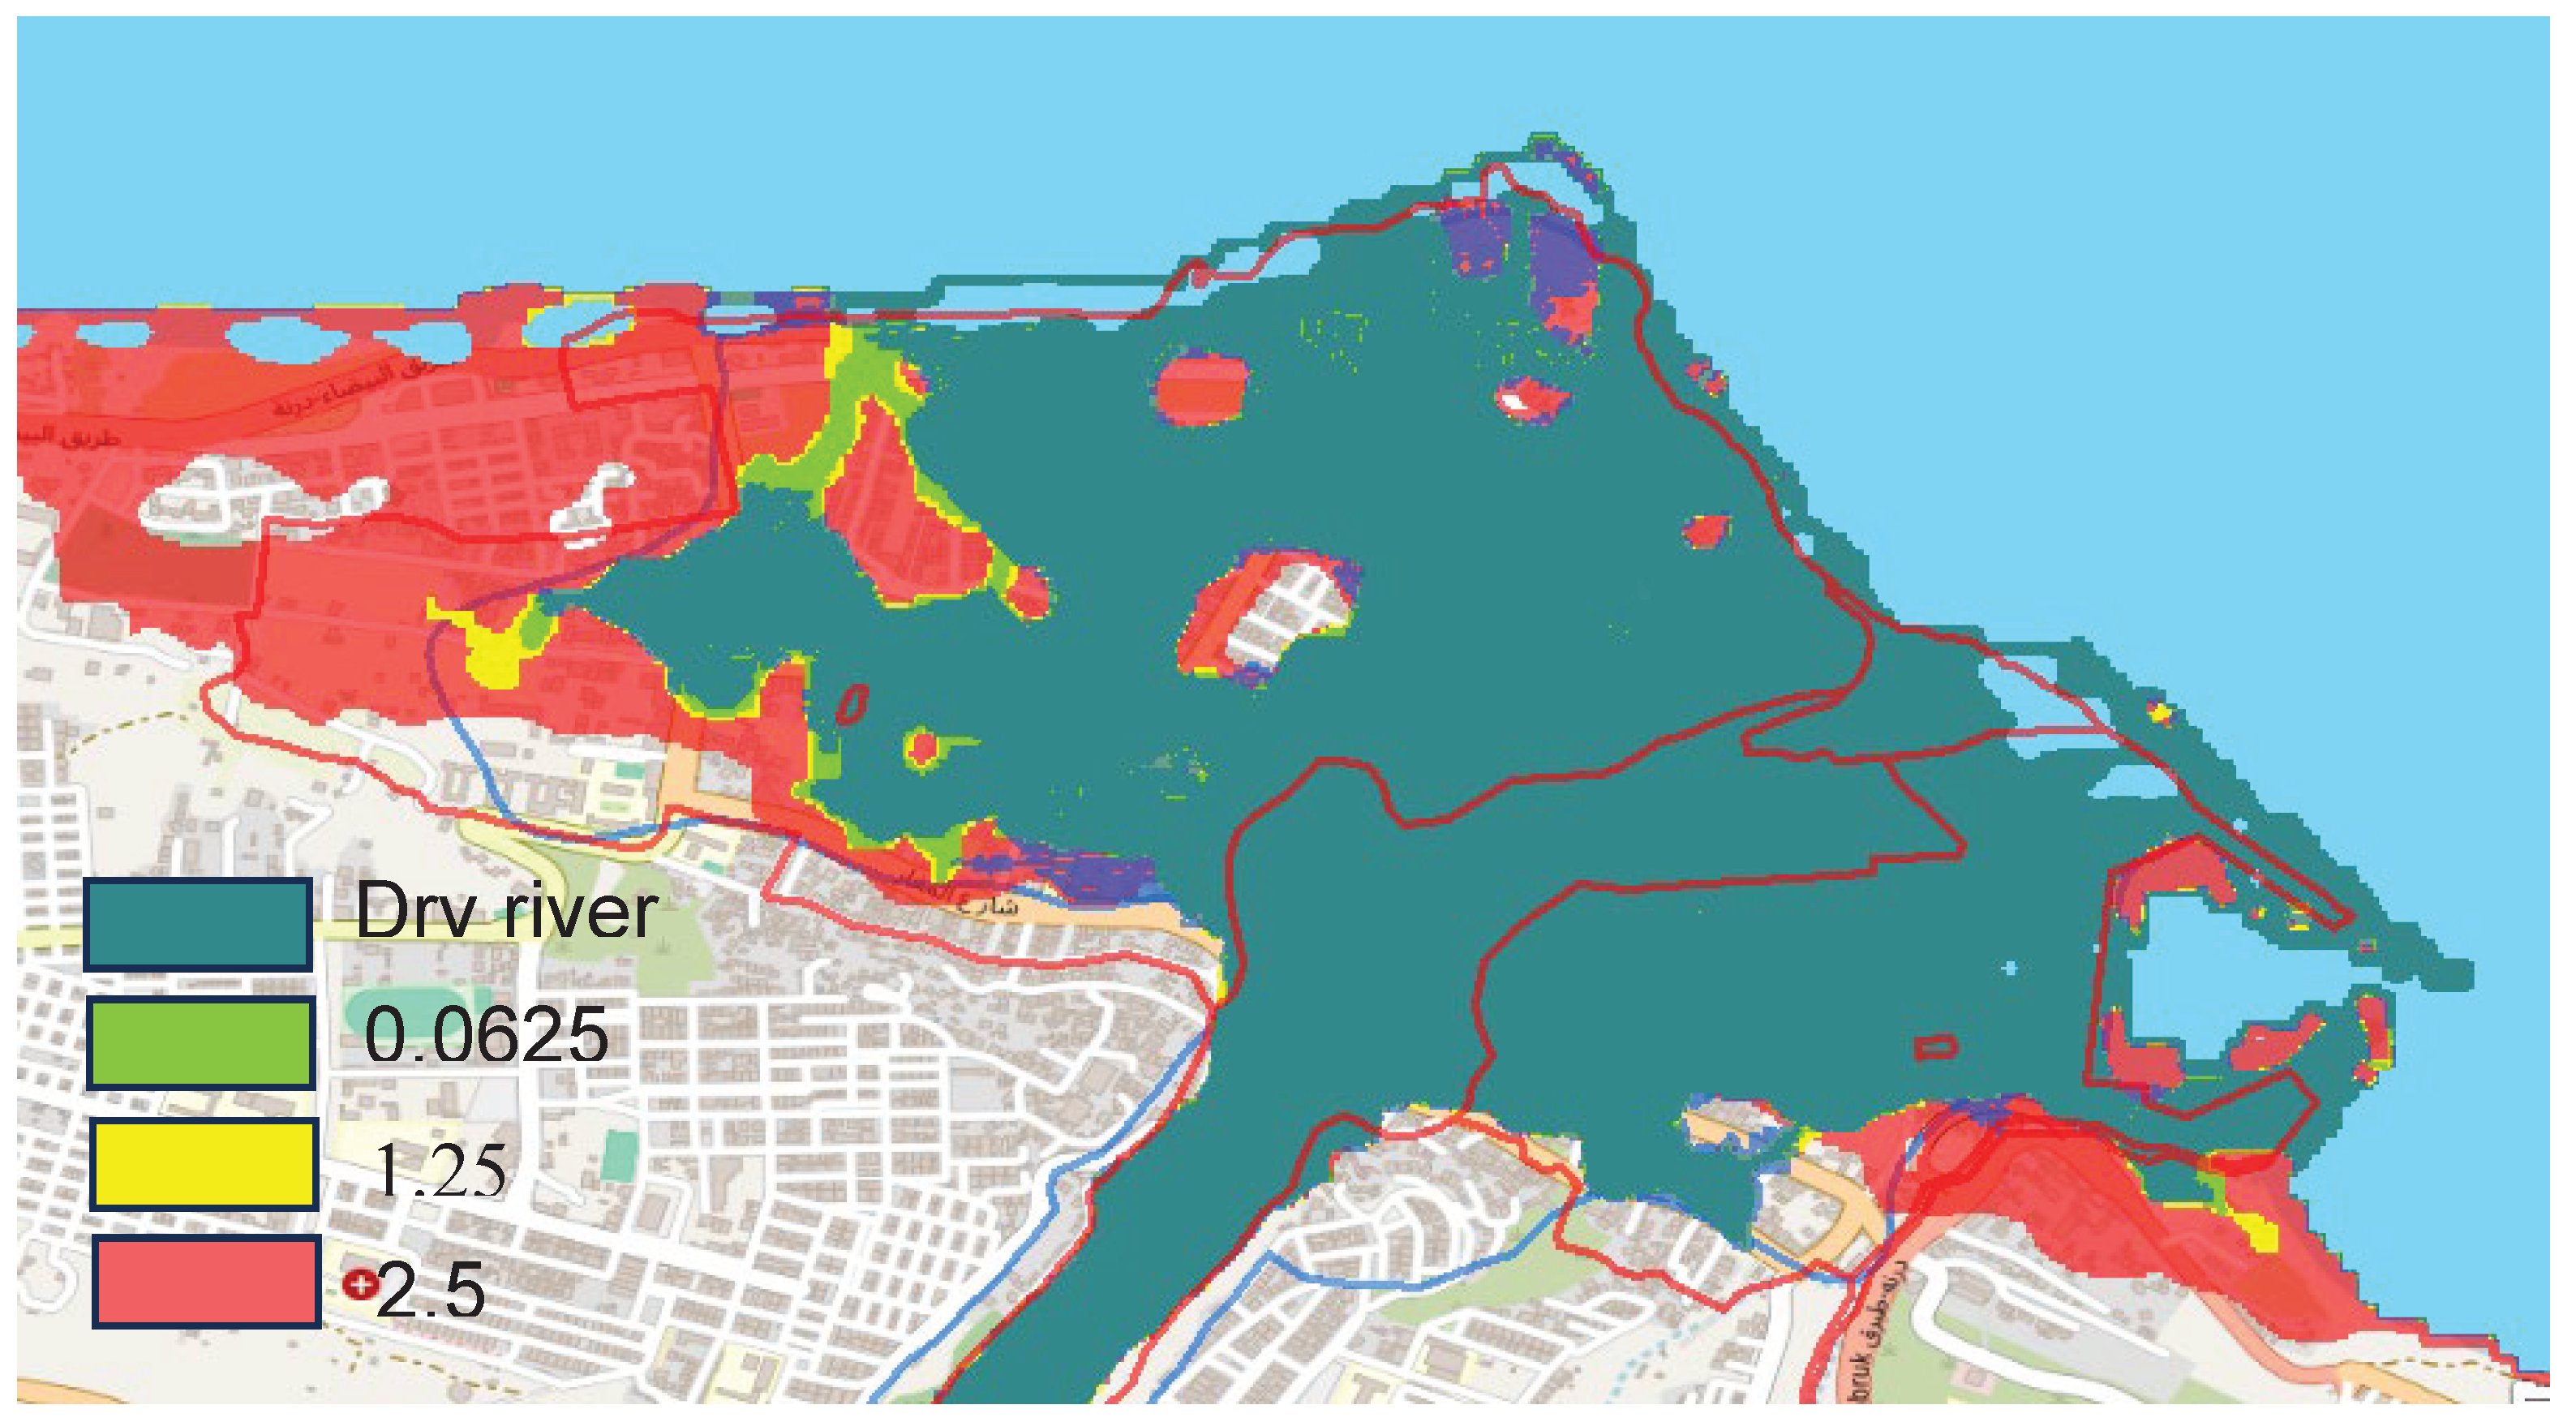
However, the effect on the downstream inundation is that as the level of the river increases, the inundation is more extended, Figure 22.
Figure 22.
Effect of the presence of the river downstream the dam.
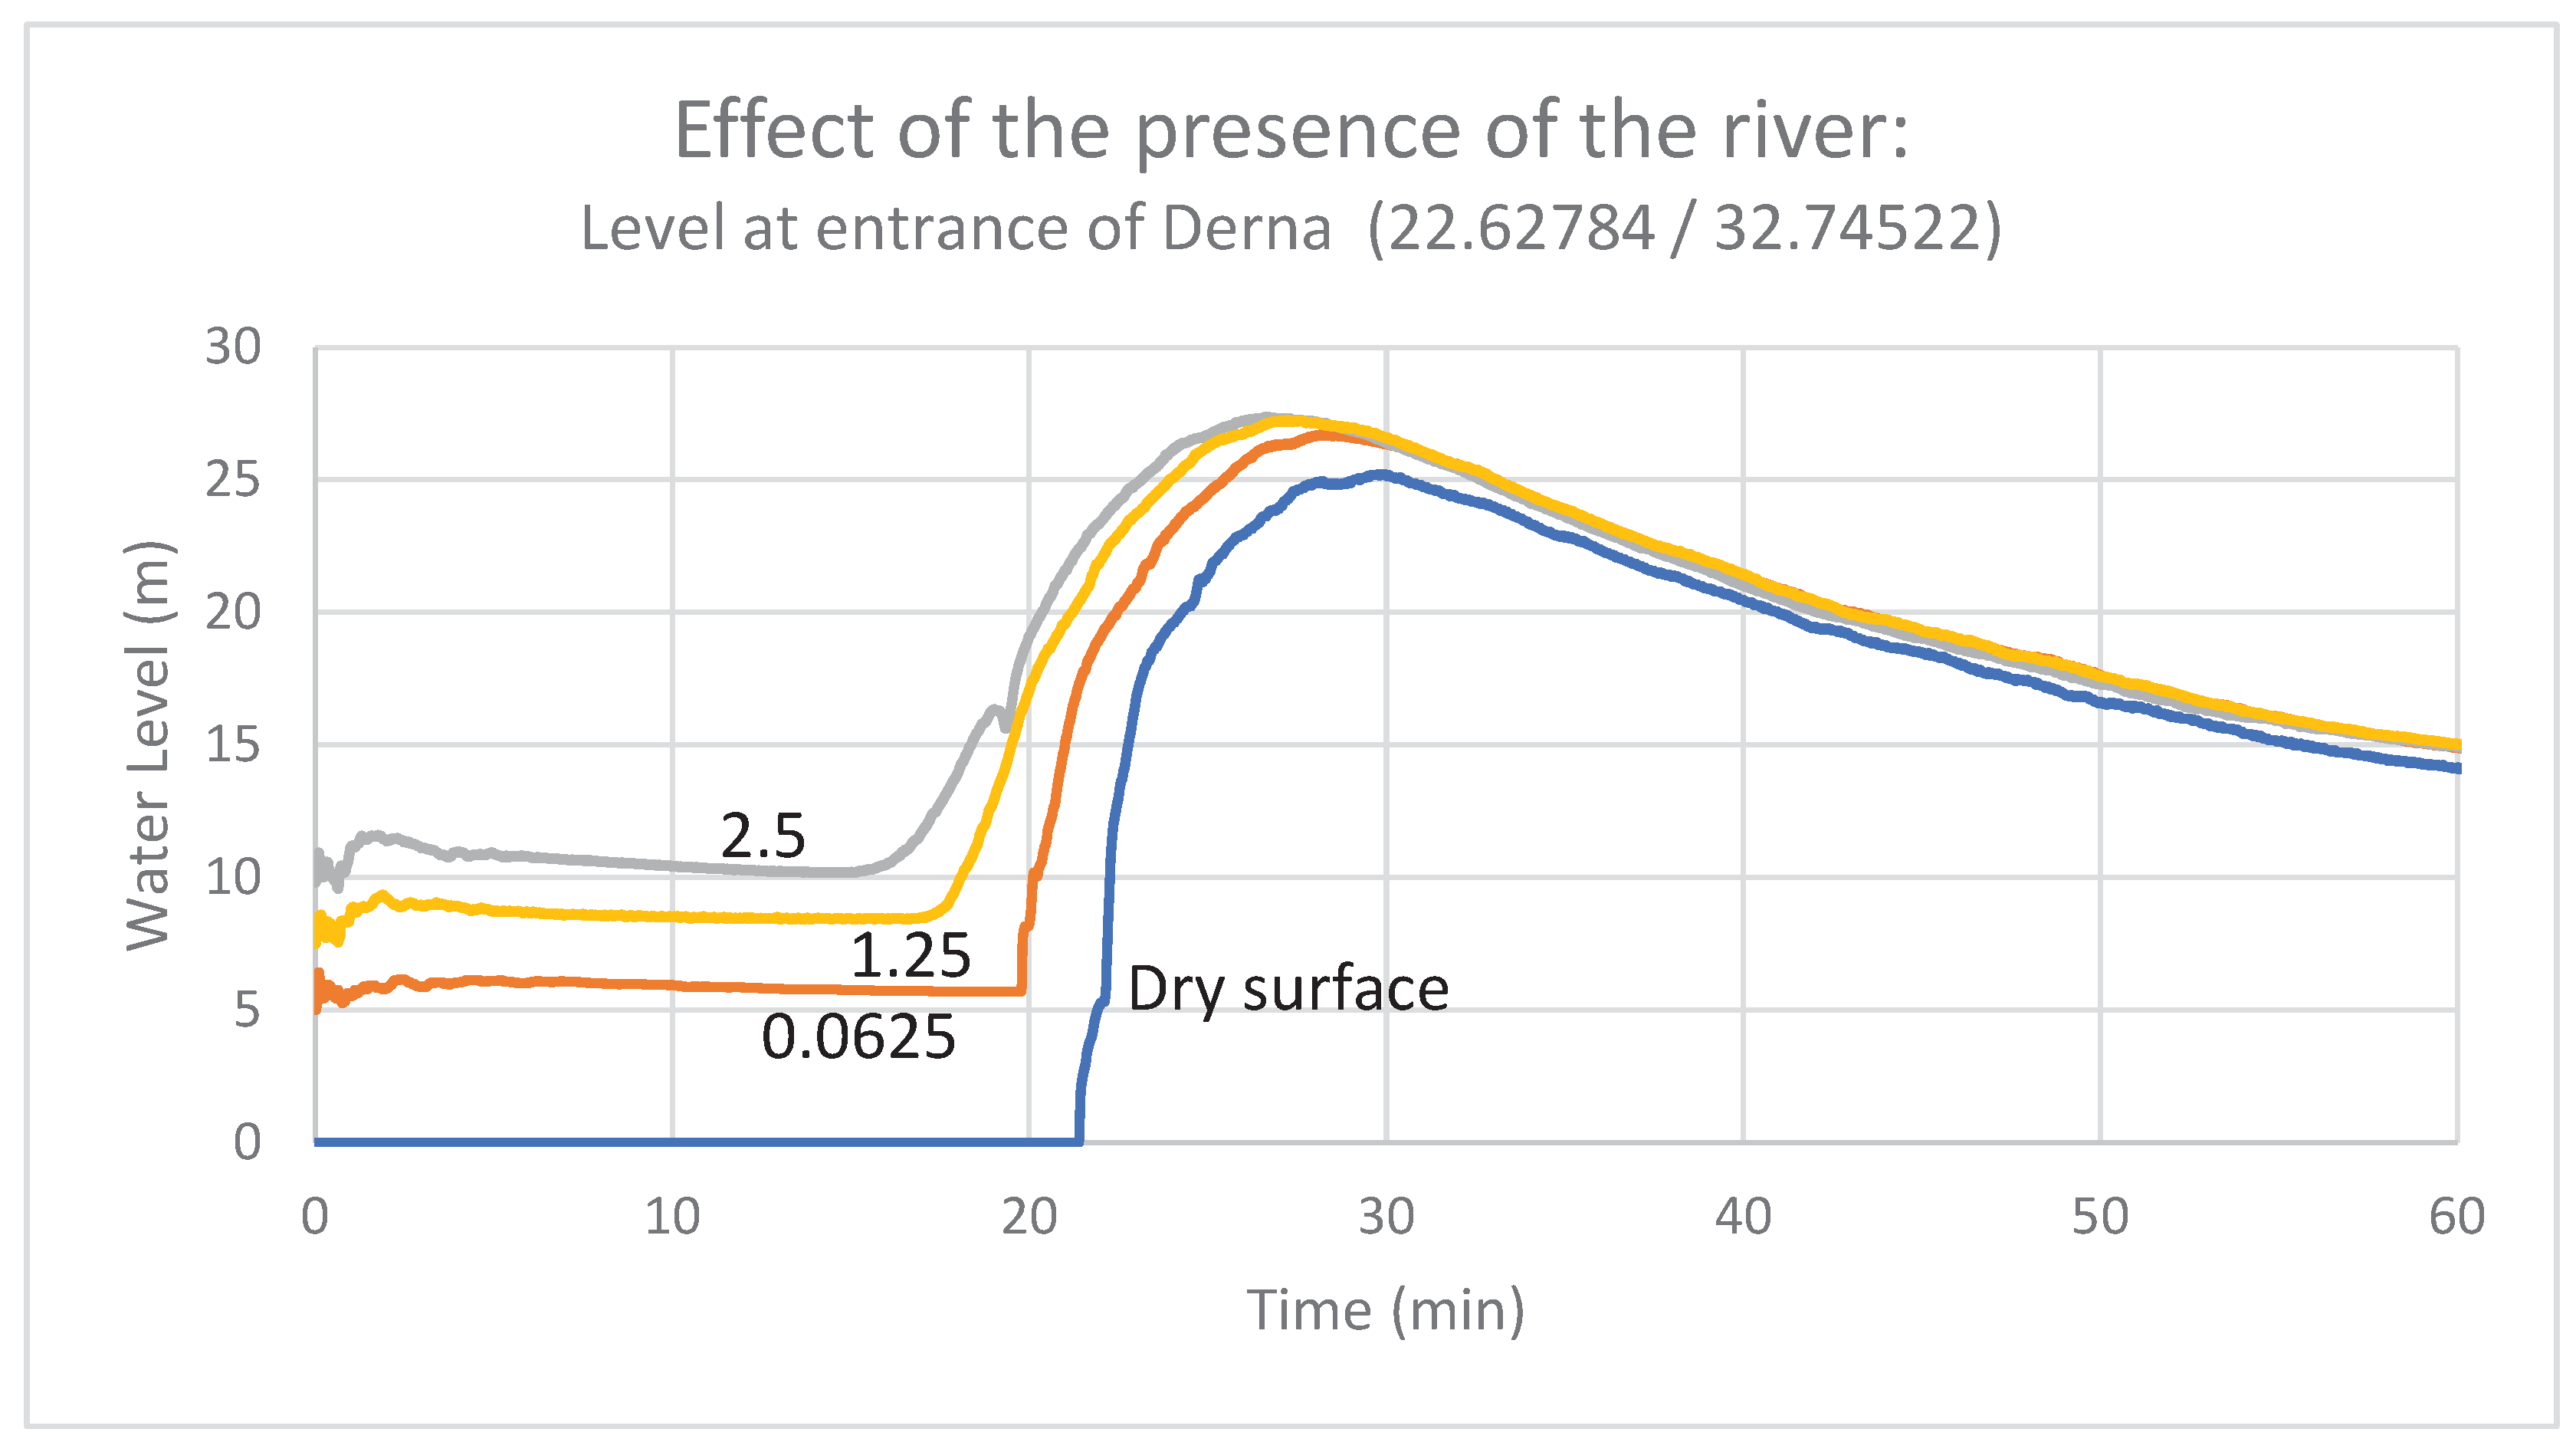
Figure 23.
Effect of river flow on Derna inundation.
4. Assessment of the Results Based on Field Reporting, Satellite Mapping and Social Media Analysis
To validate the modelling results, the following available data have been considered:
- -
- Field reporting;
- -
- Post event satellite mapping (source: Copernicus Emergency Management Service – Rapid Mapping);
The combined use of the available information allowed to perform a temporal and spatial validation.
4.1. Temporal Validation
Considering the full opening of the dam, the modelled flow takes approximately 27 minutes from the upstream dam to the closest urban area of Derna (see Figure 7). The sea is reached in around 40 minutes and the max flood extent in Derna is reached within 60 minutes.
These values are comparable in terms of order of magnitude with the testimonies collected by the Union Civil Protection Teams deployed in the field of “around 30 minutes time” for the first arrival of the flow in the city.
An additional component of the temporal validation is the measurement of the speed at which the flow depth increases over time. To perform an assessment of this key component, an image collection and analysis of the post-event damages has been performed, to extract the water depth in specific locations.
Figure 24.
Flood arrival time in Derna and the graphs for selected locations.
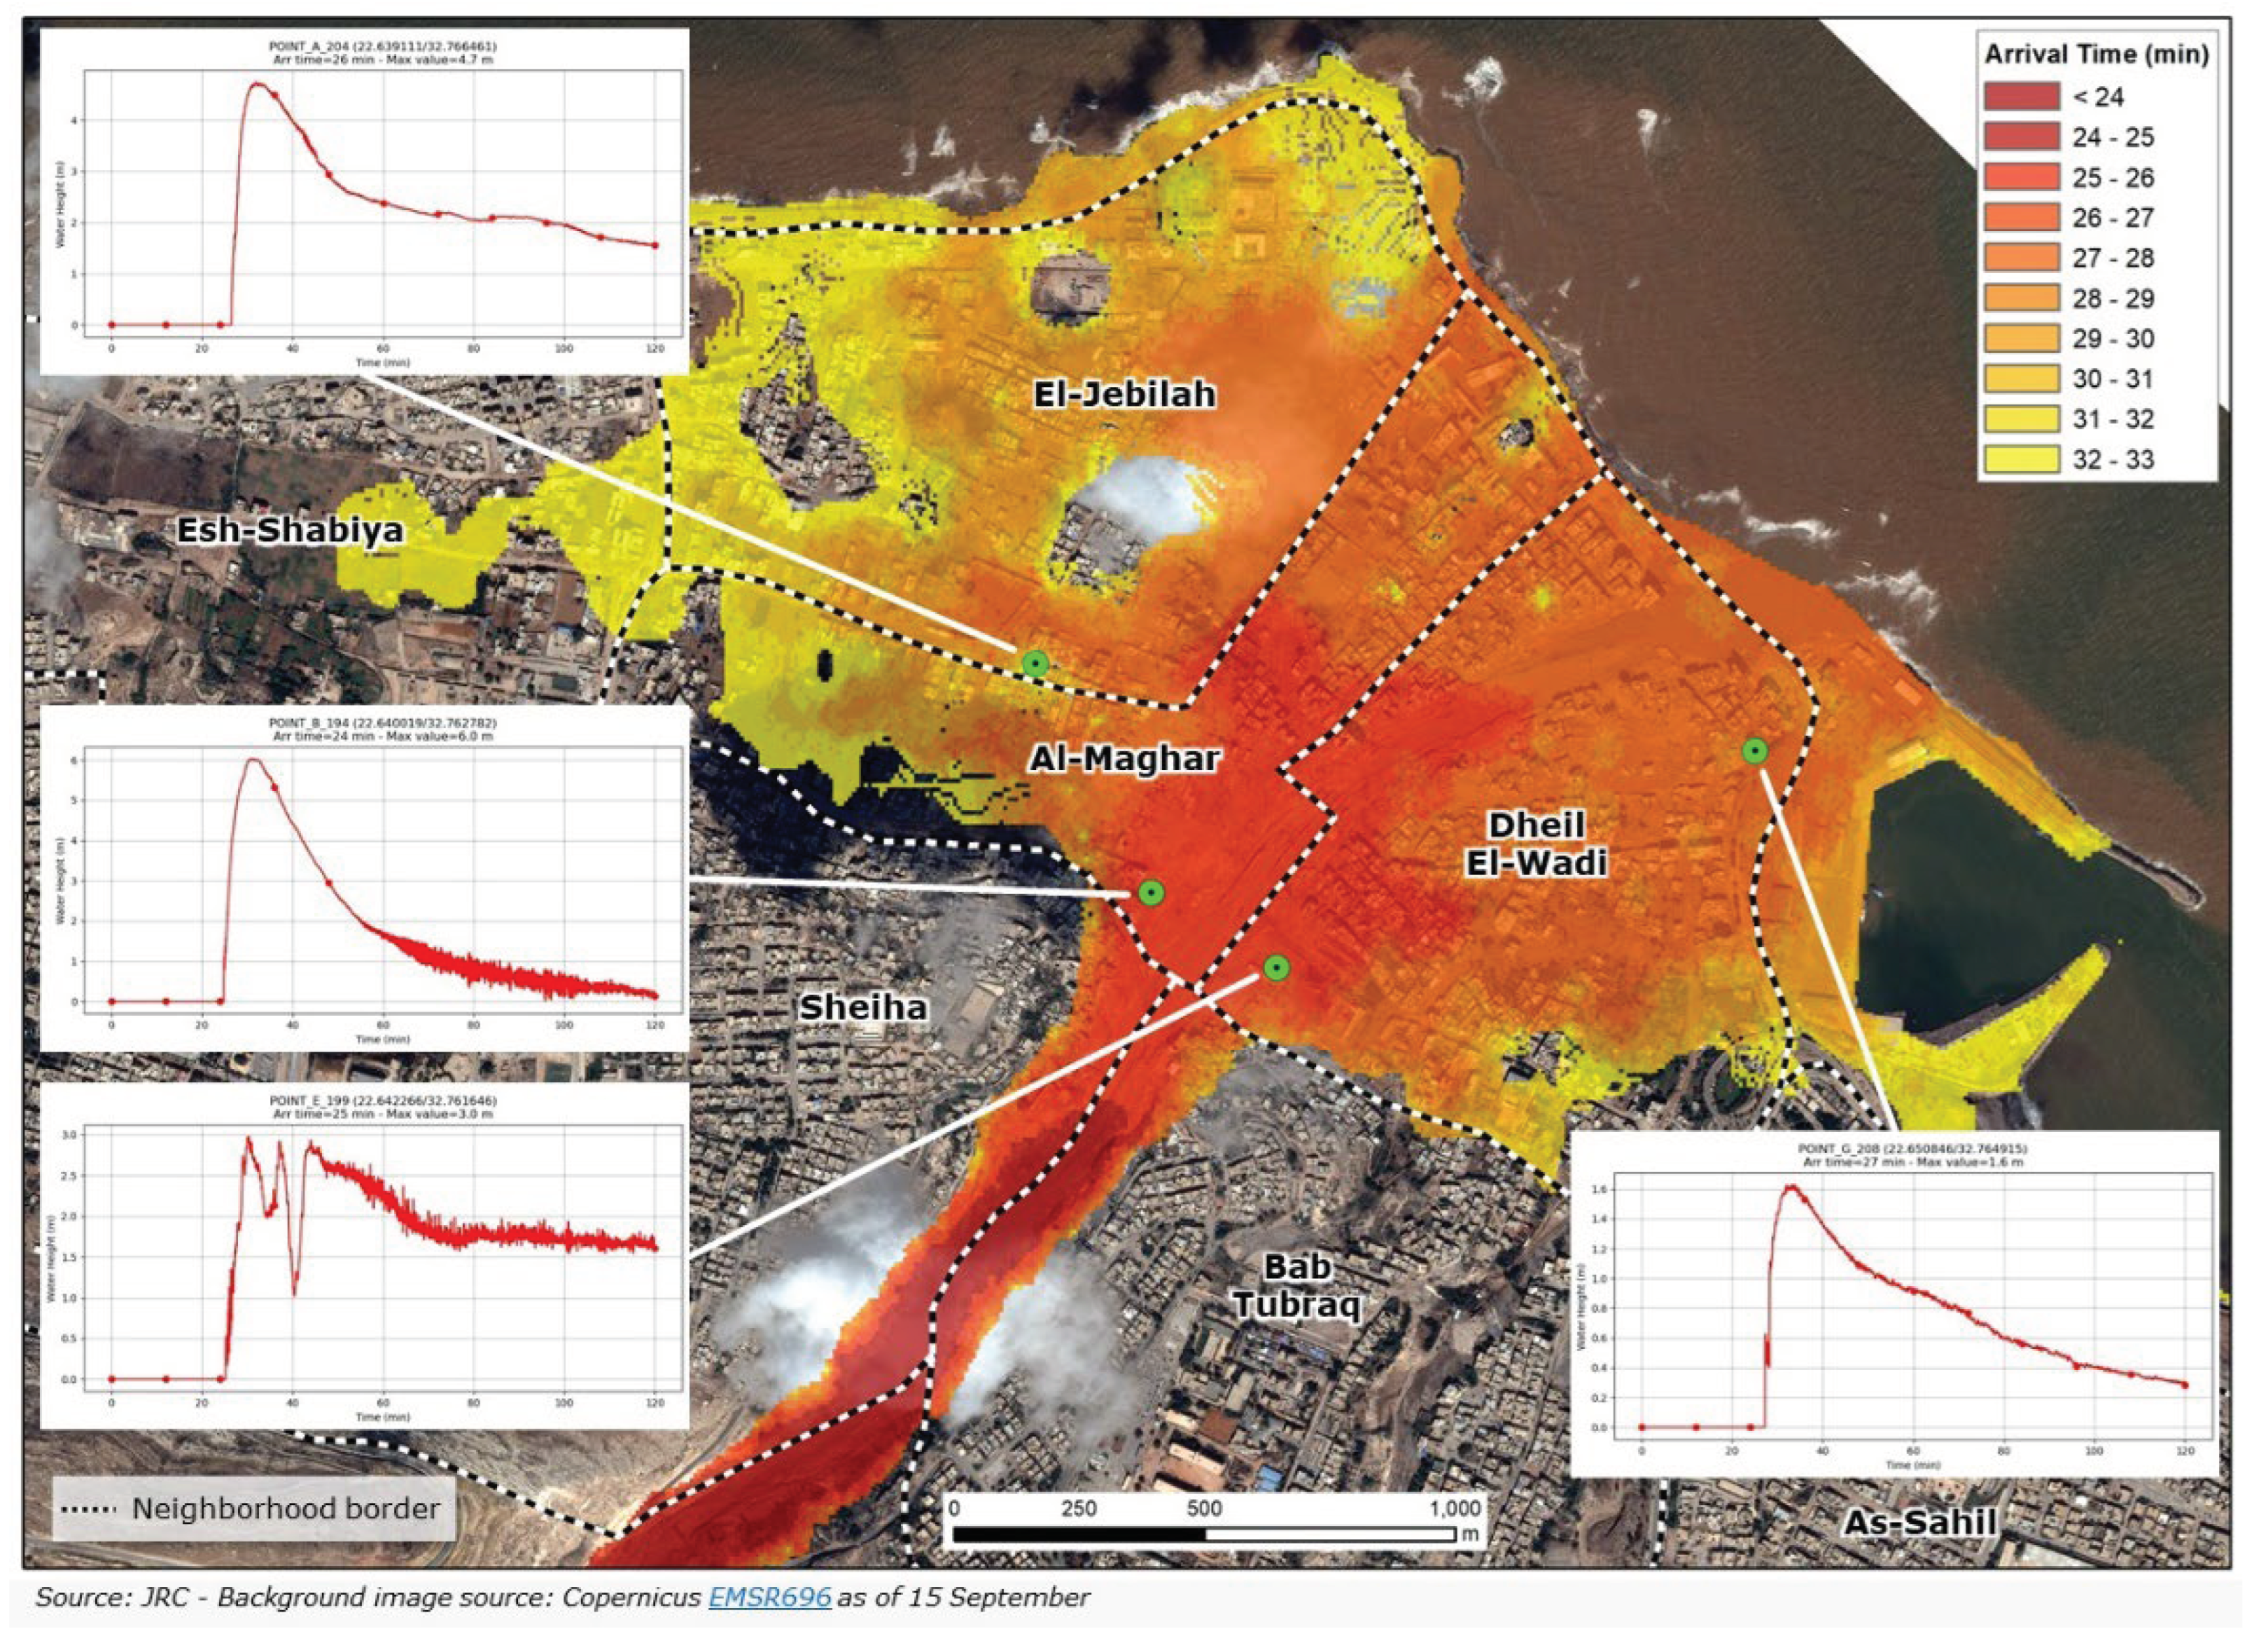
Data from security camera in the neighborhood of Al Maghar, which was the most affected in terms of flood extent and impact, showed an increase of around two meters in less than one minute4. When comparing this value with the charts in Figure 8, which represent the outcome from the simulation for Al-Maghar neighborhood, the order of magnitude is confirmed.
4.2. Flow Depth
In general, the recognition of the flow depth should be performed following precise rules such as in the case of Post Event Tsunami Assessment, with teams on the field that measure the height of the flood respect to a common reference height. In this case this was impossible, given the devastating impact and the socio-political situation. Therefore a novel method, based on social media derived images analysis was performed.
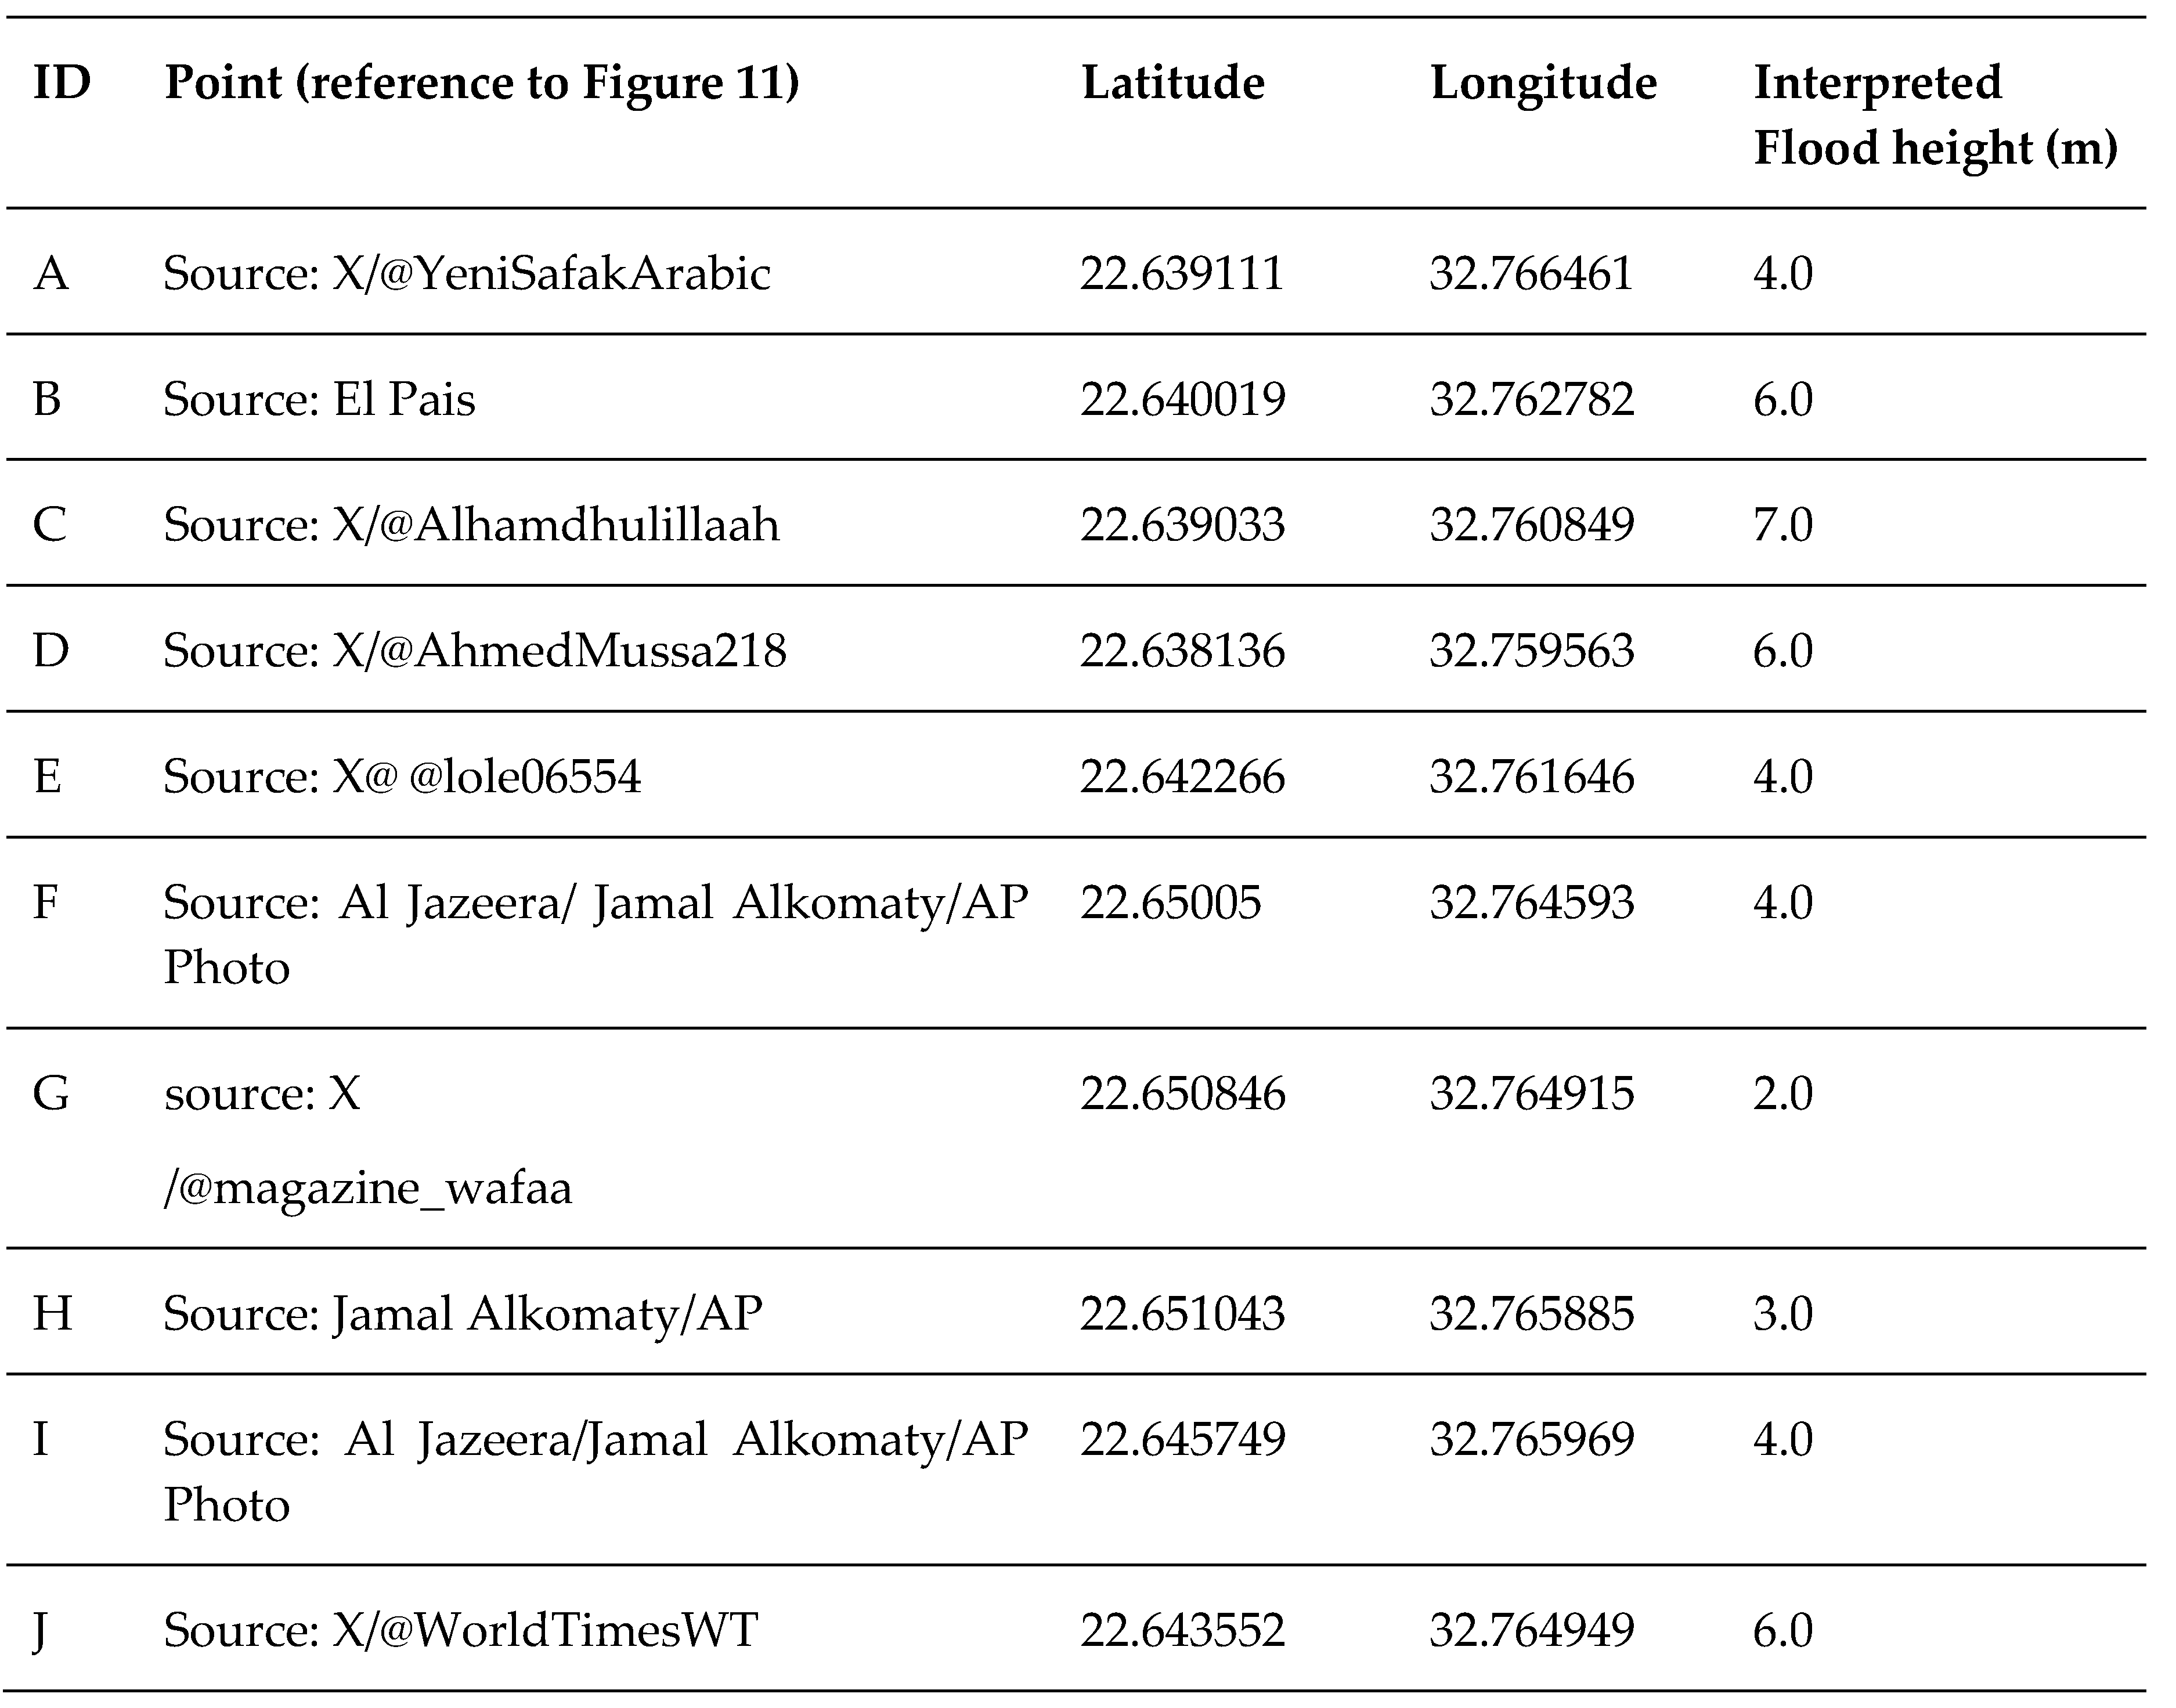
In order to determine the accuracy of the flow depth in the modelling, certain recognizable points were identified and the flow depth was estimated by visually examining post-event images of these points. The extraction of these images from social media was done using artificial intelligence techniques applied to numerous flood-related images, and text mining was employed to extract images that contained information about water depth in the accompanying text. The water depth was visually interpreted and compared to the values obtained from the modelling. The comparison revealed that the flood depth was generally underestimated, which could be attributed to the same reasoning behind the lower water extent mentioned earlier. Additionally, it is important to note that the modelling does not account for the splash effects that lead to higher flood depths along the buildings at the forefront of the flood wave, similar to the effect seen in tsunami waves (see Figure 10). The result of this assessment is presented in the Figure 25 and Figure 26.
The comparison performed via visual interpretation of the images lead to an average underestimation of the flood depth of around 13% with the 230 m and 17 % with the 225 m case.
Table 5.
List of the selected locations and comparison of the flood depth.(Appendix B shows the source of each image analysed).
Table 5.
List of the selected locations and comparison of the flood depth.(Appendix B shows the source of each image analysed).
| ID | Latitude | Longitude | Interpreted Height (m) | Calc. Height case 230m (m) | Calc. Height case 225 m (m) | Difference case 230 m (%) | Difference case 225 m (%) |
|---|---|---|---|---|---|---|---|
| A | 22.639111 | 32.766461 | 4.0 | 4.7 | 4 | -18 | 15 |
| B | 22.640019 | 32.762782 | 6.0 | 6.0 | 4.7 | 0 | 22 |
| C | 22.639033 | 32.760849 | 7.0 | 8.5 | 6.8 | -21 | 20 |
| D | 22.638136 | 32.759563 | 6.0 | 7.1 | 5.3 | -18 | 25 |
| E | 22.642266 | 32.761646 | 4.0 | 3 | 2.9 | 25 | 3 |
| F | 22.65005 | 32.764593 | 4.0 | 3.5 | 3.1 | 13 | 11 |
| G | 22.650846 | 32.764915 | 2.0 | 1.6 | 1.4 | 20 | 13 |
| H | 22.651043 | 32.765885 | 3.0 | 1.7 | 1.3 | 43 | 24 |
| I | 22.645749 | 32.765969 | 4.0 | 2.4 | 2.1 | 40 | 13 |
| J | 22.643552 | 32.764949 | 6.0 | 3.5 | 2.8 | 42 | 20 |
| Average Difference (%) | 13 | 17 | |||||
4.3. Flood Extent
For the extent of the inundation, please refer to Section 3.1.
4.4. Main Findings
The validation exercise of the Derna Dam breach scenario with satellite mapping, media and social media images and field observations allowed to detect the following observations:
Temporal Validation:
Arrival time: the exact time of the dam breach was not available, so the approximated value of 30 minutes arrival time in Derna collected from the field was considered. Therefore, the modelled arrival time in Derna of 27 minutes can be considered a very good estimation.
Velocity of the increase in flow depth: the observed velocity in the increase of the flood height has been detected from the social media data for key observation points: El-Maghar neighborhood, the Al Sahaba Mosque and other key detectable points. In the most affected area (the neighborhood of Al Maghar and the Mosque) the increase rate is about 2 meters in around 1 minute. This value is in the same order of magnitude of the modelled increase in flow depth extracted for the same observation points.
Spatial Validation:
Flood extent: the modelled flood extent in Derna, compared to the post event satellite mapping, is around 50 hectares smaller. This is considered acceptable because the model does not account for the contribution of rainfall and the rain accumulated in the minor downstream dam; moreover, the model only considers surfaces with a water depth greater than 10 cm as flooded.
Flood depth: the automatic extraction of images from social media has been performed combining artificial intelligence applied to thousands of images reproducing flood situations, and text mining, to extract the images reproducing flood with the water depth information associated in the text. The water depth has been visually interpreted and the estimated depth has been compared to the values obtained from modelling. The comparison allowed to confirm the order of magnitude.
4. Conclusions
Analysing the estimated behavior of the Derna flooding yields several key findings.
In most cases, the arrival time to the city of Derna ranged between 15 and 30 minutes, making it practically impossible to alert the population. The lack of active Early Warning Systems, as seen in many modern dams, automatically activated by rising level downstream the dam or decreasing level upstream the dam was not available. Even if such systems were in place, the short warning time would have rendered the disaster unavoidable. Additionally, as the rupture time is unknown, assessing precisely the wave’s time of arrival was not feasible.
Comparing the estimated inundation extent by the various cases with the delineation by UNOSAT and Copernicus revealed that most of the flooded area was identified, accounting for approximately 76 to 80% of the total. However, in one instance with very high initial river flow, the inundation was extensive and exceeded the estimates fromsatellite images. Moreover, [flood height and arrival time]. The analysis allowed to detect the plausible water height of the reservoir between 225-230 m, meaning that the dam breach occurred when the reservoir was at its full capacity.
Overall, the analysis demonstrated that rapid analysis is possible, and the inundation extent determined using this technique is sufficiently accurate to provide initial evaluation of the impact. For more precise assessment, acquiring detailed topography up to 1m resolution, such us through drone flights equipped with lidar instrumentation, would be necessary. In the case of Casamicciola landslide (Ischia, Italy), Copernicus drone flights obtained post-event 5 cm resolution Digital Terrain Model in two days’ time [19]. Despite the lack of precise local measures, a validation exercise using satellite and social media-derived images confirmed that the accuracy of the temporal and spatial assessment.
In conclusion, this type of rapid analysis of dam break events approves to be a suitable method for promptly estimating the impact of such events. Incorporating sensitivity analyses can provide an overall estimate of the uncertainties associated with the unknown parameters of the cases.
Acknowledgments
The author acknowledges Dr. Andrey Zaytsev for his efforts in establishing NAMI DANCE numerical structure and PhD candidate Bora Yalciner, for his outstanding success to develop GPU version of NAMI DANCE.
Appendix A. The Dam Break Platform
The Dam Break Platform (DBP) is a web application that streamlines and facilitates the estimation of the consequences of Dam Break events. It relies on several scripts that were published in this gitHub site, wrapped around a web tool that facilitates the preparation and running of a new event.
The dam break event preparation includes a number of actions to be performed, summarized here:
- definition of the domain area
- creation of the bathymetry area and identification of the lake
- definition of the break size, gauges points and other relevant parameters, such as the problem time
- running the case
- analysis
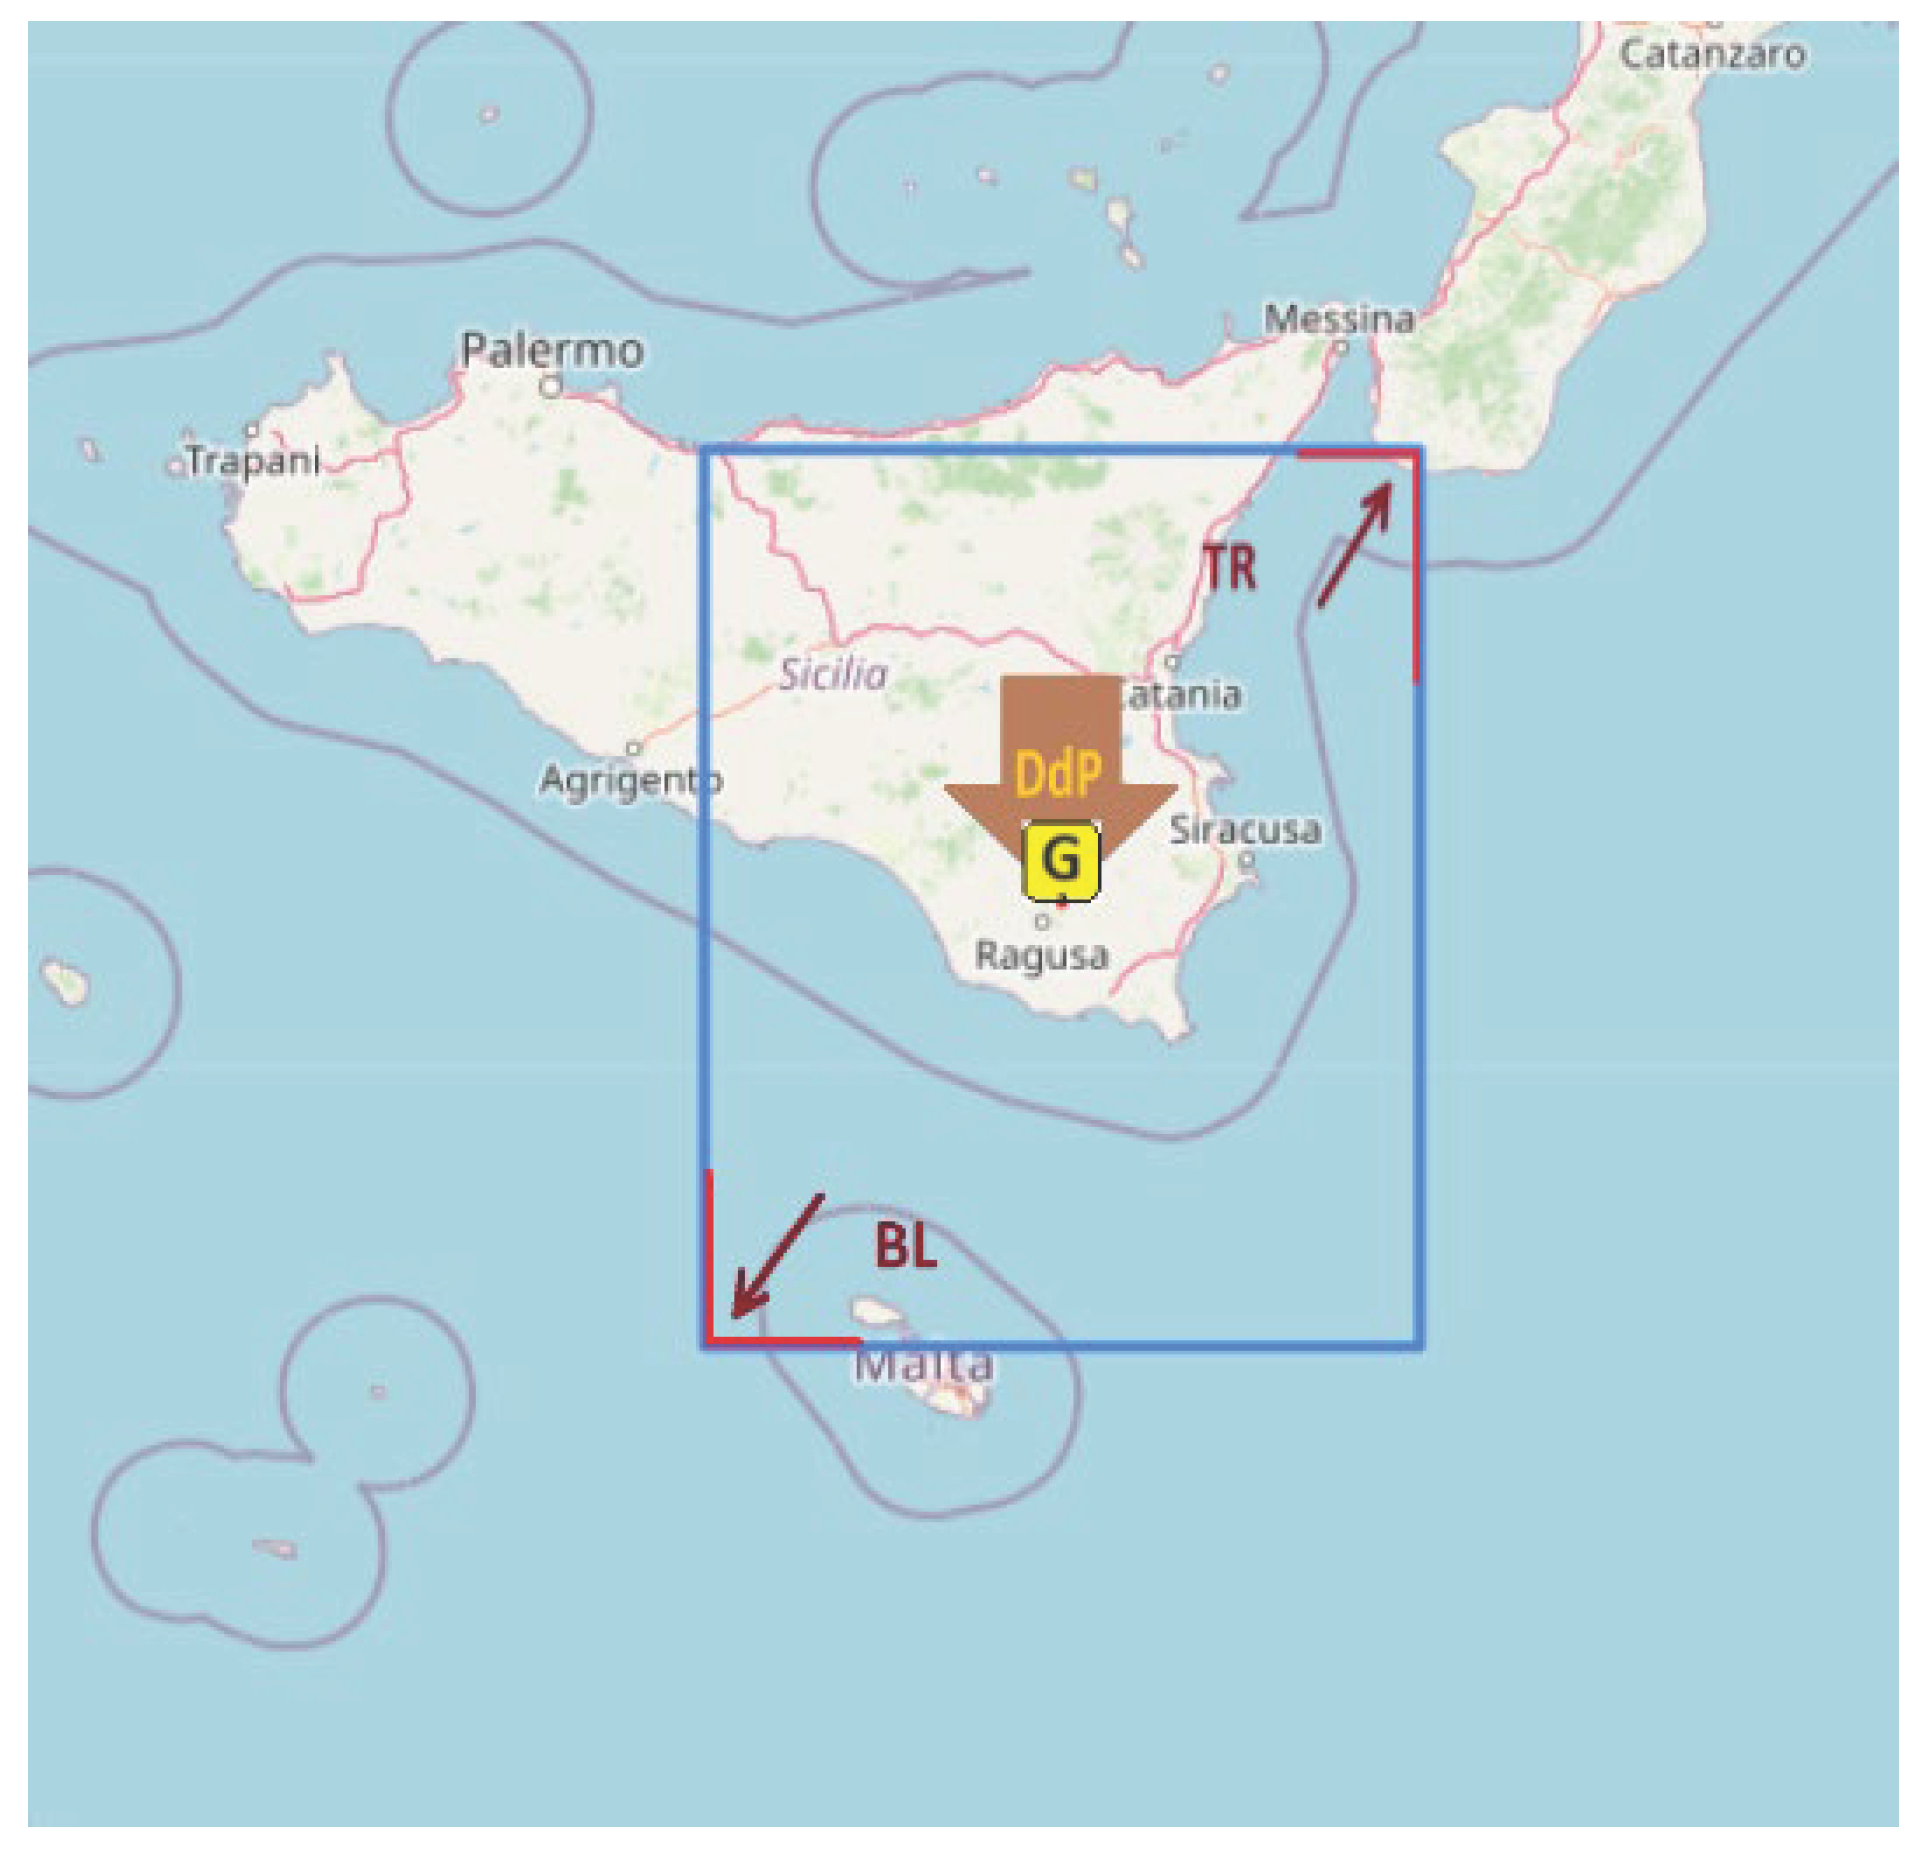
The domain area contains the whole lake upstram the dam and the expected flow path downstream. To select the domain area you can either define the bounding box filling the fields in the form or use the map and move the Bottom left and Top right icons that define the domain area. By default the domain is initialy set as +1 -1 degree in longitude and latitude but of course those limits are generally very exaggerated.
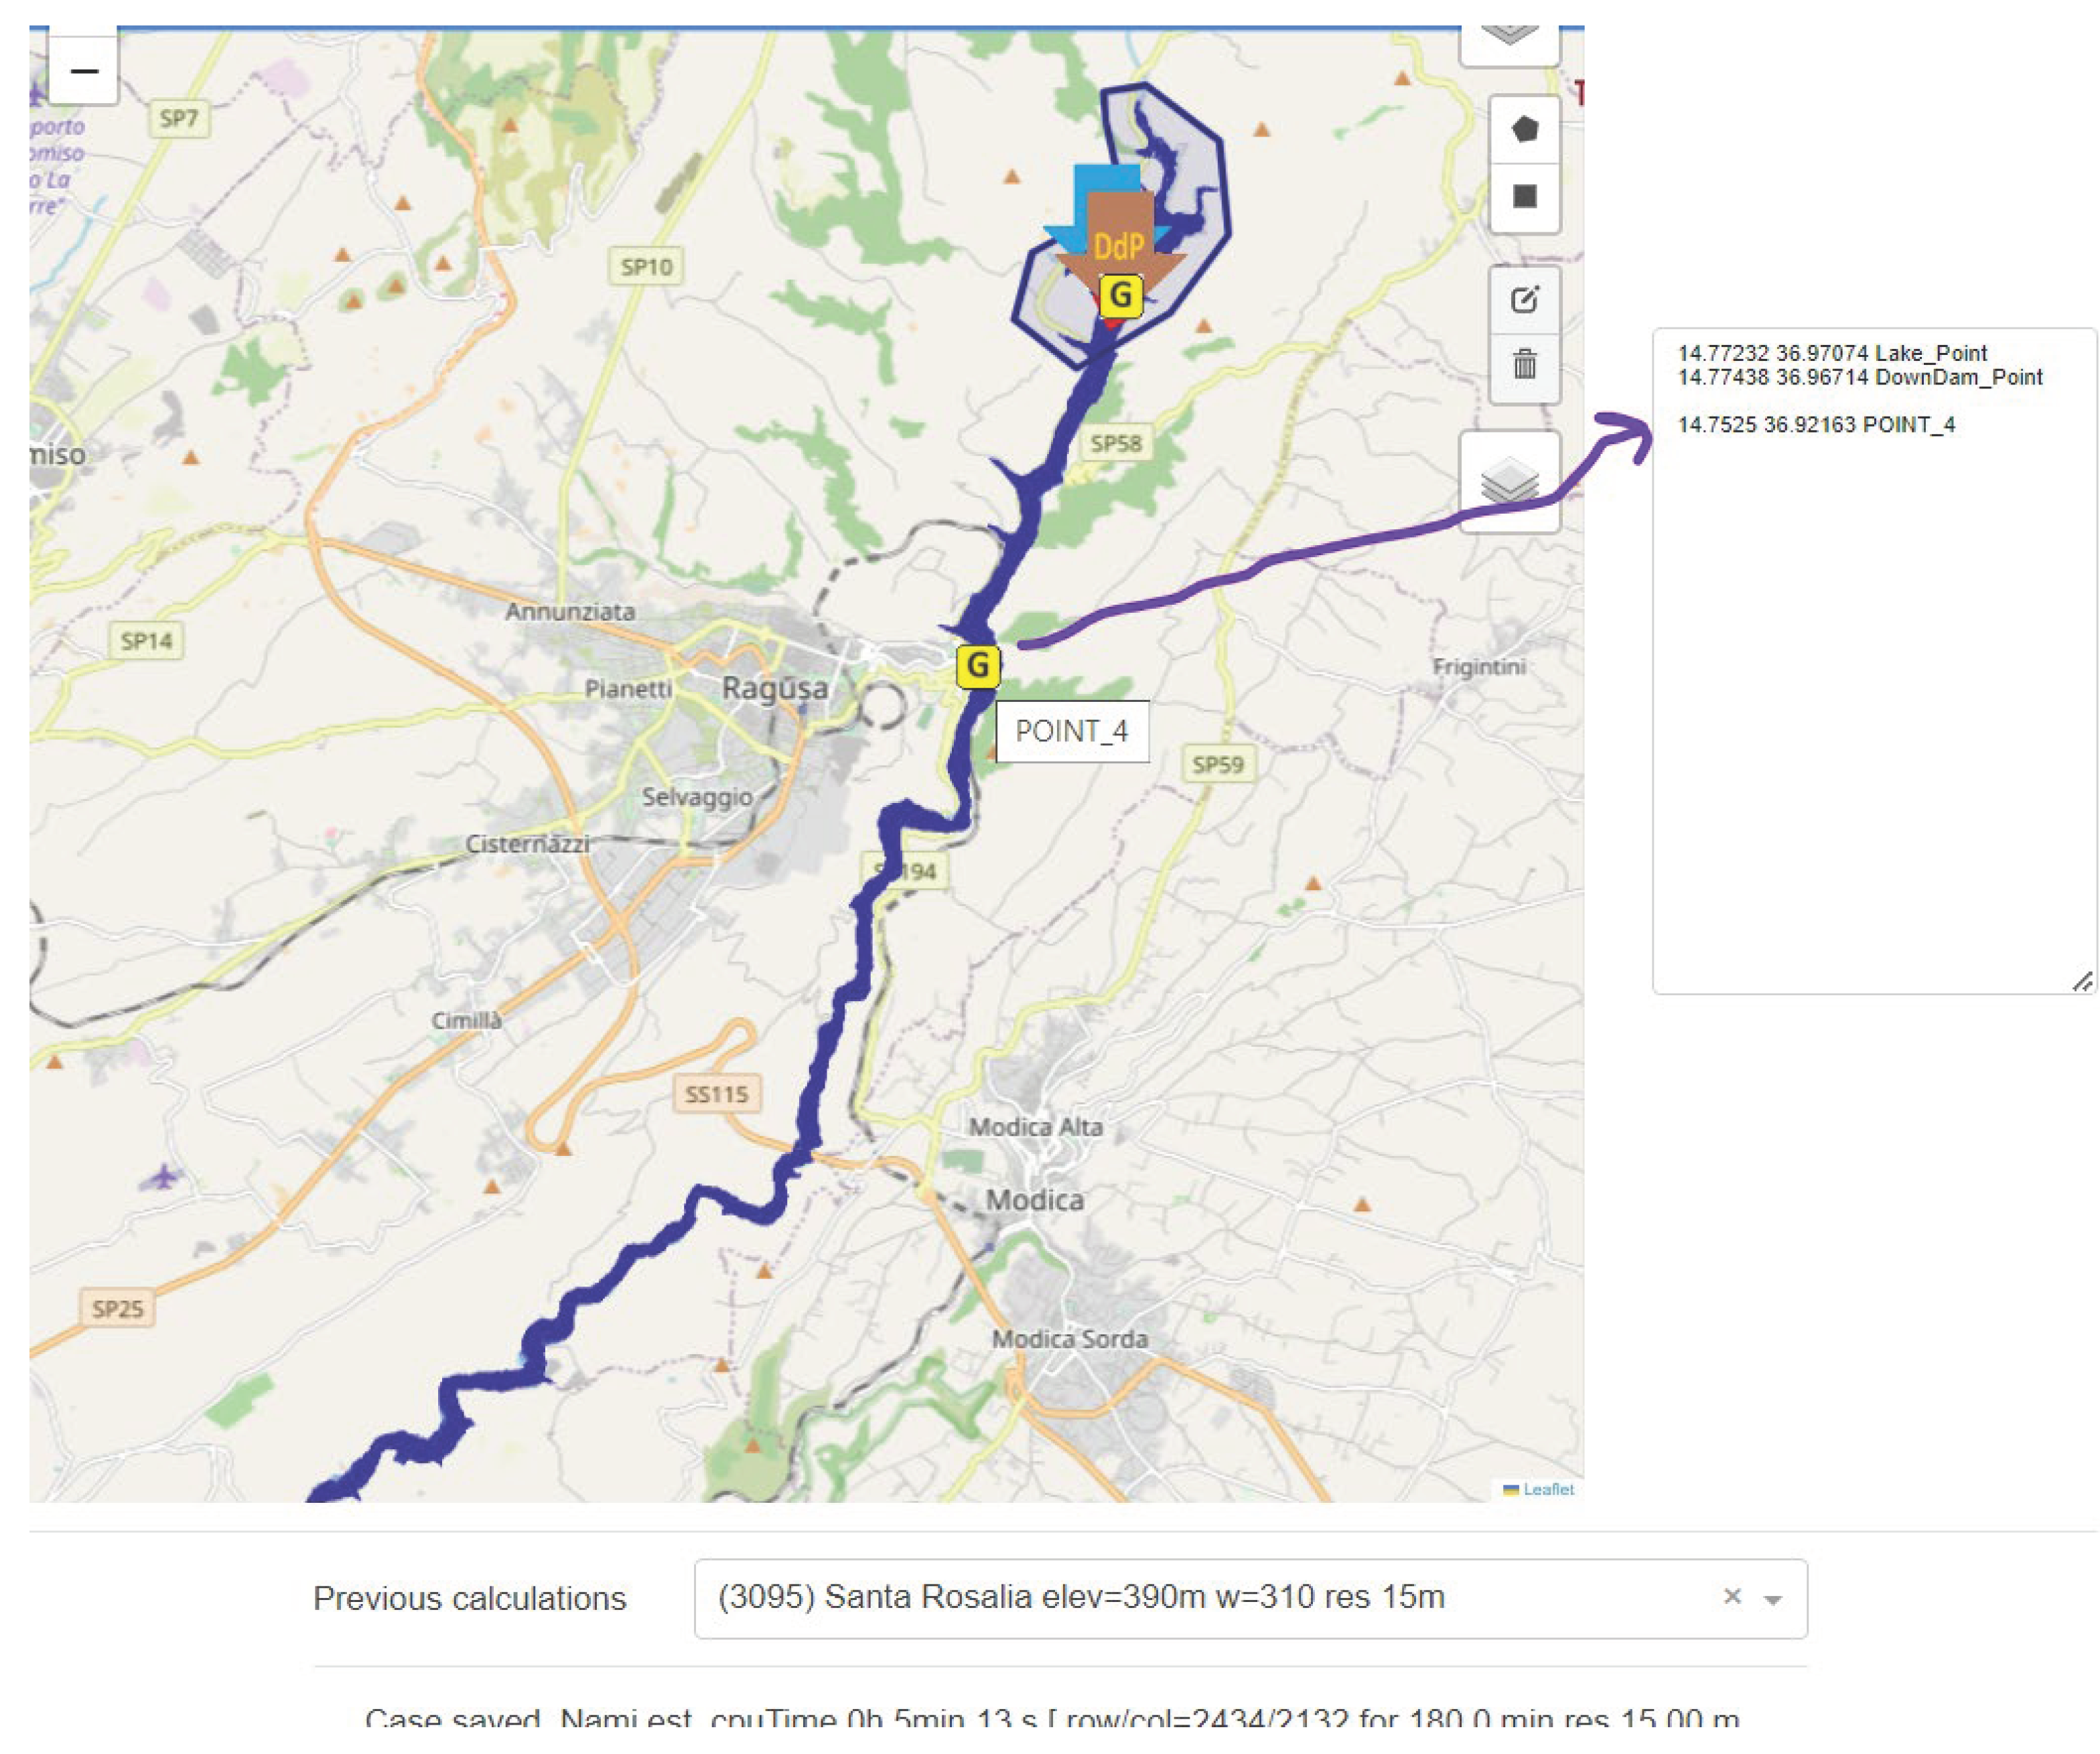
It is not mandatory but if you want to have the timelines at specific locations, you can define your own gauges.
This is done by clicking on the map; the point will appear on the right of the maop, the textbox on the right. Bt default the namingof the gauges is POINT_xxx but you can change it providing a more meaningful name. The selection of the gauge points is much easier if a previous case has been performed already because you can click on the areas affected.
Once the conditions are correct you can submit a calculation by pressung the Execute button
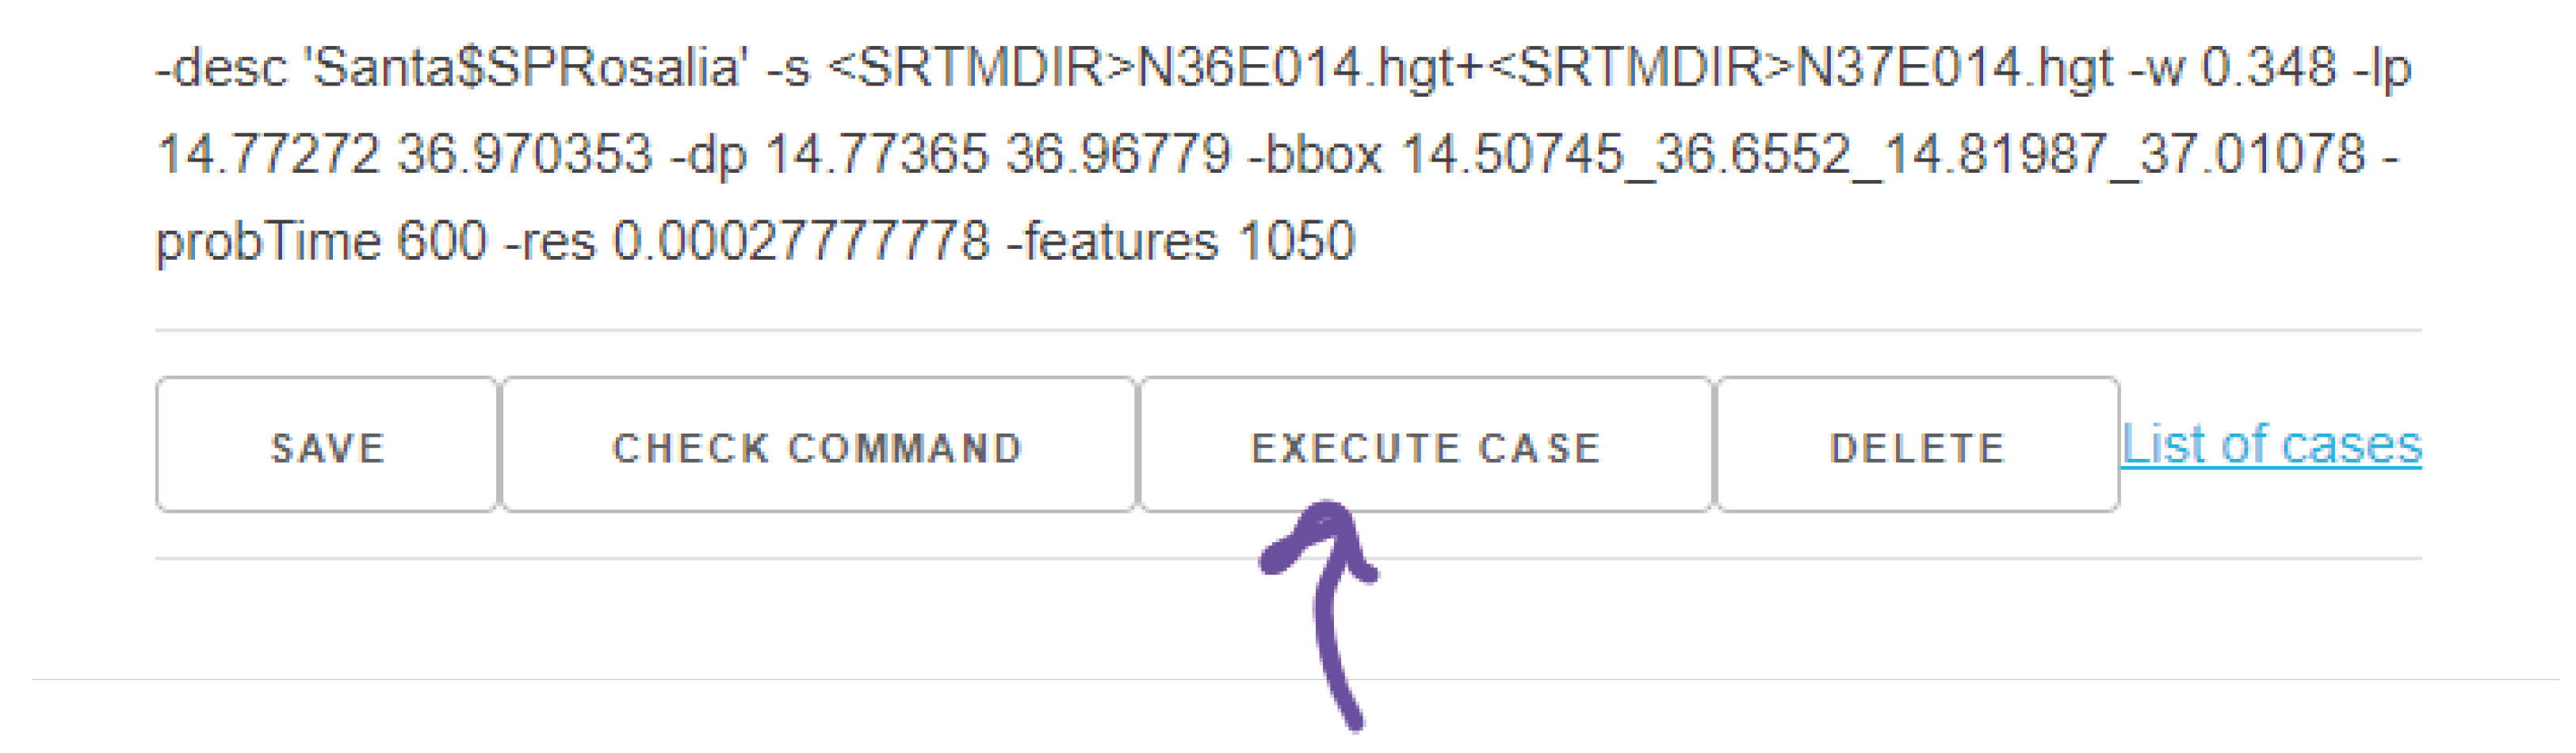
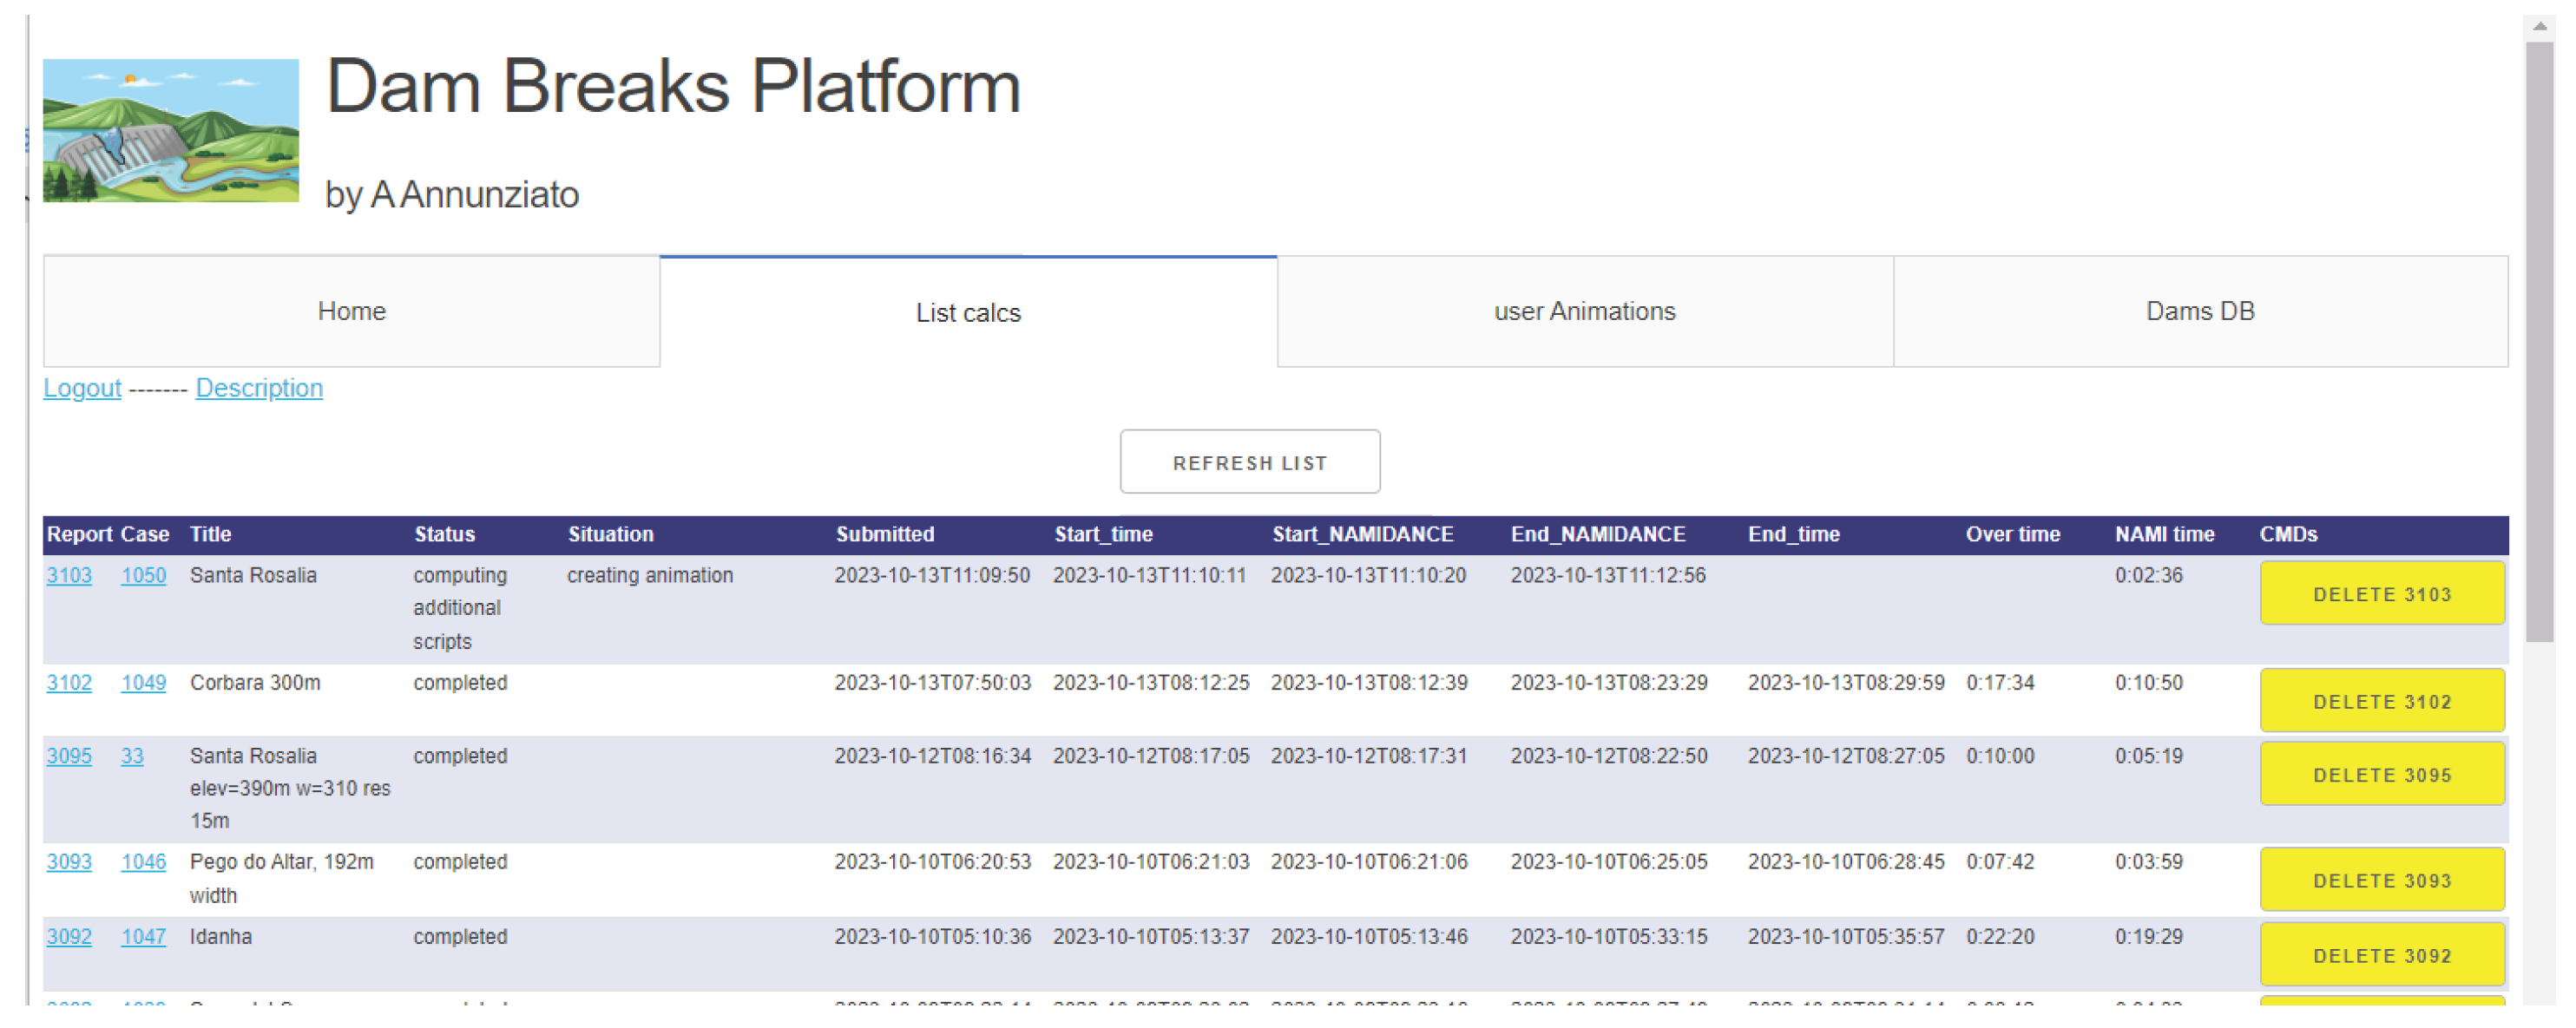
It is possible to follow the evolution of the calculations by selectibg the List Calcs tab that will show for each submitted calculation its status and other performance parameters.
The report for each computed calculation is organized in a number of sections
- Initial conditions and interactive map with overlay of Flow Depth and Arrival time
- Population involved according to 2 models (Landscan and GHSL)
- Impact maps with OSM and satellite images background
- Animation (takes some time to load)
- Timeline of the gauges
- Gauges plots
The report, saving from the browser as PDF is something like this: Calculation Report (click to open)
Appendix B. Source List for the Interpreted Images
References
- https://wmo.int/sites/default/files/2023-11/WMO%20Provisional%20State%20of%20the%20Global%20Climate%202023.pdf.
- https://reliefweb.int/report/libya/iom-libya-resilience-recovery-reconstruction-plan-storm-daniel-september-2023-september-2024.
- Pielke, R. Trends in Flooding in Africa. https://rogerpielkejr.substack.com/p/trends-in-flooding-in-africa.
- https://www.hidrotehnika.rs/en/libya/wadi-derna/ Technical data of the dams.
- Annunziato, A.; Guney Dogan, G.; Yalciner, A.C. Modeling Dam Break Events Using Shallow Water Model. Eng 2023, 4, 1851–1870. [Google Scholar] [CrossRef]
- Yalciner B, Zaytsev A. (2017) Assessment of efficiency and performance of tsunami numerical modeling with GPU. Abstract EGU2017–1246 Presented in European Geoscience Union, EGU April 2017. https://meetingorganizer.copernicus.org/EGU2017/EGU2017-1246.pdf. 20 April.
- Dogan, G. G., Annunziato, A., Hidayat, R., Husrin, S., Prasetya, G., Kongko, W., ... & Yalciner, A. C. (2021a). Numerical simulations of December 22, 2018 Anak Krakatau tsunami and examination of possible submarine landslide scenarios. Pure and Applied Geophysics, 178, 1-20. [CrossRef]
- Copernicus Emergency Management System, Mapping activation EMSR696. https://rapidmapping.emergency.copernicus.eu/EMSR696/download.
- Flood impact assessment in Derna City centre, East Province, Libya, UNOSAT activation 3672. https://unosat.org/products/3672.
- Abdalla, M. (2021). ‘Mathematical Model of Dam Break: Applied Study of Derna Dam.’, MEJ- Mansoura Engineering Journal, 27(4), pp. 46-59. [CrossRef]
- Ashoor ع. ع. ر. (2022) “Estimation of the surface runoff depth of Wadi Derna Basin by integrating the geographic information systems and Soil Conservation Service (SCS-CN) model”, Journal of Pure & Applied Sciences , 21(2), pp. 90–100. [CrossRef]
- Prida, A. – ‘Dam break simulation in Derna (Libya) using HydroMT_SFINCS’ slides presented at DSD-INT-2023 - https://softwaredays.deltares.nl/-/dsd-int-2023-slides-dam-break-simulation-in-derna-libya-using-hydromt_sfincs?startDate=06-09-2023.
- Santini, M., Proietti, C., Gerhardinger, A., Tucci, M., Barantiev, D., Giustolisi, L. and Lorini, V., Validation analysis of the dam breach calculations for Derna dam, Libya, Publications Office of the European Union, Luxembourg, 2023, JRC136254.
- JASIM Imran, Ayman Nemnem, Ahad Tanim et al. Rising Waters, Falling Dams: Deciphering the Derna Flood Disaster, 10 January 2024, PREPRINT (Version 1) available at Research Square. [CrossRef]
- SRTM topography database is from NASA: https://www2.jpl.nasa.gov/srtm/, We propose the method by D. Watkins to download: https://dwtkns.com/srtm30m/.
- Bright, E., Rose, A., & Urban, M. (2015). LandScan Global 2014 [Data set]. Oak Ridge National Laboratory. [CrossRef]
- EU Joint Research Centre Global Human Settlement Layer (GHSL). https://ghsl.jrc.ec.europa.eu/tools.php.
- The catastrophe of the Niedów dam – the dam break causes, development and consequences Stanisław Kostecki1,* and Robert Banasiak2. [CrossRef]
- Froehlich, D.C. Embankment Dam Breach Parameters and Their Uncertainties. 2008, 134, 1708–1721. [Google Scholar] [CrossRef]
- Information Bulletin 164 - The Copernicus Emergency Management Service activities in the aftermath of the mudflow in Ischia (Italy) - https://emergency.copernicus.eu/mapping/ems/information-bulletin-164-copernicus-emergency-management-service-activities-aftermath-mudflow.
Figure 1.
Situation map for the Libya Flood, source JRC.
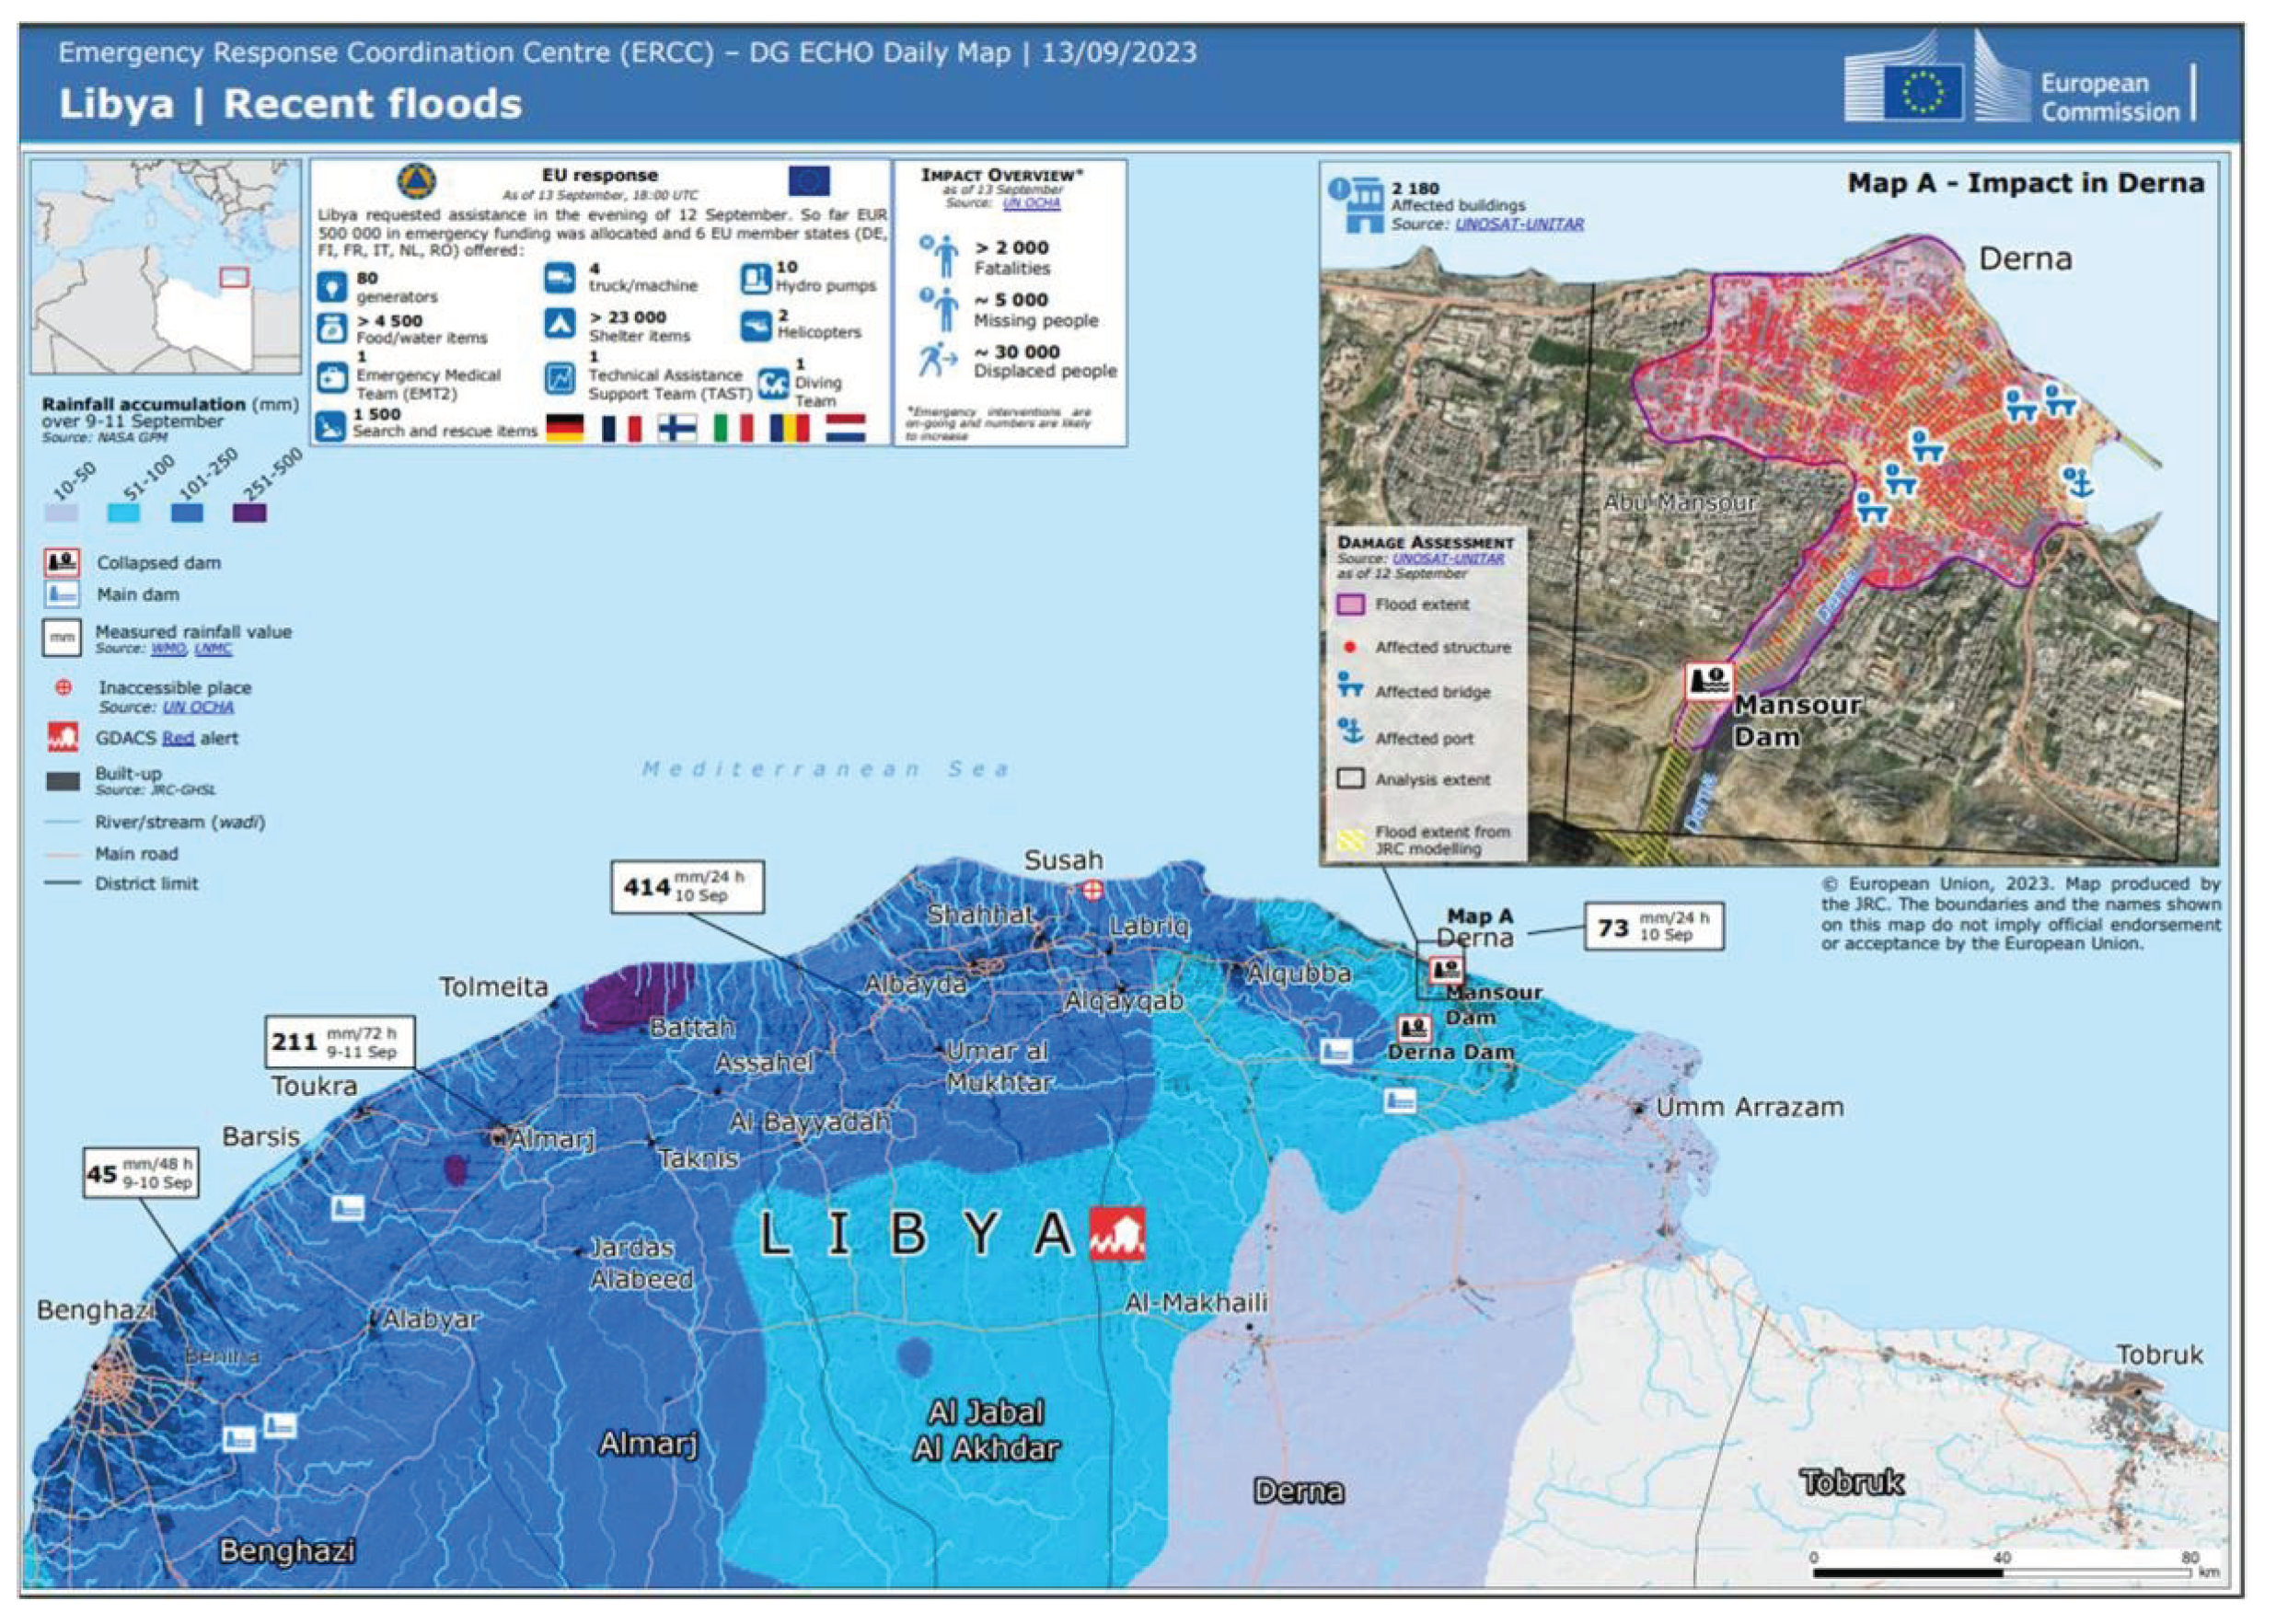
Figure 2.
City of Derna, before and after the flood. (c) Google Earth.
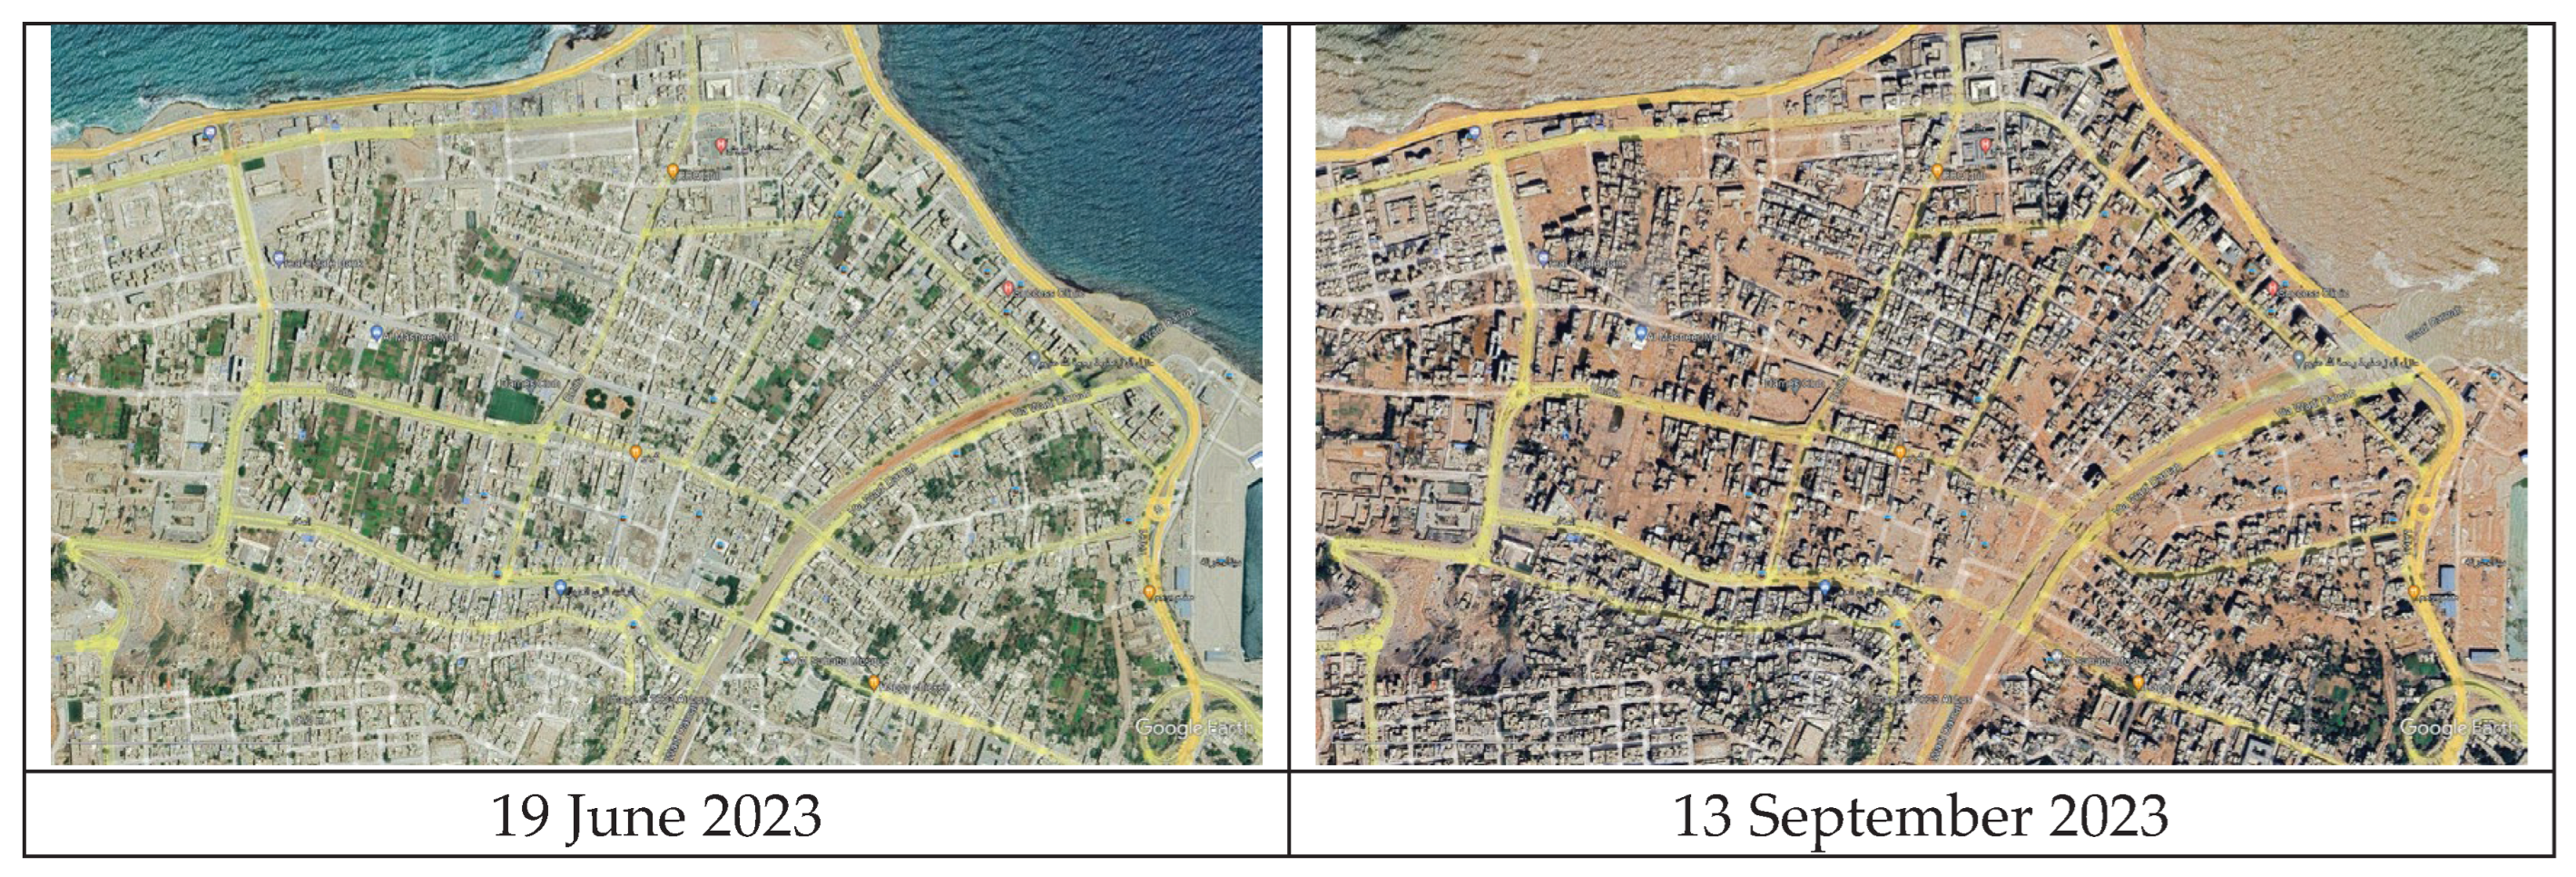
Figure 4.
Geographical location of the dams.
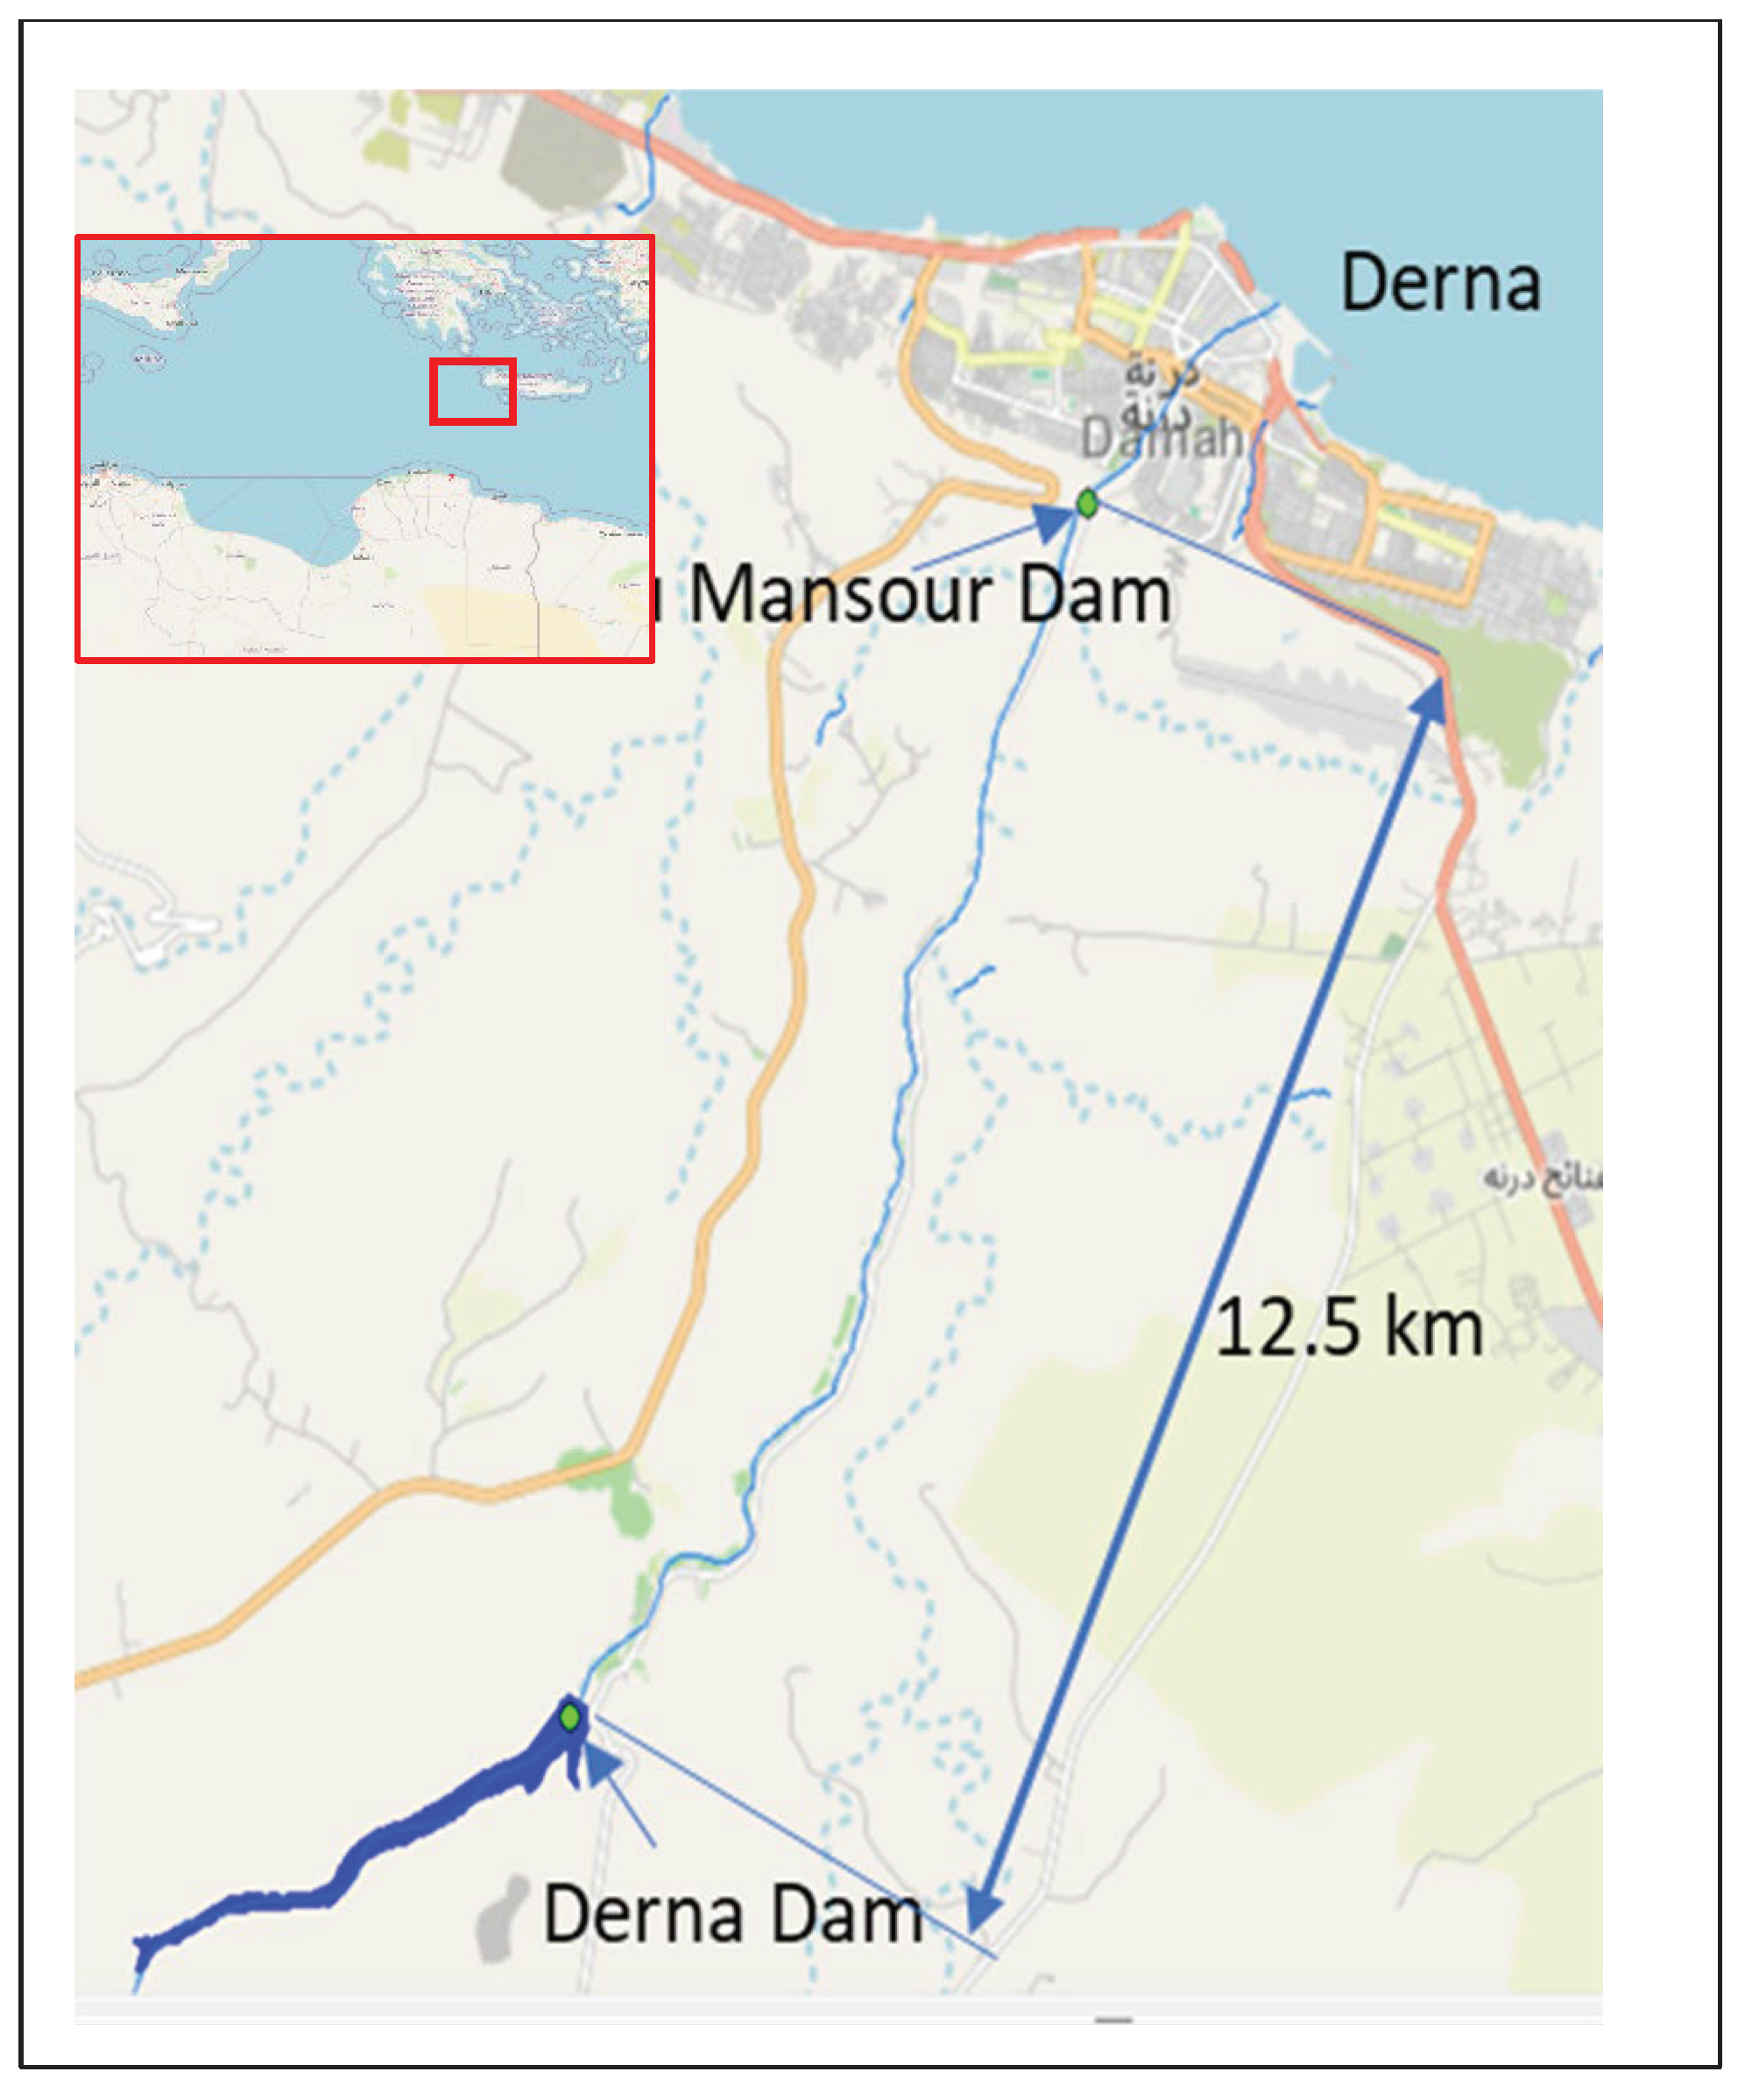
Figure 5.
Dam geometry.
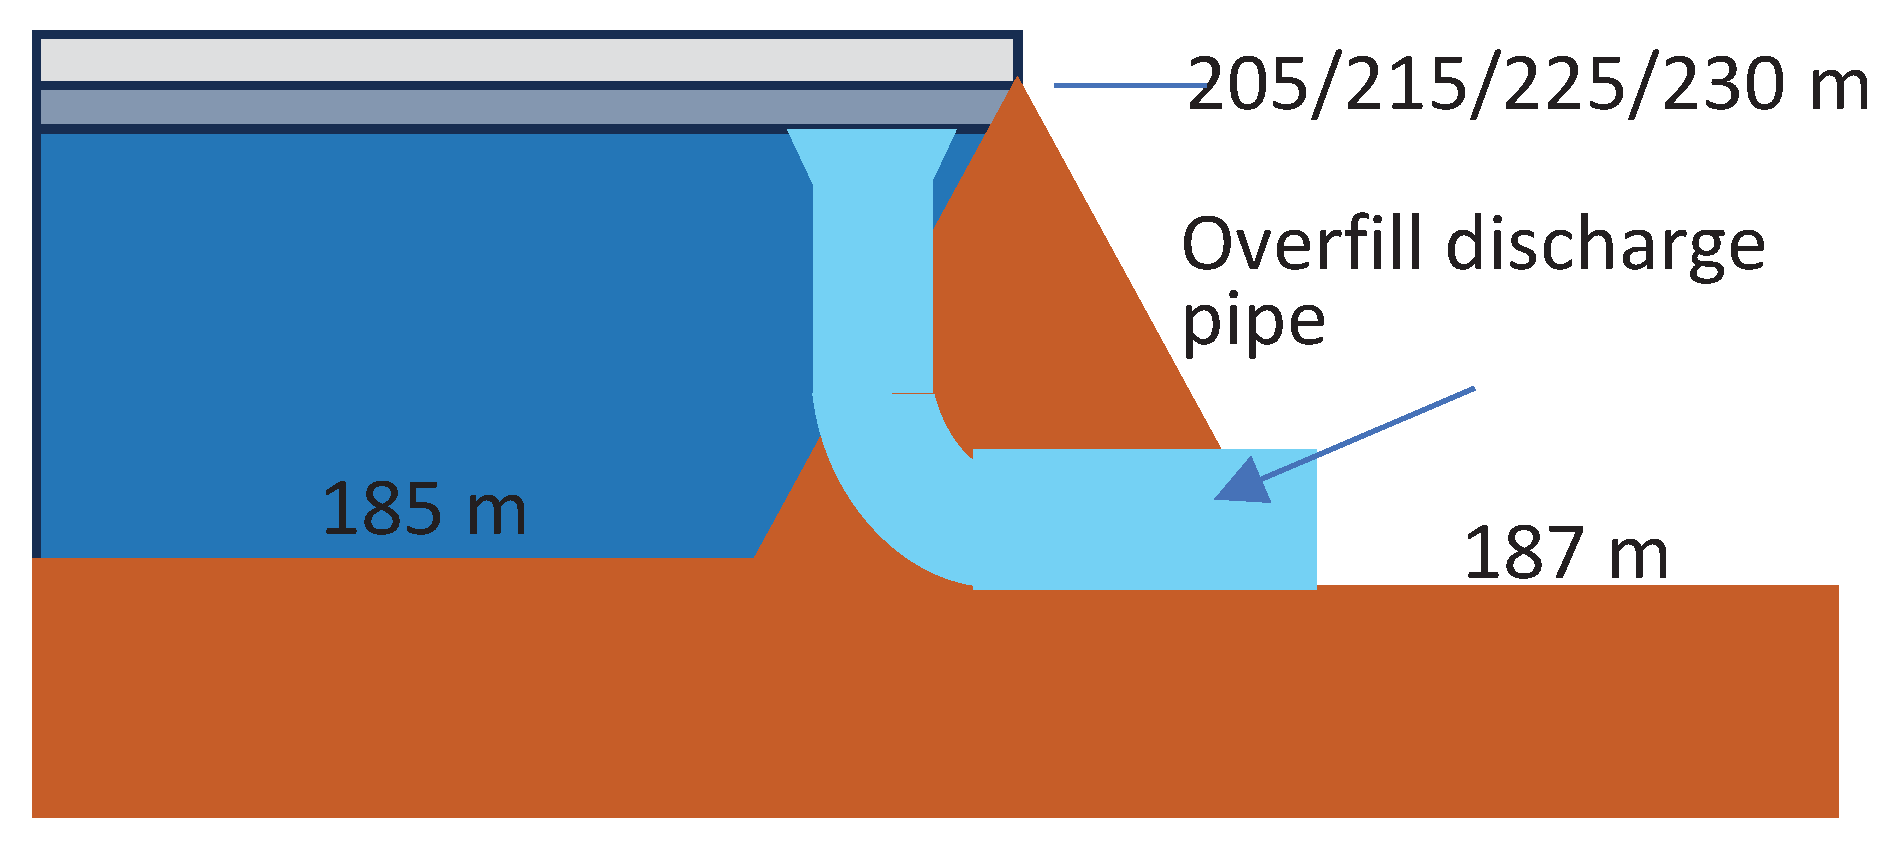
Figure 6.
Derna Dam overfill discharge piping – drawing from image https://www.erges.com.tr/EN%2C532/derna-bu-mansur-dam.html.
Figure 6.
Derna Dam overfill discharge piping – drawing from image https://www.erges.com.tr/EN%2C532/derna-bu-mansur-dam.html.
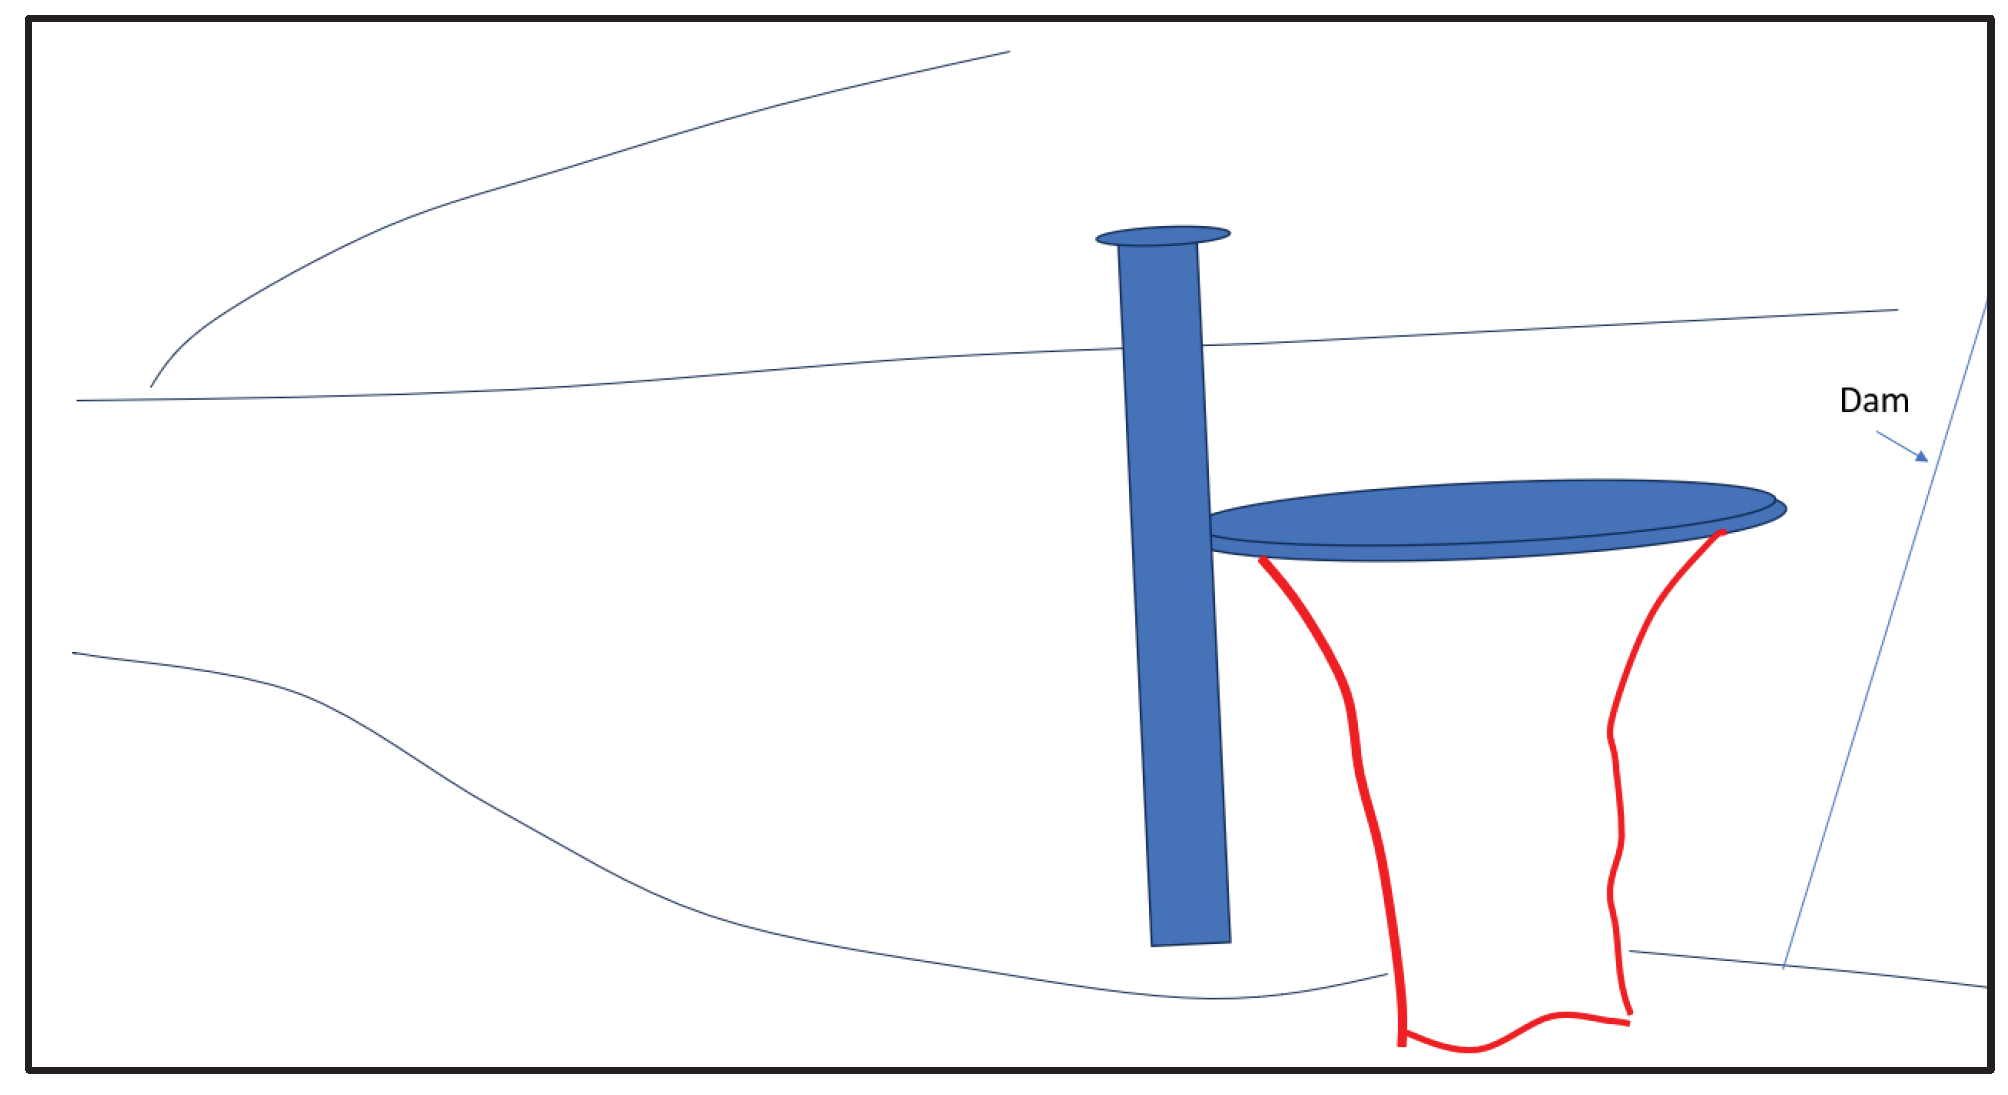
Figure 8.
The original form of the dam before the collapsing – drawing obtained using the following image https://dredgewire.com/the-failed-dams-in-wadi-derna-in-libya/.
Figure 8.
The original form of the dam before the collapsing – drawing obtained using the following image https://dredgewire.com/the-failed-dams-in-wadi-derna-in-libya/.
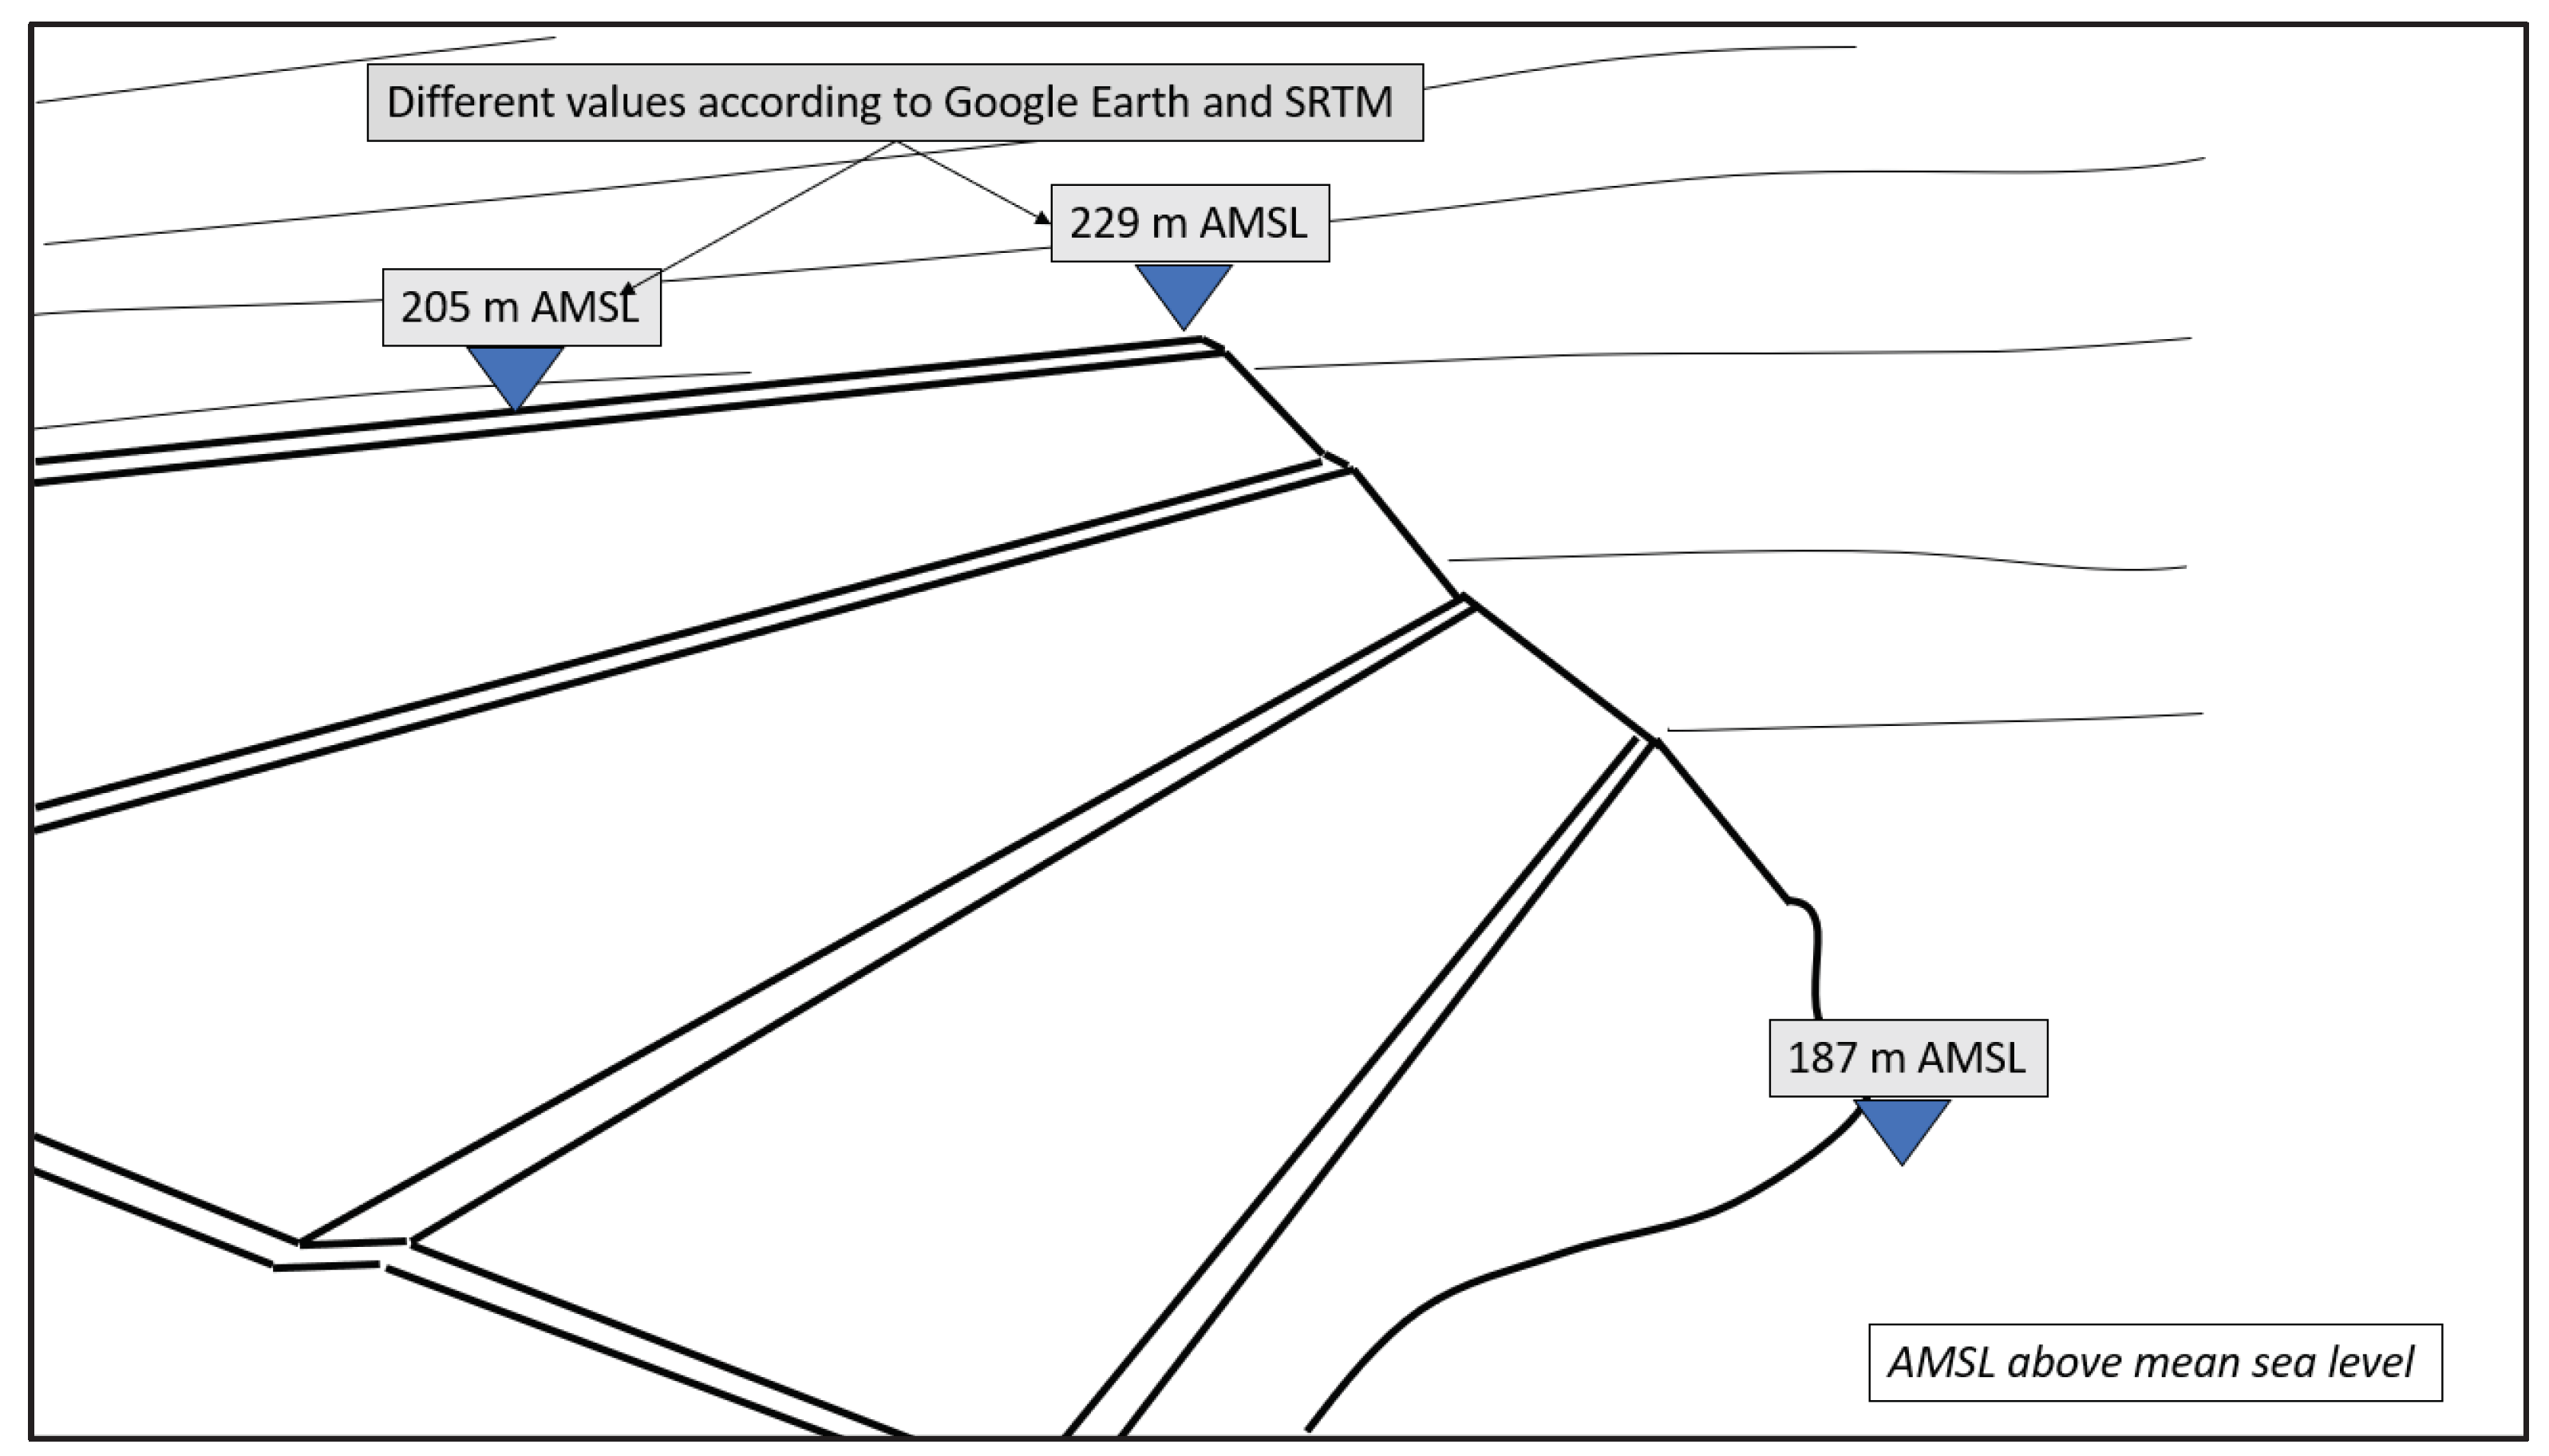
Figure 9.
The destroyed dam (obtained from the imagehttps://www.eduvast.com/information/wadi-derna-dam-collapse-has-it-led-to-flooding-in-libya/).
Figure 9.
The destroyed dam (obtained from the imagehttps://www.eduvast.com/information/wadi-derna-dam-collapse-has-it-led-to-flooding-in-libya/).
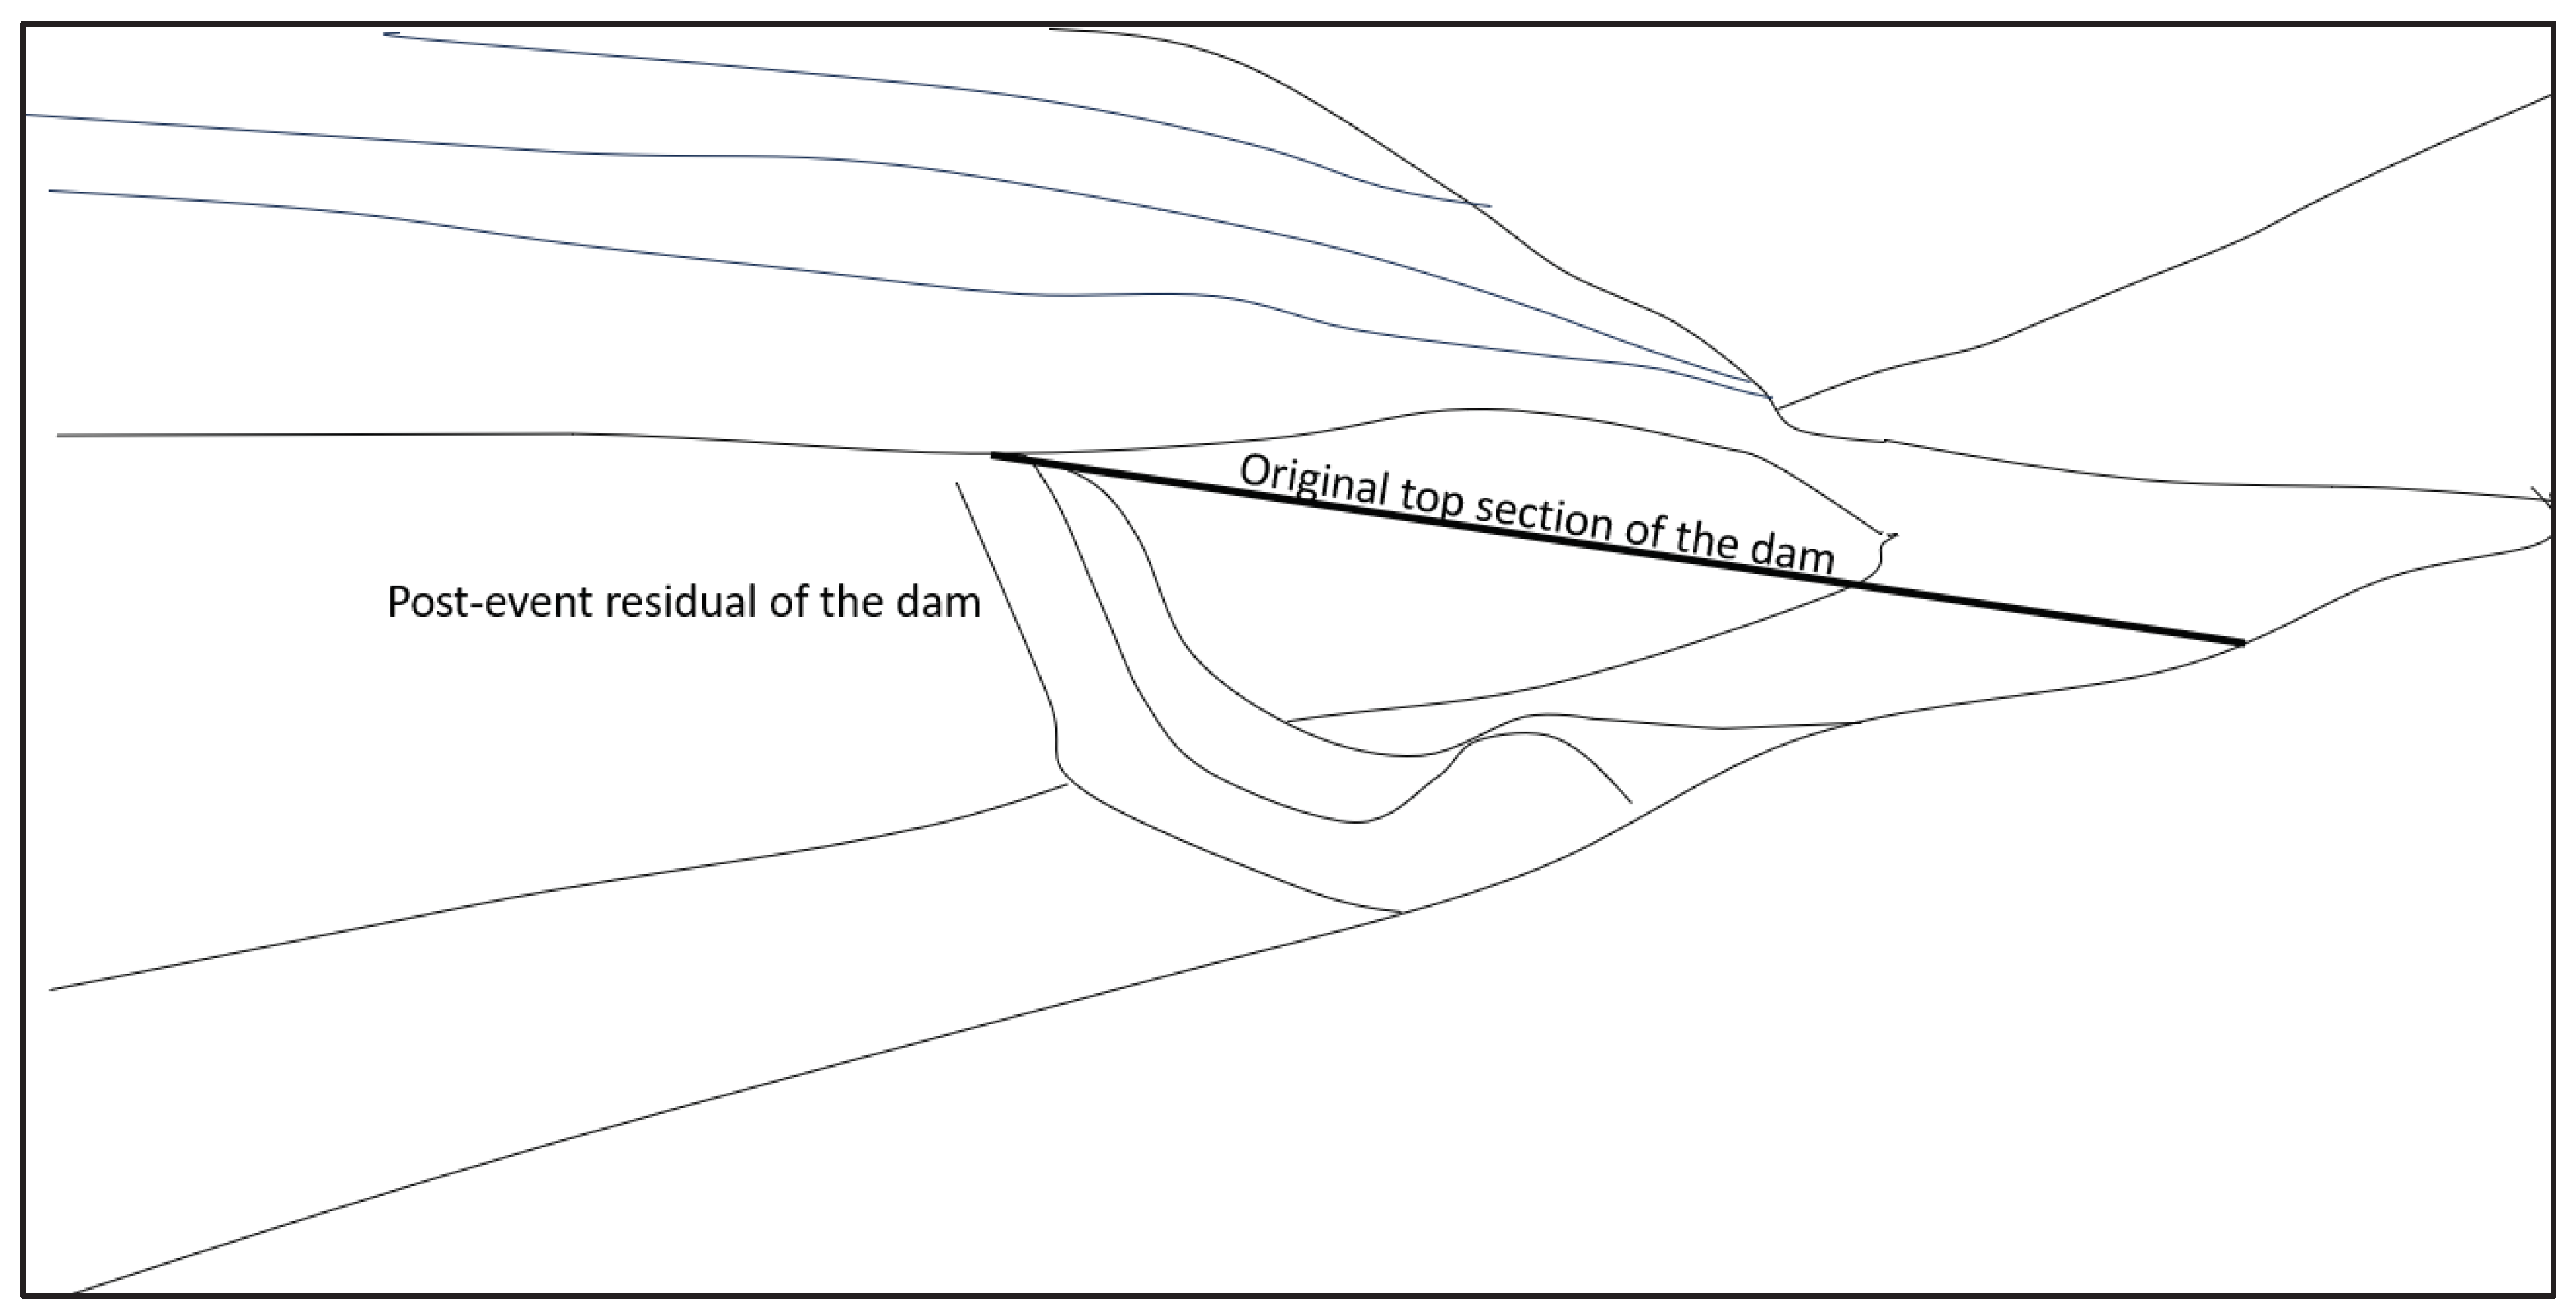
Figure 10.
Dam break water progression in the first 50 min from the break. In this case the reservoir water height was 225 m, the break size 260 m, the friction coefficient 0.015 and the river downstream the dam was empty.
Figure 10.
Dam break water progression in the first 50 min from the break. In this case the reservoir water height was 225 m, the break size 260 m, the friction coefficient 0.015 and the river downstream the dam was empty.
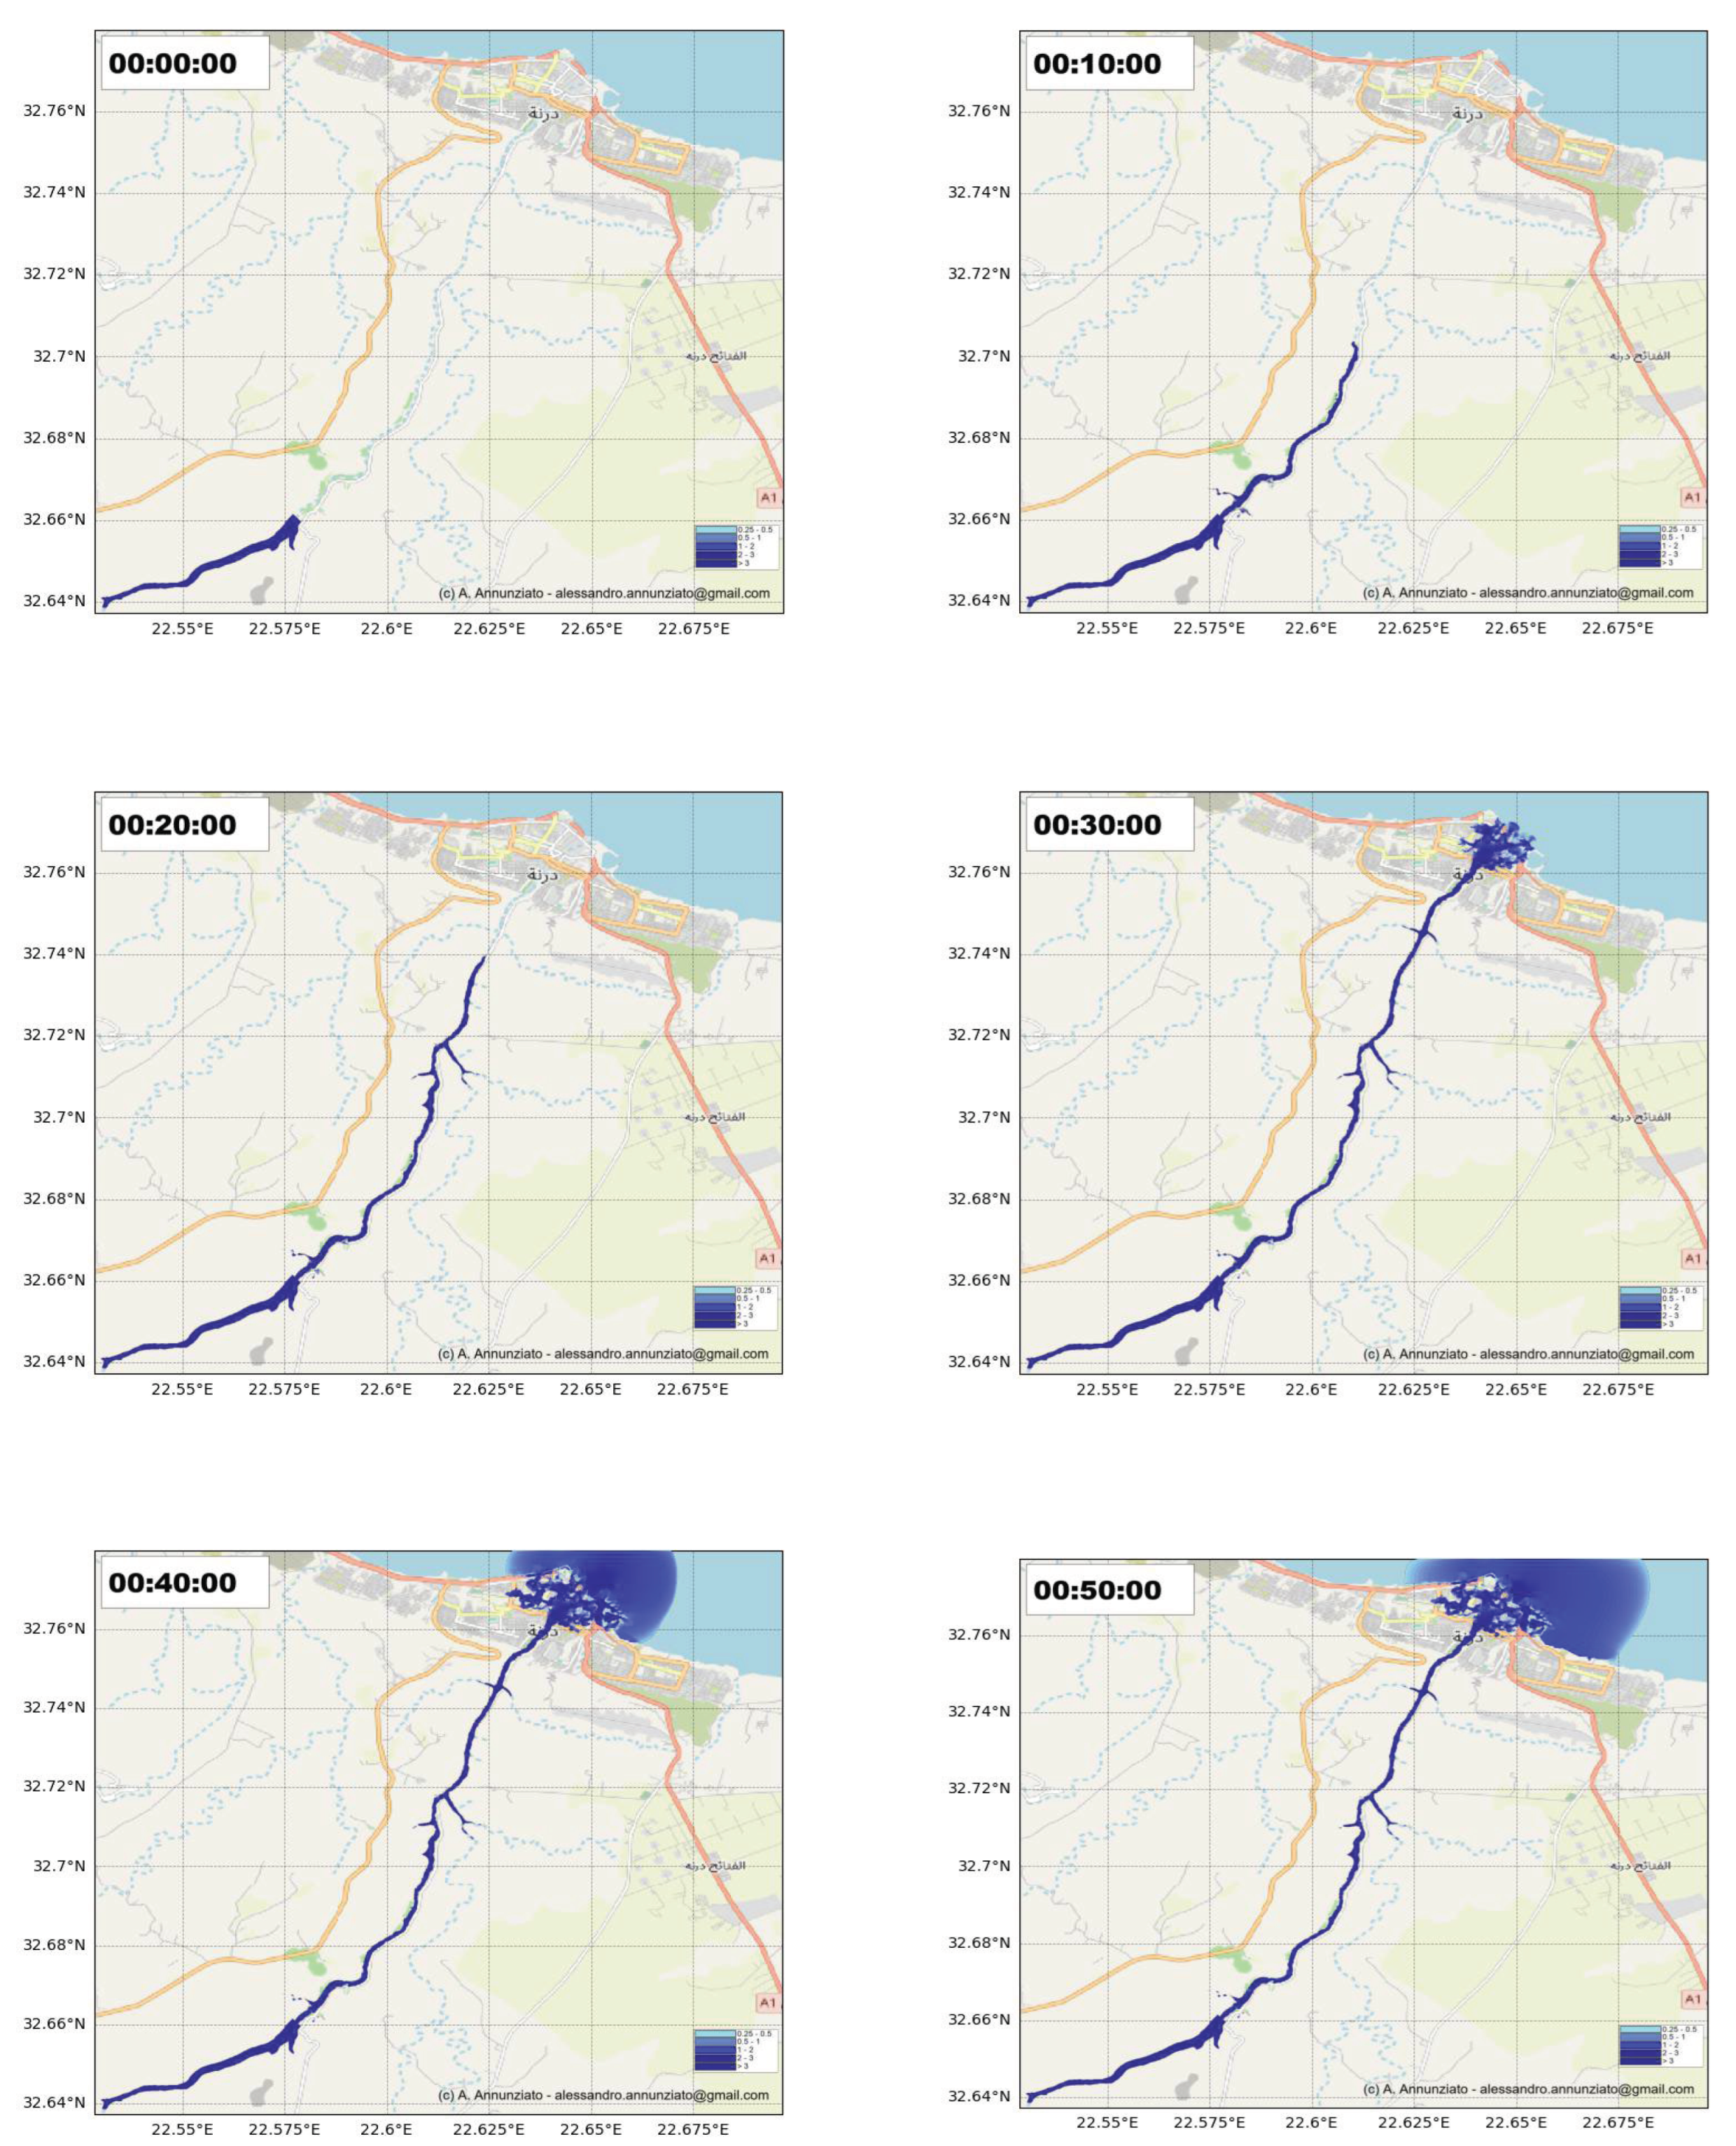
Figure 11.
Maximum Flow depth for the base case. The computed data are compared with the extent identified by UNOSAT (blue line) and Copernicus EMS (red line).
Figure 11.
Maximum Flow depth for the base case. The computed data are compared with the extent identified by UNOSAT (blue line) and Copernicus EMS (red line).
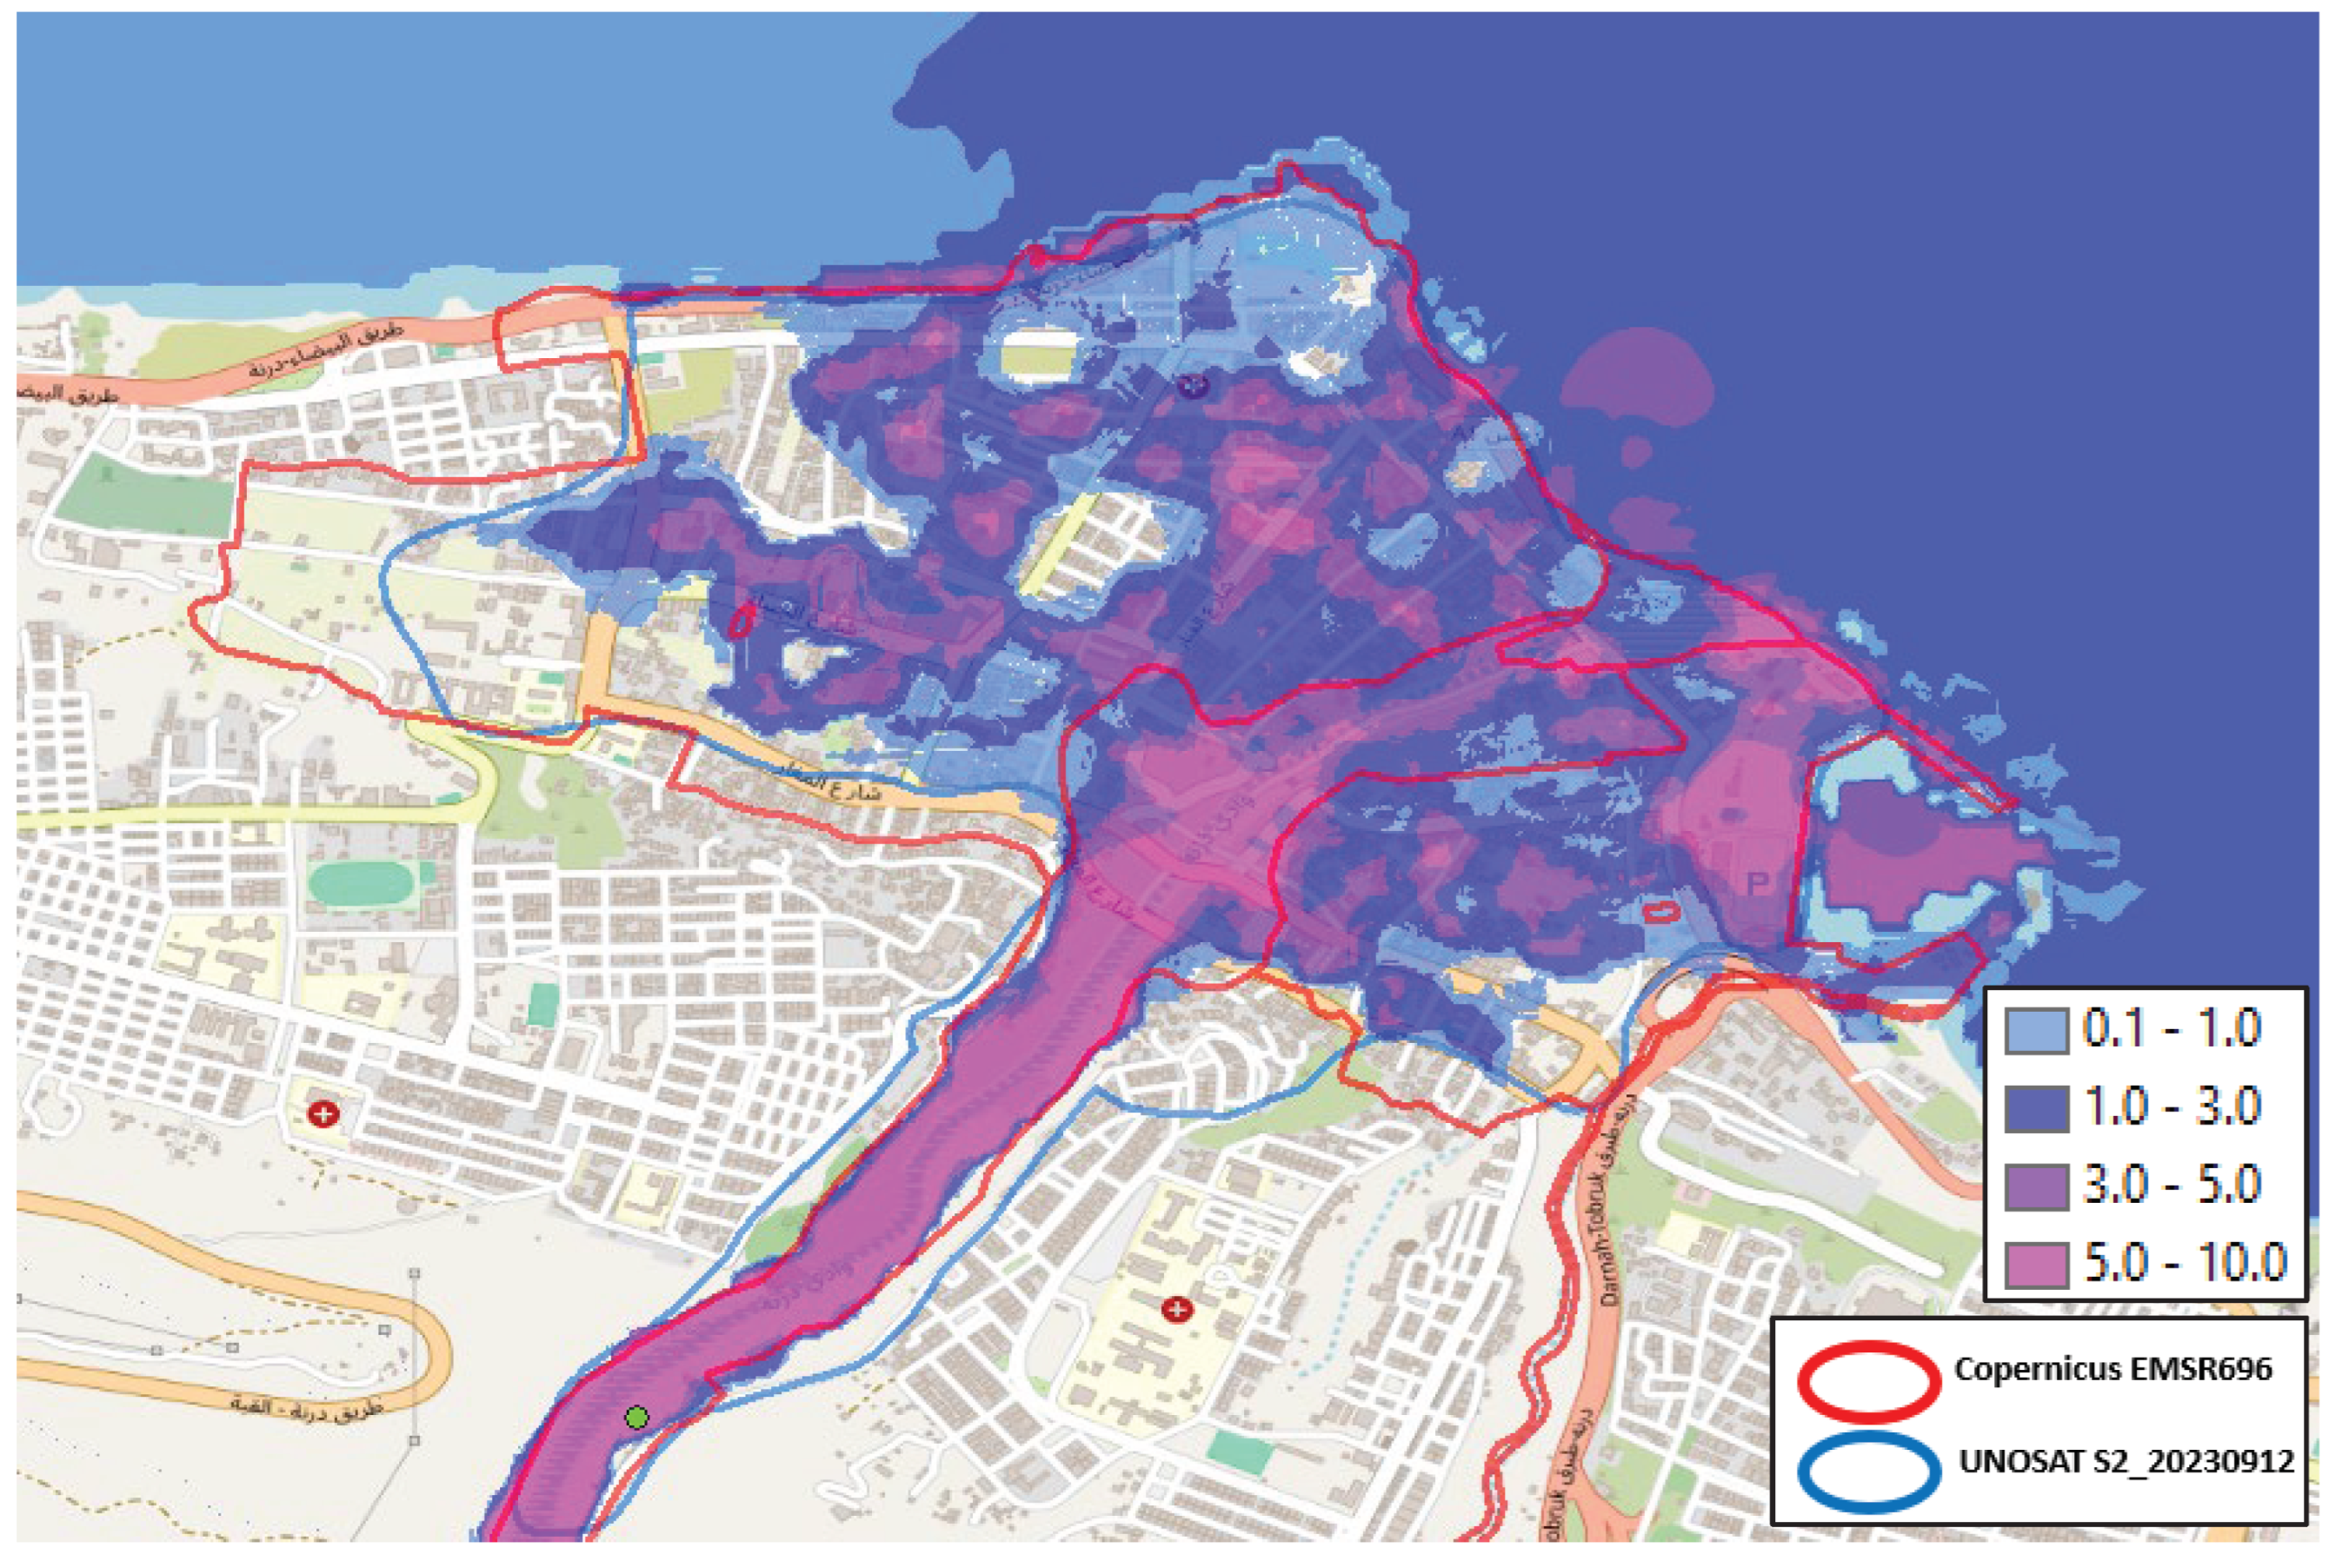
Figure 12.
- SRTM contour with superimposed the maximum flow depth.
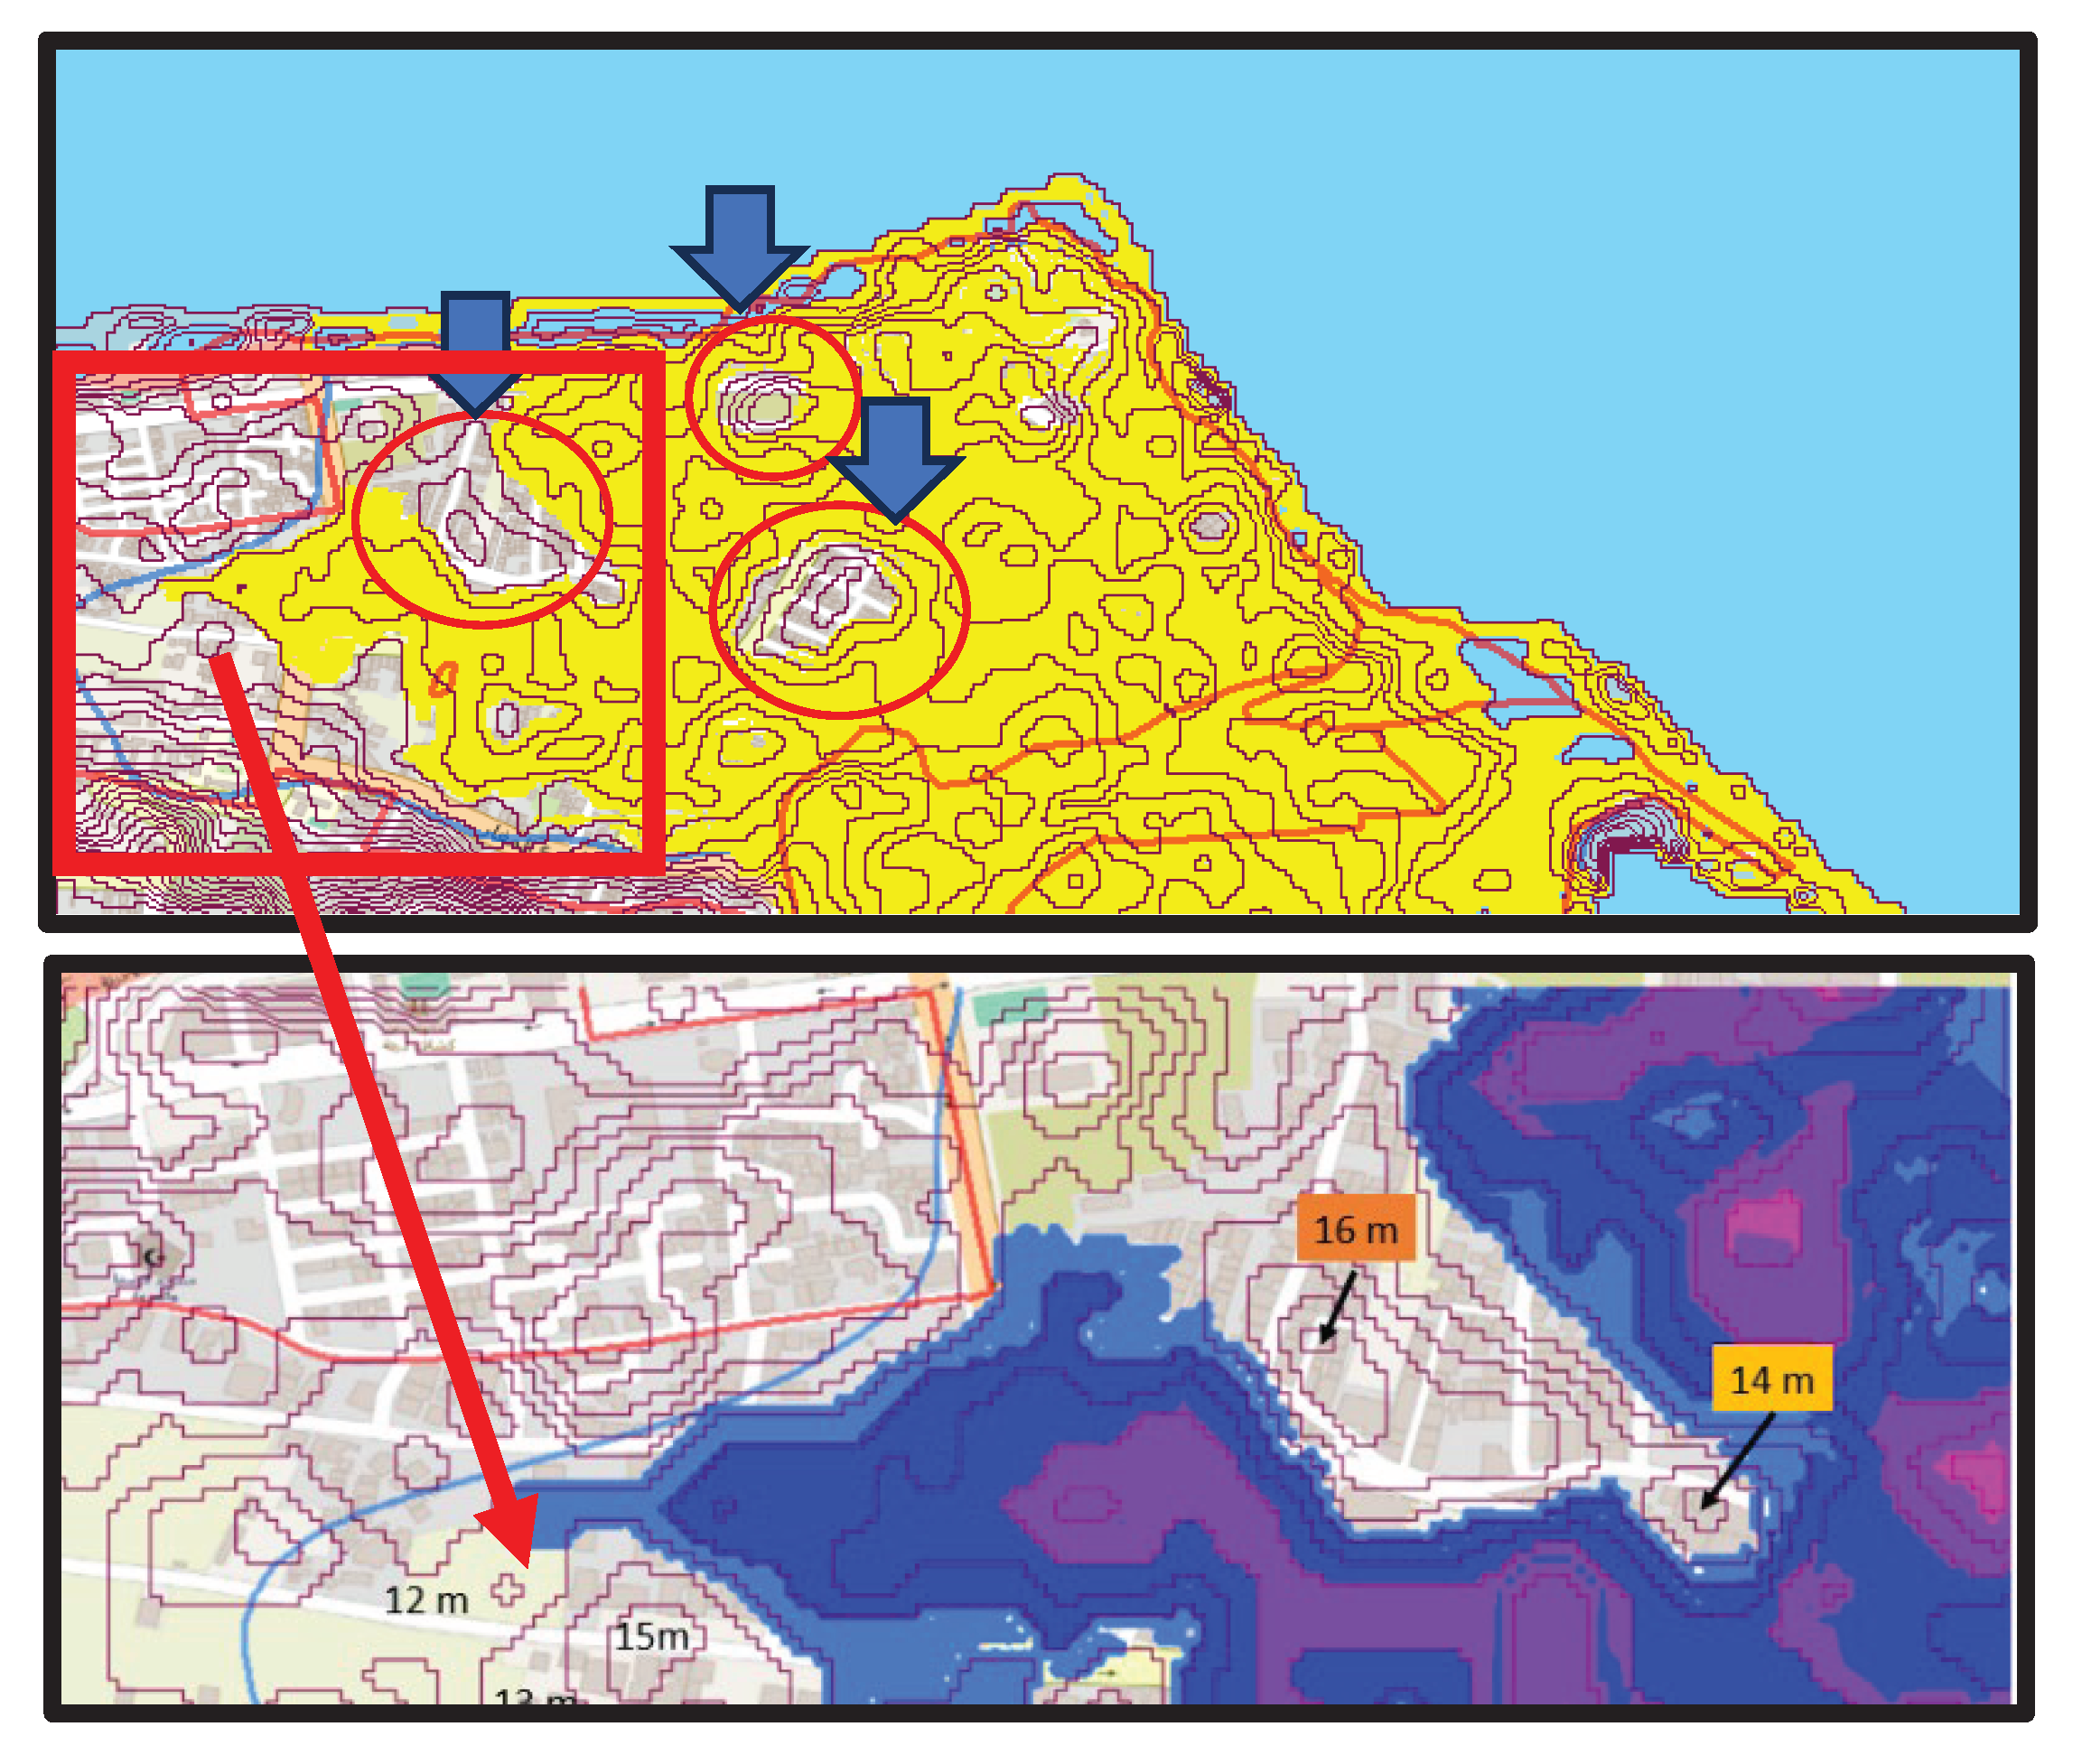
Figure 13.
Travel time of the wave.
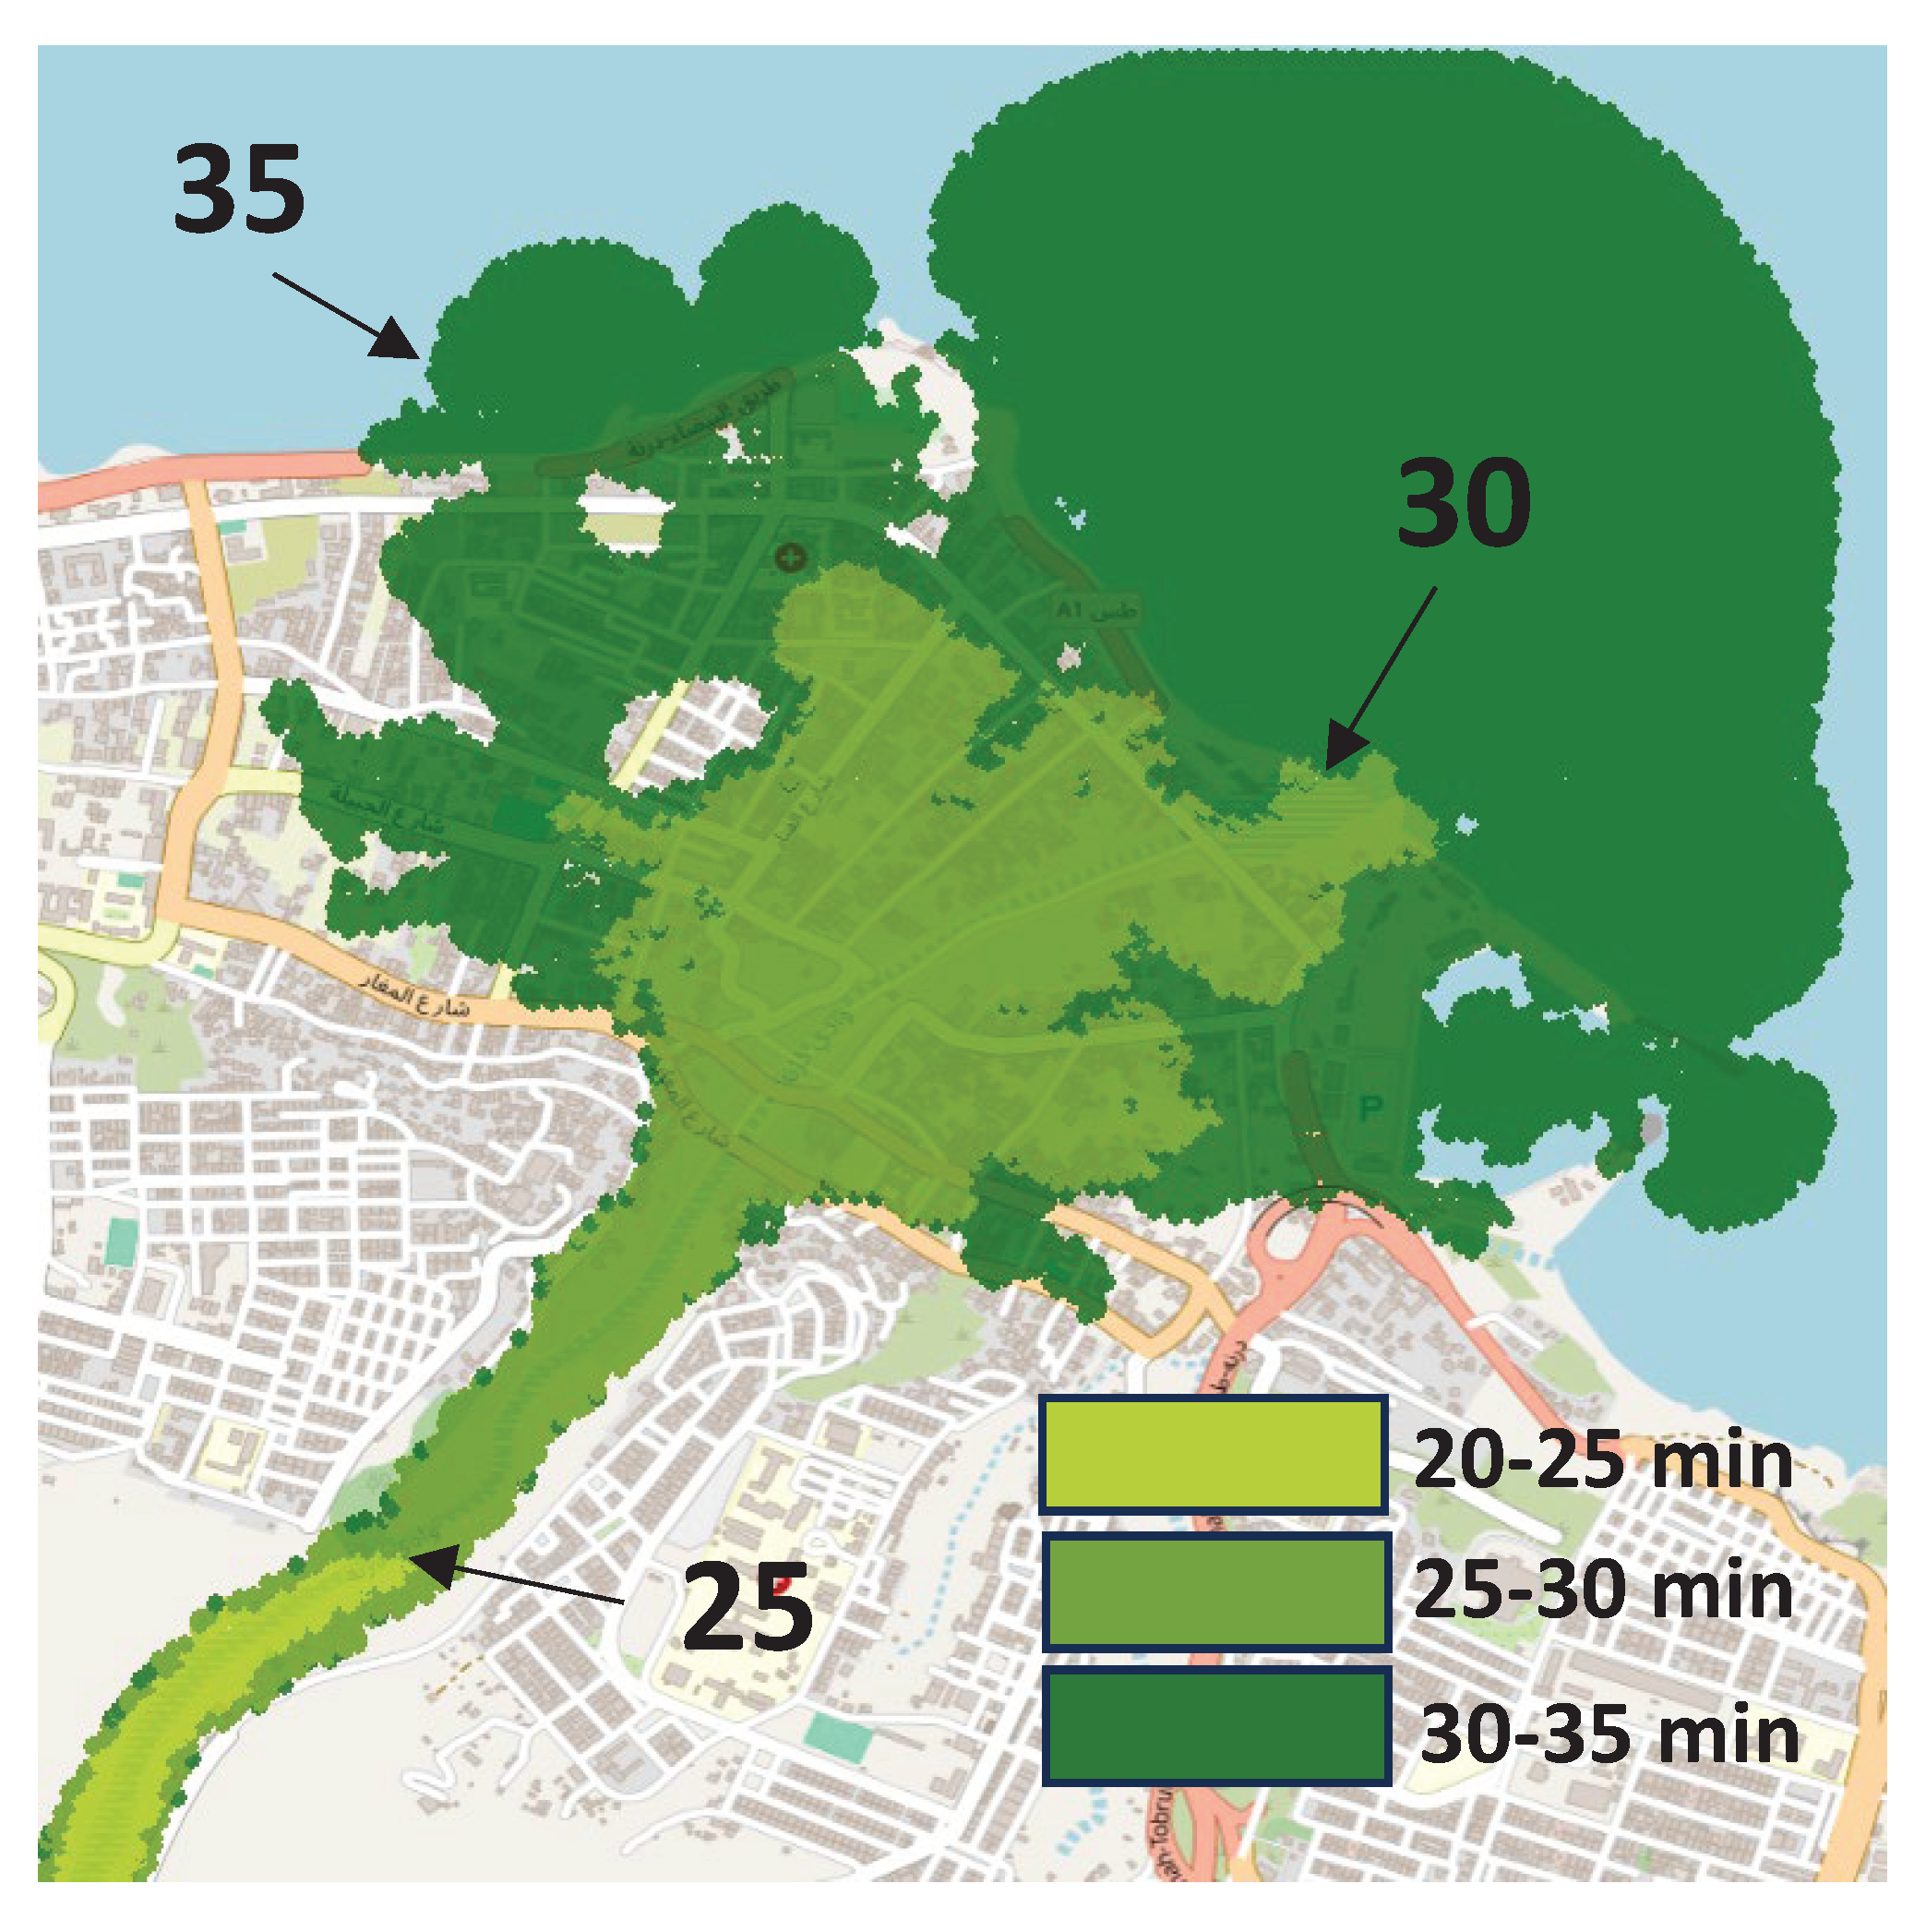
Figure 14.
Peak flow and Arrival time at the entrance of Derna city (22.62784 / 32.74522).
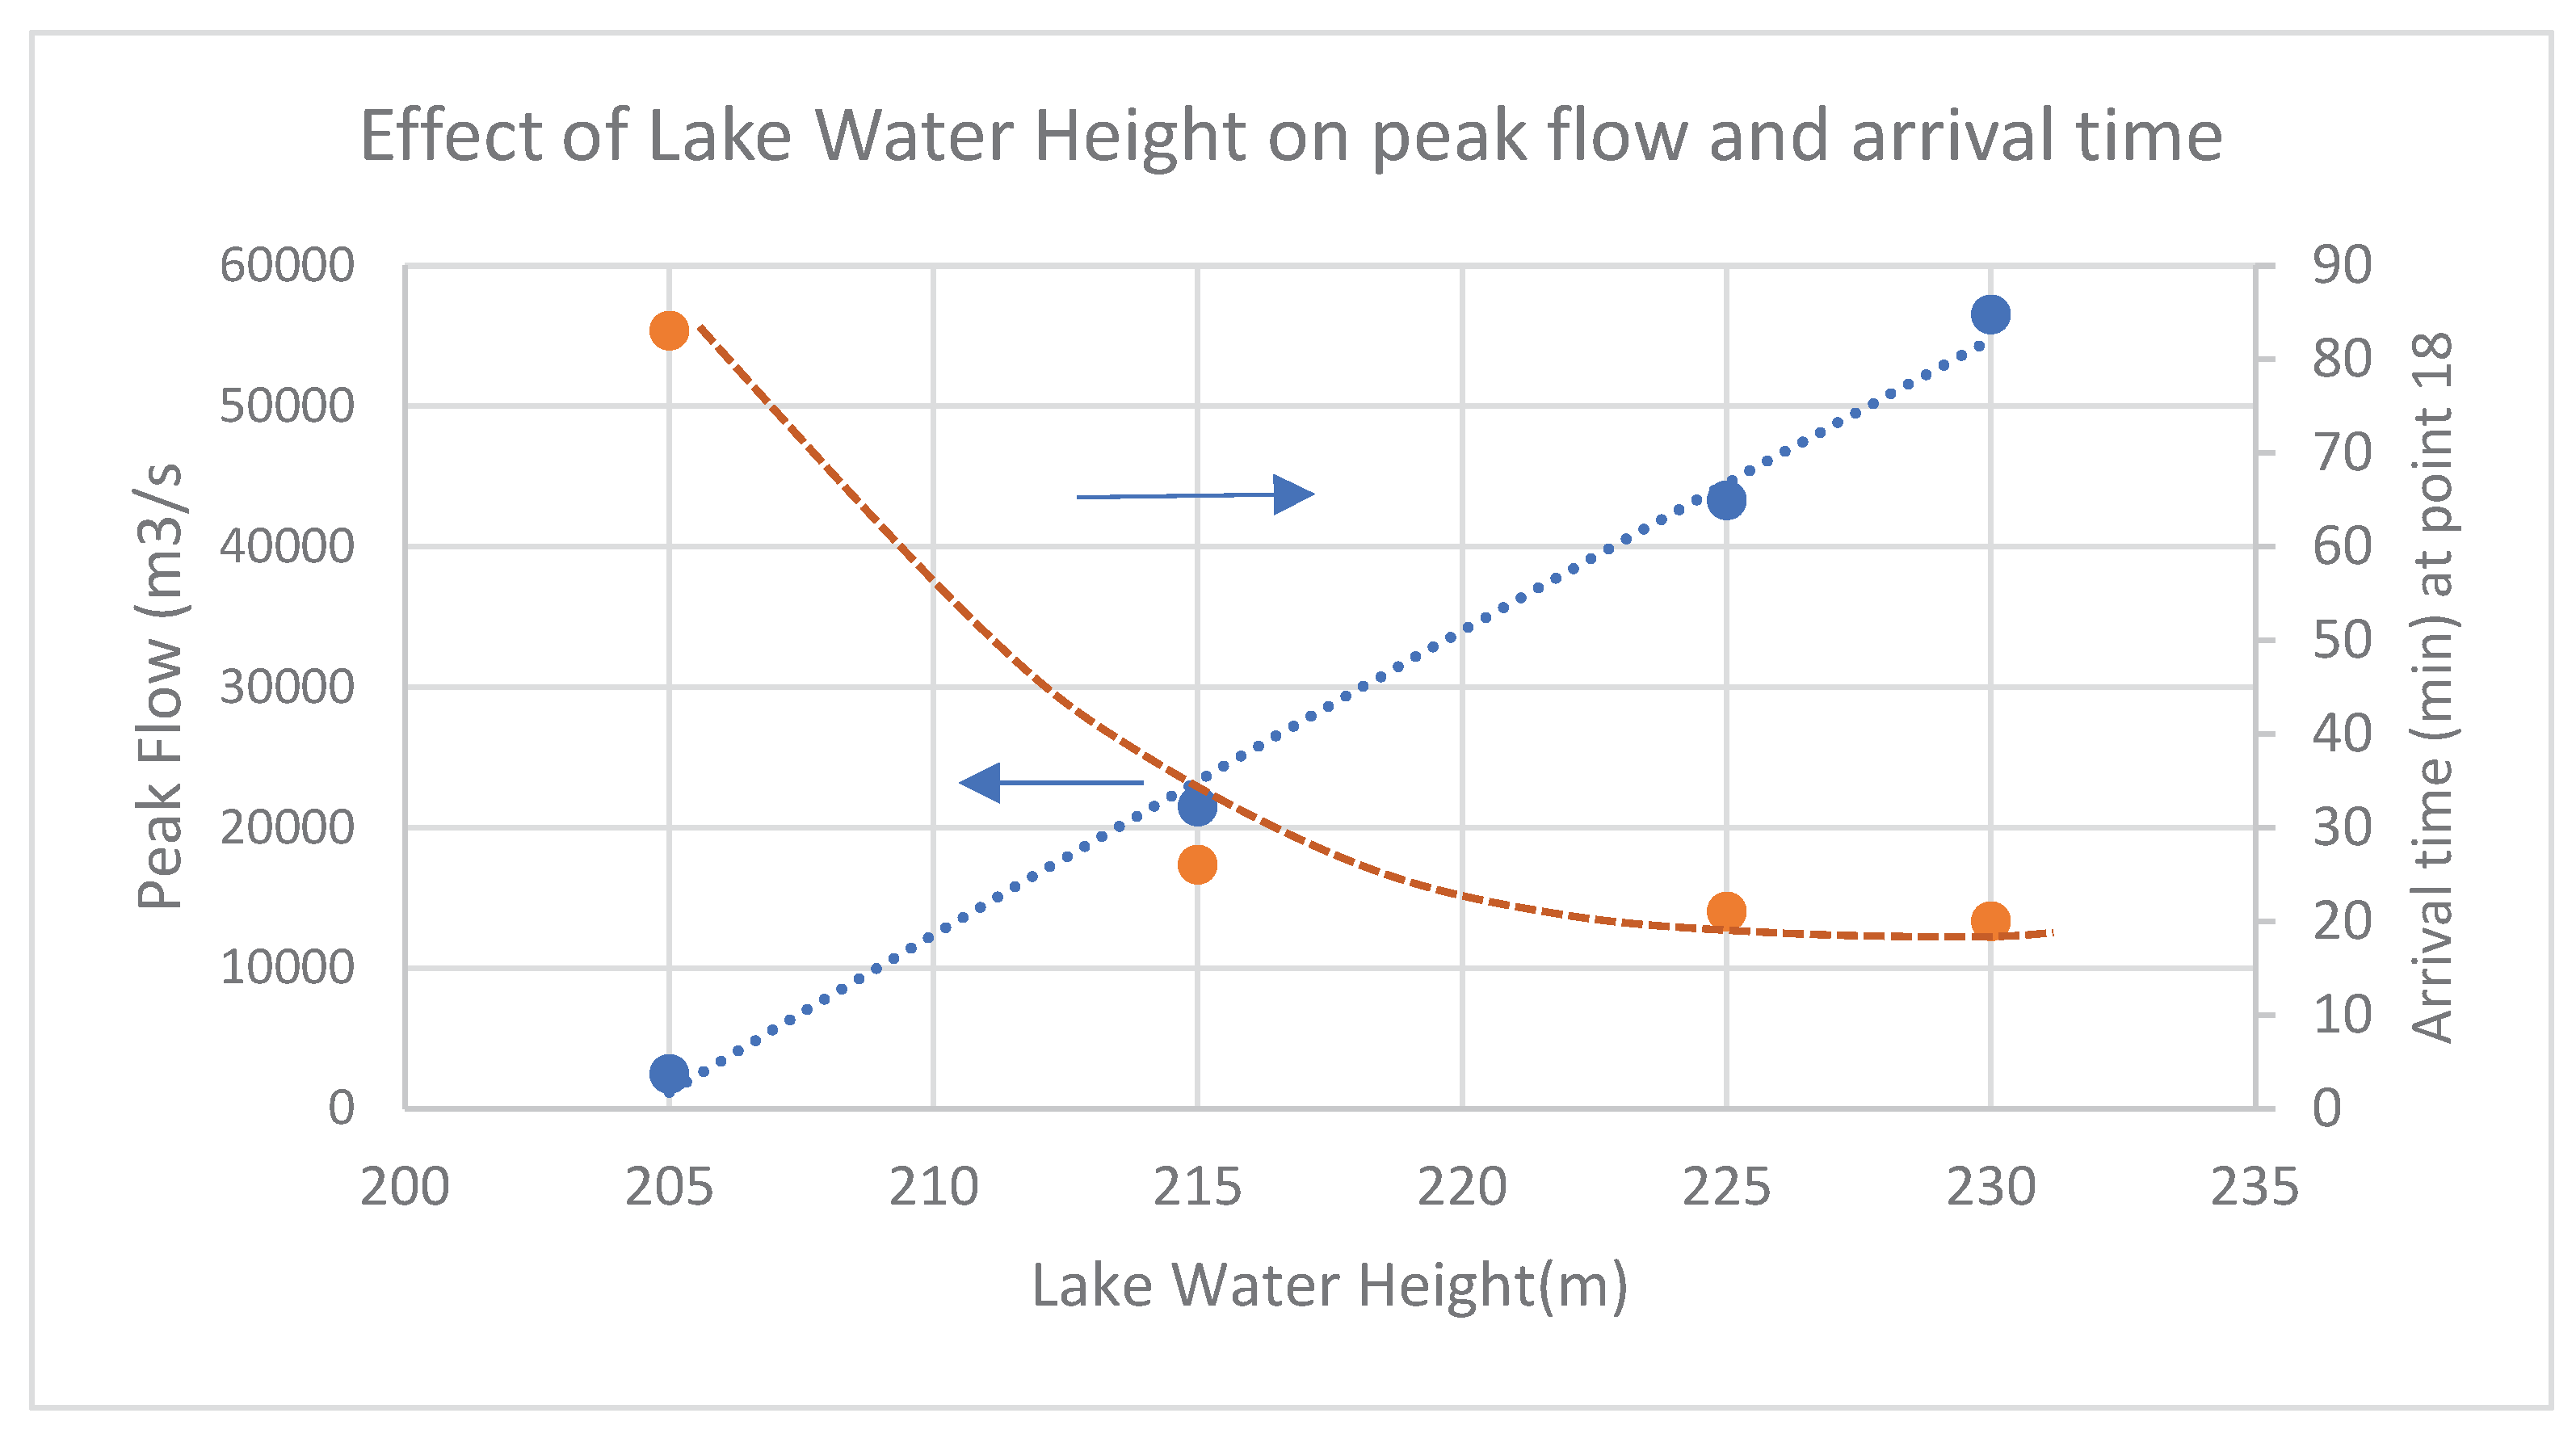
Figure 15.
Water height at the entrance of Derna (22.62784 / 32.74522) with different lake water heights.
Figure 15.
Water height at the entrance of Derna (22.62784 / 32.74522) with different lake water heights.
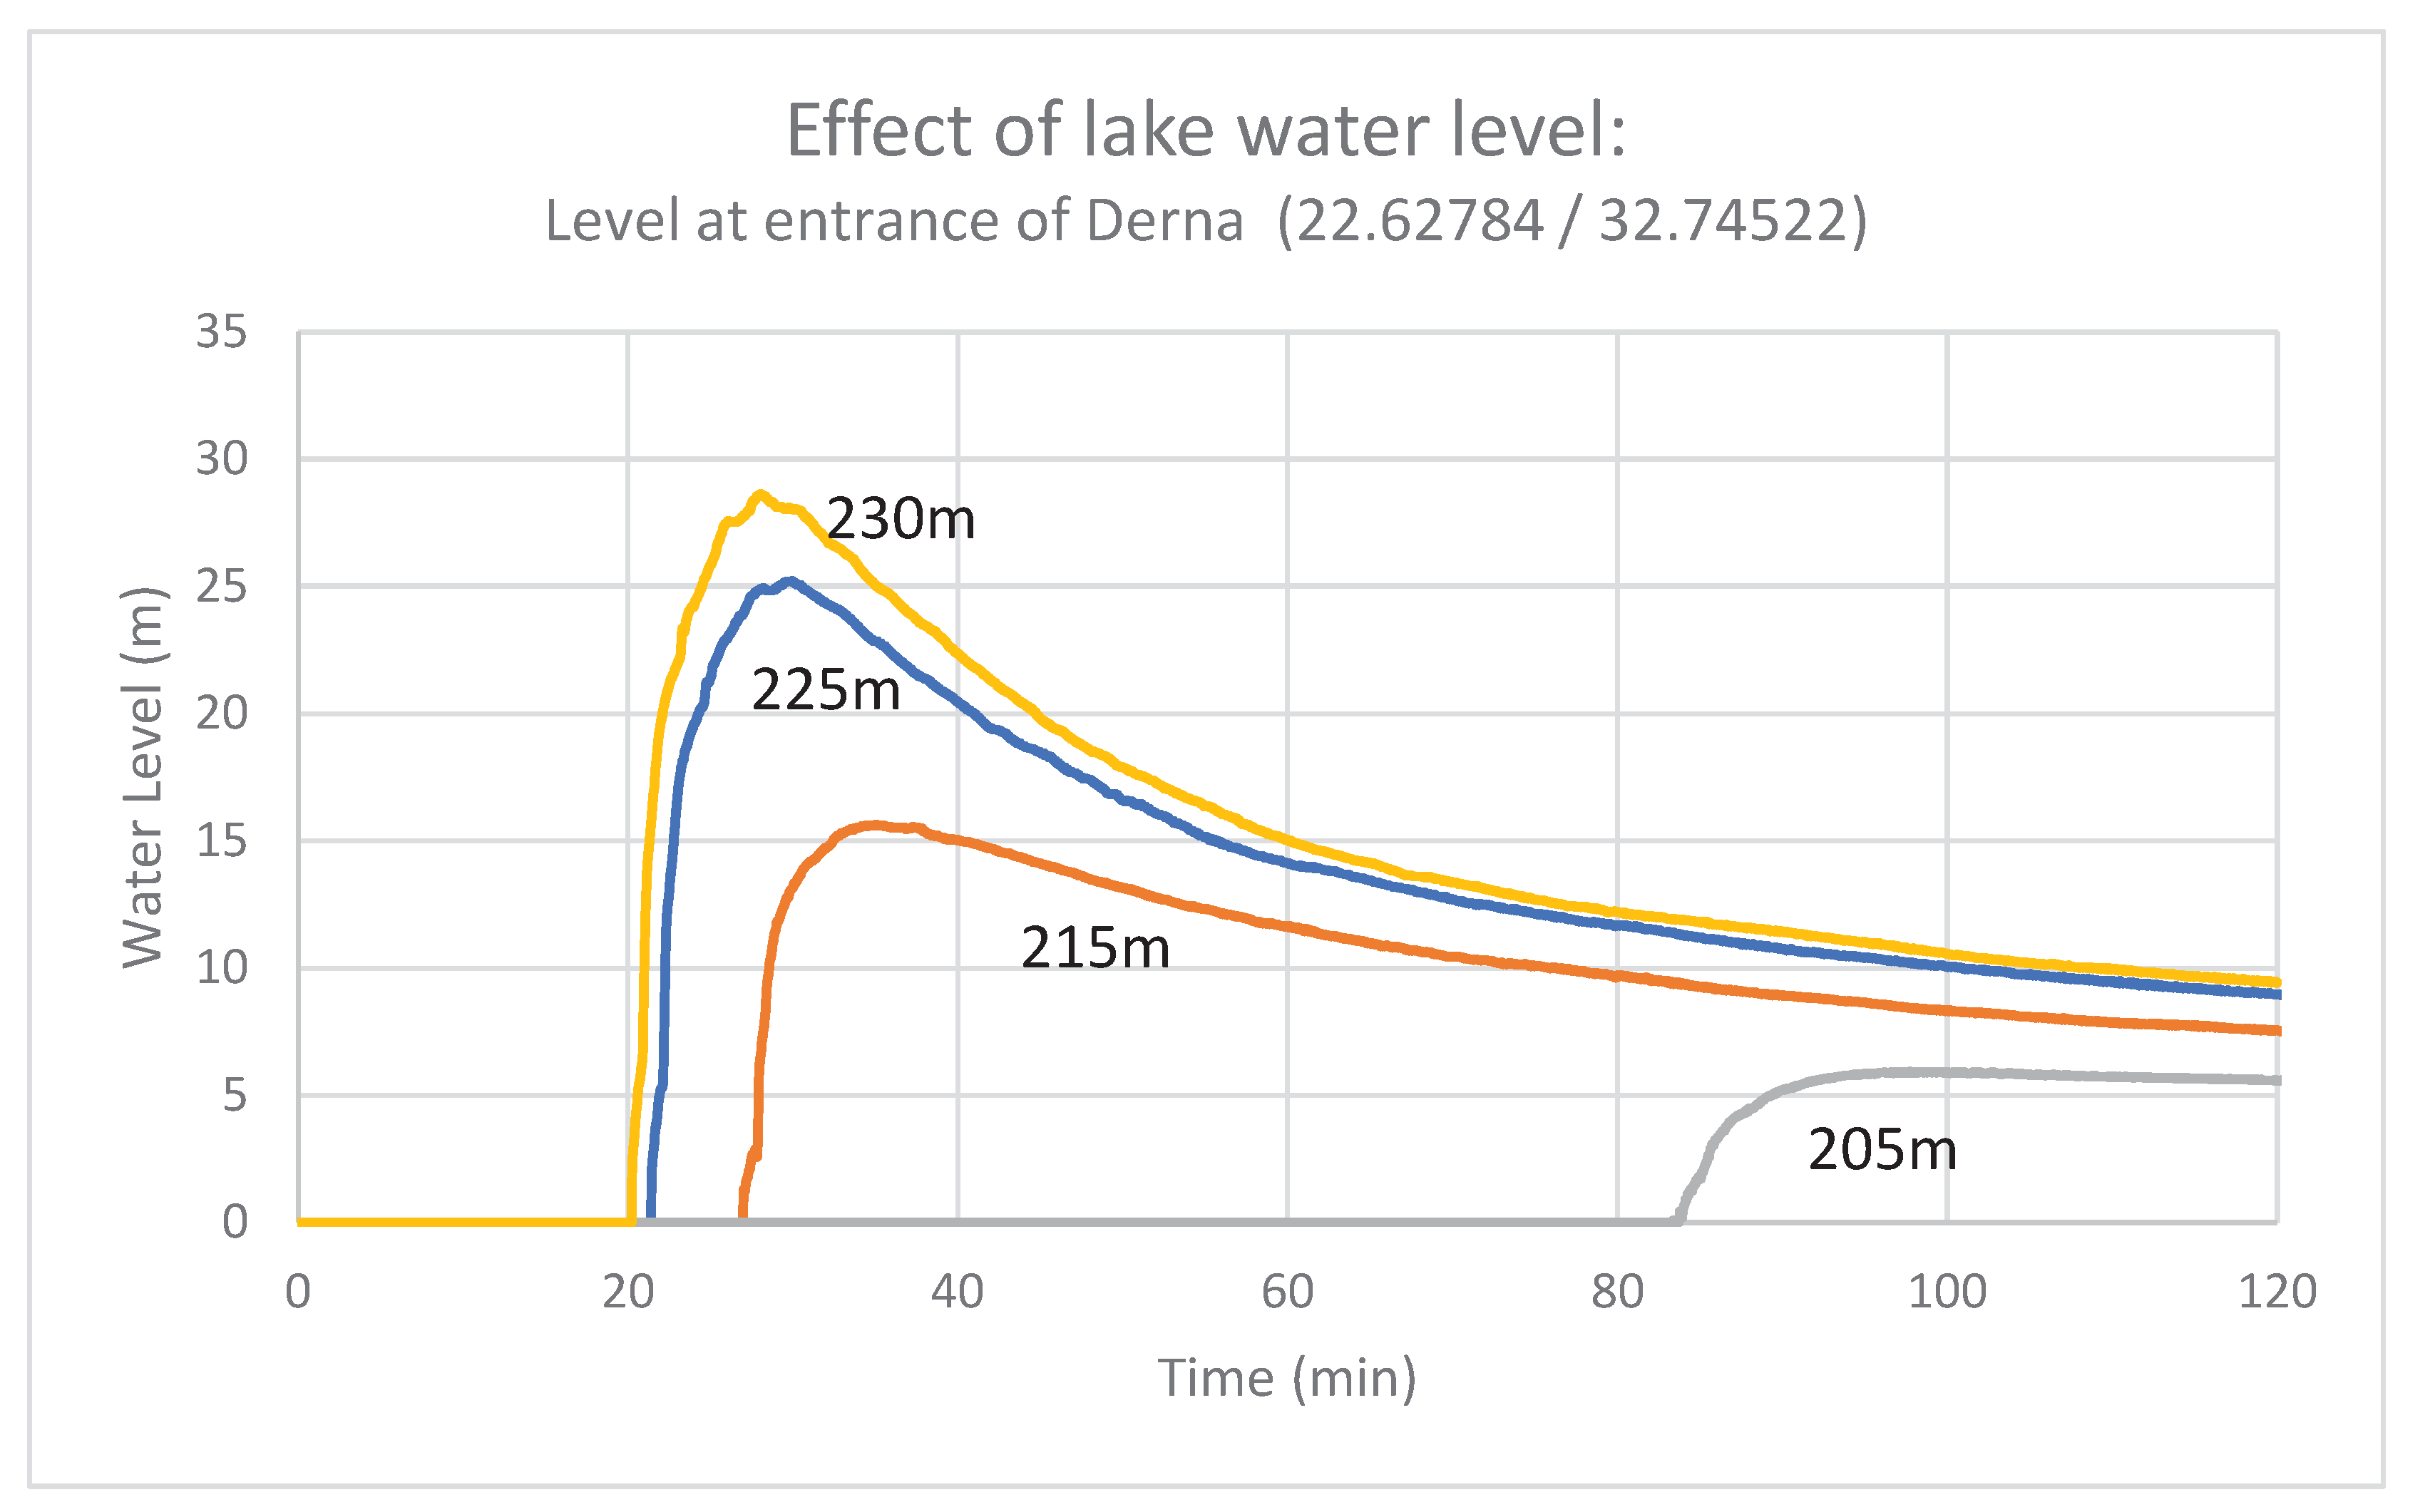
Figure 16.
Effect of initial water height on Derna inundation. The red line represents the Copernicus EMSR696 flooding extent while the blue line is the same extent as deduced by UNOSAT FL20230912 as of 13 September 2023.
Figure 16.
Effect of initial water height on Derna inundation. The red line represents the Copernicus EMSR696 flooding extent while the blue line is the same extent as deduced by UNOSAT FL20230912 as of 13 September 2023.
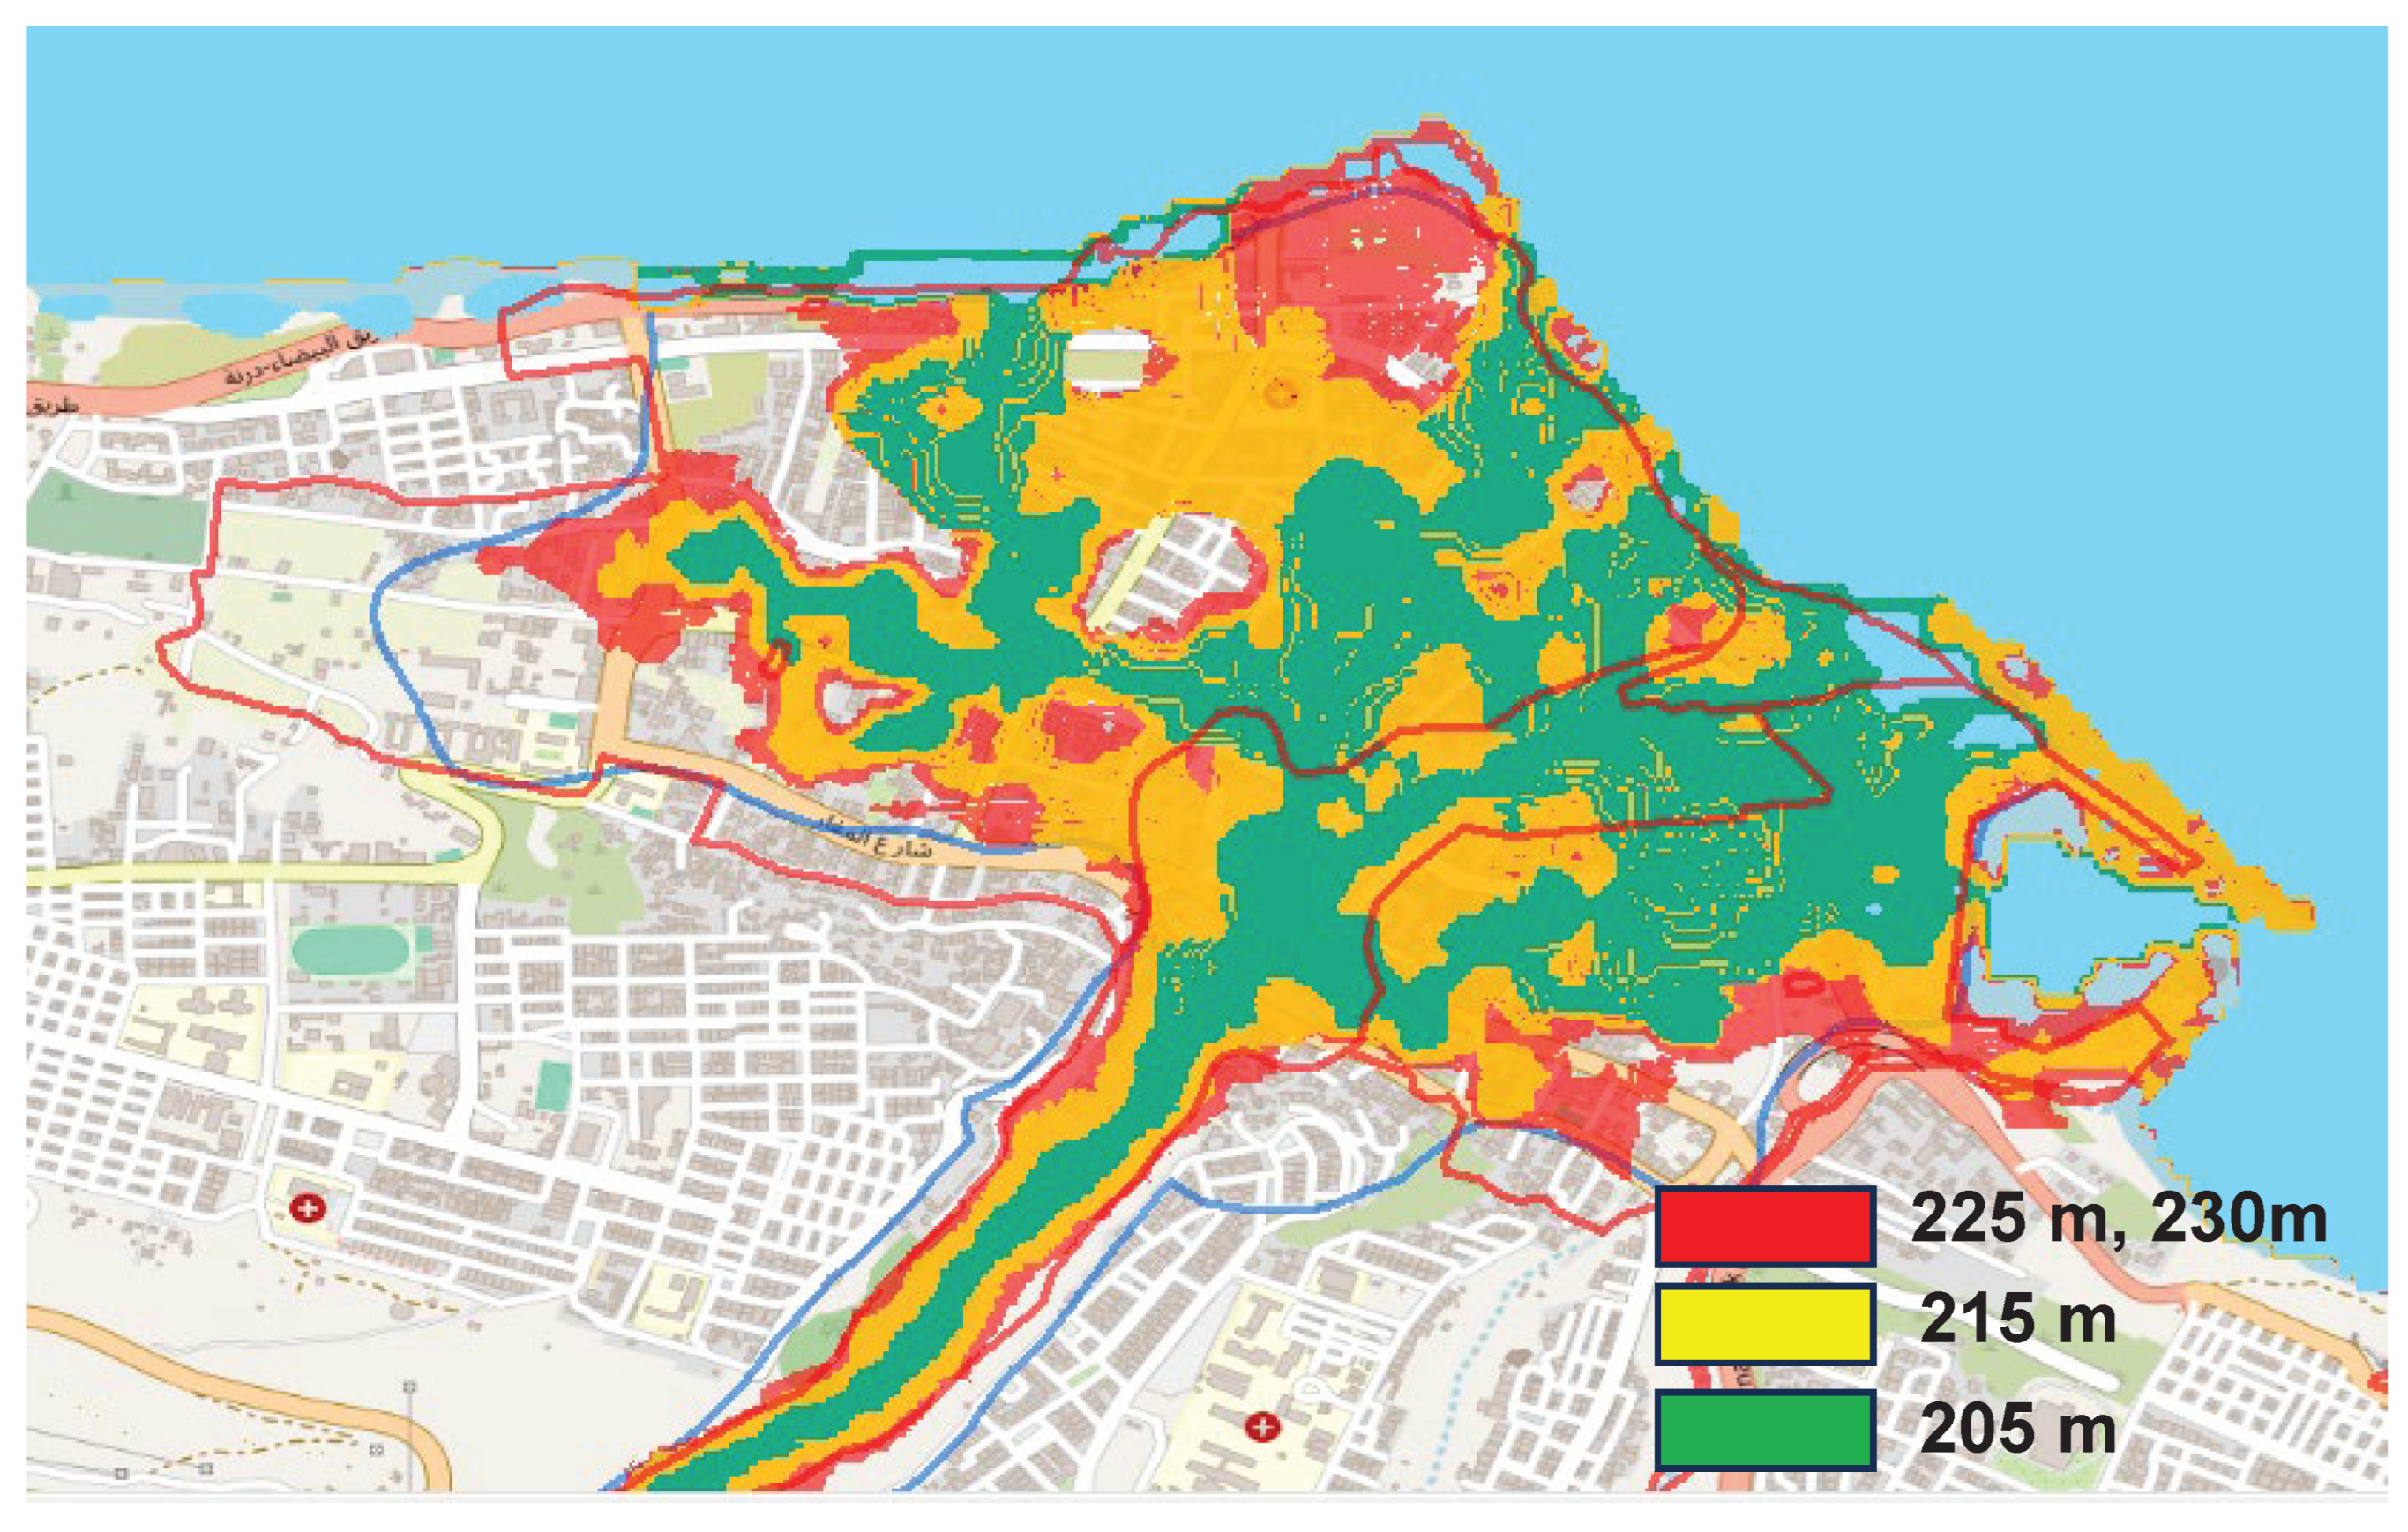
Figure 17.
Effect of friction coefficient on the peak flow and the arrival time at Derna city entrance.
Figure 17.
Effect of friction coefficient on the peak flow and the arrival time at Derna city entrance.
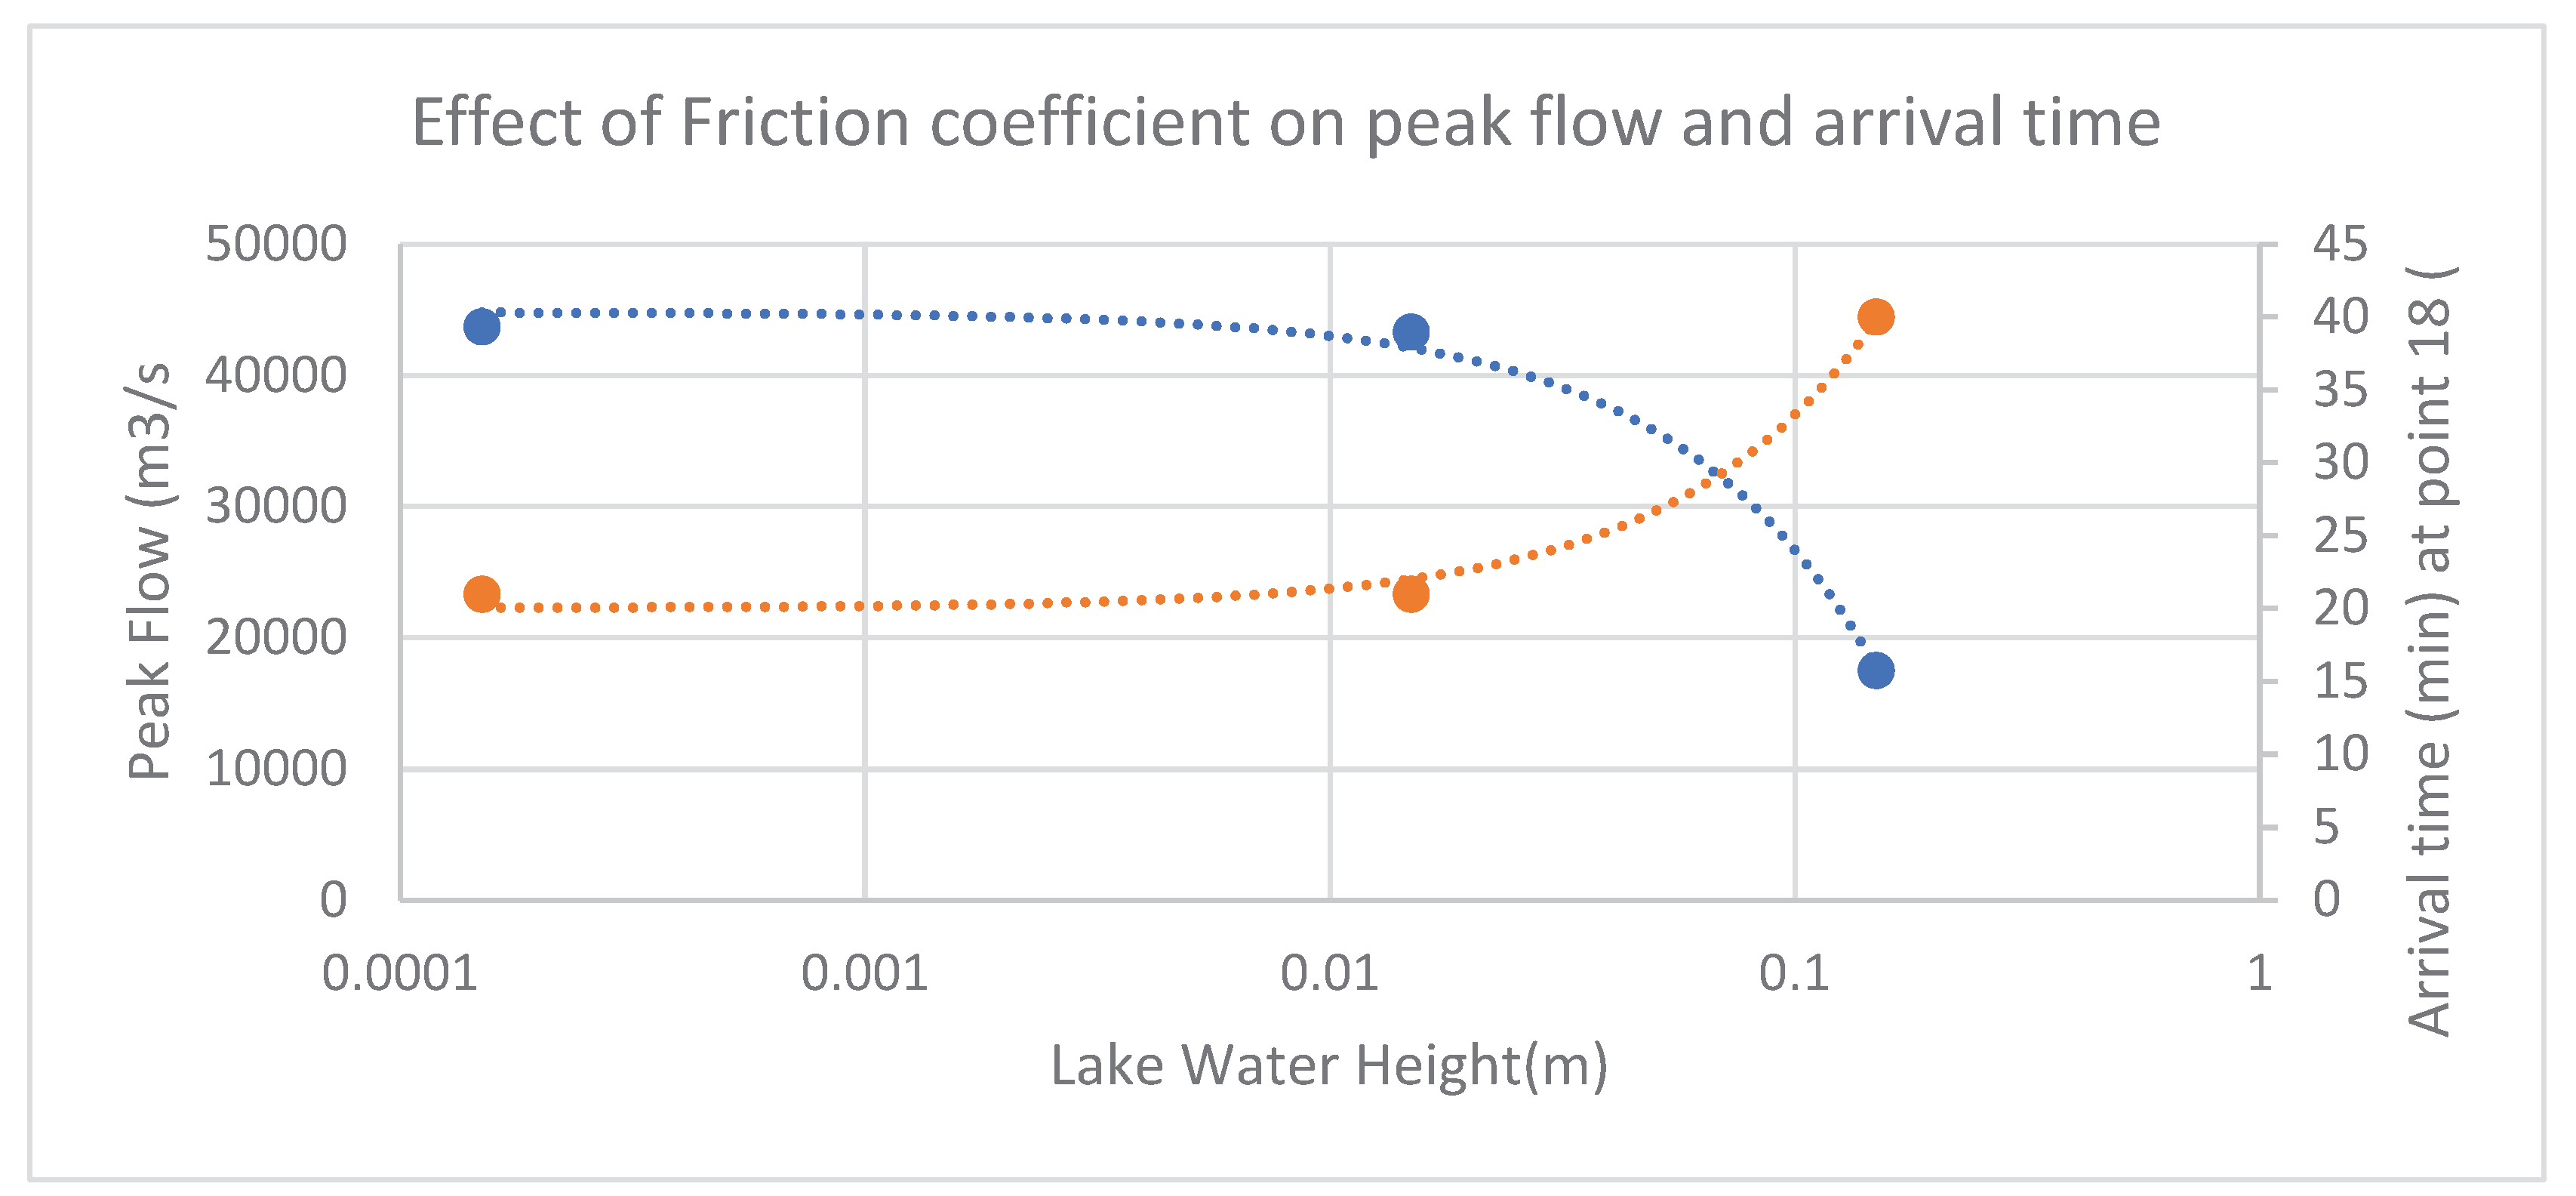
Figure 18.
Water height at the entrance of Derna (22.62784 / 32.74522) with different friction coefficients.
Figure 18.
Water height at the entrance of Derna (22.62784 / 32.74522) with different friction coefficients.
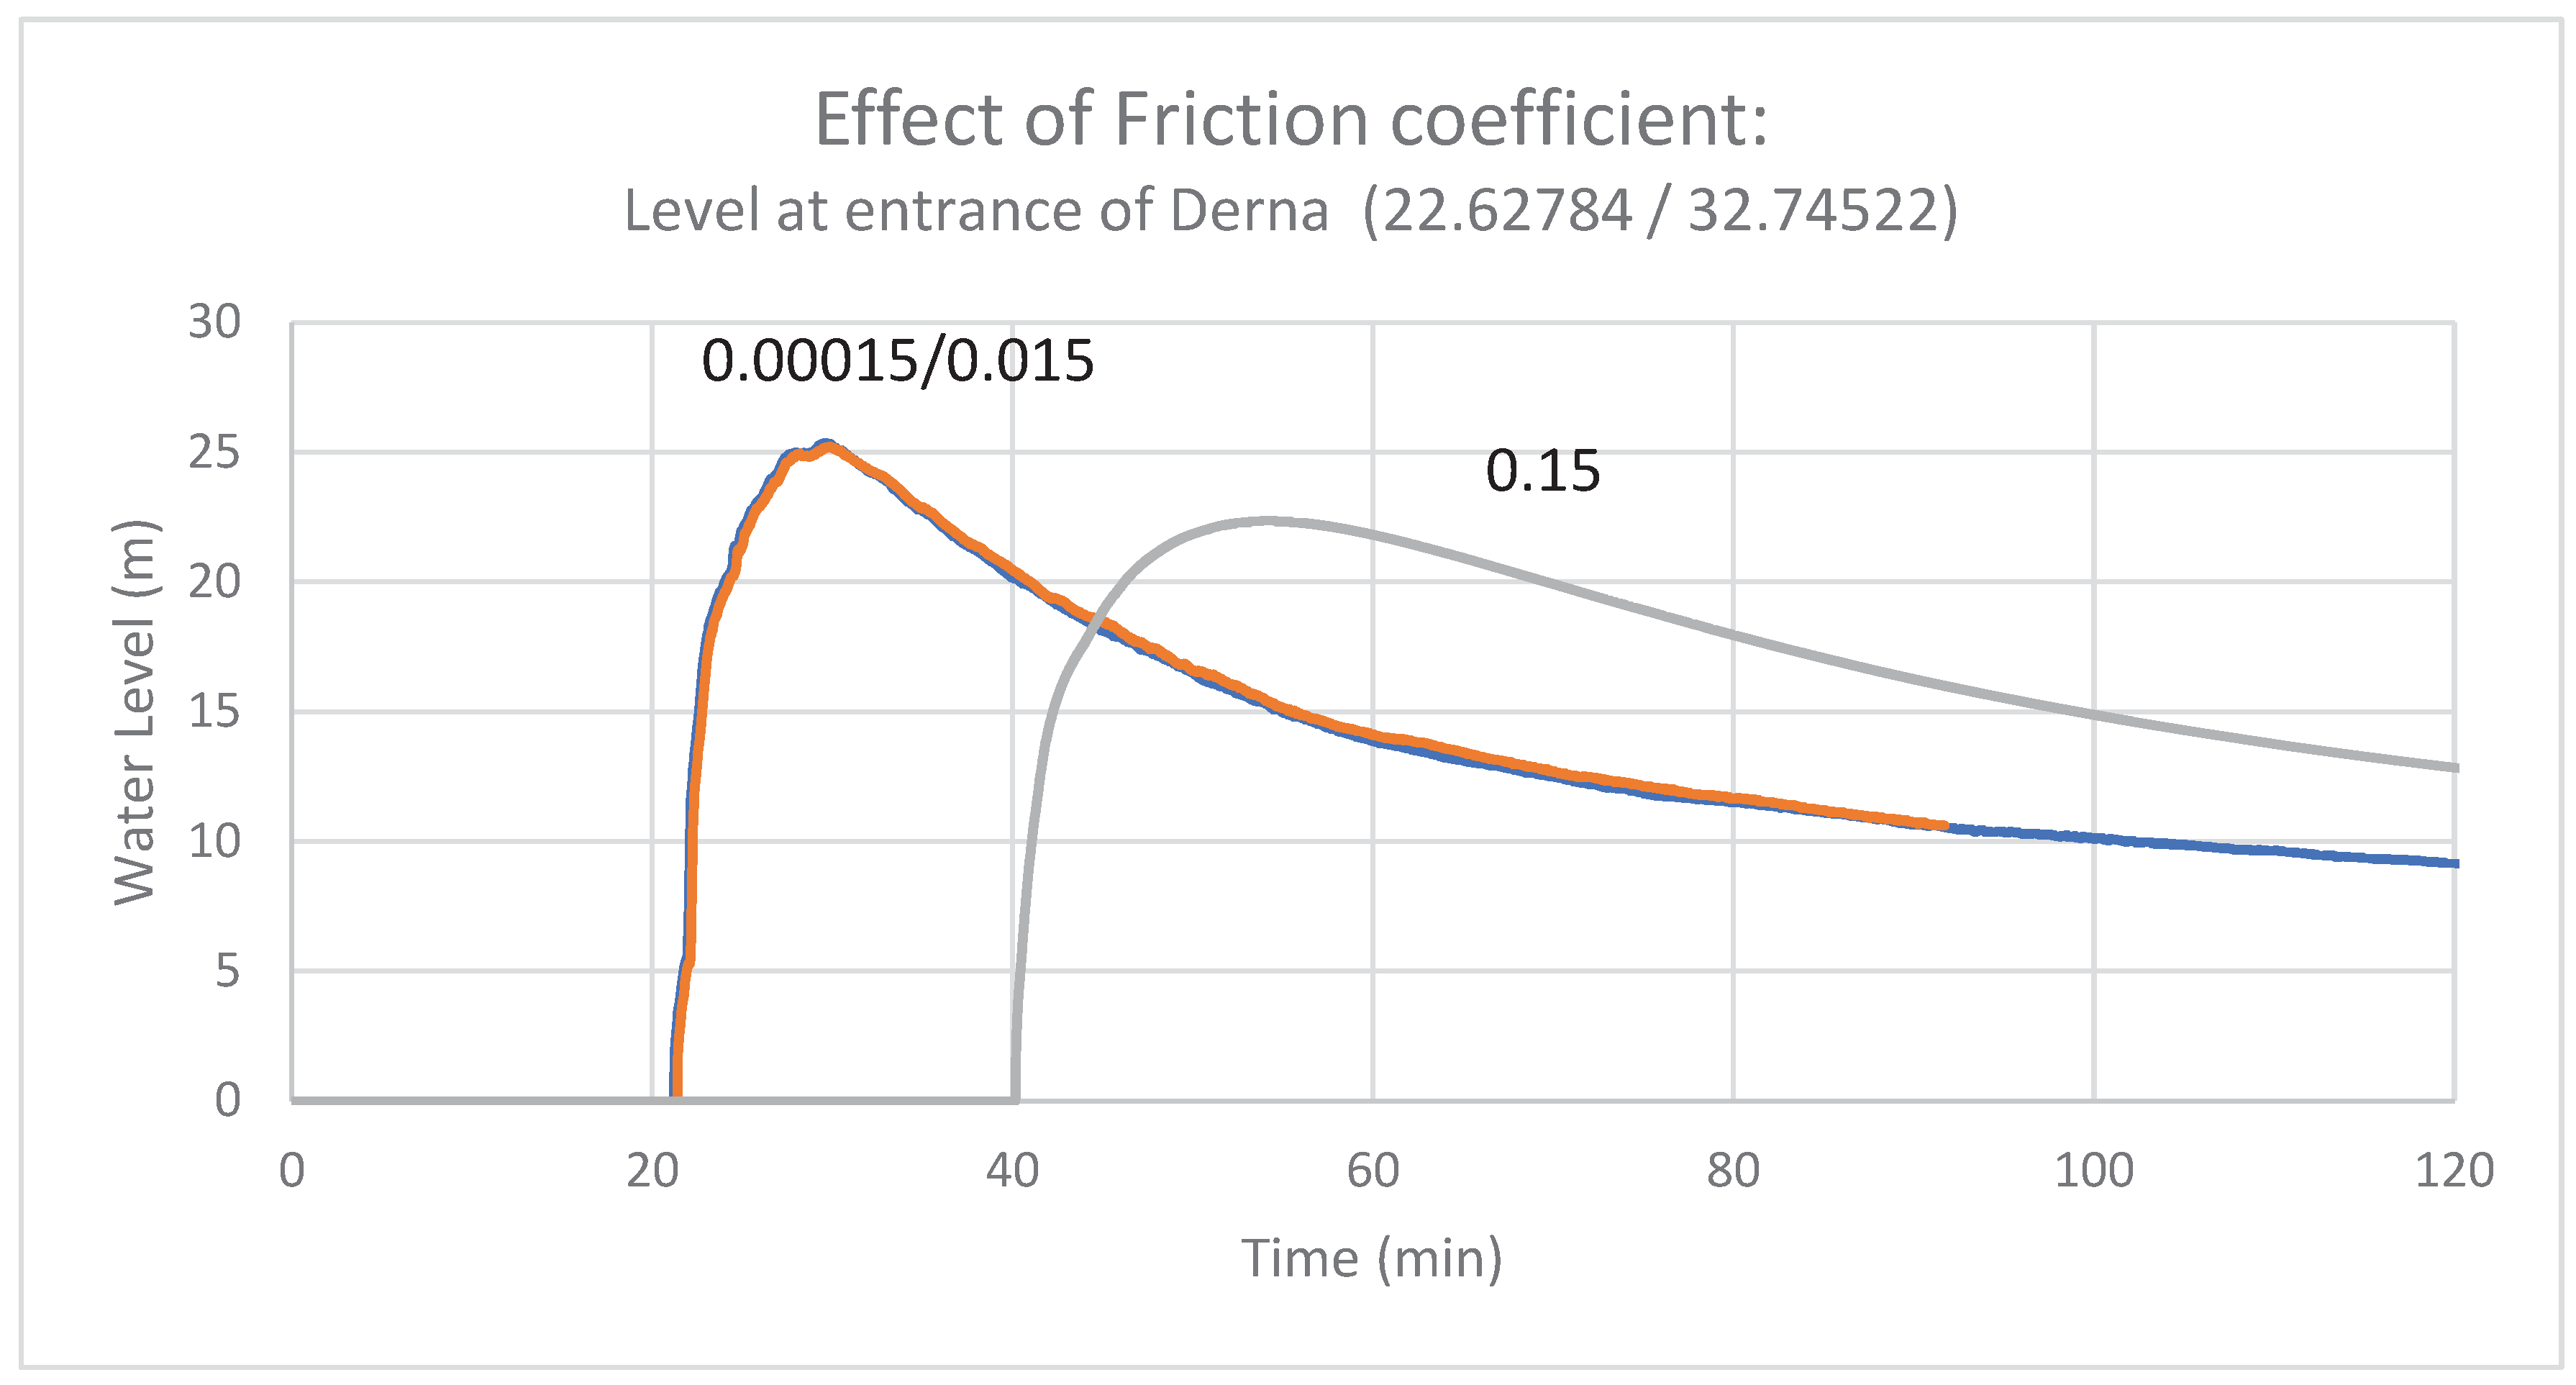
Figure 25.
Comparison of the flood depth from modelling and from visual interpretation of the images from selected locations.
Figure 25.
Comparison of the flood depth from modelling and from visual interpretation of the images from selected locations.
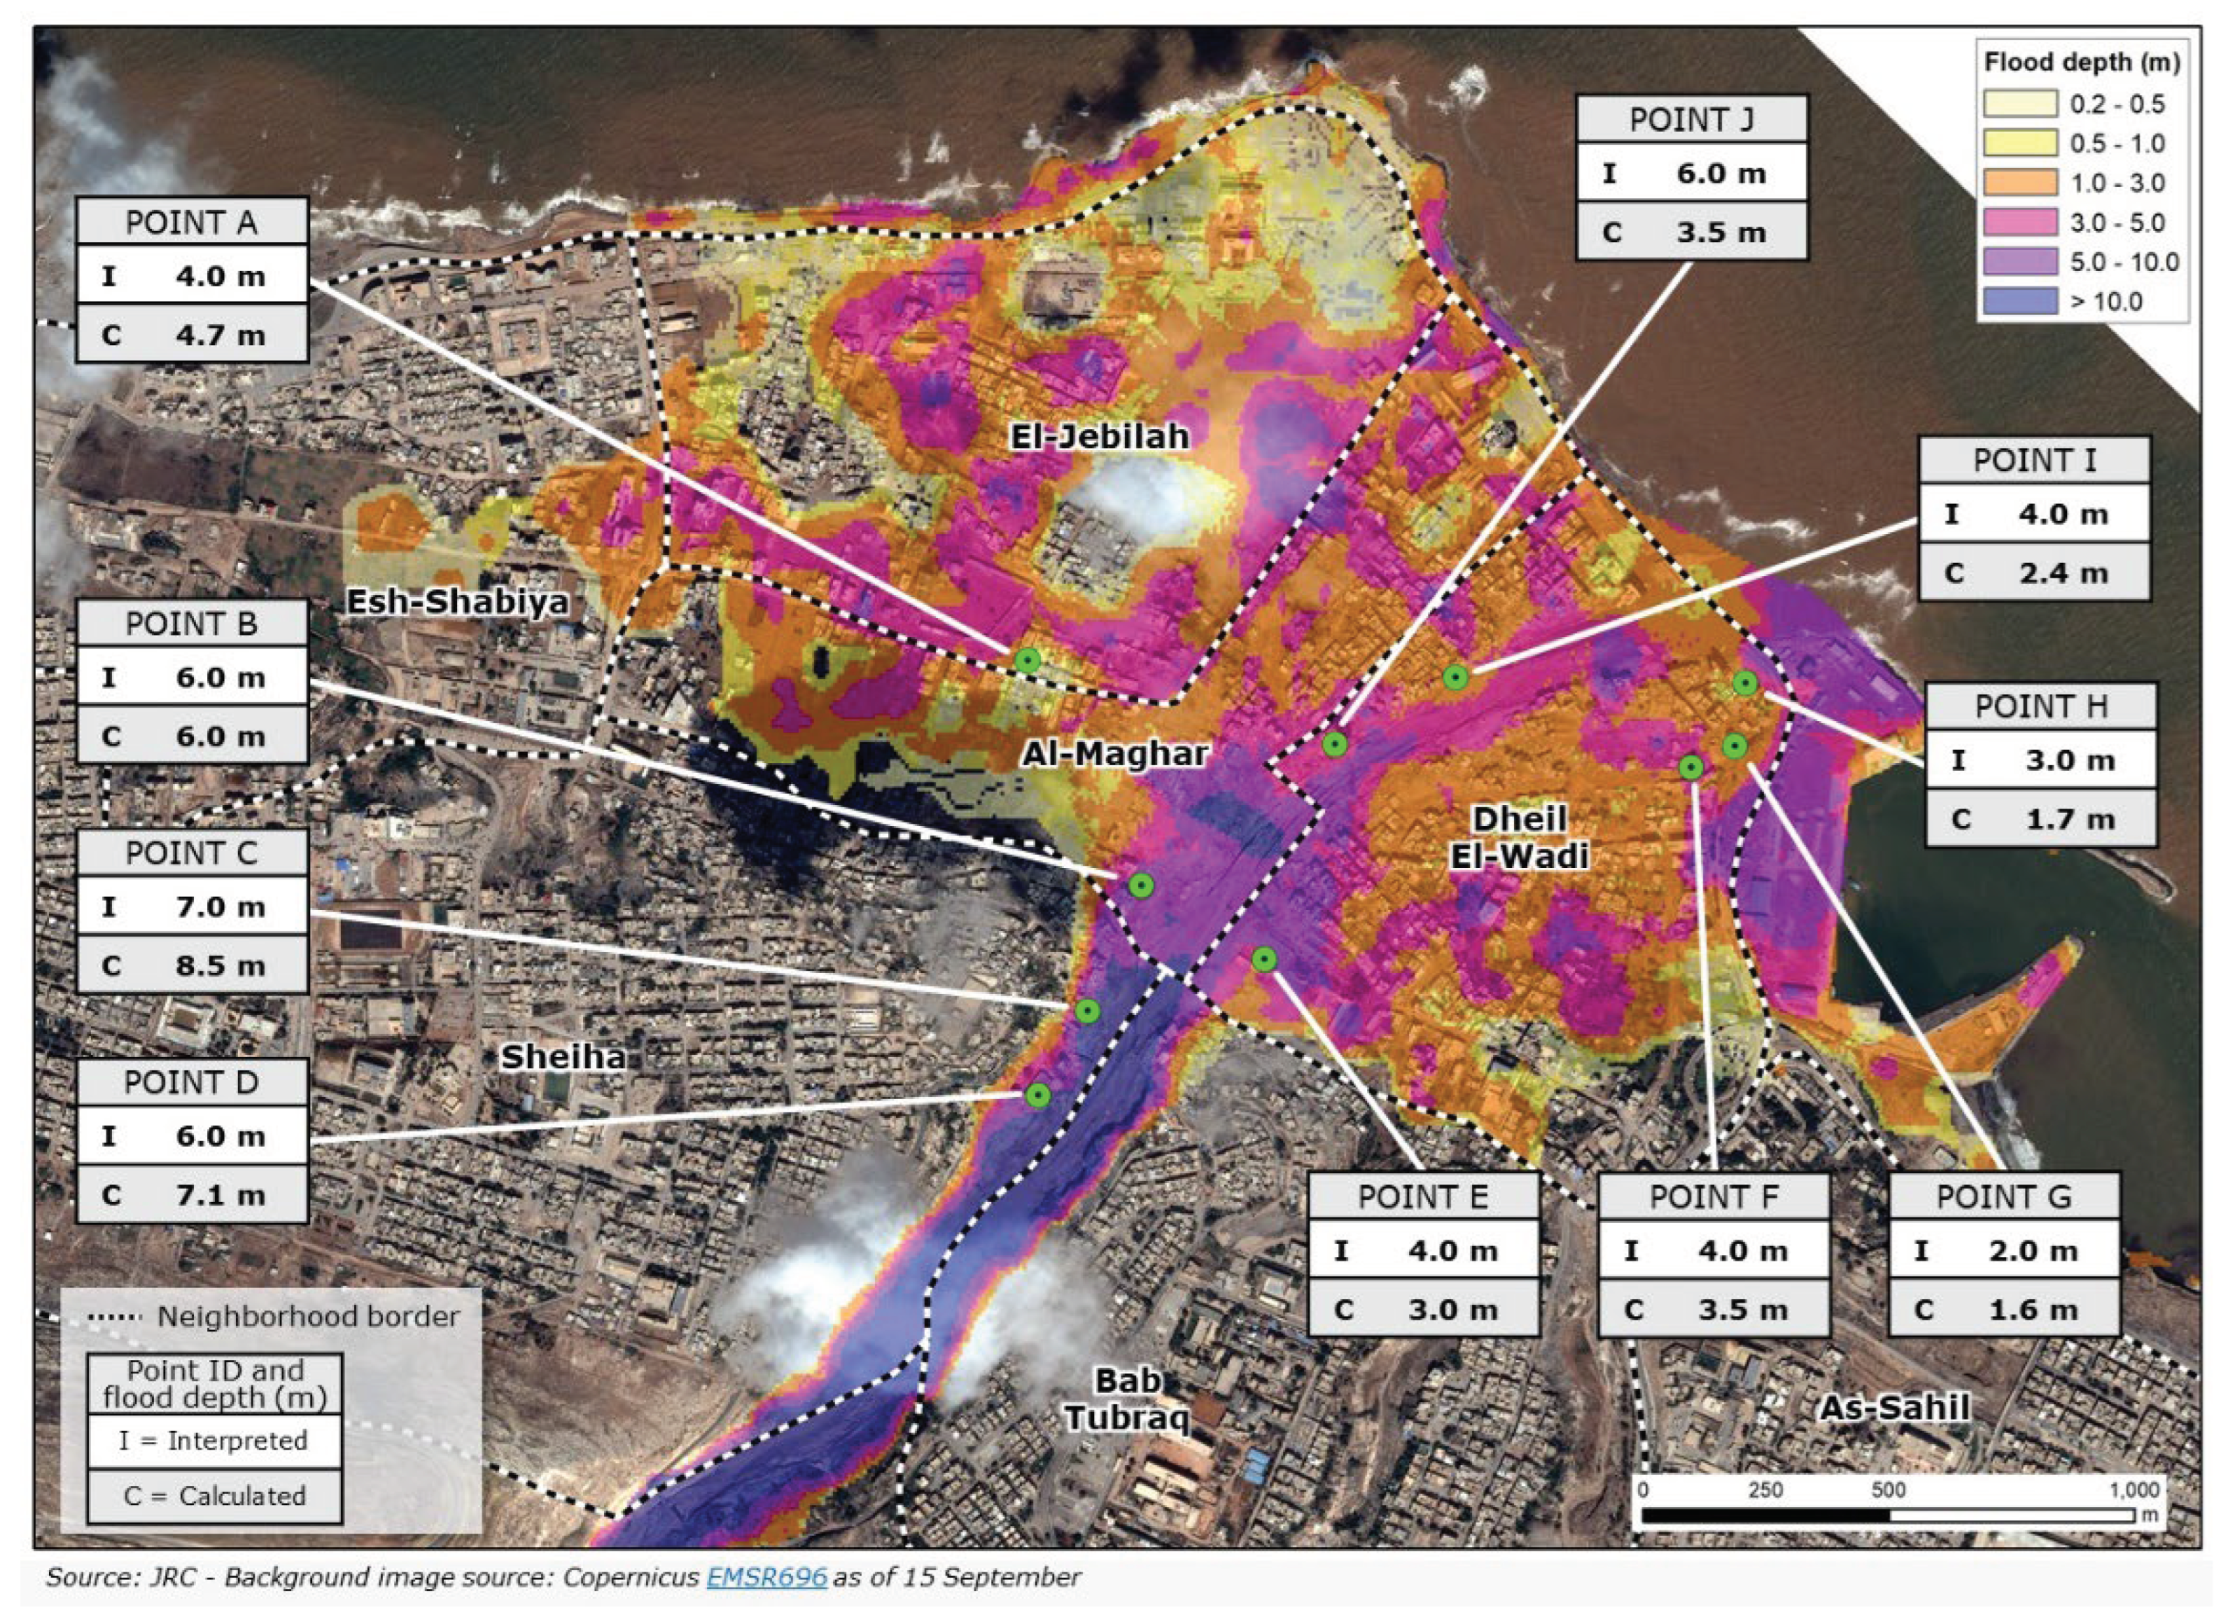
Figure 26.
Comparison between Interpreted points and 2 cases at 230 and 225 m Lake water height.
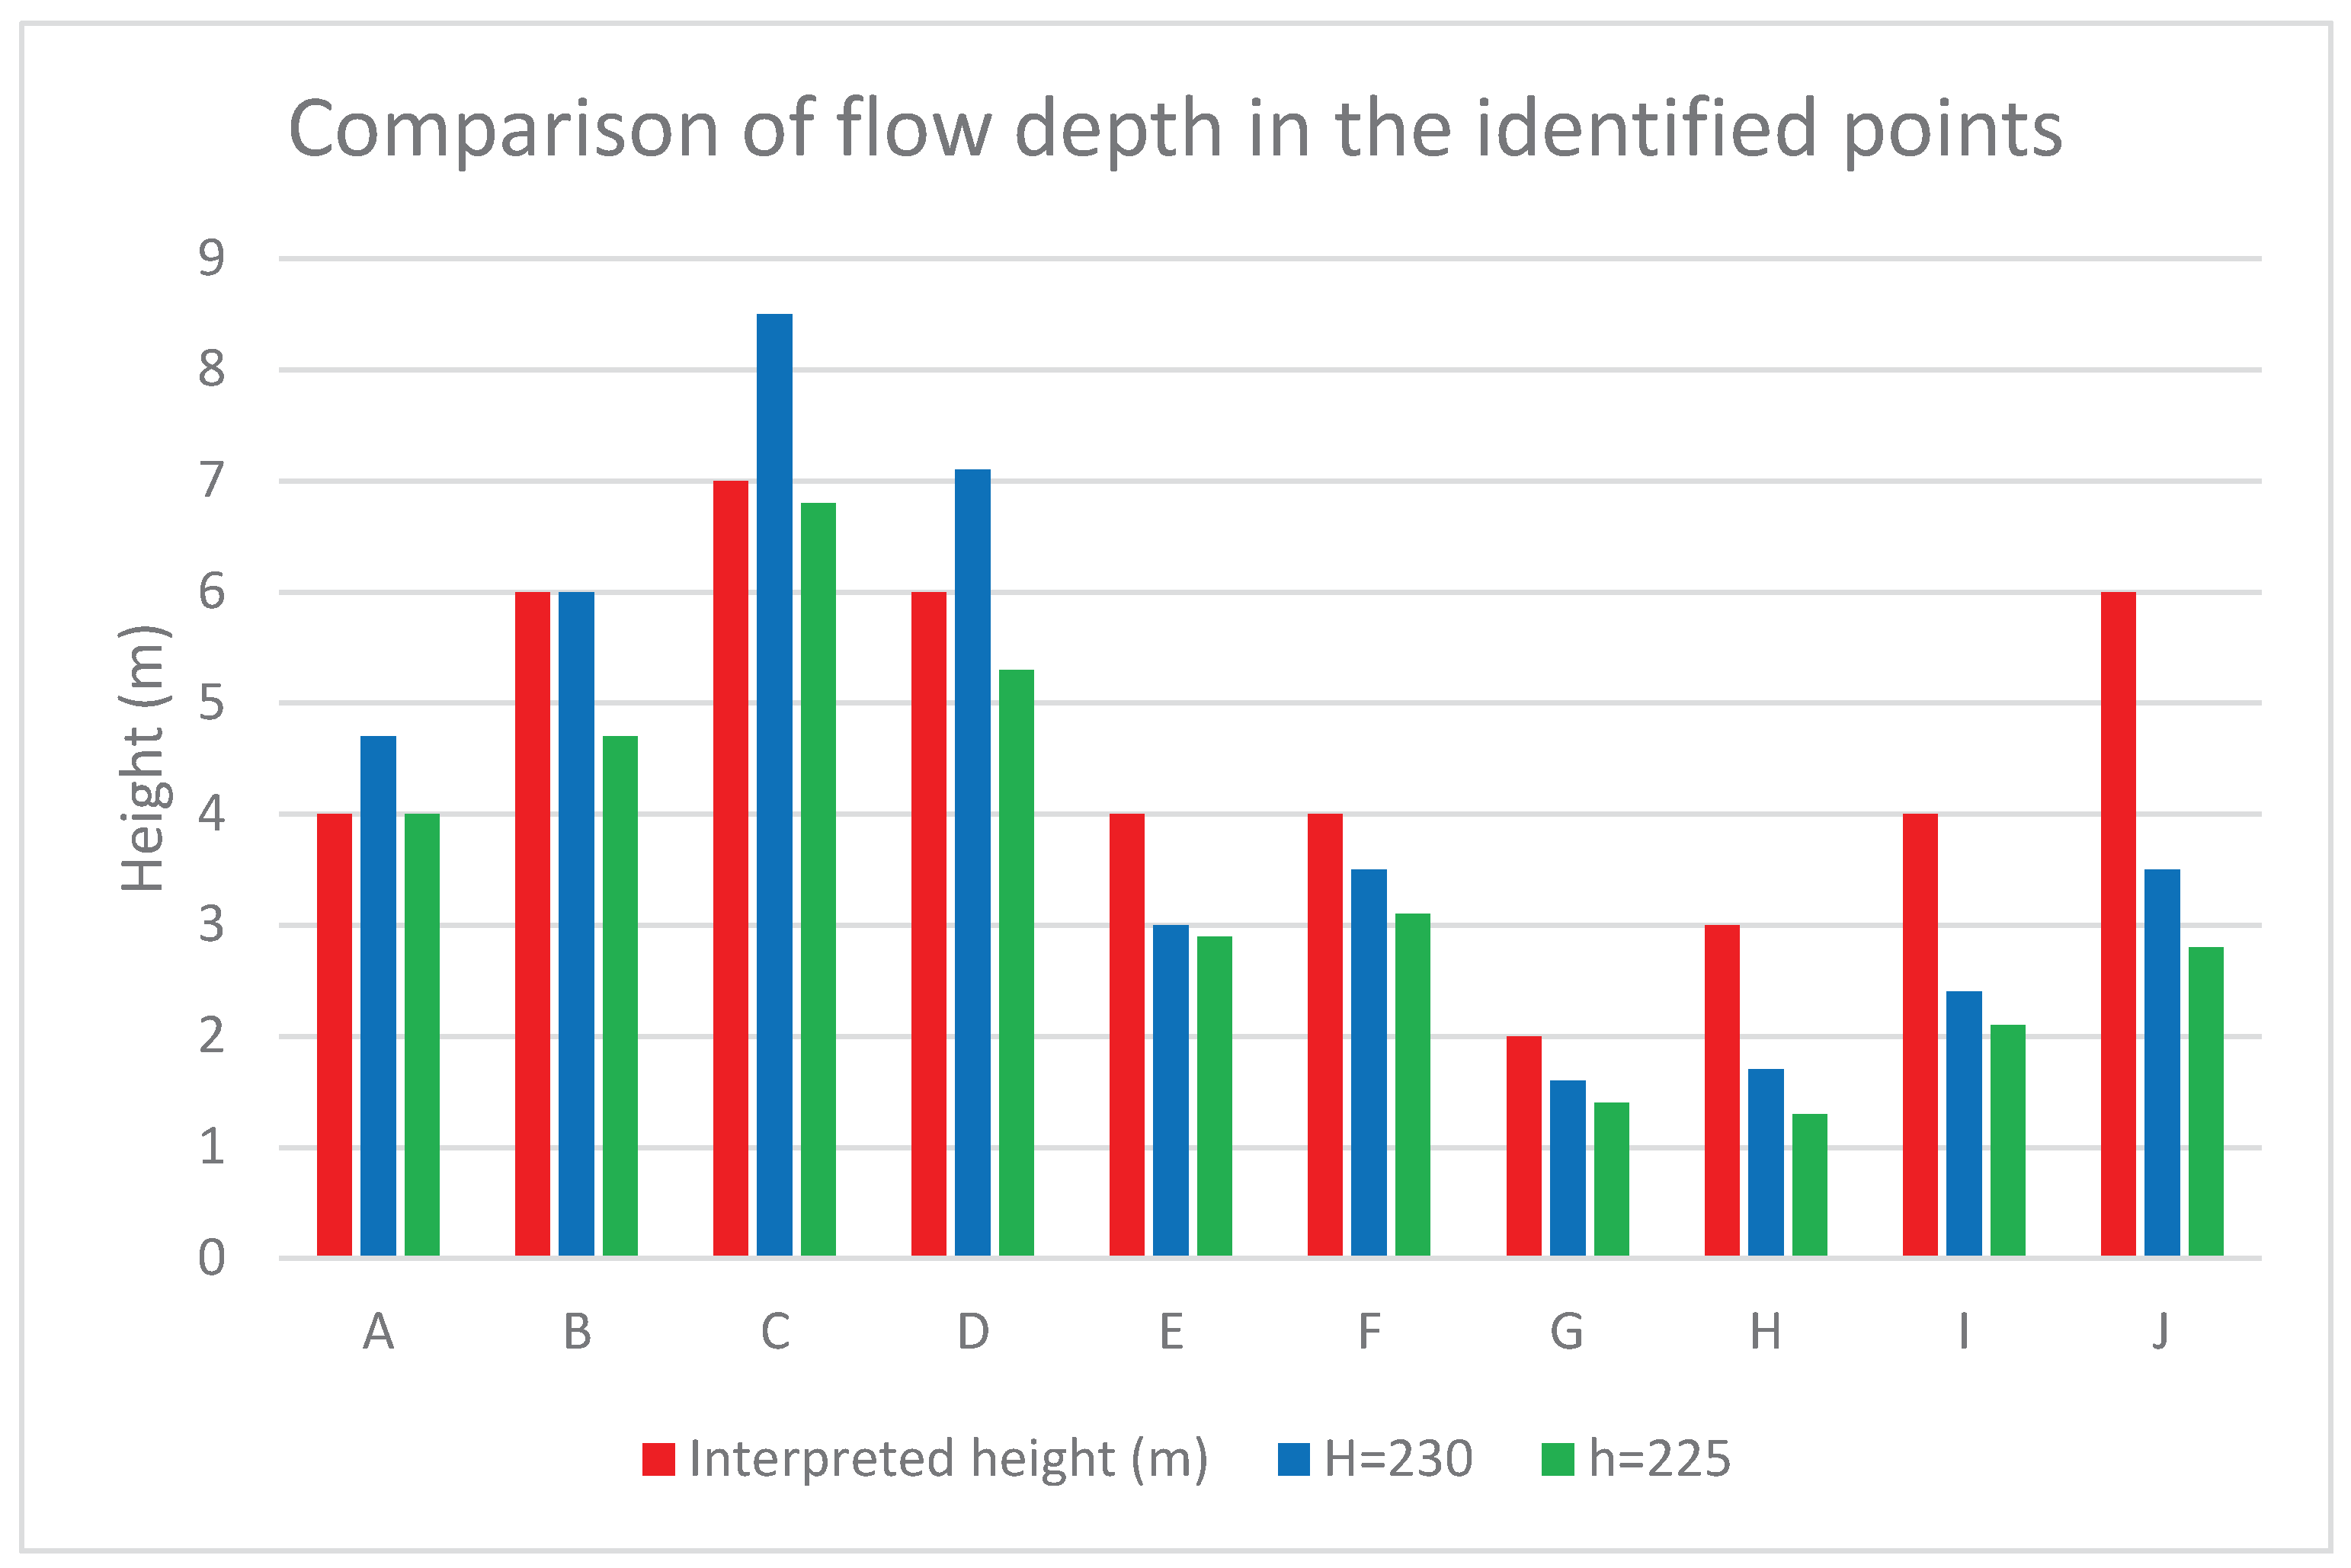
Table 2.
Inundated surface.
| Mode | Surface (km2) |
| UNOSAT | 3.42 |
| Copernicus | 3.62 |
| WL=225 BW=260 | 2.59 |
Table 3.
Population affected by water height with two population models: Landscan 2014 and the JRC Global Human Settlement Layer (GHSL).
Table 3.
Population affected by water height with two population models: Landscan 2014 and the JRC Global Human Settlement Layer (GHSL).
| Height range (m) | LANDSCAN 2014 | GHSL |
|---|---|---|
| 0.05-1.0 | 54,256 | 50,542 |
| 1.0-3.0 | 56,941 | 20,429 |
| 3.0-10. | 51 | 11 |
| 10.-20. | 1 | 0 |
| >20. | 0 | 0 |
| Total | 111,249 | 70,982 |
Disclaimer/Publisher’s Note: The statements, opinions and data contained in all publications are solely those of the individual author(s) and contributor(s) and not of MDPI and/or the editor(s). MDPI and/or the editor(s) disclaim responsibility for any injury to people or property resulting from any ideas, methods, instructions or products referred to in the content. |
© 2024 by the authors. Licensee MDPI, Basel, Switzerland. This article is an open access article distributed under the terms and conditions of the Creative Commons Attribution (CC BY) license (http://creativecommons.org/licenses/by/4.0/).
Copyright: This open access article is published under a Creative Commons CC BY 4.0 license, which permit the free download, distribution, and reuse, provided that the author and preprint are cited in any reuse.


