

Submitted:
19 March 2024
Posted:
22 March 2024
You are already at the latest version
Abstract
This paper mainly explores the feasibility of using desert sand (DS) and recycled aggregate in cement stabilized base. Recycled coarse aggregate (RCA) and DS serve as the substitutes of natural coarse and fine aggregates, respectively, in cement stabilized base. A four-factor and four-level orthogonal test is designed to analyze the unconfined compressive strength, splitting tensile strength, and compressive resilient modulus. Furthermore, this paper investigates the effects of cement content, fly ash (FA) replacement rate, RCA replacement rate, and DS replacement rate on the road performance of cement stabilized base composing of RCA and DS. The test results reveal that the performance of cement stabilized base with partial RCA instead of natural coarse aggregate (NCA) and partial DS instead of natural fine aggregate satisfy the road use. Meanwhile, DS is beneficial to improve the strength of cement stabilized base. The correlation and microscopic analyses of the test results imply the feasibility of applying DS and recycled aggregate to cement stabilized base. It is hoped that this paper can offer a solid theoretical foundation for promoting the application of DS and recycled aggregate in road engineering.
Keywords:
Recycled coarse aggregate
; Desert sand
; Cement-stabilized macadam
; Mechanical property
; Microstructure
1. Introduction
As a basic building material, cement-stabilized macadam (CSM) represents one of the most popular road base materials worldwide [1]. With robust bearing capacity, CSM is composed of suitable graded aggregate, cement with aggregate mass of 3% - 15%, and water with optimum water content [2]. Desert sand (DS) functions as the other highway base material with poor material properties, such as loose particles, small cohesion, weak gradation, low natural water content, and poor water permeability [3]. However, how to make good use of the characteristics of DS in road construction in desert areas to achieve the specified base strength becomes a novel direction for its usage [4]. On one hand, maintenance and reconstruction of cement concrete roads will produce numerous waste concrete. On the other hand, in response to the needs of national infrastructure development, highway projects require a large amount of sand and gravel these years, gradually increasing the demand for sand and gravel resources. Consequently, using recycled aggregates is of great significance [5,6,7,8]. Natural DS is abundant and concentrated in northwest China such as Xinjiang. However, it is less exploited, leading to the contradiction between supply and demand. If local materials can play a better role in promoting the application of DS in highway engineering, it can not only solve the insufficient medium sand resources but also reduce the transportation costs.
Corradini [9] explored the application of recycled aggregate in road pavement engineering through triaxial test of cyclic load, and reported that the recycled aggregate exhibited the stable rebound performance before and after cement addition. By measuring the mechanical strength and road performance of recycled CSM, Lyu et al. [10,11] believed that the utilization of recycled aggregate meets the specified requirements for road bases. Zhao et al. [12] demonstrated that maintaining the content of recycled aggregate at 25% - 30% is conductive to enhancing the fatigue resistance of CSM. Hu et al. [13] unveiled that the skeleton dense cement-stable base structure can improve the strength and crack resistance of CSM. Zou [14] used cement and fly ash (FA) to prepare recycled aggregate CSM. He proposed that the compressive strength of recycled aggregate was higher than that of natural aggregate, suggesting the potential use of full recycled aggregate in preparation of CSM. Yu [15] prepared CSM by replacing natural aggregate with 0%, 25%, 50%, 75%, and 100% recycled aggregate at 3%, 4%, 5%, and 6% cement content, respectively, and obtained the optimum content of recycled aggregate and cement through the mechanical index of the mixture.
Employing DS to fill the road base can not only control sand damage but also build land and return to the field. Moreover, filling the DS road base in irrigation area, paddy field, and soft foundation exerts a good effect on blocking capillary water and strengthening the stability of road base. Netterberg et al. [16] conducted a long-term observation on the test section of DS road base in South Africa and found that the road structure can maintain stability. Similarly, Song et al. [17] applied 6% DS instead of fine aggregate to the CSM and demonstrated that it could meet the road performance of the base mixture through the indoor test and test section tracking detection. Ma et al. [18] developed indoor mix rate test by adding cement and gravel in DS and proved the feasibility of applying DSCSM as base in highway.
This paper aims to investigate the road performance of cement stabilized base when the recycled aggregate and DS are both applied as the primary materials of road base. It ultimate goal is to provide a theoretical basis for practical application of DS and recycled aggregate, thus promoting their wider usage in road construction.
2. Materials and Methods
2.1. Testing Materials
1) Cement: Tianshan P·O42.5R cement produced by Xinjiang Urumqi Tianshan Cement Plant, with the actual strength of 44.6 MPa;
2) Natural coarse aggregate (NCA): pebbles in Urumqi, Xinjiang, with particle size of 5 ~ 30 mm and bulk density of 2,700 kg/m3;
3) Recycled coarse aggregate (RCA): it is broken from the abandoned cement stabilized base after the demolition of a military apron in Liugong Town, Changji Prefecture, Xinjiang. The particle size ranges from 5 mm to 30 mm, and the bulk density is 2,600 kg/m3. The detailed performance indicators are outlined in Table 1.
4) Fine aggregate: washing machine-made sand in Xinjiang, with fineness modulus of 3.0 and apparent density of 2,487 kg/m3;
5) DS: taken from the Taklimakan Desert, with the fineness modulus of 0.12, the average particle size of 0.118 (Table 2), the bulk density of 1,334 kg/m3, the apparent density of 2,790 kg/m3, the water content of 0.4%, and the mud content of 0.4%.
6) FA: produced in Xinjiang Kangsheng Lvyuan Building Materials Co., Ltd.

Table 1.
Performance indicators of coarse aggregate.
| Indicators | Unit | NCA | RCA | Specification |
|---|---|---|---|---|
| Apparent specific gravity | g·cm-3 | 2.687 | 2.613 | ≥2.50 |
| Water absorption | % | 0.97 | 4.93 | ≤3.0 |
| Soil content | % | 0.8 | 1.4 | ≤1.5 |
| Flat elongated particles content | % | 6.4 | 13.7 | ≤18 |
| Ruggedness | - | 4.8 | 9.5 | ≤12 |
| Crush value | % | 15.7 | 21.9 | ≤26 |
Table 2.
Particle size distribution of DS.
| Grain size | 0.16 | 0.075 | <0.075 |
|---|---|---|---|
| Cumulative sieve margin/% | 11.8 | 88.2 | 10.2 |
2.2. Gradation Design
According to the specification [18], the upper, median, and lower limits of the gradation range are selected corresponding to the three gradations of the skeleton dense CSM. To ensure the performance comparability of the CSM composing of DS and RCA (denoted as DRCSM herein) under different mix ratios, the gradation curve of each mixture group in the test is adjusted to the same as far as possible. The coarse, median, and fine gradations of the DRCSM correspond to the skeleton pore structure, skeleton dense structure, and suspension dense of aggregate, respectively. Table 3 presents the passing rate of aggregate screening under different sieves, and the corresponding aggregate gradation curve is illustrated in Figure 1.
2.3. Experimental Design
Orthogonal test was designed. The specific mix rate of DRCSM is listed in Table 4. Further, the compaction test of stable material is carried out according to the specification [19]. The amounts of water and dry mixture are determined based on the optimum water content and maximum dry density obtained from the test. The specimens for unconfined compressive strength, splitting tensile strength, and anti-scouring test is cylindrical (150 mm × 150 mm), and those for dry shrinkage test are beam (150 mm × 150 mm × 400 mm). The specimens are fabricated by static pressure method using universal press, and the degree of compaction is 98%. 6%, 8%, 10%, and 12% P·O42.5R Portland cement are added to the DRCSM.
The specimens are cured for 7, 28, and 90 d, followed by 24-h-soaking after the specified age. Subsequently, the surface moisture is eliminated and the mass is weighed. The height is measured to be accurate at 0.1 mm, and the surface is flattened with a scraper. Next, the unconfined compressive strength and splitting tensile strength are tested by universal pressure testing machine, as displayed in Figure 2, and the fixture used in the splitting test is shown in Figure 3. During the test, the loading rate is set as 1 mm/min, and the pressure when the specimen is cracked is assigned as the maximum pressure.
The compressive strength of the mixture specimen is calculated according to Equation (1):
In the equation: -Compressive strength of the specimen/MPa;
-Maximum pressure at specimen failure/N;
-The sectional area of the specimen/mm2.
The splitting tensile strength of cement stabilized base specimen is calculated according to Equation (2):
In the equation: -Splitting tensile strength of the specimen/MPa;
-Diameter of specimen/mm;
-Width of the layering/mm;
-The central angle corresponding to the half strip width/°;
-Maximum pressure at specimen failure/N;
-Height of the specimen after immersion/mm.
Expression for calculating the compressive resilient modulus under each load level is given in Equation (3):
In the equation: -Compressive resilient modulus/MPa;
-Unit pressure/MPa;
-Height of the specimen/mm;
-Rebound deformation of the specimen/mm.
2.4. Test Methods
The specimen preparation and strength test are conducted in adherence to the standard requirements [19]. Using the results of the standard compaction test, the mass of the mixture required to prepare the specimen is calculated based on the optimum water content and the maximum dry density obtained from the compaction test. The specimen (Φ 150 mm × 150 mm) is formed by static pressure method, as shown in Figure 4. 6 specimens are fabricated for each mixture rate and undergo the parallel test in turn, with the average value serving as the test result. After molding, the specimens were demolded and placed in a standard curing room set at a temperature of 20°C ± 2°C and a relative humidity of more than 95% for standard curing.
3. Results and Discussions
3.1. Unconfined Compression Strength
Table 5 lists the unconfined compressive strength obtained by orthogonal test at 7, 28, and 90 d. Figure 5 explicates the evolution of compressive strength of mixture with age under 6 % cement dosage, which is served as an example herein. The figure signifies that the compressive strength of CSM mixture changes with the curing age. Notably, the growth rate is fast before 28 d but slows down after that day. Consequently, when CSM is functioned as the semi-rigid road base, the curing time should be maintained until the basic strength is formed to avoid the damage of the base caused by the load in the subsequent construction. When the cement content is greater than or equal to 8%, the compressive strength of CSM can satisfy the specification for heavy traffic on the first-class highway.
In the specification [19], the unconfined compressive strength obtained on the 7th day (referred to as 7-d unconfined comprehensive strength) is undertaken as the reference to measure the road performance of cement stabilized base. The specific range analysis on the orthogonal test results is presented in Table 6.
Figure 6.
Mean range of each factor at each level.
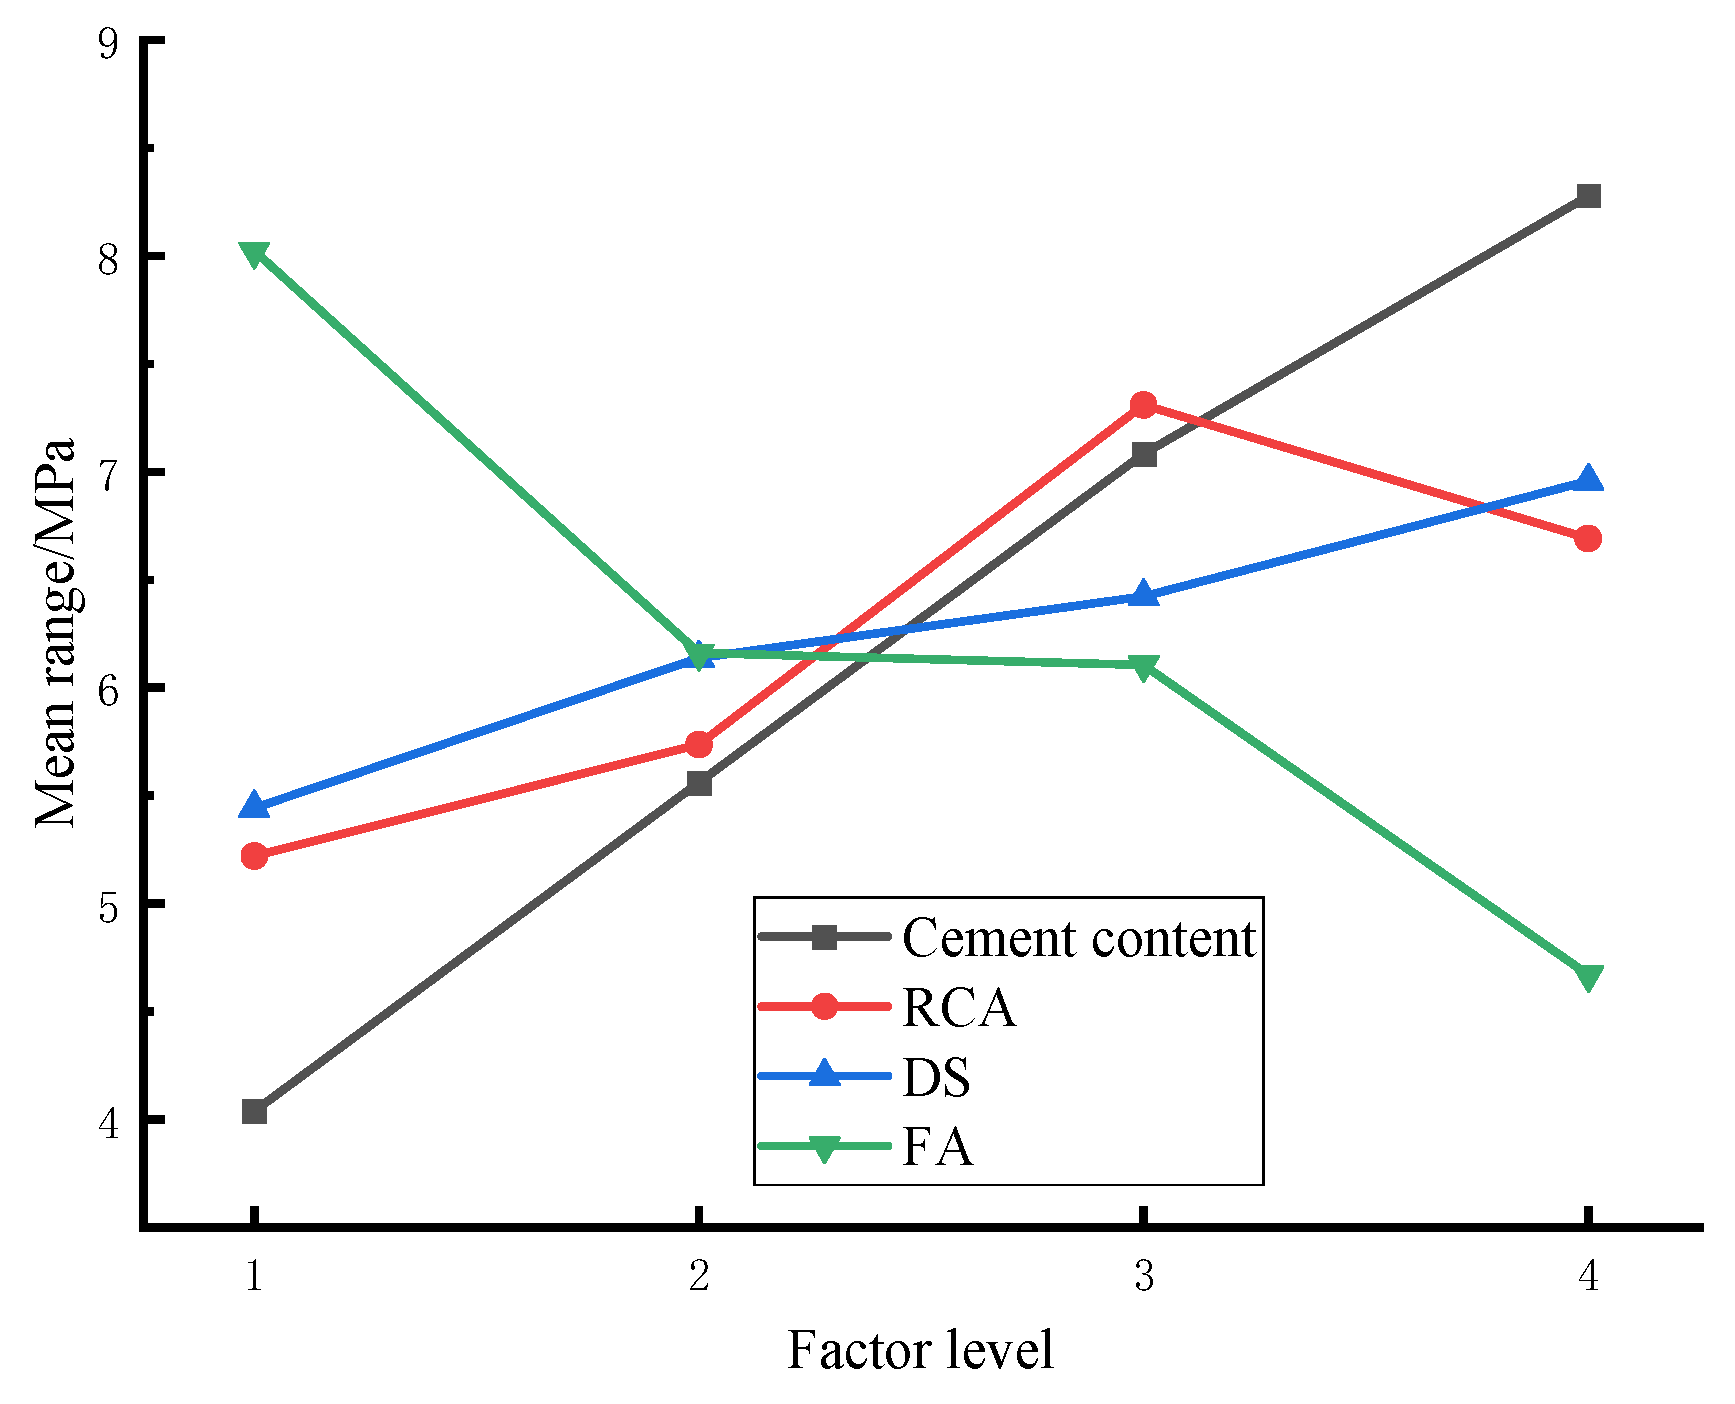
It is evident from the Table 6 that different factors exert varying influences on the 7d unconfined compressive strength. Specifically, in the selected four-level change interval, influence of each factor on the 7-d unconfined compressive strength adheres to the following order: cement dosage > FA replacement rate > RCA replacement rate > DS replacement rate. Furthermore, the above figure reveals that the compressive strength of the mixture is higher under the 30% DS replacement rate and 50% recycled aggregate replacement rate.
Range analysis on the test results can’t estimate the test error. On the other hand, variance analysis can identify the differences and error fluctuations among the test results generated by interaction among distinct levels, thus improving the accuracy of the result analysis. Consequently, the reliability of the analysis results can be enhanced by performing the variance analysis on the test results. Table 7 shows the variance analysis of the orthogonal test results of the 7-d unconfined compressive strength.
It becomes evident from the Table 7 that the F test results of the four orthogonal factors are:
a. The cement content: F > F0.01, proving that the cement content significantly affect the 7-d unconfined compressive strength;
b. The replacement rate of RCA: Fcement > F > F0.01, indicating that the RCA replacement rate exerts a highly significant effect on the 7-d unconfined compressive strength, which is weaker than thatof cement content;
c. The DS replacement rate: F0.01 > F > F0.05, suggesting that the DS replacement rate greatly influence the 7-d unconfined compressive strength;
d. FA replacement rate: Fcement > F > FRCA > F0.01, implying that the influence of FA replacement rate on the 7-d unconfined compressive strength is highly significant, showing its degree between cement content and RCA replacement rate.
Based on the results of range analysis and variance analysis, the following order can be concluded when comparing their influence on the unconfined compressive strength of cement stabilized base: cement content > FA replacement rate > RCA replacement rate > DS replacement rate. It signifies that the appropriate amount of RCA and DS can improve the compressive strength of CSM mixture.
3.2. Cleavage Strength
The stipulated 90-d splitting tensile strength of the base is 0.4 ~ 0.6 MPa [19]. range analysis of the orthogonal test results is presented in Table 8. It suggests that the four orthogonal factors influencing the 90-d splitting tensile strength exhibit the consistent order with that of the compressive strength. Specifically, in the selected four-level change interval, order of the influence degree of factors on the 90-d splitting tensile strength is observed as cement dosage > FA replacement rate > RCA replacement rate > DS replacement rate.
The variance analysis on the orthogonal test results of the 90-d splitting tensile strength in Table 9 displays the F test results of the four orthogonal factors, as follows:
a. The cement content: F > F0.01, proving that the cement content plays a significant role in influencing the 90-d splitting tensile strength;
b. The RCA replacement rate: Fcement > F > F0.01, indicating that the RCA replacement rate exerts a highly significant effect on the 90-d splitting tensile strength, which is weaker in contrast to that of cement content;
c. The DS replacement rate: F0.01 > F > F0.05, signifying that the DS replacement rate significantly influence the 90-d splitting tensile strength;
d. The FA replacement rate: Fcement > F > FRCA > F0.01, suggesting that the FA replacement rate extremely impact the 90-d splitting tensile strength, whose degree is between the cement content and the RCA replacement rate.
Table 9.
Variance analysis results of the 90-d splitting tensile strength.
| Factor | Cement content | RCA replacement rate | DS replacement rate | FA replacement rate | Error |
|---|---|---|---|---|---|
| Square of deviance | 0.830 | 0.175 | 0.087 | 0.465 | 0.049 |
| Degree of freedom | 3 | 3 | 3 | 3 | 15 |
| Estimate of variance | 0.277 | 0.058 | 0.029 | 0.155 | 0.016 |
| F0.01 | 5.417 | 5.417 | 5.417 | 5.417 | — |
| F0.05 | 3.287 | 3.287 | 3.287 | 3.287 | — |
| F | 17.090 | 3.606 | 1.782 | 9.572 | — |
Based on the results of range analysis and variance analysis, it can be concluded that the order of influence degree of the four factors on the unconfined compressive strength of cement stabilized base is: cement dosage > FA replacement rate > RCA replacement rate > DS replacement rate. It reveals that increasing the cement content can enhance the binding among mixture particles and the base strength. FA exhibits poor performance, so it can decrease the strength of the base as an alternative material for cement. Meanwhile, FA demonstrates distinct cementitious properties with cement. As a result, it will induce significant decrease in base strength if too much FA is applied to substitute cement. When the RCA replacement rate is 50 %, the optimal effect can be achieved. The analysis unveils that the RCA used in this crushing exhibits better performance, showing little effect on in case of partial use. However, it will still affect the base strength when it is applied to substitute most natural aggregate. The particle size of DS is smaller. Using DS to partially replace fine aggregate can improve the gradation of the mixture and an appropriate amount of DS can fill the pores among the aggregates, making the interior of the base more dense, thereby improving the strength of the cement stabilized base.
The 90-d compressive strength and splitting tensile strength of DRCSM in range analysis were taken separately to analyze the correlation between the compressive strength and splitting tensile strength of CSM by curve fitting.
Figure 7 reflects that the linear fitting equation of the 90-d compressive strength and splitting tensile strength of DRCSM can be expressed as follows:
The correlation coefficient is , which suggests a good correlation between the 90-d compressive strength and splitting tensile strength of the mixture.
In the equation: ——Splitting tensile strength of the specimen/MPa;
——Compressive strength of the specimen/MPa;
——Correlation coefficient.
The evaluation parameters of CSM mixture stipulated in the specification include 7-d unconfined compressive strength and 90-d splitting tensile strength. Due to similar development law of compressive strength and splitting tensile strength with age in the experimental results, correlation between 7-d compressive strength and 90-d splitting tensile strength of mixture can be further analyzed under the controlled test amount.
Figure 7.
Correlation between 90-d compressive strength and splitting tensile strength of mixture.
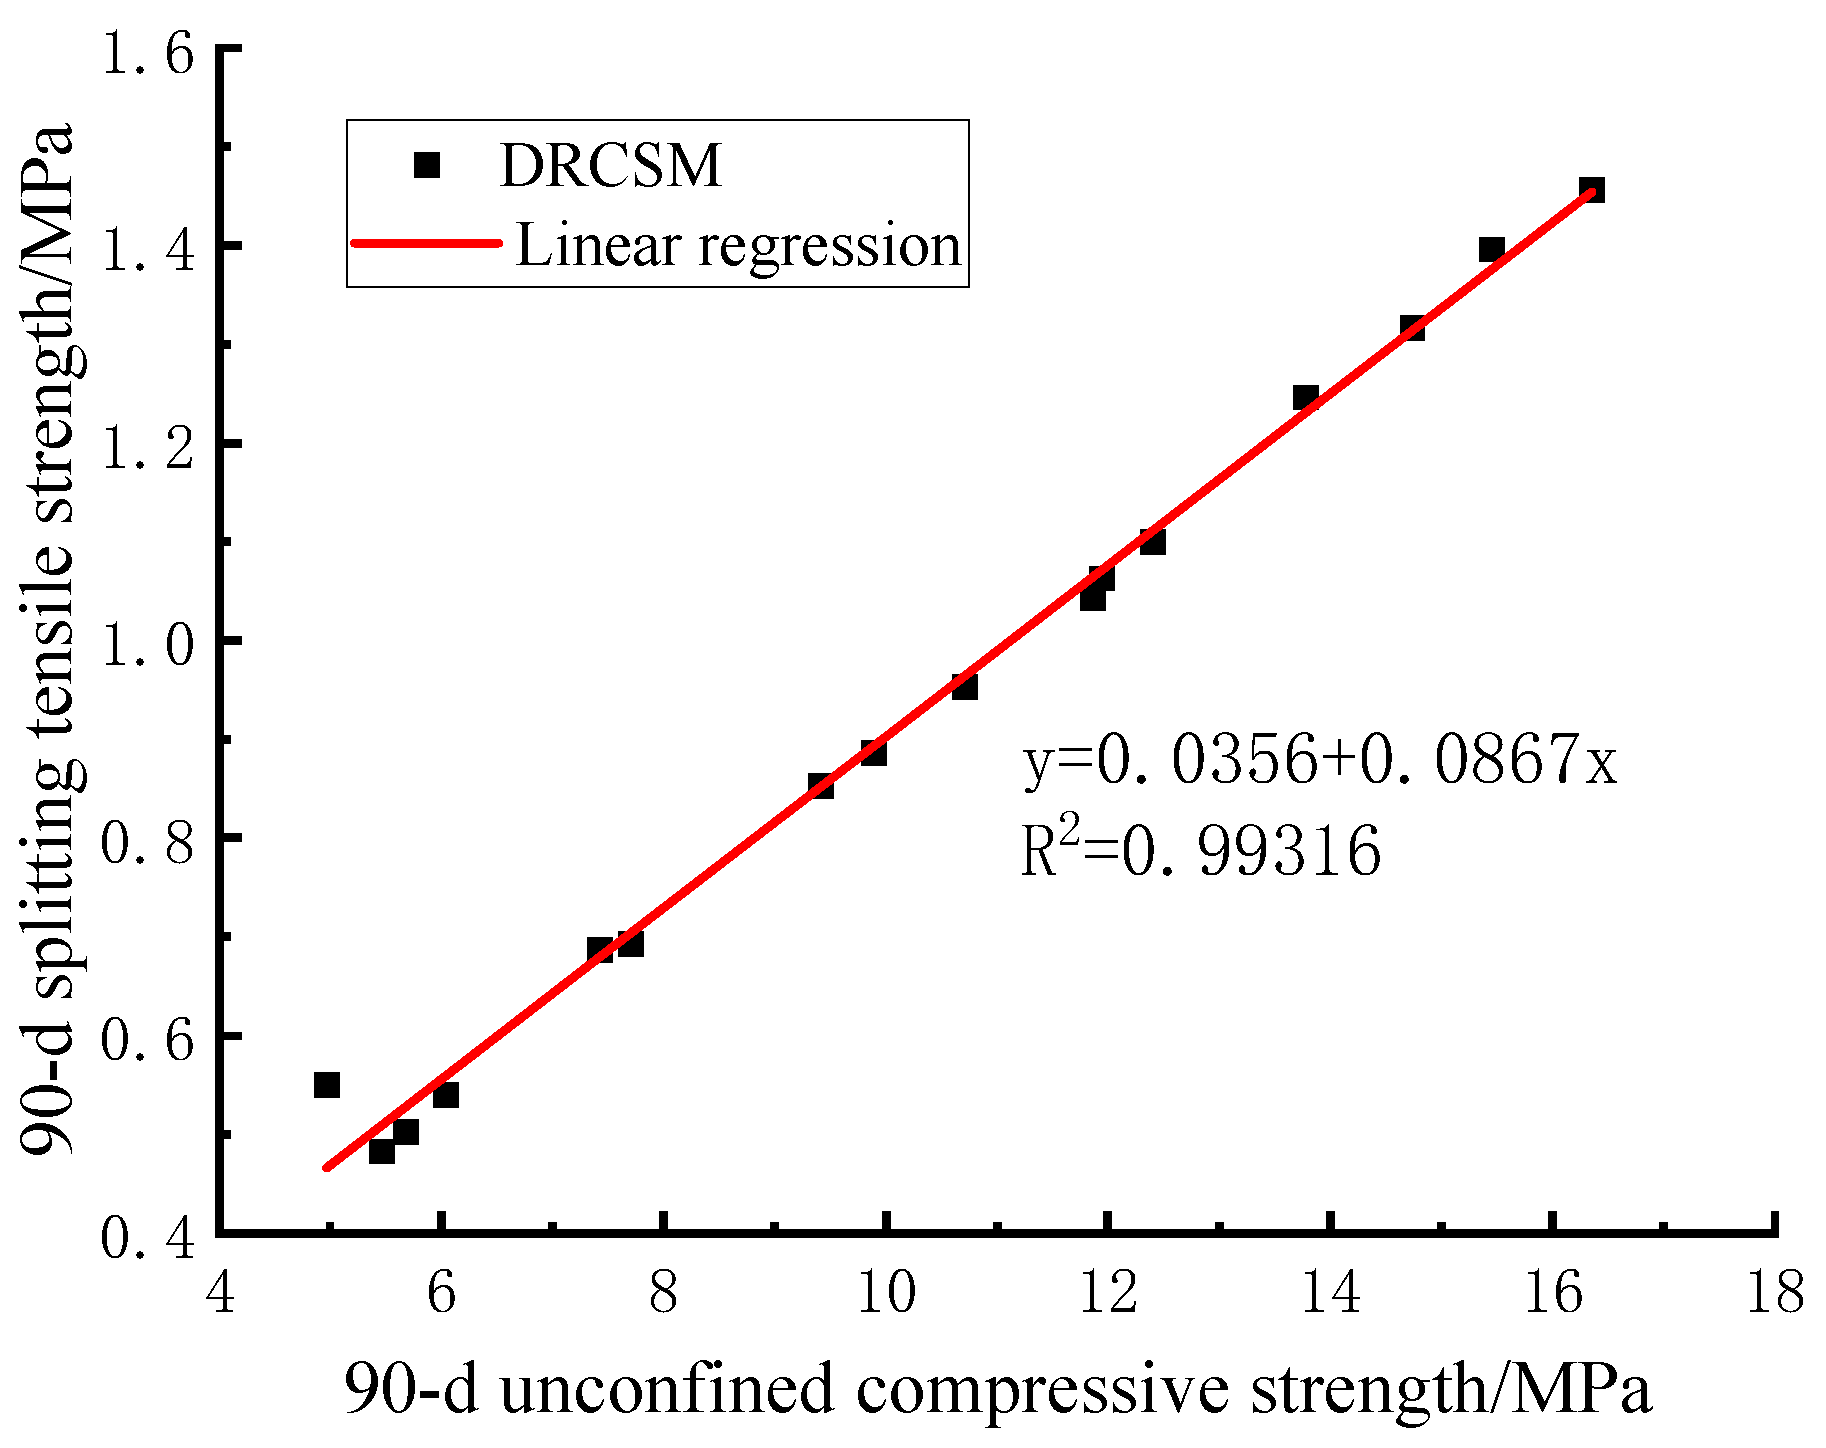
It can be observed from Figure 8 that the linear fitting equation of 90-d compressive strength and splitting tensile strength of DRCSM is expressed as follows:
Figure 8.
Correlation between 7-d compressive strength and splitting tensile strength of mixture.
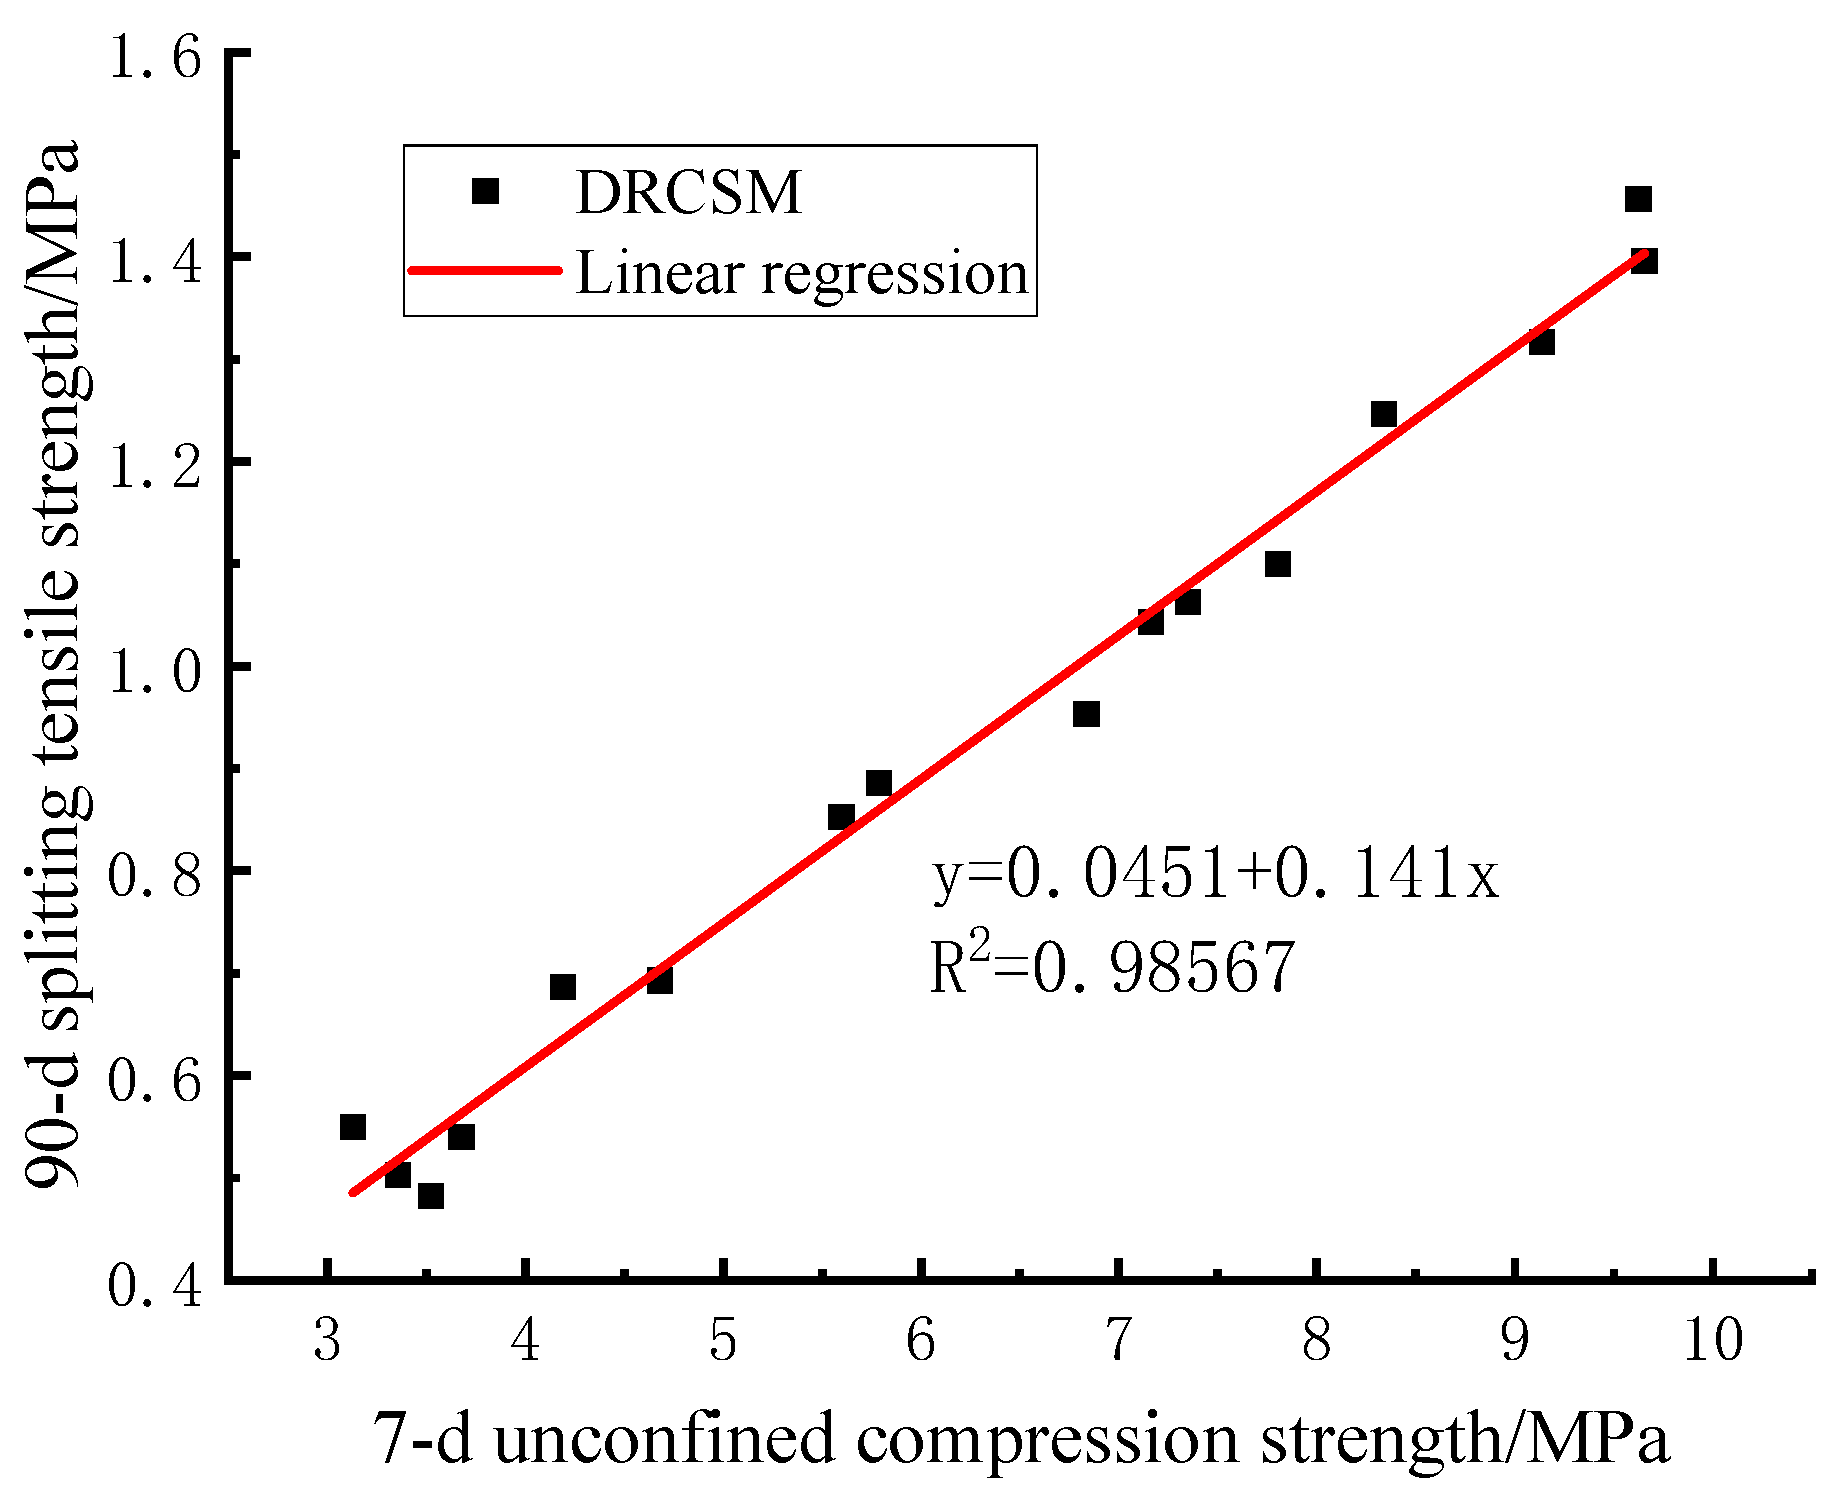
The correlation coefficient is , implying a good correlation between the 90-d compressive strength and the splitting tensile strength of the mixture. Therefore, the 90-d splitting tensile strength can be estimated according to Equation (5) and the 7-d compressive strength of CSM required by the specification.
3.3. Compressive Resilient Modulus
As presented in Table 10, under the influence of four factors, the compressive resilient modulus of the mixture gradually increases with the prolonging curing age. Taking6% cement content as an example, the 28-d compressive resilient modulus values of the four groups are 1.26 times, 1.19 times, 1.32 times, and 1.18 times of the 7-d values, and the 90-d compressive resilient modulus values are 1.74 times, 1.75 times, 1.75 times, and 1.68 times of the 28-d values. Therefore, compressive resilient modulus of DRCSM increases with the rise of curing age.
The range analysis of the orthogonal test results for the compressive resilient modulus of the mixture is summarized in Table 11. It signifies that the four orthogonal factors on the 90-d compressive resilient modulus exhibit consistent influence degree with the compressive strength. The selected four-level change interval reveals that the influence degree of the factors on the 90-d splitting tensile strength follows the order of cement dosage > FA replacement rate > RCA replacement rate > DS replacement rate.
Furthermore, Table 12 displays the variance analysis results of the orthogonal test results for the 90-d compressive resilient modulus.
Table 12 indicates that the F test results of the four orthogonal factors are as follows:
a. The cement content: F > F0.01, proving the significant effect of cement content on the 90-d compressive resilient modulus;
b. The RCA replacement rate: F < F0.05, indicating that the replacement rate of RCA fails to substantially influence the 90-d compressive resilient modulus;
c. The DS replacement rate: F < F0.05, showcasing that the DS replacement rate does not significantly affect the 90-d compressive resilient modulus;
d. The FA replacement rate: Fcement > F > F0.01, indicating that the FA replacement rate plays a highly significant effect in influencing the 90-d compressive resilient modulus, but the degree is less than the cement content.
Analysis on results of range analysis and variance analysis suggests that the order of the four factors when influencing the compressive resilient modulus of cement stabilized base is cement content > FA replacement rate > RCA replacement rate > DS replacement rate, with no significant influence of RCA and DS replacement rates. Moreover, with the increase of cement content, the mixture will form more cement during the curing, enhancing the density of internal structure, thus increasing the cohesion, deformation resistance, and compressive resilient modulus of the base. FA possesses poorer mechanical properties than cement, so the base strength will be reduced after substituting cement with FA. Besides, the mineral impurities such as calcium oxide in the FA will hinder the hydration reaction of the cement, decrease the amount and quality of cement in the mixture, thereby reducing the compressive rebound modulus of the base.
Analysis in section 3.2 reveals that if the 90-d compressive resilient modulus can be predicted by the 7-d unconfined compressive strength required by the specification, the test cycle can be greatly reduced, greatly improving the test efficiency. Consequently, the 7-d compressive strength and 90-d compressive resilient modulus of DRCSM were selected to analyze the correlation between them using curve fitting.
As illustrated in Figure 9, the linear fitting equation of the 7-d compressive strength and 90-d compressive rebound modulus of DRCSM can be written as follows:
The correlation coefficient is , which means that the 7-d compressive strength of the mixture demonstrates a good correlation with the 90-d compressive rebound modulus. Therefore, the 90-d compressive rebound modulus can be estimated by the 7-d compressive strength of the specimen through Equation (6).
In the equation: ——Compressive resilient modulus of the specimen/MPa;
——Compressive strength of the specimen /MPa;
——Correlation coefficient.
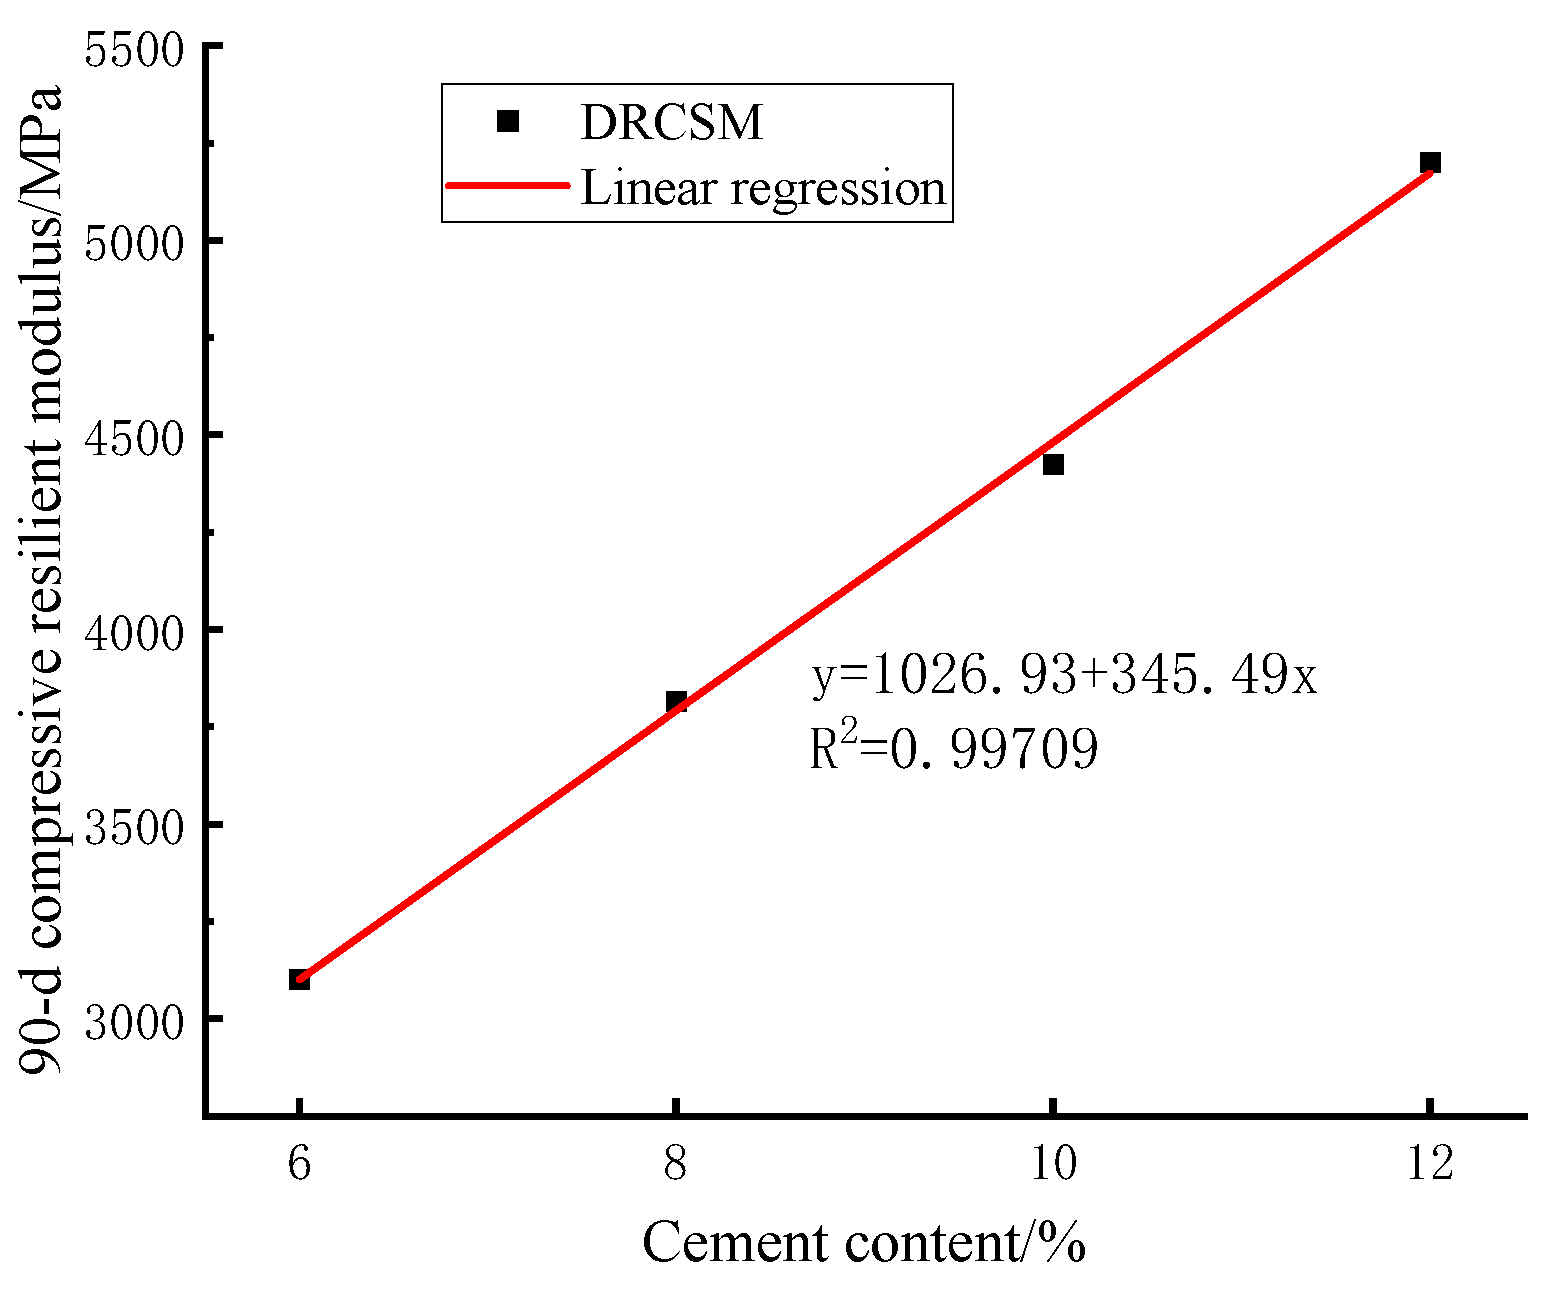
The results of variance and range analyses indicate that the compressive resilient modulus of the mixture is primarily affected by the cement content. Table 13 lists the mean values of the 90-d compressive resilient modulus under the influence of the varying cement contents in the variance analysis. After that, the correlation between the cement content and the 90-d compressive resilient modulus is fitted by curve.
As explicated in Figure 10, the following linear fitting equation is observed between the cement content of DRCSM and the 90-d compressive rebound modulus:
In the equation: ——Compressive resilient modulus of the specimen/MPa;
——Cement content in the specimen/%;
——Correlation coefficient.
The correlation coefficient is , suggesting the existence of a good correlation between the cement content of the mixture and the 90-d compressive resilient modulus. Additionally, the above Equation (7) can be adopted to estimate the 90-d compressive resilient modulus under different cement contents.
Figure 10.
Correlation between cement content and 90-d compressive resilient modulus of mixture.
3.4. Micro-Analysis
Building upon the previous section, it can be concluded that introducing a certain amount of DS is beneficial to improve the strength of CSM and the influence of FA on the strength of CSM is highly significant. Furthermore, specimens were sampled from the two materials under different substitution rates to analyze the influence of introducing them on microscopic properties of CSM using scanning electron microscopy (SEM).
As displayed in Figure 11, with the increase of FA replacement rate, the number of spherical FA particles gradually increases. Large pores are observed in Figure 11a, with obvious columnar ettringite crystals (AFt) growing among pores. In Figure 11b, the microstructure becomes denser, and the aggregate surface is wrapped by floccules, accompanied by the formation of clusters of rod-like products. There are cracks at the interface between FA particles and aggregates. Figure 11c shows that there are more FA particles and the interface between FA particles and aggregate is well combined without obvious cracks. There are also more C-S-H gels as well as needle-like and cluster-like Aft crystals. It reflects that the particle fineness of FA is higher, and the incorporation of FA instead of cement can fill the tiny pores in the aggregate, thus improving the compactness and homogeneity of the internal structure of the mixture. Secondly, active substances, such as alumina and silicate contained in FA, can react with cement, generating new hydration products, which is helpful to enhance the bonding performance inside the mixture. Thirdly, higher particle fineness and spherical shape of FA enhance its dispersion and adhesion in the mixture, restricting the development of cracks inside the mixture.
By comparing the SEM images of specimens with different DS replacement rates shown in Figure 11, the following results can be obtained. The CSM in Figure 11d exhibits loose internal structure, more pores among aggregates, and uneven distribution of compounds. With the increase of DS replacement rate, the compactness of the mixture gradually increases, the number and width of cracks decrease, and the distribution of coarse and fine aggregates is more uniform, as demonstrated in Figure 11e. In Figure 11f, the number of cracks is significantly reduced, the pores among aggregates are composed of numerous of fine pores with less larger pores, and the particles are more closely. In addition, coarse aggregates are tightly wrapped with cement hydration products and fine aggregates. These observations suggest that increasing the DS replacement rate makes the mixture denser, thus enhancing its strength. On the one hand, the finer particle size of DS can fill the gaps among coarse aggregates in the mixture, making the pore structure among the skeletons denser or more continuous. On the other hand, the cementation between DS and cement or FA can enhance the bonding performance of aggregates, thereby improving the bearing capacity of the mixture.
4. Carbon Emission Assessment of Recycled Aggregate
4.1. Carbon Emission Life Cycle Calculation of Recycled Aggregate
Xiao et al. [20] utilized life cycle assessment (LCA) methodology to delineate the carbon emissions associated with the utilization of recycled aggregates within road engineering, categorizing them into direct and indirect emissions. Direct emissions primarily comprise CO2 emissions stemming from fossil energy utilization across various stage of recycled aggregate production and application, along with those arising from the cement manufacturing process. Indirect emissions encompass CO2 emissions arising from energy acquisition processes (such as electricity and diesel usage), constituting an integral component of recycled aggregate carbon emissions.
The total carbon emission and LCA-derived carbon emission of recycled concrete can be quantitatively computed using Equations (4) and (5).
Among these equations, represents the carbon emissions of each stage of the life cycle of recycled concrete. Specifically, consists of carbon emissions stemming from raw material production and carbon emissions originating from the transportation of raw materials to the recycled concrete mixing station. Both components can be calculated using Equations (6) and (7).
represents the carbon emission incurred during the production process of recycled concrete, which can be determined using Equation (8).
denotes the carbon emission arising from the transportation of ready-mixed recycled concrete to the construction site, ascertainable through Equation (9). It is pertinent to note that the average transportation distance is 30 km.
denotes the carbon emissions attributed to recycled concrete during the construction phase. It is posited that the carbon emissions of recycled concrete and conventional concrete are substantially equivalent during construction. Drawing from reference [20], an average value of 21.8 is adopted as the carbon emissions of the primary components, representing the carbon emissions of unit recycled concrete construction .
denotes the carbon emissions incurred during the demolition of recycled concrete. This includes carbon emissions generated throughout the demolition process and carbon emissions arising during the transportation of waste concrete. As per reference [21], precise calculation of carbon emissions during the demolition process poses challenges. Consequently, it is approximated at 90 % of the construction process, yielding , while can be calculated using Equation (6).
Given the varying data requirements across each stage of the life cycle, the variables in Equations (6)~(9) are explained as follows: represents the quantity of the first type of raw materials per unit of recycled concrete; denotes the quantity of energy (e.g., electric energy, coal, diesel) consumed in the production of raw materials; signifies the carbon emission coefficient of various energy sources, comprising the aggregate of both direct carbon emission coefficient and the indirect carbon emission coefficient . represents the carbon emission associated with each material in cement production; stands for the direct carbon emission coefficient engendered by transportation usage; signifies the unit transportation energy consumption for the respective transportation mode; represents the transportation distance of raw materials for category i; represents the transportation distance of recycled concrete; m signifies the total mass of recycled concrete per cubic meter.
Xiao et al. [22] discovered that the alkaline substances present in concrete possess the capability to absorb atmospheric CO2 and undergo reaction, thereby exerting a compensation effect on the environment. Furthermore, they noted a correlation between the carbonation depth of recycled concrete and the replacement rate of recycled aggregate. To facilitate prediction, they proposed an equation for estimating the carbonation depth of recycled concrete, presented as Equation (10).
represents the carbonization depth, serving as an indicator of concrete’s carbonization extent. It is noteworthy that higher carbonization degree in concrete correspond to increased CO2 absorption over time. denotes the carbon absorption capacity resulting from the carbonation of recycled concrete, quantifiable through Equation (11).
signifies relative humidity; represents the unit water consumption of recycled concrete; denotes the correction coefficient of cement type, assumed as 1 within this study; represents the correction coefficient for cement hydration. For curing ages exceeding 90 days, assumes a value of 0.85 at 1 d and 28 d, with linear interpolation for other ages. stands for the volume fraction of CO2; signifies the duration of carbonization; represents the influence coefficient of recycled aggregate, where its value interpolates linearly between 1 and 1.5 across a range of recycled aggregate replacement rates from 0% to 100%. denotes the quantity of CO2 absorbed per unit of recycled concrete upon complete carbonization, calculated following reference [23]. represents the exposed surface area per unit of recycled concrete, with a recommended value of 5.68 m2 based on reference [24].
4.2. Calculation and Analysis of Carbon Emissions of Recycled Aggregate
Taking Urumqi as a case study, the carbon emissions associated with recycled cement-stabilized macadam featuring a 6 % cement content were calculated and compared with conventional concrete. As per reference [24], the environmental conditions in Urumqi entail a relative humidity of 57.5% and an atmospheric CO2 concentration of 0.03%. As elucidated in the previous section, the carbon emissions throughout other stages of the life cycle of recycled concrete are contingent upon the replacement rate of recycled aggregate. This section conducts a comparative analysis, computing the life cycle carbon emissions of cement-stabilized macadam employing natural aggregate and varying recycled aggregate replacement rates of 25%, 50%, 75%, and 100%. Additionally, the calculation encompasses the carbonation depth and CO2 absorption of recycled cement-stabilized macadam during the carbonation stage in Urumqi. Assumptions for this analysis include the utilization of diesel trains for transportation, with an average transportation distance of 30 km during the transportation process. The cement-stabilized base undergoes maintenance for 28 days, while the anticipated road service life spans 30 years. The calculated values for , , , and are delineated as follows: = 2.4 kg, = 7.8 kg, = 21.8 kg, and = 27.4 kg [20]. The calculation results are shown in Table 1.
The findings presented in Table 14 underscore that the life cycle carbon emissions associated with recycled CSM featuring a 6 % cement content are notably lower than those of conventional CSM. Across each stage, carbon emissions stemming from raw material production constitute the highest proportion, exhibiting a gradual increase corresponding to the replacement rate of recycled aggregate, ranging from 62.7% ~ 71.5%. Specifically, when the replacement rate of recycled aggregate varies from 25%, 50%, 75%, to 100%, the life cycle carbon emissions of unit recycled CSM measure 320.5, 316.1, 312.2, and 306.2, respectively. These values represent approximately 98.0%, 96.7%, 95.5%, and 93.6% of the carbon emissions observed in ordinary CSM. Moreover, across each stage of the recycled CSM life cycle, both the carbon emissions from raw material transportation process and the carbonization phase exhibit a declining trend with increasing recycled aggregate replacement rate. The carbon emissions arising from raw material transportation processes represent 11.2% to 20.1% of the overall life cycle, exhibiting a reduction rate of 9.5% with the decrease in recycled aggregate replacement rates from 0% to 100%. Additionally, carbon absorption during the carbonization phase accounts for 0.9% to 2.2% of the life cycle. Therefore, optimizing the proximity of recycled aggregate to the mixing station becomes imperative to enhance the environmental advantages of recycled CSM compared to ordinary CSM. This underscores the significance of promoting and utilizing recycled aggregate within cement-stabilized bases in Urumqi, as it demonstrates tangible environmental benefits.
5. Conclusions
This paper delved into the application of the mixture of DR and recycled aggregates in CSM. Through crushing, processing, and screening, the waste concrete recycled aggregate was prepared and its basic performance is tested. A four-factor and four-level orthogonal test was designed to investigate the comprehensive performance of DRCSM. In addition, the standard compaction test was completed to understand its mechanical properties. The main conclusions of this paper are as follows:
(1) With the increase of curing age, the DRCSM exhibits consistent development laws (increasement) in unconfined compressive strength, splitting tensile strength, and compressive resilient modulus. The range analysis results suggest that the four orthogonal factors have different effects on the mechanical properties of DRCSM. The specific order of influence is cement content > FA replacement rate > RCA replacement rate > DS replacement rate. The DRCSM exhibits a better compressive strength when the DS and RCA replacement rate is 30% and 50%, respectively.
(2) In the variance analysis, it is evident that the compressive strength and splitting tensile strength of the mixture show similar results. Cement content and FA replacement rate extremely significantly influence the strength of the mixture, but the influence of RCA and DS replacement rates on the compressive resilient modulus is not remarkable. The TEM analysis reveals that introducing appropriate contents of DS and FA can better the internal microstructure of CSM, improve the internal compactness of CSM, enhance the bonding performance among aggregates, and elevate the bearing capacity of the CSM;
(3) For the mechanical properties of DRCSM, when the cement content is more than 6%, its 7-d unconfined compressive strength and 90-d splitting tensile strength meet the requirements of the first-class highway special heavy traffic in the specification. A good correlation is observed by fitting and drawing the curves for compressive strength, splitting tensile strength, and compressive rebound modulus under the change of cement content. Meanwhile, splitting tensile strength and compressive rebound modulus can be predicted by compressive strength.
(4) The calculation and analysis of the life cycle carbon emissions of recycled CSM reveal that augmenting the recycled aggregate replacement rate yields a reduction in carbon emissions, contingent upon the controlled transportation distance of recycled aggregate. This observation underscores the favorable environmental benefits. Similarly, the utilization of DS in Xinjiang entails a decrease in transportation distances, thereby facilitating a reduction in carbon emissions.
Author Contributions
Conceptualization, Fengchao.Liu. and Yiheng.Yang.; methodology, Fengchao.Liu.; validation, Fengchao.Liu.; formal analysis, Fengchao.Liu.; investigation, Fengchao.Liu. and Yiheng.Yang.; resources, Yongjun.Qin.; data curation, Fengchao.Liu.; writing—original draft preparation, Fengchao.Liu.; writing—review and editing, Fengchao.Liu.; visualization, Yongjun.Qin.; supervision, Yongjun.Qin.; project administration, Yongjun.Qin.; funding acquisition, Yongjun.Qin. All authors have read and agreed to the published version of the manuscript.
Funding
This research was funded by Natural science foundation of Xinjiang uygur autonomous region, grant number 2022D01D27.
Data Availability Statement
Data analyzed or generated during the research period already exists in the main text, for the use of experts and scholars.
Acknowledgments
The funding in this article does not include administrative and technical support, or donations in kind (e.g., materials used for experiments).
Conflicts of Interest
The funders had no role in the design of the study; in the collection, analyses, or interpretation of data; in the writing of the manuscript; or in the decision to publish the results.
References
- Cong, Zhuohong; Zheng, Nanxiang; Yan, Hongguang. Comprehensive evaluation method for road performance of semi-rigid base materials. Journal of Transportation Engineering 2011, 11, 23–28. [Google Scholar] [CrossRef]
- JTG F10-2006; Technical Specification for Highway Subgrade Construction. Beijing, RP China, 2006.
- Guo, Gensheng; Zhang, Fei. Study on the ratio of cement stabilized gravel aeolian sand base based on unconfined compressive strength. Science and Technology and Engineering 2018, 18, 326–331. [Google Scholar]
- Guo, Gensheng; Zhang, Yan; Du, Shimeng. Experimental Study on Shear Strength of Cement Stabilized Aeolian Sand Base. Science Technology and Engineering 2017, 17, 322–326. [Google Scholar]
- Zhang, Chao; Ding, Jizhong; Guo, Jinsheng. The application of waste cement concrete recycled aggregate in semi-rigid base. Journal of Chang ‘an University (Natural Science Edition) 2002, 22, 1–4. [Google Scholar] [CrossRef]
- Sun, Jiaying; Jiang, Huaqin; Liu, Suifang; et al. Effect of recycled concrete aggregate on the performance of cement stabilized macadam and its engineering application. Concrete and cement products 2009, (01), 20–23. [Google Scholar] [CrossRef]
- Yang, Jun; Li, Xinchun; Chen, Junsong; et al. Experimental study on waste concrete used as cement stabilized base. Journal of Environmental Engineering 2014, 8, 2097–2103. [Google Scholar]
- Hu, Zhonghui; Jia, Zhirong; Zhang, Wengang; et al. Experimental Study and Engineering Application of Cement Stabilized Recycled Aggregate Base. Construction Technology 2016, 45, 126–129. [Google Scholar]
- Corradini, A.; Cerni, G.; Porceddu, P.R. Comparative study on resilient modulus of natural and post-quake recycled aggregates in bound and unbound pavement subbase applications. Construction and Building Materials 2021, 297. [Google Scholar] [CrossRef]
- Lyu, Xiaowu; Lyu, Weiqian; Li, Yumei. Experimental Study on Cement Stabilized Construction Waste Recycled Road Subbase. Highway Transportation Technology (Applied Technology Edition) 2018, 14, 94–95. [Google Scholar]
- Peng, Liang. Study on the road performance of recycled aggregate in cement stabilized macadam base. Chongqing Jiaotong University, Chongqing, 2017. [Google Scholar]
- Zhao, Baichao. Effect of waste concrete on fatigue properties of cement stabilized soil. Shenyang University of Technology, Shenyang, 2020. [Google Scholar]
- Hu, Huimin; Sun, Yexiang. Experimental study on mix proportion design and strength law of recycled aggregate cement stabilized macadam. Journal of Hefei University of Technology (Natural Science Edition) 2009, 32, 238–240. [Google Scholar]
- Zou, Guilian; Wang, Huaxin; Fang, Shuai. Research on road performance of cement stabilized recycled aggregate. Highway Engineering 2018, 43, 28–32. [Google Scholar]
- Yu, Chunyan. Research on the application of cement stabilized recycled aggregate in road base. Zhejiang University of Technology, Hangzhou, 2020. [Google Scholar]
- Netterberg, F.; Elsmere, D. Untreated aeolian sand base course for low-volume road proven by 50-year old road experiment. Journal of the South African Institution of Civil Engineering 2015, 57, 50–68. [Google Scholar] [CrossRef]
- Song, Liangrui; Li, Baiyi. Effect of Aeolian Sand Content on Mechanical Properties and Durability of Cement Stabilized Graded Macadam. Silicate Bulletin 2020, 39, 1421–1429. [Google Scholar] [CrossRef]
- Ma, Shibin; Chang, Junying; Wei, Lianyu; et al. Orthogonal Experimental Study on Cement Stabilized Aeolian Sand Macadam Base. Journal of Chongqing Jiaotong University 2004, (05), 48–51. [Google Scholar]
- JTG/T F20-2015; Technical Rules for Construction of Highway Pavement Base. Beijing, RP China, 2015.
- Xiao, Jianzhuang; Li, Ao; Ding, Tao. Life cycle CO2 emission assessment of recycled concrete. Journal of Southeast University (Natural Science Edition) 2016, 46, 1088–1092. [Google Scholar] [CrossRef]
- Gong, X.Z.; Nie, Z.R.; Wang, Z.H.; et al. Life cycle energy consumption and carbon dioxide emission of residential building designs in Beijing. Journal of Industrial Ecology 2012, 16, 576–587. [Google Scholar] [CrossRef]
- Xiao, Jianzhuang; Lei, Bin. Carbonation model and structural durability design for recycled concrete. Journal of Architecture and Civil Engineering 2008, 25, 66–72. (In Chinese) [Google Scholar] [CrossRef]
- Li, Chunhui. Study on the carbonation performance of concrete mixed with mineral admixtures. Civil Engineering College of Xi’an University of Architecture and Technology, Xi’an, 2009. [Google Scholar]
- Lee, S.H.; Park, W.J.; Lee, H.S. Life cycle CO2 assessment method for concrete using CO2 balance and suggestion to decrease CO2 of concrete in South-Korean apartment. Energy and Buildings 2013, 58, 93–102. [Google Scholar] [CrossRef]
Figure 1.
Aggregate grading curve.
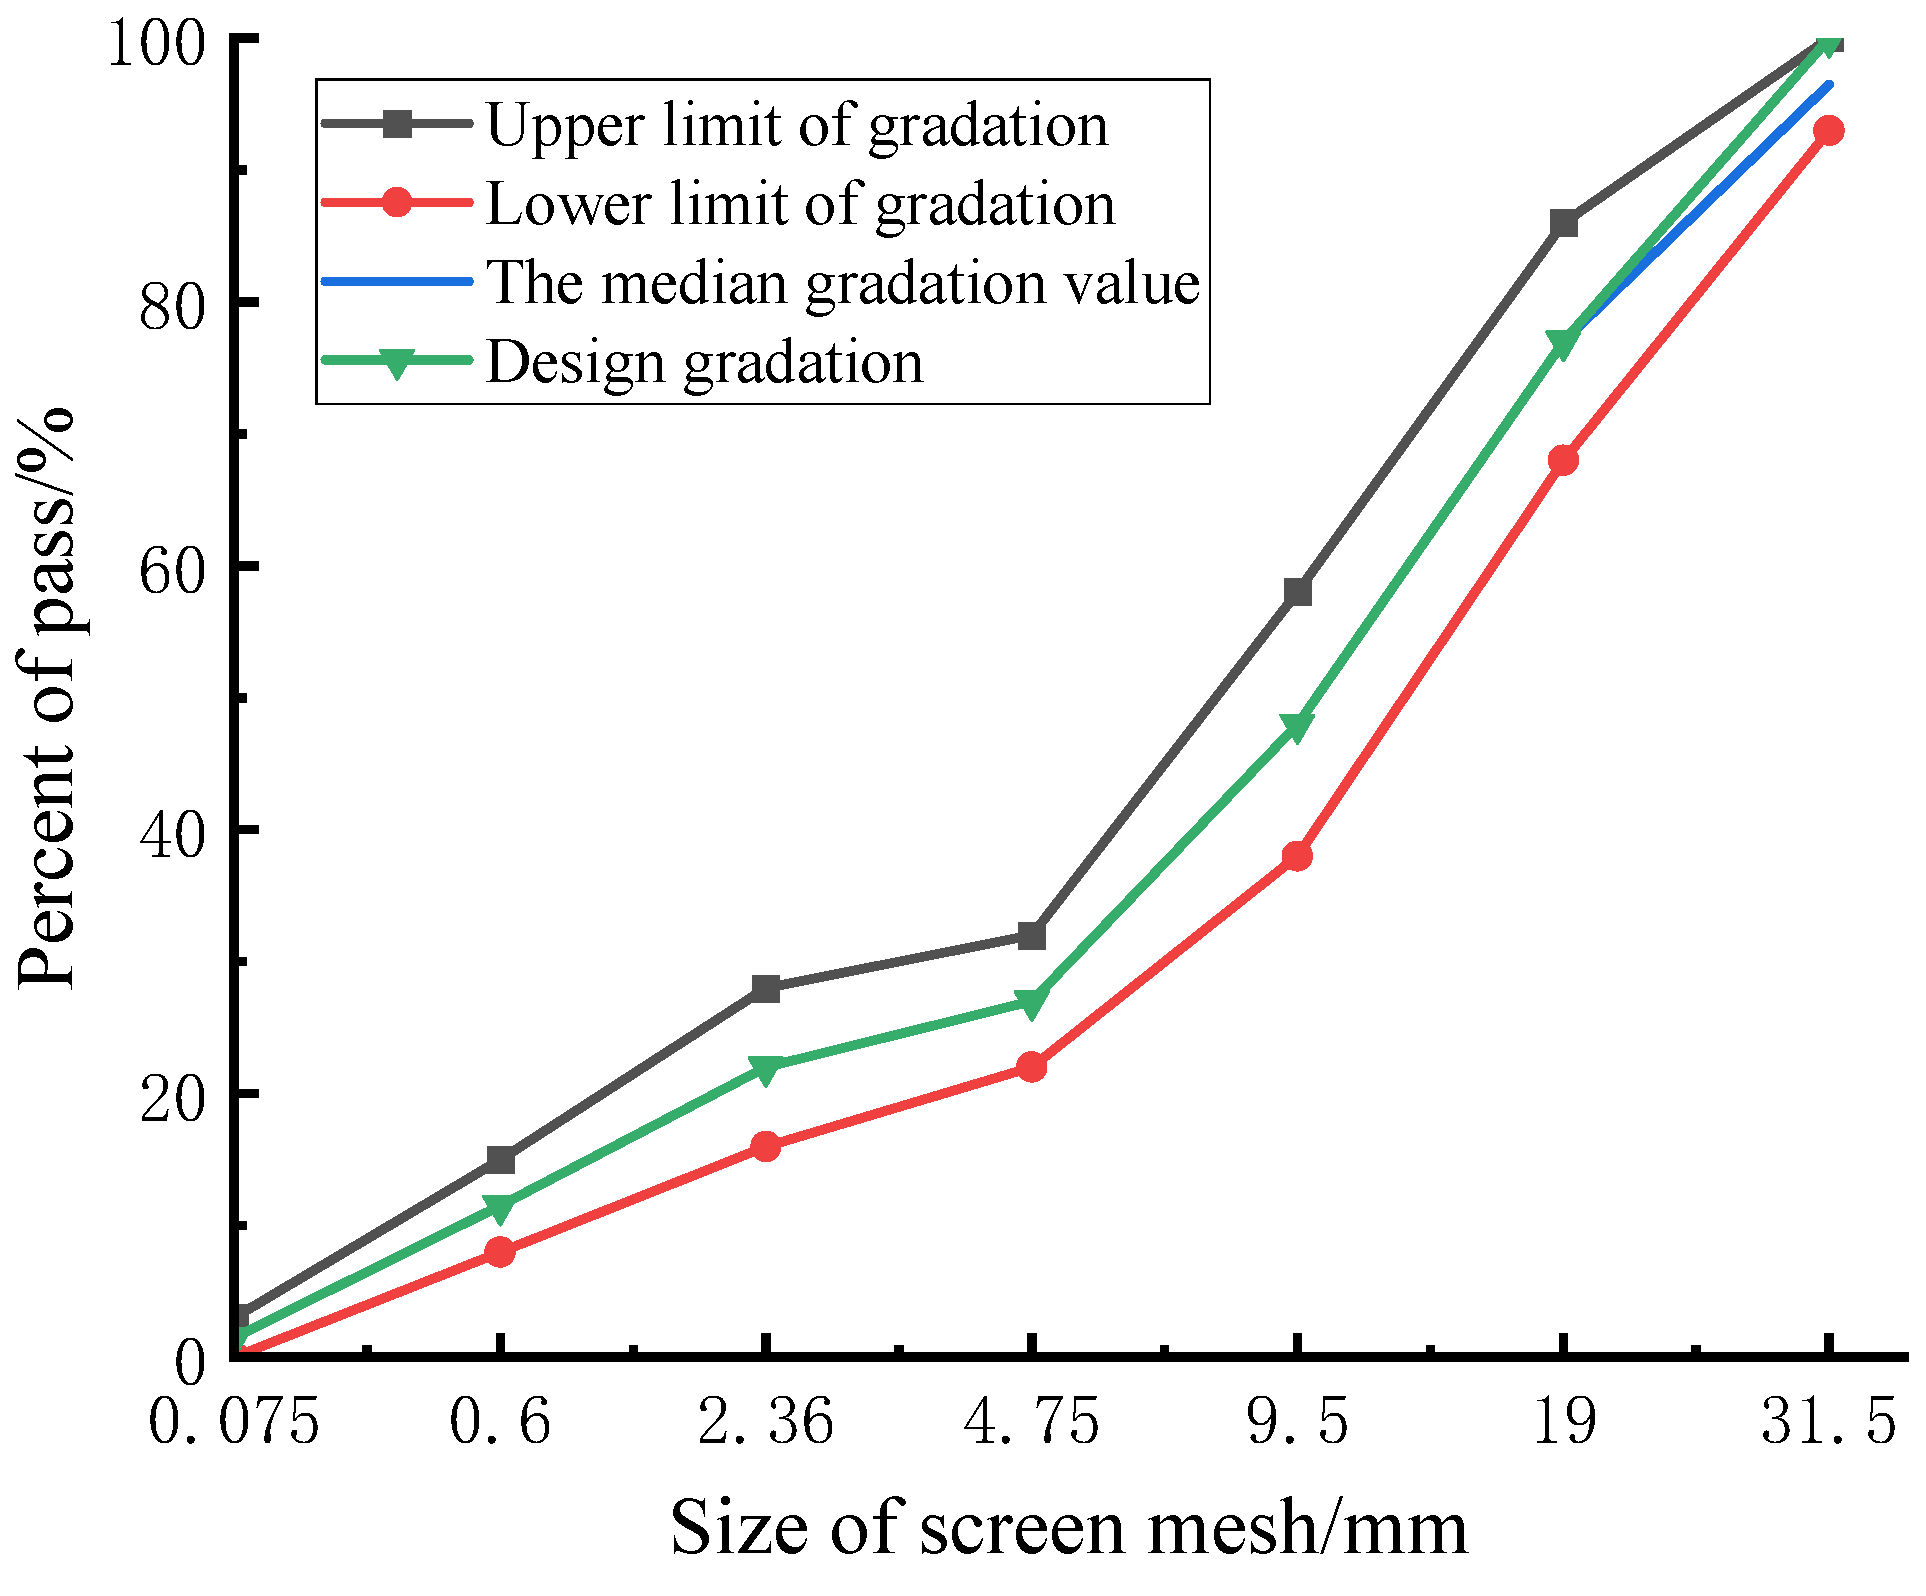
Figure 2.
Machine for unconfined compressive strength test.
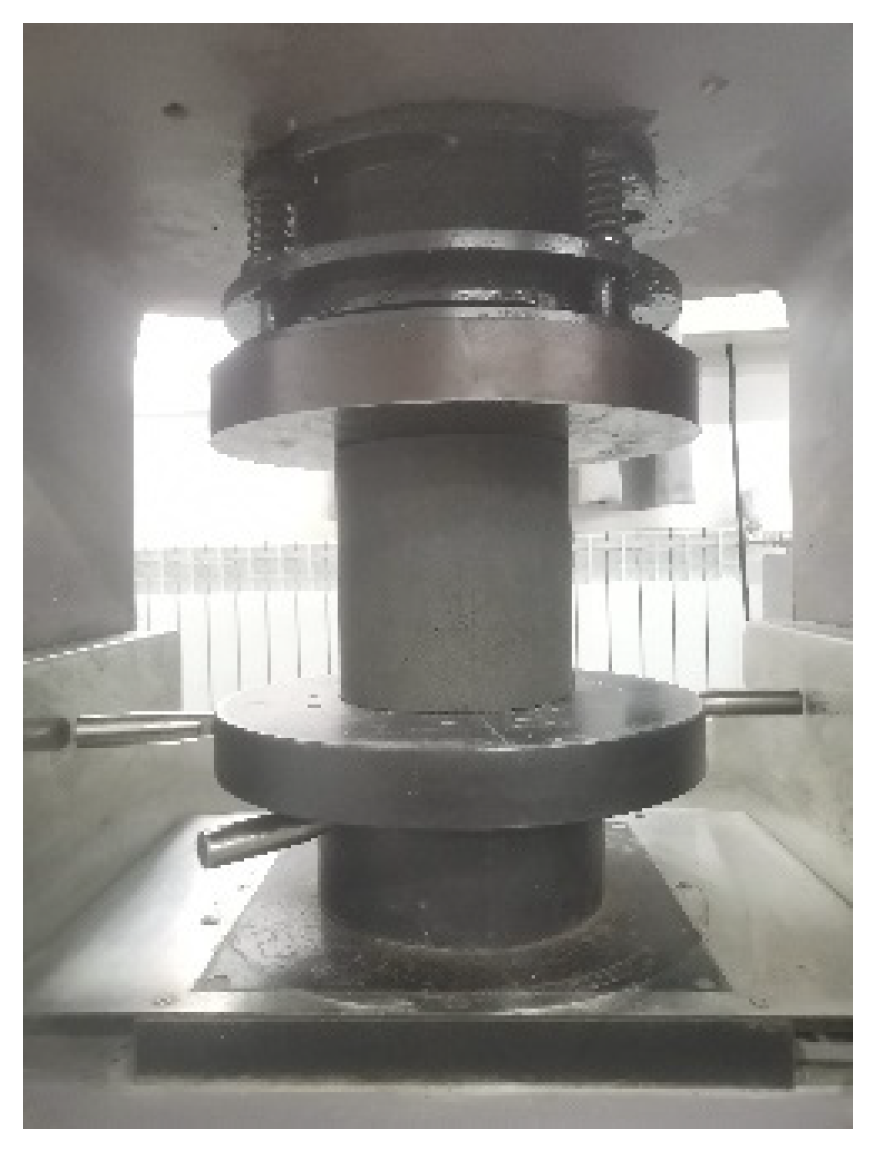
Figure 3.
Fixture for splitting test.
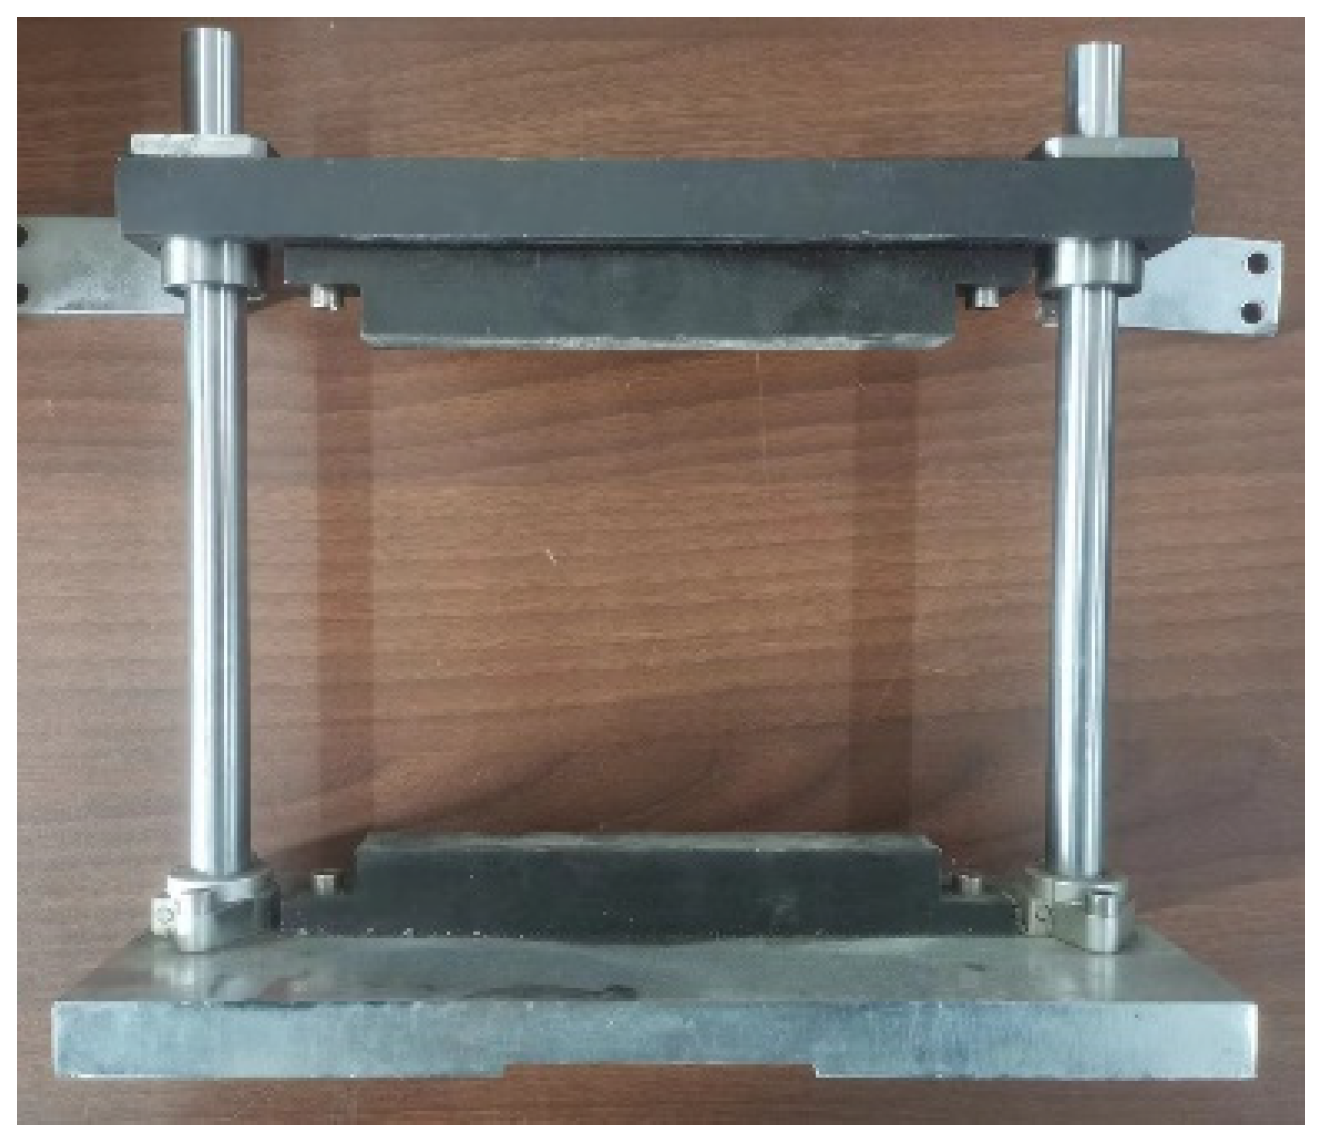
Figure 4.
Specimen compaction molding.
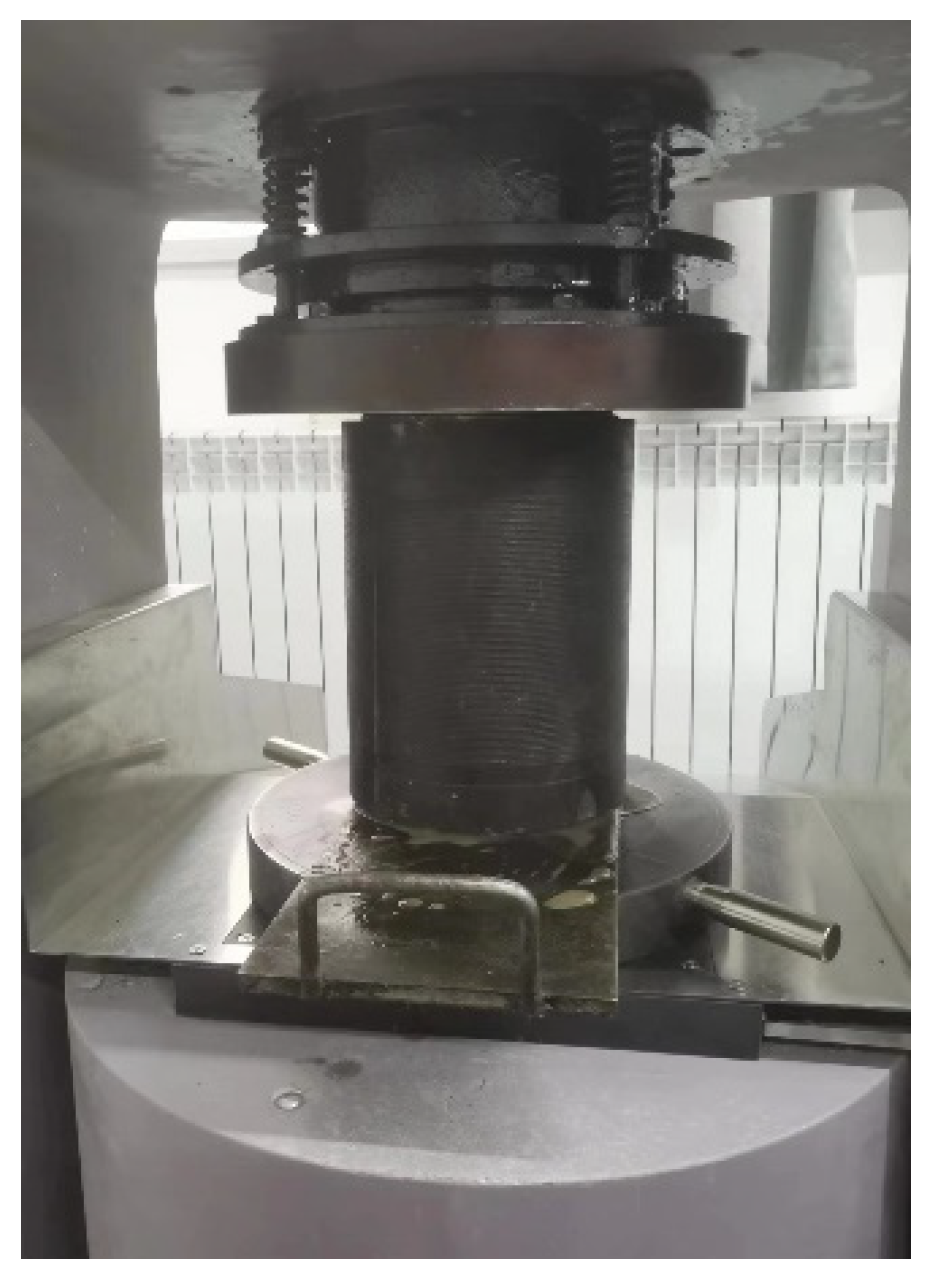
Figure 5.
Changes in compressive strength of CSM with curing age.
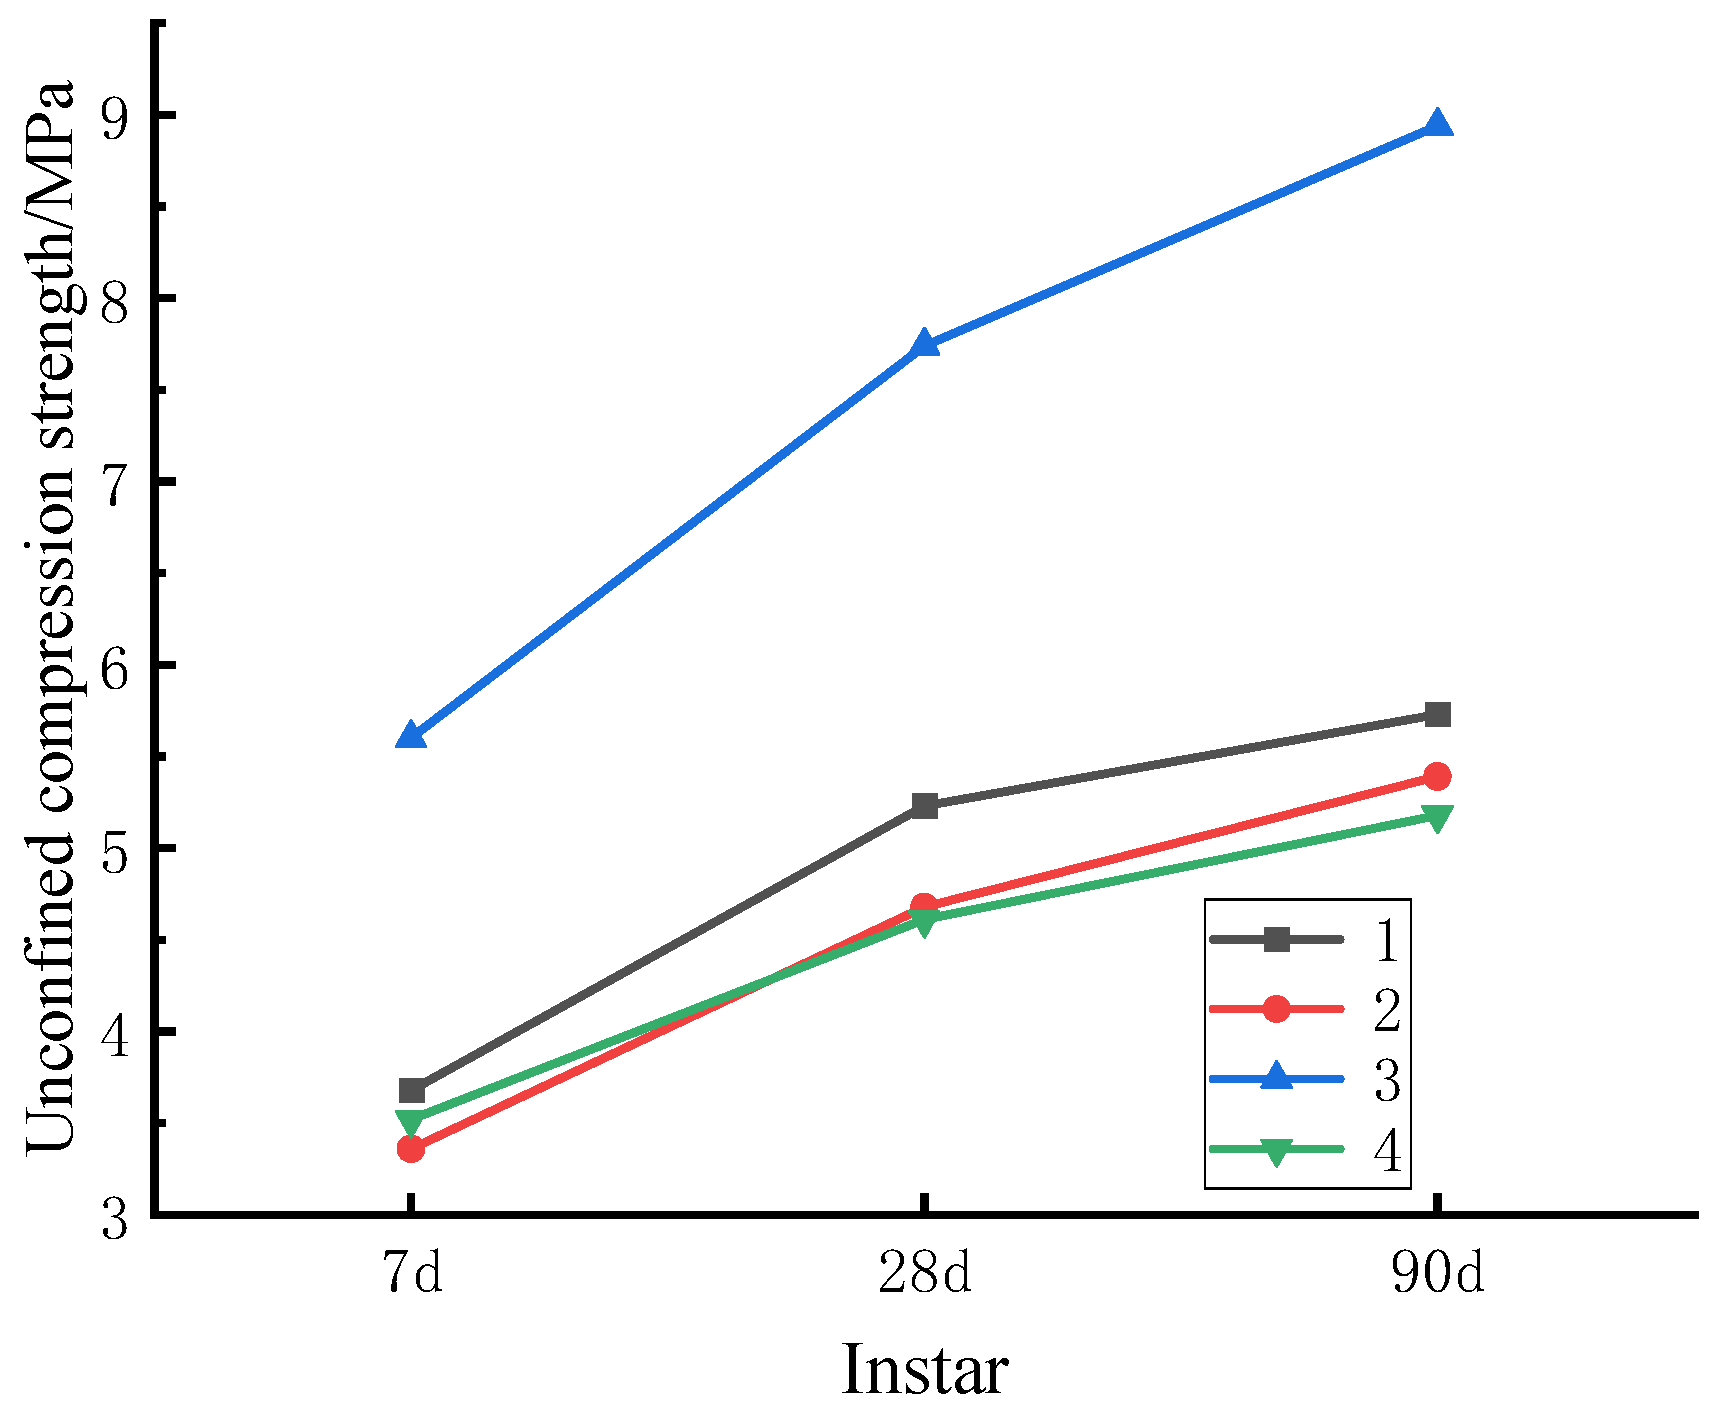
Figure 9.
Correlation between the 7-d compressive strength and 90-d compressive resilient modulus of mixture.
Figure 9.
Correlation between the 7-d compressive strength and 90-d compressive resilient modulus of mixture.
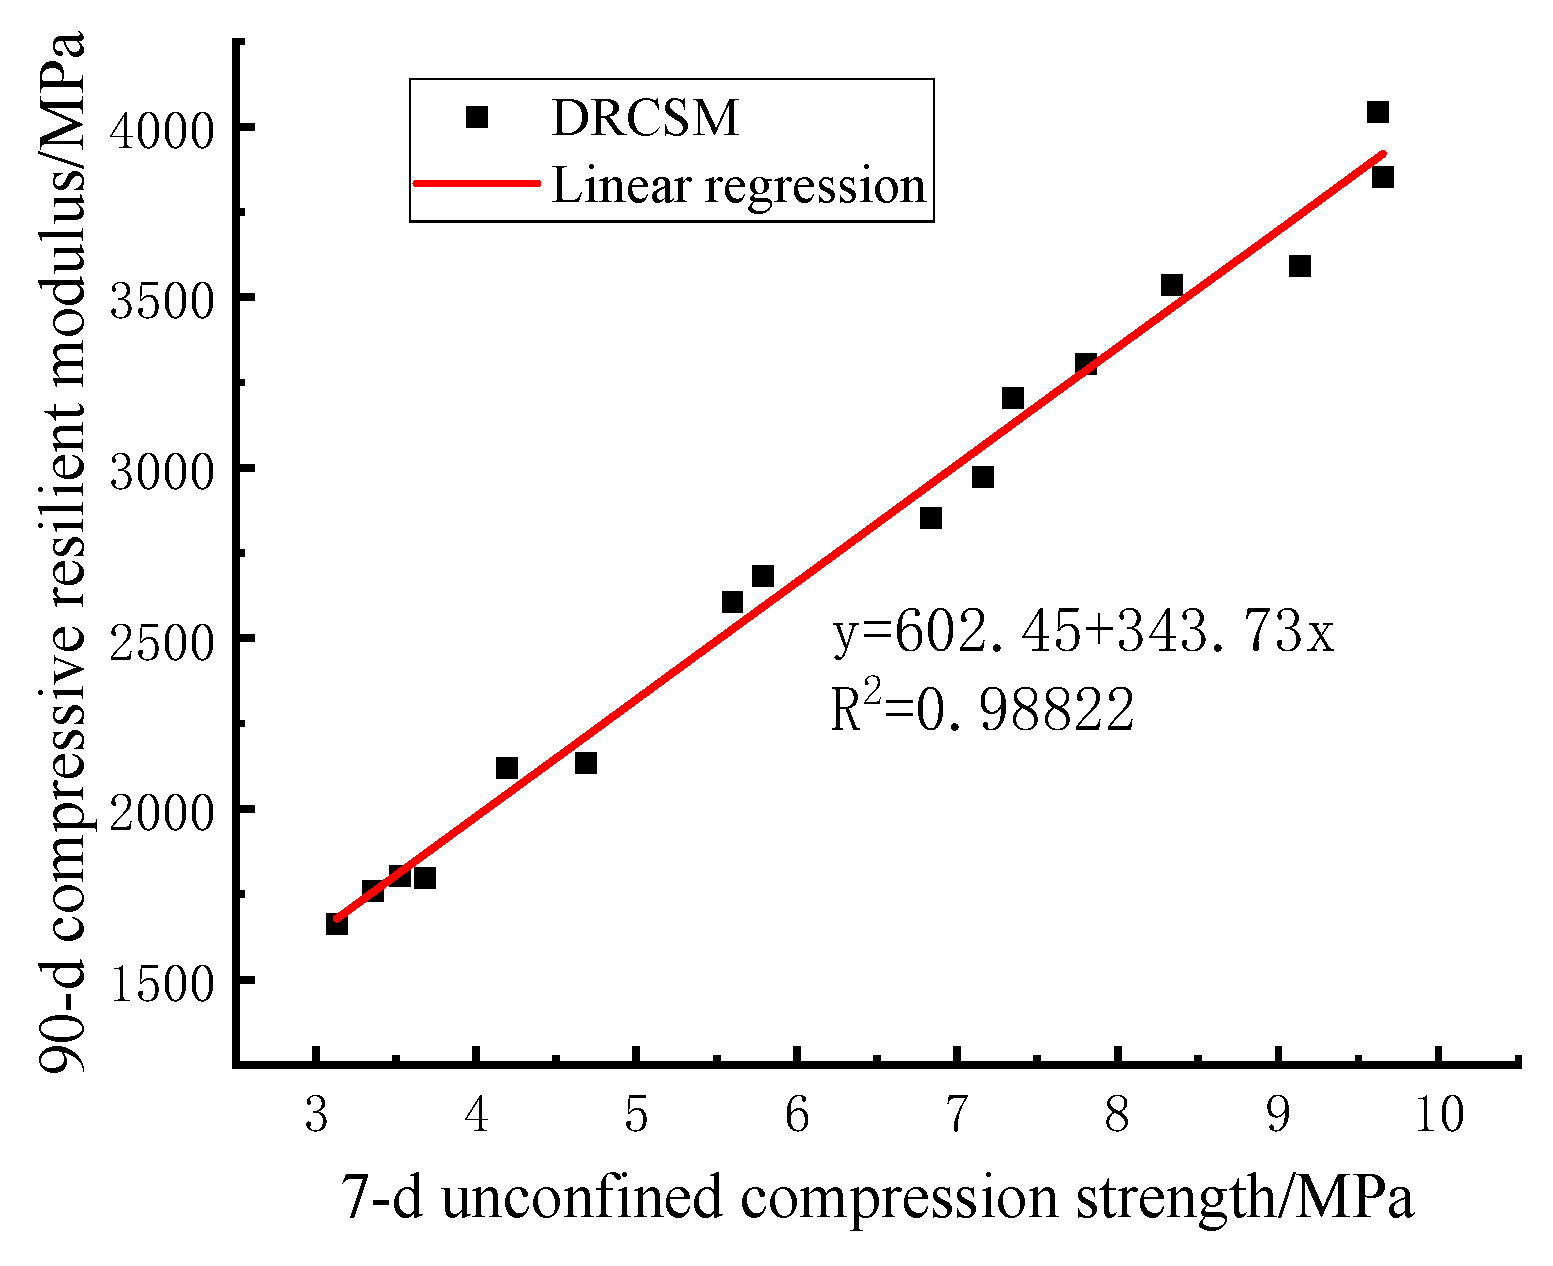
Figure 11.
Electron microscope photos CSM with different FA and DS contents.
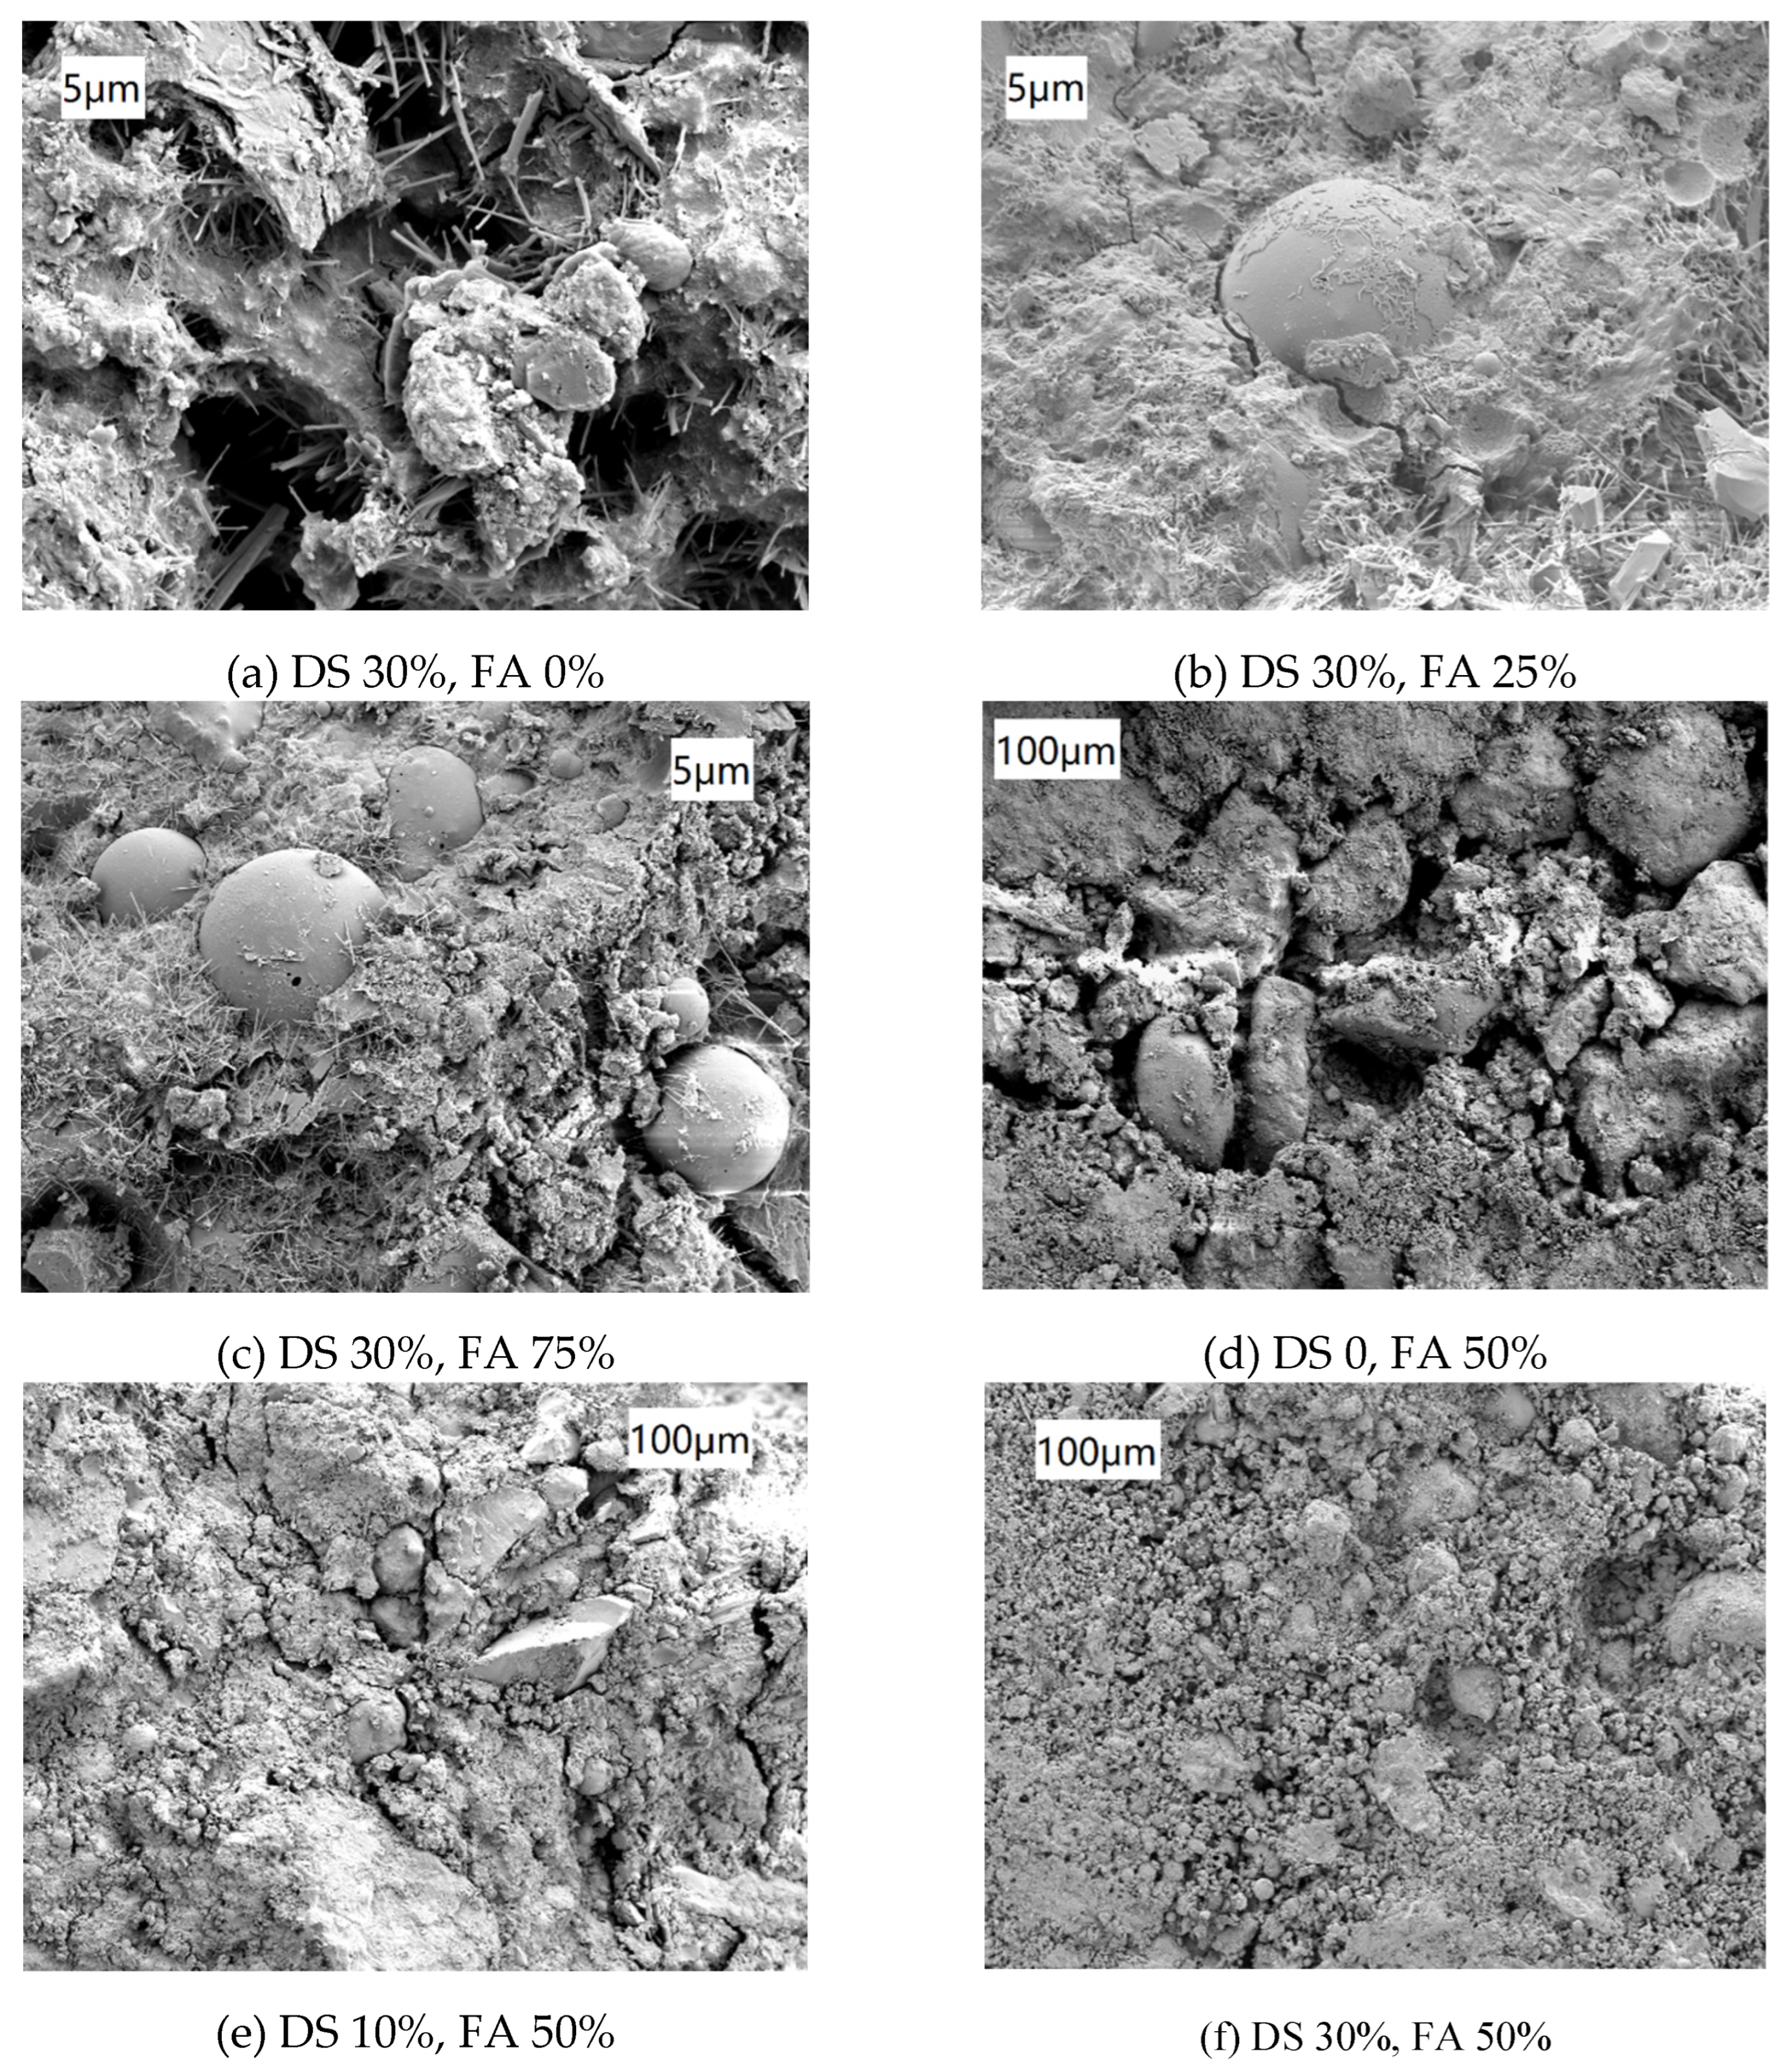
Table 3.
The passing rate of aggregate screening.
| Size of screen mesh/mm | Passing rate/% | |||
|---|---|---|---|---|
| Upper limit | Lower limit | Median gradation | Design gradation | |
| 31.5 | 100 | 93 | 96.5 | 100 |
| 19.0 | 86 | 68 | 77 | 77 |
| 9.5 | 58 | 38 | 48 | 48 |
| 4.75 | 32 | 22 | 27 | 27 |
| 2.36 | 28 | 16 | 22 | 22 |
| 0.6 | 15 | 8 | 11.5 | 11.5 |
| 0.075 | 3 | 0 | 1.5 | 1.5 |
Table 4.
Specimen mix design.
| Specimen number | Cement content | RCA replacement rate | DS replacement rate | FA replacement rate |
|---|---|---|---|---|
| DRCSM-1 | 6% | 0% | 0% | 0% |
| DRCSM-2 | 6% | 25% | 10% | 25% |
| DRCSM-3 | 6% | 50% | 20% | 50% |
| DRCSM-4 | 6% | 75% | 30% | 75% |
| DRCSM-5 | 8% | 0% | 10% | 50% |
| DRCSM-6 | 8% | 25% | 0% | 75% |
| DRCSM-7 | 8% | 50% | 30% | 0% |
| DRCSM-8 | 8% | 75% | 20% | 25% |
| DRCSM-9 | 10% | 0% | 20% | 75% |
| DRCSM-10 | 10% | 25% | 30% | 50% |
| DRCSM-11 | 10% | 50% | 0% | 25% |
| DRCSM-12 | 10% | 75% | 10% | 0% |
| DRCSM-13 | 12% | 0% | 30% | 25% |
| DRCSM-14 | 12% | 25% | 20% | 0% |
| DRCSM-15 | 12% | 50% | 10% | 75% |
| DRCSM-16 | 12% | 75% | 0% | 50% |
Table 5.
Unconfined compressive strength of mixture 7, 28, and 90 d after curing.
| Group number | Unconfined compression strength/MPa | ||
|---|---|---|---|
| 7-d | 28-d | 90-d | |
| DRCSM-1 | 3.68 | 5.23 | 5.73 |
| DRCSM-2 | 3.36 | 4.68 | 5.39 |
| DRCSM-3 | 5.60 | 7.74 | 8.94 |
| DRCSM-4 | 3.52 | 4.61 | 5.18 |
| DRCSM-5 | 4.19 | 6.07 | 7.05 |
| DRCSM-6 | 3.13 | 4.24 | 4.72 |
| DRCSM-7 | 9.13 | 12.81 | 14.00 |
| DRCSM-8 | 5.79 | 8.29 | 9.40 |
| DRCSM-9 | 4.68 | 6.41 | 7.32 |
| DRCSM-10 | 6.83 | 9.01 | 10.17 |
| DRCSM-11 | 7.16 | 10.35 | 11.27 |
| DRCSM-12 | 9.65 | 12.92 | 14.68 |
| DRCSM-13 | 8.34 | 11.71 | 13.09 |
| DRCSM-14 | 9.62 | 13.25 | 15.54 |
| DRCSM-15 | 7.35 | 10.03 | 11.34 |
| DRCSM-16 | 7.80 | 10.40 | 11.78 |
Table 6.
Range analysis of the unconfined compressive strength by taking the 7-d value as reference.
Table 6.
Range analysis of the unconfined compressive strength by taking the 7-d value as reference.
| Extremum difference analysis | Factor | |||
|---|---|---|---|---|
| Cement content | RCA replacement rate | DS replacement rate | FA replacement rate | |
| Mean 1 | 4.038 | 5.221 | 5.443 | 8.022 |
| Mean 2 | 5.560 | 5.736 | 6.137 | 6.160 |
| Mean 3 | 7.082 | 7.309 | 6.422 | 6.106 |
| Mean 4 | 8.278 | 6.691 | 6.956 | 4.669 |
| Range | 4.240 | 2.088 | 1.513 | 3.353 |
Table 7.
The variance analysis results of 7-d unconfined compressive strength.
| Factor | Cement content | RCA replacement rate | DS replacement rate | FA replacement rate | Error |
|---|---|---|---|---|---|
| Square of deviance | 40.693 | 10.557 | 4.768 | 22.665 | 1.259 |
| Degree of freedom | 3 | 3 | 3 | 3 | 15 |
| Estimate of variance | 13.654 | 3.519 | 1.589 | 7.555 | 0.420 |
| F0.01 | 5.417 | 5.417 | 5.417 | 5.417 | — |
| F0.05 | 3.287 | 3.287 | 3.287 | 3.287 | — |
| F | 32.313 | 8.383 | 3.786 | 17.997 | — |
Table 8.
Range analysis results of the 90-d splitting tensile strength.
| Group number | Factor | Targets of test | |||
|---|---|---|---|---|---|
| Cement content | RCA replacement rate | DS replacement rate | FA replacement rate | 90-d splitting tensile strength/MPa | |
| DRCSM-1 | 6% | 0% | 0% | 0% | 0.69 |
| DRCSM-2 | 6% | 25% | 10% | 25% | 0.52 |
| DRCSM-3 | 6% | 50% | 20% | 50% | 1.07 |
| DRCSM-4 | 6% | 75% | 30% | 75% | 0.58 |
| DRCSM-5 | 8% | 0% | 10% | 50% | 0.75 |
| DRCSM-6 | 8% | 25% | 0% | 75% | 0.49 |
| DRCSM-7 | 8% | 50% | 30% | 0% | 1.58 |
| DRCSM-8 | 8% | 75% | 20% | 25% | 1.03 |
| DRCSM-9 | 10% | 0% | 20% | 75% | 0.66 |
| DRCSM-10 | 10% | 25% | 30% | 50% | 1.37 |
| DRCSM-11 | 10% | 50% | 0% | 25% | 2.02 |
| DRCSM-12 | 10% | 75% | 10% | 0% | 1.79 |
| DRCSM-13 | 12% | 0% | 30% | 25% | 1.79 |
| DRCSM-14 | 12% | 25% | 20% | 0% | 2.24 |
| DRCSM-15 | 12% | 50% | 10% | 75% | 1.20 |
| DRCSM-16 | 12% | 75% | 0% | 50% | 1.31 |
| Mean 1 | 0.715 | 0.9725 | 1.1275 | 1.575 | — |
| Mean 2 | 0.9625 | 1.155 | 1.065 | 1.34 | — |
| Mean 3 | 1.46 | 1.4675 | 1.25 | 1.125 | — |
| Mean 4 | 1.635 | 1.1775 | 1.33 | 0.7325 | — |
| Range | 0.92 | 0.495 | 0.265 | 0.8425 | — |
Table 10.
Test results of compressive resilient modulus of mixture.
| Group number | Unconfined compression strength/MPa | ||
|---|---|---|---|
| 7-d | 28-d | 90-d | |
| DRCSM-1 | 1322.87 | 1670.31 | 2906.35 |
| DRCSM-2 | 1349.04 | 1604.13 | 2807.23 |
| DRCSM-3 | 1745.89 | 2298.16 | 4021.78 |
| DRCSM-4 | 1344.48 | 1589.26 | 2669.96 |
| DRCSM-5 | 1455.95 | 1898.61 | 3246.62 |
| DRCSM-6 | 1299.96 | 1495.18 | 2586.66 |
| DRCSM-7 | 2449.86 | 3233.38 | 5561.41 |
| DRCSM-8 | 1748.99 | 2277.79 | 3872.25 |
| DRCSM-9 | 1604.13 | 1875.55 | 3169.68 |
| DRCSM-10 | 2061.42 | 2399.28 | 4126.77 |
| DRCSM-11 | 2109.90 | 2724.95 | 4659.67 |
| DRCSM-12 | 2634.21 | 3321.13 | 5745.55 |
| DRCSM-13 | 2427.35 | 3157.77 | 5557.68 |
| DRCSM-14 | 2653.92 | 3256.24 | 5698.42 |
| DRCSM-15 | 2106.60 | 2712.71 | 4692.99 |
| DRCSM-16 | 2245.18 | 2791.22 | 4856.72 |
Table 11.
Range analysis results of 90-d compressive resilient modulus.
| Extremum difference analysis | Factor | |||
|---|---|---|---|---|
| Cement content | RCA replacement rate | DS replacement rate | FA replacement rate | |
| Mean 1 | 3101.33 | 3720.08 | 3752.35 | 4977.93 |
| Mean 2 | 3816.73 | 3804.77 | 4123.10 | 4224.21 |
| Mean 3 | 4425.42 | 4733.96 | 4190.53 | 4062.97 |
| Mean 4 | 5201.45 | 4286.12 | 4478.96 | 3279.82 |
| Range | 2100.12 | 1013.88 | 726.61 | 1698.11 |
Table 12.
The variance analysis results of the 90-d compressive resilient modulus.
| Factor | Cement content | RCA replacement rate | DS replacement rate | FA replacement rate | Error |
|---|---|---|---|---|---|
| Square of deviance | 5484996 | 636663 | 402212 | 1548590 | 266688 |
| Degree of freedom | 3 | 3 | 3 | 3 | 15 |
| Estimate of variance | 1828332 | 212221 | 134071 | 516197 | 88896 |
| F0.01 | 5.417 | 5.417 | 5.417 | 5.417 | — |
| F0.05 | 3.287 | 3.287 | 3.287 | 3.287 | — |
| F | 20.567 | 2.387 | 1.508 | 5.807 | — |
Table 13.
Average range of 90-d compressive resilient modulus of mixture under different cement contents.
Table 13.
Average range of 90-d compressive resilient modulus of mixture under different cement contents.
| Cement content | 6% | 8% | 10% | 12% |
|---|---|---|---|---|
| 90-d compressive resilient modulus | 3101.25 | 3816.75 | 4425.75 | 5201.50 |
Table 14.
Calculation results of life cycle carbon emissions of 1 m3 CSM.
| Group number | C (kg) | ||||||
|---|---|---|---|---|---|---|---|
| NCA | 1 | 0.85 | 126.9 | 1 | 199.2 | 11.3 | 2.9 |
| RCSM-25 | 126.9 | 1.125 | 199.2 | 14.3 | 3.7 | ||
| RCSM-50 | 126.9 | 1.25 | 199.2 | 17.7 | 4.6 | ||
| RCSM-75 | 126.9 | 1.375 | 199.2 | 21.4 | 5.6 | ||
| RCSM-100 | 126.9 | 1.5 | 199.2 | 25.4 | 6.6 |
Note: RCSM-25, RCSM-50, RCSM-75, and RCSM-100 represent the recycled aggregate replacement rate of CSM of 25%, 50%, 75%, 100%, respectively; NCA represents the conventional CSM.
Disclaimer/Publisher’s Note: The statements, opinions and data contained in all publications are solely those of the individual author(s) and contributor(s) and not of MDPI and/or the editor(s). MDPI and/or the editor(s) disclaim responsibility for any injury to people or property resulting from any ideas, methods, instructions or products referred to in the content. |
© 2024 by the authors. Licensee MDPI, Basel, Switzerland. This article is an open access article distributed under the terms and conditions of the Creative Commons Attribution (CC BY) license (http://creativecommons.org/licenses/by/4.0/).
Copyright: This open access article is published under a Creative Commons CC BY 4.0 license, which permit the free download, distribution, and reuse, provided that the author and preprint are cited in any reuse.


