Submitted:
20 March 2024
Posted:
21 March 2024
You are already at the latest version
Preprints on COVID-19 and SARS-CoV-2
Abstract
Keywords: COVID-19, SARS-CoV-2, Antibody, ELISA, Spike, S1, S2, RBD, epitopes, Neutralization
Keywords:
COVID-19
; SARS-CoV-2
; Antibody
; ELISA
; Spike
; S1
; S2
; RBD
; epitopes
; Neutralization
1. Introduction
Four years have passed since the World Health Organization (WHO) declared the COVID-19 pandemic due to SARS-CoV-2, on March 11, 2020. More than 770 million cases of COVID-19 and over 7 million deaths have been officially reported since then, although it is estimated that these numbers are considerably higher [1]. Nonetheless, SARS-CoV-2 vaccines have contributed to attenuate such a burden by promoting the development of effective immune responses, thus reducing the spread of the pandemic, the severity of the disease, hospitalizations and deaths [2].
SARS-CoV-2 belongs to the family Coronaviridae, is an enveloped virus, with a positive sense genome of around 30,000 nt. The genome codes for four structural proteins (nucleocapsid or N, spike or S, membrane or M and envelope or E), 15 non-structural proteins and 8 accessory proteins [3]. The structural homotrimeric glycoprotein S has been used as the target for many of the vaccines developed [4,5]. This protein is composed of the S1 and S2 subunits. The surface subunit S1 is composed of 672 amino acids and is organized into four domains: an N-terminal domain (NTD), a C-terminal domain (CTD, also known as the receptor-binding domain, RBD) and two subdomains (SD1 and SD2) [5]. The highly antigenic region known as the receptor binding domain (RBD) mediates the interaction with the receptor angiotensin converting enzyme (ACE2) and the binding of the majority of neutralizing antibodies [6]. It is known that other epitopes outside of RBD, like NTD, are also important in immunity and contribute to the antigenic profile of the S protein [7,8,9], but the effects of antibody recognition are not yet well characterized. The transmembrane subunit S2 is composed of 588 amino acids and contains a hydrophobic N-terminal fusion peptide (FP), two heptad repeats (HR1 and HR2), a transmembrane domain (TM), and a cytoplasmic tail (CT), the S2 subunit being the more conserved among all coronaviruses [10,11]. S antigen was used as immunogen in several vaccine constructs.
Vaccine strategies included non-replicating adenoviral vectors, nucleic acid (mRNA), whole inactivated viruses and protein subunit-based vaccines. The two-component adenovirus vector vaccine Gam-COVID-Vac (Sputnik-V) was the second most distributed vaccine in Venezuela and was also employed in other Latin American countries [12,13]. Despite being distributed in at least 35 countries and having over 1.3 billion doses administered by March 2024 (according to ourworldindata.com), few studies are available on Sputnik-V efficacy and immunogenicity, compared to other vaccines. In order to deepen the understanding of its effectiveness and immunogenicity of Sputnik-V, the aim of this study was to explore the antibody reactivity of individuals vaccinated with Sputnik-V towards different regions of S. Neutralizing antibody (Nab) activity was assessed and correlated with the reactivity of the antibodies to S over time.
2. Materials and Methods
2.1. Study Design, Participants and Serum Recollection
The samples evaluated were obtained from volunteer subjects belonging to the Gam-COVID-Vac (NCT04642339): prospective, double-blind, randomized, placebo-controlled clinical trial in Venezuela, from December 2020 to July 2021. Inclusion criteria included male and female volunteers aged 18 years or older, who read and signed the informed consent form, tested negative for HIV, hepatitis and syphilis; volunteers had no clinical history of COVID-19 and tested negative for both IgG and IgM antibodies to SARS-Cov-2 by enzyme immunoassay (PISHTAZTEB Diagnostic, Tehran, Iran) and negative for SARS-Cov-2 by RT-PCR. Exclusion criteria were any vaccination/immunization within 30 days prior to enrollment, use of steroids (except hormonal contraceptives) and/or immunoglobulins or other blood products not completed within 30 days before the enrollment, completion of immunosuppressive therapy within 3 months prior to enrollment, pregnancy and lactation. The inclusion and exclusion criteria details are shown in more detail on the clinical trials website (clinicaltrials.gov/ct2/show/NCT04642339). The volunteers were from Caracas, ranging in age from 20 to 80 years old. A total of 133 sera were obtained, being 80 male and 53 female volunteers, divided between vaccinated (n=105) and placebo controls (n=28). All volunteers received a first dose on day 1 and a second dose 21 days after the first dose. Samples were taken 42 days post vaccination (dpv), counting after the first dose and 21 days after the second dose. For a subgroup of 46 vaccinated volunteers, serum was also obtained at 180 dpv. The trial and all its procedures were approved by the National Ethics Committee for Research in COVID-19.
2.2. Antigens
The recombinant antigens for the enzyme-linked immunosorbent assays (ELISA) were acquired from MyBioSource Inc. (San Diego, CA). The ancestral S protein (MBS8574721), S1 (MBS8309640), S2 (MBS9141947), RBD (MBS8574741), and N (MBS5316649) antigens, were used. The concentration of antigens was confirmed using Qubit™ Protein Assay according to the manufacturer’s specifications (Thermo Fisher, catalog number Q32866).
2.3. ELISA Reactivity
To determine the reactivity of the sera towards the different regions of S and N, the latter to rule out a SARS-CoV-2 infection, the microtiter plates were sensitized with 1 µg/mL (2 µg/mL for N) of the antigens in a final volume of 50 µL, and incubated at 4 C° overnight. The next day, the solution was decanted, and the plates were incubated with 150 µL of 1X blocking solution (Abcam, Cambridge, United Kingdom, ab126587) for at least 1 hour at room temperature. During this incubation, the samples of vaccinated and controls were diluted 1/100 in 1X blocking solution. After the blocking time, the plate was washed 6 times with 0.01% PBS-Tween and 100 µL of the diluted serum samples were incubated for 2 hours at 37°C and the plate was washed again. The anti-human IgG secondary antibody conjugated to horseradish peroxidase (Jackson ImmunoResearch Inc, Pennsylvania, United States of America, 109-035-008) diluted 1/70,000 was added and incubated for 1 hour. The chromogenic substrate solution of peroxidase, TMB (3,3′,5,5′-tetramethylbenzidine) was used for the color development reaction. To stop the reaction, 50 µL of HCl [3M] was used. For the reading and recording of the data, a spectrophotometer (SpectraMax 250) was used at 450 nm. As negative controls, 18 sera from apparently healthy individuals obtained before the pandemic were used. A positive control to normalize data was used, consisting of a mixture of two sera from highly responsive individuals, vaccinated with Sputnik-V and with two infections confirmed by PCR. An additional 20 sera with hybrid immunity (infection(s) plus Sputnik-V vaccination) with infections confirmed by RT-PCR, were included. Reactivity against SARS-CoV-2 antigens (ancestral: S, S1, S2 and RBD) was assessed within this group of 134 individuals. The optical densities (O.D.) of the blank was subtracted from the O.D. of the samples. O.D. exceeding the cut off established with negative control mean plus 3 standard deviations were considered as responders to N or S. Relative levels of IgG antibodies were normalized as the sample-to-positive ratio (S/P) [12,14] using this formula with the respective controls assayed on each ELISA plate:
S/P= ((O.D. sample-O.D. negative controls)/(O.D. positive controls-O.D. negative controls)) X 100.
The BAU (binding antibody units) serum international standard from the World Health Organization (WHO) was used for some assays to establish a standard curve and measure the relative concentration of antibodies in each sample.
2.4. Surrogate Neutralization Test (SNT) Based on ACE2 Blocking Adsorption Immunoassay
A commercial kit was used that allows the detection of neutralizing antibodies, through a competitive ELISA (SARS-CoV-2 Neutralization Antibody Detection Kit, Elabscience ®, Houston, USA), according to manufacturer instructions. Briefly, the test quantifies NAbs against RBD able to block the interaction between S and ACE-2. In this assay, 50 µL of the sera diluted 1/10 were incubated with 50 µL of the solution containing the recombinant spike protein (RBD) conjugated to HRP in a microtiter plate already sensitized with ACE2 for 1 hour. Subsequently, it was washed 3 times with the commercial washing solution provided by the kit and 90 µL of commercial substrate from the commercial kit were added for a 15-minute incubation, after this time, 50 µL of the STOP solution provided by the kit were added. For the reading and recording of the data, a spectrophotometer (SPECTRAmax 250) was used at 450 nm. If neutralizing antibodies are present in the sample, they will inhibit spike interaction with recombinant ACE-2, which will result in a decrease in the optical density signal. The commercial kit provides a titration curve to determine the titers of NAbs anti-RBD.
2.5. Plaque Reduction Neutralization Test
A plaque reduction neutralization test (PRNT) was conducted on 20 samples of serum collected at 42 days post-vaccination (dpv), and 18 samples from 180 dpv. PRNT was performed according to a previously reported procedure [14]. VERO C1008 cells (Vero 76, clone E6, vero. ATCC, Manassas, USA), were maintained at 37 °C and 5% CO2 in RPMI medium (Thermo Fisher Scientific, 11875093) supplemented with 10% fetal bovine serum (FBS, Thermo Fisher Scientific, 16000044) and 1% penicillin-streptomycin (Thermo Fisher Scientific, Massachusetts, United States of America, 15140122). Infection was performed using viral seeds of a SARS-CoV-2 ancestral strain (B.1.1.3) in a biosecurity cabinet within a level 3 biosecurity facility. PRNT50 of each serum was determined through a non-linear regression test, defining this value as the reverse of the dilution at which 50% of the virus control (VC) is neutralized.
2.6. Statistical Analysis
All statistical tests and graphs were performed with PRISM GraphPad ©, California, USA. For the analysis of the reactivity towards the ancestral spike protein and its different regions, the Kruskal Wallis test with an alpha value of 0.05 was used, with its respective Dunn’s correction post-hoc analysis. For the analysis of reactivity towards the spike and its different regions and SNT comparisons a Mann-Whitney test with an alpha value of 0.05 was used. For ELISA and PRNT50, comparisons at 42 and 180 dpv, a paired Wilcoxon test was used with an alpha value of 0.05. To determine the degree of association between IgG antibody reactivity, SNT and PRNT50, the correlations matrix test was performed using the Spearman correlation coefficient with a confidence interval (CI) of 95%. For frequency comparison among groups, statistical difference was assessed with Chi square test (Epi InfoTM, Centers for Disease Control and Prevention, Atlanta, USA).
3. Results
3.1. Seroconversion Rates in Non-Exposed Vaccinated Individuals in the Clinical Trial
A total of 133 volunteer sera were obtained from the Gam-COVID-Vac clinical trial, in Venezuela. Of them, 105 were from vaccinated individuals, and 20/106 exhibited reactivity against N, suggestive of exposure (Figure 1). The sera of 85/105 vaccinated (with no serological evidence of exposure) were analyzed for their reactivity against different regions of S. Figure 2 shows the levels of Abs (BAU/mL) for S in the sera from the different groups. A total of 92% of the vaccinated non-exposed individuals could be classified as responders, according to their BAU titer. Some sera (52%) from placebo individuals without reactivity to N, showed however reactivity to S in this assay (Figure 2), suggesting that some of them were also exposed during the course of the clinical trial, or before. It is important to note, however, that some of the sera apparently reactive to N or S, exhibited very low S/P or BAU values, near the limit of positivity, suggesting some unspecific reactivity.
3.2. Reactivity to Different Regions of SARS-CoV-2 S
In order to dissect the humoral immune response to S, the reactivity to the different regions of this protein was evaluated (Figure 3). The reactivity of sera from apparently healthy individuals collected before the pandemic (pre-pandemic) was also analyzed as negative controls. S and S1 regions were recognized at a similar frequency, while fairly less sera recognized the RBD region, and significantly less sera recognized the S2 domain (58%, p<0.001) (Figure 3A). For the vaccinated individuals at 42 dpv, statistically significant differences were observed (p<0.0001) in the S/P average ratio between the different antigens. Multiple comparisons revealed that the S1 region was recognized with a greater S/P value in the sera than other regions (p=0.0054), while S and RBD exhibited similar reactivity, and S2 was recognized with significantly lower reactivity (p<0.0001).
The reactivity of the vaccinated volunteers was compared with those with serological evidence of exposure, suggestive of hybrid immunity (Figure 3B). The average reactivity of the sera from the group of individuals with hybrid immunity was significantly higher than that of the vaccinated only group (Wilcoxon test), especially in the case of the S2 region, where a more pronounced difference was observed (4.1x). Reactivity of some sera with S (n=2), S2 (n=8) and RBD (n=2) was observed in the 20 prepandemic sera, being the S2 the most frequently recognized (p 0.0076) (Figure 3C). These samples were excluded for the antigen cut-off calculation. The sera at 180 dpv (in vaccinated individuals who completed the clinical trial, n=21) exhibited a significant decrease in reactivity to S and RBD (Wilcoxon paired test, p<0.05), while no significant differences were observed for S1 and S2. In some cases, an increase in S/P value was observed at 180 dpv (Figure 3D).
3.3. Surrogate Neutralization Test (SNT)
The SNT based on ACE2 blocking immunoassay allowed to quantify the NAbs against SARS-CoV-2 directed against RBD (Figure 4). Significant differences were observed between the placebos and the vaccinated, as expected. No significant differences were observed between the Nabs levels at 42 and 180 dpv. The pre-pandemic sera did not show NAbs by this test, even those that exhibited ELISA reactivity to some S regions.
The ELISA reactivity to different regions of S was correlated with demographic parameters (Figure 5). A low negative but significant correlation was found between reactivity to S and the level of SNT with age. This was not observed for S1, S2 and RBD (not significant). No significant correlation was found between the reactivity to S and its regions and sex (data not shown). Significant positive correlations were found between reactivity to S and to S1 and RBD, but not to reactivity for S2. The highest positive correlation was found between SNT and reactivity to RBD, as expected, with the lowest correlation between SNT and reactivity to S2.
3.4. Plaque Reduction Neutralization Test (PRNT50)
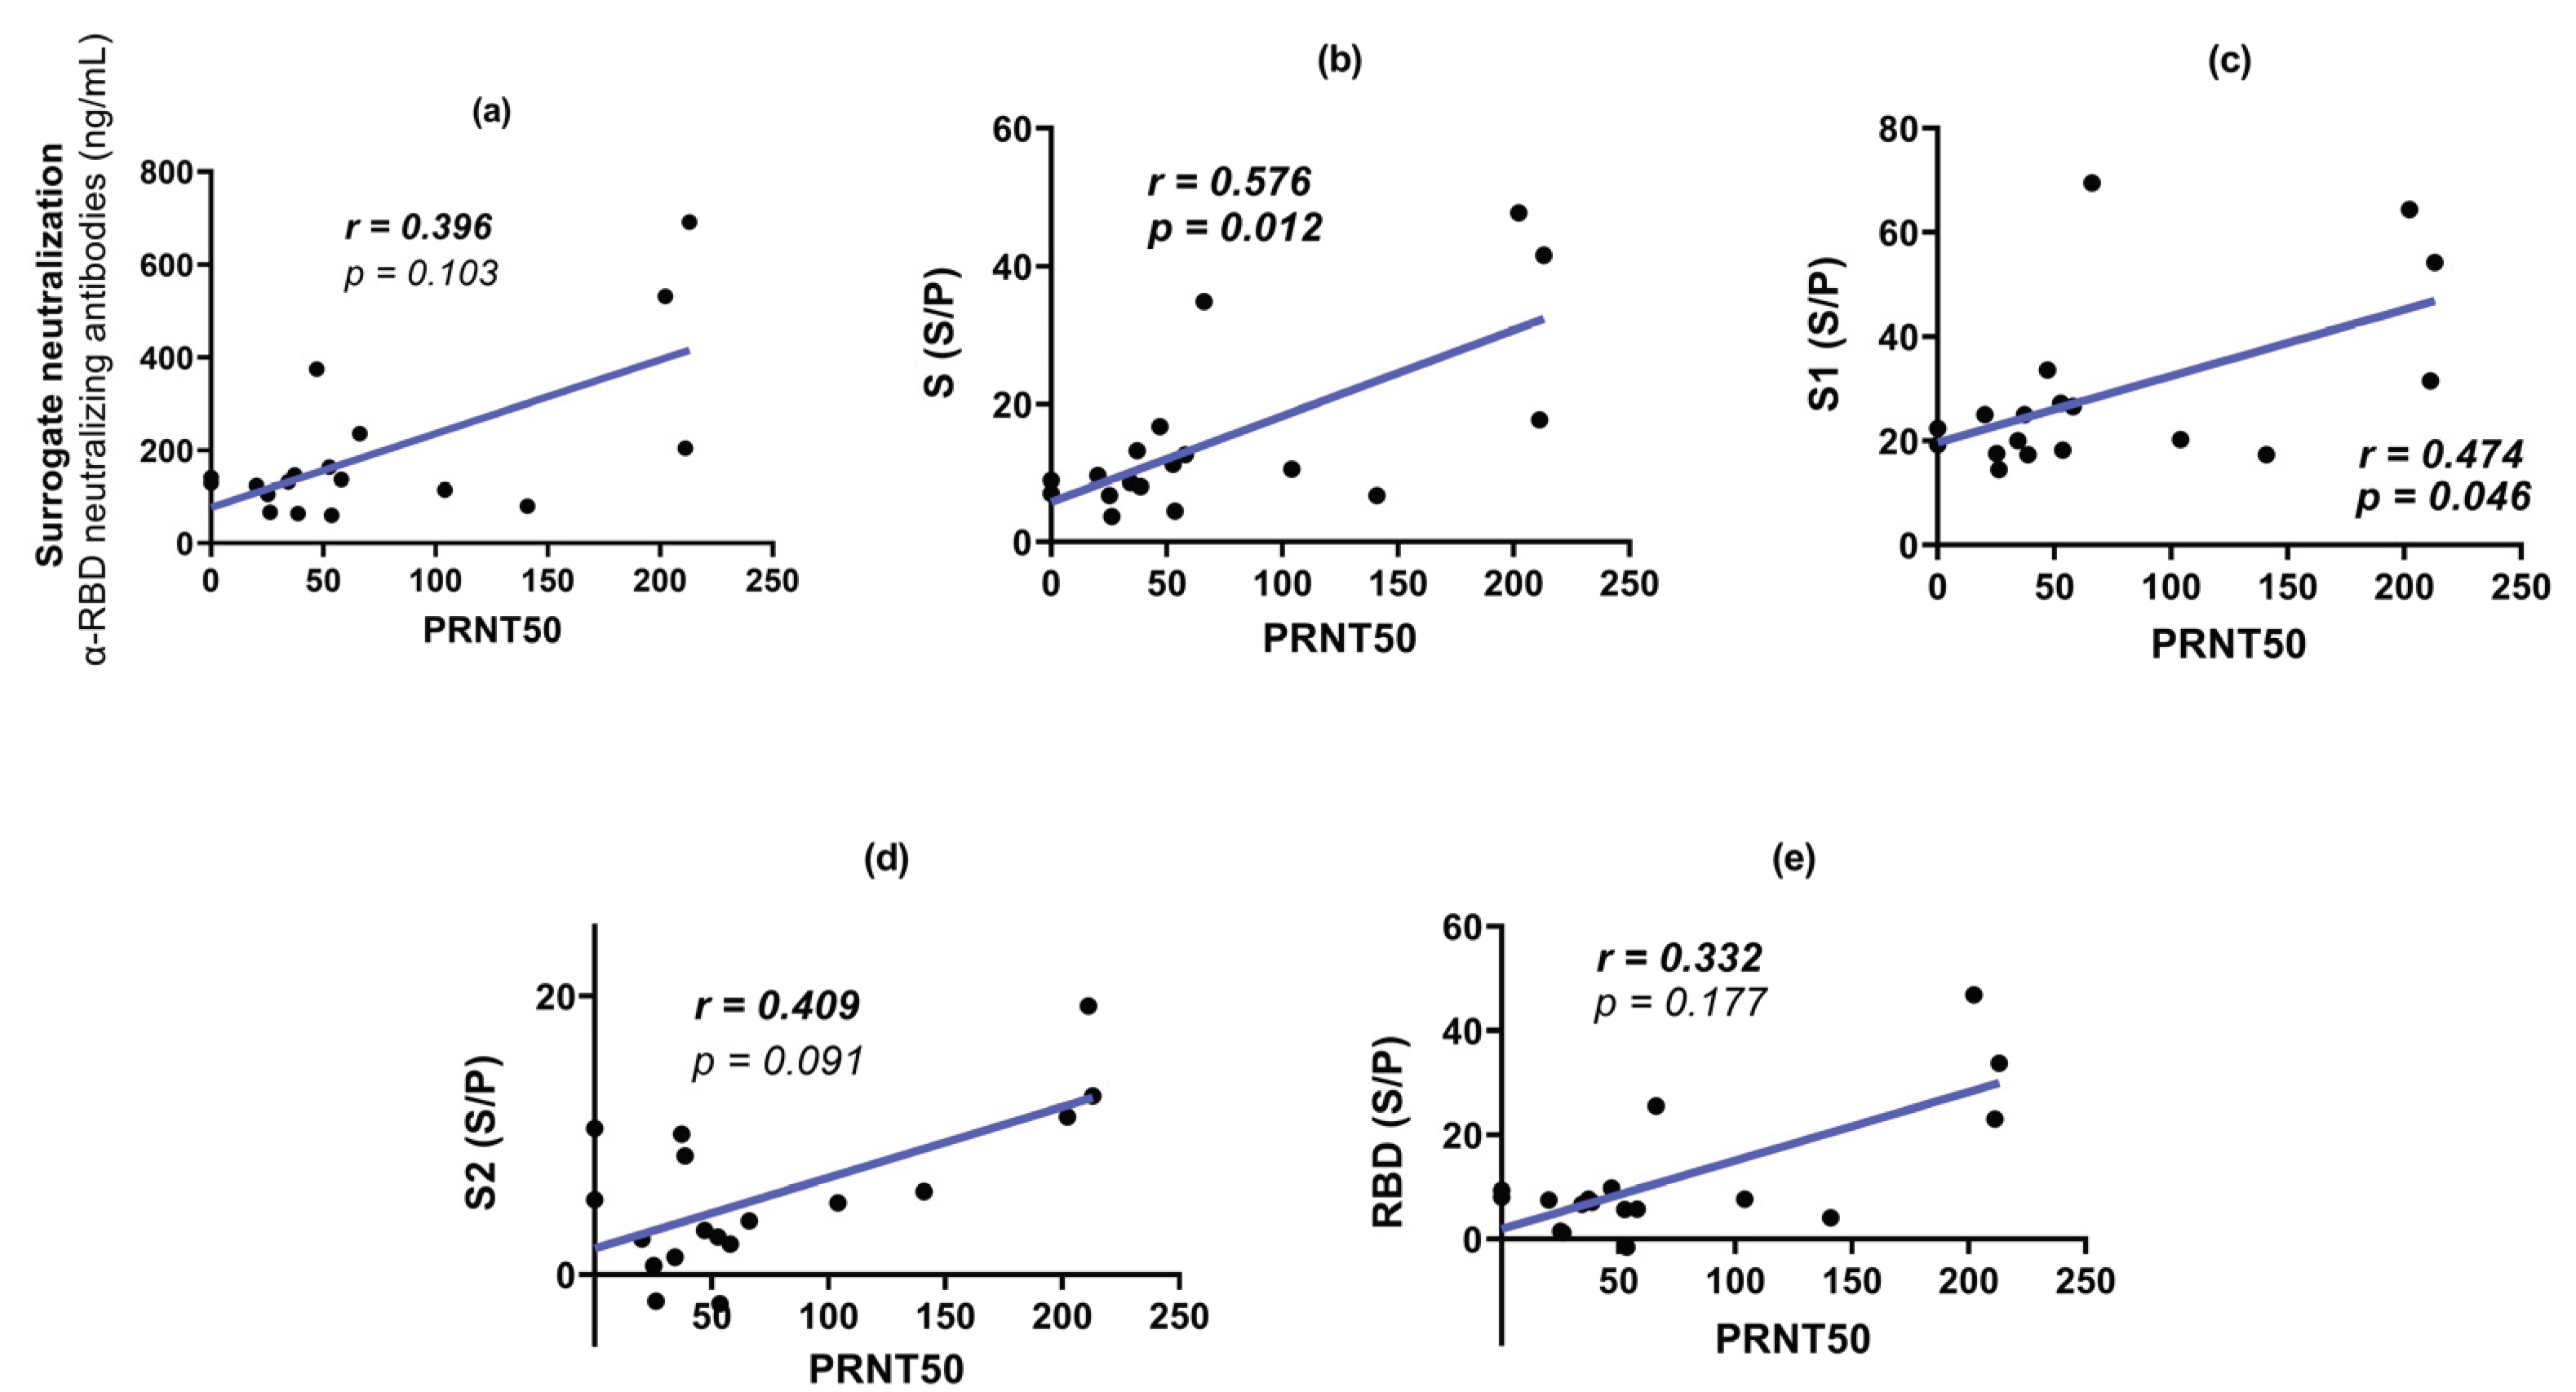
Figure 6 shows the PRNT50 for the sera analyzed at 42 and 180 dpv. PRNT50 titer was not observed for any placebo sera. No significant difference was observed between the PRNT50 at 42 and 180 dpv. Some individuals even exhibited higher neutralization titers at 180 dpv. PRNT50 titers were correlated with the other parameters analyzed in this study (Figure 7). The highest correlation was obtained with the reactivity to S1, followed by S and RBD. A lower correlation was observed with SNT and reactivity to S2. All comparisons showed moderate to low correlations with PRNT50. Similar results were observed when analyzing sera at 180 dpv (Figure 8) with a reduction in the correlation with reactivity to RBD.
4. Discussion
The dissection of the Ab reactivity to different S regions allowed us to correlate this reactivity with the neutralizing ability of sera from volunteers vaccinated with Sputnik V. Determining exposure to SARS-CoV-2 was essential to exclude from the study those individuals who were exposed to the virus during the course of the clinical trial, by analyzing reactivity to N. The first observation is that a quite important proportion of volunteers exhibited evidence of SARS-CoV-2 exposure (anti-N Abs) during the clinical trial. It should be noted that anti-N Abs have low persistence in serum compared to anti-S ones [15]. In fact, the analysis of the reactivity to S revealed that additional volunteers from the placebo group exhibited anti-S Abs, without reactivity to N, suggesting that an even higher degree of exposure in the group might have occurred. The apparent relatively high incidence of exposure to the virus during the window of the clinical trial could be explained by the increase in the number of cases in Venezuela during the period of time of the clinical trial [16]. It is important to note that only 2 of the apparently exposed volunteers, from the placebo group, reported a symptomatic COVID-19 episode. This suggests that the Ab reactivity to SARS-CoV-2 proteins might have been associated to an asymptomatic or mild exposure in most of the cases.
Of the total vaccinated, 92% of individuals responded to vaccination by generating detectable anti-S Abs, a frequency similar to the one reported in previous studies, and in agreement to the high efficacy and seroconversion rate reported for the Sputnik vaccine [17,18,19,20,21]. It has been reported that BAU levels between 13 and 141 BAU/ml provided only 12.4% protection against SARS-CoV-2 (ancestral strain), a concentration between 141 and 1700 BAU/ml 89.3% protection and a concentration of 1700 BAU/ml and higher provided complete protection [22]. In our study, a value less than 119 BAU/mL was considered as the threshold to define non-responder individuals.
The analysis of Ab reactivity to the different regions of S showed that S1 was the most important antigenic region, exhibiting higher recognition than the RBD, while S2 turned out to be the region with the lowest reactivity. These results are consistent with previous reports describing other regions within S1 outside RBD capable of generating an antibody response [23]. On the other hand, the fact that S1 exhibited greater antigenicity than S in our assays, also suggests that some of these sites are probably encrypted or less exposed when S is in its homotrimeric conformation or the pre-fusion states [23,24,25]. Most of the S in the SARS-CoV-2 virions are present in a metastable pre-fusion conformation, although some S can adopt an extended post-fusion rod-like conformation, due to the premature dissociation of S1 from S2 (independent of the interaction with ACE-2), which also releases the soluble S1s subunit. S1s can act as an independent immunogen, and probably induces a B lymphocyte response independent of T through cross-linking of the B cell receptor (BCR) [26] in addition to the canonical mechanisms of B lymphocyte stimulation. This same conformational phenomenon has been reported in the S product of the Sputnik-V vaccine construct, which does not have stabilization mutations [27]. The role of the dissociation of the S1 subunit in immunity or the pathophysiology of the disease is still unclear: some data suggest that it may contribute to a higher proportion of no NAbs compared to neutralizing ones [28]. We hypothesize that it may contribute to the generation of Abs against regions outside of RBD, such as NTD. It has been described that dissociated S1 subunits are capable of forming immune complexes with Abs [28] that probably can activate Fc receptors in dendritic and follicular cells promoting the S1 antigen presentation. Additionally, other studies have indicated that the S1 subunit, particularly the NTD, can activate cells within the innate immune system [29].
The S2 region trigger the fusion of the viral membrane to the cellular membrane. Some authors have suggested that it is a less immunogenic region than S1, because of its high degree of glycosylation [30,31] In contrast to the low antigenicity exhibited by S2 in the sera of vaccinated volunteers, this was the region of S most frequently recognized by pre-pandemic control sera (Figure 3C). The presence of these antibodies is probably due to the seasonal prevalence of the four common types of human coronaviruses, especially OC43 and HKU1 [32,33]. Some authors have described, through microarray assays with recombinant S peptides, that there are immunogenic sites in S2 between amino acids 818 and 835, the region corresponding to the fusion peptide (FP) that is highly conserved among coronaviruses [34,35,36]. Targeting the FP with antibodies can prevent the host protease TMPRSS2 from cleaving the S2 subdomain, thus reducing viral entry [34]. In addition, the amino acid sequence of FP does not vary among the variants of SARS-CoV-2 currently known [37]. Interestingly, when comparing the Ab reactivity to the different S regions between the sera of vaccinated and (probably) exposed vaccinated volunteers, the highest increase in reactivity was found for the S2 region (4.1X). This observation might suggest that natural infection induces a stronger reactivity to S2, compared to the one elicited by the Sputnik V vaccine. The results obtained coincide with other reports such as those of Polvere et al. who identified that natural infection by COVID-19 combined with vaccination results, on average, in a higher antibody titer and greater neutralizing activity with respect to fully vaccinated people without a history of COVID-19 [38].
No differences were observed between sex and the anti-S Abs levels, in agreement with previous reports [39]. The correlation between reactivities to S, SNT and age exhibited an age-independent response. This has also been reported in other Sputnik-V studies [17,20,40]. While a reduction in the total Abs was observed by ELISA, the levels of Nabs, measured by SNT or PRNT50, were maintained on average at 180 dpv, suggesting a maturation process in the immune response. In contrast, a decline in Nabs has been reported for mRNA vaccines [41]. Some low-level transgene long-term expression has been described [42,43]. The persistence of antigen expression may be a distinctive feature of adenovirus vector vaccines and has been proposed to contribute to the induction of sustained immune responses and lasting immunity to S and could explain the persistence of NAbs. Another mechanism, such as maturation of B lymphocytes in germinal centers (GC) in the lymph node [44,45] has also been reported to contribute to the diversification of response and maturation of antibodies affinity [46,47,48].
SNT levels were not significantly correlated with PRNT50 titers. Moreover, at 42 dpv, the highest correlation with PRNT50 was observed with S1 reactivity. This observation is in agreement with the evidence that RBD is not the only region that actively participates in inducing Nabs against SARS-CoV-2 [49] like NTD. While the function of the NTD as a neutralization target is not yet fully understood, it has been observed that other NTD-specific neutralizing antibodies, in MERS, can inhibit the conformational change from pre-fusion to post-fusion even after receptor binding occurs [9,50].
This study has potential limitations. The number of volunteers at 180 dpv was limited, reducing the strength of comparison for this time point. An analysis of the cellular immune response in the participants would have been useful.
In conclusion, the vaccine immunogenicity reported in this study is in agreement with the high efficacy reported for the Sputnik V vaccine [17,21], and that this vaccine is able to induce an immunity lasting at least for 180 days. The dissection of the Ab reactivity to different regions of S allowed to identify the relevance of epitopes outside RBD able to induce Nabs. We suggest that polyclonal and diverse responses of antibodies against S could confer different levels of protection including neutralizing antibodies and a lasting response.
Author Contributions
Conceptualization, supervision, and project administration, F.H.P., A.G., H.R.R.; investigation, A.C., C.F., M.R., D.J.G., R.C.J.; resources, I.B., S.M., M.H., F.C., J.H.W., N.P.G., writing—original draft preparation, A.C.; writing—review and editing, A.C., C.F., F.H.P., F.L., R.C.J., J.L.Z., J.H.W.; funding acquisition, F.H.P., H.R.R, A.G. All authors have read and agreed to the published version of the manuscript.
Funding
This research was funded by Ministerio del Poder Popular de Ciencia, Tecnología e Innovación of Venezuela.
Institutional Review Board Statement
The study was conducted in accordance with the Declaration of Helsinki and approval was obtained from the National Ethics Committee for Research in COVID-19 of Venezuela.
Informed Consent Statement
Patient consent for samples used in this study was obtained in accordance with the Declaration of Helsinki, and and approved by the National Ethics Committee for Research in COVID-19 of Venezuela.
Data Availability Statement
The complete genome sequence of the SARS-CoV-2 strain used for neutralization assays have been deposited in the GISAID database (accession numbers EPI_ISL_6980947.
Acknowledgments
The authors are indebted to all members of the clinical trial team. We are also indebted to the volunteers who acceded to participate in the Clinical trial. This study was supported by Ministerio del Poder Popular de Ciencia, Tecnología e Innovación of Venezuela.
Conflicts of Interest
The authors declare no conflict of interest. The funders had no role in the design of the study; in the collection, analyses, or interpretation of data; in the writing of the manuscript, or in the decision to publish the results.
References
- Barber, R.M.; Sorensen, R.J.D.; Pigott, D.M.; Bisignano, C.; Carter, A.; Amlag, J.O.; Collins, J.K.; Abbafati, C.; Adolph, C.; Allorant, A.; et al. Estimating Global, Regional, and National Daily and Cumulative Infections with SARS-CoV-2 through Nov 14, 2021: A Statistical Analysis. The Lancet 2022, 399, 2351–2380. [Google Scholar] [CrossRef] [PubMed]
- Watson, O.J.; Barnsley, G.; Toor, J.; Hogan, A.B.; Winskill, P.; Ghani, A.C. Global Impact of the First Year of COVID-19 Vaccination: A Mathematical Modelling Study. Lancet Infect Dis 2022, 22, 1293–1302. [Google Scholar] [CrossRef] [PubMed]
- V’kovski, P.; Kratzel, A.; Steiner, S.; Stalder, H.; Thiel, V. Coronavirus Biology and Replication: Implications for SARS-CoV-2. Nat Rev Microbiol 2021, 19, 155–170. [Google Scholar] [CrossRef] [PubMed]
- Wang, Q.; Zhang, Y.; Wu, L.; Niu, S.; Song, C.; Zhang, Z.; Lu, G.; Qiao, C.; Hu, Y.; Yuen, K.Y.; et al. Structural and Functional Basis of SARS-CoV-2 Entry by Using Human ACE2. Cell 2020, 181, 894–904.e9. [Google Scholar] [CrossRef] [PubMed]
- Duan, L.; Zheng, Q.; Zhang, H.; Niu, Y.; Lou, Y.; Wang, H. The SARS-CoV-2 Spike Glycoprotein Biosynthesis, Structure, Function, and Antigenicity: Implications for the Design of Spike-Based Vaccine Immunogens. Front Immunol 2020, 11. [Google Scholar] [CrossRef]
- Wheatley, A.K.; Pymm, P.; Esterbauer, R.; Dietrich, M.H.; Lee, W.S.; Drew, D.; Kelly, H.G.; Chan, L.J.; Mordant, F.L.; Black, K.A.; et al. Landscape of Human Antibody Recognition of the SARS-CoV-2 Receptor Binding Domain. Cell Rep 2021, 37. [Google Scholar] [CrossRef]
- Ou, X.; Liu, Y.; Lei, X.; Li, P.; Mi, D.; Ren, L.; Guo, L.; Guo, R.; Chen, T.; Hu, J.; et al. Characterization of Spike Glycoprotein of SARS-CoV-2 on Virus Entry and Its Immune Cross-Reactivity with SARS-CoV. Nat Commun 2020, 11. [Google Scholar] [CrossRef]
- Cai, Y.; Zhang, J.; Xiao, T.; Peng, H.; Sterling, S.M.; Walsh, R.M.; Rawson, S.; Rits-Volloch, S.; Chen, B. Distinct Conformational States of SARS-CoV-2 Spike Protein. Science (1979) 2020, 369. [Google Scholar] [CrossRef] [PubMed]
- Zhou, H.; Chen, Y.; Zhang, S.; Niu, P.; Qin, K.; Jia, W.; Huang, B.; Zhang, S.; Lan, J.; Zhang, L.; et al. Structural Definition of a Neutralization Epitope on the N-Terminal Domain of MERS-CoV Spike Glycoprotein. Nat Commun 2019, 10, 3068. [Google Scholar] [CrossRef] [PubMed]
- Wrapp, D.; Wang, N.; Corbett, K.S.; Goldsmith, J.A.; Hsieh, C.-L.; Abiona, O.; Graham, B.S.; Mclellan, J.S. Cryo-EM Structure of the 2019-NCoV Spike in the Prefusion Conformation. Science (1979) 2019, 367, 1260–1263. [Google Scholar] [CrossRef] [PubMed]
- Shah, P.; Canziani, G.A.; Carter, E.P.; Chaiken, I. The Case for S2: The Potential Benefits of the S2 Subunit of the SARS-CoV-2 Spike Protein as an Immunogen in Fighting the COVID-19 Pandemic. Front Immunol 2021, 12. [Google Scholar] [CrossRef] [PubMed]
- Claro, F.; Silva, D.; Pérez Bogado, J.A.; Rangel, H.R.; de Waard, J.H. Lasting SARS-CoV-2 Specific IgG Antibody Response in Health Care Workers from Venezuela, 6 Months after Vaccination with Sputnik V. International Journal of Infectious Diseases 2022, 122, 850–854. [Google Scholar] [CrossRef] [PubMed]
- Chahla, R.E.; Tomas-Grau, R.H.; Cazorla, S.I.; Ploper, D.; Vera Pingitore, E.; López, M.A.; Aznar, P.; Alcorta, M.E.; Vélez, E.M. del M.; Stagnetto, A.; et al. Long-Term Analysis of Antibodies Elicited by SPUTNIK V: A Prospective Cohort Study in Tucumán, Argentina. The Lancet Regional Health - Americas 2022, 6, 100123. [Google Scholar] [CrossRef] [PubMed]
- Claro, F.; Silva, D.; Rodriguez, M.; Rangel, H.R.; de Waard, J.H. Immunoglobulin G Antibody Response to the Sputnik V Vaccine: Previous SARS-CoV-2 Seropositive Individuals May Need Just One Vaccine Dose. International Journal of Infectious Diseases 2021, 111, 261–266. [Google Scholar] [CrossRef]
- Van Elslande, J.; Oyaert, M.; Lorent, N.; Vande Weygaerde, Y.; Van Pottelbergh, G.; Godderis, L.; Van Ranst, M.; André, E.; Padalko, E.; Lagrou, K.; et al. Lower Persistence of Anti-Nucleocapsid Compared to Anti-Spike Antibodies up to One Year after SARS-CoV-2 Infection. Diagn Microbiol Infect Dis 2022, 103. [Google Scholar] [CrossRef]
- Jaspe, R.C.; Sulbaran, Y.; Loureiro, C.L.; Moros, Z.C.; Marulanda, E.; Bracho, F.; Ramirez, N.A.; Canonico, Y.; D’Angelo, P.; Rodriguez, L.; et al. Detection of the Omicron Variant of SARS-CoV-2 in International Travelers Returning to Venezuela. Travel Med Infect Dis 2022, 48, 102326. [Google Scholar] [CrossRef]
- Logunov, D.Y.; Dolzhikova, I. V.; Shcheblyakov, D. V.; Tukhvatulin, A.I.; Zubkova, O. V.; Dzharullaeva, A.S.; Kovyrshina, A. V.; Lubenets, N.L.; Grousova, D.M.; Erokhova, A.S.; et al. Safety and Efficacy of an RAd26 and RAd5 Vector-Based Heterologous Prime-Boost COVID-19 Vaccine: An Interim Analysis of a Randomised Controlled Phase 3 Trial in Russia. The Lancet 2021, 397, 671–681. [Google Scholar] [CrossRef]
- Jones, I.; Roy, P. Sputnik V COVID-19 Vaccine Candidate Appears Safe and Effective. The Lancet 2021, 397, 642–643. [Google Scholar] [CrossRef]
- Logunov, D.Y.; Dolzhikova, I. V.; Zubkova, O. V.; Tukhvatullin, A.I.; Shcheblyakov, D. V.; Dzharullaeva, A.S.; Grousova, D.M.; Erokhova, A.S.; Kovyrshina, A. V.; Botikov, A.G.; et al. Safety and Immunogenicity of an RAd26 and RAd5 Vector-Based Heterologous Prime-Boost COVID-19 Vaccine in Two Formulations: Two Open, Non-Randomised Phase 1/2 Studies from Russia. The Lancet 2020, 396, 887–897. [Google Scholar] [CrossRef]
- Logunov, D.Y.; Dolzhikova, I. V.; Zubkova, O. V.; Tukhvatullin, A.I.; Shcheblyakov, D. V.; Dzharullaeva, A.S.; Grousova, D.M.; Erokhova, A.S.; Kovyrshina, A. V.; Botikov, A.G.; et al. Safety and Immunogenicity of an RAd26 and RAd5 Vector-Based Heterologous Prime-Boost COVID-19 Vaccine in Two Formulations: Two Open, Non-Randomised Phase 1/2 Studies from Russia. The Lancet 2020, 396, 887–897. [Google Scholar] [CrossRef]
- Fiolet, T.; Kherabi, Y.; MacDonald, C.J.; Ghosn, J.; Peiffer-Smadja, N. Comparing COVID-19 Vaccines for Their Characteristics, Efficacy and Effectiveness against SARS-CoV-2 and Variants of Concern: A Narrative Review. Clinical Microbiology and Infection 2022, 28, 202–221. [Google Scholar] [CrossRef] [PubMed]
- Dimeglio, C.; Herin, F.; Martin-Blondel, G.; Miedougé, M.; Izopet, J. Antibody Titers and Protection against a SARS-CoV-2 Infection. Journal of Infection 2022, 84, 248–288. [Google Scholar] [CrossRef] [PubMed]
- Voss, W.N.; Hou, Y.J.; Johnson, N. V.; Delidakis, G.; Kim, J.E.; Javanmardi, K.; Horton, A.P.; Bartzoka, F.; Paresi, C.J.; Tanno, Y.; et al. Prevalent, Protective, and Convergent IgG Recognition of SARS-CoV-2 Non-RBD Spike Epitopes. Science (1979) 2021, 372, 1108–1112. [Google Scholar] [CrossRef] [PubMed]
- Li, Y.; Lai, D. yun; Zhang, H. nan; Jiang, H. wei; Tian, X.; Ma, M. liang; Qi, H.; Meng, Q. feng; Guo, S. juan; Wu, Y.; et al. Linear Epitopes of SARS-CoV-2 Spike Protein Elicit Neutralizing Antibodies in COVID-19 Patients. Cell Mol Immunol 2020, 17, 1095–1097. [Google Scholar] [CrossRef] [PubMed]
- Piccoli, L.; Park, Y.J.; Tortorici, M.A.; Czudnochowski, N.; Walls, A.C.; Beltramello, M.; Silacci-Fregni, C.; Pinto, D.; Rosen, L.E.; Bowen, J.E.; et al. Mapping Neutralizing and Immunodominant Sites on the SARS-CoV-2 Spike Receptor-Binding Domain by Structure-Guided High-Resolution Serology. Cell 2020, 183, 1024–1042.e21. [Google Scholar] [CrossRef]
- Ke, Z.; Oton, J.; Qu, K.; Cortese, M.; Zila, V.; McKeane, L.; Nakane, T.; Zivanov, J.; Neufeldt, C.J.; Cerikan, B.; et al. Structures and Distributions of SARS-CoV-2 Spike Proteins on Intact Virions. Nature 2020, 588, 498–502. [Google Scholar] [CrossRef] [PubMed]
- Heinz, F.X.; Stiasny, K. Distinguishing Features of Current COVID-19 Vaccines: Knowns and Unknowns of Antigen Presentation and Modes of Action. NPJ Vaccines 2021, 6. [Google Scholar] [CrossRef]
- Bos, R.; Rutten, L.; van der Lubbe, J.E.M.; Bakkers, M.J.G.; Hardenberg, G.; Wegmann, F.; Zuijdgeest, D.; de Wilde, A.H.; Koornneef, A.; Verwilligen, A.; et al. Ad26 Vector-Based COVID-19 Vaccine Encoding a Prefusion-Stabilized SARS-CoV-2 Spike Immunogen Induces Potent Humoral and Cellular Immune Responses. NPJ Vaccines 2020, 5. [Google Scholar] [CrossRef]
- Schroeder, J.T.; Bieneman, A.P. The S1 Subunit of the SARS-CoV-2 Spike Protein Activates Human Monocytes to Produce Cytokines Linked to COVID-19: Relevance to Galectin-3. Front Immunol 2022, 13. [Google Scholar] [CrossRef]
- Casalino, L.; Gaieb, Z.; Goldsmith, J.A.; Hjorth, C.K.; Dommer, A.C.; Harbison, A.M.; Fogarty, C.A.; Barros, E.P.; Taylor, B.C.; Mclellan, J.S.; et al. Beyond Shielding: The Roles of Glycans in the SARS-CoV-2 Spike Protein. ACS Cent Sci 2020, 6, 1722–1734. [Google Scholar] [CrossRef]
- Errico, J.M.; Adams, L.J.; Fremont, D.H. Antibody-Mediated Immunity to SARS-CoV-2 Spike. In Advances in Immunology; Academic Press Inc., 2022; Vol. 154, pp. 1–69. ISBN 9780323989435. [Google Scholar] [CrossRef]
- Sealy, R.E.; Hurwitz, J.L. Cross-Reactive Immune Responses toward the Common Cold Human Coronaviruses and Severe Acute Respiratory Syndrome Coronavirus 2 (SARS-CoV-2): Mini-Review and a Murine Study. Microorganisms 2021, 9, 1643. [Google Scholar] [CrossRef]
- Chen, Y.; Zhao, X.; Zhou, H.; Zhu, H.; Jiang, S.; Wang, P. Broadly Neutralizing Antibodies to SARS-CoV-2 and Other Human Coronaviruses. Nat Rev Immunol 2022. [Google Scholar] [CrossRef] [PubMed]
- Ballmann, R.; Hotop, S.K.; Bertoglio, F.; Steinke, S.; Heine, P.A.; Chaudhry, M.Z.; Jahn, D.; Pucker, B.; Baldanti, F.; Piralla, A.; et al. ORFeome Phage Display Reveals a Major Immunogenic Epitope on the S2 Subdomain of SARS-CoV-2 Spike Protein. Viruses 2022, 14. [Google Scholar] [CrossRef] [PubMed]
- Li, Y.; Lai, D. yun; Zhang, H. nan; Jiang, H. wei; Tian, X.; Ma, M. liang; Qi, H.; Meng, Q. feng; Guo, S. juan; Wu, Y.; et al. Linear Epitopes of SARS-CoV-2 Spike Protein Elicit Neutralizing Antibodies in COVID-19 Patients. Cell Mol Immunol 2020, 17, 1095–1097. [Google Scholar] [CrossRef] [PubMed]
- Wang, H.; Wu, X.; Zhang, X.; Hou, X.; Liang, T.; Wang, D.; Teng, F.; Dai, J.; Duan, H.; Guo, S.; et al. SARS-CoV-2 Proteome Microarray for Mapping COVID-19 Antibody Interactions at Amino Acid Resolution. ACS Cent Sci 2020, 6, 2238–2249. [Google Scholar] [CrossRef]
- Guo, L.; Lin, S.; Chen, Z.; Cao, Y.; He, B.; Lu, G. Targetable Elements in SARS-CoV-2 S2 Subunit for the Design of Pan-Coronavirus Fusion Inhibitors and Vaccines. Signal Transduct Target Ther 2023, 8. [Google Scholar] [CrossRef]
- Polvere, I.; Parrella, A.; Zerillo, L.; Voccola, S.; Cardinale, G.; D’Andrea, S.; Madera, J.R.; Stilo, R.; Vito, P.; Zotti, T. Humoral Immune Response Diversity to Different COVID-19 Vaccines: Implications for the “Green Pass” Policy. Front Immunol 2022, 13. [Google Scholar] [CrossRef]
- Rastegar Kashkouli, A.; Jafari, M.; Yousefi, P. Effects of Gender on the Efficacy and Response to COVID-19 Vaccination; a Review Study on Current Knowledge. Journal of Renal Endocrinology 2022, 8, e25064. [Google Scholar] [CrossRef]
- Petrović, V.; Vuković, V.; Patić, A.; Marković, M.; Ristić, M. Immunogenicity of BNT162b2, BBIBP-CorV, Gam-COVID-Vac and ChAdOx1 NCoV-19 Vaccines Six Months after the Second Dose: A Longitudinal Prospective Study. Vaccines (Basel) 2022, 11, 56. [Google Scholar] [CrossRef]
- Prather, A.A.; Dutcher, E.G.; Robinson, J.; Lin, J.; Blackburn, E.; Hecht, F.M.; Mason, A.E.; Fromer, E.; Merino, B.; Frazier, R.; et al. Predictors of Long-Term Neutralizing Antibody Titers Following COVID-19 Vaccination by Three Vaccine Types: The BOOST Study. Sci Rep 2023, 13. [Google Scholar] [CrossRef]
- Yang, T.-C.; Millar, J.; Groves, T.; Grinshtein, N.; Parsons, R.; Takenaka, S.; Wan, Y.; Bramson, J.L. The CD8+ T Cell Population Elicited by Recombinant Adenovirus Displays a Novel Partially Exhausted Phenotype Associated with Prolonged Antigen Presentation That Nonetheless Provides Long-Term Immunity. The Journal of Immunology 2006, 176, 200–210. [Google Scholar] [CrossRef] [PubMed]
- Tatsis, N.; Fitzgerald, J.C.; Reyes-Sandoval, A.; Harris-McCoy, K.C.; Hensley, S.E.; Zhou, D.; Lin, S.-W.; Bian, A.; Xiang, Z.Q.; Iparraguirre, A.; et al. Adenoviral Vectors Persist in Vivo and Maintain Activated CD8+ T Cells: Implications for Their Use as Vaccines. Blood 2007, 110, 1916–1923. [Google Scholar] [CrossRef] [PubMed]
- Hoehn, K.B.; Turner, J.S.; Miller, F.I.; Jiang, R.; Pybus, O.G.; Ellebedy, A.H.; Kleinstein, S.H. Human B Cell Lineages Associated with Germinal Centers Following Influenza Vaccination Are Measurably Evolving. Elife 2021, 10. [Google Scholar] [CrossRef] [PubMed]
- Turner, J.S.; Zhou, J.Q.; Han, J.; Schmitz, A.J.; Rizk, A.A.; Alsoussi, W.B.; Lei, T.; Amor, M.; McIntire, K.M.; Meade, P.; et al. Human Germinal Centres Engage Memory and Naive B Cells after Influenza Vaccination. Nature 2020, 586, 127–132. [Google Scholar] [CrossRef]
- Turner, J.S.; O’Halloran, J.A.; Kalaidina, E.; Kim, W.; Schmitz, A.J.; Zhou, J.Q.; Lei, T.; Thapa, M.; Chen, R.E.; Case, J.B.; et al. SARS-CoV-2 MRNA Vaccines Induce Persistent Human Germinal Centre Responses. Nature 2021, 596, 109–113. [Google Scholar] [CrossRef]
- Kim, W.; Zhou, J.Q.; Horvath, S.C.; Schmitz, A.J.; Sturtz, A.J.; Lei, T.; Liu, Z.; Kalaidina, E.; Thapa, M.; Alsoussi, W.B.; et al. Germinal Centre-Driven Maturation of B Cell Response to MRNA Vaccination. Nature 2022, 604, 141–145. [Google Scholar] [CrossRef]
- Laidlaw, B.J.; Ellebedy, A.H. The Germinal Centre B Cell Response to SARS-CoV-2. Nat Rev Immunol 2022, 22, 7–18. [Google Scholar] [CrossRef]
- Chi, X.; Yan, R.; Zhang, J.; Zhang, G.; Zhang, Y.; Hao, M.; Zhang, Z.; Fan, P.; Dong, Y.; Yang, Y.; et al. A Neutralizing Human Antibody Binds to the N-Terminal Domain of the Spike Protein of SARS-CoV-2. Science (1979) 2020, 369, 650–655. [Google Scholar] [CrossRef]
- Finkelstein, M.T.; Mermelstein, A.G.; Miller, E.P.; Seth, P.C.; Stancofski, E.S.D.; Fera, D. Structural Analysis of Neutralizing Epitopes of the Sars-Cov-2 Spike to Guide Therapy and Vaccine Design Strategies. Viruses 2021, 13. [Google Scholar] [CrossRef]
Figure 1.
Sputnik V clinical trial group. The stratification of the sample set based on the reactivity results for the SARS-CoV-2 N (exposure) is presented. Reactivity was quantified in a total of 133 samples (vaccinated and placebo) at 42 dpv. Then, 21 samples of vaccinated and N negative, were selected to compare their reactivity at 42 and 18 to 180 dpv. From them, 20 sera, were selected for neutralization assays and comparison between 42 and 180 dpv. SNT: Surrogate neutralization.
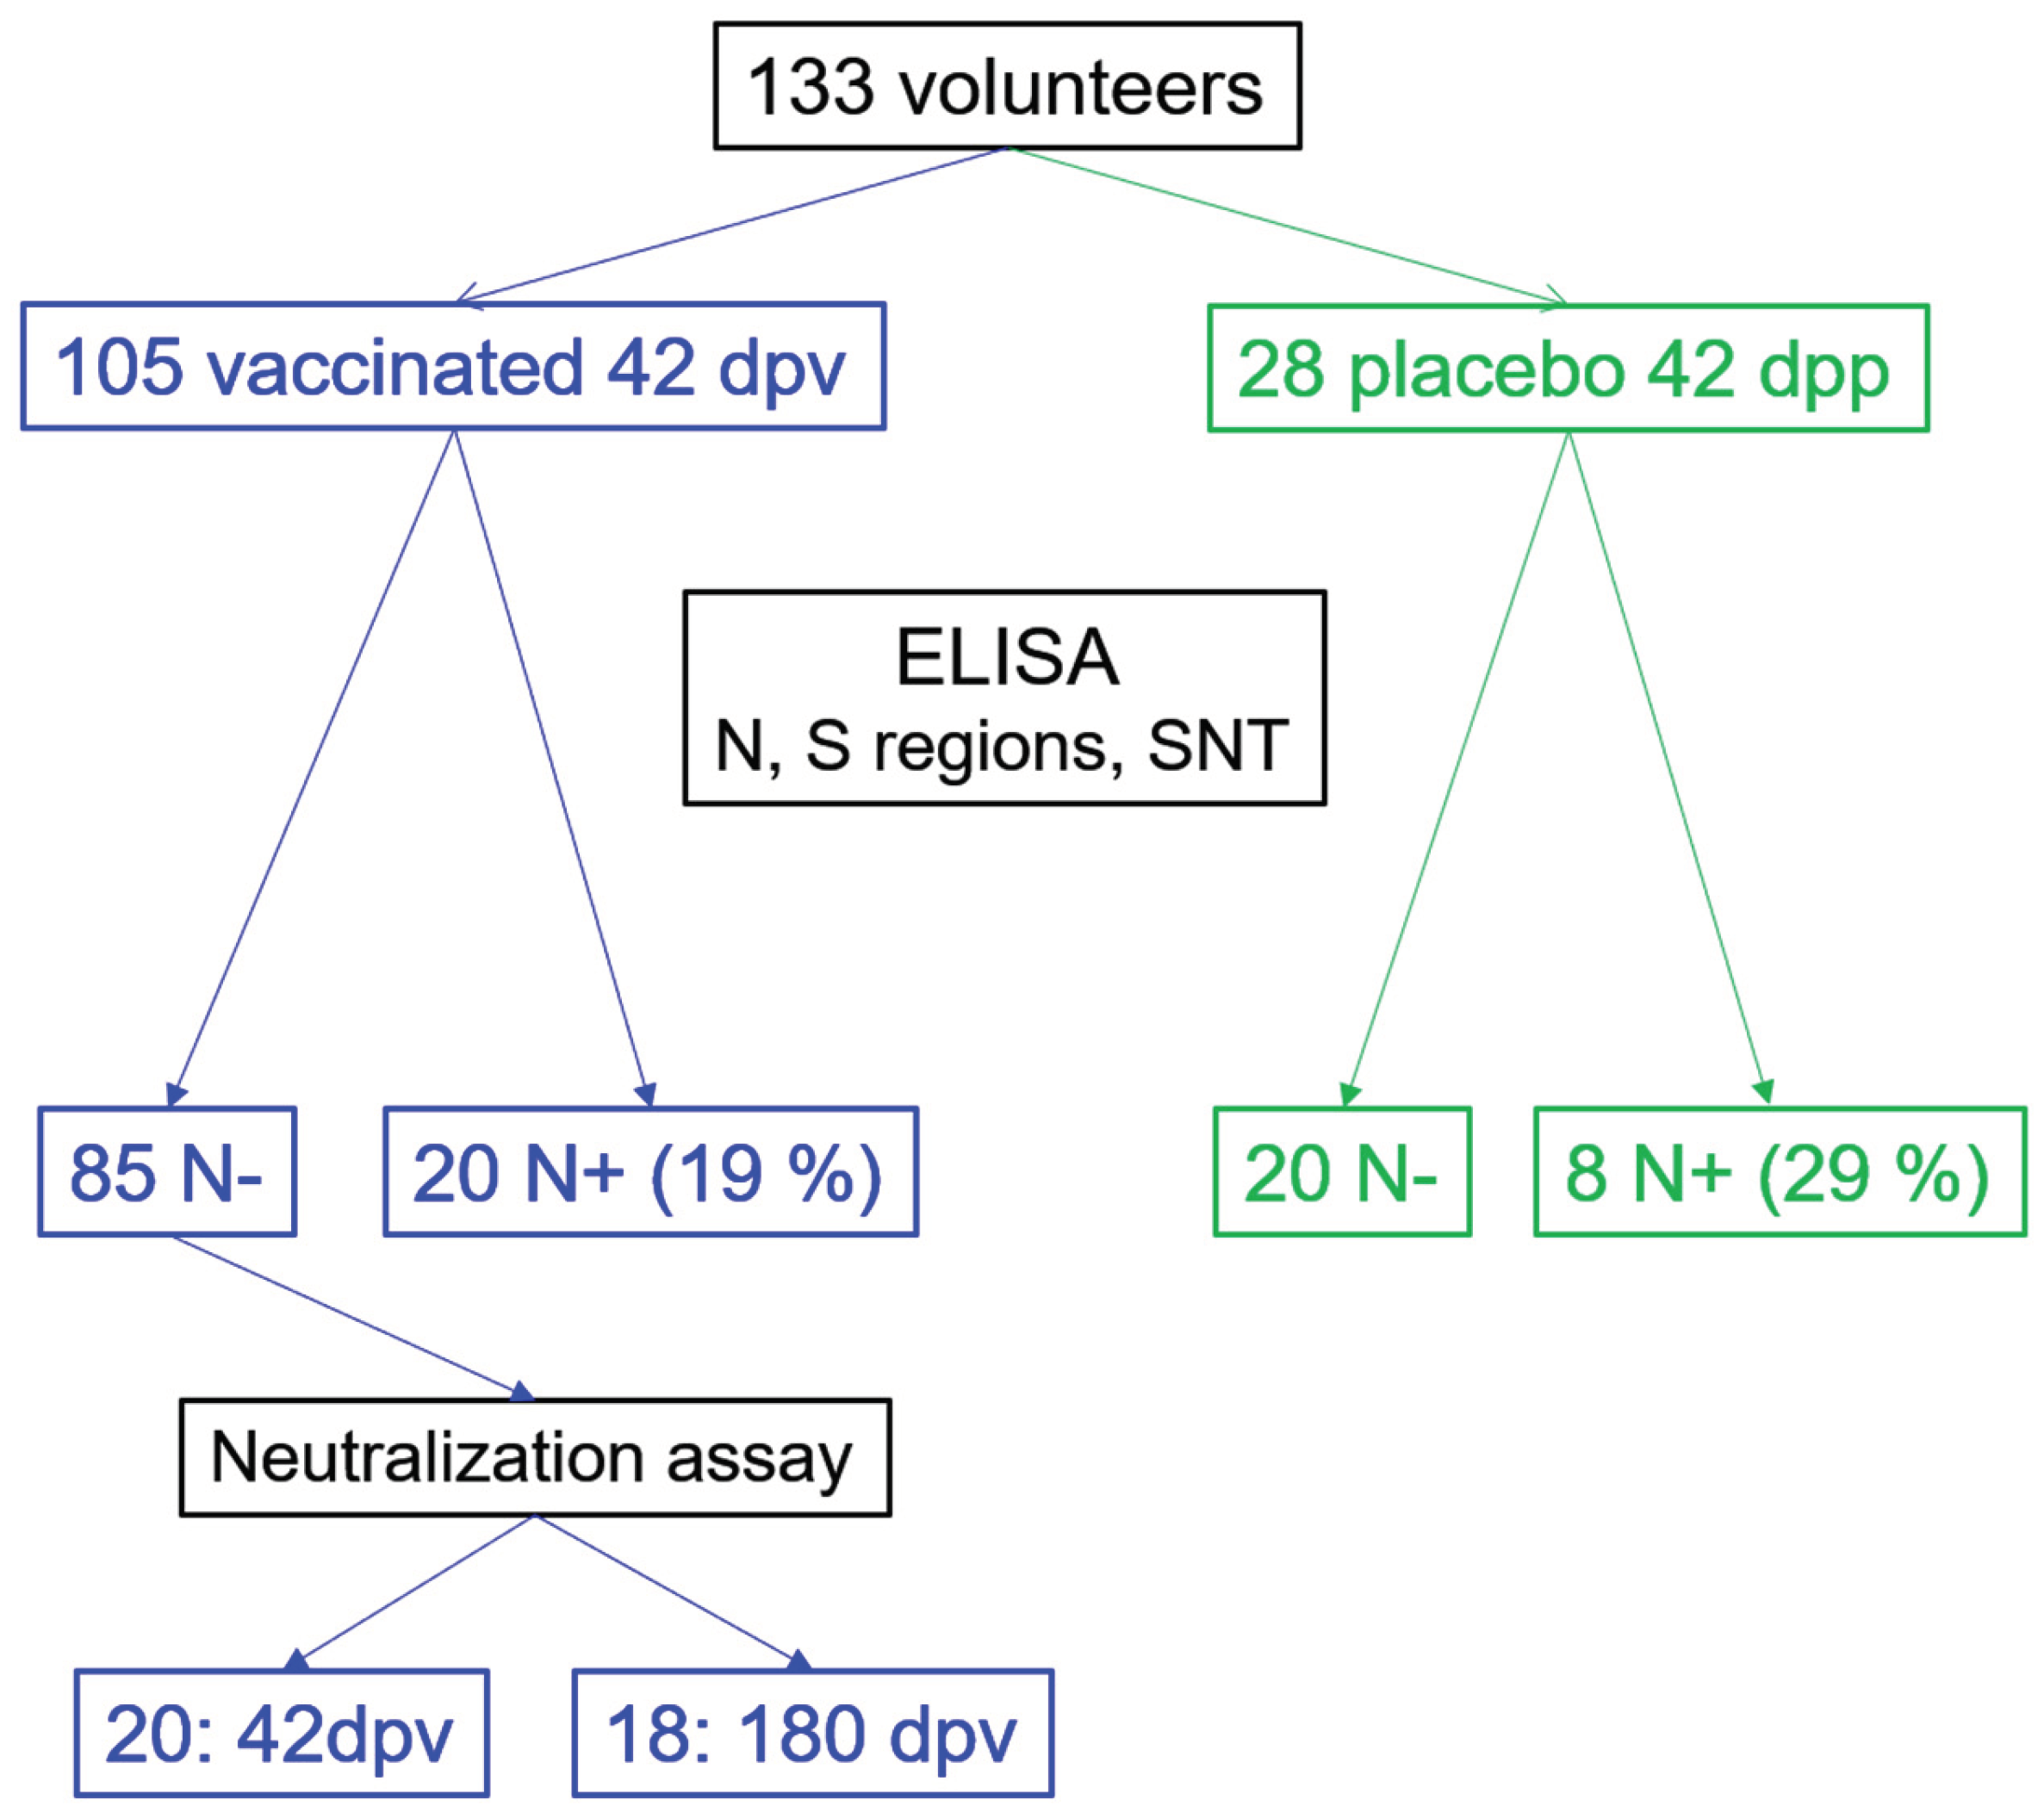
Figure 2.
BAU reactivity to S. The different groups are shown: vaccinated, exposed vaccinated, placebos, and exposed placebos (classification made according to the reactivity to N), in addition to hybrids and pre-pandemics. The percentage values represent individuals whose BAU value exceeded the cut-off point (CP). Kruskal Wallis test (p<0.0001) with Dunn’s correction post-hoc analysis was used for groups comparisons. Dash lines indicate cut-off value (119 BAU/mL).
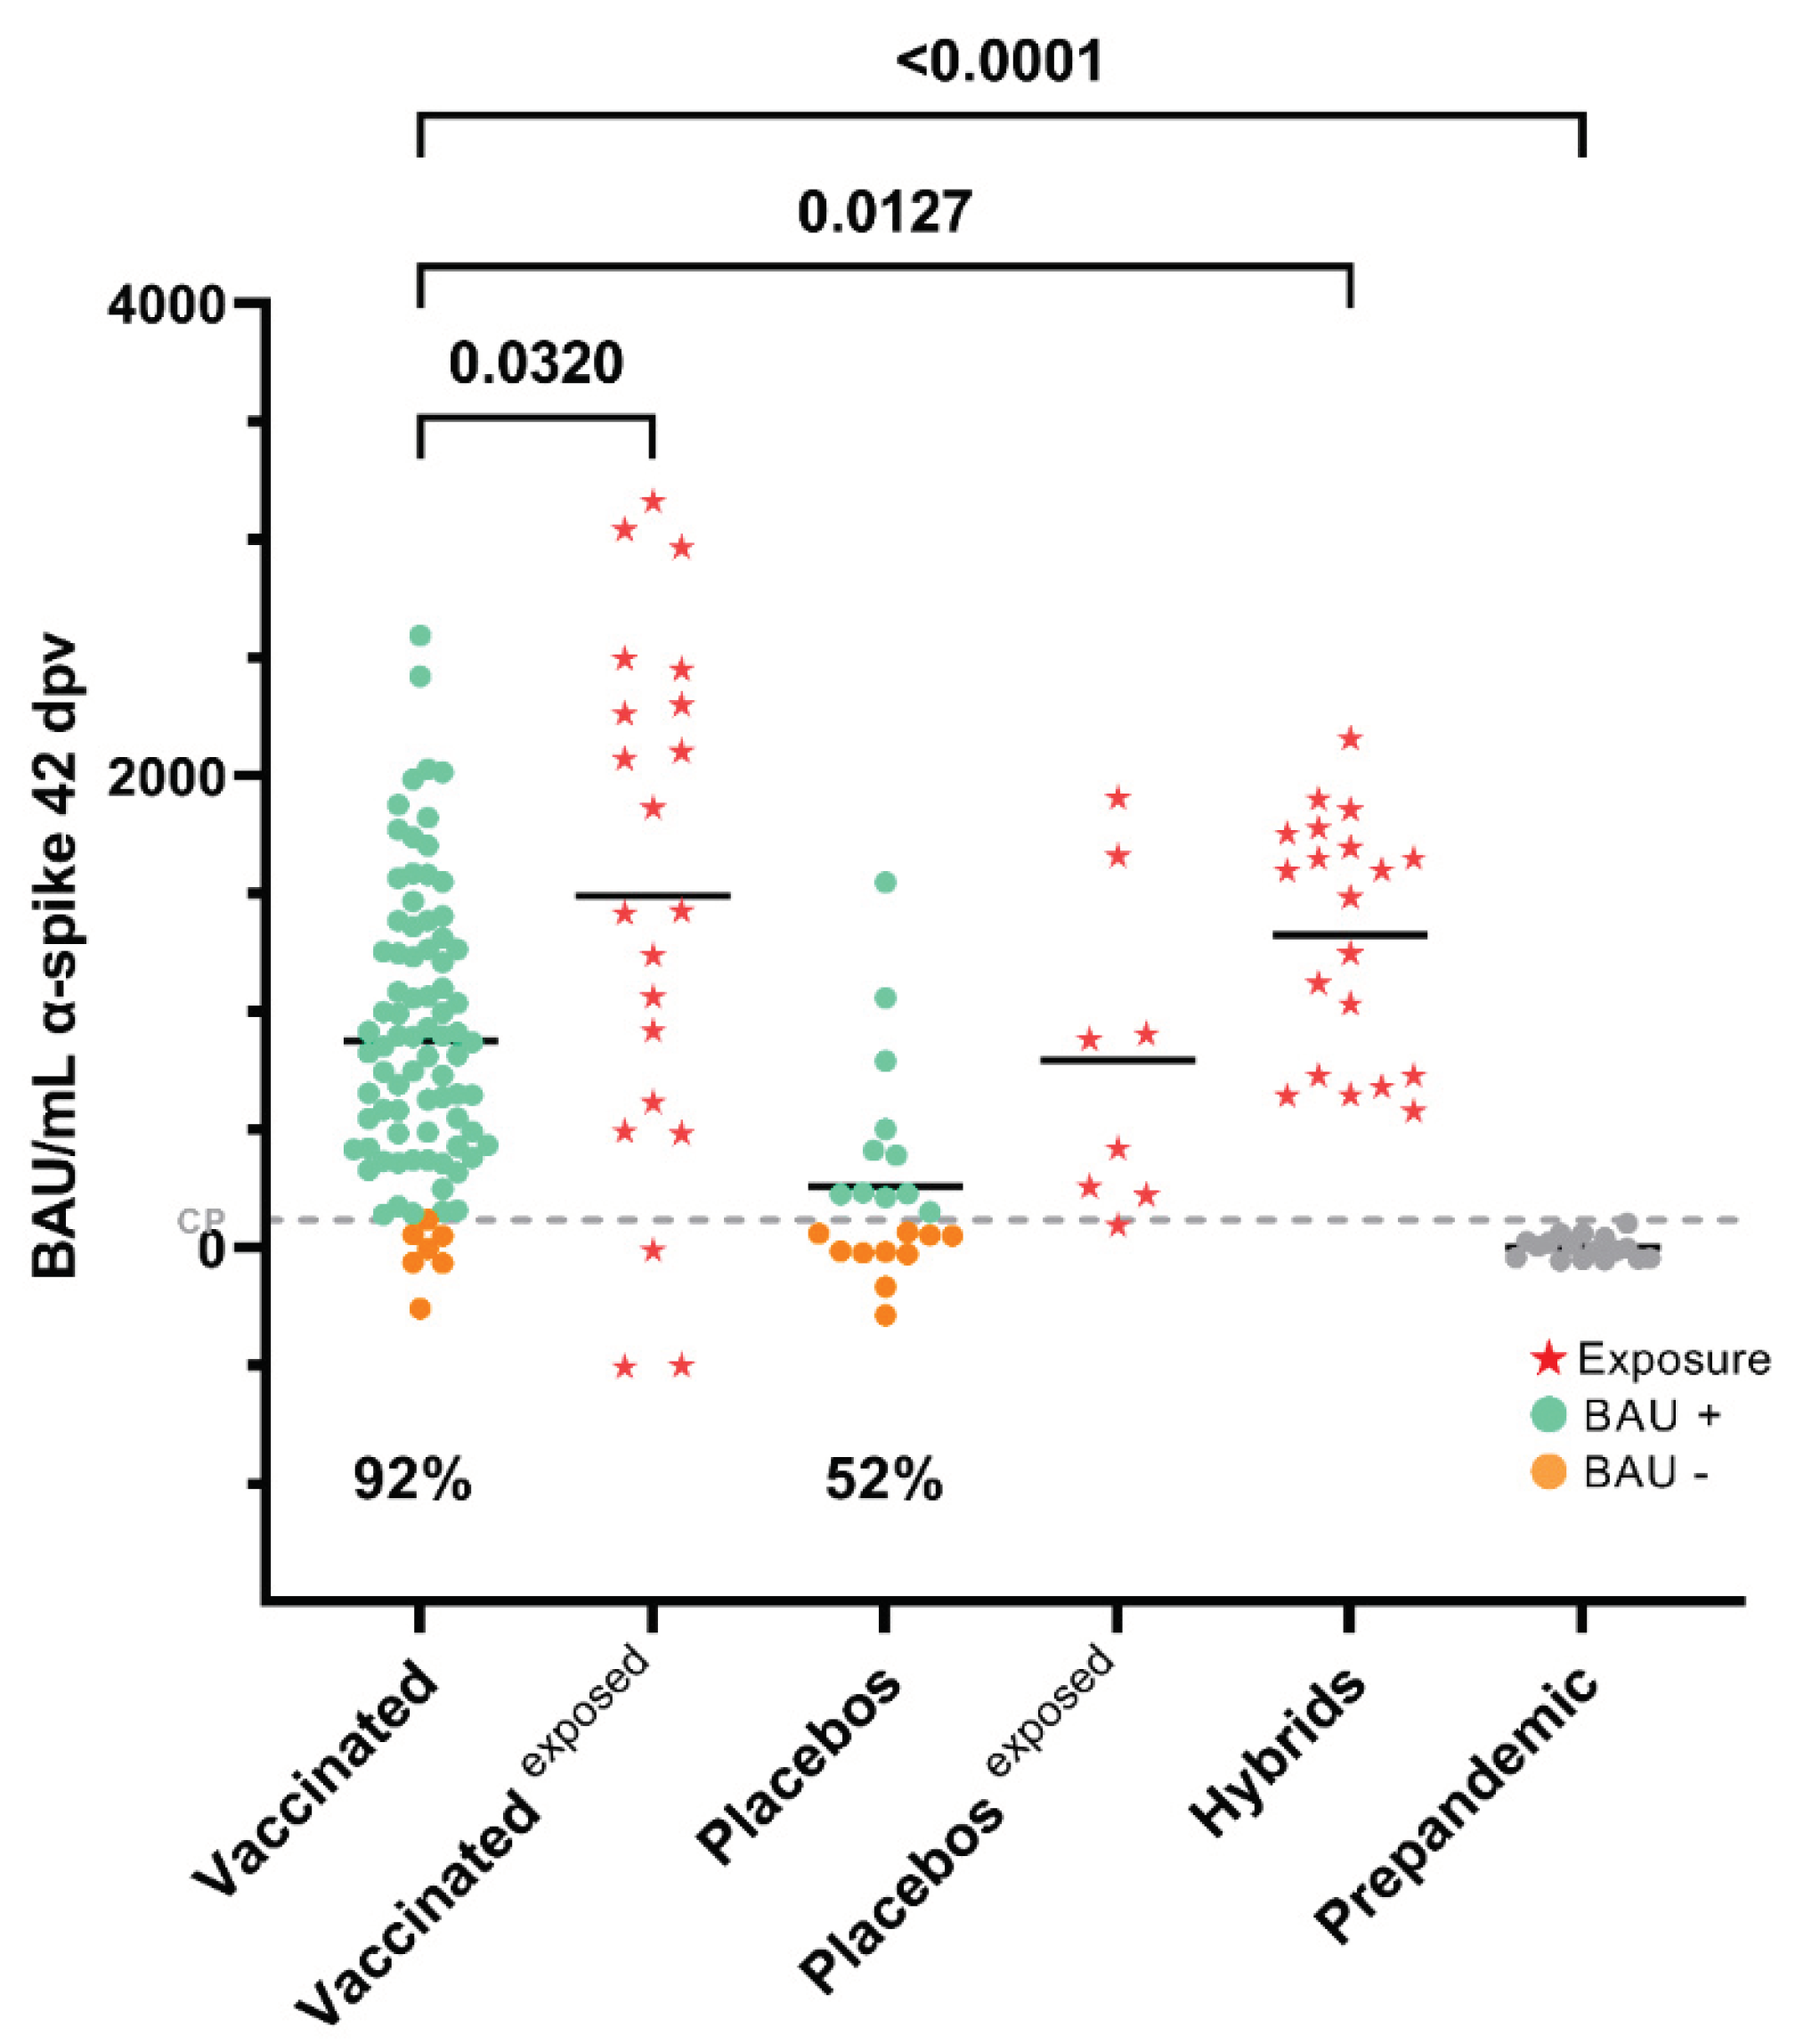
Figure 3.
Reactivity towards different regions of S. (a) Multiple comparisons of the reactivity of sera from vaccinated individuals at 42 dpv by the Kruskal Wallis test (p<0.0001) with Dunn’s correction post-hoc analysis. The Y-axis represents percent of sample-to-positive ratio value. For S1, only 61 samples are plotted. Percent of responders are show. (b) Mann-Whitney test of sera from individuals vaccinated with Sputnik-V and exposed. The reactivity towards the different regions of S is shown compared to individuals who were vaccinated and had apparently exposure to the virus during the clinical trial (★), the increased S/P value between the vaccinated and the exposed vaccinated is shown. (c) Reactivity of pre-pandemic sera towards the different regions of S were analyzed by Kruskal Wallis test (p<0.0001) with Dunn’s correction post-hoc. (d) Paired Wilcoxon test Reactivity towards the different regions of the Spike (ancestral) at 42 and 180 dpv in the cohort that completed the clinical trial without N reactivity (2 samples excluded). ns: not significant.
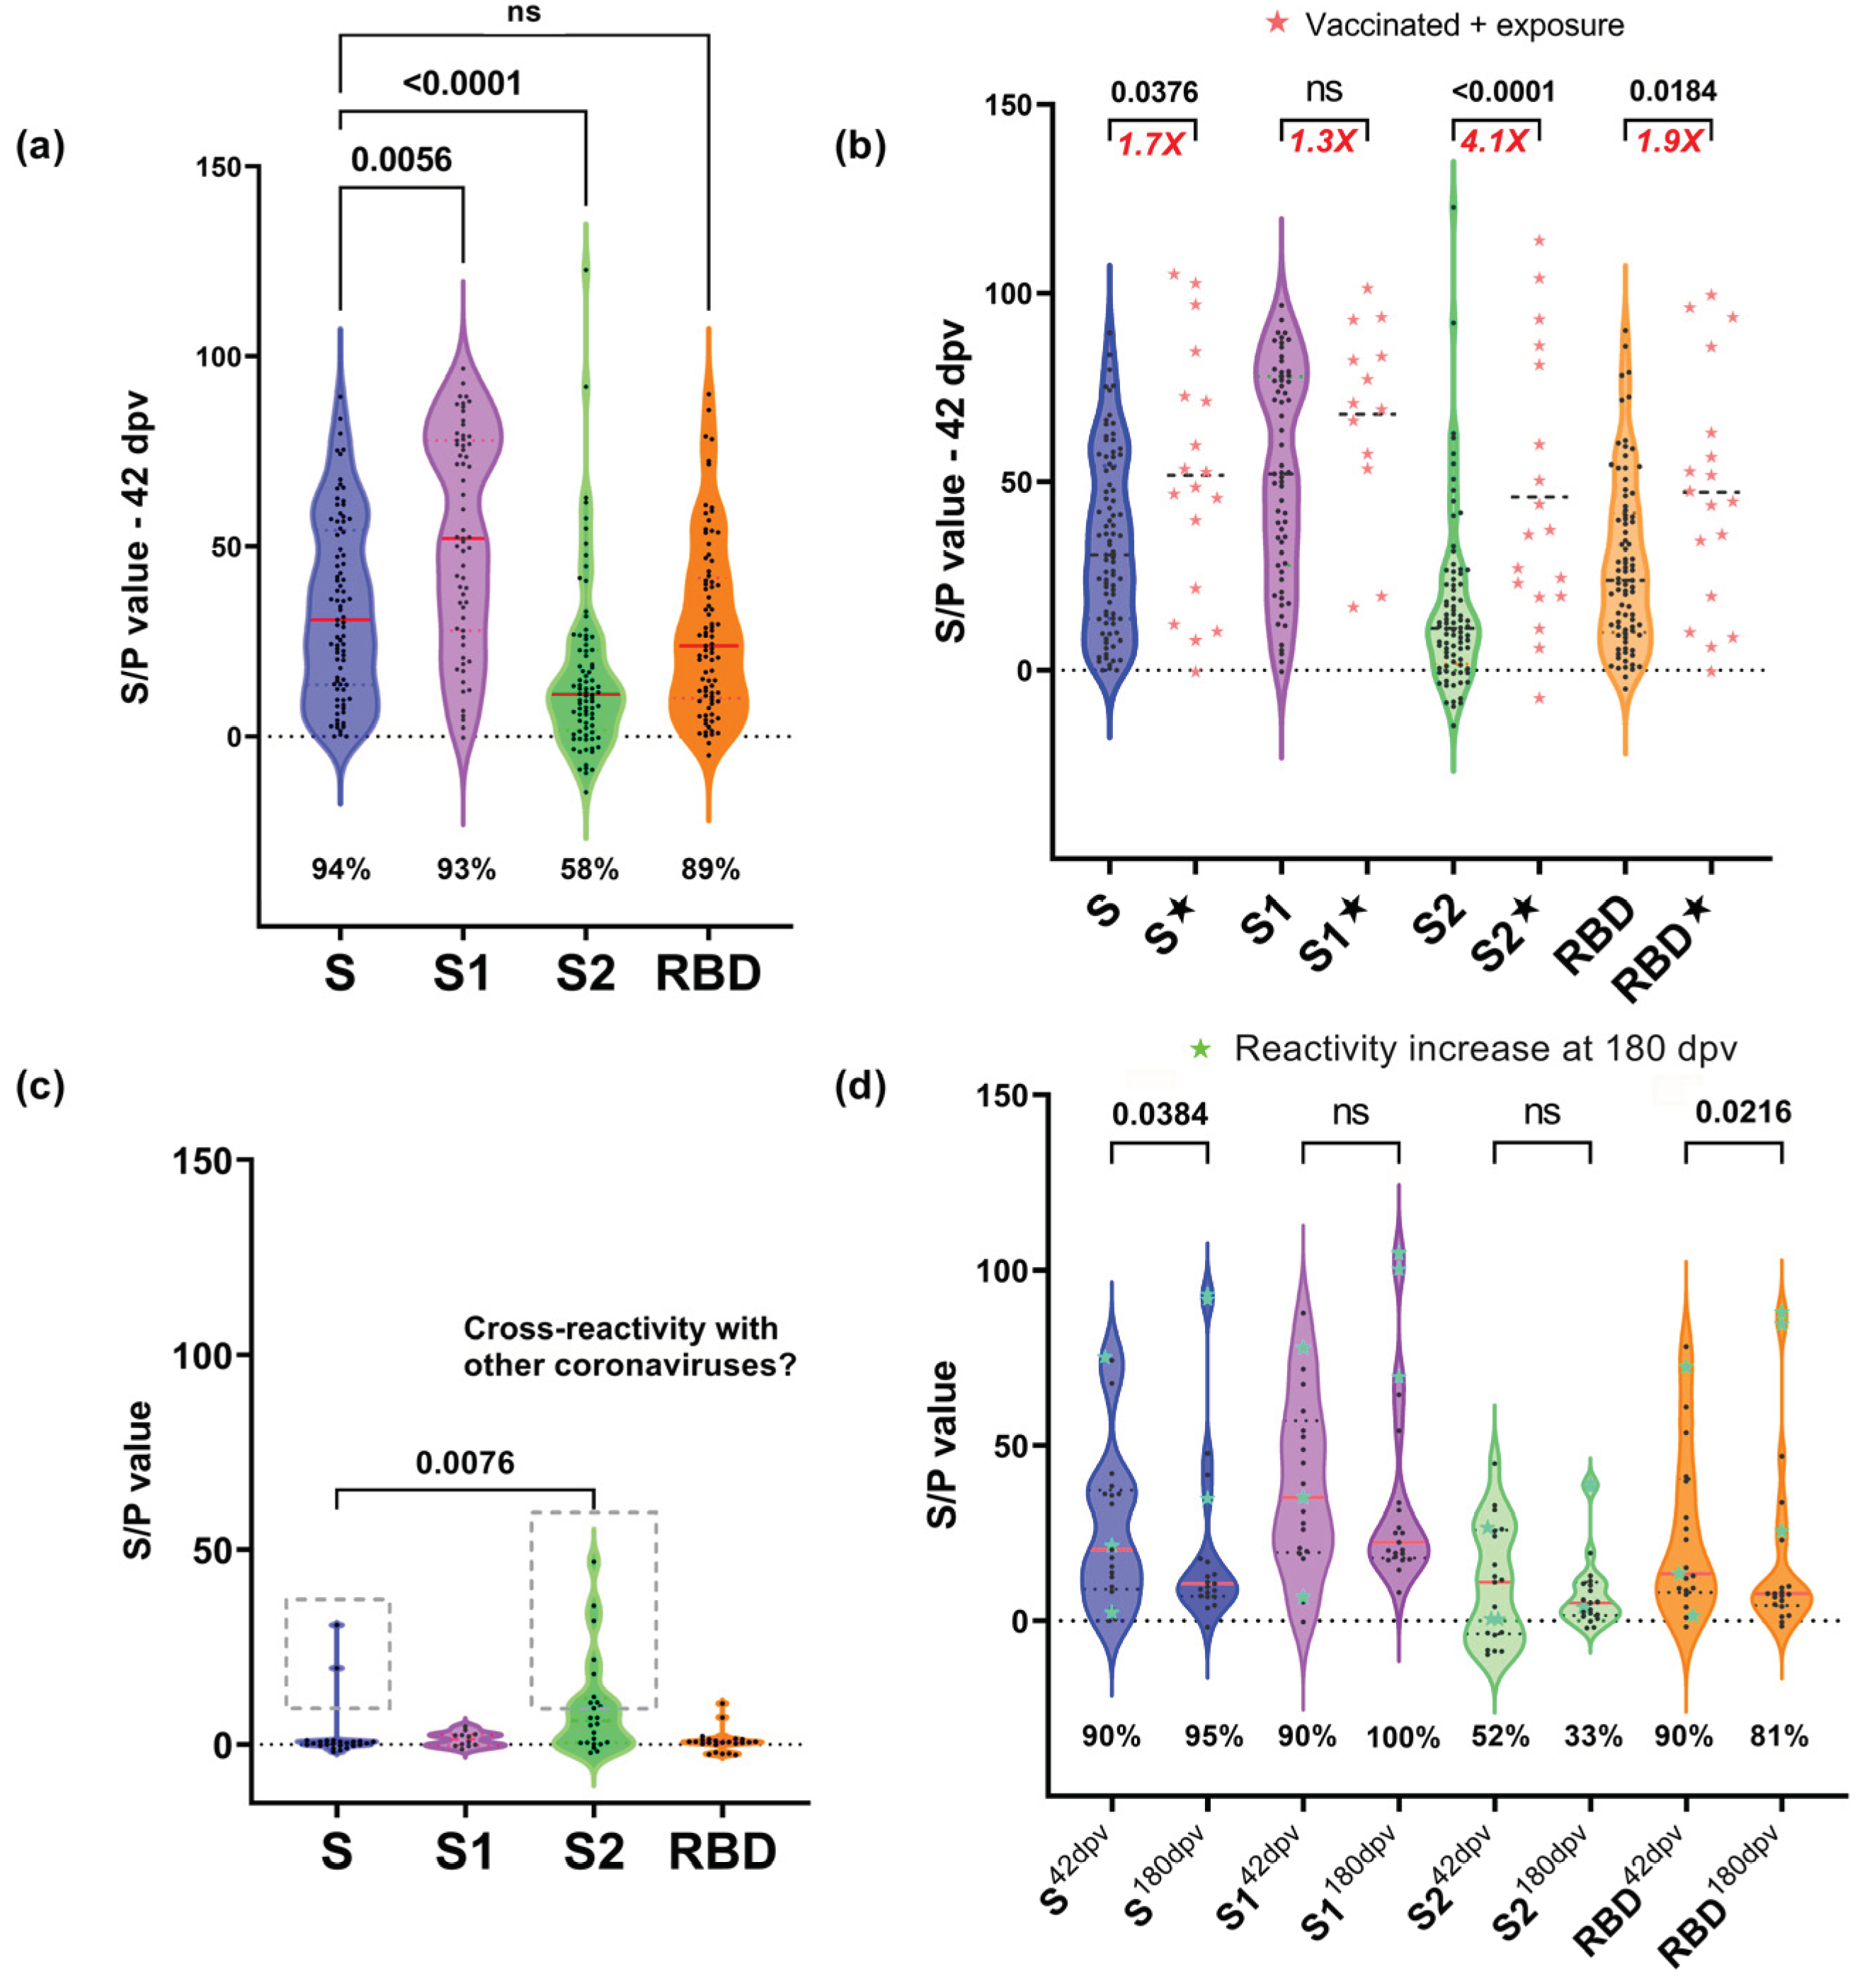
Figure 4.
SNT (NAb α-RBD) at 42- and 180-days post-vaccination. NAb titers (ng/mL) at 42 and 180 dpv. Wilcoxon was performed only in paired sera with 42 and 180 dpv sample. ★ Red: two vaccinated individuals with evidence of exposure (excluded from the statistics). ★ Green: sera for which the SNT levels increased at 180 days. Kruskal Wallis test (p<0.0001) with Dunn’s correction post-hoc was performed for the other comparisons.
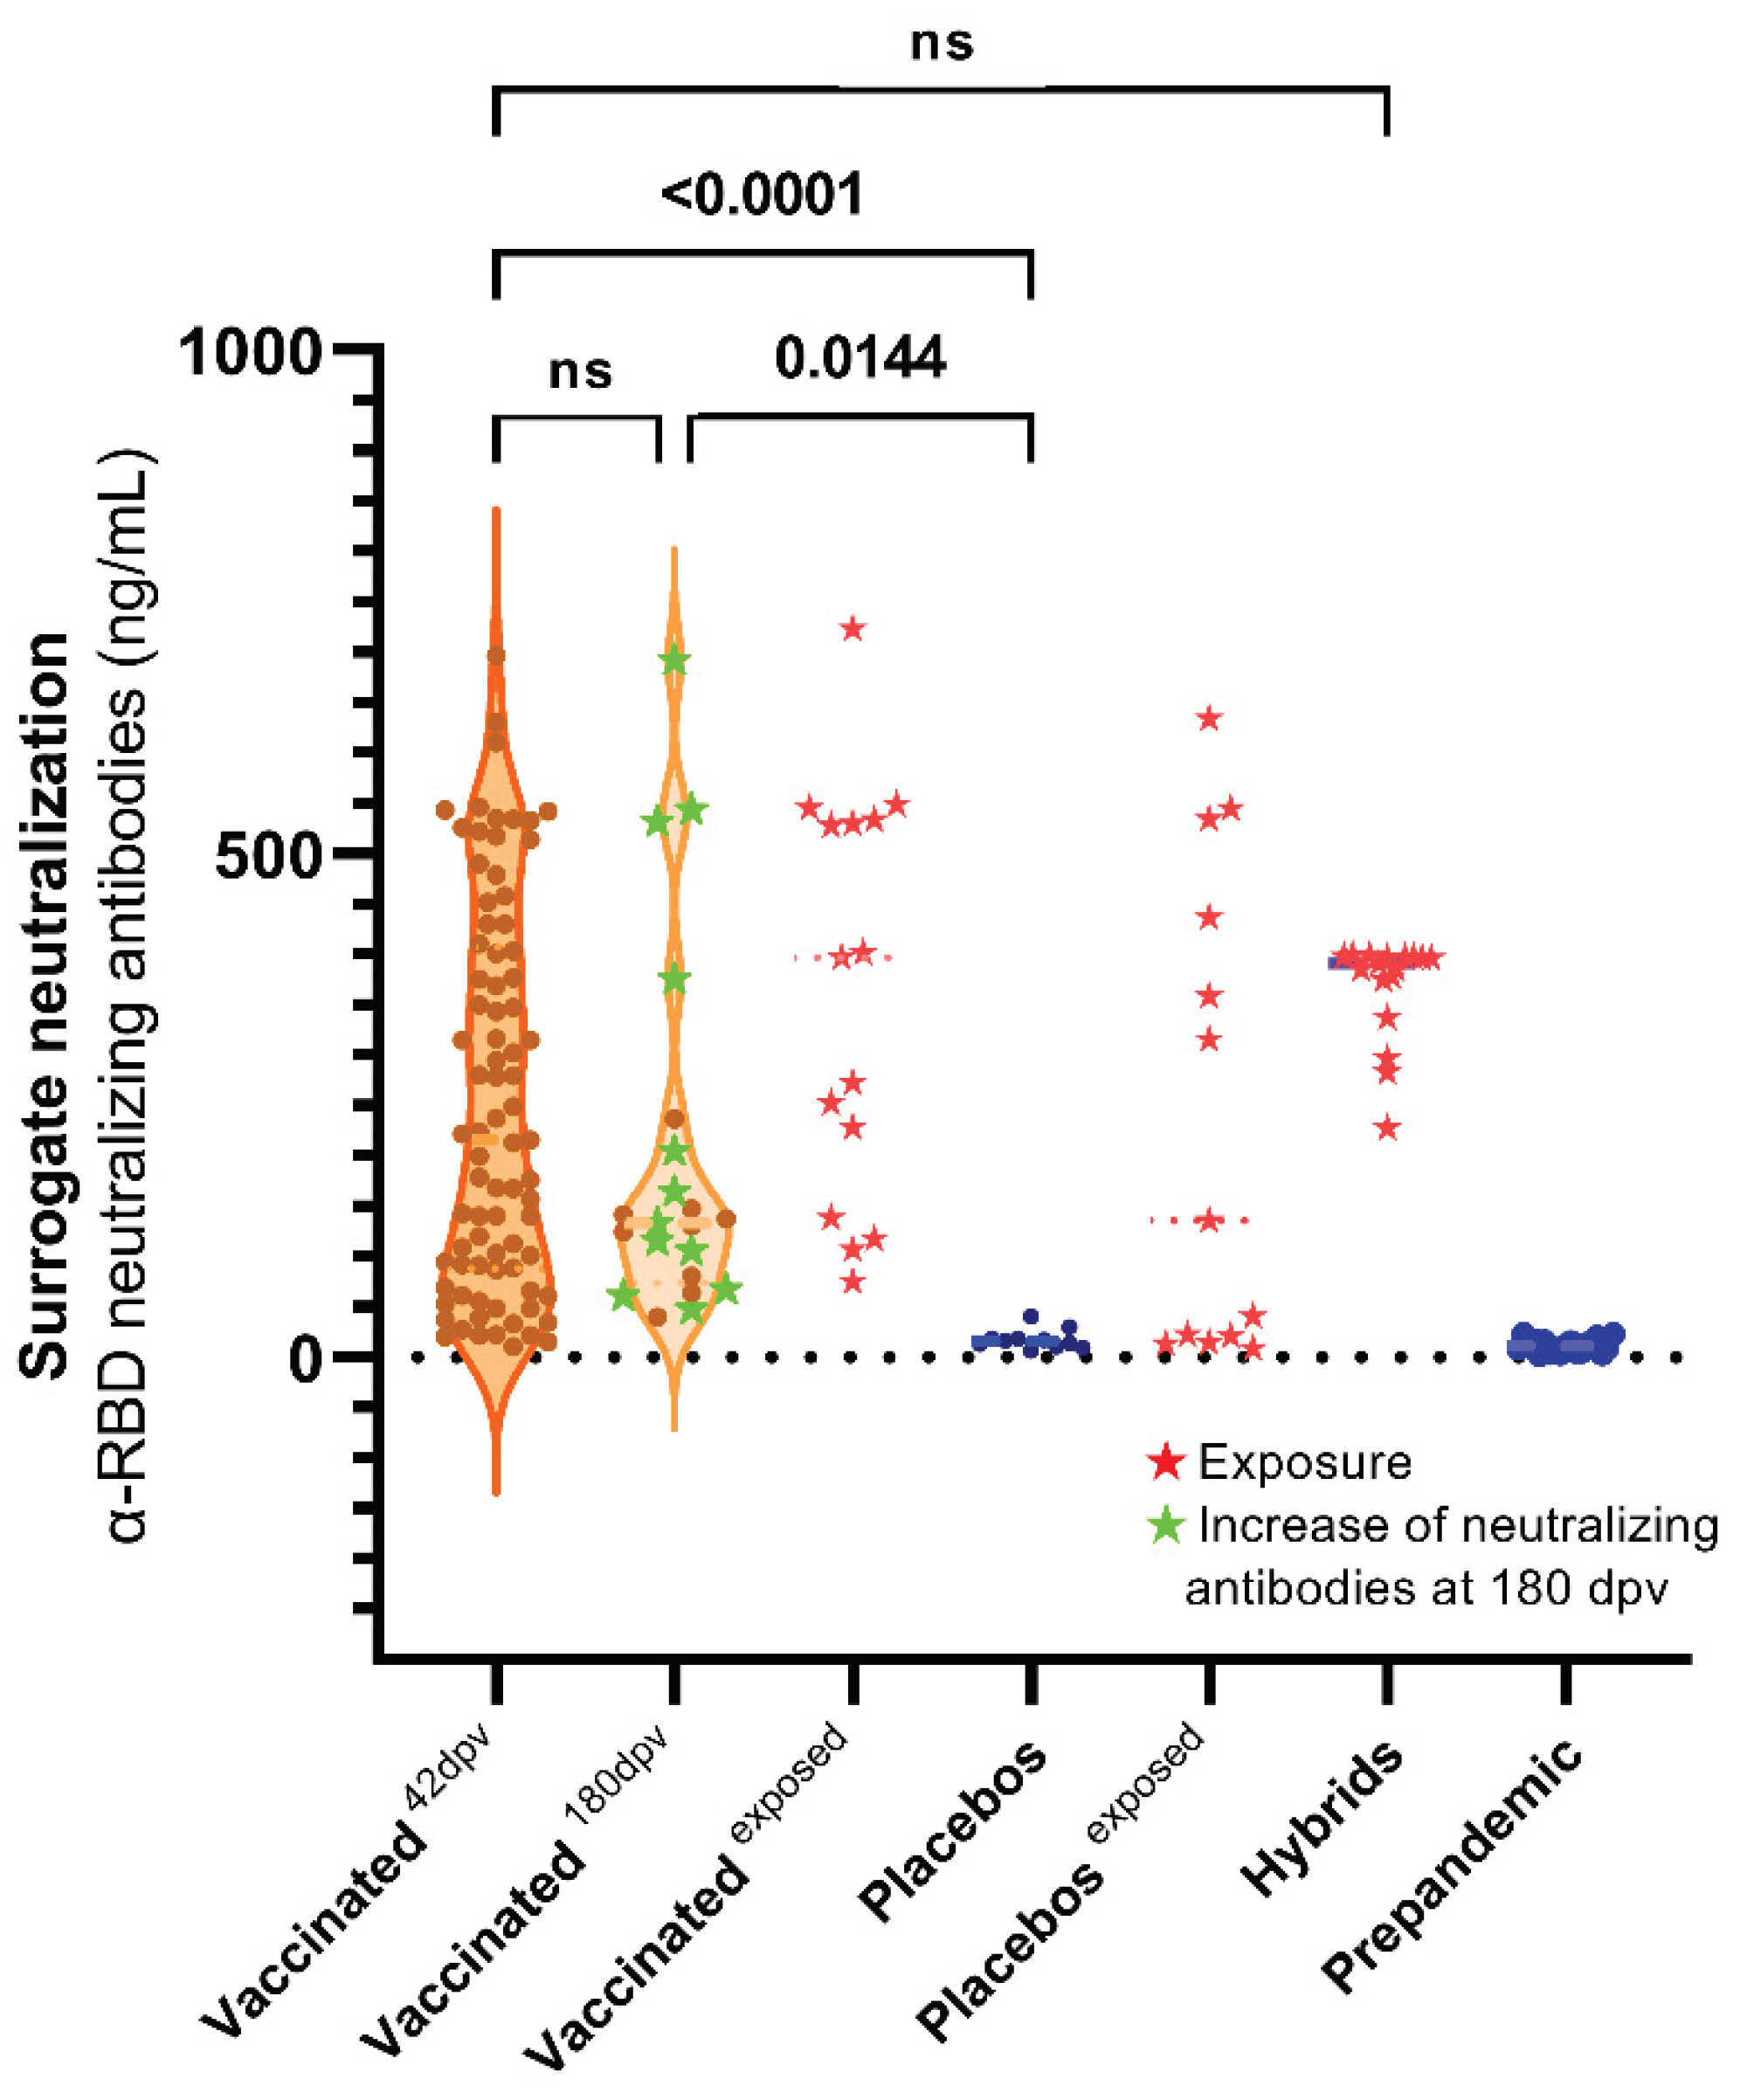
Figure 5.
Correlation matrix between reactivity, surrogate neutralization and ages at 42 dpv. Association between variables is represented with a heatmap where blue and red are used to represent positive and negative correlations respectively. For S1, only 61 samples of S1 were used in the correlations. S1, S2 and RBD doesn’t show significance correlation between age, the rest of correlation show p values under 0.05.
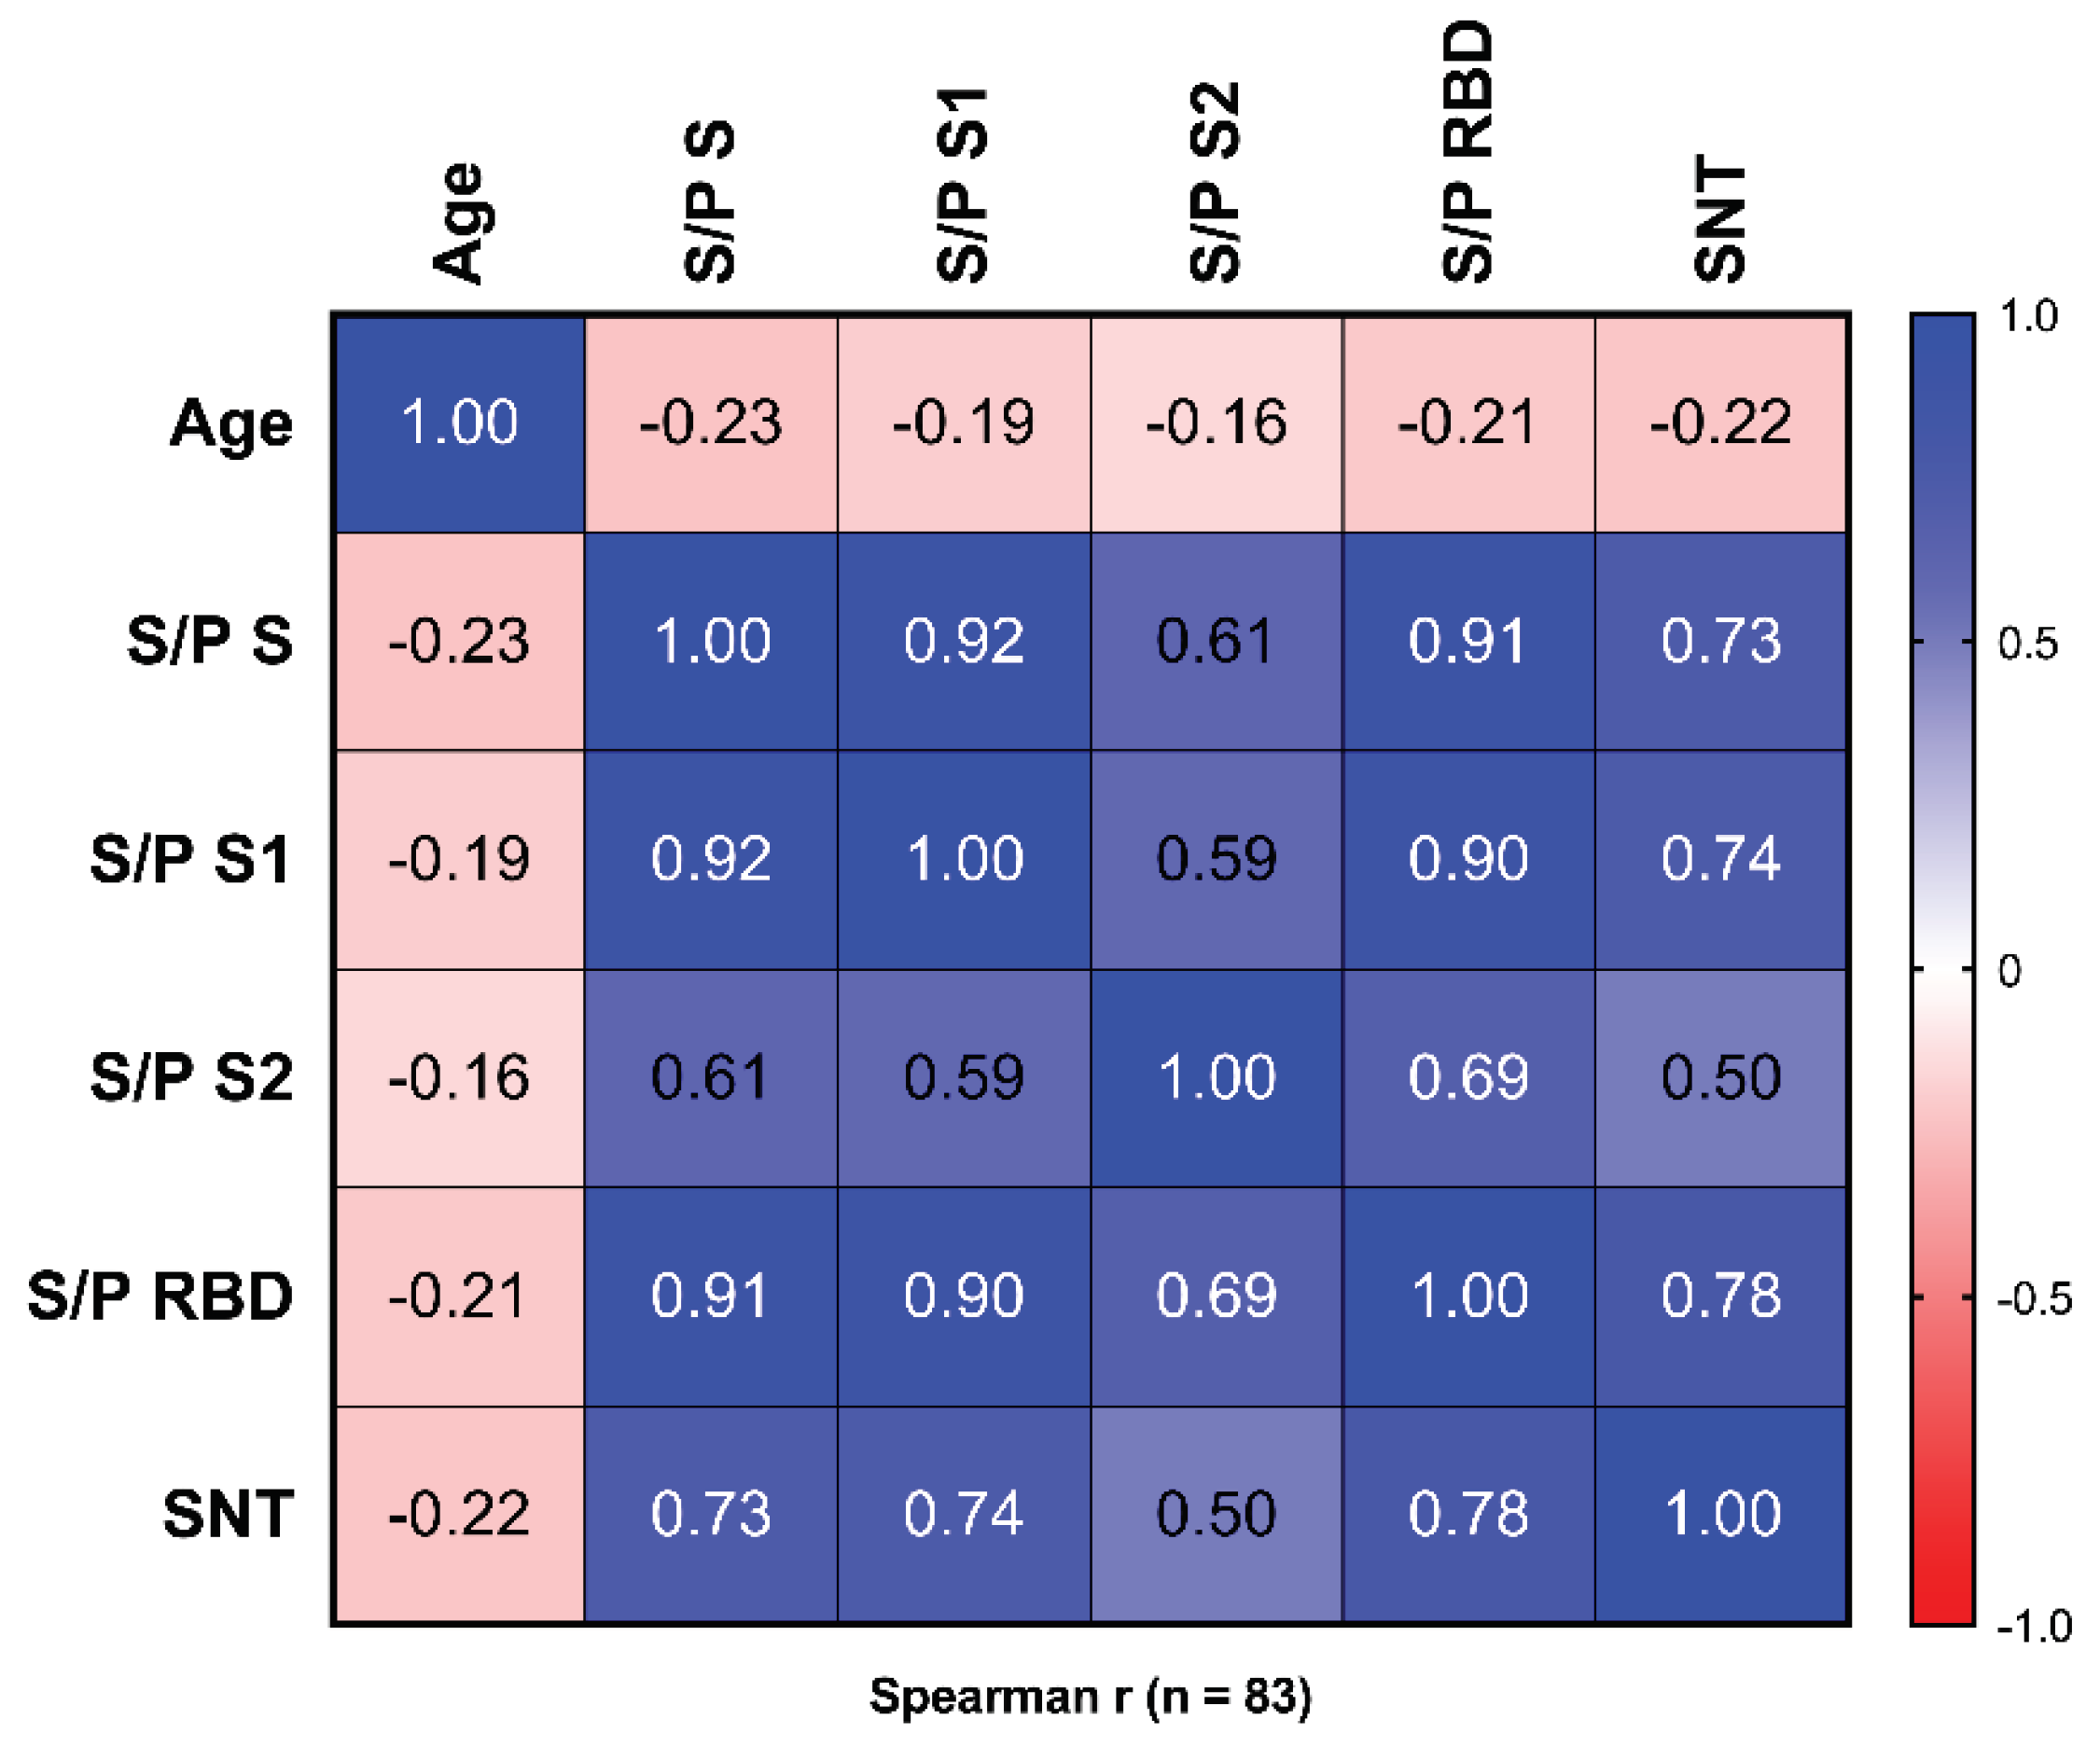
Figure 6.
PRNT50 values of the sera from vaccinated individuals at 42 and 180 dpv. The Y-axis corresponds to the PRNT50 of each serum. ★ Red: two vaccinated individuals with evidence of exposure (excluded from the statistics). ★ Green: sera for which the PRNT50 titer increased at 180 days. Kruskal Wallis test (p<0.0001).
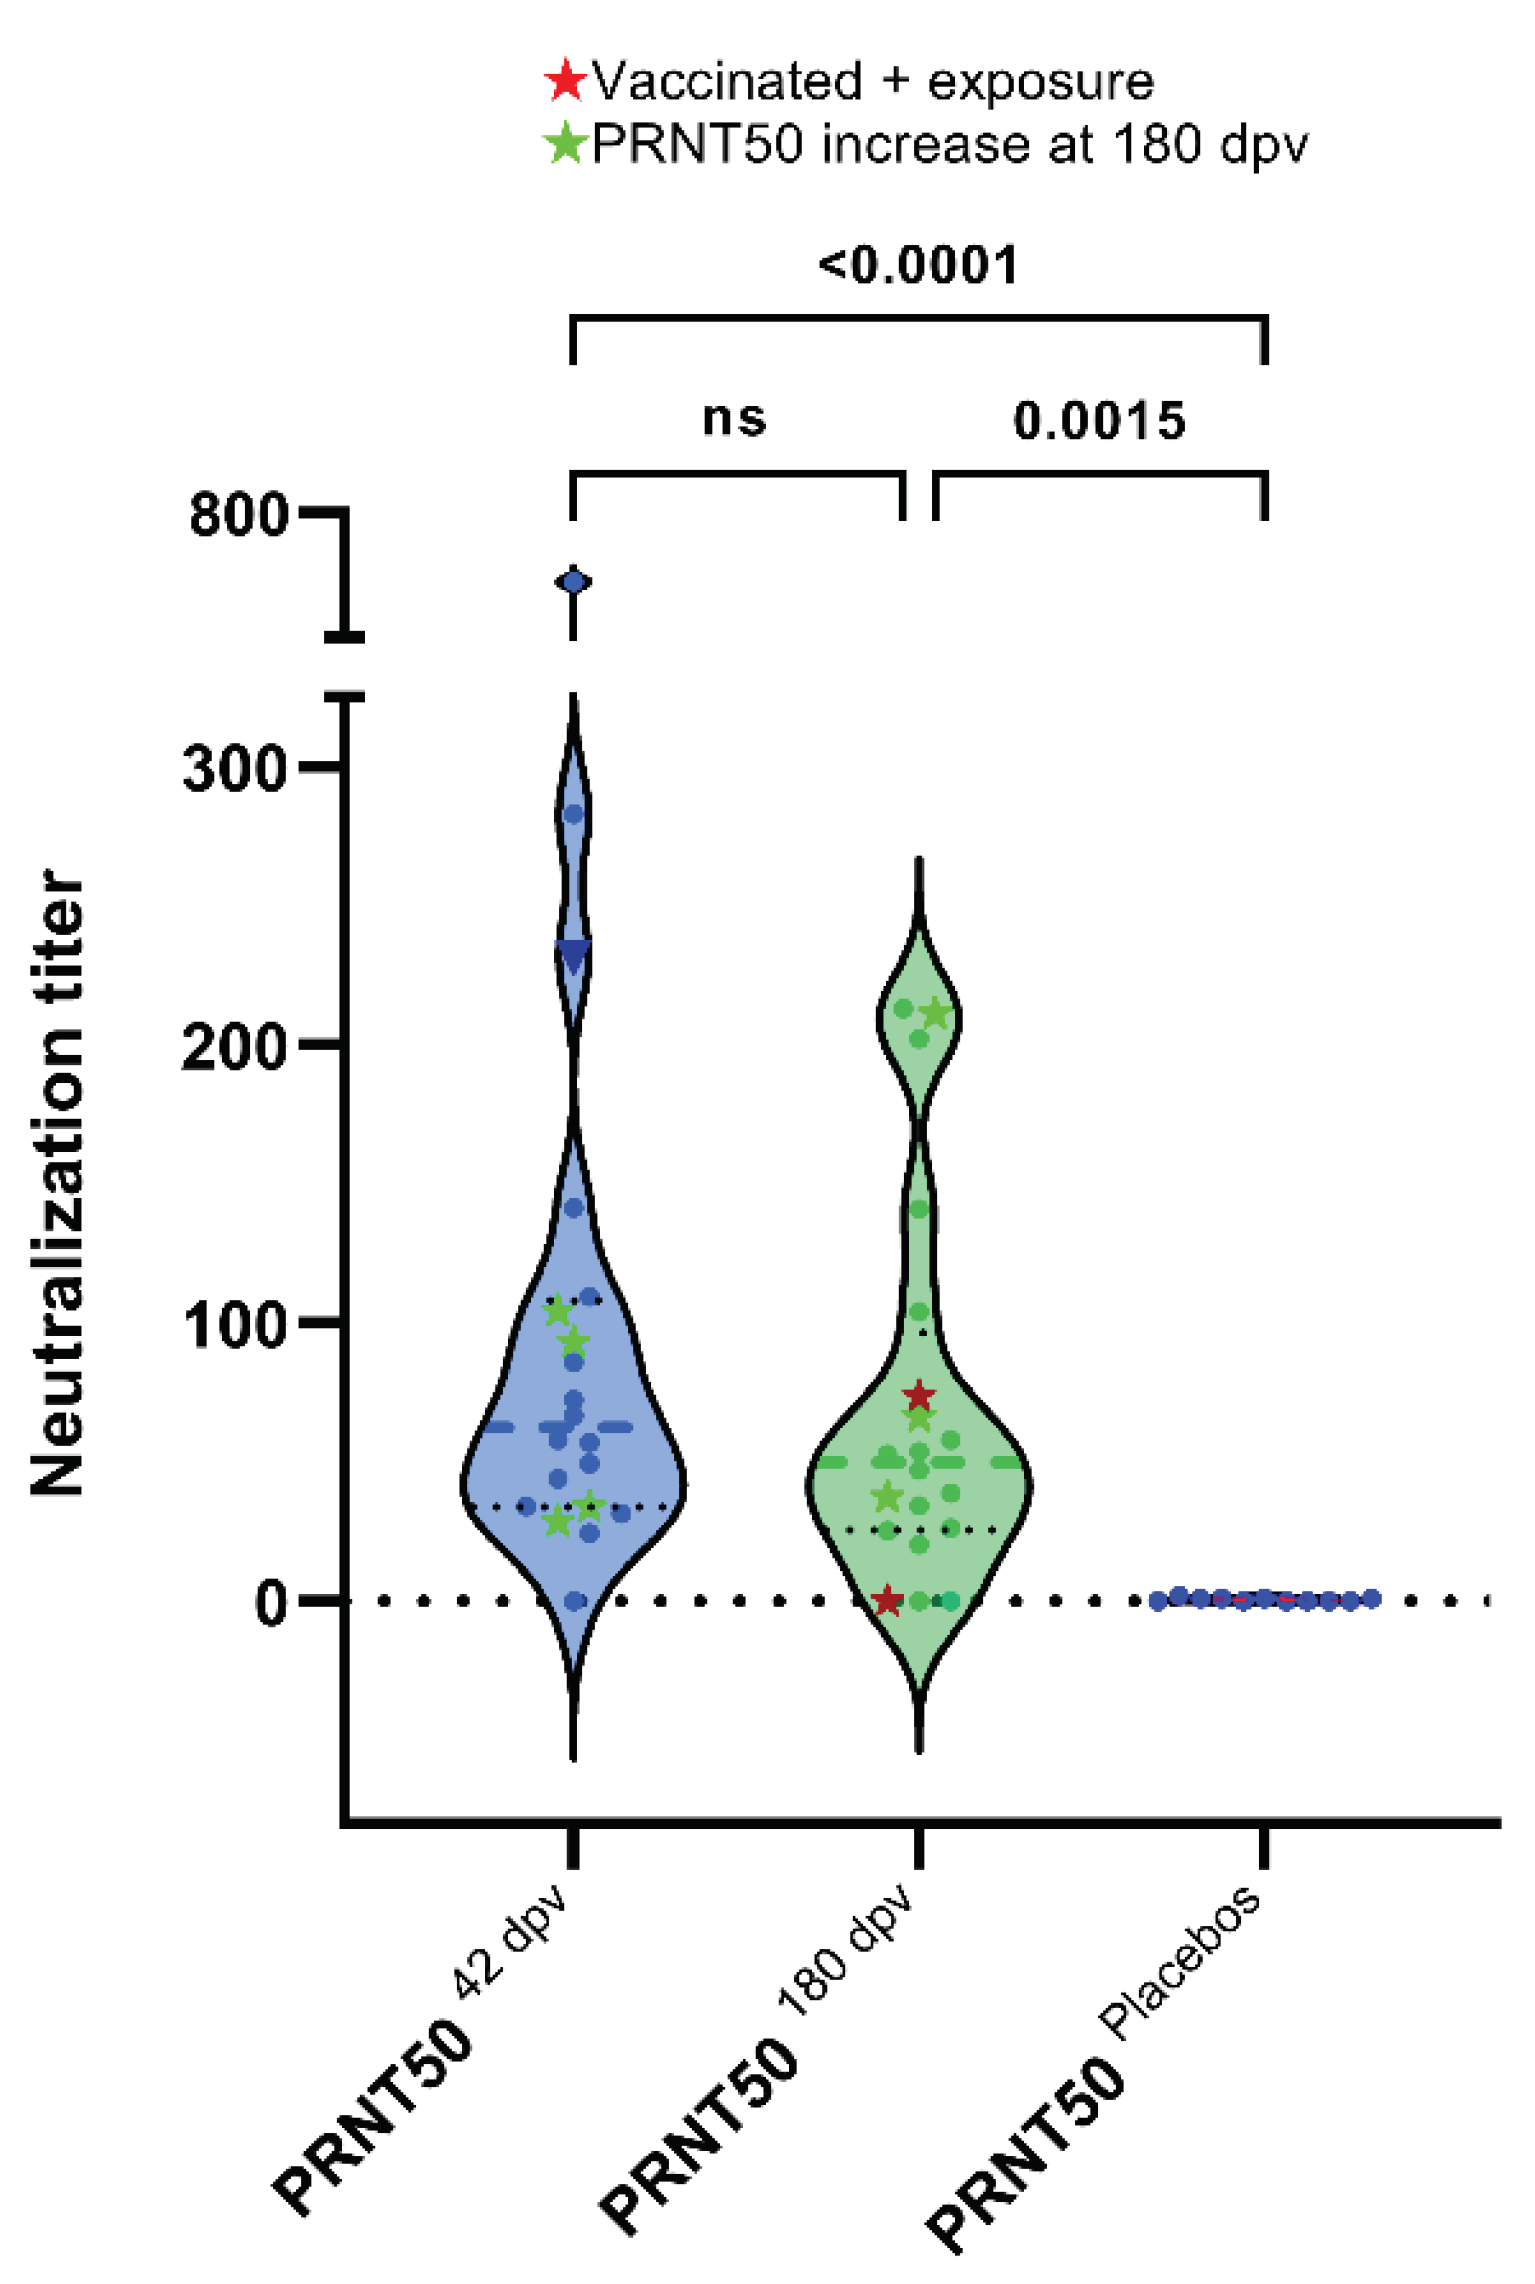
Figure 7.
Correlations between PRNT50 titers, SNT (NAb α-RBD) and ELISA reactivity to S regions in individuals vaccinated with Sputnik-V (42 dpv). r: spearman correlation coefficient and p value (p<0.05); 95% CI; linear regression model shown in blue line.
Figure 7.
Correlations between PRNT50 titers, SNT (NAb α-RBD) and ELISA reactivity to S regions in individuals vaccinated with Sputnik-V (42 dpv). r: spearman correlation coefficient and p value (p<0.05); 95% CI; linear regression model shown in blue line.
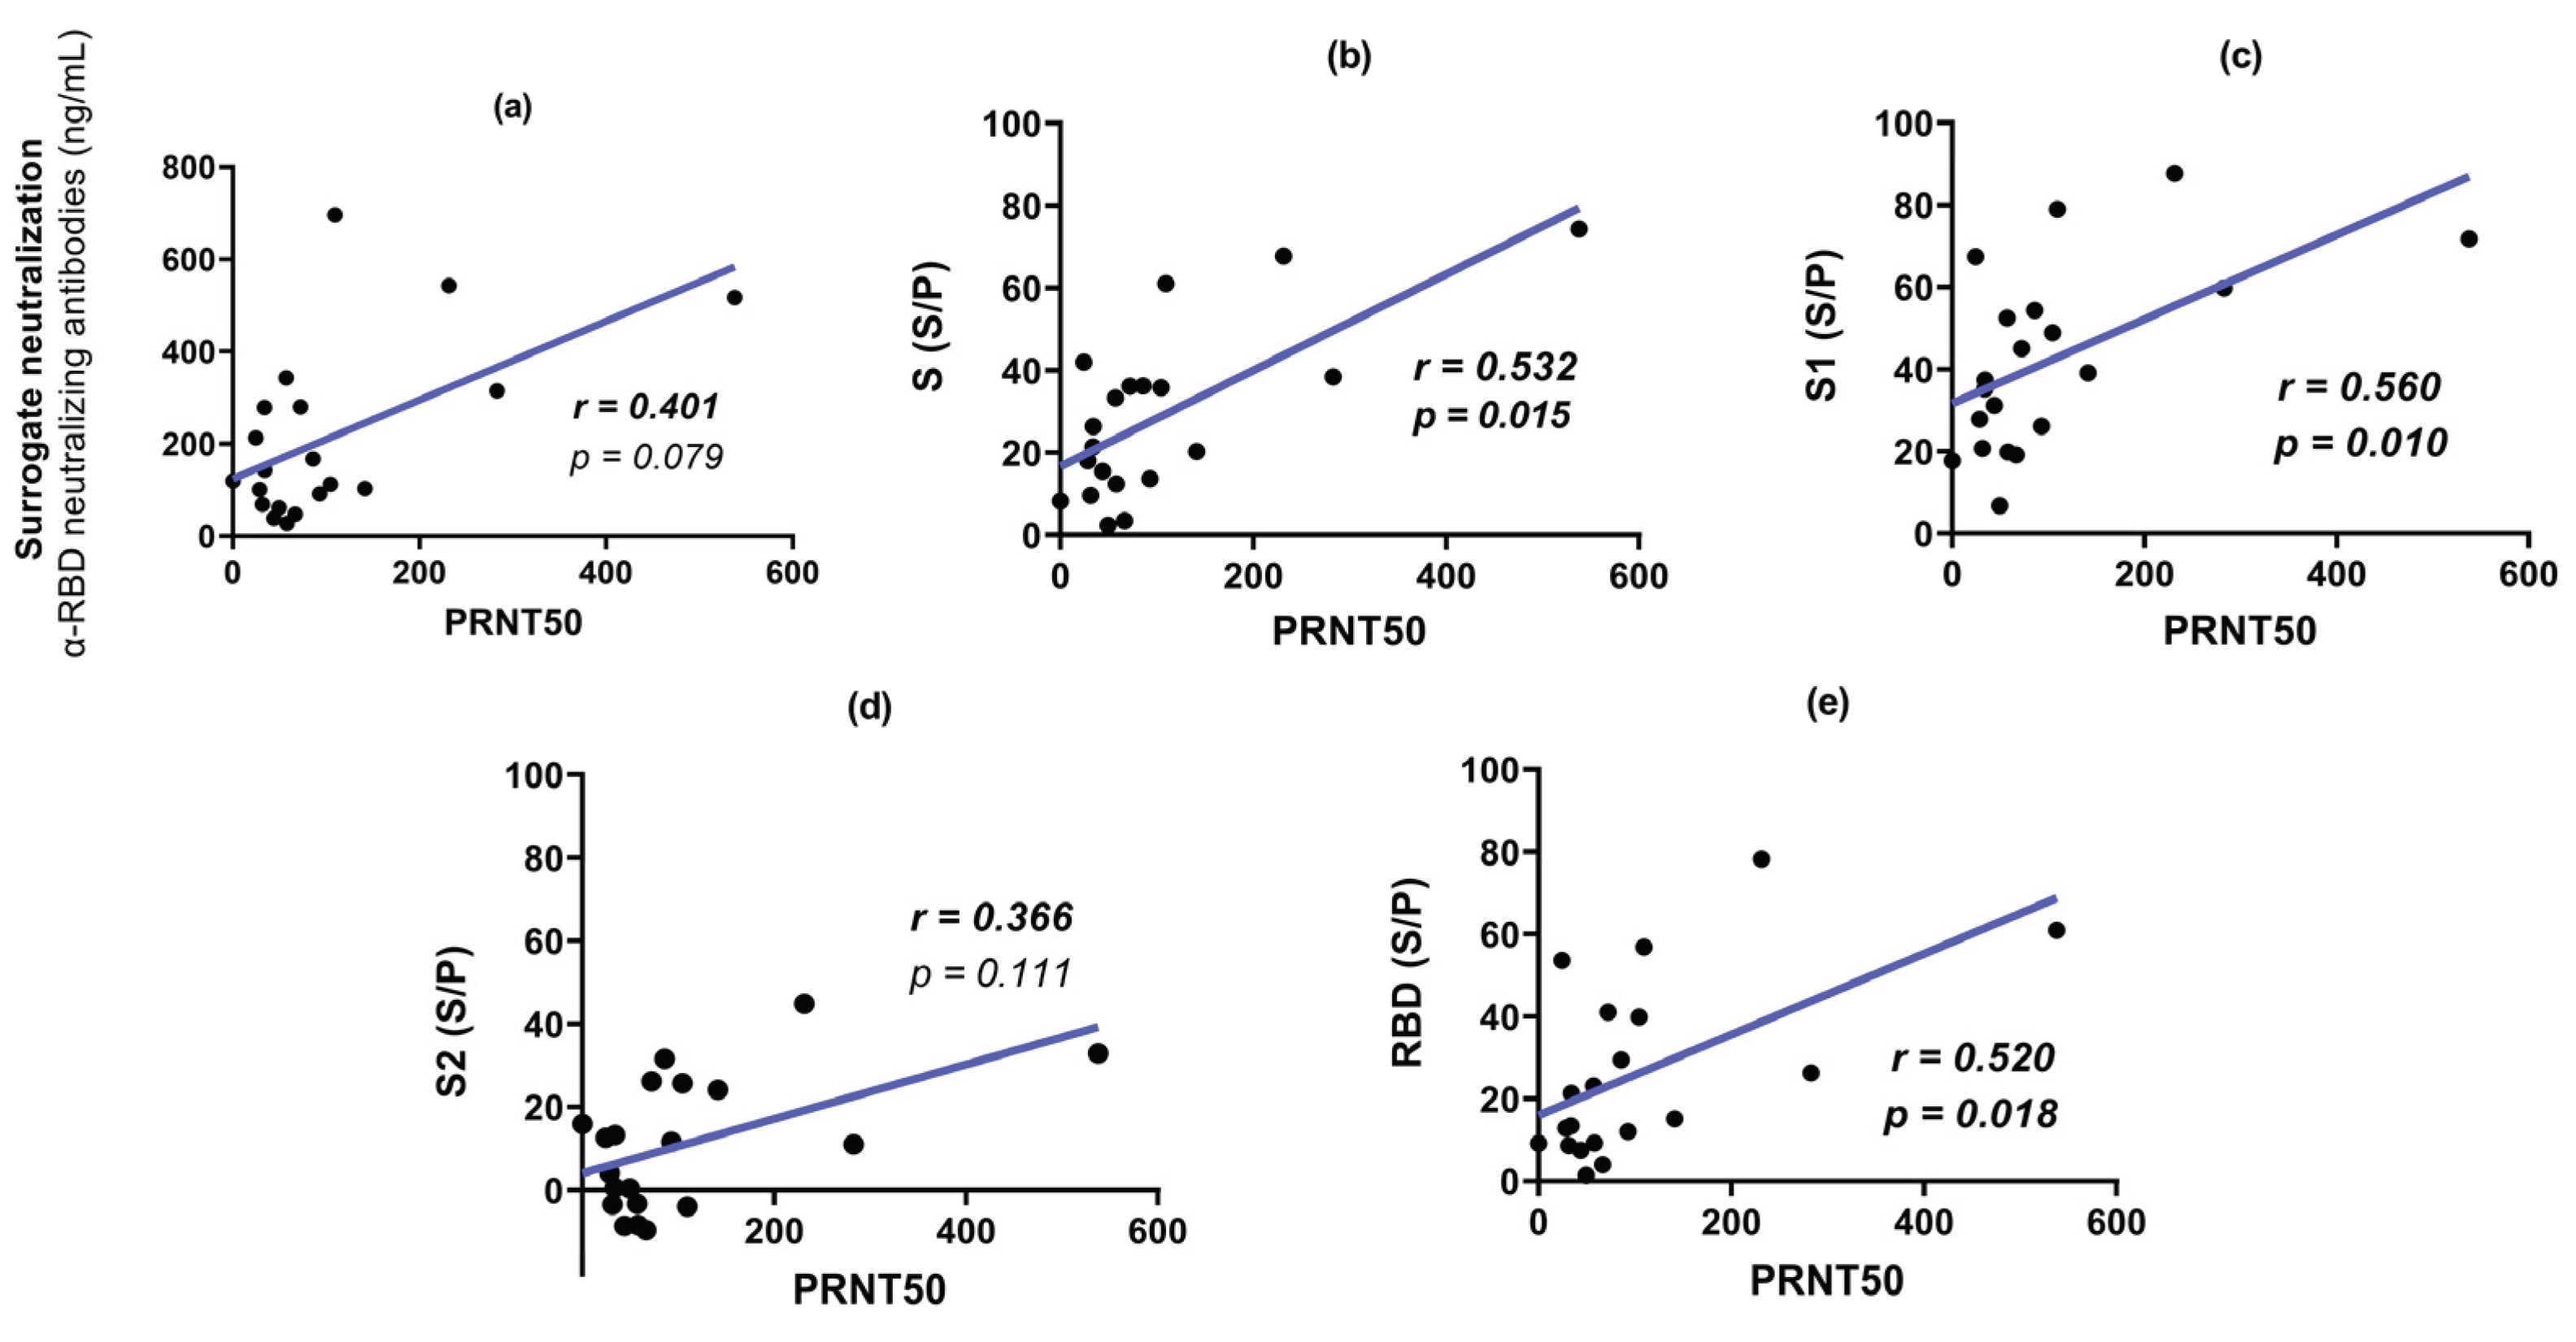
Figure 8.
Correlations between PRNT50 titers, SNT (NAb α-RBD) and ELISA reactivity to S regions in individuals vaccinated with Sputnik-V (180 dpv). r: spearman correlation coefficient and p value (p<0.05); 95% CI; linear regression model shown in blue line.
Figure 8.
Correlations between PRNT50 titers, SNT (NAb α-RBD) and ELISA reactivity to S regions in individuals vaccinated with Sputnik-V (180 dpv). r: spearman correlation coefficient and p value (p<0.05); 95% CI; linear regression model shown in blue line.
Disclaimer/Publisher’s Note: The statements, opinions and data contained in all publications are solely those of the individual author(s) and contributor(s) and not of MDPI and/or the editor(s). MDPI and/or the editor(s) disclaim responsibility for any injury to people or property resulting from any ideas, methods, instructions or products referred to in the content. |
© 2024 by the authors. Licensee MDPI, Basel, Switzerland. This article is an open access article distributed under the terms and conditions of the Creative Commons Attribution (CC BY) license (http://creativecommons.org/licenses/by/4.0/).
Copyright: This open access article is published under a Creative Commons CC BY 4.0 license, which permit the free download, distribution, and reuse, provided that the author and preprint are cited in any reuse.


