
Submitted:
20 March 2024
Posted:
20 March 2024
You are already at the latest version
Abstract
The microscopic pore structure of tight sandstone reservoir significantly influences the characteris-tics of CO2 flooding after water flooding. The research was conducted using various techniques such as casting thin sections, high pressure mercury injection, scanning electron microscopy, Nu-clear magnetic resonance (NMR) testing, and a self-designed high-temperatures and high-pressures microscopic visualization displacement system. Three type cores with different pore structures were selected for the flooding experiments and the microscopic visualization displace-ment experiments, including CO2 immiscible flooding, near-miscible flooding, and miscible flood-ing after the conventional water flooding. The characteristics of CO2 flooding and the residual oil distribution after water flooding were quantitatively analyzed and evaluated. The results show that: (1) During the water flooding process, the oil produced from type I and type III samples mainly comes from large and some medium pores. Oil utilization of all pores is significant for type II samples. The physical properties and pore types have a greater impact on water flooding. Type I and II samples are more suitable for near-miscible flooding after water flooding. Type III samples are more suitable for miscible flooding after water flooding. (2) In the CO2 flooding, oil recovery increases gradually with increasing pressure for all three types of samples. Type II core samples have the highest recovery. Before miscibility, the oil recovered from type I and type II samples was primarily from large pores, however, the oil recovery mainly comes from medium pores when reaching miscibility. As for the type III samples, the oil produced in the immiscible state mainly comes from large and medium pores, and the enhanced oil recovery mainly comes from medium and small pores after reaching the near-miscible phase. (3) It can be seen from the microscopic re-sidual oil distribution that oil recovery will increase as the petrophysical properties of the rock model improve. The oil recovery of near-miscible flooding after water flooding regarding the type II model is up to 68.11%. The oil recovery of miscible flooding after water flooding about type III model is the highest at 74.57%. With increasing pressure, the proportion of flake residual oil grad-ually decreases, while the proportion of droplet-like and film-like residual oil gradually increases. Type II samples have a relatively large percentage of reticulated residual oil in the near-miscible stage.
Keywords:
Microscopic oil utilization
; Residual oil type
; Nuclear magnetic resonance
; Microscopic visualization technology
; CO2 flooding
1. Introduction
With the ongoing advancements in exploration and development technology, the global energy landscape has undergone a corresponding transformation. There has been a gradual shift from traditional methods of energy extraction towards the cultivation of unconventional sources of energy[1,2,3].
As a type of unconventional energy, low-permeability tight sandstone reservoirs have gained significant attention in recent years. These reservoirs exhibit poor physical properties, intricate pore throat structures, high heterogeneity, and limited seepage capacity [4,5,6], making their extraction significantly more challenging compared to conventional oil reservoirs. These reservoirs have low overlying formation pressure and poor physical properties[7], which further complicate the mining process. Due to the low oil recovery of primary depletion mining and secondary water injection development, the overall oil recovery of low-permeability tight sandstone reservoirs is significantly lower than that of conventional oil reservoirs[8,9]. Water flooding has a limited impact on the improvement of tight oil reservoir yields[10,11]. To further enhance the oil recovery of tight oil formations, petroleum researchers must identify and implement innovative strategies.
In recent years, petroleum scientists have discovered that gas injection can greatly enhance the oil recovery from tight reservoirs[12,13]. Due to its unique properties, CO2 injection not only improves the oil recovery of the reservoir[14,15,16], but also enables the geological storage of CO2[17,18,19]. CO2 can dissolve oil, thereby reducing its viscosity and increasing its fluidity within the reservoir[20,21]. When CO2 become a supercritical state, it is allowed to penetrate smaller pores more easily in tight reservoirs and drive out the oil[22,23,24].When CO2 reaches a miscible phase with oil, the displacement effect significantly increases due to the formation of a single-phase system[25,26], the interfacial tension between the gas and liquid phases disappears, which resulted in a significant reduction in capillary resistance within the reservoir, this will greatly improve oil recovery. In summary, CO2 injection can be an effective method to improve oil recovery from tight reservoirs while simultaneously addressing the issue of greenhouse gas emissions by storing CO2 underground.
Currently, there are several ways to develop tight sandstone reservoirs. In the early stage, many scholars have done much more research on water flooding development [27,28]. Liu et al[29], used the Chang8 reservoirs and Chang9 reservoirs dense sandstones of the Honghe Oilfield as a study object, investigated the effect of pore structure on oil saturation. It was concluded that the affected area of most low permeability samples is larger than hyperpermeable samples after water flooding. The main source of oil flooding efficiency is mainly from intergranular pores, the connectivity of pores is a key factor affecting oil saturation. Zhou et al[30], they studied the effect of micropore structure on tight sandstone reservoirs, considering that type II oil reservoirs are the main targets for subsequent exploration and development. Water flooding methods mainly include network flooding and finger flooding, with residual oil separated by water in the form of oil drops. Pore size and oil distribution characteristics are key determinants of oil recovery. Jiang et al[31], used dense sandstones with different wettability in the Chang6 and Chang8 reservoirs in the Ordos Basin as a study object, calculating and measuring the T2 spectra of the applied gradient magnetic field for different callback times. Eventual, they constructed a residual oil index based on T2 spectra for evaluating water flooding grades in tight water flooding reservoirs. Chen et al[10], used typical dense sandstones with different permeabilities in the Junge Basin as the study object, simulating water-flooding reservoirs by varying injection pressure, injection rate, and injection volume. Based on NMR measurements, it was found that increasing the injection rate significantly improves the oil recovery, mainly from medium pores and micropores.
Li et al[32], selected three cores with different permeability classes and analyzed the oil recovery of CO2 injection under 5 pressure points at immiscible state, supercritical state, and miscible state, respectively. They also studied the effect of CO2 oil drive on core wettability. Wang et al[33], calculated the oil recovery after CO2 miscible flooding and the volume of residual oil. They found that when the throat radius is less than 0.26μm, CO2 miscible phase flooding leads to throat blockage. Gao et al[34], analyzed CO2 flooding experiments using a self-developed a high-temperatures and high-pressures microscopic visualization displacement system. They quantitatively analyzed the oil mobilization patterns of different pore structures and evaluated the residual oil characteristics and distribution patterns. They explained CO2 flooding microscopic mechanism and the mechanism of residual oil formation. They only singularly studied the residual oil distribution after CO2 flooding but didn’t study the residual oil distribution of gas flooding after water flooding.
The study of microscopic visualization of displacement in tight sandstone reservoirs is crucial for improving oil recovery[35]. Currently, various models are used for this purpose, including non-consolidated filling model[36,37], capillary model[38], simulation two-dimensional model[39,40], and real three-dimensional core model[41,42,43]. However, each model has its limitations.
The filling model is not suitable for simulating the effects of capillary force and wettability on oil production characteristics due to the large size of filling hole throat. The capillary model is a simplification of the real porous medium model and cannot simulate the effects of related mechanisms such as tortuosity. The simulated 2D model can only simulate strongly hydrophilic or strongly lipophilic networks but cannot simulate flooding under intermediate wettability conditions. Realistic 3D core models are currently limited by low pressure and cannot simulate oil production characteristics under reservoir conditions with high pressure and high temperature.
Tight sandstone reservoirs with poor physical properties have higher capillary resistance in the microporous throat, making them inaccessible to water flooding and resulting in poor effective oil utilization. After water flooding, the pressure of low permeability reservoirs drops rapidly, energy recovery is difficult, and water flooding is prone to finger-like breakthroughs. Single CO2 flooding is prone to gas kick, which results in a smaller CO2 flooding area and poorer oil recovery. CO2 flooding after water flooding can effectively solve these problems by entering the small pore space with high resistance to drive out the oil and preventing gas kick. This method can increase the gas flooding wave area, better replenish the formation energy, and enhance the oil recovery.
To address the issue of higher water content in tight reservoirs after water flooding, this paper conducts indoor simulation experiments on tight sandstone reservoirs through water flooding. The simulated reservoir enters a high-water content stage, followed by gas flooding experiments after water flooding to simulate third CO2 gas flooding oil recovery. This study aims to provide a more in-depth understanding of microscopic oil utilization characteristics in gas flooding reservoirs after water flooding.
Currently, there is a significant amount of research on water and CO2 injection in tight sandstone reservoirs. These consist mainly of indoor experiments and field experiments. However, limited research has been conducted on the microscopic utilization characteristics of CO2 flooding after water drive and the factors affecting the efficiency of oil recovery in different pore structures. To solve this issue, we have developed a real core displacement equipment, the high-temperatures and high-pressures microscopic visualization displacement system can condition to visualize the characteristics of oil movement. This study focuses on the Ordos Basin of tight sandstone reservoirs and uses three types of typical core samples for analysis. A combination of NMR technology and microscopic visualization was employed to quantitatively analyze the CO2 flooding after water flooding from a microscopic perspective. Comparative experiments were conducted using an independently designed microscopic visualization flooding system to study the influence of pore structure for the microscopic utilization characteristics of oil. The study analyzed the distribution regularity and the characteristics about residual oil during CO2 flooding after water flooding in different phases. The findings of this research will provide a theoretical support for the efficient development in tight sandstone reservoirs with CO2 flooding after water flooding.
2. Microscopic Pore Structure Characteristics of Typical Tight Sandstone
The article analyzed 50 samples of dense sandstone from Ordos Basin of the Chang6 reservoir and found that 74% of the cores had a bimodal distribution, while 26% had a monomodal distribution. The bimodal cores were more heterogeneous, with a higher percentage of left peaks and small holes. We used NMR T2 spectra, high-pressure mercury injection, scanning electron microscopy, cast thin-section analysis, and other parameters to evaluate the reservoir. We selected nine characteristic parameters for evaluation, including permeability, porosity, maximum mercury saturation, coefficient of sorting, median pressure, discharge pressure, pore throat radius, pore type and pore throat combination type, based on these parameters, we classified the 50 core samples and established three sample classification and evaluation criteria for the Chang6 reservoir in dense sandstone (Table 1).
Type I sandstone samples have the best physical properties and the best pore structure in three type samples. This type of reservoir has a proportion of 32%, the porosity is between 9.45%-13.58%, with an average porosity of 10.96%. The permeability is between 0.123×10⁻³μm2-0.381×10⁻³μm2, with an average of 0.138×10⁻³μm2. The maximum mercury saturation is an average of 89.25% from the mercury compression experiments. Other data are shown in Table 1. Observations from the cast thin sections reveal that the predominant pore types within this rock core are intergranular pores. (Figure 1a and Figure 1b). Type I has the lowest threshold pressure, the average is only 0.58 (Figure 2a). The NMR T2 spectra of saturated water in the samples of type I cores, which are bimodal with the T2 spectrums. The relaxation time has a wide distribution, mainly in the range of 0.02-499.45ms (Figure 2b). The distribution range is wide, it means the type I samples have a better physical property.
The pore structure and physical properties of type II sandstone samples are slightly worse than type I samples. The proportion of type II reservoir is higher at 46%, and the porosity ranges from 8.19% to 11.61%, with an average of 9.12%. The permeability ranged from 0.047 × 10⁻³ μm2 to 0.116 × 10⁻³ μm2 with an average of0.067 × 10-3 μm2. The maximum feed mercury saturation averaged 85.71% from mercury compression experiments. A small number of intergranular pores and much more dissolved pores are observed in this type of core from casting thin sections (Figure 1c and Figure 1d).. Type II average threshold pressure is 1.82 (Figure 2a). The NMR T2 spectra of saturated water in type II core samples are also bimodal, but the relaxation time distribution of the T2 spectrum is smaller than that of type I samples. It is mainly distributed in 0.03-252.35ms (Figure 2b). This type of core has poorer physical properties, greater median and discharge pressures than type I samples, and a smaller average pore throat radius.
It is poor physical properties and poor pore structure for type III sandstone samples. The proportion of this type of reservoir is 22%, with porosity ranging from 6.87% to 10.48%, and an average of 8.83%. Permeability ranges from 0.025×10⁻³μm2 to 0.043×10⁻³μm2, with an average of 0.031×10⁻³μm2. The maximum feed mercury saturation averaged 74.62% from mercury compression experiments, types of pore throats in this type of core, as observed in cast thin sections, are predominantly solution and intergranular pores (Figure 1e and Figure 1f). Type III has the highest threshold pressure, the average is 3.94 (Figure 2a). The saturated water NMR T2 spectra of type III core samples are predominantly single-peaked, the highest peak is on the left. Indicating a high percentage of small pores, the relaxation time is mainly distributed in the range of 0.04-136.04ms (Figure 2b). This type of core has the worst physical properties and the smallest pore throat radius, and this type of pore is relatively single.
3. Experimental Section
3.1. Experimental Principles
The NMR technique is primarily utilized to measure the transverse relaxation time T2 of core samples, which quantifies the volume change of fluid within the core. The equation for the conversion relationship between T2 relaxation time and pore radius can be expressed as follows:
where T2 is a transverse relaxation time, ms; ρ is a rock surface relaxation strength constant. S/V is the specific surface, m2/m3; c is a parameter with pore-related; r is a pore radius, μm.
From fundamental principles of NMR, the pore radius is directly proportional to the relaxation time T2. The oil recovery can be calculated using equation (2), while the contribution of various porosity scales to the overall oil recovery can be determined using equation (3). A schematic representation of the NMR T2 spectrum change curve is provided in Figure 3.
Where E is a degree of oil recovery. C is a contribution rate. S0 is the area integrated with saturated oil. Si is the area integrated with an x-axis at the end of water flooding or CO2 flooding at a certain pressure. Ai is denoted the envelope area of denote the T2 spectrum of a certain pore type before and after experiments.
3.2. Experimental materials
We selected three type samples based on the classification of microscopic pore structure with shown in Table 2. The oil sample used in the experiment was degassed oil from the surface of Ordos Basin Chang6 reservoir, and kerosene to the volume ratio of oil was 3:1. The reservoir temperature is 60°C. The reservoir pressure is 2 MPa, with 0.809 g/cm3 density and 1.3 mPa·S viscosity. The minimum miscible pressure (MMP) is 15.8MPa. The heavy water used in the experiment was 99.9% D2O (heavy water) and the CO2 gas was 99.9% pure. The stratum water used in the experiment was CaCl2 water type with 25,000 ppm. To shield the hydrogen signal in the experiment, the Mn2+ solution used was mineralized at 25,000 ppm.
3.3. Experimental Apparatus
The experimental setup is composed of a plunger-like displacement device and a microscopic visualization displacement device, as shown in Figure 4 below. The LDY-150 displacement system includes a thermostat box, displacement injection pump, intermediate container, core gripper, hand pump, pressure return valve, gas flow meter, and other components. The injection pump can operate at flooding velocities ranging from 0.001 to 10 mL/min and flooding pressures ranging from 0 to 42MPa. It can perform constant-pressure or constant-velocity flooding. The core gripper, intermediate container, and pressure return valve can withstand a maximum bearing pressure of 50 MPa. The maximum temperature of the thermostat is up to 120°C, with an error of ±0.5°C. The NMR instrument used has a model number of PQ001 and basic parameters of a 12MHz permanent magnet, 1-inch probe, echo time of 0.1ms, number of callbacks of 5,000, measurement waiting time of 2.5s, and the number of accumulations is 64 times. The high-temperatures and high-pressures microscopic visualization displacement system is self-developed and features a micro-visualization core gripper. The experimental samples were changed from samples to visualization models. An annular pressure pump was replaced with an annular pressure tracking pump, and a high-definition camera system and data processing system were added for better visualization and data analysis.
3.4. Experimental Procedure
The specific experimental steps are as follows:
- Plunger sample displacement experiment.
- Core preparation. The core was washed with a mixture of benzene and ethanol in a ratio of 3:1 for seven days using an oil washing apparatus. Following this, the cores were heated to 105°C in a thermostat and maintained at that temperature for 48 hours without any changes. After drying, permeability and porosity of the cores should be calculated.
- Reconstruction of oil-water distribution. The core was saturated with simulated formation water with 0.01 mL/min low rate, it consisted of CaCl2 water with a salinity level of 25000 mg/L. The flooding process was halted when the liquid output reached 4-5PV. We use Mn2+ solution to minimize the hydrogen signal with 4-5PV. Subsequently, using 0.01mL/min rate of the configured simulated oil was injected into the core. The flooding process was halted again when the discharge reached 4-5PV, and the liquid at the outlet was confirmed to be 100% simulated oil. Finally, an NMR T2 spectral was performed on the core.
- D2O flooding experiment. In the D2O flooding experiment, 0.01mL/min rate of the D2O injected is into the core at the inlet end. Reaching 2PV, the displacement is stopped, it is recorded about the oil production and the D2O injection, and it must be performed T2 spectrum sampling at the before and end of the displacement.
- CO2 flooding Experiment. After the D2O flooding experiment, the CO2 flooding experiment was initiated. The intermediate vessel containing CO2 was first pressurized to the experimental pressure of 10MPa. By adjusting the pressure return valve, the backpressure was adjusted to 0.1 MPa below the injection pressure. The CO2 injected rate is 0.1 mL/min to the inlet end, and the valve at the injection end was opened. The flooding process was stopped with 2PV injection volume. t is recorded about the oil production and the CO2 injection, and NMR T2 spectrum always recorded.
- During the whole experiment, the annular pressure remains constant at 25MPa throughout the experiment, with the temperature set at 60℃. After completing the flooding process (2)-(4), the pressure is adjusted to 15MPa and 20MPa respectively for subsequent flooding experiments. Following each experiment, the core is replaced before continuing with steps (2)-(5).
- Micro-visualization experiments.
- Preparation of real core model. The core sample is extracted from the area adjacent to the plunger in the displacement experiment. It is then carefully cut and polished using professional equipment to create a visual model with dimensions of 50mm×25mm×5mm (length × width × thickness). The model is then glued together for visualization purposes, and its porosity and permeability are measured.
- The visualization of flooding experiments follows the same steps as those used in plunger-like flooding experiments, with some differences in experimental subjects. The microscopic visualization of the flooding is studied using real core flakes, while the sample substitution is carried out using a standard core sample with a diameter of 2.5 cm.
- During the visualization of the flooding process, the annular pressure is regulated by an annular pressure tracking pump, which maintains a constant pressure that is always higher 0.5 MPa than the injection pressure.
4. Results and Discussion
4.1. Saturated Oil T2 Spectrum of Typical Core Samples
The saturated oil NMR T2 spectra of the cores are shown in Figure 5 below. To calculate individual pore fractions from the saturated oil NMR T2 spectra, we analyzed the amplitude of the left and center peaks for type I samples. The percentage of small, medium, and large pores were found to be 22.61%, 41.70%, and 35.69%, respectively. For type II core samples, the right peak amplitude was relatively high, with 32.12%, 42.40%, and 25.47%of small, medium, and large pores, respectively. Type III core samples exhibited relatively high left peak amplitudes and a slightly higher percentage of small pore intervals at 41.29%. The percentages of medium and large pores were 40.10% and 18.61%, respectively.
The NMR T2 spectra of the three types of core samples show that there is a high degree of variability in the development of each pore in different types of cores. The highest NMR T2 spectra correspond to the large pores of type II core samples, followed by type I core samples, and the lowest NMR T2 spectra for type III core samples. The NMR T2 spectra corresponding to intermediate porosity are the highest in magnitude for type I core samples, type III core samples are lowest. The amplitude of the NMR T2 spectra is highest for the small porosity type III cores and lowest for the type II samples.
4.2. Oil Utilization Characteristics of Heavy Water Flooding
4.2.1. Recovery of D2O Flooding for Different Types of Samples
Prior to CO2 gas flooding, D2O flooding experiments were conducted on three distinct core samples. Utilizing the NMR curve, the recovery rate was ascertained in accordance with Equation 2. As depicted in Figure 6, the D2O flooding oil recovery for type I samples was 18.12%, followed by type II samples with an oil recovery of 15.72%, and type III samples with the lowest oil recovery of 11.25%. The recovery after D2O flooding of type II cores was only 2.4% lower than that of type I, while type III, with inferior physical properties, had an oil recovery 6.87% lower than that of type I. This disparity is attributable to variations in the physical properties and pore structure of the three cores, which ultimately resulted in varying D2O flooding oil recovery about the three types of samples. The physical attributes of type II samples are slightly inferior to those of type I samples, yet they exhibit a substantial number of intergranular pores. In comparison to type III reservoirs, their physical properties are significantly superior, fallow the type II samples oil recovery and type III samples are lowest oil recovery. The presence of numerous intergranular pores in type II samples, despite their slightly inferior physical properties compared to type I samples, still results in their significantly higher oil flooding oil recovery than type III samples. The better the core's physical properties, the lower its capillary resistance becomes, leading to a higher D2O flooding oil recovery and a reduced residual oil content within the core.
4.2.2. Microporous Oil Utilization Characteristics of D2O Flooding
Based on the NMR T2 spectra after the D2O flooding. Equation (2) was applied to quantify the oil utilization of the three types of samples. Obtaining the degree of oil utilization in small, medium, and large pores during D2O flooding process. As can be seen in Figure 7 below, there are highest degree of oil utilization within the large pore during the D2O flooding in the three types of samples. Followed by medium pore, small pore oil utilization is minimal. Because the capillary resistance varies within different pores, with smaller pore scales the capillary resistance increases. D2O will preferentially enter the large pores where the resistance of the capillary is lower, the leading edge of the wave is advancing, the wave spreads to the surrounding medium pores with slightly higher capillary resistance as well as to some of the small pores, thus, the oil in medium and small pores can be effectively utilized. Type I samples have more developed pores, more intergranular pores, lower discharge pressure and larger average pore throat radius. So, it is easier for D2O to enter the core to drive out more oil. Type II samples have a higher degree of medium pore utilization due to better connectivity between medium and large pores in type II samples. Type III have a higher percentage of poorer pore, structure small pores, and higher capillary resistance, so there is fewer oil utilization in both small and large pores of type III samples.
Based on the NMR T2 spectra post D2O flooding, Equation (2) was employed to quantify oil in small, medium, and large pores of the three samples. This yielded at the D2O flooding, oil utilization of the large and small pores has a rapid growth. As evident from Figure 7 below, all three sample types exhibited that the large pore has the highest degree of oil utilization within during D2O flooding. Following this, medium pore utilization was observed, with minimal small pore oil utilization. The capillary resistance varies across different pores, with smaller pore scales leading to increased resistance. D2O preferentially enters large pores where capillary resistance is lower, advancing the wave front and subsequently spreading to surrounding medium pores with slightly higher resistance and some small pores. Consequently, oil in medium and small pores can be effectively utilized. Type I samples possess more developed pores, greater intergranular porosity, larger average pore throat radius, and lower discharge pressure, making it easier for D2O to penetrate the core and extract more oil. Type II samples exhibit a higher degree of medium pore utilization due to improved connectivity between large and medium pores. In contrast, type III samples have a higher percentage of small pores, poorer pore structure, and elevated capillary resistance, resulting in reduced oil utilization in both large and small pores.
4.3. Oil Utilization Characteristics of CO2 Flooding after Water Flooding
4.3.1. Recovery of CO2 Flooding after D2O Flooding for Different Types of Samples
For the three types of core samples, analyzed the recovery of CO2 flooding after D2O flooding at different pressures (Figure 8) and the specific increasing of oil recovery (Table 3), it was observed that the recovery of samples gradually increased with increasing pressure. There is the highest oil recovery for type II samples, but the enhancement in oil recovery varied by stage for the three types of cores. From 10MPa immiscible phase to 15MPa near-miscible phase, for type II samples, a maximum oil recovery of 64.33% and a maximum increase of 33.42% were observed, followed by type I, while type III samples recorded the lowest increase.
The primary reason for this is that in the immiscible phase, CO2 primarily displaces oil in large and medium-sized pores. As for type III samples, it has a lower percentage of medium and large pores, resulting in lower oil recovery. It has the best physical property for type I samples, with a well-developed pore structure and a high proportion of large and medium pores. However, CO2 tends to gas kick easily, which can impact the final oil recovery. The pressure increases beyond the minimum miscible pressure (MMP), the residual oil in type III samples after water flooding is effectively utilized. Within the pressure range of 15MPa to 20MPa, the oil recovery of type III samples increased by up to 38.16%, the growth rate of type I samples was second, it is the lowest improvement for type II samples. This indicates that the miscible phase has a significant impact on enhancing the oil recovery of type III reservoirs.
By comparing the gas flooding oil utilization of different pore in three types of core samples after D2O flooding (Figure 9), before miscibility, it was found that the degree of oil utilization was consistently highest in the small, medium, and large pores of type II samples, with the increase rate being the greatest. Type III samples were followed, it is the lowest ratio of growth in recovery for type I samples. This is since type II cores have a higher proportion of both large and medium pores, coupled with superior pore connectivity. Below the MMP, CO2 expansion flooding is dominant, and CO2 will preferentially enter large pores and continue to accumulate and expand, eventually forcing its way into smaller pores with higher surrounding capillary resistance. This result shows that type II samples have the highest degree in the small pores. Type I cores are susceptible to gas kick due to pore structure and physical properties, resulting in low utilization of large and medium pores. Since the percentage of medium and large pores is higher in type I cores than in type III core, the degree of oil utilization of each pore in type III samples is lower than that of type I samples under near-miscible phase pressure after D2O flooding. When the pressure reaches the 20MPa miscible phase, the interfacial tension between oil and CO2 disappears, but CO2 will still preferentially enter the large pore. After several contacts between CO2 and oil, it gradually enters the medium and small pores from the large pores in a miscible phase. Type III cores have a relatively small percentage of large and medium pores, and the large pore of the residual oil is mainly used to dissolve CO2 to achieve a miscible phase. Therefore, it is the highest degree of large and medium pores oil utilization for type III samples during the miscible phase. Thus, it is considered that type III cores are more suitable for CO2 miscible phase flooding after D2O flooding, while type I and type II cores are more suitable for near-miscible phase flooding after D2O flooding.
4.3.2. Microporous Oil Utilization Characteristics of CO2 Flooding
4.3.2.1. Oil Utilization Characteristics of Type I Samples
The NMR T2 spectra of type I samples at different pressures, between large and medium pores have an increase connection from Figure 10(a), indicating that CO2 squeezes oil from large pores to medium pores under immiscible pressure. Additionally, there is a higher accumulation of oil at the throat due to some oil staying there. As the pressure increases and reaches 15 MPa in the near-miscible phase, the NMR T2 spectra corresponding to large and medium pores decrease more significantly, suggesting that near-miscible phase flooding after D2O flooding is dominated by large and medium pores. Finally, when the pressure is increased nearly one step to reach the miscible phase, the T2 spectra of large, medium, and small pores show a significant decrease.
From Figure 10(b), the oil utilization in large, medium, and small pores increases gradually with pressure after D2O flooding. There is the highest oil utilization for large pores, medium pores are followed, and small pores are lowest. The oil recovery of large pores is fastest in the immiscible phase, and the growth ratio of medium and large pores is comparable after reaching the miscible and near-miscible phases. This is due to the higher physical properties and better pore structure of type I samples. CO2 preferentially enters large and medium pores with better connectivity to large pores. When pressure reaches the near-miscible phase, oil can dissolve into CO2 in large quantities, leading to a gradual decrease in interfacial tension. Interfacial tension disappears after reaching the miscible phase, allowing CO2 to enter small pore spaces more easily with higher resistance to flooding the oil in the miscible phase. At a pressure of 20 MPa, the oil utilization in small, medium, and large pores of type I samples was 93.06%, 73.51% and 52.36%, respectively. Figure 10(c) shows that when pressure reaches the near-miscible phase, oil is mainly driven out from medium porosity.
4.3.2.2. Oil Utilization Characteristics of Type II Samples
Type II core samples exhibit distinct characteristics when compared to type I samples. Despite having lower physical properties, type II samples possess a higher percentage of large porosity, as evident from Figure 11(a). The NMR T2 spectra of these samples also display a gradual decline with increasing pressure, albeit with slight variations. Notably, at 10 MPa immiscible phase flooding, the NMR T2 spectra for both large and small pores show a more modest decrease, while medium pores experience a more pronounced decline. This phenomenon can be attributed to the intricate structure of type II pores and the fact that D2O predominantly occupies the main pore seepage channels. Consequently, larger pores tend to have less residual oil, while medium pores retain more residual oil. Furthermore, the connectivity between medium and large pores is better than type II samples, so the oil utilization degree in medium pores during immiscible phase flooding.
The NMR T2 spectra decreases significantly as the pressure increases towards the near-miscible phase. This is due to the increased solubility of CO2 and its extraction effect, which causes a gradual decrease between CO2 and oil in the interfacial tension. As a result, the oil gradually dissolves into the CO2, leading to a higher CO2 solubility and extraction capacity. This leads to a greater oil recovery of type II samples at near-miscible phases. As the pressure continues to increase, the solubility of CO2 also increases. The oil becomes continuously saturated with high concentrations of CO2, causing it to dissolve into the oil. Additionally, light hydrocarbons in the oil are constantly added to the miscible phase interface layer. This results in the gradual disappearance of the gas-oil interface and eventually reaching the miscible phase. At this point, CO2 can dissolve most of the oil in the pores and ultimately drive it out. At pressures up to 20 MPa, the oil utilization degree in large, medium, and small pores of type II samples was 94.96%, 81.75%, and 64.31%, respectively. With increasing pressure during CO2 flooding after D2O flooding process, the contribution ratio of small and medium pores gradually increases, while that of large pores gradually decreases. Once the near-miscible phase is reached, oil mainly comes from medium pores.
4.3.2.3. Oil Utilization Characteristics of Type III Samples
Type III samples have the poor physical properties, the medium and small pores have a high proportion and a low proportion of large pores. NMR T2 spectra show less decrease from Figure 12(a) at immiscible and near-miscible phases. From Figure 12(b), compared to type I and type II samples, the oil recovery in large, medium, and small pores is lower for type III samples. The complex pore structure of type III core samples results in limited CO2 entering large pores before reaching the miscible phase, leading to low utilization of medium and small pores. However, when the pressure reaches 20 MPa miscible phase, the oil utilization degree increases significantly in large and medium pores. The NMR T2 amplitude values of large pores are close to zero, indicating that the oil in these pores has been completely driven out by CO2 extraction and dissolution. Medium and some small pores also benefit from CO2 extraction, account for the final oil utilization degree, small pores utilization is 53.86%, medium pores utilization is 88.27%, and large pores utilization is 97.87%at 20 MPa.
4.4. Microscopic Residual Oil Characteristics
4.4.1. Residual Oil Distribution Regularity
At different stages, the residual oil distribution can be obtained by taking high-definition photographs of the flooding model at different stages using micro-visualization displacement equipment. In this study, we analyzed the core photographs of three types of core visualization models after water flooding and different pressure CO2 flooding to reveal the distribution regularity pattern of residual oil at different stages.
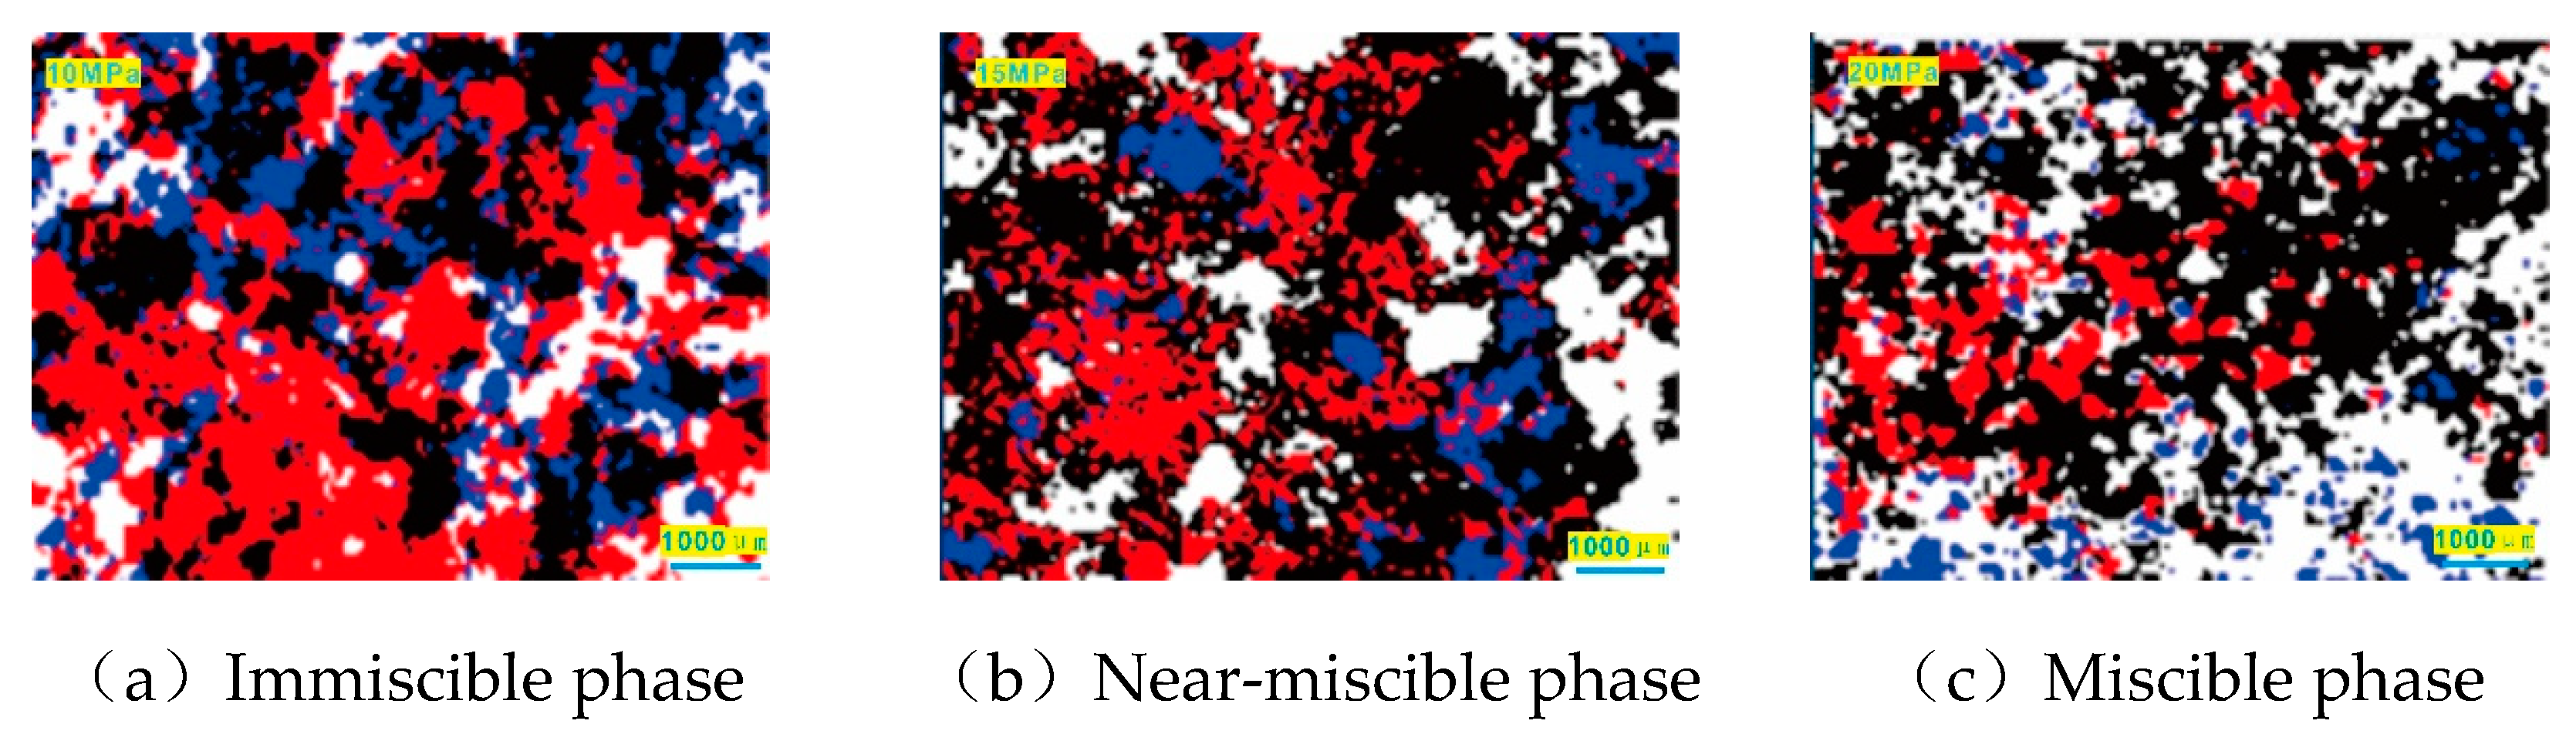
Figure 13(a) illustrates the residual oil distribution following water flooding and subsequent CO2 immiscible phase flooding at 10 MPa, near-miscible phase flooding at 15 MPa, and miscible phase flooding at 20 MPa. The red area diminishes in size and lightens in color from left to right. This indicates that from immiscible phase flooding at 10 MPa, to near-miscible phase flooding at 15 MPa, and finally to miscible phase flooding at 20 MPa, CO2 continuously dissolves and extracts oil, resulting in a progressive reduction in residual oil saturation and a corresponding decrease in oil enrichment areas. In water flooding, due to the more developed pores in the type I model, water primarily flowed along hypertonic channels, yielding an oil recovery of 18.5% post-water flooding. Following water flooding, CO2 flooding at 10 MPa led to a significant increase in wave area, with the visible area's red color gradually transitioning to white and residual oil saturation decreasing. The final oil recovery reached 38.78%. At 15 MPa near-miscible phase CO2 flooding, the interfacial tension between CO2 and oil decreased gradually, significantly enhancing CO2's ability to dissolve oil. This resulted in an increase in CO2 wave area, a reduction in residual oil saturation, and a nearly 58.47% increase in CO2 flooding oil recovery. When the pressure reached 20 MPa, CO2 and residual oil achieved complete miscibility, in the visible area, in the percentage of residual oil area was reduced, residual oil saturation was reduced, and the final oil recovery was 68.15%.
From Figure 13(b) photograph, it depicts the type II residual oil, which exhibits lower physical properties than the type I, and has a larger area, as observed from the water flooding visualization images. This indicates that physical properties significantly impact the water flooding oil recovery. In comparison to water flooding, at 10 MPa CO2 flooding photograph shows a lighter, smaller red color visible area, and lower residual oil saturation, the calculated oil recovery is 42.52%. As the 15 MPa, the near-miscible phase CO2 flooding after water flooding exhibits a significantly higher oil recovery in the type II model compared to the type I model, with a final oil recovery of 68.11%. When the pressure further rises to 20 MPa, the type II model residual oil area is smaller than type I model under miscible phase CO2 flooding after water flooding. The final oil recovery is 71.98%.
From Figure 13(c) photographs, it depicts the visualization of CO2 flooding for the type III model water flooding as well as for immiscible, near miscible, and miscible phase flooding after water flooding. The oil recovery of the type III modeled water flooding is 13.8%, The oil recovery of immiscible phase CO2 flooding after water flooding at 10 MPa is 40.72%, the oil recovery is 56.84% at 15 MPa near-miscible phase flooding, and the oil recovery is 75.47% at 20 MPa miscible phase flooding.
In the type I model, the highest recovery was achieved in the core area, which had the best physical properties during the water flooding. However, as the physical properties decrease, the oil recovery gradually decreases. For the immiscible 10 MPa CO2 flooding after water flooding, the oil recovery of models is not much different from each other. When the pressure reaches 15 MPa near-miscible phase CO2 flooding after water flooding, the highest type II of oil recovery is 68.11%, and when the pressure accomplishes to miscible phase, the highest final oil recovery of type III samples is 75.47% during gas flooding after water flooding.
4.4.2. Typology of Microscopic Residual Oils
The utilization of ENVI software for the conversion of microscopic visualization models post-CO2 flooding into digital format, encompassing three different phases. The digital representation of the visualization image, with black denoting rock, red signifying residual oil, blue representing water, and white indicating pores after being displaced by CO2. A portion of the oil and water adhere to the rock, hence the digitization process only showcases the oil and water, while the underlying rock remains unhighlighted.
The residual oil in the form of continuous flakes accounts for a larger proportion, followed by the reticular, and the oil film and oil droplets account for a smaller proportion. In immiscible phase 10MPa flooding, CO2 mainly circulates along with the hypertonic channels, and the oil in the large pores is well utilized, while most of the small and medium pore is less utilized, lead to a lot of residual oil in the form of contiguous flakes. When the pressure reaches 15MPa in the near-miscible phase. From the residual oil graph, the flaky of residual oil is significantly reduced, the reason for this is that CO2 can disperse the flake-like residual oil, and the oil with less capillary resistance in the middle of the throat pore is displaced. Closed to the rock wall, the oil is more difficult to be driven away due to higher viscous forces. As a result, the residual oil is connected to each other in the form of a membrane, forming a large amount of reticular and filmy residual oil. As the pressure increases to 20MPa miscible phase, the CO2 extraction capacity is enhanced. From pictures, it can be observed that there is less flaky residual oil, and increase the content of residual oil in the form of reticulation and oil film.
Figure 14.
Distribution of residual oil after flooding in different phases.
The residual oil can be calculated by analyzing the driving oil recovery after CO2 flooding at different pressures, as shown in Figure 15(a) below. It was observed that the residual oil content in all samples decreases with increasing pressure. The residual oil distribution pattern in different phases was evaluated using Image J software by quantitatively assessing the proportion of four different residual oil contents. As shown in Figure 15(b)(c)(d), with the increase of CO2 flooding pressure, the residual oil content types of core samples gradually decrease after water flooding. Different residual oil types have different proportion. But overall, the contiguous residual oil proportion is decreasing, while the film residual oil proportion is increasing.
It had the highest proportion of reticulated residual oil for type II samples in the near-miscible phase at 15MPa, and the oil film-like residual oil had the highest proportion when reaching in the 20 MPa miscible phase. Type II core samples were also different at the residual oil shape. Type I samples had the least proportion of flaky residual oil. This is because flaky residual oil is mainly found in large pores, whereas type I samples have better physical properties and more developed pores, with more large pores. The residual oil content gradually decreases with the pressure increasing, lead to a decreasing flaky residual oil proportion and an increasing proportion of droplet and film residual oil.
4.4.3. Differential Characterization of Different Types of Samples
Through the comparison of the different oil utilization characteristics of the core samples, as well as the residual oil distribution and residual oil characteristics, it can be observed that type I and type II samples show a significant increase in recovery after the pressure reaches the 15MPa near-miscible phase. The medium pores proportion is the most influence for oil recovery. In terms of residual oil distribution, type I and type II samples residual oil area decreases dramatically, which is resulted to a significant reduction in residual oil saturation and increasing oil recovery. It has the largest proportion of reticular residual oil for type I samples after reaching the miscible phase, and it has the largest residual oil proportion for type II samples at near-miscible phase. For type III core samples, the oil utilization characteristics show that reaching the miscible phase, the oil recovery increases significantly, and the proportion of medium pores and small pores oil significantly increases at the 20MPa miscible phase. From the residual oil distribution, compared to the near-miscible phase, the type III model residual oil area is significantly reduced at the miscible phase. After reaching the miscible phase the proportion of droplet and reticular residual oil increases significantly. In summary, type I and type II samples are most suitable for near-miscible phase flooding after water flooding, and type III samples are suitable for miscible phase flooding after water flooding to realize the maximum economic benefits.
5. Conclusion
Three types of tight sandstone samples with different permeability levels were selected for CO2 displacement experiments under different pressures after water flooding using the low-field NMR method. The study aimed to quantitatively analyze the oil movement characteristics in core samples. Additionally, microscopic visualization experiments were carried out on three kinds of real core models using a high-temperature and pressure visualization displacement system. The objective was to evaluate the distribution of residual oil and the characteristics of its occurrence.
- During water flooding, the oil recovery of type I, II, and III samples decreased progressively. The oil recovery of type I core was the highest at 18.12%. Produced oil in large pores and some medium pores is considerable, and the contribution from the small pores is relatively small for Type I and type III samples.
- The CO2 flooding after water flooding, the CO2 flooding significantly increases the oil recovery for all three-sample types. Type II core samples exhibited the highest oil recovery, while type I cores had the lowest oil recovery in both immiscible and miscible flooding. In near-miscible phases, type III cores had the lowest oil recovery. Notably, from immiscible to near-miscible flooding, type II cores demonstrated the most significant improvement in recovery. On the other hand, from near-miscible flooding to miscible flooding, type III cores experienced the most substantial recovery enhancement.
- As pressure increases, in the near-miscible phase, produced oil in type I and II samples primarily from large pores. Upon reaching the miscible phase, the recovered oil is predominantly from medium pores. In the immiscible phase, recovered oil for type III samples mainly from medium and large pores. In the near-miscible phase, produced oil is mainly from medium and small pores. The near-miscible phase flooding after water flooding is more suitable for Type I and II samples, while the miscible phase flooding is more suitable for type III samples.
- Examination of the microscopic distribution of residual oil reveals that in immiscible phase flooding after water flooding, the oil recovery among the three core types exhibits marginal disparities, with the maximum recovery of 68.11% achieved in the near-miscible phase flooding of the type II model after water flooding. The highest recovery of 74.57% is observed in the miscible phase flooding of the type III model after water flooding. The characteristics of residual oil are well-established. With escalating pressure, the proportion of flaky residual oil diminishes, while that of droplet and oil film formations gradually increases. Reticular residual oils predominate in type II samples during the near-miscible phase.
Acknowledgments
The authors would like to acknowledge the support of the National Natural Science Foundation of China (Grant Nos. 52174030 and 52374041), the Natural Science Basic Research Program of Shaanxi (Program Nos. 2024JC-YBMS-256 and 2022JQ-528), and the Scientific Research Program Funded by Shaanxi Provincial Education Department (Program No. 23JY067).
Notes
The authors declare no competing financial interest.
References
- Caineng, Z.; Zhang, G.; Zhi, Y.; Shizhen, T.; Lianhua, H.; Rukai, Z.; Xuanjun, Y.; Qiquan, R.; Denghua, L.; Zhiping, W. Concepts, characteristics, potential and technology of unconventional hydrocarbons: On unconventional petroleum geology. Petroleum Exploration and Development 2013, 40, 413–428. [Google Scholar]
- Longde, S.; Caineng, Z.; Ailin, J.; Yunsheng, W.; Rukai, Z.; Songtao, W.; Zhi, G. Development characteristics and orientation of tight oil and gas in China. Petroleum Exploration and Development 2019, 46, 1073–1087. [Google Scholar]
- Kokkinos, N.C.; Nkagbu, D.C.; Marmanis, D.I.; et al. Evolution of Unconventional Hydrocarbons: Past, Present, Future and Environmental FootPrint[J]. Journal of Engineering Science & Technology Review 2022, 15, 15–24. [Google Scholar]
- Lin, R.; Yu, Z. H.; Zhao, J. Z.; Dai, C. L.; Sun, Y. P.; Ren, L.; Xie, M. K. Experimental evaluation of tight sandstones reservoir flow characteristics under CO2-Brine-Rock multiphase interactions: A case study in the Chang 6 layer, Ordos Basin, China. Fuel 2022, 309, 122167. [Google Scholar] [CrossRef]
- Gao, H.; Liu, Y.; Zhang, Z.; Niu, B.; Li, H. Impact of Secondary and Tertiary Floods on Microscopic Residual Oil Distribution in Medium-to-High Permeability Cores with NMR Technique. Energy & Fuels 2015, 29, 4721–4729. [Google Scholar]
- Gao, H.; Wang, C.; Cheng, Z.; Li, T.; Dou, L.; Zhao, K.; Xue, J.; Luo, K. Effect of pressure pulse stimulation on imbibition displacement within a tight sandstone reservoir with local variations in porosity. Geoenergy Science and Engineering 2023, 226, 211811. [Google Scholar] [CrossRef]
- Wang, C.; Gao, H.; Qi, Y.; Li, X.; Zhang, R.; Fan, H. Investigation on the Mechanisms of Spontaneous Imbibition at High Pressures for Tight Oil Recovery. ACS omega 2020, 5, 12727–12734. [Google Scholar] [CrossRef]
- Zhang, T.; Tang, M.; Ma, Y.; Zhu, G.; Zhang, Q.; Wu, J.; Xie, Z. Experimental study on CO2/Water flooding mechanism and oil recovery in ultralow - Permeability sandstone with online LF-NMR. Energy 2022, 252, 123948. [Google Scholar] [CrossRef]
- Jiang, Z.; Liu, Z.; Zhao, P.; Chen, Z.; Mao, Z. Evaluation of tight waterflooding reservoirs with complex wettability by NMR data: A case study from Chang 6 and 8 members, Ordos Basin, NW China. Journal of Petroleum Science and Engineering 2022, 213, 110436. [Google Scholar] [CrossRef]
- Chen, M.; Dai, J. C.; Liu, X. J.; Kuang, Y. T.; Wang, Z. T.; Gou, S. C.; Qin, M. J.; Li, M. Effect of displacement rates on fluid distributions and dynamics during water flooding in tight oil sandstone cores from nuclear magnetic resonance (NMR). Journal of Petroleum Science and Engineering 2020, 184, 106588–106588. [Google Scholar] [CrossRef]
- Zhang, J.; Li, X. Z.; Shen, W. J.; Gao, S. S.; Liu, H. X.; Ye, L. Y.; Fang, F. F. Study of the Effect of Movable Water Saturation on Gas Production in Tight Sandstone Gas Reservoirs. Energies 2020, 13, 4645–4645. [Google Scholar] [CrossRef]
- Wang, W.; Li, X. Y.; Wei, Z. K.; Xin, Y. D.; Xiao, R.; Yang, H. X.; Chen, X. L. Effect of CO2-Brine-Rock Interactions on the Pore Structure of the Tight Sandstone during CO2 Flooding: A Case Study of Chang 7 Member of the Triassic Yanchang Formation in the Ordos Basin, China. ACS omega 2023, 8(4), 3998–4009. [Google Scholar] [CrossRef]
- Chen, W.; Maolei, C.; Kai, W.; Yong, W.; Keyi, W.; Hui, G. Full-Scale Experimental Study on the Effect of CO2 Flooding on Storage-Seepage Capacity of Tight Sandstone Reservoirs. ACS omega 2023, 8, 11897–11907. [Google Scholar]
- Ding, J. C.; Yan, C. H.; Wang, G. Z.; He, Y. M.; Zhao, R. H. Competitive adsorption between CO2 and CH4 in tight sandstone and its influence on CO2-injection enhanced gas recovery (EGR). International Journal of Greenhouse Gas Control 2022, 113, 103530. [Google Scholar] [CrossRef]
- Lin, R.; Yu, Z. H.; Zhao, J. Z.; Dai, C. L.; Sun, Y. P.; Ren, L.; Xie, M. K. Experimental evaluation of tight sandstones reservoir flow characteristics under CO2-Brine-Rock multiphase interactions: A case study in the Chang 6 layer, Ordos Basin, China. Fuel 2022, 309, 122167. [Google Scholar] [CrossRef]
- Li, T.; Gao, H.; Ni, J.; Wang, C.; Cheng, Z. L.; Xue, J. J.; Luo, K. Q. Research on the Differential Oil Producing in the Various Scale Pores under Different CO2 Flooding Modes with a Fluid Distribution Pore Classification Method. Energy & Fuels 2023, 37, 3775–3784. [Google Scholar]
- Danchen, L.; Soheil, S.; Zunsheng, J.; Ye, Z. An experimental study of CO2 injection strategies for enhanced oil recovery and geological sequestration in a fractured tight sandstone reservoir. Geoenergy Science and Engineering 2023, 230, 212166. [Google Scholar]
- Ping, Y.; Feng, L.; Kai, Y.; Chunshuo, H.; Chao, R.; Jiangtang, Z.; Xiukun, W.; Quantang, F.; Xinxin, L.; Liangbin, D. Micro-Displacement and Storage Mechanism of CO2 in Tight Sandstone Reservoirs Based on CT Scanning. Energies 2022, 15, 6201. [Google Scholar]
- Yuting, D.; Fengpeng, L.; Jun, N.; Yisheng, L.; Hao, S.; Gongshuai, S. Evaluation of the impact of CO2 geological storage on tight oil reservoir properties. Journal of Petroleum Science and Engineering 2022, 212, 110307. [Google Scholar]
- Xiang, L.; Junjie, X.; Yanqing, W.; Weipeng, Y.; Jun, L. Experimental study of oil recovery from pore of different sizes in tight sandstone reservoirs during CO2 flooding. Journal of Petroleum Science and Engineering 2022, 208, 109740. [Google Scholar]
- Wang, Y.; Shang, Q.; Zhou, L.; Jiao, Z. Utilizing macroscopic areal permeability heterogeneity to enhance the effect of CO2 flooding in tight sandstone reservoirs in the Ordos Basin. Journal of Petroleum Science and Engineering 2021, 196, 107633. [Google Scholar] [CrossRef]
- Peng, H.; Yang, J.; Peng, J. L.; Pu, J. H.; Liu, Q.; Su, J.; Liu, J. Experimental investigation of the mechanism of supercritical CO2 interaction with tight sandstone. Frontiers in Energy Research 2022, 10, 984144. [Google Scholar] [CrossRef]
- Peng, H.; Zhou, L.; Yang, J.; Peng, J.L.; Han, H.F.; Gou, X.H.; Wang, Z.Y. Influence of Supercritical CO2 on the Formation Sensitivity of Tight Sandstone. Frontiers in Energy Research 2022, 10, 922941. [Google Scholar] [CrossRef]
- Xue, J., Gao, H., Wen, X., Wang, M., Cheng, Z., Wang, C., ... & Zhang, N. (2023). Microscopic Production Characteristics of Huff-n-Puff after CO2 Flooding in Tight Oil Sandstone Reservoirs. Energy & Fuels, 37(17), 12994–13010. [CrossRef]
- Wang, Q.; Wang, L.; Glover, P. W. J.; Lorinczi, P. Effect of a Pore Throat Microstructure on Miscible CO2 Soaking Alternating Gas Flooding of Tight Sandstone Reservoirs. Energy & Fuels 2020, 34, 9450–9462. [Google Scholar]
- Wang, Q.; Yang, S.; Glover, P. W. J.; Lorinczi, P.; Qian, K.; Wang, L. Effect of Pore-Throat Microstructures on Formation Damage during Miscible CO2 Flooding of Tight Sandstone Reservoirs. Energy & Fuels 2020, 34, 4338–4352. [Google Scholar]
- Liu, X.; Kang, Y.; You, L.; et al. Experimental Evaluation of Spontaneous Imbibitions and Water Injection in Tight Sandstone Oil Reservoirs. Arabian Journal for Science and Engineering volume 2019, 44, 10525–10535. [Google Scholar] [CrossRef]
- Jinghong, H.; Haopeng, Z.; Du, C.; Yuan, Z. An analytical model for shut-in time optimization after hydraulic fracturing in shale oil reservoirs with imbibition experiments. Journal of Petroleum Science and Engineering 2022, 210, 110055. [Google Scholar]
- Liu, H.; Luo, Y.; Meng, Y.; Xiao, G.; Zhao, Y.; Zhou, S.; Shao, L. Effects of pore structure on the moveable oil saturation in water-driven tight oil sandstone reservoirs. Journal of Petroleum Science and Engineering 2021, 207, 109142. [Google Scholar] [CrossRef]
- Zhou, S.; Zhou, Y.; Shi, J.; Zhu, Y.; Xiao, W.; Zhang, R. Micropore structure and water driving characteristics of tight sandstone reservoirs in Ordos Basin. Journal of Petroleum Science and Engineering 2022, 12, 601–612. [Google Scholar] [CrossRef]
- Jiang, Z.; Liu, Z.; Zhao, P.; Chen, Z.; Mao, Z. Evaluation of tight waterflooding reservoirs with complex wettability by NMR data: A case study from Chang 6 and 8 members, Ordos Basin, NW China. Journal of Petroleum Science and Engineering 2022, 213, 110436. [Google Scholar] [CrossRef]
- Li, X.; Xue, J.; Wang, Y.; Yang, W.; Lu, J. Experimental study of oil recovery from pore of different sizes in tight sandstone reservoirs during CO2 flooding. Journal of Petroleum Science and Engineering 2022, 208, 109740. [Google Scholar] [CrossRef]
- Wang, H.; Tian, L.; Chai, X.; Wang, J.; Zhang, K. Effect of pore structure on recovery of CO2 miscible flooding efficiency in low permeability reservoirs. Journal of Petroleum Science and Engineering 2022, 208, 109305. [Google Scholar] [CrossRef]
- Gao, H.; Luo, K. Q.; Xie, Y. G.; Qi, Y.; Li, T.; Cheng, Z. L.; Wang, C. Experimental Investigation of the CO2 Flooding Characteristics of Tight Sandstone Reservoirs Using a High-Temperature and-Pressure Visualization Apparatus. Energy & Fuels 2022, 12544–12554. [Google Scholar]
- Yuxi, Z.; Quan, W.; Haizhu, W.; Bin, W.; Kangjian, T.; Tianyu, W.; Jie, L.; Zhichao, Z.; Shouceng, T.; Sergey, S.; Alexey, C.; Yaniv, E. Laboratory visualization of supercritical CO2 fracturing in tight sandstone using digital image correlation method. Geoenergy Science and Engineering 2023, 225, 211556. [Google Scholar]
- Wang, Y.; Hou, J.; Tang, Y.; Song, Z. Effect of vug filling on oil-displacement efficiency in carbonate fractured-vuggy reservoir by natural bottom-water drive: A conceptual model experiment. Journal of Petroleum Science and Engineering 2018, 174, 1113–1126. [Google Scholar] [CrossRef]
- Al-Obaidi, D. A.; Al-Mudhafar, W. J.; Al-Jawad, M. S. Experimental evaluation of Carbon Dioxide-Assisted Gravity Drainage process ( CO2-AGD ) to improve oil recovery in reservoirs with strong water drive. Fuel 2022, 324, 124409. [Google Scholar] [CrossRef]
- D., K.P.; K., K.L.; Somnath, N. Characterization of heterogeneous petroleum reservoir of Indian Sub-continent: An integrated approach of hydraulic flow unit – Mercury intrusion capillary pressure – Fractal model. Journal of Petroleum Science and Engineering 2021, 205, 108788. [Google Scholar]
- Yang, J.; Hou, J. Experimental study on gas channeling characteristics of nitrogen and foam flooding in 2-D visualized fractured-vuggy model. Journal of Petroleum Science and Engineering 2020, 192, 107334. [Google Scholar] [CrossRef]
- Song, Z.; Li, M.; Zhao, C.; Yang, Y.; Hou, J. Gas injection for enhanced oil recovery in two-dimensional geology-based physical model of Tahe fractured-vuggy carbonate reservoirs: karst fault system. Petroleum Science 2020, 17, 419–433. [Google Scholar] [CrossRef]
- Ting, Z.; Pengfei, X.; Fangfang, L. 3D reconstruction of digital cores based on a model using generative adversarial networks and variational auto-encoders. Journal of Petroleum Science and Engineering 2021, 207, 109151. [Google Scholar]
- Andrés, P.; Luis, R.; Miguel, A.; Nicolás, R. Modelling of 3D viscous fingering: Influence of the mesh on coreflood experiments. Fuel 2020, 287, 119441. [Google Scholar]
- Yan, G.; Yan, W.; Yuan, Y.; Gong, X.; Tang, Z.; Xue, B. Research on the Method of Evaluating the Pore Throat Structure of Rock Microscopically Based on the 3D Pore Network Model of Digital Core. International Journal of Petroleum Technology 2022, 9, 44–53. [Google Scholar] [CrossRef]
- Huang, X.; Zhang, Y.; He, M.; et al. Asphaltene precipitation and reservoir damage characteristics of CO2 flooding in different microscopic structure types in tight light oil reservoirs[J]. Fuel 2022, 312, 122943. [Google Scholar] [CrossRef]
Figure 1.
Pore-throat types of typical core samples.
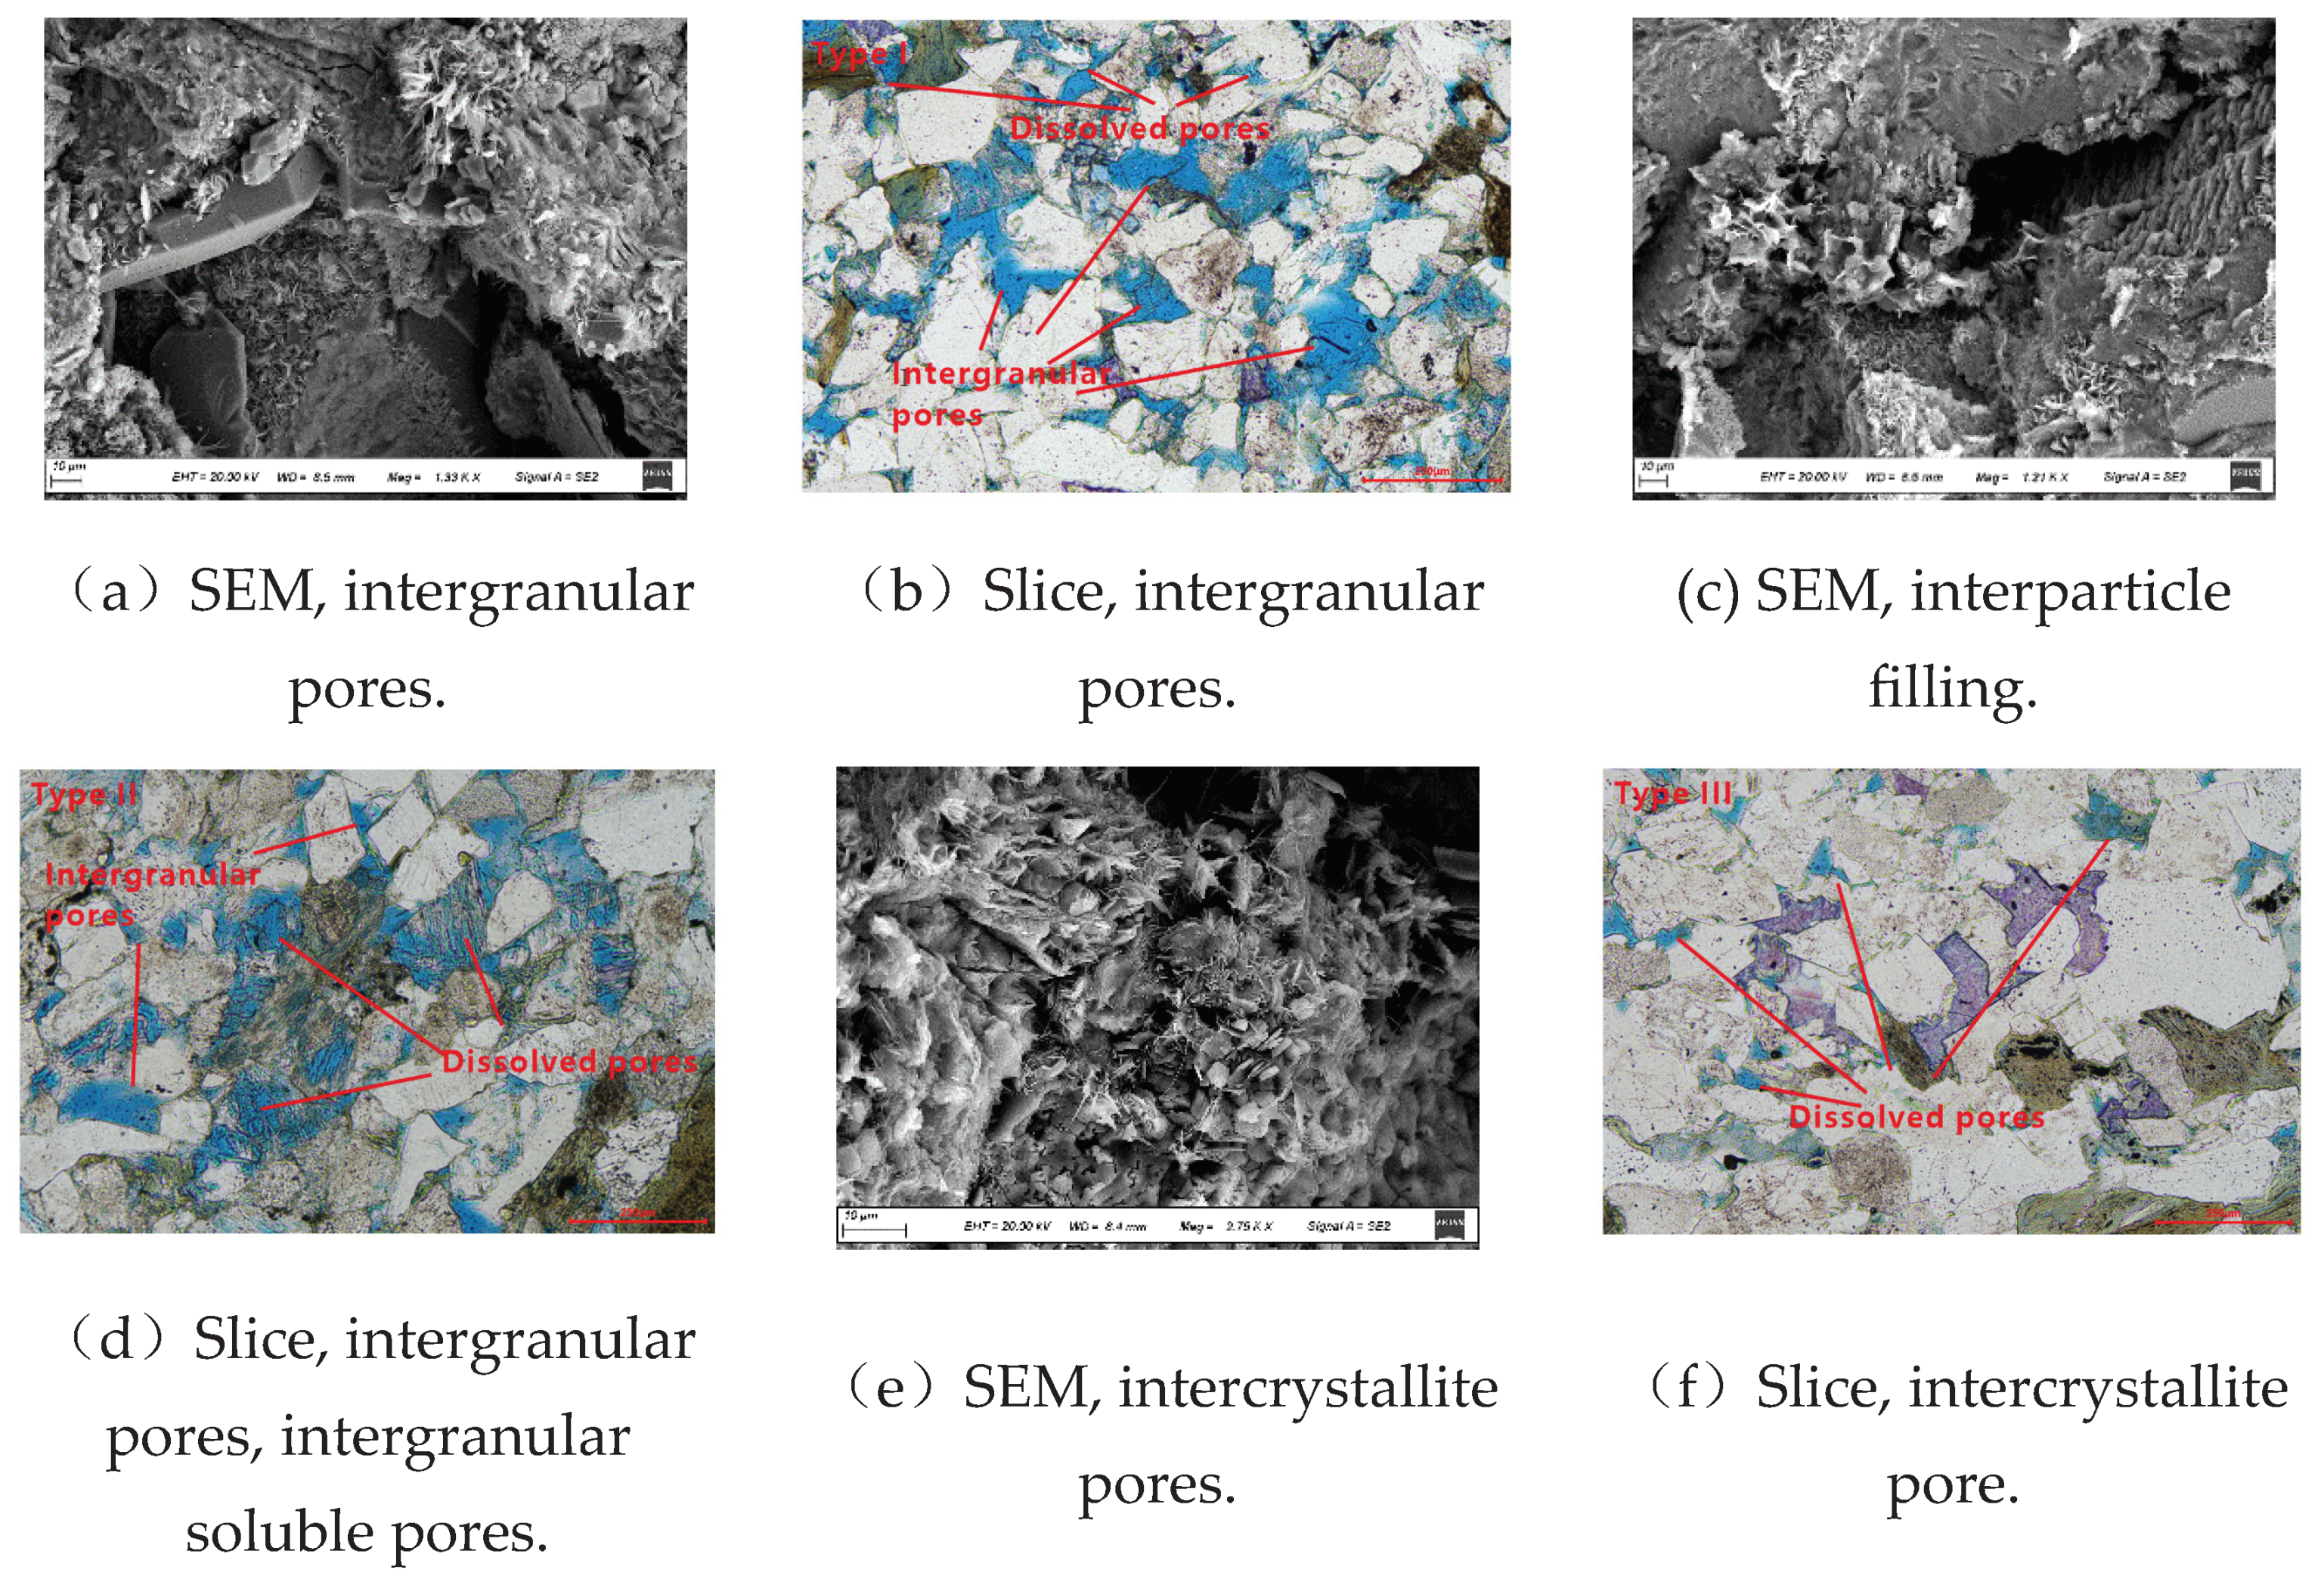
Figure 2.
High-pressure mercury intrusion curves (a) and NMR T2 spectra Characteristic (b) of typical core samples.
Figure 2.
High-pressure mercury intrusion curves (a) and NMR T2 spectra Characteristic (b) of typical core samples.
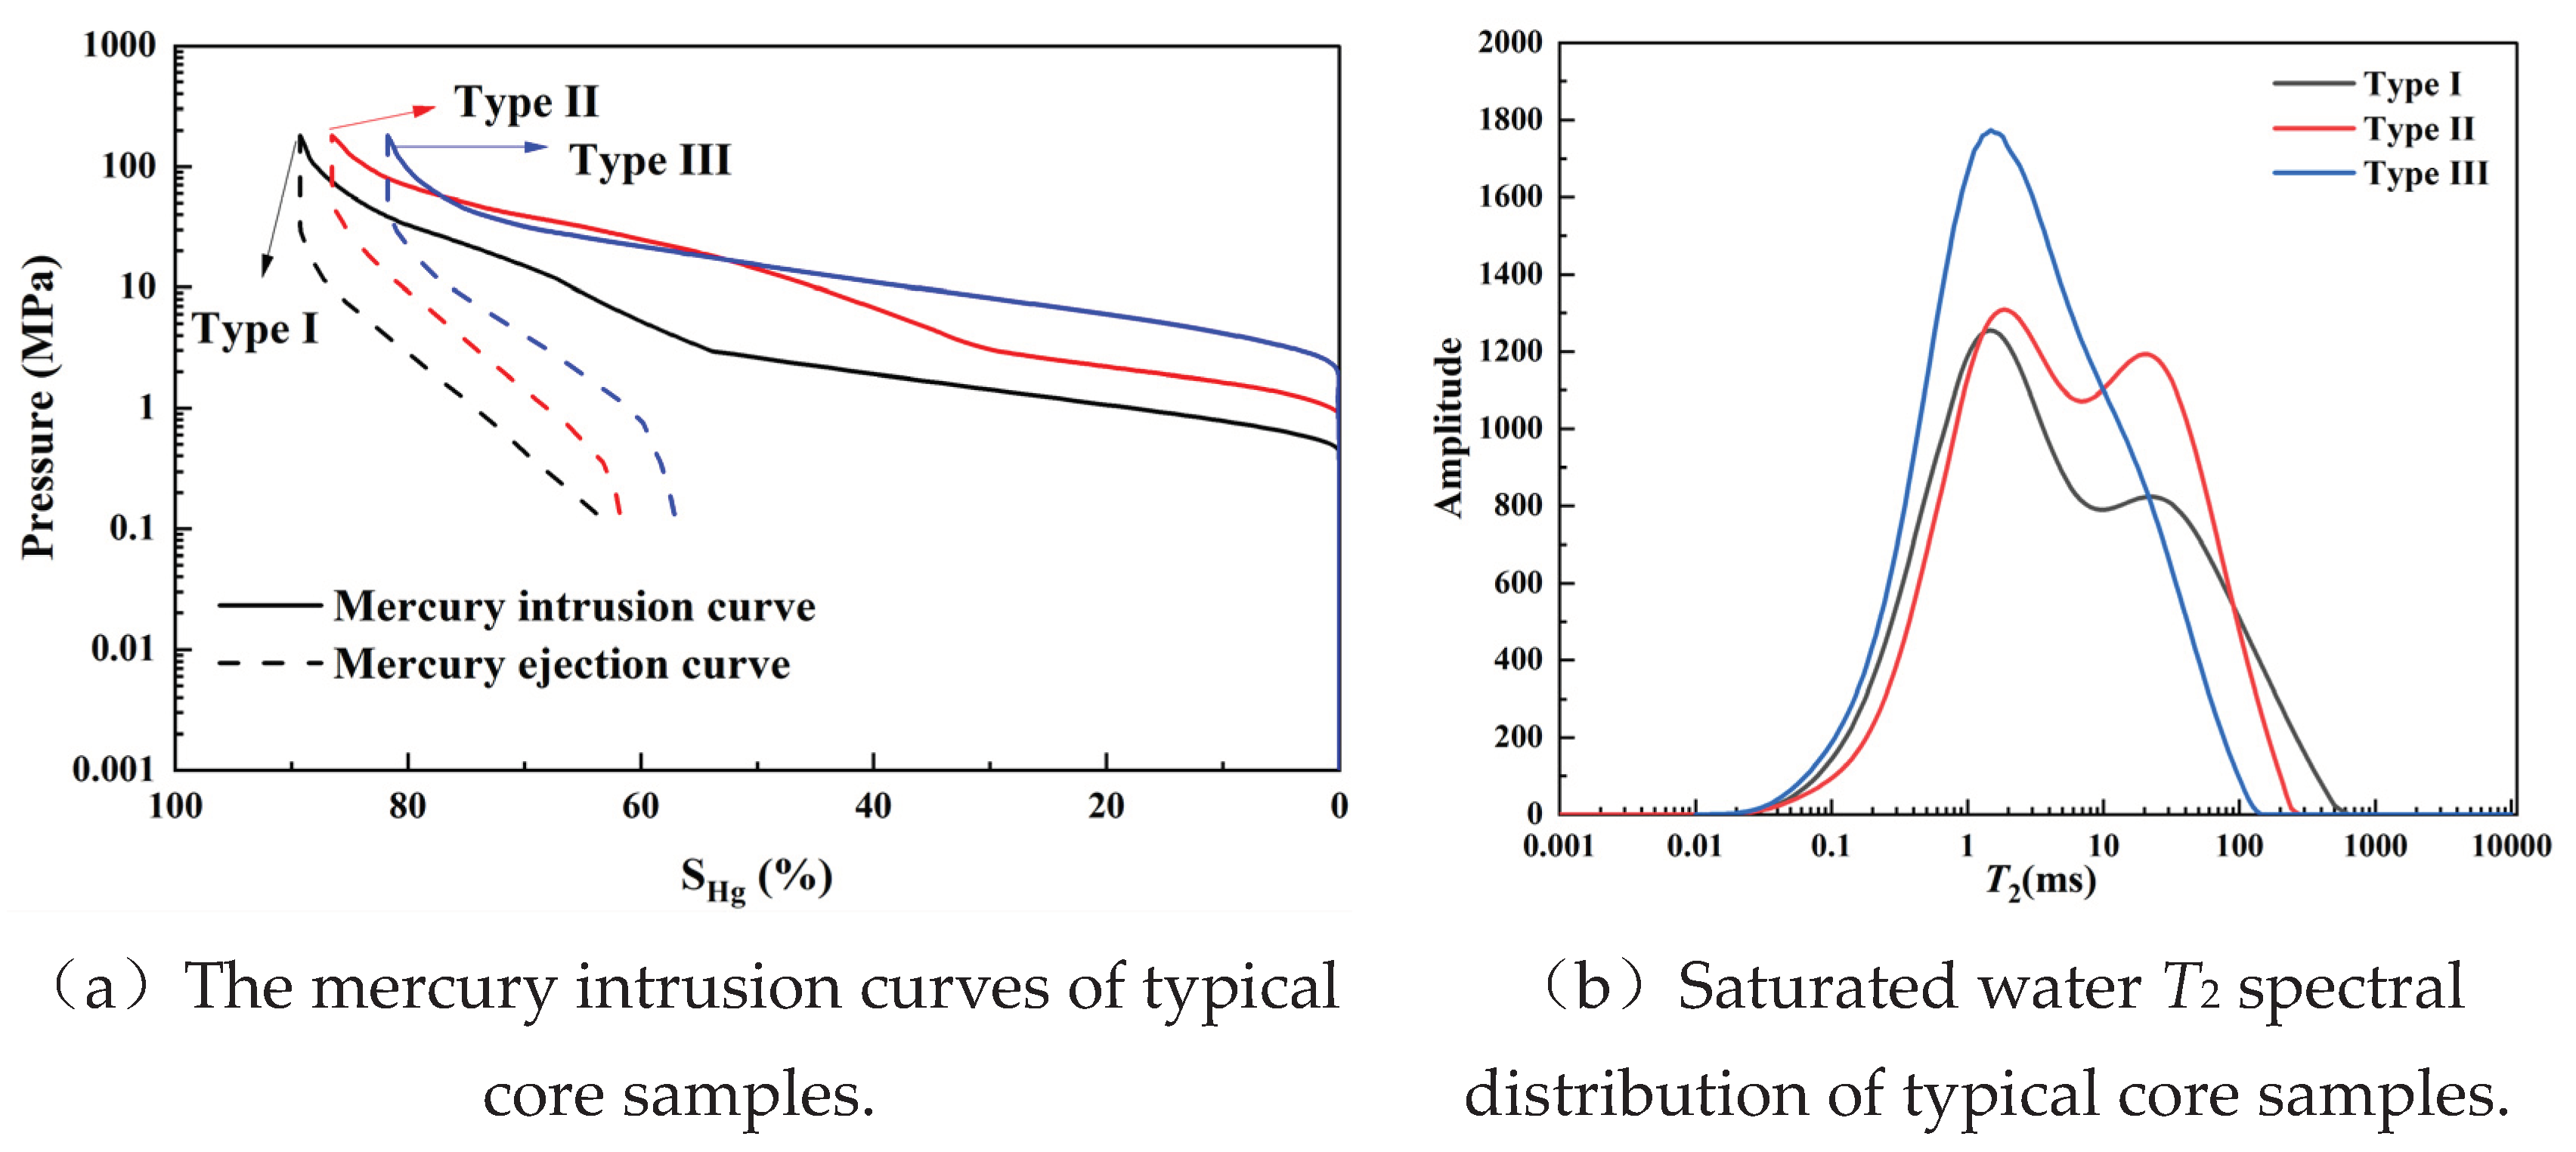
Figure 3.
Variation schematic of NMR T2 spectra.
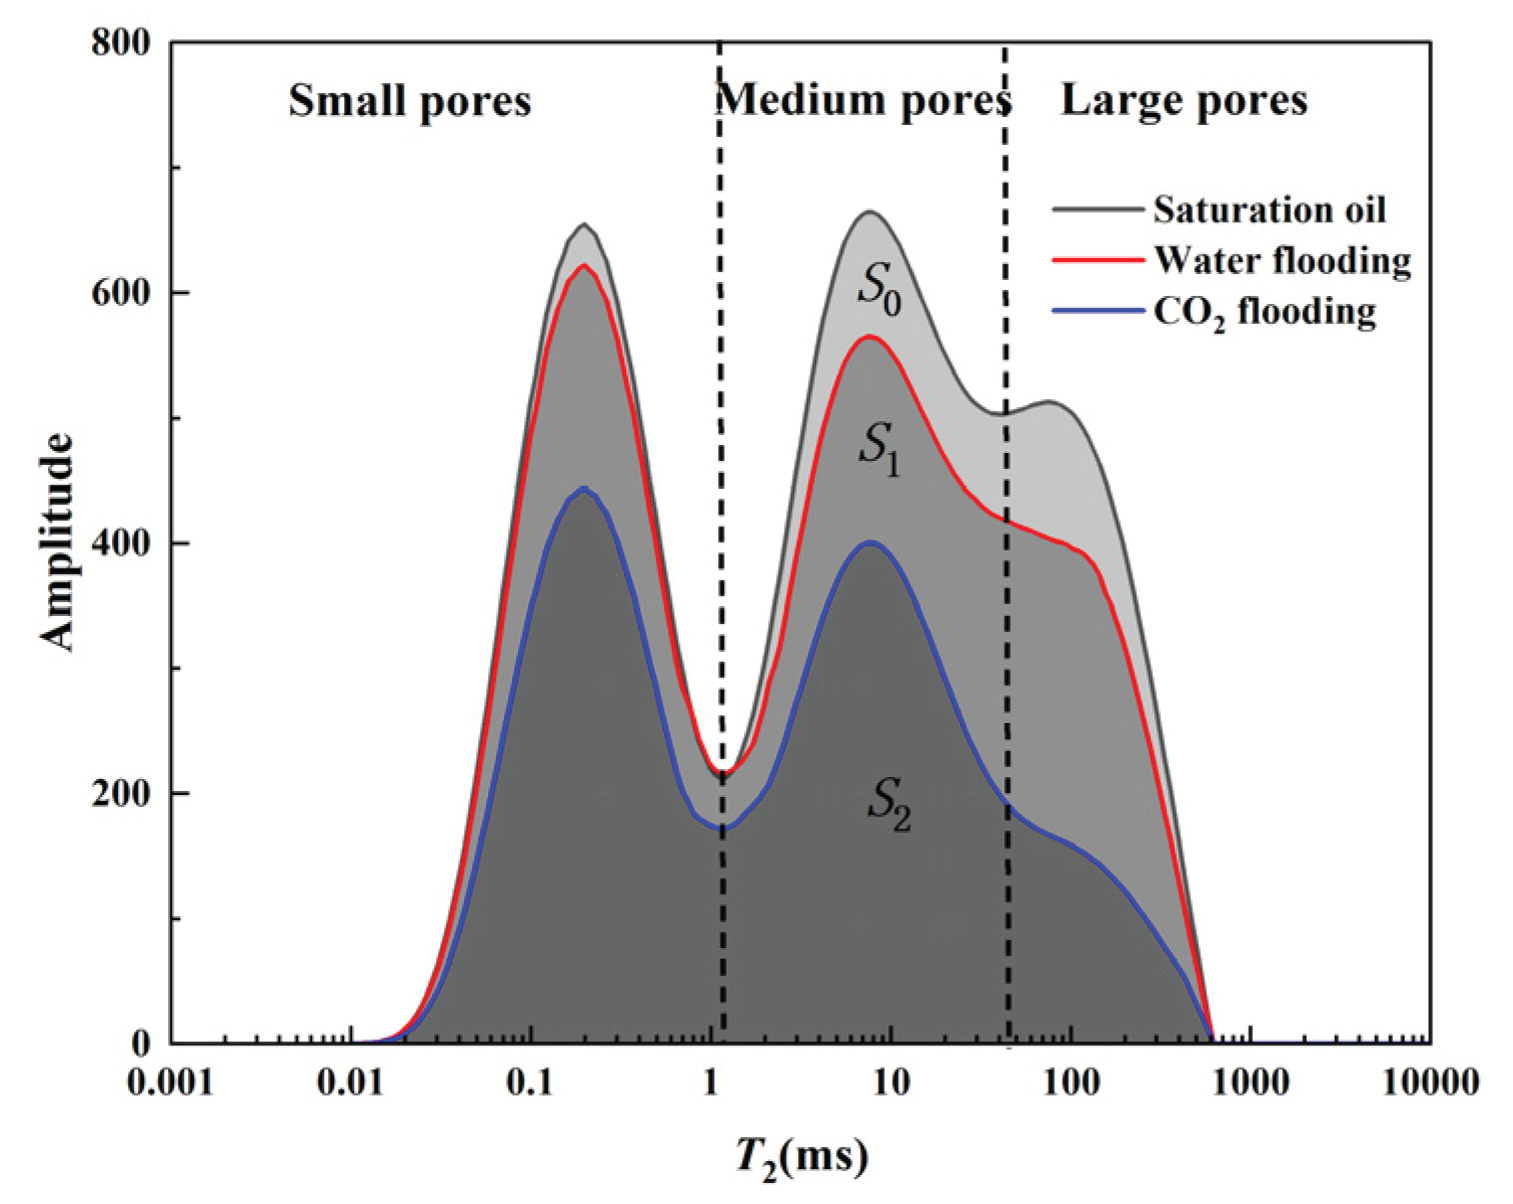
Figure 4.
Schematic of equipment.
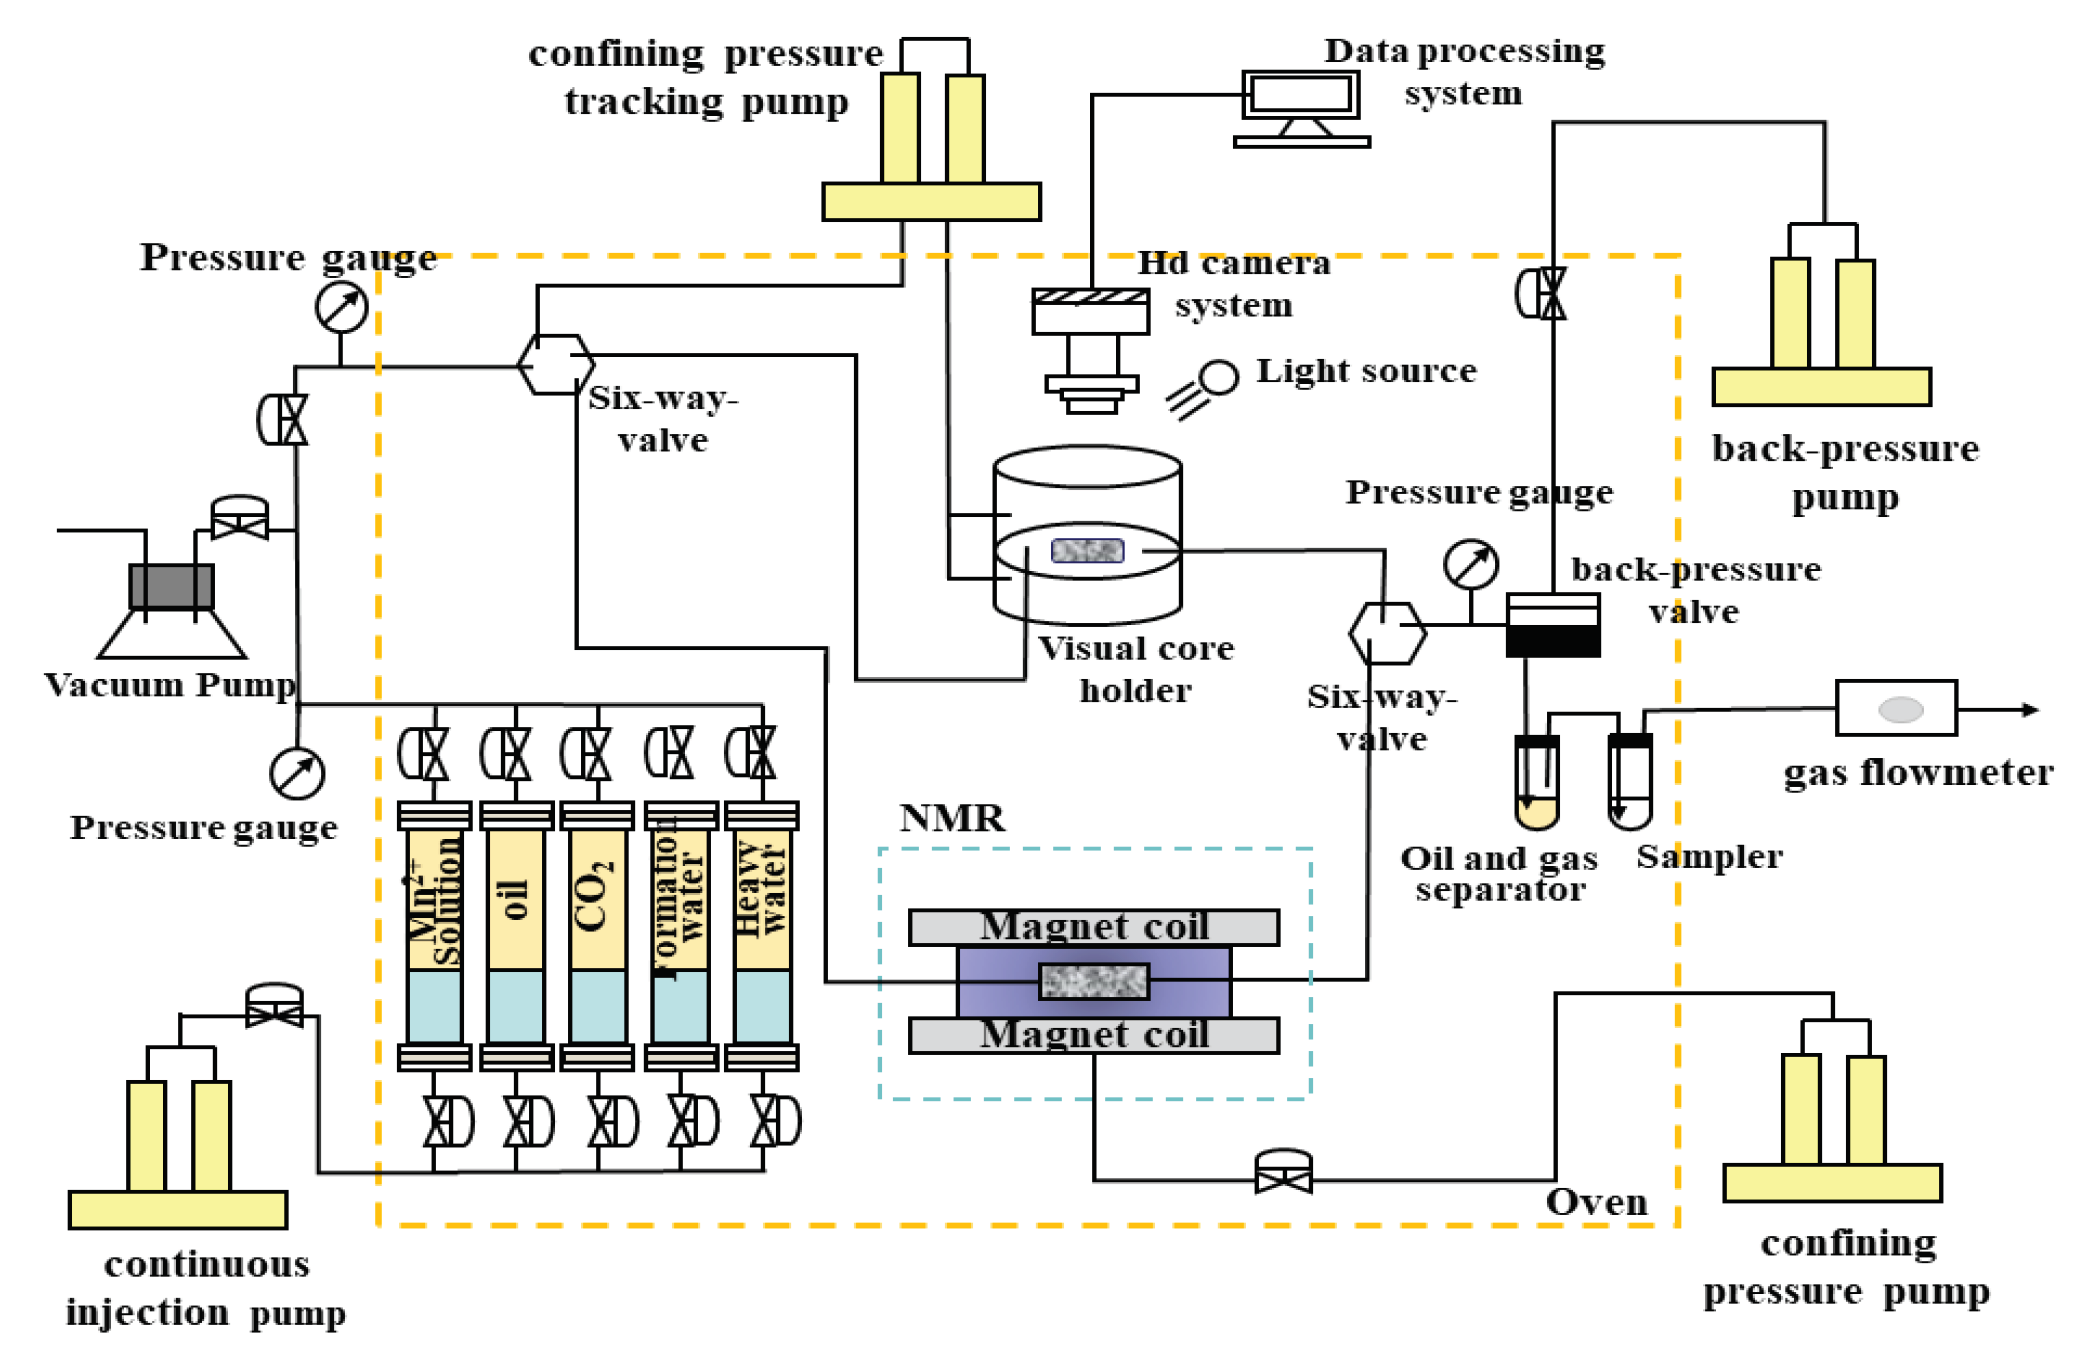
Figure 5.
Saturated oil NMR T2 spectra of typical core samples.
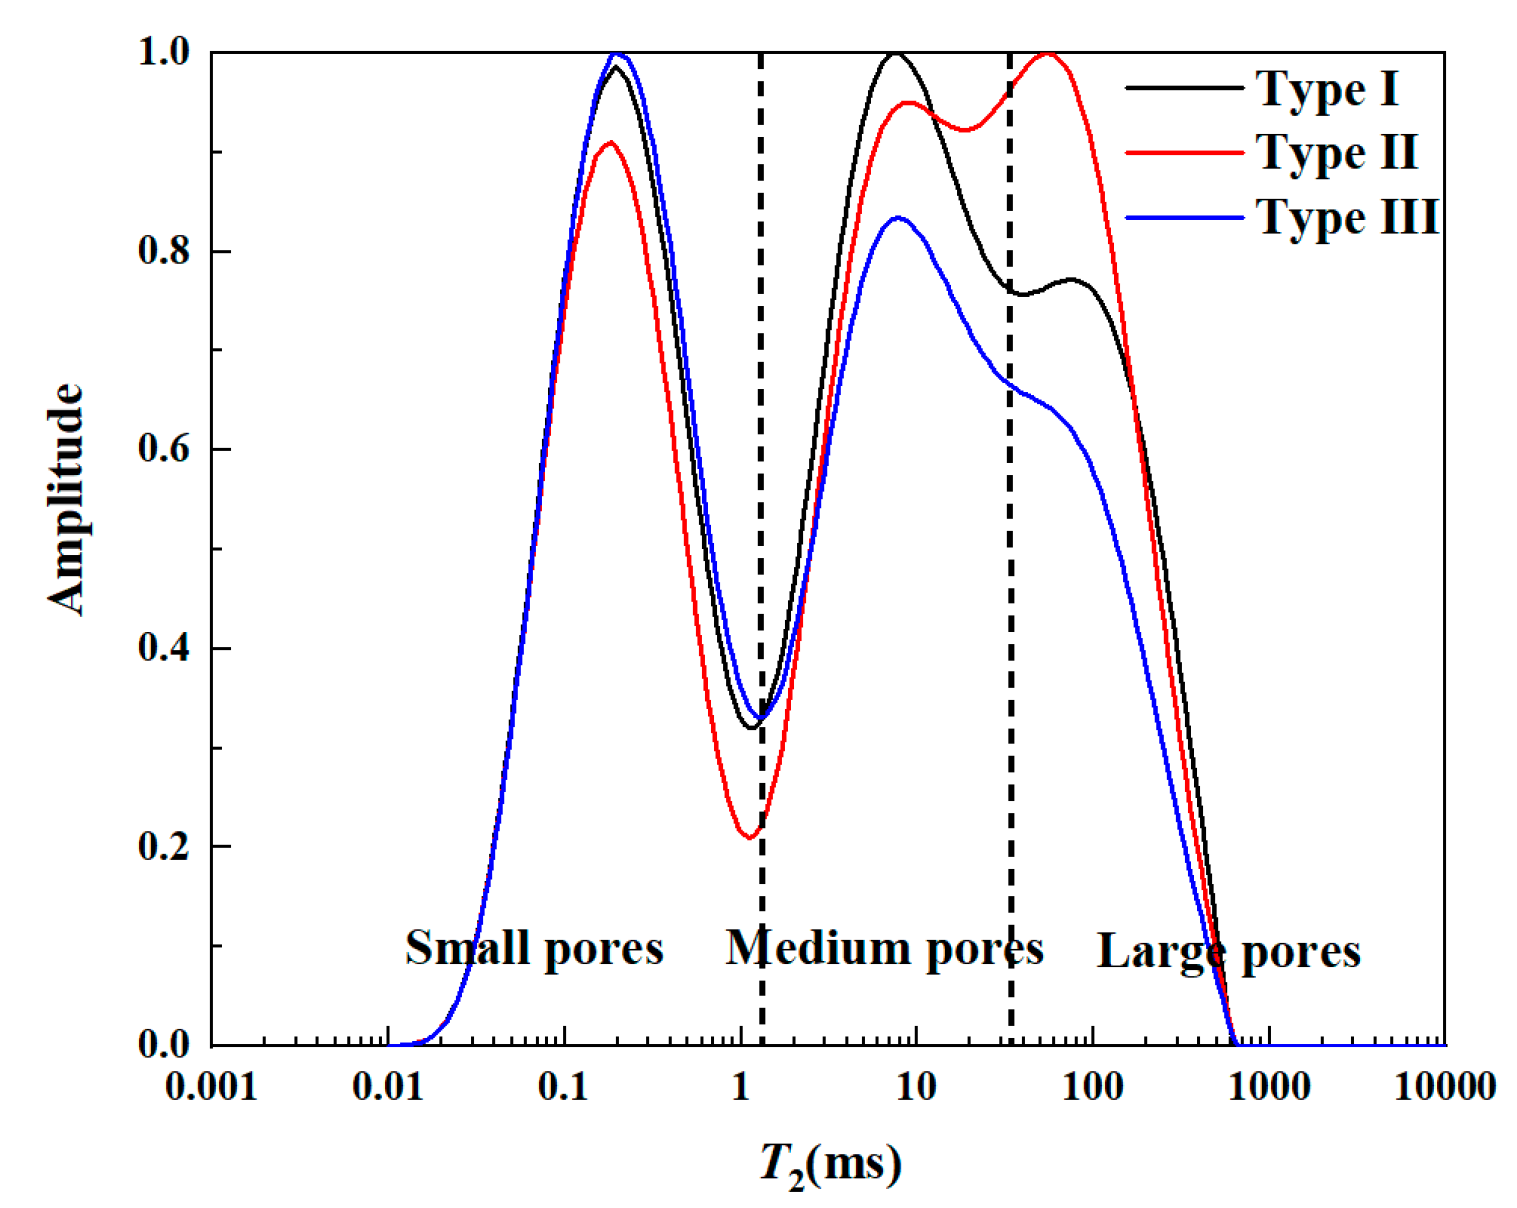
Figure 6.
Oil recovery for water flooding.
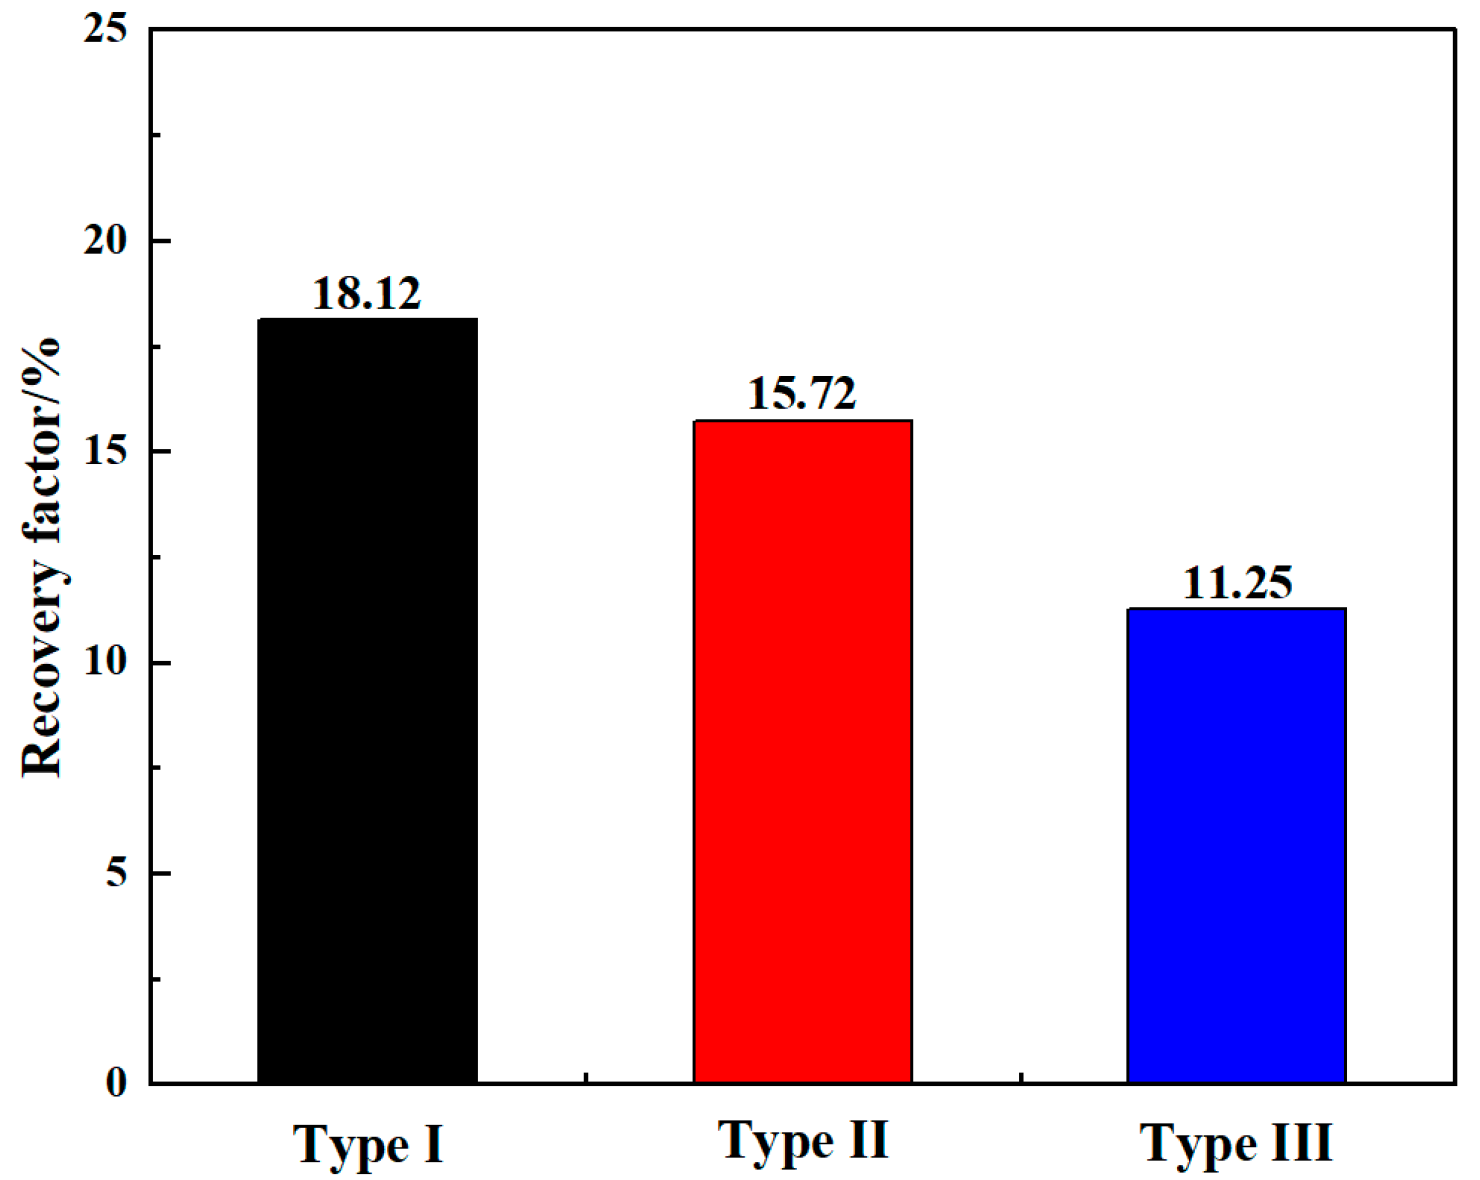
Figure 7.
Oil utilization of different pores for water flooding.
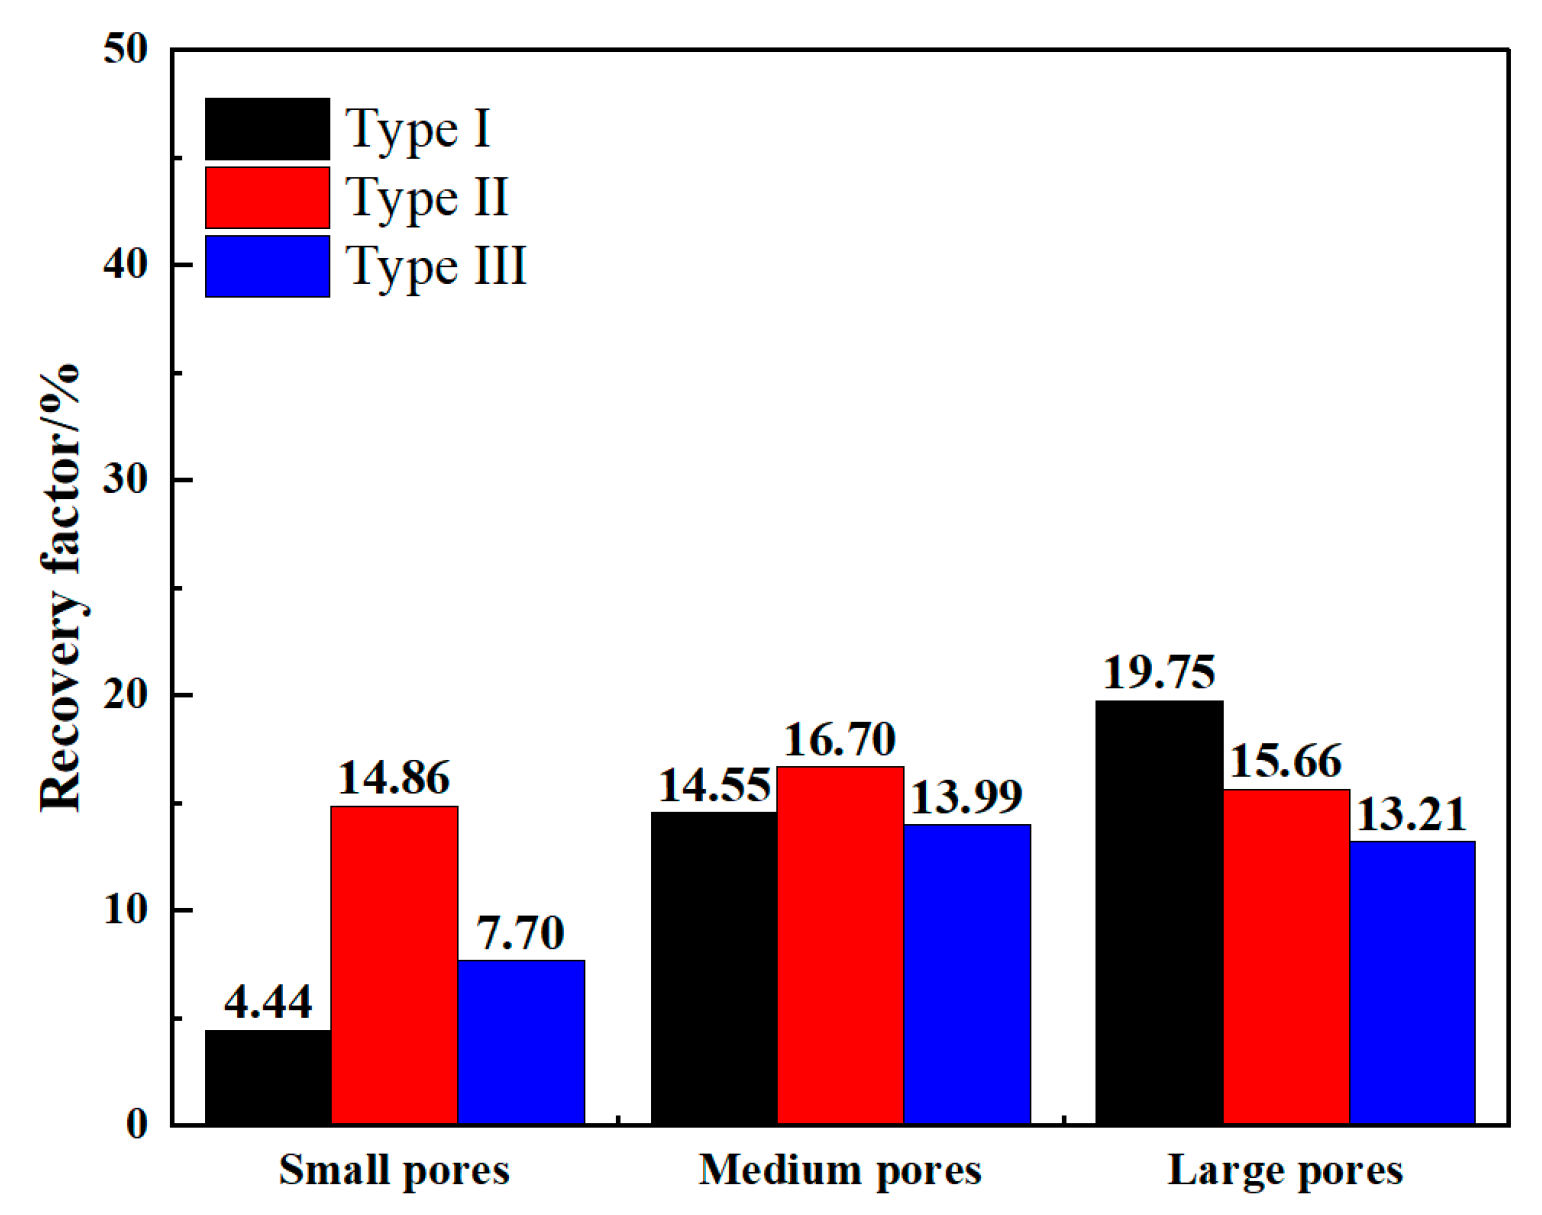
Figure 8.
Gas flooding recovery at different pressures in three types of core samples.
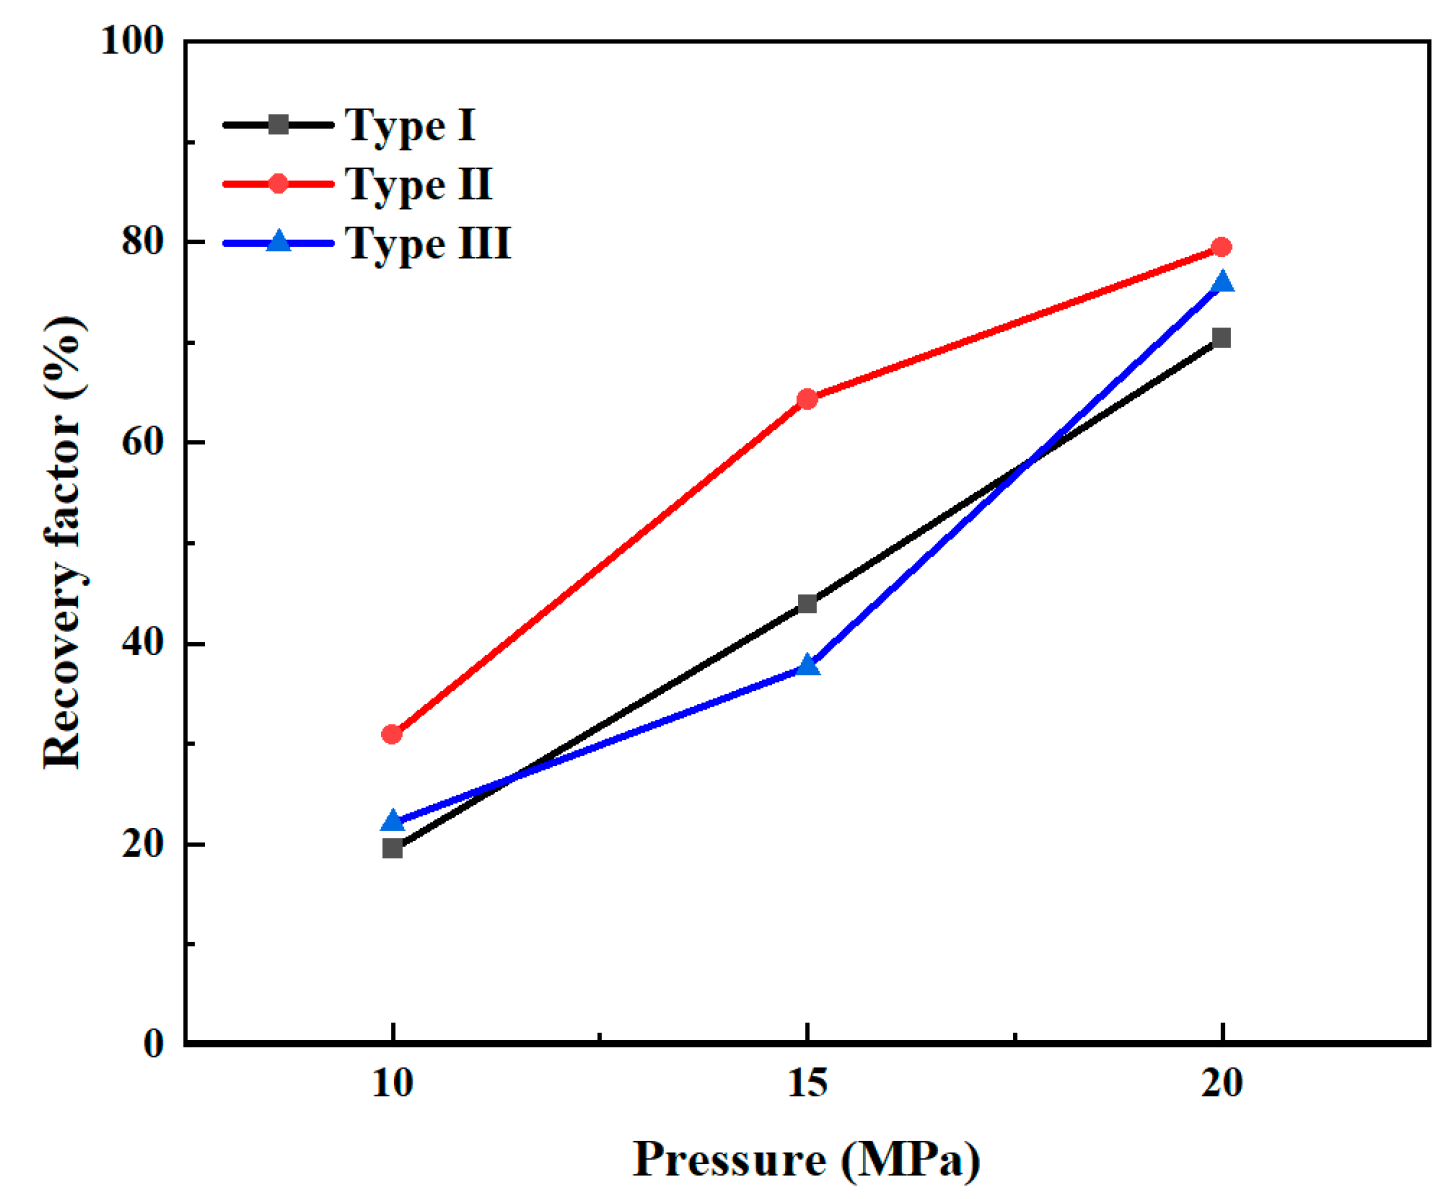
Figure 9.
Degree of oil utilization of different pores in three types of samples.
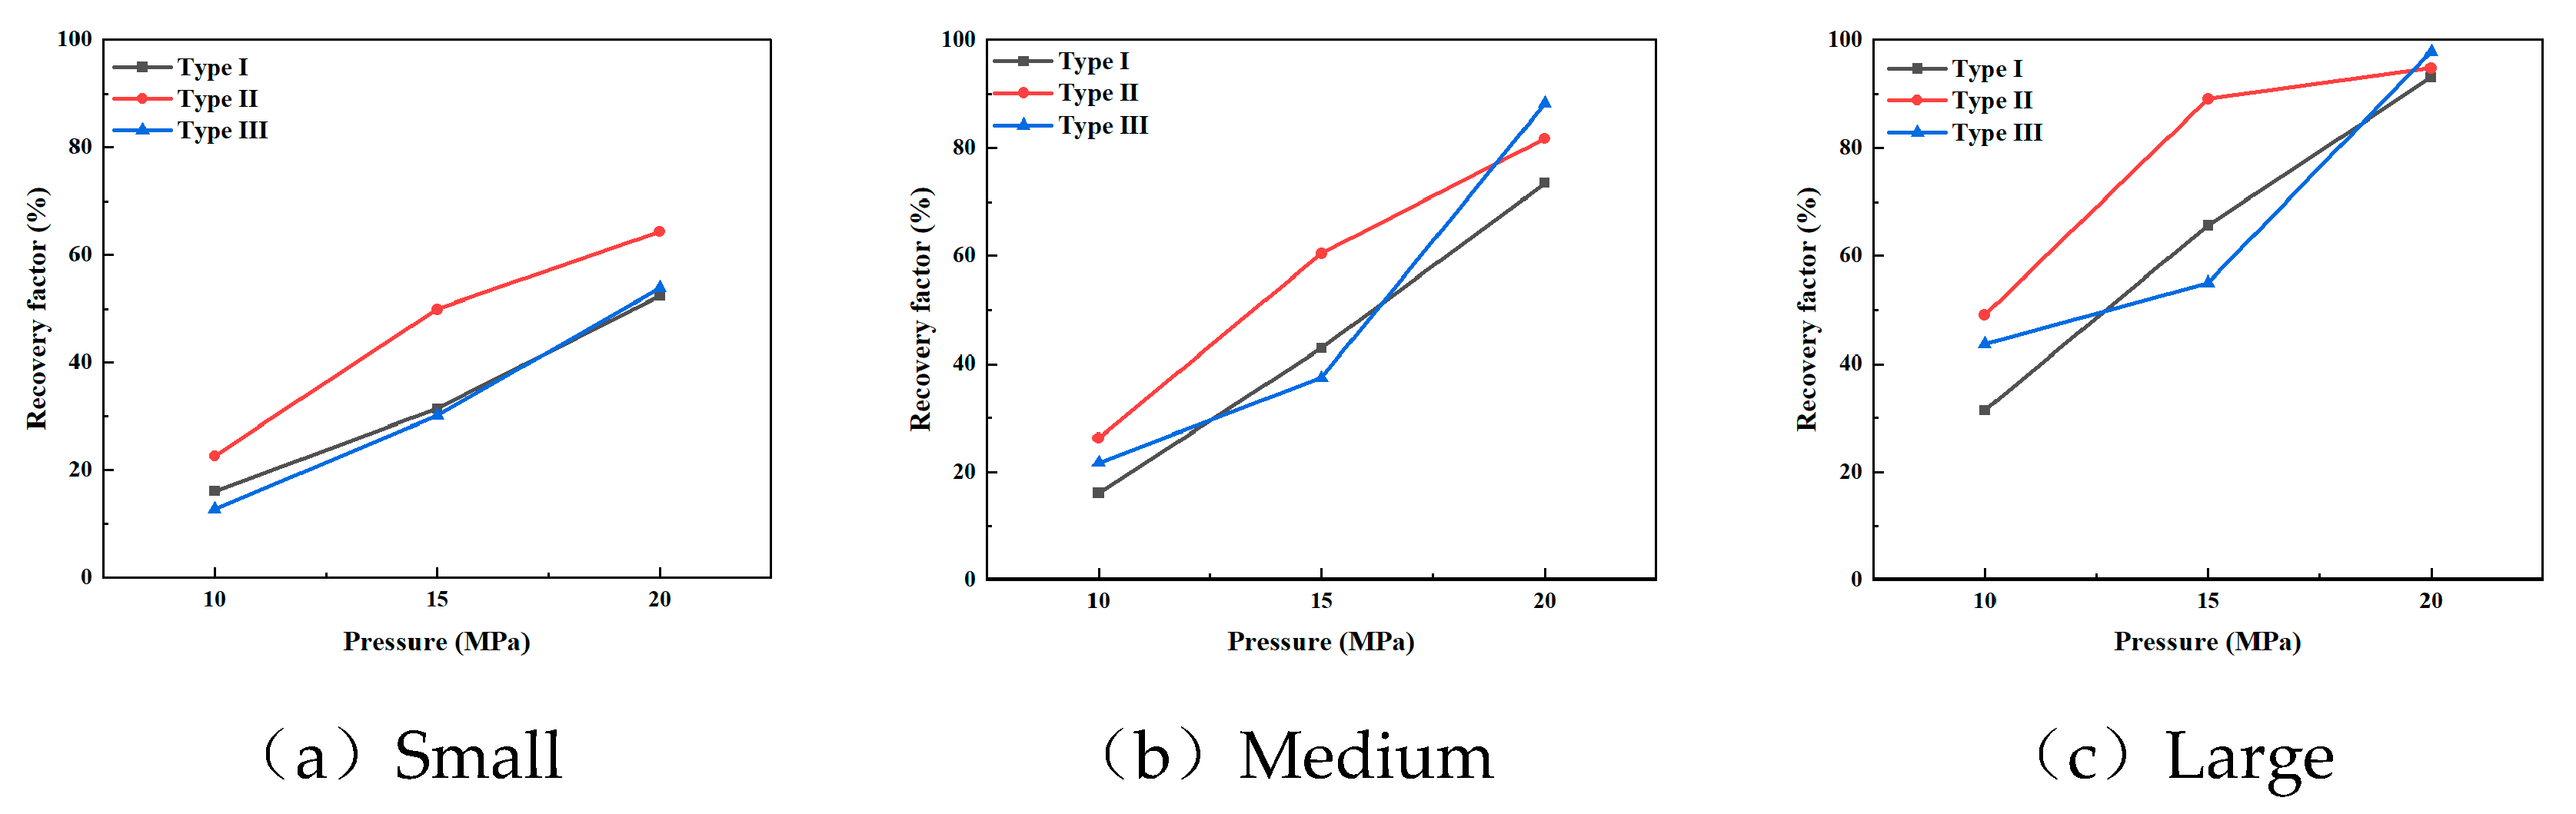
Figure 10.
CO2 flooding after D2O flooding of type I sample.
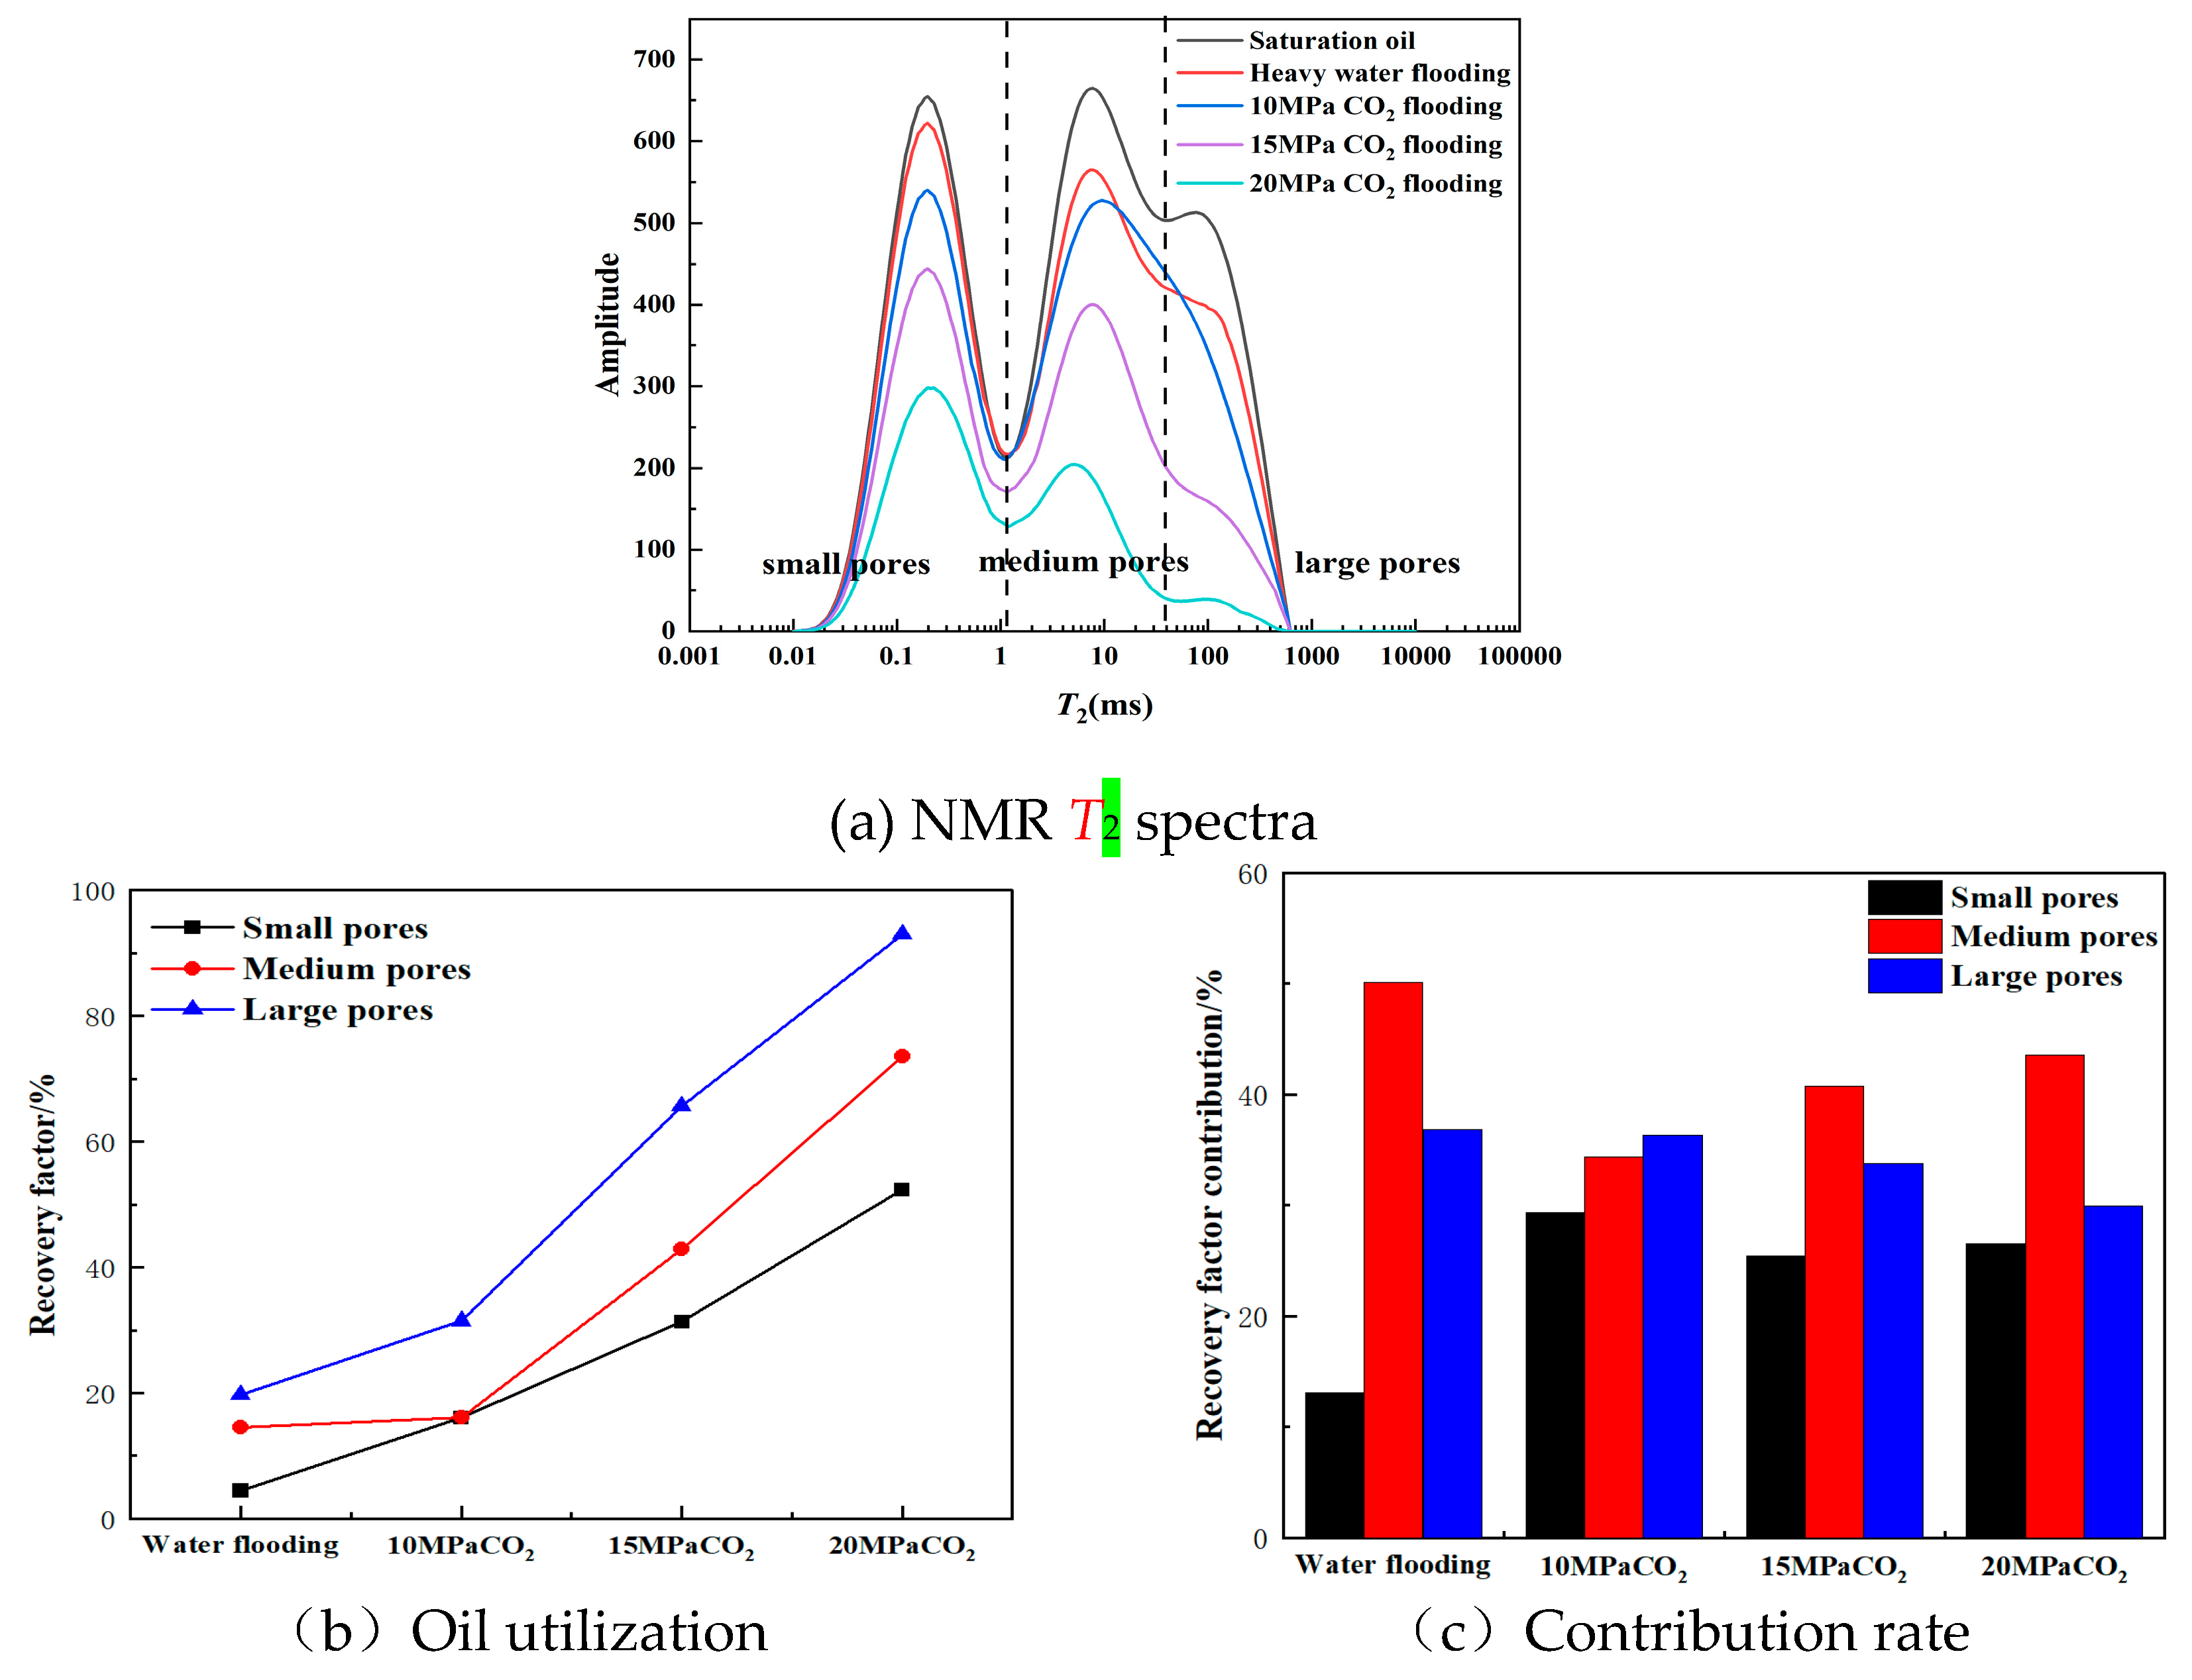
Figure 11.
CO2 flooding after D2O flooding of type II sample.
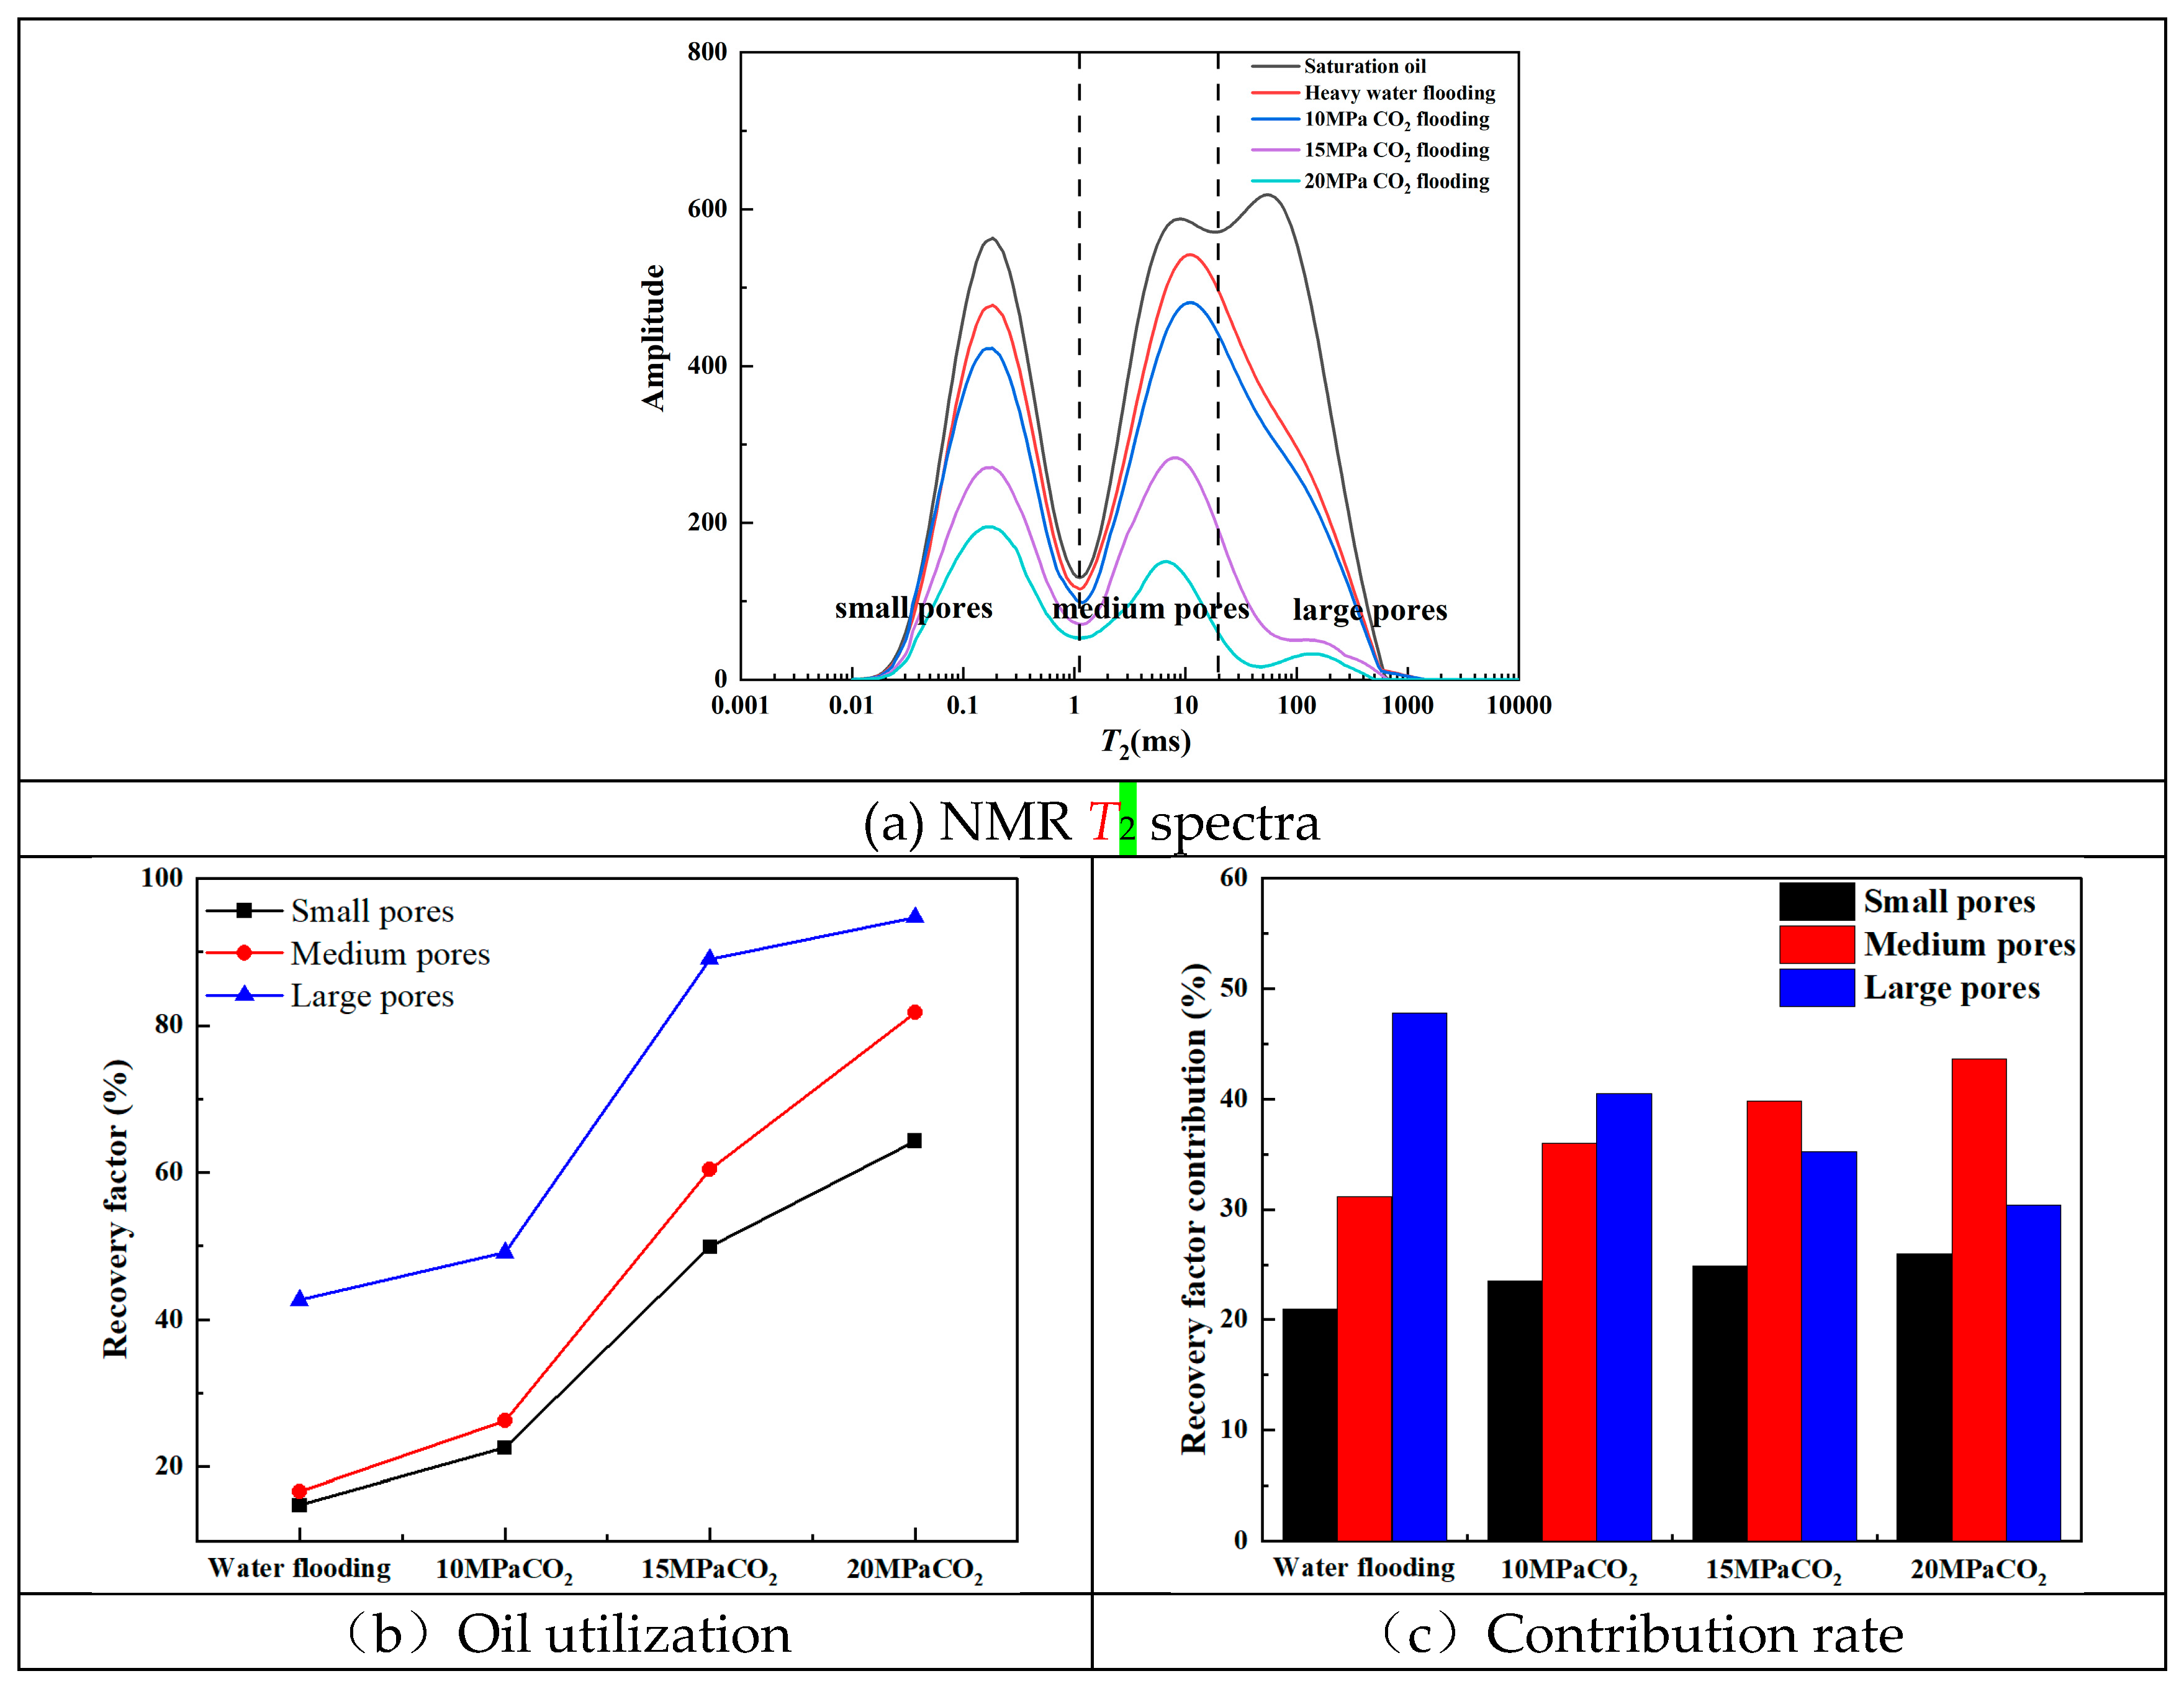
Figure 12.
CO2 flooding after D2O flooding of type III sample.
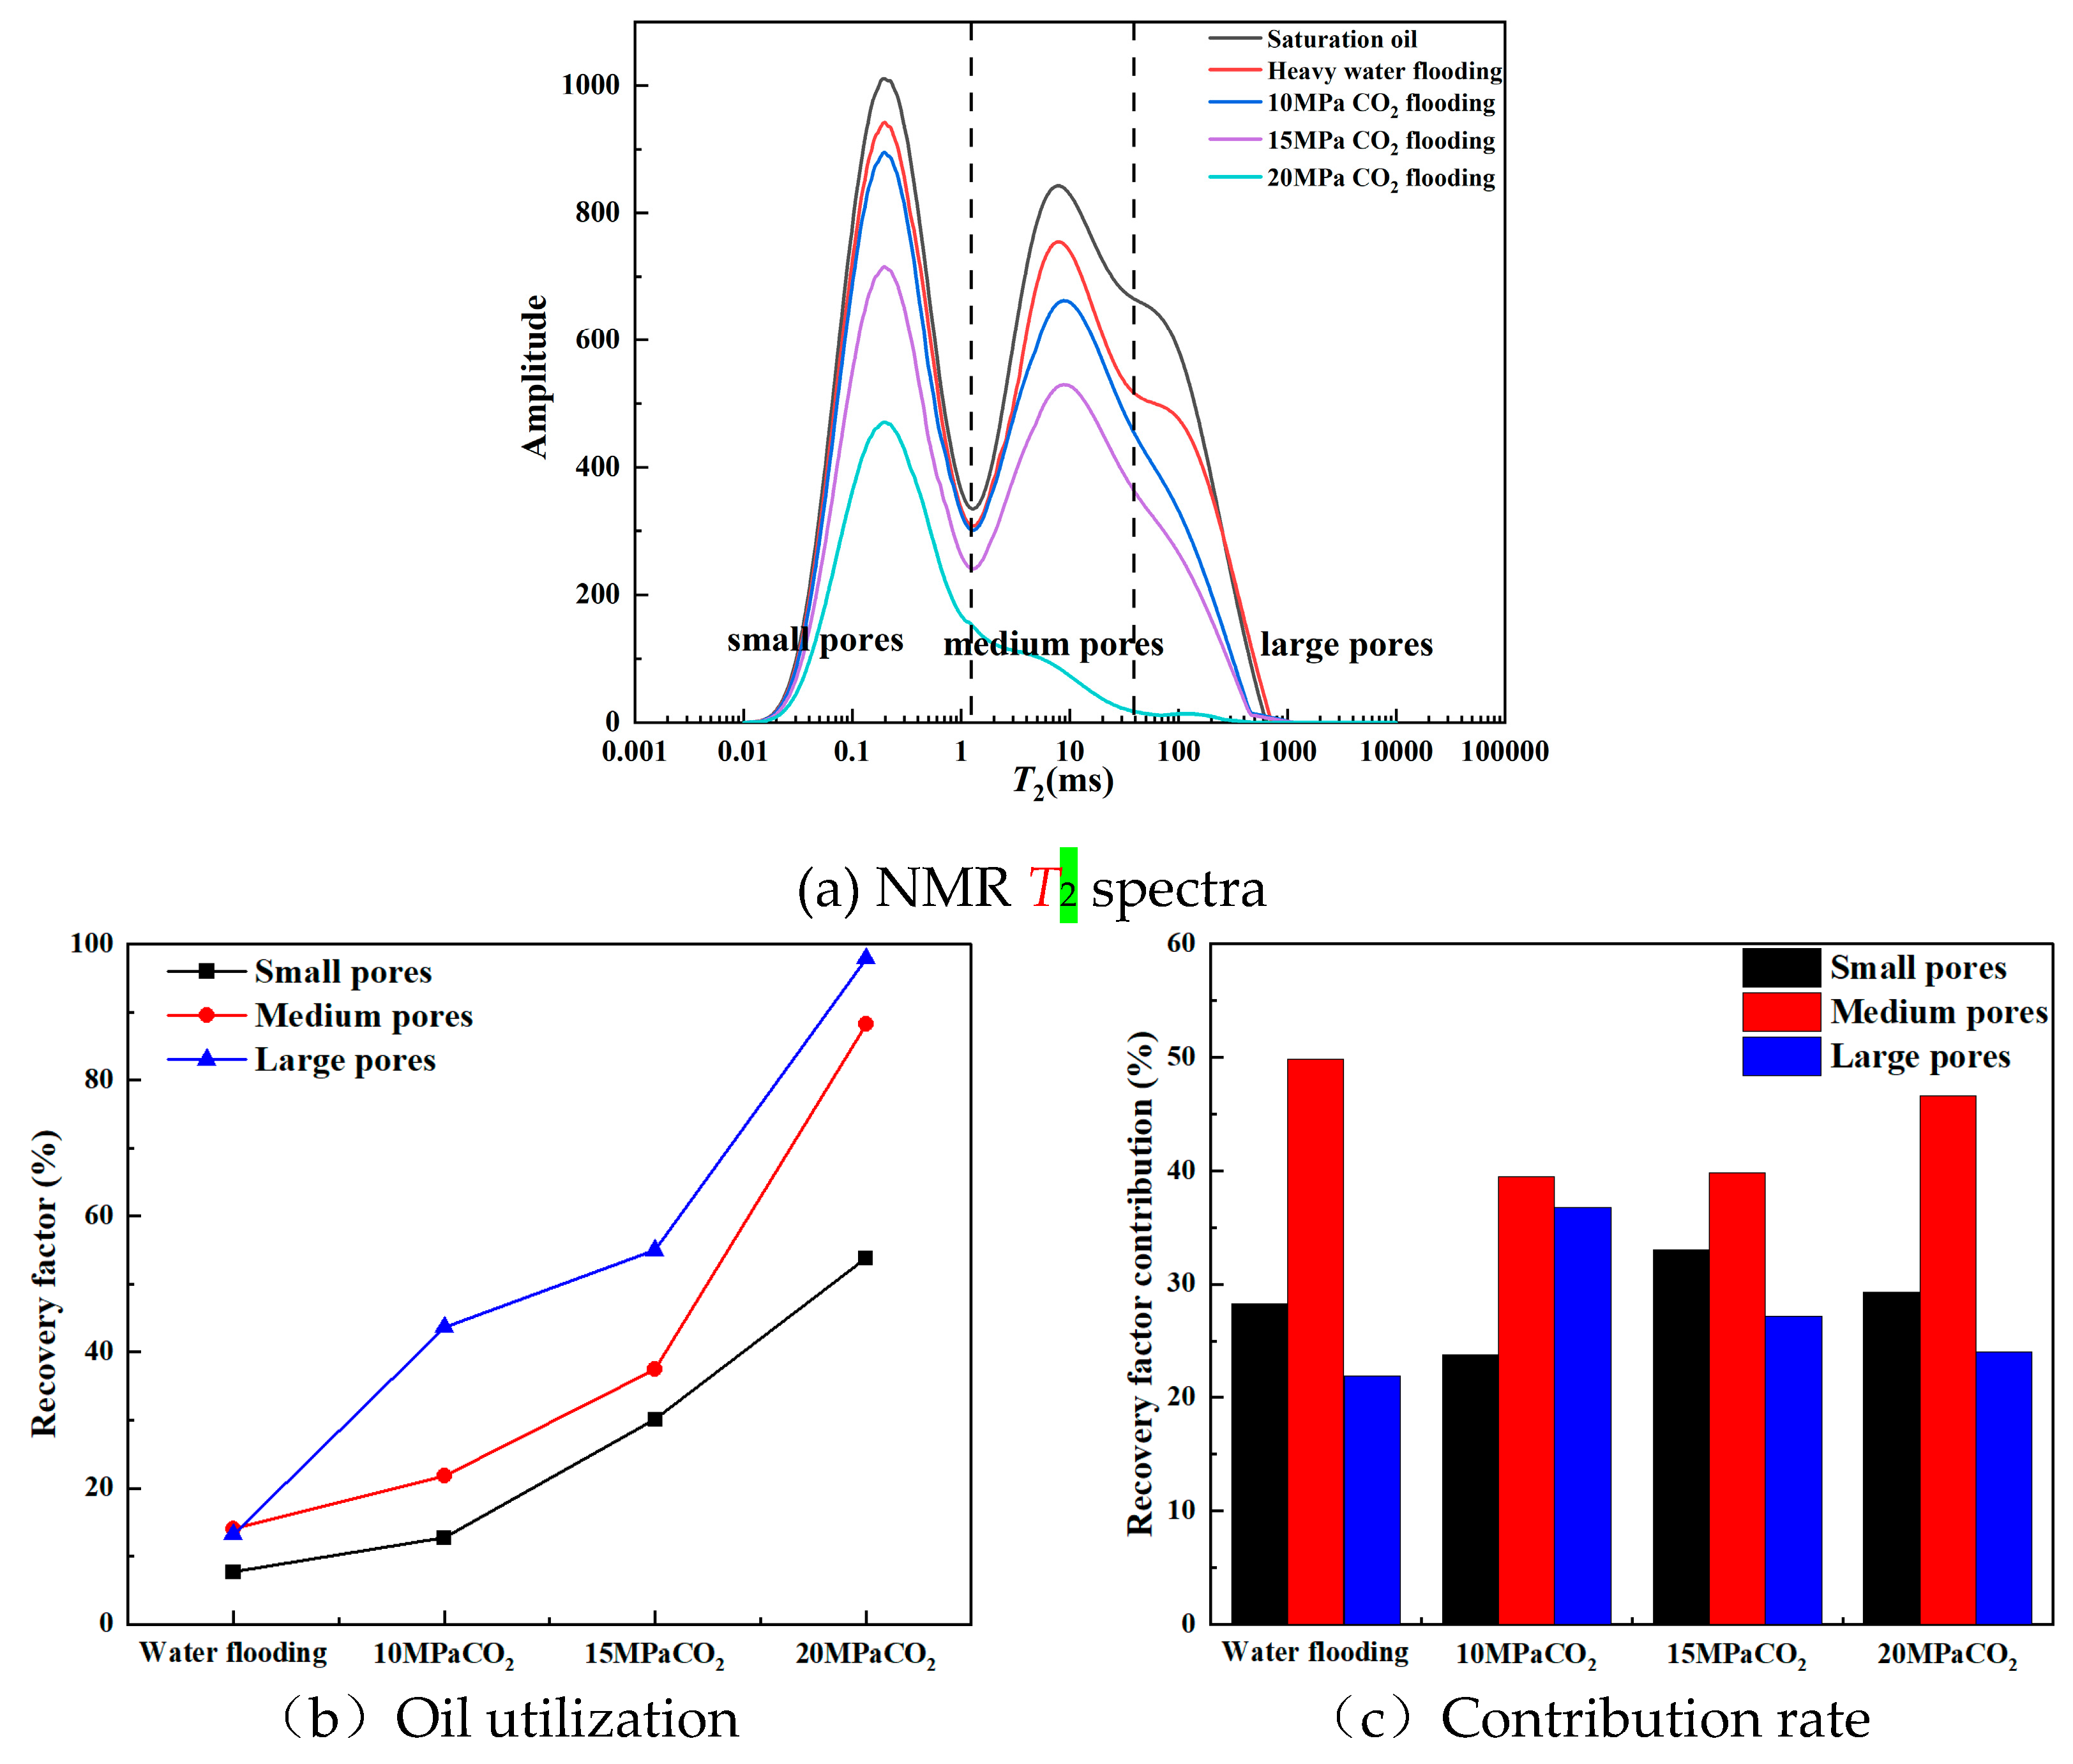
Figure 13.
Residual oil distribution after different flooding methods of three types of models.
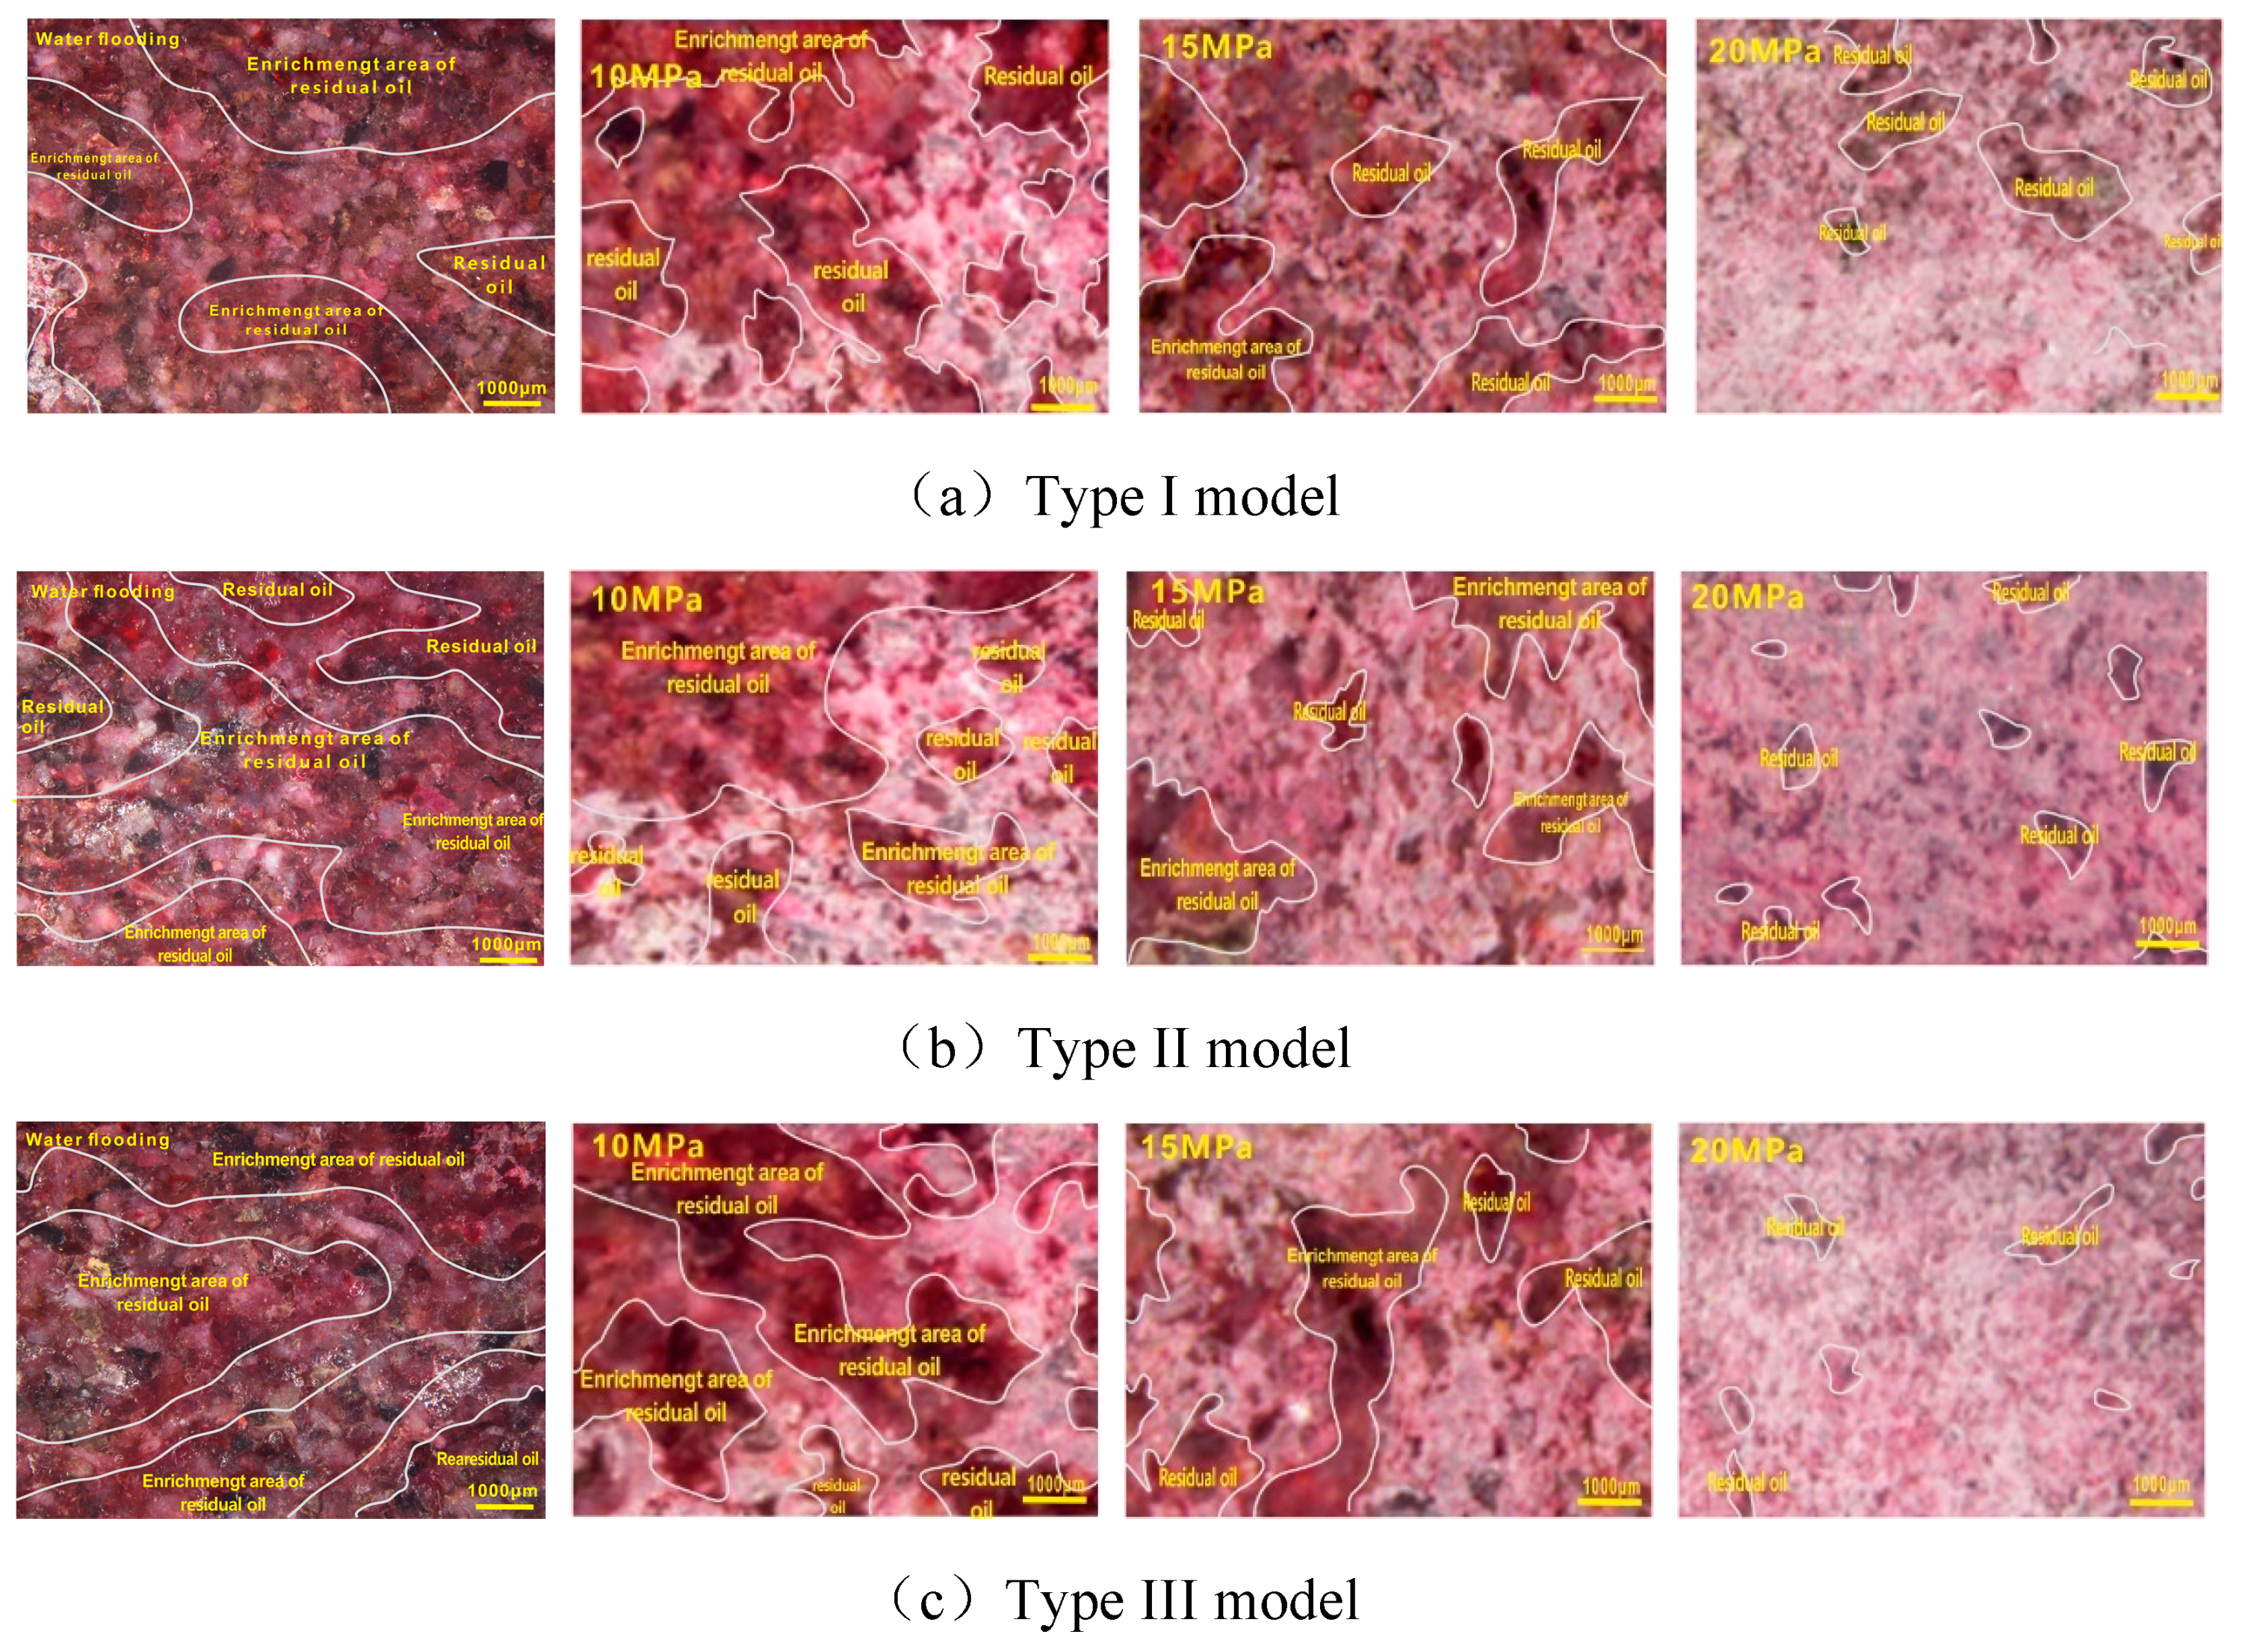
Figure 15.
Percentage of different residual oil types in three types of core samples.
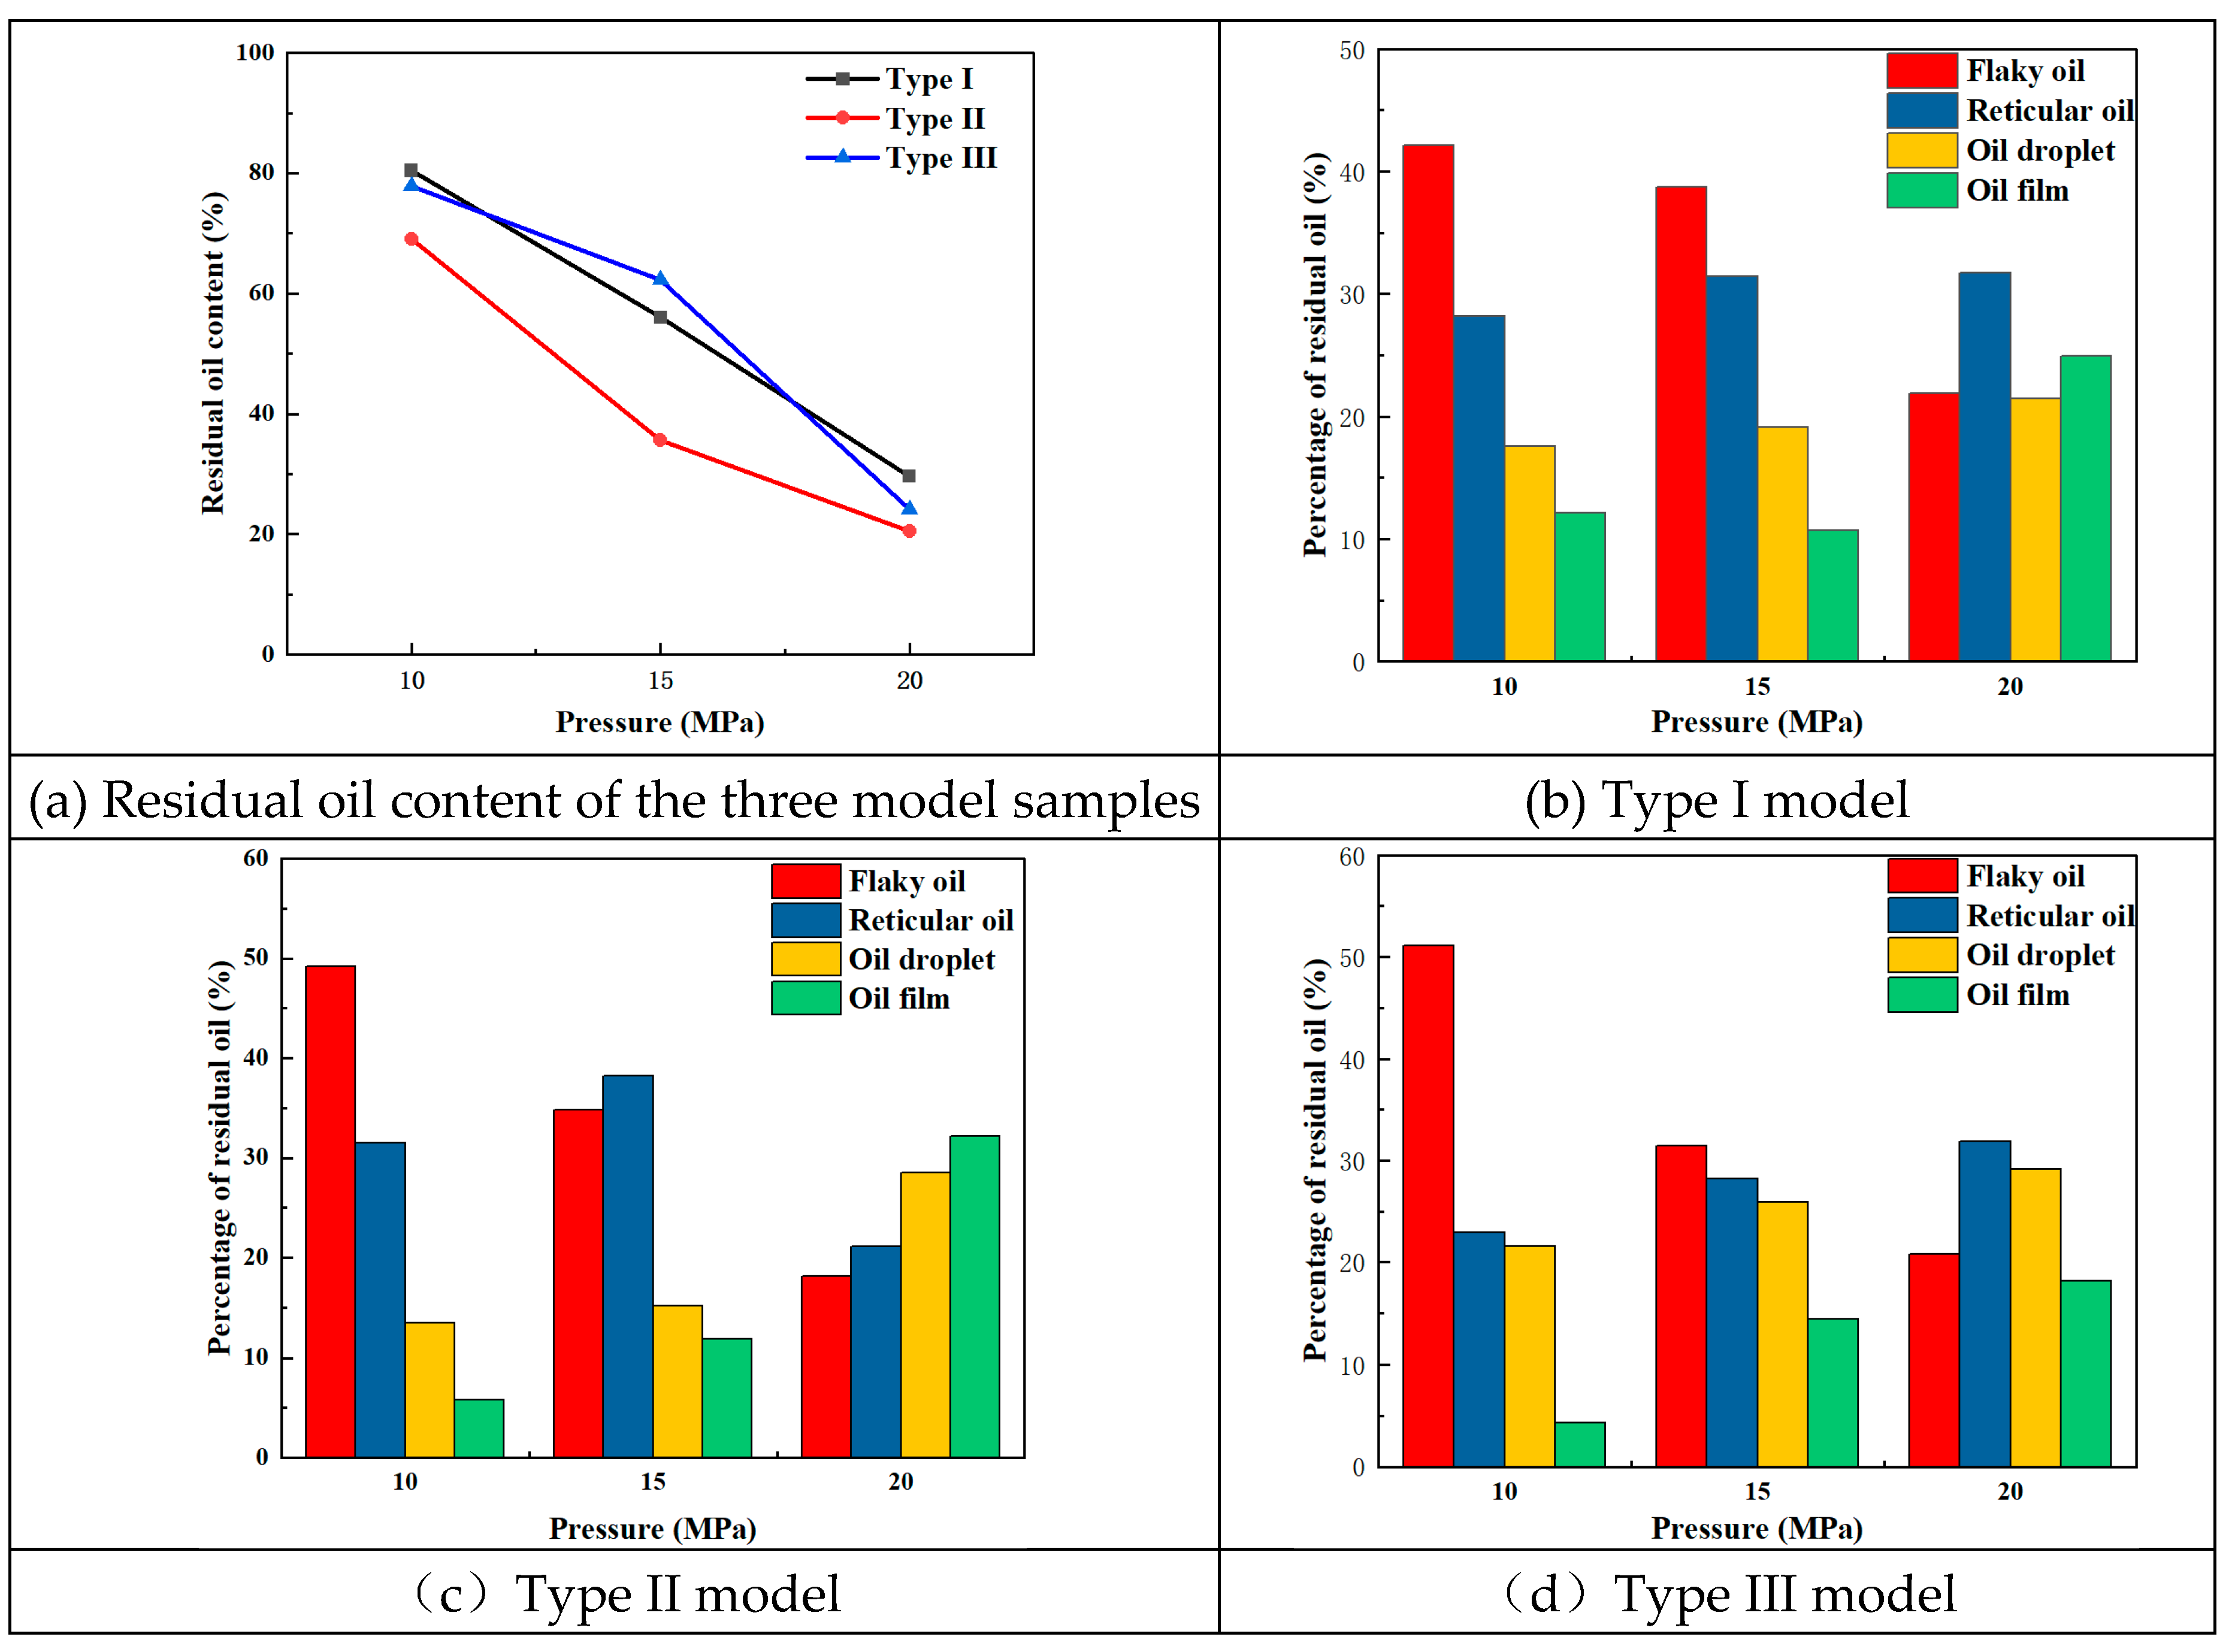

Table 1.
Classification of the Chang6 reservoir pore samples.[44].
Table 1.
Classification of the Chang6 reservoir pore samples.[44].
| Parameter type | Type I (16cores) |
Type II (23cores) |
Type III (11cores) |
|||||||||
| Range | Average | Range | Average | Range | Average | |||||||
| Physical | Porosity/% | 9.45-13.58 | 10.96 | 8.19-11.61 | 9.12 | 6.87-10.48 | 8.83 | |||||
| Permeability /10-3μm2 | 0.123-0.381 | 0.138 | 0.047 -0.116 | 0.067 | 0.025 -0.043 | 0.031 | ||||||
| Mercury injection | Maximum mercury saturation/% | 86.24-93.81 | 89.25 | 83.87-89.58 | 85.71 | 67.95-88.14 | 74.62 | |||||
| Median pressure /MPa | 2.85-8.56 | 6.97 | 5.65-10.93 | 8.91 | 18.52-38.14 | 31.84 | ||||||
| Threshold pressure /MPa | 0.29-0.97 | 0.58 | 0.87-2.84 | 1.82 | >3.48 | 3.94 | ||||||
| Pore throat radius /μm | 0.27-2.48 | 1.94 | 0.21-1.30 | 0.57 | 0.06-0.46 | 0.24 | ||||||
| Sorting factor | 1.86-2.95 | 2.53 | 1.45-2.51 | 2.21 | 1.39-2.38 | 1.83 | ||||||
| Casting thin section | Pore throat combination | Medium pore Medium-fine throat | Small pore Medium-fine throat | Fine pore Micro-fine throat | ||||||||
| Pore type | Intergranular pore - solution pore | Intergranular pores -a small amount of corrosion pores | Corrosion pore – a small number of intergranular pores | |||||||||
| Comprehensive reservoir evaluation | Good | Medium | Difference | |||||||||
Note: Values below "/" are averages.
Table 2.
Basic parameters of typical core samples.
| Sample type | Core number | Length(cm) | Diameter(cm) | Permeability(mD) | Porosity(%) |
| Type I | 11-1 | 5.75 | 2.52 | 0.158 | 11.784 |
| Type II | 10-2 | 5.35 | 2.53 | 0.0886 | 10.190 |
| Type III | 20-8 | 6.02 | 2.53 | 0.0311 | 8.474 |
Table 3.
Recoveries of three cores samples.
| Recovery of CO2 flooding after D2O flooding |
10MPa | 15MPa | 20MPa | |||
| Current (%) |
Increase (%) |
Current (%) |
Increase (%) |
Current (%) |
Increase (%) |
|
| I类 | 19.57 | - | 43.95 | 24.37 | 70.39 | 26.44 |
| II类 | 30.91 | - | 64.33 | 33.42 | 79.46 | 15.13 |
| III类 | 22.12 | - | 37.69 | 15.56 | 75.84 | 38.16 |
Disclaimer/Publisher’s Note: The statements, opinions and data contained in all publications are solely those of the individual author(s) and contributor(s) and not of MDPI and/or the editor(s). MDPI and/or the editor(s) disclaim responsibility for any injury to people or property resulting from any ideas, methods, instructions or products referred to in the content. |
© 2024 by the authors. Licensee MDPI, Basel, Switzerland. This article is an open access article distributed under the terms and conditions of the Creative Commons Attribution (CC BY) license (http://creativecommons.org/licenses/by/4.0/).
Copyright: This open access article is published under a Creative Commons CC BY 4.0 license, which permit the free download, distribution, and reuse, provided that the author and preprint are cited in any reuse.


