
Submitted:
14 March 2024
Posted:
20 March 2024
You are already at the latest version
Abstract
Thunderstorms endager life and infrastructure. Accurate and precise prediction of thunderstorms are therefore helpful to enable protections measures and to reduce the risks. This manuscript presents the latest developments to improve thunderstorm forecasting in the first few hours. This includes the description and discussion of a new Julia-based method (JuliaTSnos) for the temporal extrapolation of thunderstorms and the blending of this method with the numerical weather prediction model (NWP) ICON. The combination of ICON and JuliaTSnow attempts to overcome the limitations associated with the pure extrapolation of observations wit Atmospheric Motion Vectors (AMVs) and thus increase the prediction horizon. For the blending the operational ICON-D2 is used, but also the experimental ICON-RUC, which is performed with a higher data assimilation update cycle. The blended products are evaluated against lightning data. The Critical Success Index (CSI) for the blended RUC product is higher for all forecast time steps. This is mainly due to higher resolution of the AMVs (prediction hours 0-2) and the rapid update cycle of ICON-RUC (prediction hours 2-6). The results demonstrate the potential of the rapid update cycle to improve the short term forecasts of thunderstorms. Also the transition between AMV driven nowcasting to NWP is much smoother in the blended RUC product, which points to the advantages of fast data assimilation for seamless predictions. The CSI is well above the critical value of 0.5 for the 0-2 hour forecasts. However, also with RUC the CSI drops below 0.5 as soon as the last forecast is more than 3 hours away from the last data assimilation, indicating the lack of the model physics to accurately predict thunderstorms. This lack is simply a result of chaos theory. Within this scope the role of NWP in comparison with Artificial Intelligence (AI) is discussed and it is concluded that AI could replace physical short term forecasts in the near future.
Keywords:
thunderstorms
; cumulonimbus
; convection
; nowcasting
; lightning
1. Introduction
Thunderstorms, which are also referred to as Cumulonimbus clouds (Cb), occur frequently during the summertime in many regions of the world. They are often accompanied by wind gusts, heavy precipitation, hail and turbulences. These weather events can lead to serious local floods, harvest failures and damages to infrastructure. Further, people all around the world are regularly killed by lightning strokes. In aircrafts passengers are well protected against lightning as a result of the phenomena known as Faraday cage. However, thunderstorms are usually associated with tubulences and those are one of the most common reasons for injuries in aviation. These examples illustrate that it is important to know the occurrence and expected severity of Cbs well in advance in order to protect infrastructure and human life.
Thunderstorm detection and monitoring is offered by operators of lightning detection networks, see [1,2,3,4,5,6]. However, these services are commercial and do not use satellite information for the nowcasting of thunderstorms. Nowcasting is referenced here and throughout the manuscript as the temporal extrapolation of observations for 0-2 hours. In Europe one of the first entities who provided software for a satellite based thunderstorm nowcasting was the Nowcasting Application facility (NWC-SAF) [7], but for the application at DWD this software was not suitable as discussed in detail in [8]. As a result, the NowCastSat-Aviation (NCS-A) method was developed and implemented at Deutscher Wetterdienst as an operational 24/7 product at DWD’s High Performance Computer (HPC) with ecflow[9].
NCS-A provides near real-time detection and predictions of convective cells across the global domain using geostationary satellites in combination with lightning data and information from numerical weather prediction. The satellites used for NCS-A are METEOSAT, the European METEOrological SATellite [10], GOES, the US Geostationary Operational Environmental Satellite [11] and HIMAWARI [12], which means sunflower in English. In 2023 the weather satellite GK2A [13] operated by the Korean Meteorological Administration (KMA) was added. Lightning data from VAISALA [2,3,4,5,6] is used to highlight heavy convection and to reduce the false alarms and missed cells during the detection step, which would be incurred if only satellites were used. The GLD360 data covers the complete globe and is based on Broadband VLF Radio Reception [14].
The NCS-A product is provided in 3 different severity levels. The light and moderate severity levels are defined mainly by the brightness temperatures derived from the SEVIRI water vapour channels. Light convection is defined for satellite pixels with a brightness temperature difference of the water vapour channels () larger then -1 and a convective KO index of less than 2. The later condition is used to reduce false alarms as not all cold clouds are thunderstorm clouds, see [15] for details. The KO index is derived from the numerical weather prediction model ICON [16]. For the moderate convection the clouds needs to be colder, in detail greater than 0.7 for the difference in the water water channels () and greater than 2 for the BT difference of the water vapour channel and the window channel (). The latter condition can be used to identify overshooting tops , which are an indicator for strong updrafts associated with severe turbulences and hail [17,18,19,20]. The occurrence of lightning data is a prerequisite for the classification of the severe level. As a consequence, the severe level is usually surrounded by the light or moderate level. All lightning measurements occurring 15 minutes before the end of the latest satellite scan are taken into account. For the nowcasting two subsequent satellite images of the water vapour channel (ca 6.2 ) from different geostationary satellites are used. These images are fed into the optical flow method TV-L1 [21], which is provided as part of OpenCV [22,23]. The latest image is then extrapolated in time based on the estimated atmospheric flow. Forecasts are calculated every 15 minutes and cover lead times up to to 2 hours after the latest satellite scan with a temporal resolution of 15 minutes and a spatial resolution of 0.1 degree (ca 10 km). The nowcasting, including the processing of the satellite, lightning and NWP data, is performed with a software package developed at DWD referred to as Geotools. The Geotools package is written in python, using pytroll [24] for reading of satellite data and georeferencing of the satellite data. More detailed information about NCS-A can be found in [8]
Another global Cb nowcasting product is based on Convective Diagnosis Oceanic (CDO) algorithm. It is used to detect the area of thunderstorms that are most hazardous for aviation by a combination of geostationary satellite-based data and ground-based lightning data. A simple fuzzy logic approach is used to combine the information from different input fields. The CDO input fields are the cloud top height, the Global Convective Diagnosis [25], the Overshooting Tops Detection algorithm [17] and the EarthNetworks global, ground-based lightning detection network [26]. On a regional scale radar data can be used for nowcasting as well, e.g NowCastMIX-Aviation (NCM-A) [27].
Atmospheric Motion Vectors (AMVs) are typically used to predict the movement of cloud objects in satellite based physical nowcasting methods, whereby at least 2 subsequent satellite images are needed for their calculation. Different methods can be applied for the calculation of the AMVs, as discussed in more detail in [28]. In modern applications AMVs are typically gained from optical flow methods. DWD has quite good experience with modern computer vision techniques, e.g. [21,29,30]. They can be easily adapted to the different application fields as they provide a dense vector field based on a multi-scale approach. The parameters can be optimised for the respective application. Optical flow is used at DWD for the nowcasting of thunderstorms [8], turbulence [31], solar surface irradiance [28] and precipitation/radar [27,32].
Yet, temporal extrapolation with AMVs only considers the movement of cells. Life cycle features, e.g. the dissipation or development cells, are not captured. However, a typical feature of convection is that the cells do not stay constant, but grow or dissipate. Hence, a central assumption of optical flow is violated, namely, that the intensity of the objects do not change. Thus, atmospheric motion vectors are not only limited by the fact that they are only describing the movement, but also by an increase of errors in the estimated advection in the presence of strong convection. Thus, the number of false alarms and missed cells increases considerably as the forecast time increases. The critical value of around 0.5 is usually reached for CSI after 90 minutes of prediction time and then drops off rapidly, regardless on the chosen optical flow method, see e.g. [8,33]. This limitation is an inherit feature and applies to all atmospheric motion vector methods as illustrated in Figure 1 and motivated further developments to improve the accuracy and extend the forecast length. This includes adjustments of the nowcasting and the combination with numerical weather prediction.
Within this scope the manuscript provides an overview about recent developments concerning thunderstorm prediction at the DWD. In the first part (Section 2.1) purely data driven thunderstorm nowcasting will be discussed with a subsection for cloud top height information, which is a typical companion for thunderstorm nowcasting. Afterwards in Section 2.2 the analysis of the NWP ensembles is presented, which is used to prolong the data driven nowcasting to 0-6 hours. In order to combine the nowcasting and the NWP based forecasts a blending method is needed, which is described in Section 2.3. The evaluation of the resulting 0-6 hour forecasts is discussed in the Section 3. The paper closes with a discussion of the evaluation results and a conclusion, whereby also the strength and weakness of the physical approach is discussed in relation to data driven AI based nowcasting approaches, e.g. [33].
2. Materials and Methods: 6-Hour Forecast of Severe Convection
The prediction of thunderstorms for the time range of 0-6 hours is done by a combination of the Lightning Potential Index (LPI) of the numerical weather prediction model ICON and the observational based nowcasting of thunderstorms. In the following the methods to generate the 0-6 hour forecasts are described in more detail. First, the nowcasting method is described, followed by a description of the analysis of the ensembles and the method for the blending.
2.1. The Nowcasting Method
In order to enable a good basis for the transition of the nowcasting to the analysis of the Lightning Potential Index (LPI) the NCS-A approach has been modified. This was also done to test further potential improvements of the method and the Julia programming language (www.julialang.org, [34]) which promises higher computing performance compared to python. This in turn is of great importance for big data applications. The python based NCS-A method needs almost 15 minutes in 10 km resolution (geostationary ring) and 8-12 after optimization, which is some kind of a show stopper for the use of the new capabilities provided by MTG/FCI [35]. Below the main difference of the JuliaTSnow nowcasting method compared to NCS-A are discussed.
The nowcasting method JuliaTSnow was developed explicitly for thunderstorms. Thus, deep convection without the occurrence of lightning strokes are not covered by the method. As mentioned, the LPI is used as a proxy for thunderstorms on the model side. Thus, the basis for the detection of thunderstorms in the nowcasting part is based on lightning as well. This is a significant difference compared to NCS-A, where light and moderate convection can be classified without the occurrence of flashes.
Further, the optical flow method TV-L1 is replaced by Farnebäck, which works reasonable well for thunderstorms. Farnebäck is faster and more robust concerning static cells, but unfortunately also more sensitive to changes in intensities than TV-L1. Basically, two subsequent images of the brightness temperature differences of the water vapour channels are used [15] () for the calculation of the optical flow. However, the optical flow method expects images within the range of 0-1, hence, the BT differences are normalized with a maximum value of 10 and a minimum of -4. The range is defined in order to focus on medium to optical thick clouds. This improves the quality of the AMVs, but increases also the computing speed.
Finally, the severity is defined in another manner. In both methods the severity depends on how cold the clouds are, beside others as a consequence of the relation between severity and brightness temperature, e.g. [36]. NCS-A comes with 3 severity levels, but the JuliaTSnow provides continuous values from 0-1 for the severity of thunderstorms. The severity is defined as follows.
is the severity, are the normalized brightness temperature differences for the pixels at location i,j.
The JuliaTSNow approach provides TS nowcasting for Europe and Africa and needs only 2 minutes for the completion of the nowcast. The occurrence of at least one lightning event within a 10 minute interval and a search radius of 1 pixel is the precondition for the detection of a thunderstorm cell. JuliaTSnow is operated in two modes. First as a stand alone tool covering Europa, Africa and the surrounding oceans. In this mode the global GLD360 lightning data [2,3,4,5,6] is used. The respective TS nowcasting (0-90 minutes) is available on the DWD data server as a stand-alone product in 15 minute and 0.05 degree resolution in cf conform netcdf format [37].
In the other mode only central Europe is covered and this mode is operated for the data fusion with ICON-D2 and ICON-RUC, see Section 2.3. This region is well covered by the regional LINET data [1,38], which offers a higher density of lightning data. This is an advantage for blending with ICON. As a consequence of the combination with ICON the forecast horizon is extended to 0-6 hours in this mode. The respective data is not available on open data.
Information about the cloud top height of thunderstorms is an important information for many application, including thunderstorm nowcasting, thus a smart CTH approach is briefly described below.
2.1.1. Prediction by Visual Inspection - Cloud Top Height
The cloud top height is well suited for the visual analysis and nowcasting of thunderstorms and weather impacting clouds and offers in more generally the option of an early detection of developing convection. It is one of the most used satellite based products for the visual inspection of the development of thunderstorms at DWD.
Further, in many applications, in particular dealing with aviation, the severity information of the thunderstorms or severe convection is accompanied by cloud top height information. Also, NCS-A provides a cloud top height information for deep convection, whereby a NWP filter is applied for the light convection. However, the aviation customers asked for height information for all optical thick clouds without NWP filtering in order to get a global scan of weather active zones into the cockpit as well. For this reason a cloud map option has been added to NCS-A with the discrete distinction between low, medium and high clouds see Figure 2.
Before a CTH can be calculated a cloud mask is needed. As the focus of the CTH product for aviation lies on optical thick clouds the Brightness Temperature Difference (BTD) of the water vapour channels with BTD threshold of about -8 to -10 can be used [17,39]. Optical thick clouds are opaque in the IR. Hence, in good approximation, the observed BT equals the temperature of the cloud top. For opaque clouds, the cloud top height can be defined as follows:
Here, is the brightness temperature of the IR window channel (∼ 10.8 ), and are the temperature and height of the tropopause from numerical weather prediction model ICON [16] or likewise climatologies. LR is the Lapse Rate and is set to 8.0 [K/km] for NCS-A [8,15,31].
For the aviation specific CTH product three height levels were defined from user requirements of NCS-A users, which are FL250(7.6km), FL325(9.9km) and FL400(12.2km). The following CTHs and BTD thresholds are used for the definition of the three levels. Cloud heights greater than FL400 should indicate areas where flying over the clouds is not advisable due to a possible stall (coffin corner)
While discrete height information is sufficient for the NCS-A product, continuous CTH products have established themselves in general weather forecasting. Further for the combined use of CTH with radar reflectivities a parallax corrected CTH product is of great benefit. This motivated the development of a stand-alone CTH product for Europe. As this product includes all clouds and not only optical thick clouds a different cloud mask is needed. The respective cloud mask results from the adaptation of the CALSAT method [40] to the Infrared window channel (10.6). As a consequence the Cloud Top Height (CTH) is then calculated for cloudy pixels with equation 2. However, in this case and information comes from standard climatological profiles for the ease of it and to avoid model contamination. Thus, in contrast to other methods no information from Numerical Weather Prediction (NWP) is needed Further, in contrast to NCS-A the lapse rate is assumed to be 6.5 in accordance with ICAO_93. The difference is motivated by the fact that NCS-A is only applied to deep convection whereas the CTH open data product covers all cloud types.
For semitransparent clouds a correction of the CTH is needed which can be done with a method referred to as water vapour H2O- intercept method [31]. The CTH open data product [41] is provided as cf-conform netcdf file in a regular grid, with a spatial resolution of 0.05x0.05 degrees and a temporal resolution of 15 minutes (10 minutes with MTG). The height is given in m. For the combined use with radar data, the CTH product is parallax corrected using a function from the Julia satellite library. This library is available on request. The basic geometric equation in this function are from Eumetsat.
2.2. Thunderstorm Forecast with LPI
Numerical weather models (NWP) contain physics, which allows to simulate the life cycle of cells and with that the dissemination and development of cells. Hence, there might be a potential to improve and extend reliable thunderstorm prediction by blending data driven nowcasting with numerical weather prediction. Of course, due to the complex and partly chaotic thermodynamics the accurate simulation of the processes are quite difficult. A central key to improve the forecast quality is data assimilation, as this forces to model to the real atmospheric conditions. Within this scope one aim is the use of as many observational data as possible in order to define the initial state of the atmosphere for the data assimilation as good as possible. On average, the higher the uncertainty of the initial state the higher the uncertainty of the simulated weather. Also great progress has been done to improve the definition of the initial state, e.g. by the use of the data from new satellite generations, there is still a significant under-determination of the initial state. Further, also the model physics induces uncertainties in the forecasts. To account for these uncertainties weather services implemented the option of ensemble forecasts, which are also used in this study.
Thunderstorms are among the most chaotic phenomenons of weather. Based on the theory of Lorenz [42] it is expected that an higher update cycle of data assimilation leads to a better accuracy in particular for short term forecasts. This will be further investigated and discussed in Section 4 after presentation of the results.
In this study the regional NWP model ICON is used for the combined product. The ICOsahedral Nonhydrostatic D2 [16,43] is a nonhydrostatic model that enables improved forecasts of hazardous weather conditions with high-level moisture convection (super and multi-cell thunderstorms, squall lines, mesoscale convective complexes) due to improved physics in combination with its fine mesh size. The domain of ICON-D2 covers Germany and bordering countries with a spatial resolution of 2.2 km. For ICON-D2 data assimilation is applied every 3 hours, a complete model run needs approximately 2 hours.
ICON-D2 is the current operational model at DWD. It provides meteorological variables every hour for the routine weather forecasts and the DWD open data server. In parallel, numerical experiments were carried out with a Rapid Update Cycle (RUC) of ICON, in which the data assimilation is performed every hour and meteorological variables are provided every 15 minutes.
The processing time is 1 hour, so that forecast are available 1 hour after the start of the respective model run, e.g. at 13 UTC the forecasts from the 12 UTC run are available. This offers a timely availability of the forecast runs with the latest data assimilation step. In addition, a 2 moment micro-physical scheme has been implemented in RUC which improves the cloud physics [44].
As a proxy for thunderstorms the maximum of the lightning potential index () during a given time step is used. The Lightning Potential Index (LPI) is a measure of the potential for lightning in thunderstorms. It is calculated from simulated updraft and micro-physical fields. It was developed to predict the potential of lightning occurrence in operational numerical weather models. The implementation in ICON-D2 and RUC follows the approach of [45]. Further information of the implementation into ICON-D2 are given in [44]. For ICON-D2 it is the maximum during the last hour and for ICON-RUC during the last 15 minutes.
ICON ensembles of D2 and RUC are analysed to define the occurrence and severity of thunderstorms before the blending is applied. The respective analysis is motivated by an approach of Axel Barleben, which is used for a NWP only product provided to MUAC for evaluation purposes. This product is referred to as iCONv from ICON-Convection and is based on operational ICON ensembles [16]. In this product, meteorological variables relevant to convection, specifically lightning, precipitation, hail, reflectivity and wind gusts, are used to define the occurrence and severity of convection. The selection of the variables is motivated by the work of James et al. [27]. The three convection levels are then defined by fuzzy logic. An example of the product is given in Figure 4
However, this approach was modified for the blending with the JuliaTSnow nowcasting and only is used, as this variable already combines meteorological properties that are relevant for thunderstorms. Following a brief description of the modified approach applied for the blending with the nowcasting. If one of 20 members is above a certain threshold, than it is assumed that a thunderstorm exist. The severity is then defined by the number of ensemble members above the threshold, e.g. 10 members out of 20 would lead to a severity of 0.5. This definition is based on the comparison for several cases with the nowcasting described in Section 2.1 in order to adjust the severity levels of both worlds, NWP and observational based nowcasting.
As a consequence of the different micro-physics implemented in RUC, the input information for the calculation of the LPI differs as well. This motivated an different adjustments of the thresholds for the analysis to improve the comparability of the results. For RUC 2.5 is used and for D2 5 .
2.3. The Ensemble Post-Processing and the Blending
In a first step the ensembles of ICON-D2 and ICON-RUC are extracted from the data bank. The ensembles are then processed with the free software fieldextra [46]. Fieldextra is used to estimate the thunderstorm severity as described in Section 2.2 by statistical analysis of the ensemble members. Further it is used to convert the hexagonal original grid to regular latitude longitude gird and the grib format to netcdf.
The closest available NWP-runs in terms of time were used for the blending with the nowcast. As an example, for the blending taking place at 13 UTC , the most readily available ICON-D2 run is that of 9 UTC, as the ICON-D2 takes 2 hours to calculate and new runs only start every 3 hours, so the 12 UTC run is not completed and no earlier run then that of 09 UTC is available. In contrast, the 12 UTC run of ICON-RUC is already available as a new run starts every hour and the calculation time is only 1 hour for RUC. For the 14 UTC prediction, the 12 UTC run of ICON-D2 is ready, hence the 12 UTC ICON-D2 run can be used. However, for RUC the 13 UTC is already ready and can be used. In the first step the blending of nowcasting and NWP was done as illustrated in Figure 5. For D2 this was done based on hourly values. In this case hourly means of the nowcasting has been calculated beforehand. For RUC the 15 minute values were blended. However, in order to enable a comparison with D2 hourly values of the blended product were calculated after the blending. Because of the different time resolutions of RUC and D2 different blending methods were used, see Figure 5 for further details. For both approaches the climate data operators were used [47]
Please note that the blended product is calculated every hour for the complete forecast horizon of 6 hours.
3. Results
3.1. Validation of the Operational Nowcasting
The data fusion of nowcasting and ICON was done in a pre-operational environment. As a result RUC shows data gaps. Only time steps are used in the validation where both RUC and D2 where available.
For the statistical analysis of the forecasts (up to 6h) established skill scores are used. In detail, the probability of detection (POD), the false alarm ratio (FAR) and the critical success index (CSI) [15,27,48]. These skill scores are based on 2x2 contingency tables [49] and are determined by the comparison of the predicted thunderstorms to the measured lightning. For the definition of hits, missed or false alarms an object based [48] or pixel based approach is possible. Validation based on objects is not optimal to consider the size of the Cbs for the evaluation of the scores. That is why the pixel based and object based approaches are combined.
In order not to be too strict with regard to spatial uncertainties of the forecasts, a distance of 0.3 degree between the combined forecast product and the lightning measurements are accepted and counted as intersect. This distance of 0.3 degrees considers also the recommendation of the American Air Safety Authority FAA, according to which aircraft should keep a lateral distance of 20 miles to thunderstorms. A hit is counted when lightning occurs within the search radius of a predicted thunderstorm, else it is counted as false alarm. Thunderstorms are defined as missed if lightning occurs, but no thunderstorm is predicted within the search radius of 0.3 degree. The skill scores are calculated for each time step (1-6 hours). The evaluation period covers May 2023 to September 2023.
Figure 6 shows the results for CSI and Figure 7 for POD and FAR. The validation results indicate that the blended RUC product performs significant better for the transition between NWP and nowcast, but also for the model only forecast time steps.
The POD is higher throughout all time steps for the blended RUC product. The FAR for the blended D2 product shows a remarkable feature. It is higher for the nowcasting and blending step, but lower than RUC for the model only forecast times. The reason for that lies in the poorer performance of hourly atmospheric motion vectors compared to 15 minute values, which were used for the nowcasting and blending with RUC. Deviation from linear movements of the cells within the hourly time steps are not well represented by the hourly mean AMV values, but much better with the 15 minutes resolution applied for the blending with RUC. Thus on average, the movement of cells is much poorer for the blending with D2 than for the blending with RUC. Of course, this has no effect for the model only time steps, as the internal calculation steps are identical for ICON-D2 and ICON-RUC. For the model only steps (forecast times 3-6) the FAR of D2 is lower than that of RUC, but this can not compensate for the significant lower POD. Thus, the CSI is higher for RUC throughout all time steps.
But, what is the main driver for the significant higher CSI of RUC for the model only time steps. Is it due to the improved micro-physics or the higher assimilation rate. To address this question the CSI is diagrammed over the lead time of the different model forecast steps in Figure 6. For this figure this the mean lead time is used for the time axis. For RUC every hour a new run with assimilation is started, hence the lead time corresponds to the forecast time step given in Figure 6 plus 1 hour. For ICON-D2 the average lead time is the forecast time step plus 3 hours, as a result of the 3 hourly calculation interval and the 2 hourly calculation time. For illustration, the 11 UTC ICON-RUC model run is available for the blending starting at 12 UTC, but the closest available ICON-D2 run in terms of time is the 09 UTC run. Hence, for the respective 15 UTC forecast (3h forecast time) the lead time for RUC is 3+1 h (11 to 15 UTC ) and for D2 3+3 h (09 to 15 UTC). This results in the CSI over lead time as shown in Figure 8. Please note, for this comparison only the model only time steps of the blended products were used.
The CSI applied over lead time shows a linear transition between D2 and RUC. Thus, from this point of view D2 and RUC perform equal. Thus, this is clear hint that the main driver for the improvement of ICON-RUC is the higher data assimilation rate and not the improved micro-physics. Or in other words, the accuracy is data driven. The difference in FAR and POD are induced by the slightly lower threshold of LPI for D2 and RUC. The consequences will be further discussed in the next section.
4. Discussion
The results indicate that the higher CSI scores of ICON-RUC are mainly due to the higher update cycle of the data assimilation. This is supported by the theory of Lorentz [42] and well established knowledge about chaos theory. Within this scope it is well known that the model errors increases rapidly at convection-permitting scales [50]. This explains why the information from the observations gets rapidly lost. It is therefore obvious that a higher update cycle of the data assimilation and a more accurate definition of the initial state of the atmosphere are the main driver for improving NWP model-based 0-6h predictions. Inconcsistensies in the model physics could amplify these effects.
For these reasons a central question is: Wouldn’t it be better to carry out deep learning if the accuracy of the model system is determined by observations anyway and the NNP could devalue useful observations ? In other words, would it not be better let the network learn the physics from the observations. Indeed the results of deep learning provided in Brodehl et al. [33] indicates that higher skill scores without any model physics can be achieved for short term forecastin than with state of the art NWP models. Also for other model parameters and medium term forecast it has been shown that artificial intelligence can beat NWP [51,52]. Of course, reanalysis data will continue to be very important, as reanalysis provides a consistent and rectified 4-D data cube for the training of AI. But, what is the future of numerical weather prediction ?
It is likely that numerical weather prediction in its current form will be replaced by data driven AI models, within the ongoing AI revolution [53]. However, until then, it is important that data assimilation is improved. In addition to rapid updates of the assimilation, the description of the initial state as complete as possible is also extremely important. In case of thunderstorm forecasts the description of the initial state, and with that the ICON forecasts, could be improved by assimilation of lightning data, e.g. [54].
However, the training of AI is not a trivial task and needs man and computing power. Further, regular retraining is needed. For this purpose an appropriate infrastructure, concerning both computer hardware and human resources are needed. The weather services are currently in a transition phase, as both the computer infrastructure and stuff are not optimally suited for AI. It is known from the social sciences that fundamental changes meet with resistance and that people have a tendency to cling to the old ways. On one hand, this constitutes a protection against hasty changes, but it can also slow down innovation and necessary changes. Applied to weather services, it could be that the NWP enthusiasts are sticking to numerical weather prediction for too long. Yet, the customers are likely not taking care about the method behind, but are interested in the quality of the products and services. Thus, it could be that many products and services of traditional weather services will become obsolete if they miss the train of the AI revolution [53] .
5. Conclusions
The blending of the nowcasting with RUC shows higher CSI scores throughout the forecast horizon of 0-6 hours. A higher update cycle for the calculation of the Atmospheric Motion Vectors (AMVs) improved the temporal extrapolation of the thunderstorms, which effects the CSI in the first two forecasat hours. From the 3-hour forecast onward only model information is used in the blended product. The higher CSI for this prediction times demonstrates that ICON-RUC outperforms ICON-D2. However, the main advantage of RUC is given by the rapid update cycle, which forces the model more often to come back be to reality. The results confirm that RUC is better suited to enable a smooth transition from observation-based nowcasting to modeling. But, even for the rapid update cycle, the CSI drops below the critical value of 0.5 for the 3 hour forecasts. Compared to AI based nowcasting [33,52] it seems that the ICON model looses the information contained in the observations quite rapidly. Thus, a better way forward to improve the thunderstorm prediction in the 2-6 hour range and to achieve CSI values higher than 0.5 could be a purely data driven solution using artificial intelligence [55].
Author Contributions
Richard Mueller developed the nowcasting, CTH and blending method. Axel Barleben developed the method for the analysis of NWP ensembles. All authors contributed to the writing of the manuscript.
Funding
This research received no external funding.
Data Availability Statement
The thunderstorm nowcasting and CTH data is available at the DWD open data server. https://opendata.dwd.de/weather/satellite/clouds/
Acknowledgments
The authors would like to thank the following people for their valuable feedback and suggestions that improved NCS-A: L. Lewe, W. Greiner, O. Matz and A. Ritter from Lufthansa Airlines, M. Gerber and J. Vetsch from SWISS Airlines, A. Medlhammer and A. Erhegyi from Lufthansa Systems GmbH. V. Santos and A. Laj from SITA, W. Rumler from PACE Aerospace and M. Schneider from Eurocontrol MUAC.
Conflicts of Interest
The authors declare no conflict of interest.
Sample Availability
Samples of the compounds are available from the authors.
Abbreviations
The following abbreviations are used in this manuscript:
| AI | Articial Intelligence |
| Cb | Comulinmbus Cloud, Thunderstorm |
| CSI | Critical Success Index |
| CTH | Cloud top Height |
| DWD | Deutscher Wetterdienst |
| FAR | False Alarm Ratio |
| GLD | Globale Lightning Detection |
| GOES | Geostationary Operational Environmental Satellite |
| HIMAWARI | Sunslower |
| MDPI | Multidisciplinary Digital Publishing Institute |
| METEOSAT | METEOrological SATellite |
| MSG | Meteosat Second Generation |
| Nowcasting | Extrapolation of observations in time, usually for 0-2 hours. |
| NCS-A | Nowcast Satellite Aviation |
| POD | Probability Of Detection |
| TS | Thunderstorm |
| TV-L1 | Total Variation L1 norm |
| LD | Linear dichroism |
References
- Betz, H.; Schmidt, K.; Oettinger, W.; Montag, B. Cell-tracking with lightning data from LINET. Advances in Geoscience 2008, 17, 55–61. [Google Scholar] [CrossRef]
- Pohjola, H.; Mäkelä, A. The comparison of GLD360 and EUCLID lightning location systems in Europe. Atmospheric Research 2013, 123, 117–128. [Google Scholar] [CrossRef]
- VAISALA. VAISALA GLD360 Global Dataset - Understanding the GLD360 Dataset, V: Corporation, Head Office, 0167; 21.
- Said, R.K.; Cohen, M.B.; Inan, U.S. Highly intense lightning over the oceans: Estimated peak currents from global GLD360 observations. J. Geophys. Res. Atmos. 2013, 118, 6905–6915. [Google Scholar] [CrossRef]
- Said, R.; Murphy, M. GLD360 Upgrade: Performance Analysis and Applications. 2016, 24th International Lightning Detection Conference and 6th International Lightning Meteorology Conference.
- Pessi, A.T.; Businger, S.; Cummins, K.L.; Demetriades, N.W.S.; Murphy, M.; Pifer, B. Development of a Long-Range Lightning Detection Network for the Pacific: Construction, Calibration, and Performance. Journal of Atmospheric and Oceanic Technology 2009, 26, 145–166. [Google Scholar] [CrossRef]
- Autones, F. Algorithm Theoretical Basis Document for Rapid Development Thunderstorms. Technical report, NWC-SAF, 2013.
- Müller, R.; Barleben, A.; Haussler, S.; Jerg, M. A Novel Approach for the Global Detection and Nowcasting of Deep Convection and Thunderstorms. Remote Sensing 2022, 14. [Google Scholar] [CrossRef]
- ECMWF. Ecflow Dokumentation. https://confluence.ecmwf.int/display/ECFLOW.
- Schmetz, J. ; Pili, Tjemkes, P.S.; Just, D.; Kerkmann, J.; Rota, S.; Ratier, A. An introduction to Meteosat Second Generation (MSG). Bull. Am. Met. Soc.
- GOES. GOES-R Series Data Book, 2019.
- BESSHO, K.; DATE, K.; HAYASHI, M.; IKEDA, A.; IMAI, T.; INOUE, H.; KUMAGAI, Y.; MIYAKAWA, T.; MURATA, H.; OHNO, T.; OKUYAMA, A.; OYAMA, R.; SASAKI, Y.; SHIMAZU, Y.; SHIMOJI, K.; SUMIDA, Y.; SUZUKI, M.; TANIGUCHI, H.; TSUCHIYAMA, H.; UESAWA, D.; YOKOTA, H.; YOSHIDA, R. An Introduction to Himawari-8/9; Japans New-Generation Geostationary Meteorological Satellites. Journal of the Meteorological Society of Japan. Ser. II 2016, 94, 151–183. [Google Scholar] [CrossRef]
- KMA. Status Report on the Current and Future Satellite Systems by KMA. Technical report, KMA, 2015. Presented to CGMS-43 Plenary Session, Agenda Item [E.1]; University Corporation for Atmospheric Research (UCAR): Boulder, CO, USA.
- Cohen, M.B.; Inan, U.S.; Paschal, E.W. Sensitive Broadband ELF/VLF Radio Reception With the AWESOME Instrument. IEEE Transactions on Geoscience and Remote Sensing 2010, 48, 3–17. [Google Scholar] [CrossRef]
- Müller, R.; Haussler, S.; Jerg, M. The Role of NWP Filter for the Satellite Based Detection of Cumulonimbus Clouds. Remote Sensing 2018, 10. [Google Scholar] [CrossRef]
- Zängl, G.; Reinert, D.; Rípodas, P.; Baldauf, M. The ICON (ICOsahedral Non-hydrostatic) modelling framework of DWD and MPI-M: Description of the non-hydrostatic dynamical core. Quarterly Journal of the Royal Meteorological Society 2015, 141, 563–579. [Google Scholar] [CrossRef]
- Bedka, K.; Brunner, J.; Dworak, R.; Feltz, W.; Otkin, J.; Greenwald, T. Objective satellite-based detection of overshooting tops using infrared window channel brightness temperature gradients. Applied Meteorology and Climatology 2010, 49, 181–202. [Google Scholar] [CrossRef]
- Mikuš Jurković, P.; Mahović, N.S.; Počakal, D. Lightning, overshooting top and hail characteristics for strong convective storms in Central Europe. Atmospheric Research 2015, 161-162, 153–168. [Google Scholar] [CrossRef]
- Scarino, B.; Itterly, K.; Bedka, K.; Homeyer, C.R.; Allen, J.; Bang, S.; Cecil, D. Deriving Severe Hail Likelihood from Satellite Observations and Model Reanalysis Parameters Using a Deep Neural Network. Artificial Intelligence for the Earth Systems 2023, 2, 220042. [Google Scholar] [CrossRef]
- Giordani, A.; Kunz, M.; Bedka, K.M.; Punge, H.J.; Paccagnella, T.; Pavan, V.; Cerenzia, I.M.L.; Di Sabatino, S. Characterizing hail-prone environments using convection-permitting reanalysis and overshooting top detections over south-central Europe. EGUsphere 2023, 2023, 1–36. [Google Scholar] [CrossRef]
- Zach, C.; Pock, T.; Bischof, H. A duality based approach for realtime TV-L1 optical flow. Pattern Recognition.
- OpenCV. OpenCV Homepage. http://opencv.org/. Accessed: 2022-04-11.
- Bradski, G. OpenCV is an open-source, computer-vision library for extracting and processing meaningful data from images. Online. Dr. Dobbs. The world of Software Development, 2000.
- pytroll.
- Mosher, F. Detection of deep convection around the globe. American Meteorological Society, 2002, Preprints, 10th Conference on Aviation, Range and Aerospace Meteorology, Portland, OR, pp. 289–292.
- EarthNetworks. Lightning Data. https://www.earthnetworks.com/product/lightning-data/.
- James, P.; Reichert, B.; Heizenreder, D. NowCastMIX: Automatic Integrated Warnings for Severe Convection on Nowcasting Time Scales at the German Weather Service, Weather and Forecasting. Weather and Forecasting 2018, 33, 1413–1433. [Google Scholar] [CrossRef]
- Urbich, I.; Benidx, J.; Müller, R. A Novel Approach for the Short-Term Forecast of the Effective Cloud Albedo. Remote Sensing 2018, 10. [Google Scholar] [CrossRef]
- Sánchez, J.P.; Meinhardt-Llopis, E.; Facciolo, G. TV-L1 optical flow estimation. Image Processing On Line 2013, 3, 137–150. [Google Scholar] [CrossRef]
- Farnebäck, G. Two-frame motion estimation based on polynomial expansion. Image analysis. [CrossRef]
- Barleben, A.; Haussler, S.; Müller, R.; Jerg, M. A Novel Approach for Satellite-Based Turbulence Nowcasting for Aviation. Remote Sensing 2020, 12. [Google Scholar] [CrossRef]
- Ayzel, G.; Heistermann, M.; Winterrath, T. Optical flow models as an open benchmark for radar-based precipitation nowcasting (rainymotion v0.1). Geoscientific Model Development 2019, 12, 1387–1402. [Google Scholar] [CrossRef]
- Brodehl, S.; Müller, R.; Schömer, E.; Spichtinger, P.; Wand, M. End-to-End Prediction of Lightning Events from Geostationary Satellite Images. Preprints 2022 2022. [Google Scholar] [CrossRef]
- Bezanson, J.; Edelman, A.; Karpinski, S.; Shah, V.B. Julia: A Fresh Approach to Numerical Computing. SIAM Review 2017, 59, 65–98. [Google Scholar] [CrossRef]
- Holmlund, K.; Grandell, J.; Schmetz, J.; Stuhlmann, R.; Bojkov, B.; Munro, R.; Lekouara, M.; Coppens, D.; Viticchie, B.; August, T.; Theodore, B.; Watts, P.; Dobber, M.; Fowler, G.; Bojinski, S.; Schmid, A.; Salonen, K.; Tjemkes, S.; Aminou, D.; Blythe, P. Meteosat Third Generation (MTG): Continuation and Innovation of Observations from Geostationary Orbit. Bulletin of the American Meteorological Society 2021, 102, E990–E1015. [Google Scholar] [CrossRef]
- Erdmann, F.; Poelman, D. Lightning trends and whar they tell us about the thunderstorm characteristics. Presentation at the Eumetsat conference 2023. Malmü, Sweden, 11-, https://imagine.eumetsat.int/smartViews/view?view=EMSC. 15 September.
- DWD. Thunderstorm nowcasting open data product, available at. https://opendata.dwd.de/weather/satellite/clouds/TS/.
- Betz, H.D.; Schmidt, K.; Laroche, P.; Blanchet, P.; Oettinger, W.P.; Defer, E.; Dziewit, Z.; Konarski, J. LINET — An international lightning detection network in Europe. Atmospheric Research 2009, 91, 564–573. [Google Scholar] [CrossRef]
- Ingram, J. Quantifying the Spatial and TemQuantifying the Spatial and Temporal Response of UTH and OLR to Deep Convection over Tropical Africaporal Response of UTH and OLR to Deep Convection over Tropical Africa, 2016. Space and Atmospheric Physics Group Department of Physics Imperial College of Science, Technology and Medicine.
- Mueller, R.; Pfeifroth, U. Remote sensing of solar surface radiation - a reflection of concepts, applications and input data based on experience with the effective cloud albedo. Atmospheric Measurement Techniques 2022, 15. [Google Scholar] [CrossRef]
- DWD. Cloud Top Height (CTH) open data product, available at. https://opendata.dwd.de/weather/satellite/clouds/CTH/.
- Lorenz, E.N. Deterministic Nonperiodic Flow. Journal of Atmospheric Sciences 1963, 20, 130–141. [Google Scholar] [CrossRef]
- D. Reinert, D.; Prill, F.; Frank, H.; Denhard, M.; Baldauf, M.; Schraff, C.; Gebhardt, C.; Marsigli, C.; Zängl, G. D. Reinert, D.; Prill, F.; Frank, H.; Denhard, M.; Baldauf, M.; Schraff, C.; Gebhardt, C.; Marsigli, C.; Zängl, G. DWD Database Reference for the Global and Regional ICON and ICON-EPS Forecasting System. Technical Report Version 2.1.7, DWD, 2021.
- Schröder, G.; Göcke, T.; Köhler, M. Subgrid scale Lightning Potential Index for ICON with parameterized convection. Reports on ICON, Issue 10 ISSN: 2628-4898, Deutscher Wetterdienst, 2022. [CrossRef]
- Lynn, B.; Yair, Y. Prediction of lightning flash density with the WRF model. Advances in Geoscience 2010, 23, 11–16. [Google Scholar] [CrossRef]
- Fieldextra Wiki. https://github.com/COSMO-ORG/fieldextra-wiki/wiki.
- Schulzweida, U. CDO User Guide. Technical report, Max-Planck-Institution for Meteorology, https://code.mpimet.mpg.de/projects/cdo, 2023. available at: https://code.mpimet.mpg.de/projects/cdo/embedded/cdo.pdf.
- Zinner, T.; Forster, C.; de Coning, E.; Betz, H.D. Validation of the Meteosat storm detection and nowcasting system Cb-TRAM with lightning network data – Europe and South Africa. Atmos. Meas. Tech. 2013, 6, 1567–1583. [Google Scholar] [CrossRef]
- Wilks, D.S. Statistical Methods in the Atmospheric Sciences; Vol. 91, International Geophysics Series; Elsevier: Amsterdam, 2006. [Google Scholar]
- Guidelines for Nowcasting Techniques; Number WMO-No. 1198, World Meteorological Organization, WMO: WMO, 7 bis, avenue de la Paix, P.O. Box 2300, CH-1211 Geneva 2, Switzerland, 2017. ISBN 978-92-63-11198-2.
- Lam, R.; Sanchez-Gonzalez, A.; Willson, M.; Wirnsberger, P.; Fortunato, M.; Alet, F.; Ravuri, S.; Ewalds, T.; Eaton-Rosen, Z.; Hu, W.; Merose, A.; Hoyer, S.; Holland, G.; Vinyals, O.; Stott, J.; Pritzel, A.; Mohamed, S.; Battaglia, P. Learning skillful medium-range global weather forecasting. Science 2023, 382, 1416–1421. [Google Scholar] [CrossRef] [PubMed]
- Google. Deepmind. https://deepmind.google/discover/blog/graphcast-ai-model-for-faster-and-more-accurate-global-weather-forecasting/.
- Dewitte, S.; Cornelis, J.P.; Müller, R.; Munteanu, A. Artificial Intelligence Revolutionises Weather Forecast, Climate Monitoring and Decadal Prediction. Remote Sensing 2021, 13. [Google Scholar] [CrossRef]
- Xiao, X.; Sun, J.; Qie, X.; Ying, Z.; Ji, L.; Chen, M.; Zhang, L. Lightning Data Assimilation Scheme in a 4DVAR Sytem and Its Impcact on Very Short-Term Convective Forecasting. Monthly Weather Review 2021, 149, 353–373. [Google Scholar] [CrossRef]
- Wand, M. Personal communication within a meeting dealing with the PhD of Sebastian Brodehl.
Figure 1.
Example of failures in the short term extrapolation of TS due to the use of AMVs without life cycle information. The lightning observations are diagrammed as crosses over the nowcasting. The large cell on the west is correctly nowcasting in a first step, but it dissipates after a hour, pure movement of cells by AMVs can not capture this process, hence false alarms occur. Further on the South-West cells develop which can not be captured by AMVs as well, leading to missed detections.
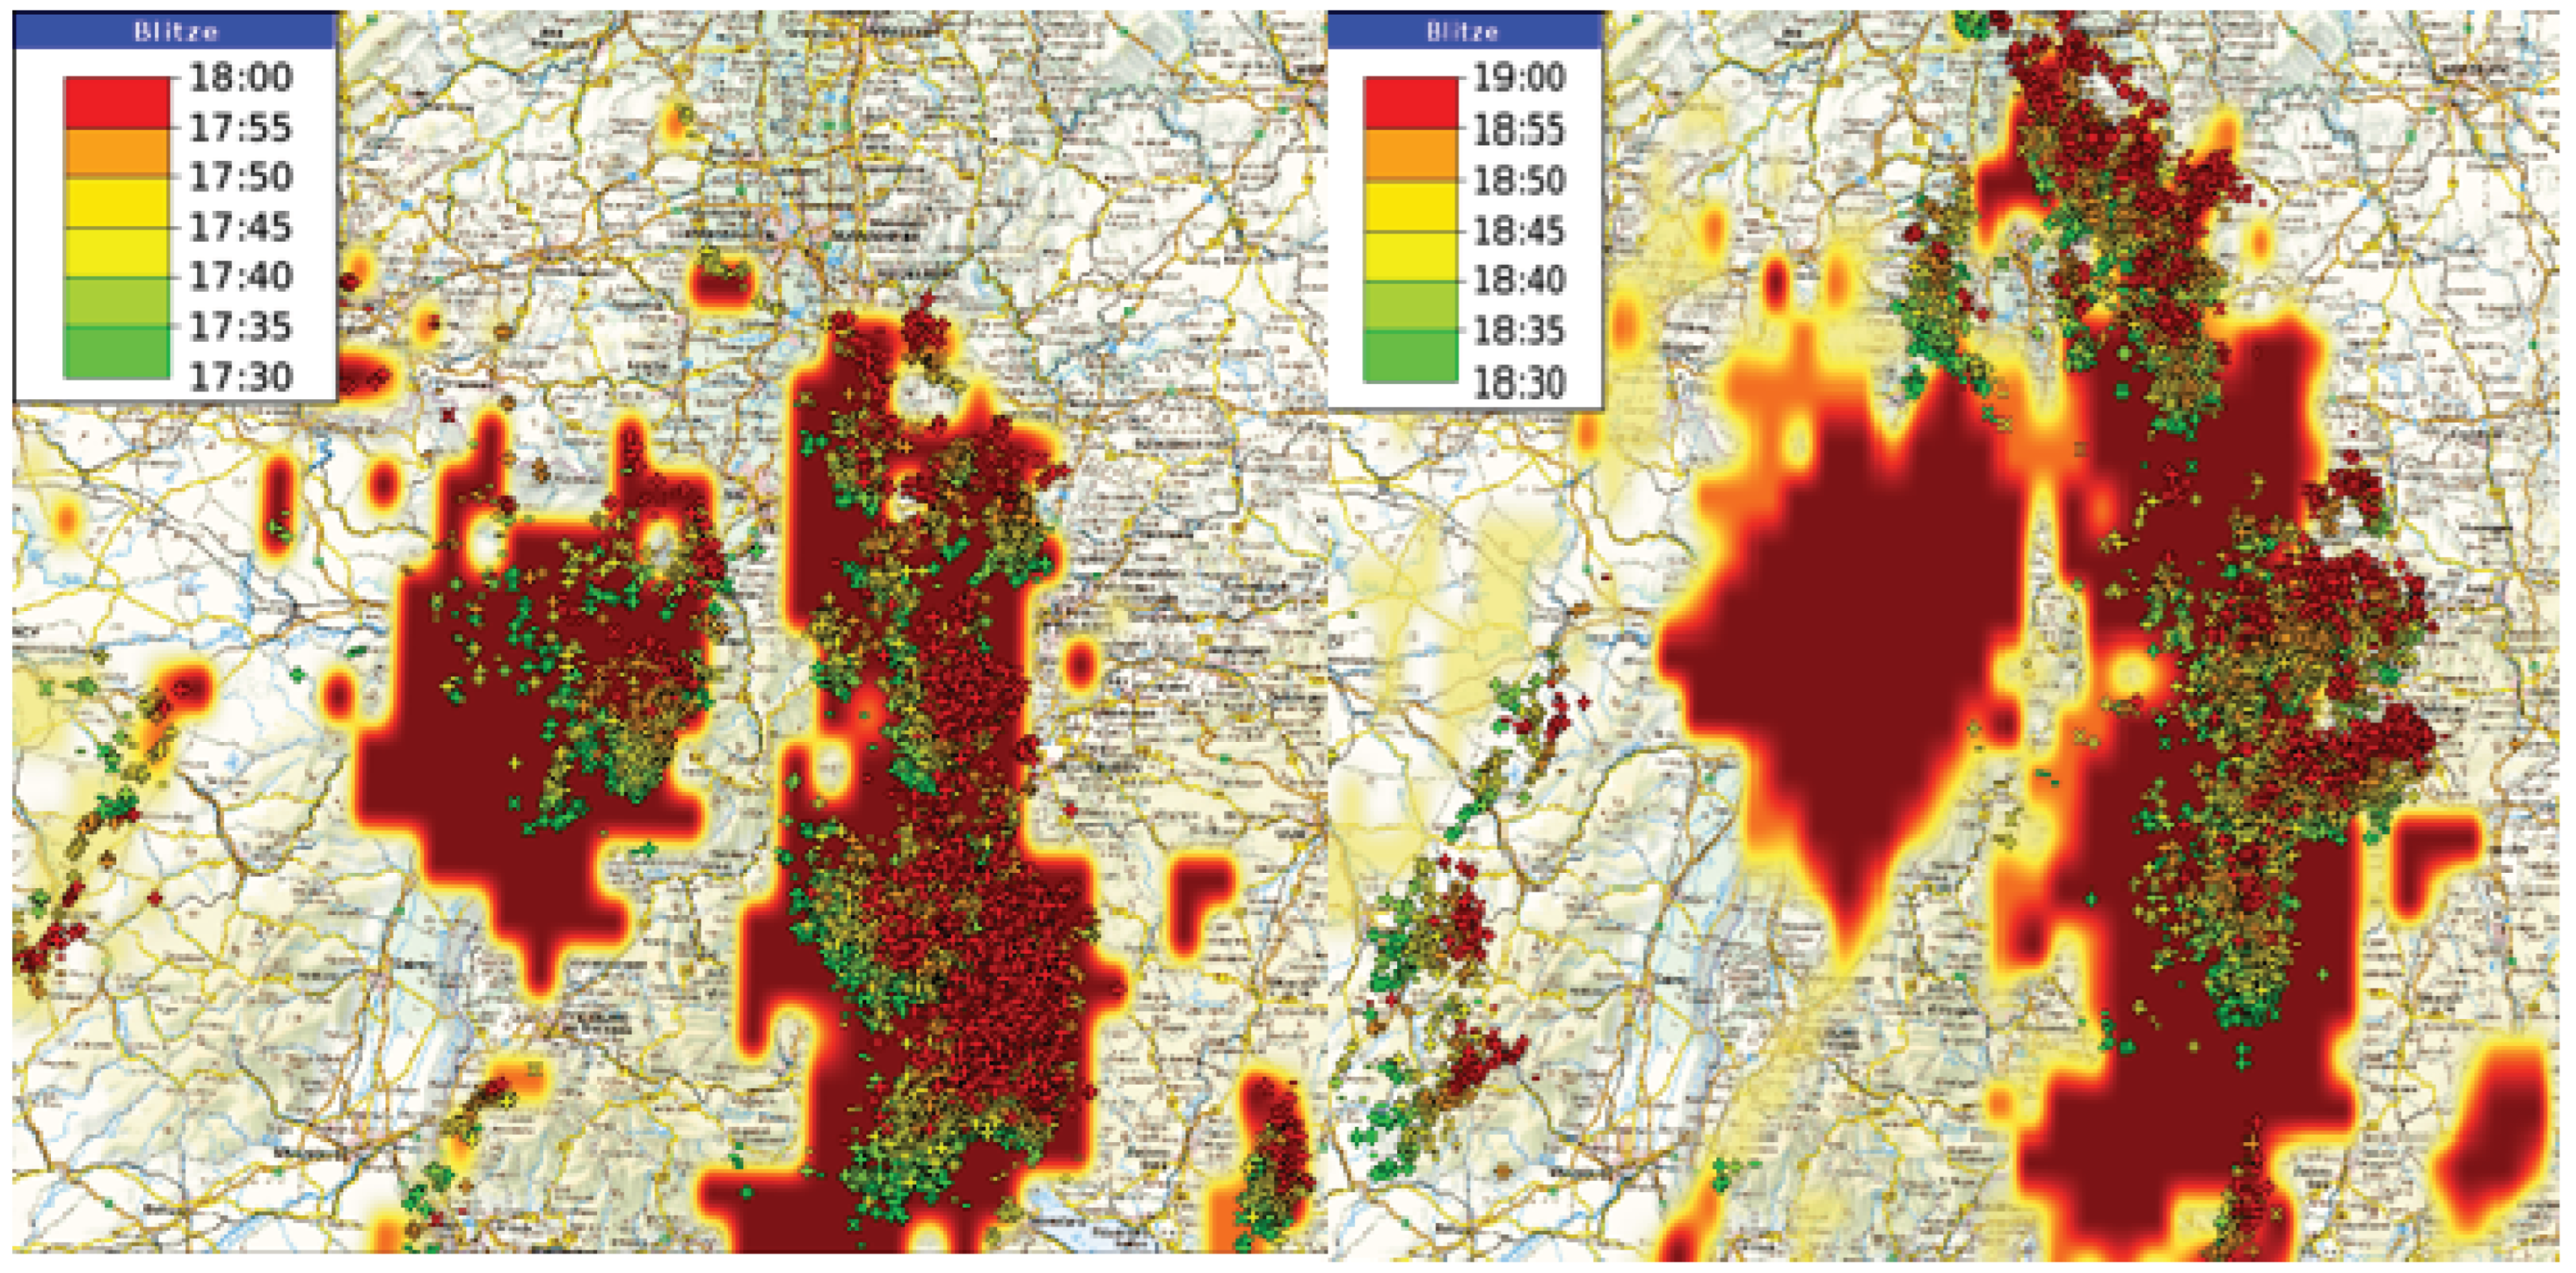
Figure 2.
Example of the Cloud_CTH product of low, medium and high clouds, implemented as extension to the NCS-A convection product.
Figure 2.
Example of the Cloud_CTH product of low, medium and high clouds, implemented as extension to the NCS-A convection product.
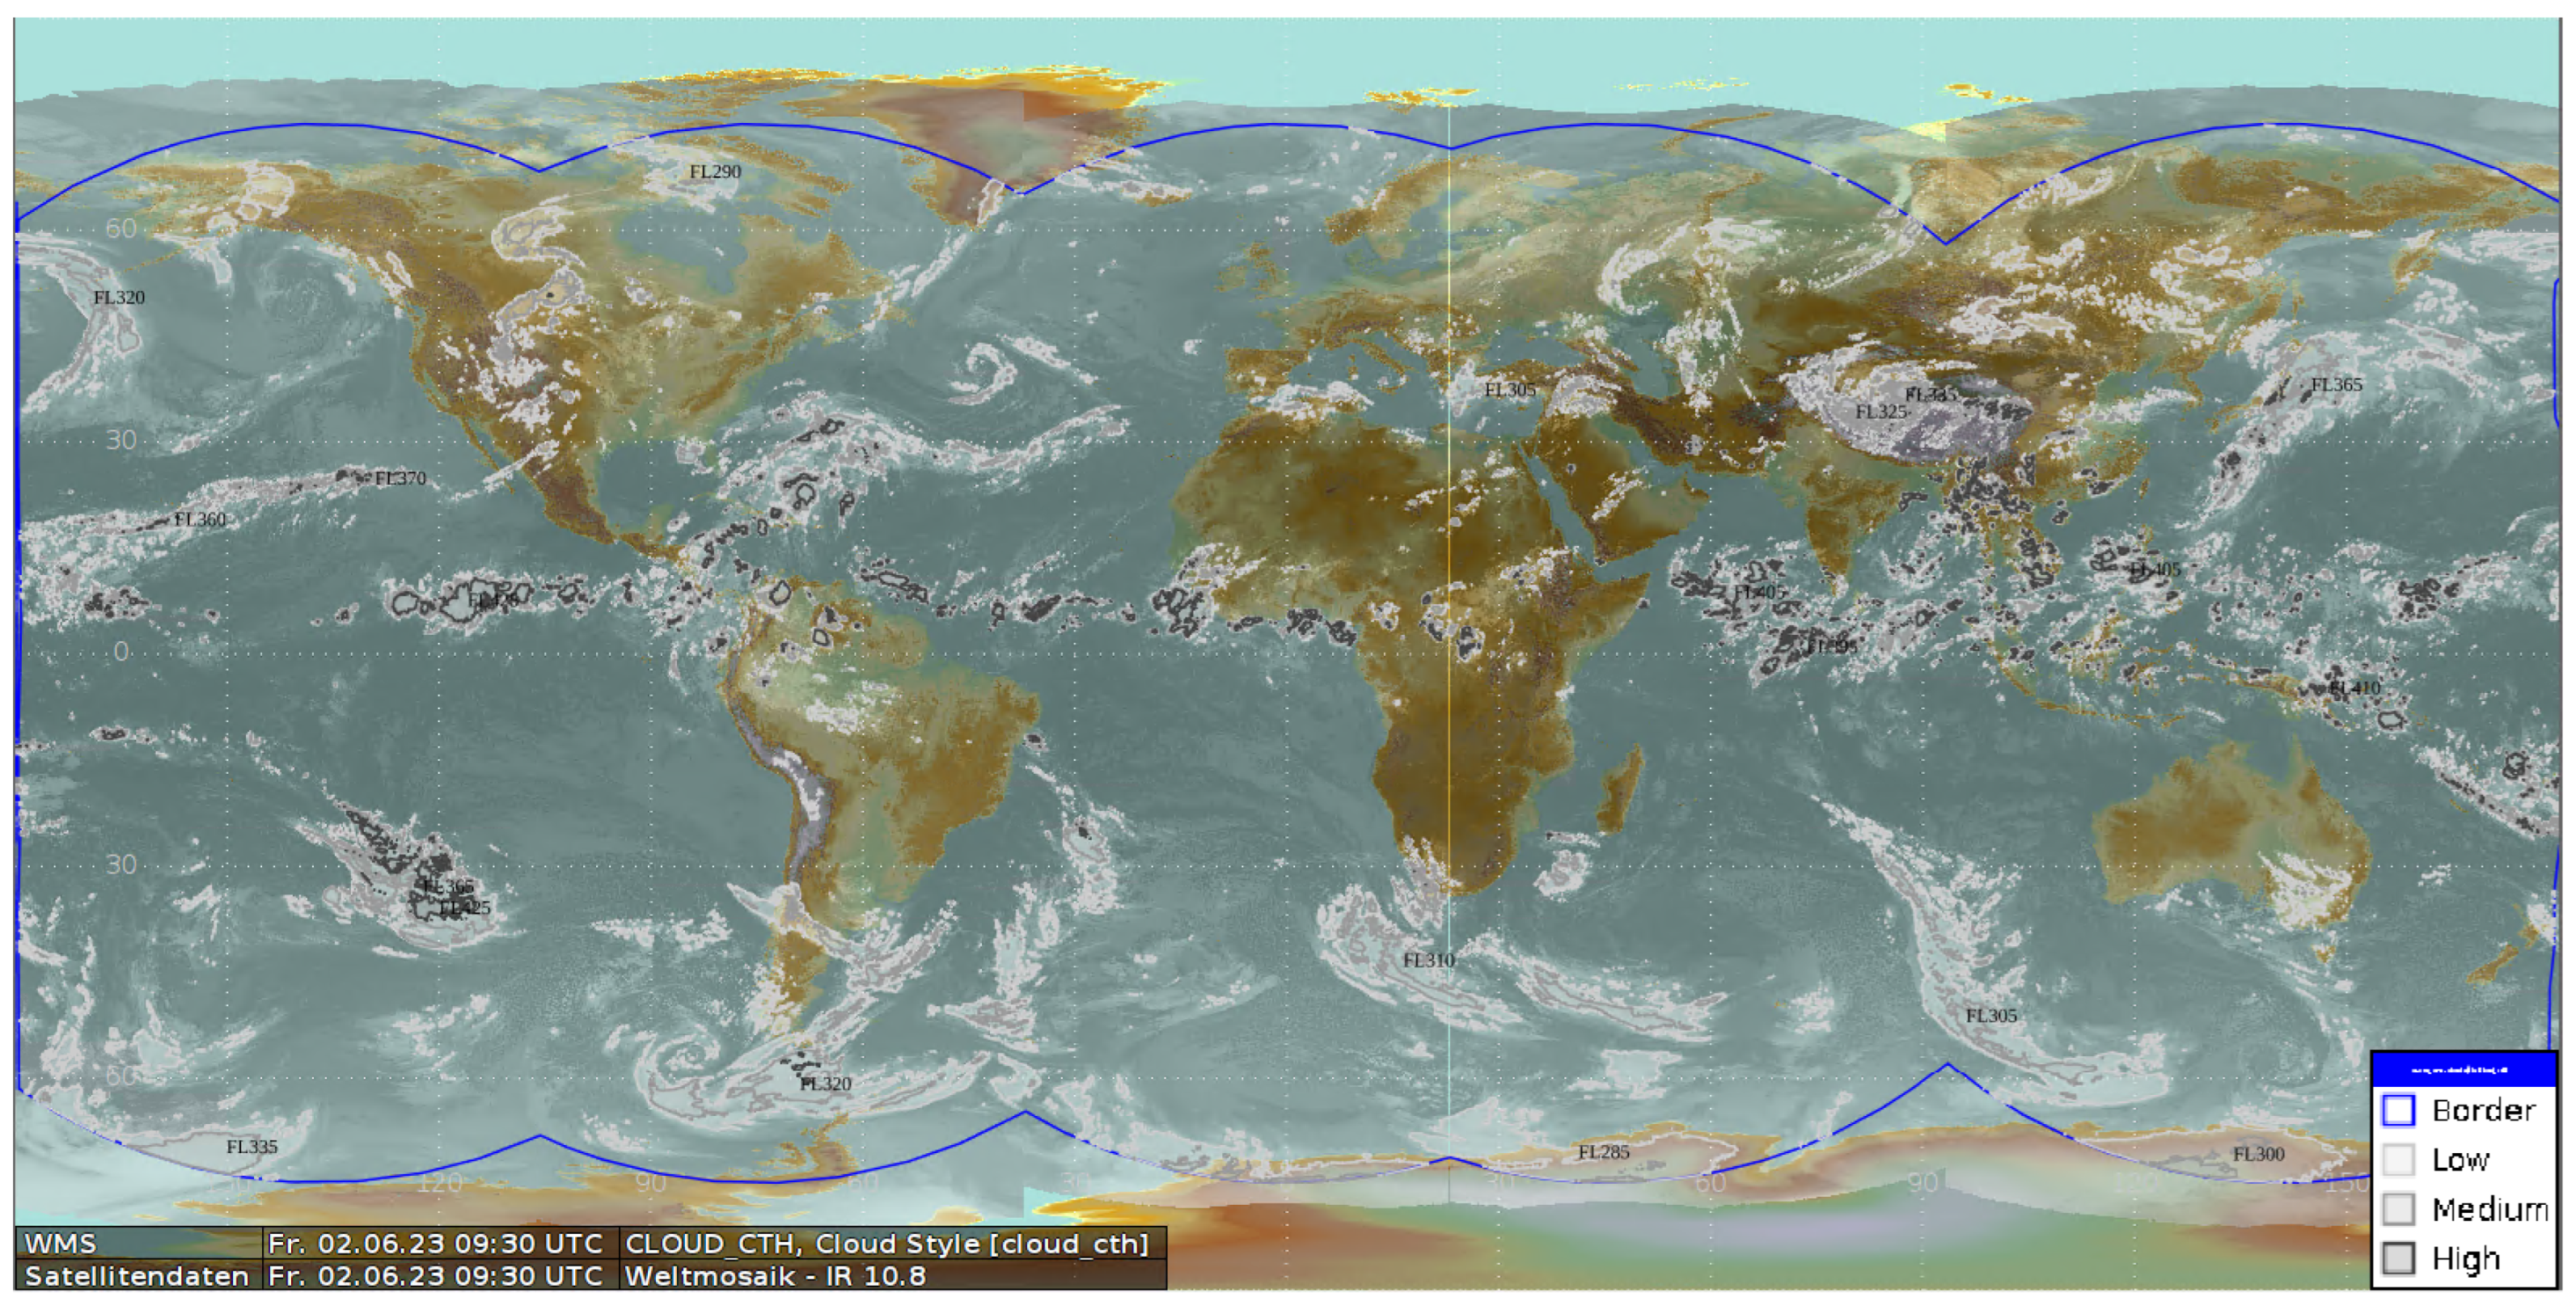
Figure 3.
Illustration for the cloud top height product for Europe 20220609, 12:45 UTC. Large red spherical regions indicates thunderstorms. The product on open data is already parallax corrected.
Figure 3.
Illustration for the cloud top height product for Europe 20220609, 12:45 UTC. Large red spherical regions indicates thunderstorms. The product on open data is already parallax corrected.
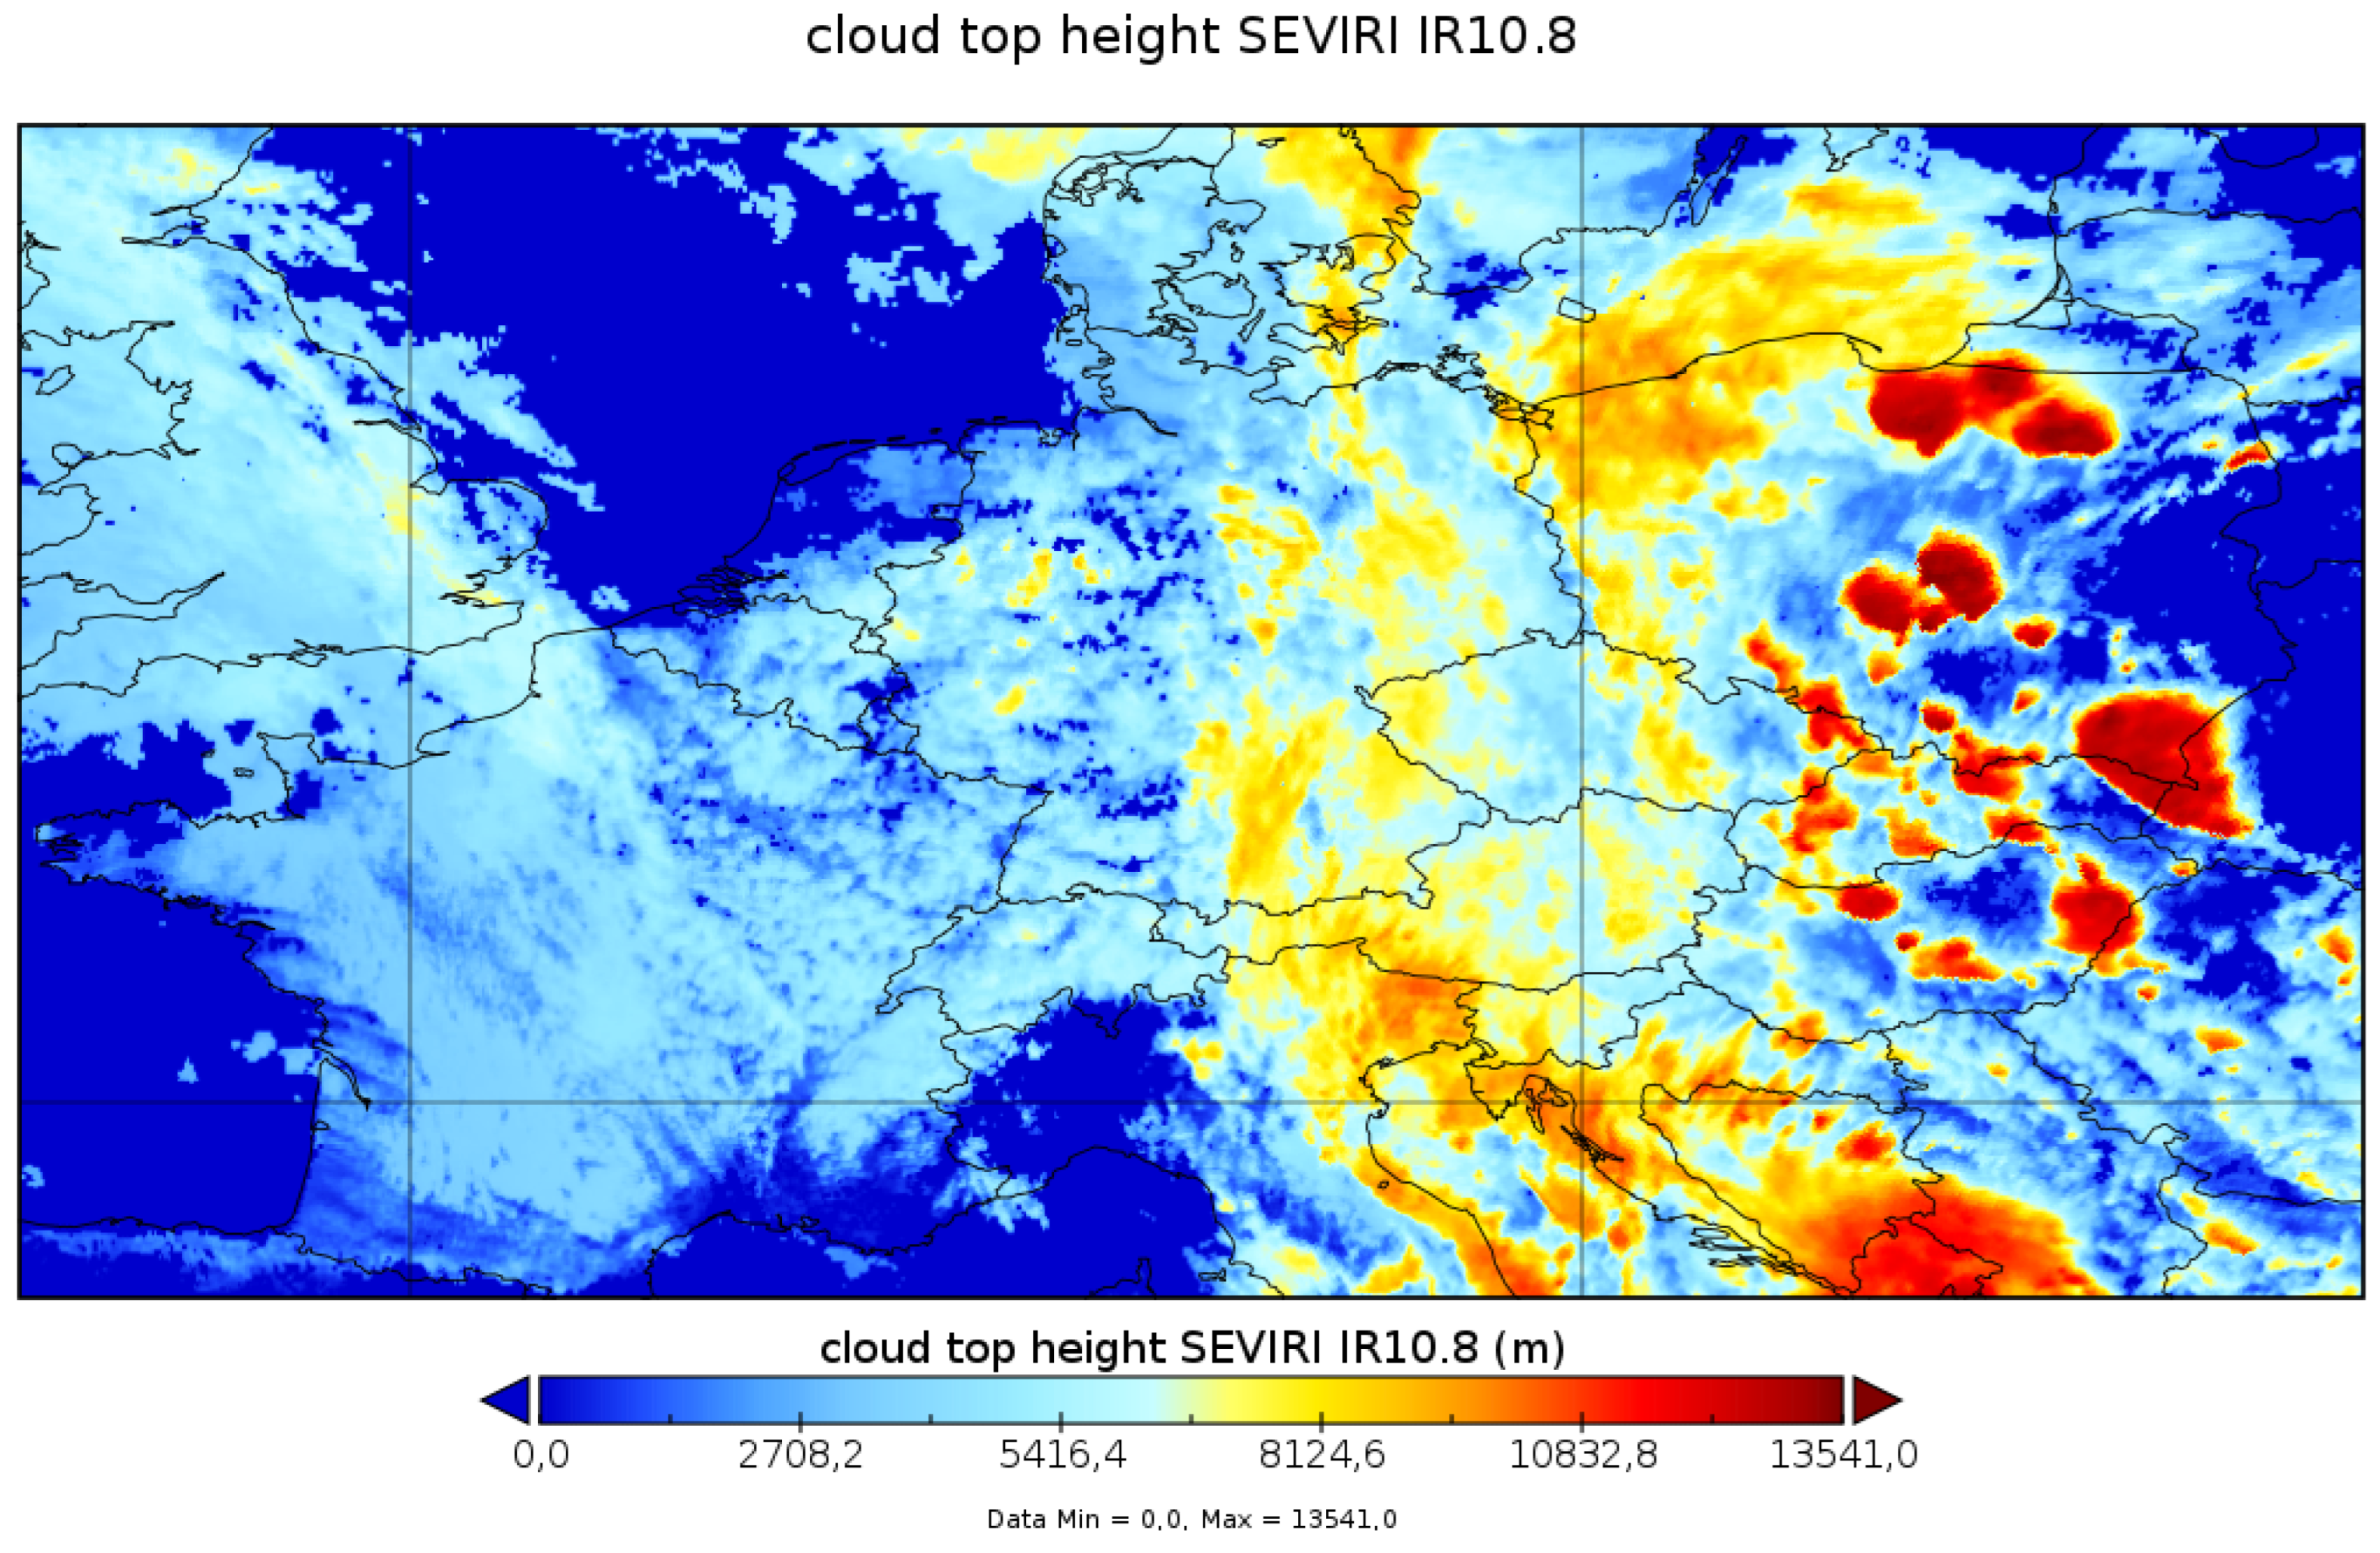
Figure 4.
Example iCONv-GL for possible (green), likely(orange) and most likely (red) convection shown together with ground-based observations of lightning (translucent) and satellite-based infrared radiation measurements.
Figure 4.
Example iCONv-GL for possible (green), likely(orange) and most likely (red) convection shown together with ground-based observations of lightning (translucent) and satellite-based infrared radiation measurements.
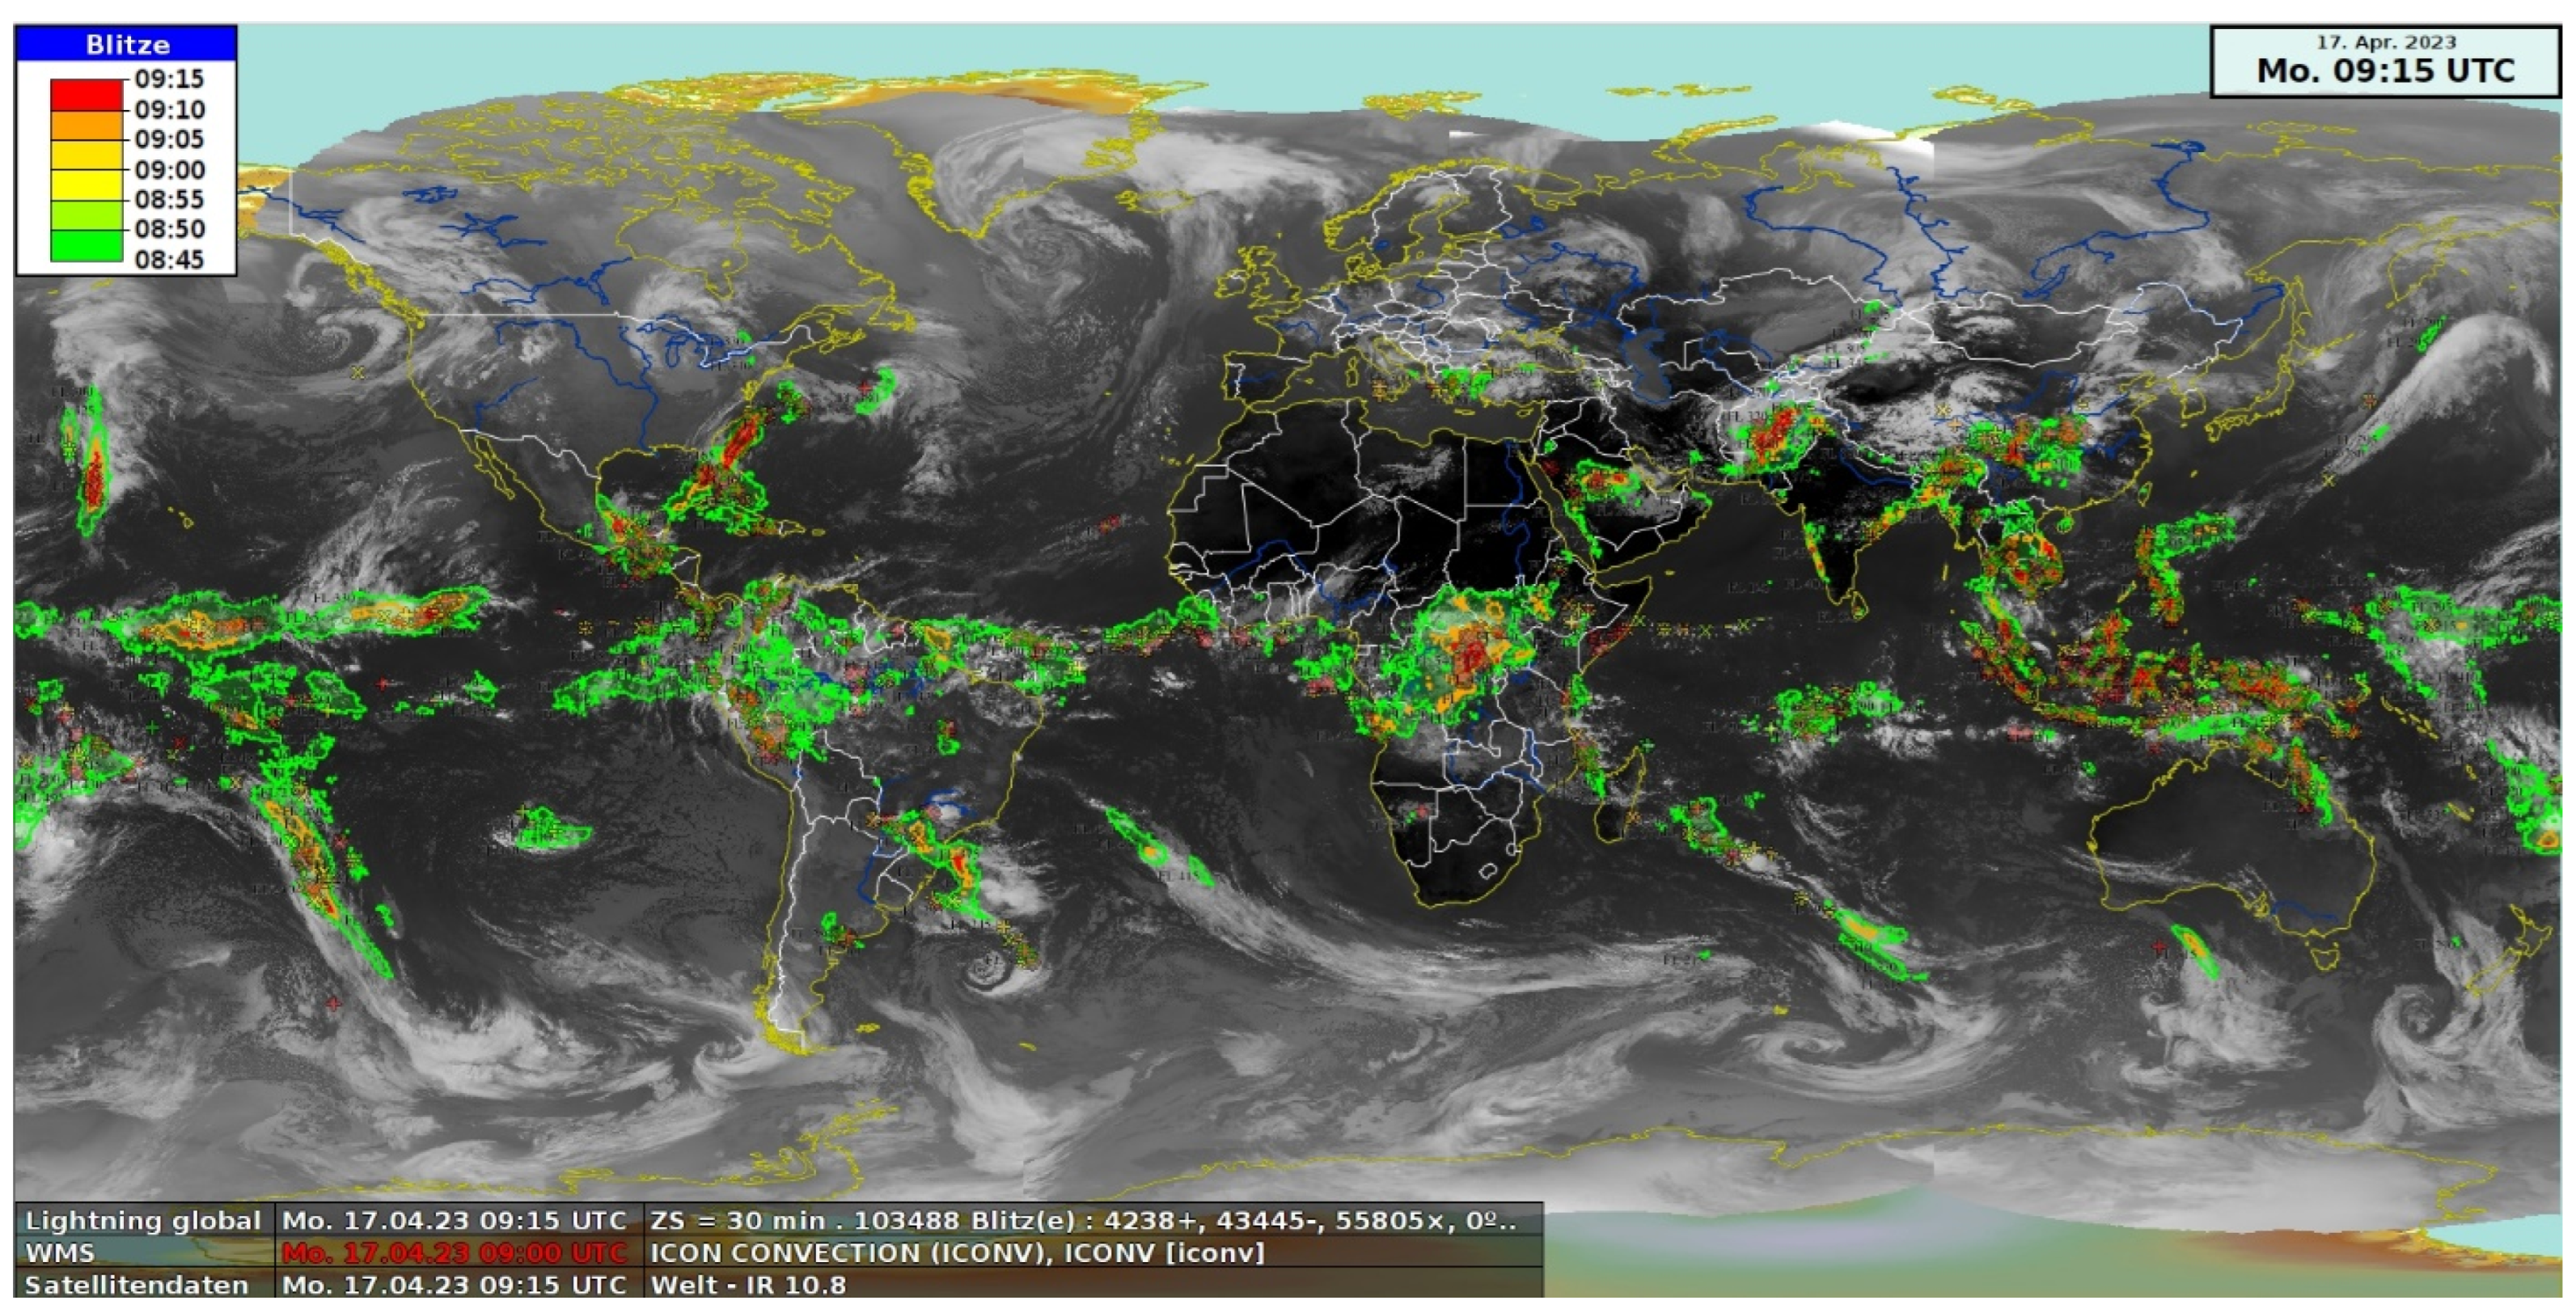
Figure 5.
Blending approach for RUC and D2, hourly means. For the 1 hour forecast only nowcasting is used, 2 h forecast is the blending step and from 3 h on-ward, only model is used.
Figure 5.
Blending approach for RUC and D2, hourly means. For the 1 hour forecast only nowcasting is used, 2 h forecast is the blending step and from 3 h on-ward, only model is used.
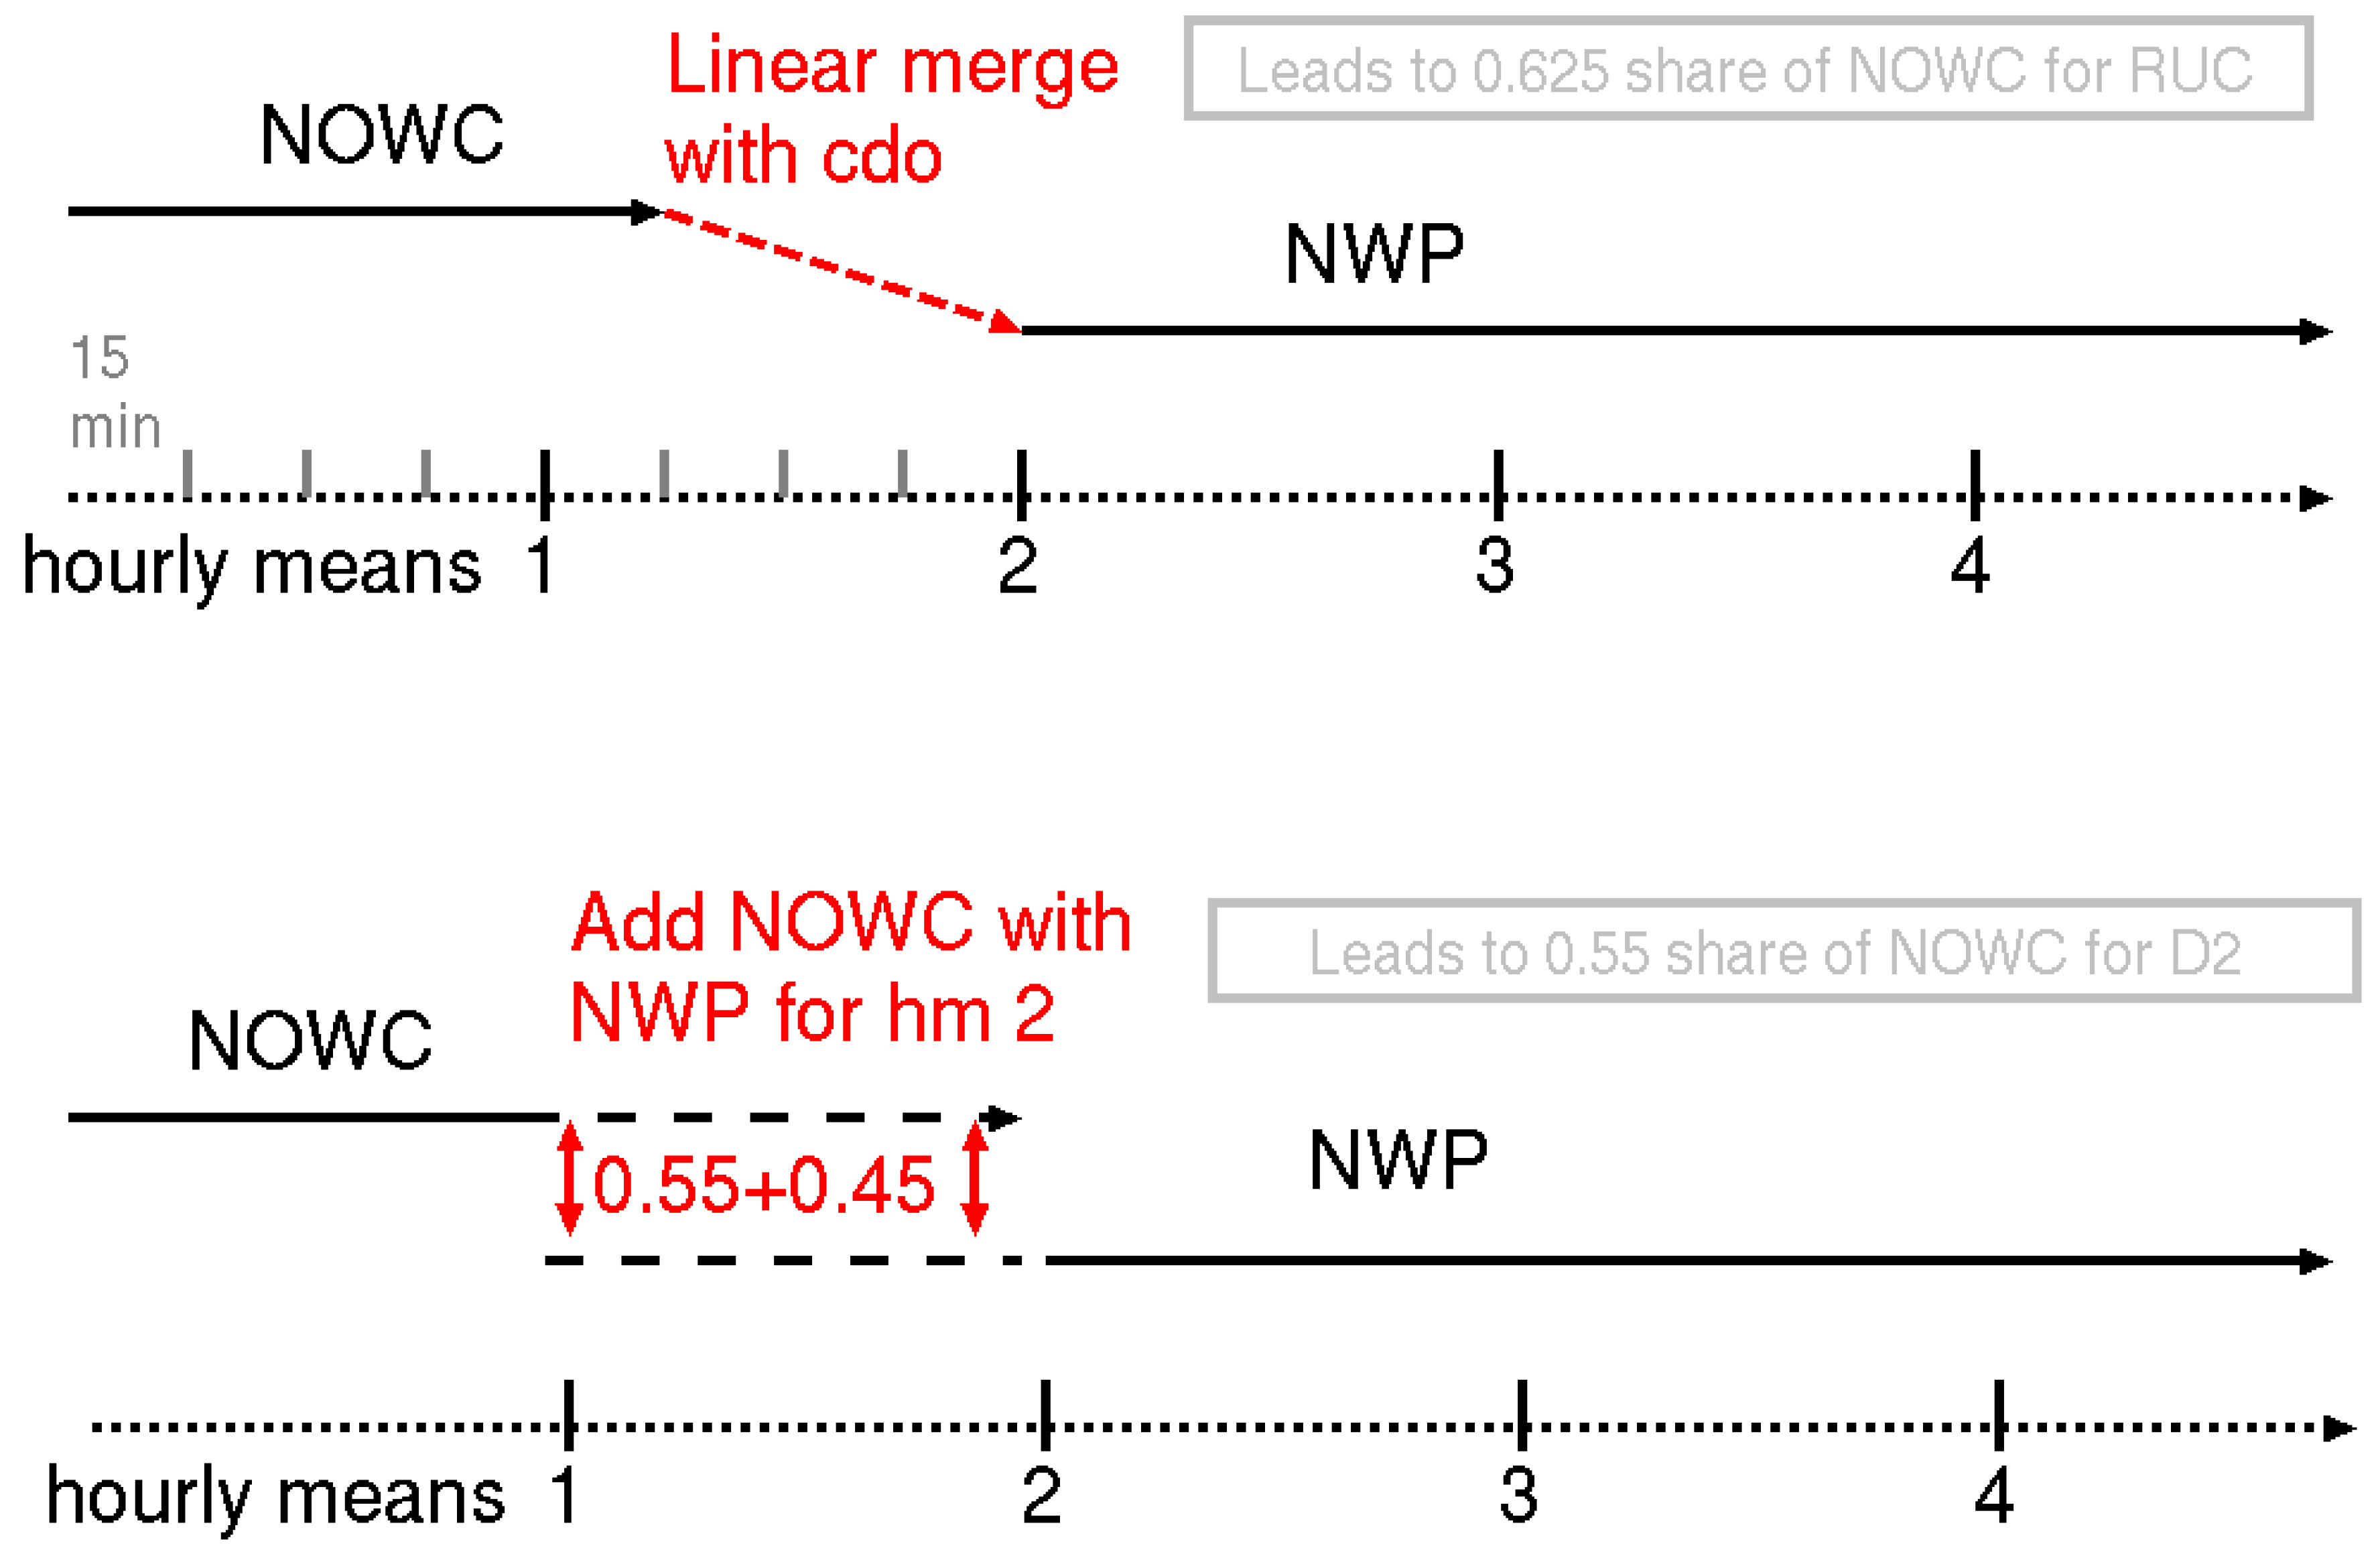
Figure 6.
CSI over forecast time for the blended products that are mixed with either RUC or D2.
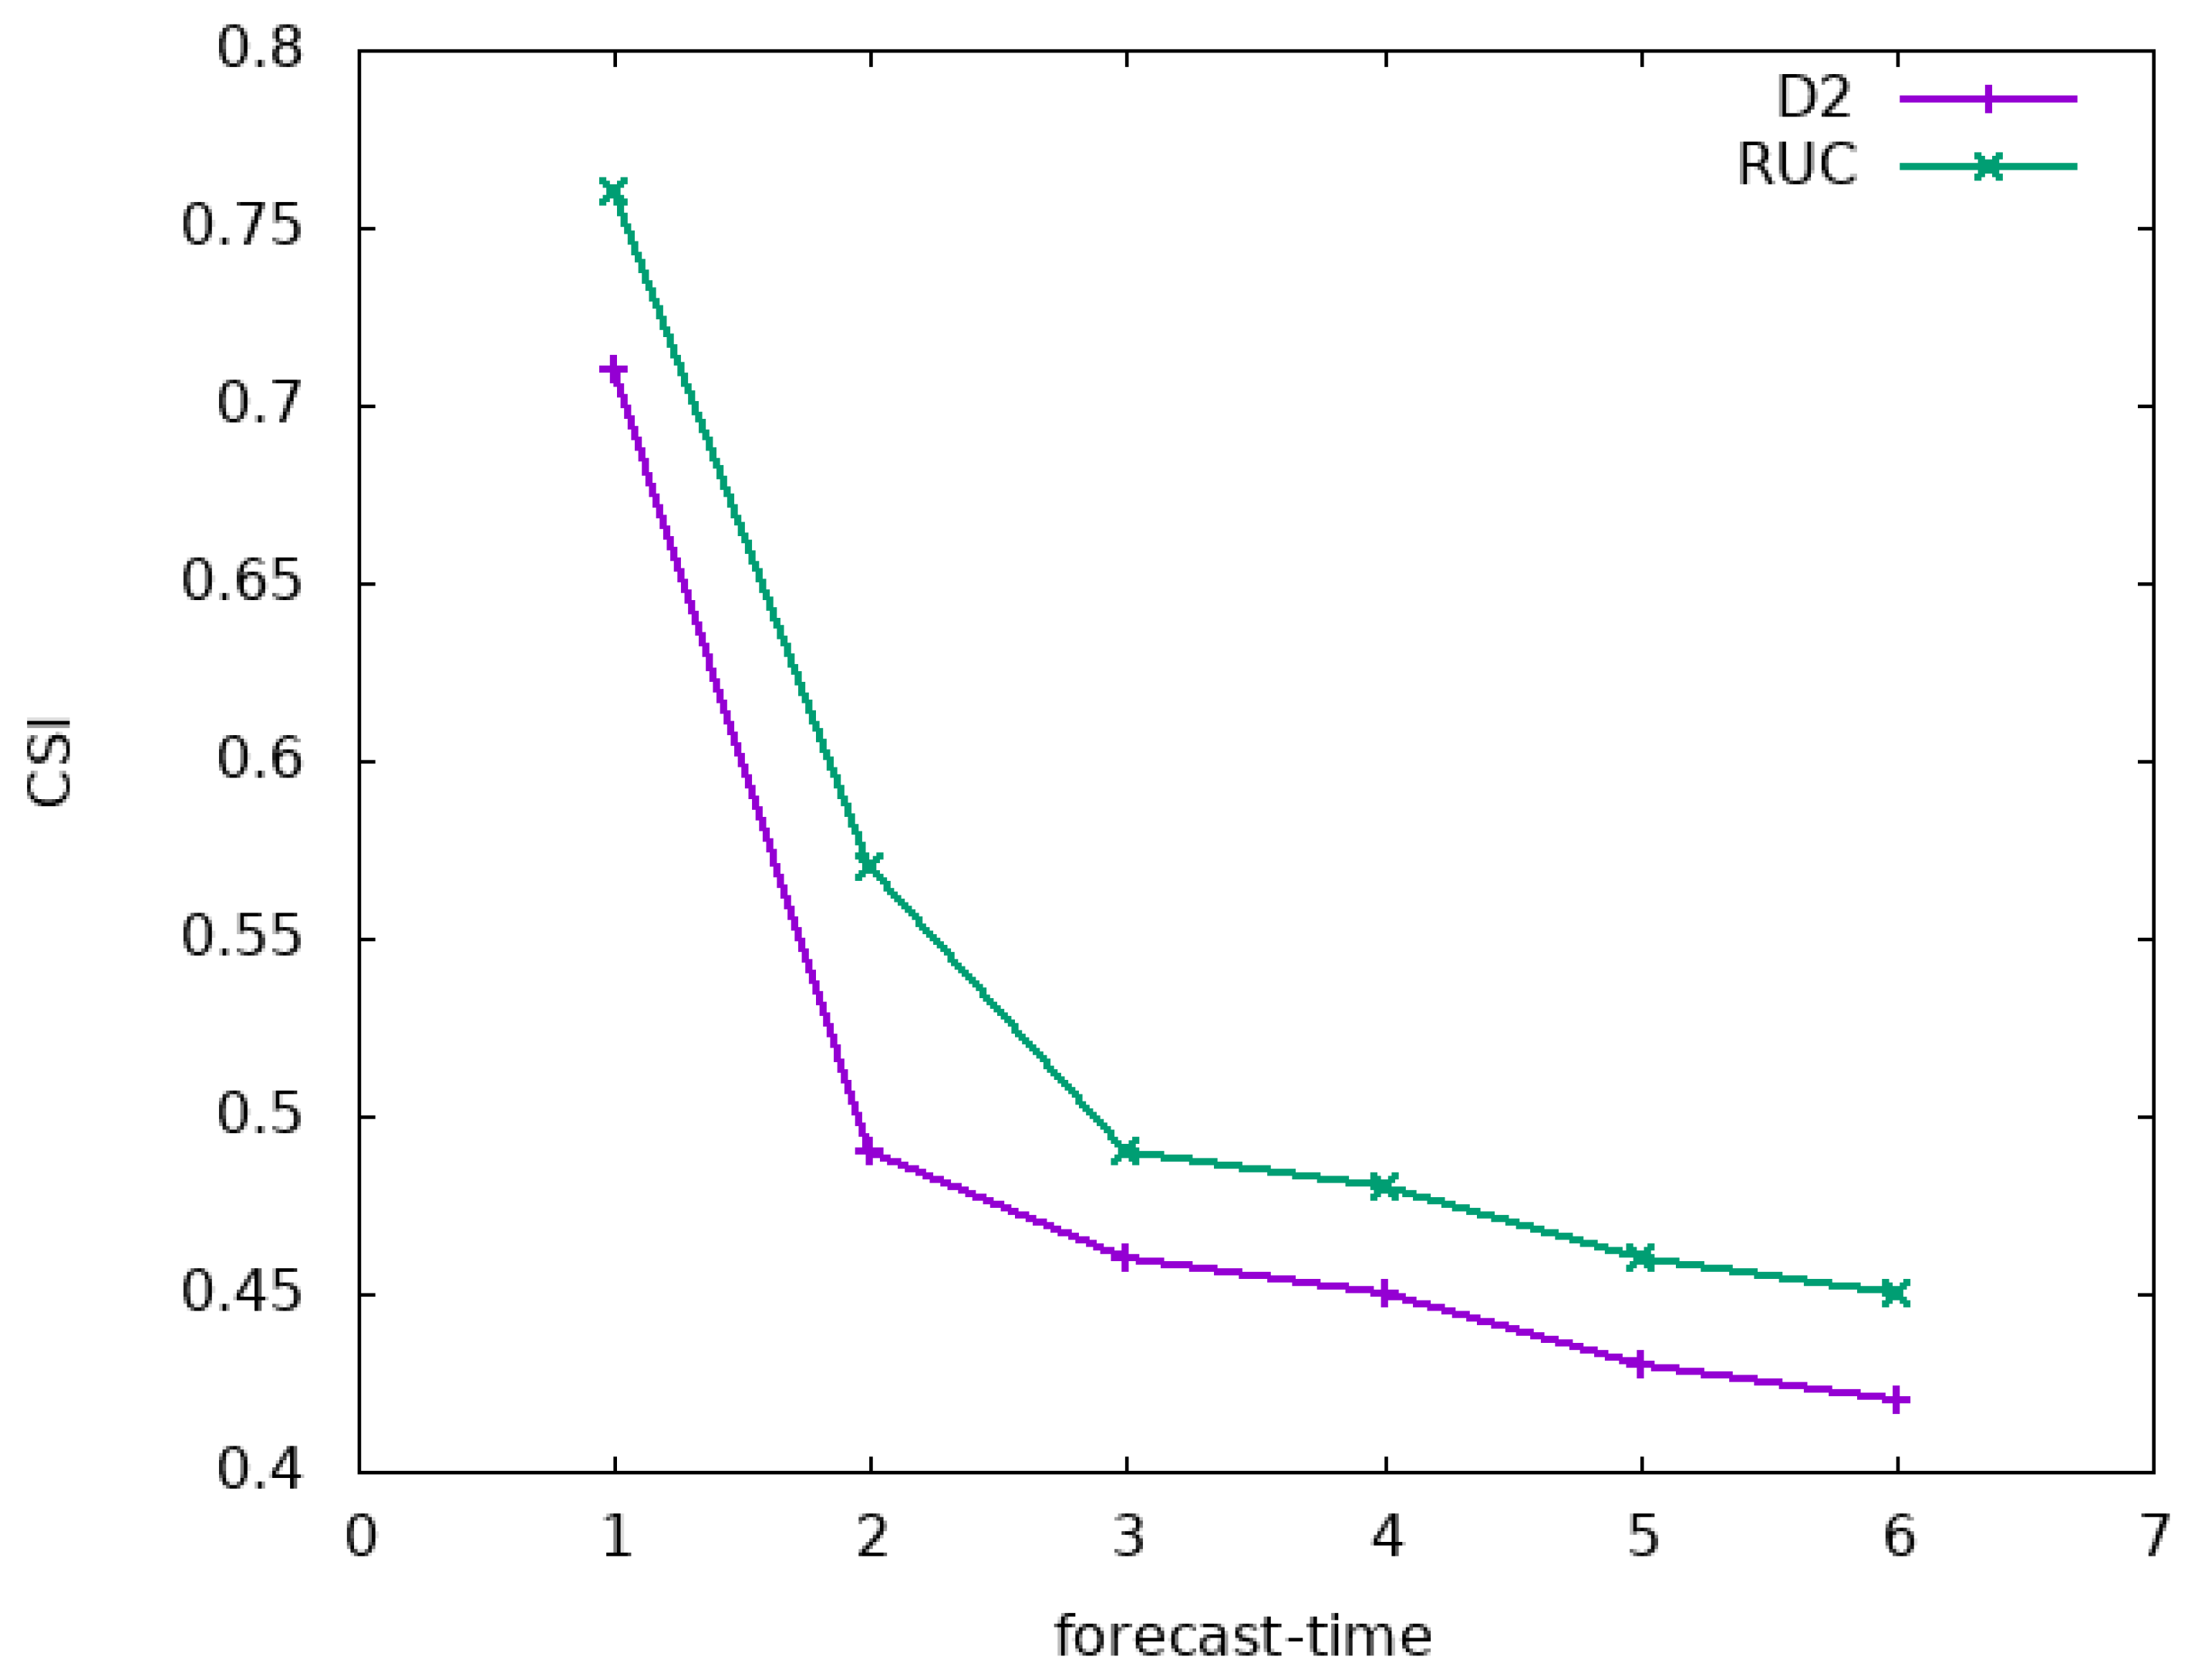
Figure 7.
FAR and POD for the blended product.
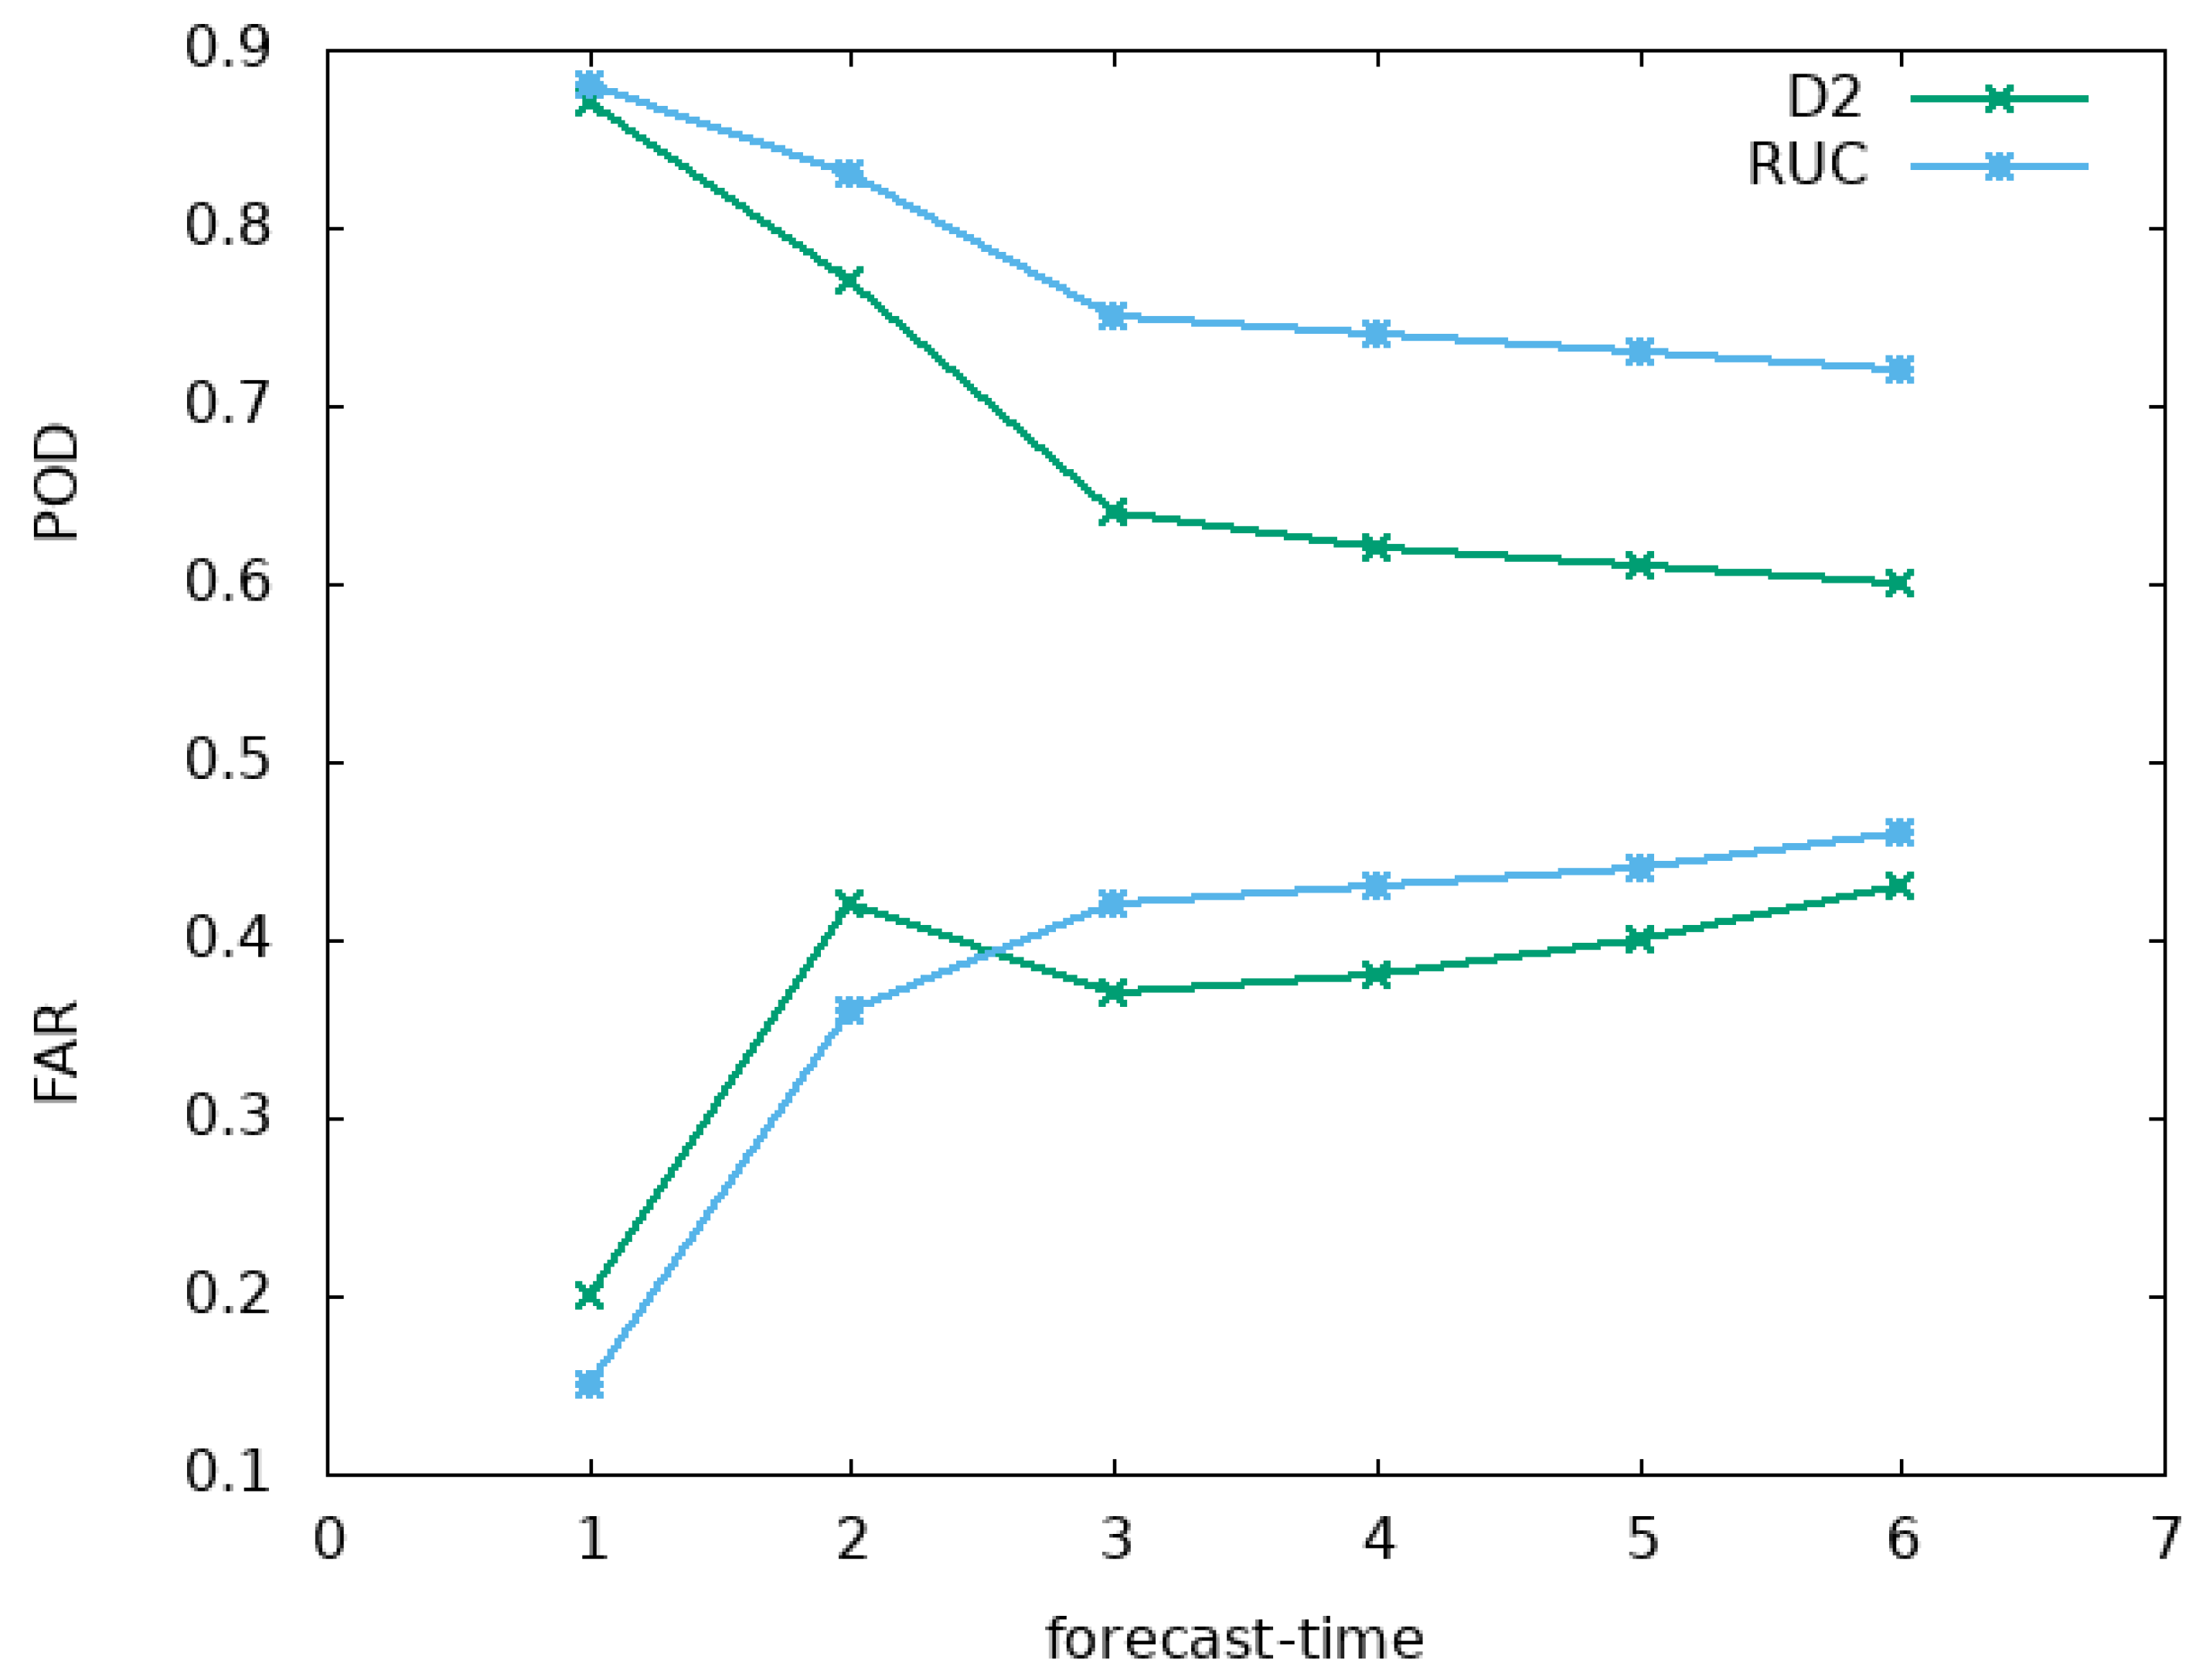
Figure 8.
CSI over lead time for the blended products, blending with RUC and D2, but for the model only timesteps.
Figure 8.
CSI over lead time for the blended products, blending with RUC and D2, but for the model only timesteps.
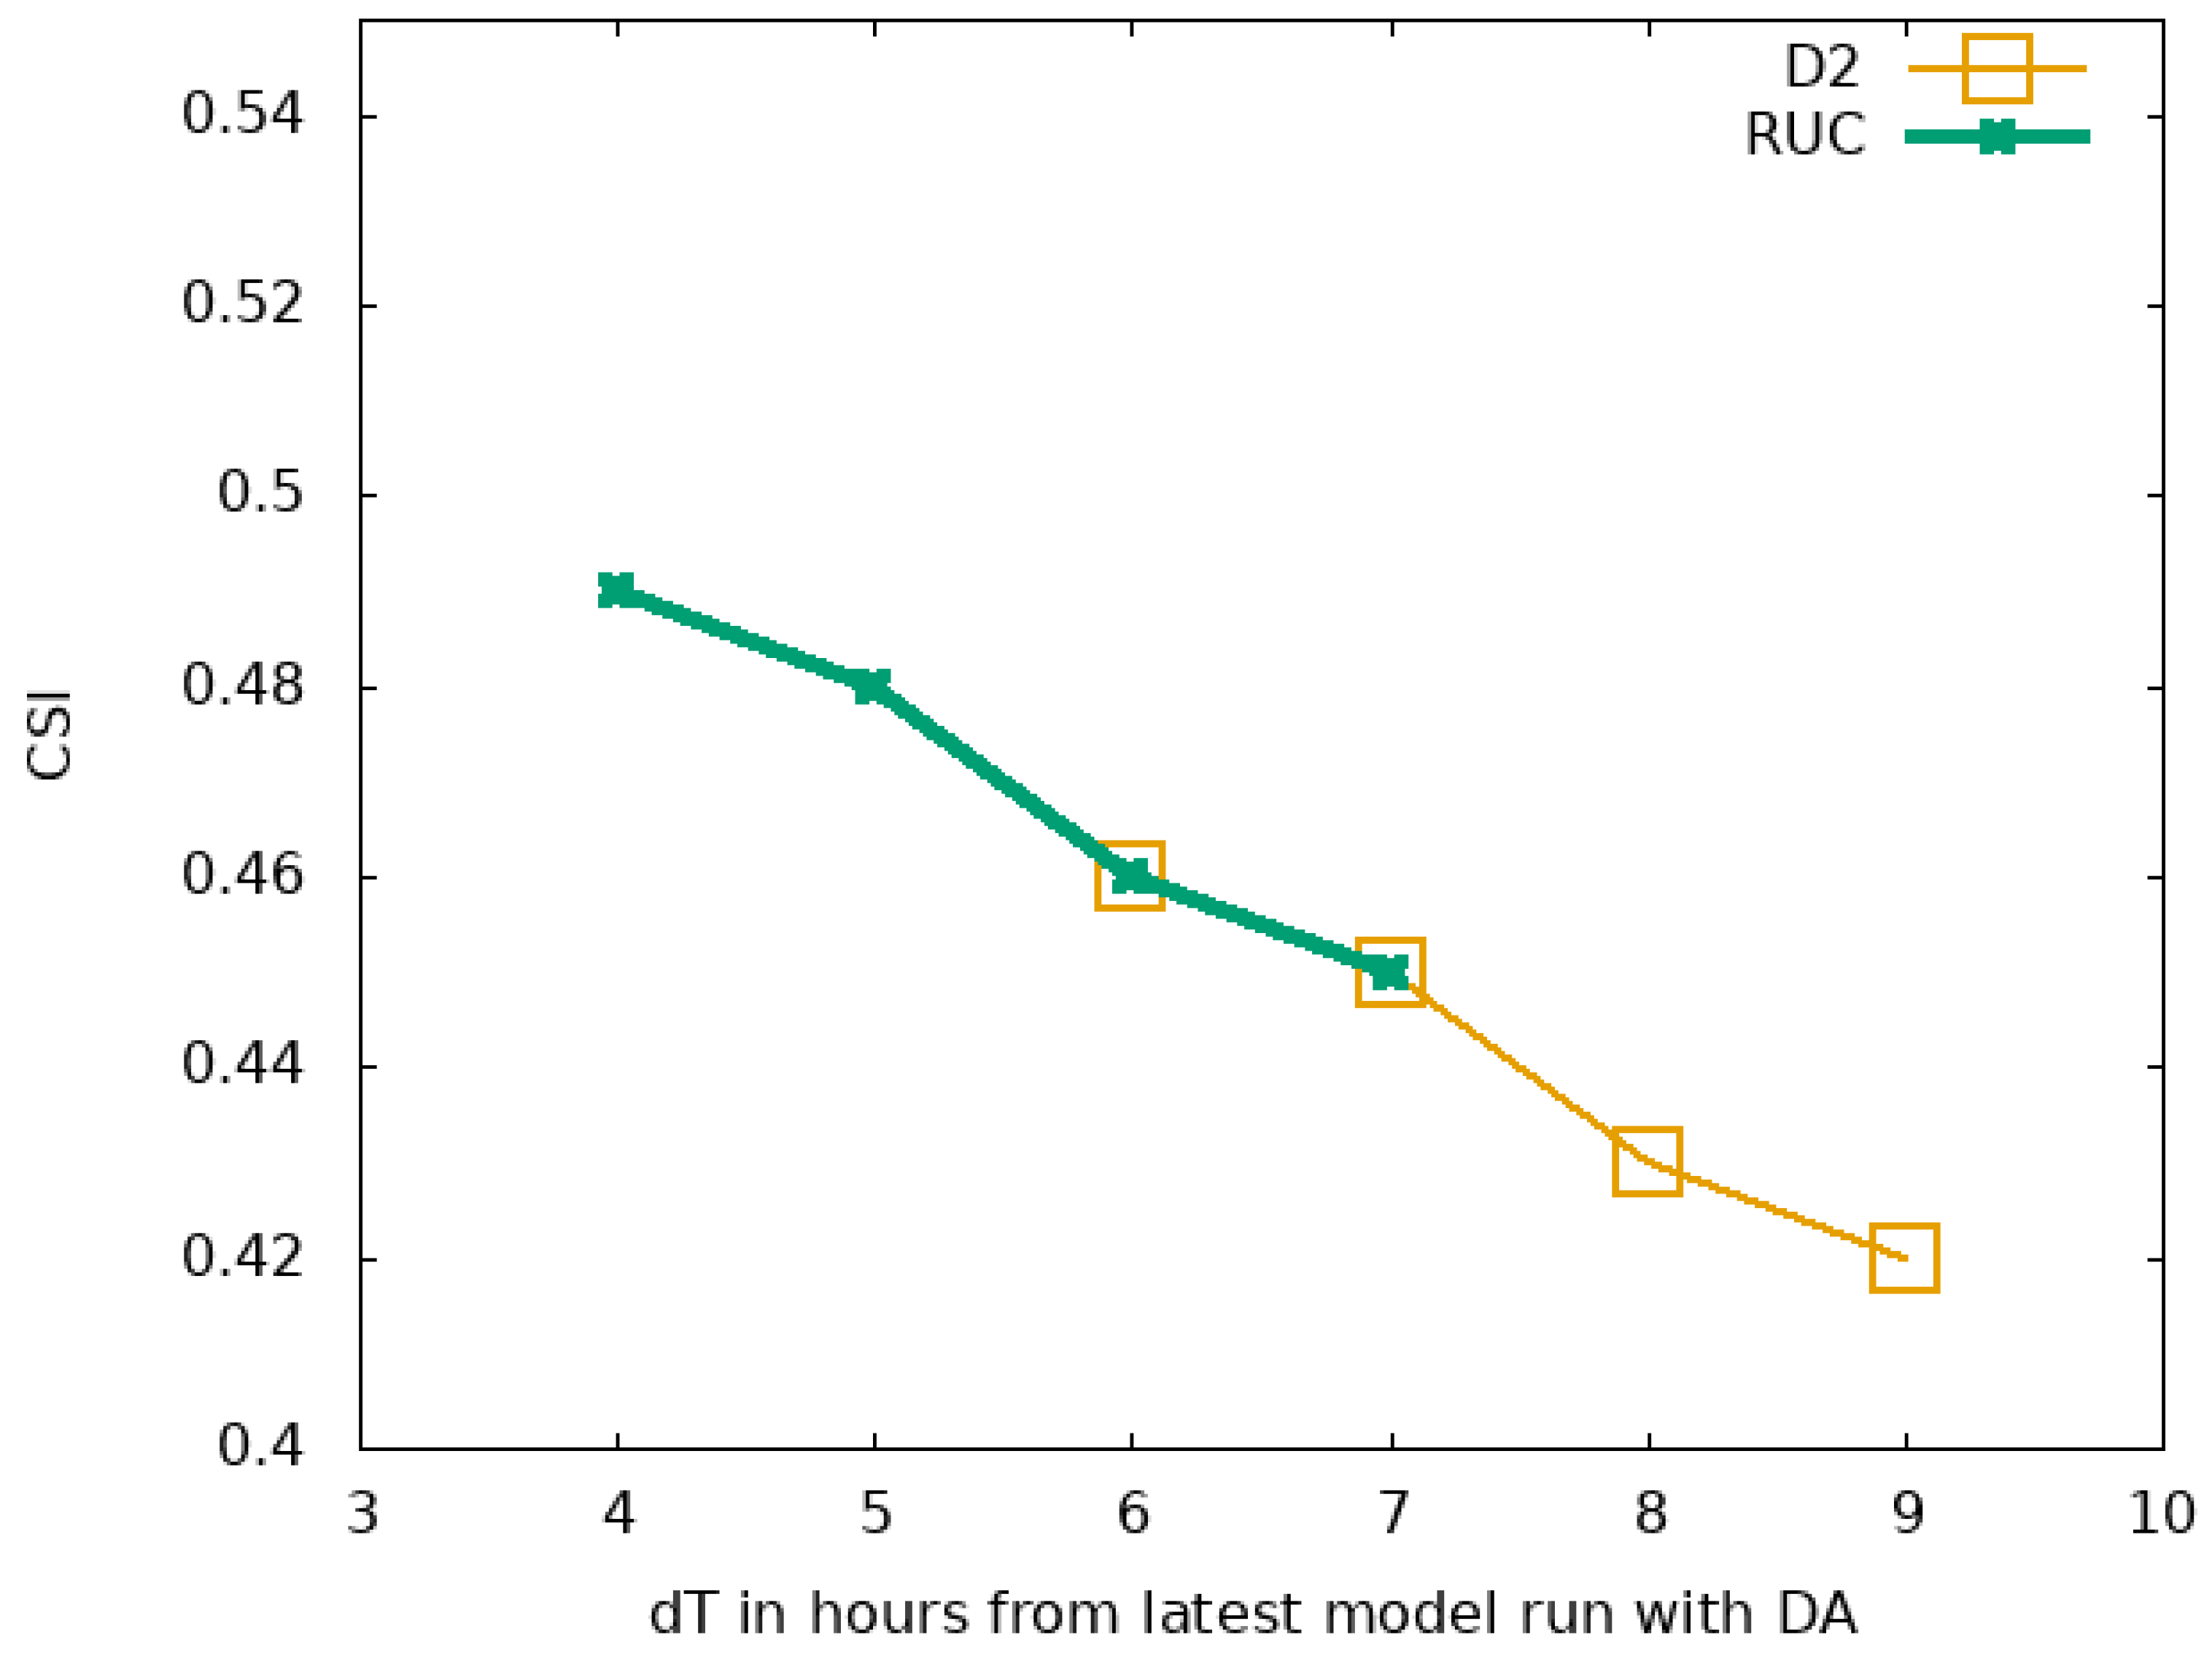

Table 1.
Overview about the definition of the three cloud height regimes and their possible relation to the life cycle of deep convection. BTD is the difference of the water vapour channels.
Table 1.
Overview about the definition of the three cloud height regimes and their possible relation to the life cycle of deep convection. BTD is the difference of the water vapour channels.
| vertical thickness | Threshold | in case of convection |
|---|---|---|
| medium | > -8 and > FLT250 | early stage |
| high | > -4 and > FLT325 | developing |
| very high | > -1 and > FLT400 | deep convection |
Disclaimer/Publisher’s Note: The statements, opinions and data contained in all publications are solely those of the individual author(s) and contributor(s) and not of MDPI and/or the editor(s). MDPI and/or the editor(s) disclaim responsibility for any injury to people or property resulting from any ideas, methods, instructions or products referred to in the content. |
© 2024 by the authors. Licensee MDPI, Basel, Switzerland. This article is an open access article distributed under the terms and conditions of the Creative Commons Attribution (CC BY) license (https://creativecommons.org/licenses/by/4.0/).
Copyright: This open access article is published under a Creative Commons CC BY 4.0 license, which permit the free download, distribution, and reuse, provided that the author and preprint are cited in any reuse.


