Submitted:
12 March 2024
Posted:
20 March 2024
You are already at the latest version
Abstract
A labyrinth metamaterial wall with glass coverage is measured in a reverberating chamber and after its installation in a restaurant. Glass is used to meet two aims, namely acoustic absorption and visual design demands. The wall consists of five multiple labyrinth elements of 1.83 m$^2$ each. Glass was taken to make the wall act as a room lightning device where a translucent cover material is needed. Absorption measurements show about four times improved absorption compared to typical glass. Due to the metamaterial behavior, absorption is high in the low-frequency range below 300 Hz where damping is problematic with traditional materials. Especially in this range, the glass metamaterial wall is an excellent compromise between room acoustic and visual design demands, as loud low-frequencies make visitors speak louder and experience less intimacy with additionally reduced speech intelligibility. For mid-frequencies, absorption is shown less effective and improvements are discussed.
Keywords:
Room Acoustics
; Acoustic Metamaterials
; Restaurant Acoustics
0. Introduction
Ambient sound is an important aspect of restaurant quality rating. However, no clear picture of the reasons for complaints and the complex interaction between auditory and visual cues and visiting experience has been found yet.
Reproducing a restaurant ambient sound with a 64 loudspeaker system, substantial differences between the rating of the original restaurant and the reproduction were found [26], where reproduction was much more annoying than the original case, pointing to customization of ambient noise in real restaurants. Differentiating between noise annoyance, speech intelligibility, and privacy difficulty shows high correlation between all three parameters. This means that privacy was found to be a problem with increasing background noise. The study finds such findings counterintuitive by expecting ambient noise to lead to a more private experience. Still, this finding is in line with noise annoyance in general, where noise from other sources is the main reason for annoyance [24]. Tarlao et al. find an increase in the duration of customers’ stay in a restaurant and an increase in money spent with increasing sound pressure levels correlating with increased eventfulness and monotony. Still, the pleasantness with increased background noise only holds for non-noise-sensitive subjects, while for noise-sensitive subjects, the opposite is the case.
A correlation between reverberation time in restaurants and annoyance was found [32]. Still, the relation to the overall restaurant quality rating is poor. Comparing background sounds like other talkers or music, physical sounds like air conditioning or noise produced by kitchen equipment, and manager handling of situational sounds, like loud children, all three were found to influence customer satisfaction [36]. Still, no interaction between these three was found, pointing to all aspects being independent. Customers approve managers’ handling of situational sounds, accept kitchen sounds as necessary, find background noise dissatisfying, and stay longer in restaurants playing background music [12]. The influence of gender and the type of retail store also correlates with the effect of background music [3].
The annoyance of background sound and music in restaurants is only poorly differentiated with respect to musical parameters. In a review, Michel et al. find background music having positive, negative, or neutral effects on customers’ time spent in a location, money spent, and overall satisfaction or brand identification highly differentiated with respect to location, musical genre, tempo, next to others [25]. In an early study, classical compositions were rated as ’happy’, ’sad’ or ’neural’ and correlated to musical features, where ’happy’ pieces showed internal definiteness and uniformity in harmony, tempo, dynamics, and rhythm [2] and influenced the emotional response of subject when used as background music of commercials. The effect of the tempo in music presented in shops was found to influence product diversity seeking in shops [30].
0.1. Relation of Sound and Emotion
The relation between sound and emotion has extensively been studied in music relating simple emotions to even single psychoacoustic parameters and also showing high intercultural consistency (for reviews see [16,21,27,28,29]), still again without, as yet, leading to a canonical conclusion. For example, Eerola suggests a three-stage model, with a) core affects, related to a neural response, b) basic or fundamental affects on the level of perception, and c) experience or complex affects on the highest level, representing aesthetics, identity, and cognitive appraisal. By contrast, the BREGVEMA model ([20,22]) suggests eight mechanisms, among them physiology, memory, embodied, or appraisal. This model attempts to explain the inter-subject consistency as well as the individuality of emotions evoked in subjects perceiving music on different and changing emotional levels. Another complementary approach accounts for emotions in terms of the two dimensions of valence and arousal and has been extensively applied to musical emotions ([14,18], next to many others). This approach is compatible with a division of emotions in opposite extremes, such as positive and negative, calm and intensive, evoking fleeing or attracting body reactions, etc., often over time.
0.2. Low-Frequency Annoyance and Speech Intelligibility
The annoyance of low-frequency sound components [24] and its disturbing role in health [8,9,35] are well known. Perceptually, low frequencies are perceived as big, deep, or large. This holds for musical tones as for concert spaces [10]. In room acoustics, the parameter of bass ratio is correlated with venue acoustic quality. In venues for Rock/Pop and related genres, a long reverberation time in the bass range leads to a doomy, noise-like drone sound. This was found novel during the 1960th, where a prominent example is the Star Club in Hamburg, where the Beatles developed their sound according to the doom-like character of the venue [7]. Still, this doomy sound is no longer acceptable for modern venues [1]. Modern bass-line production and sound systems using subwoofers are able to reproduce bass frequencies with high precision, making it necessary for a venue to have a very low reverberation time in the bass frequency region.
Speech intelligibility is influenced by background noise, which also causes a change in speech production called the Lombard effect. Interestingly, speech intelligibility increases in the presence of background noise due to an increase in speakers f0 and a decrease of spectral tilt towards higher frequencies [31]. Speakers also increase their speech volume. The role of low frequencies for speech intelligibility is poorly studied, too. The role of the presence of f0 in electric-acoustic hearing has been shown to considerably improve speech intelligibility [11]. The glimpsing of relevant cues in sentences benefits from f0 presence and is disturbed by the background low-frequency energy of other talkers.
Overall, research has not arrived at a clear picture of the impact of noise on restaurant quality. This holds especially true for low frequencies. It is caused at first by the restricted possibilities of low-frequency attenuation in room acoustics, which means high costs for restaurants to damp low frequencies. It is also caused by the complex experimental measurements in the low-frequency range. Still, low frequencies are known to be perceived as big and deep and, therefore, counteract an intimate room perception. They are also known to blur auditory perception when bass frequencies are present with long reverberation time, as is very well known in rock/pop venues or clubs. Also, speakers increase their speech volume with present ambient sound, which also holds for low frequencies.
Damping of low frequencies is therefore expected to improve room acoustic quality in restaurants.
0.3. Acoustic Metamaterials
Damping low frequencies in rooms is not trivial. Traditionally, bass traps or room-in-room solutions exist.
Bass traps are spaces separated from the main room of such size to resonate low frequencies. Low frequencies are decaying in these rooms, leading to a reduced reverberation time in this spectral range. Although bass traps are efficient, they need a lot of space to resonate low frequencies and, therefore, considerably reduce the size of the room.
Room-in-room solutions are mainly used to isolate a room from its surroundings in the lower frequency range and are, therefore, not room acoustic solutions in the first place. With material, sound insulation is much easier to achieve from mid and high frequencies but ineffective in the lower spectral range. Room isolation means a detachment of the inner room walls from a second room around the inner room. Then, only air-borne sound and no longer structure-borne sound is transmitted from the inner room to the outside world. This leads to a substantial attenuation of sound power radiated from the space over the whole spectral range, including the lower frequencies. This solution is very cost-intensive and not applicable to restaurants.
A recent advance of damping low frequencies is achieved via metamaterials for complex structures leading to negative stiffness or negative density [19]. Strong damping also appears in sonic crystals, leading to band gaps [15], when mass is attached to a membrane [34] or plates [13]. Also, labyrinth structures were proposed for strong sound attenuation [23]. Metamaterials have also been used for sound design in musical instruments with drums [6], or strings and spheres [4]. or [5].
A metamaterial labyrinth wall was suggested for broad-band and low-frequency sound absorption [5]. In its simplest form, the labyrinth is about 1 m x 1 m x 0.08 m in size and hosts a labyrinth built from wood or material with hard sound boundary conditions. The labyrinth is filled with air. The front and back plates are made of wood, glass, or any other solid material. Sound approaching the wall’s front side is either reflected or entering the wall labyrinth air column. The proposed labyrinth structure has a lowest frequency of 44 Hz, which is in the very low-frequency range. Furthermore, eigenmodes of the labyrinth are present over the whole frequency range, making it reactive to very low frequencies and over the whole audible frequency range.
In a combination of four such labyrinth structures arranged in a regular grid of 2 x 2 labyrinths, the wooden structure separating the single labyrinths was found not to be ideally sound isolating, as expected. Therefore, a coupling between the single labyrinths appears. In simulations, the lowest eigenmode of the 2 x 2 array is at 14 Hz, therefore in the infrasound range. Although such frequencies are no longer audible, they are of high interest, e.g., with wind turbine noise having about 90% of sound energy in the infrasound domain [9].
Furthermore, as the lowest eigenmode at 14 Hz is so low, in the frequency range up to 100 Hz, about eight eigenmodes exist, whereas with a single labyrinth, there is only one eigenmode at 44 Hz. This strongly increased mode density up to 100 Hz leads to a much higher reactance in the low-frequency range compared to a single labyrinth.
0.4. Research Question and Application
Often, a trade-off between the needs of room acoustics and the demands of architects or designers in public spaces leads to unsatisfying results. Room acoustics often asks for applying material suitable for noise reduction but not visually acceptable by designers. On the contrary, design features, like glass walls, are acoustically leading to no solution.
The presented metamaterial labyrinth wall built of glass surfaces might be a solution to improve the situation. Although glass is not the best material to test the sound absorption features of metamaterials due to the strong reflection behavior, the metamaterial labyrinth might help to improve sound absorption and, therefore, help to balance the trade-off.
The measured metamaterial walls were elements implemented in a restaurant for both visual improvement and sound absorption. Right from the start of the experiment, it was clear that the wall area possibly built in the restaurant, about 11 m2s, would not be sufficient to meet both demands, no matter how good the absorption behavior of any material. Still, the visual impact on the room is considerable, and the absorption of such a device could be investigated.
1. Method
1.1. Metamaterial Wall
The basic element of the metamaterial wall is shown in Figure 1. In the figure, gray regions are filled with air, while white regions are solid strucures. The labyrinth is closed on all sides. Four labyrinth arms join in the middle section and therefore constitute a single air volume. The labyrinth is expected to have a lowest eigenmode of 44 Hz as discussed in a previous paper [5]. Combining four such elements in a 2 × 2 grid lead to a resonance frequency of 14 Hz theoretically.
The metamaterial wall built for the experiment consists of several elements. Each element consist of two air filled labyrinths placed on top of each other but disconnected one from another by wood. Each element has dimensions of 201 cm height, 91 cm width and 10 cm depth and therefore has a surface of 1.83 m2.
The elements are built of wood in terms of their frame and the labyrinth. For the front glass is used. Inside the glass a light source is placed to be used as lightning elements in the restaurant. Additionally, during daytime, the labyrinth is considered an attractive visual element of the restaurant interior. Figure 2 shows two impressions of the wall implemented in the restaurant. On the top two elements are shown. One is placed upside on the left in the back. Another element is hanging horizontally above the counter. The bottom picture shows the lighted elements on the other room side from where the first picture was taken.
The measurements were performed in the reverberating chamber of the University of Applied Sciences Hamburg and at the Kutscherscheune restaurant.
1.2. Reverberating Chamber Measurements
The measurements in the reverberating chamber were performed at the University of Applied Science in Hamburg. This chamber has a volume of 150 cubic meters. Five wall elements were placed inside the chamber.
In the restaurant six elements are implemented. Still, for the measurements not all elements were produced. In measurements, two elements have glass at front and back of the labyrinth. Two elements have glass on one side and wood on the opposite side, again with the labyrinth in between. And one element has the labyrinth but with one side open and one side covered with wood. The element with one side open is not expected to work as a metamaterial device and is, therefore, expected not to act on low frequencies considerably.
All elements were placed upside-standing with a minimum distance to the chamber walls of 1 m. The elements were placed in a complex order in that no elements were placed parallel one to another. Figure 3 shows an impression of the reverberating chamber, the wall assembly, and the measurement equipment.
Using a Qohm dodecamer loudspeaker of QSources driven by a PA1000 amplifier, white noise is used as a sound source. Recordings were performed using an artificial head of HEAD Acoustics with a Quadriga recording device.
The method of switching off a white noise signal was used to measure reverberation time. Four measurements were performed, placing the artificial head at different positions in the reverberating chamber. The impulse responses were Fourier transformed using adjacent time windows of 225 ms, and Schumann backward integration was used to calculate frequency-dependent T20 reverberation times. As discussed below, for high frequencies in the case of metamaterial walls in the chamber, the signal was too low to measure T20 reliably as the decaying signal was disturbed by measurement equipment noise.
Frequency-dependent absorption coefficients were calculated according to DIN 354, averaging over the four positions, although it is not clear how to apply the formula to metamaterial walls. The formula asks for an absorption surface. Still, with metamaterial structures, absorption takes place in the air volume inside the metamaterial structure. Also, as in this investigation mainly low frequencies are of interest, the single wall element without coverage is taken out of the calculation, resulting in a surface of 7.32 m2 in total to enter the calculation.
The metamaterial wall is expected to work in the low-frequency region below about 200 Hz. Still, the reverberating chamber used is not suitable for measuring in the very low-frequency range. To the best of our knowledge, there is no measurement facility able to reliably measure in such low-frequency regions. Therefore, the measurements presented here are only a first approximation to estimating the absorption properties of metamaterial walls of such construction.
1.3. Restaurant Measurements
The reverberation time in the restaurant was measured before and after the implementation of the metamaterial wall. A sine sweep from 20 Hz to 10 kHz was played back via a Genelec 8050B loudspeaker and recorded via a Behringer ECM 8000 omnidirectional microphone and an Antelope ZEN Q Synergy Core sound card. A loudspeaker with decisive directional characteristics was used to estimate speaker directivity effects with respect to speech intelligibility in a later study. The measured reverberation times did not considerably depend on the placement of the loudspeaker.
Eight loudspeaker/microphone setups were used for measurements. The resulting sine sweeps were deconvolved using the method of inverse filtering [17]. The resulting impulse responses were Fourier transformed with adjacent time windows of 50 ms, and Schumann backward integration was used to calculate frequency-dependent T20 reverberation times.
Again, the algorithm of DIN 354 was used to calculate the reverberation time. Of course, this norm does not apply to real spaces but only to reverberating chambers, still it was applied for the sake of comparison.
2. Results
2.1. Reverberating Chamber Measurements
The averaged reverberation T20 times are shown in Figure 4 for the empty chamber (yellow) and when placing the metamaterial walls (blue). The yellow curve shows a large T20 around 200-400 Hz of up to 10 seconds. Below about 200 Hz, T20 decreases considerably. Up to 4 kHz, reverberation time is still high around 3-4 seconds.
When placing the metamaterial walls in the chamber, T20 is considerably reduced over the whole frequency range. While the frequency dependency of T20 for the chamber without walls shows an exponential decay, as expected , the spectrum with metamaterial does not show such a behavior. Instead, from about 1.5 kHz on, T20 is more or less constant. Near 4 kHz, the T20 of the measurement with walls is no longer reliable. When taking a closer look at the data, it appears that the energy in this frequency region is so low that attenuation by about 20 dB is already disturbed by measurement equipment noise.
The frequency-dependent absorption coefficient is shown in Figure 5. It is integrated with respect to minor third intervals with 125 Hz as the lowest frequency. In the 125 Hz band a = 0.45 and decreasing towards higher frequencies. The frequency bands starting from 2 kHz are not reliable, as discussed above, caused by the energy in the chamber with walls so low that already at about 20 dB decay the signal is disturbed by measurement equipment noise.
In blue, the absorption values for typical glass are shown which are at about a = 0.1 for about 100 Hz and decay to a between 0.01 - 0.04 for higher frequencies. The metamaterial wall, mainly built of glass, is considerably outperforming typical glass. At 125 Hz, it is about four times more absorbing, also at 300 Hz.
The absorption coefficient is strongest with low frequencies, as expected. Taking into account the hard boundary condition of glass, the damping is strong. Still, the metamaterial damping effect is outperforming that of typical glass over the whole frequency range.
2.2. Restaurant Measurements
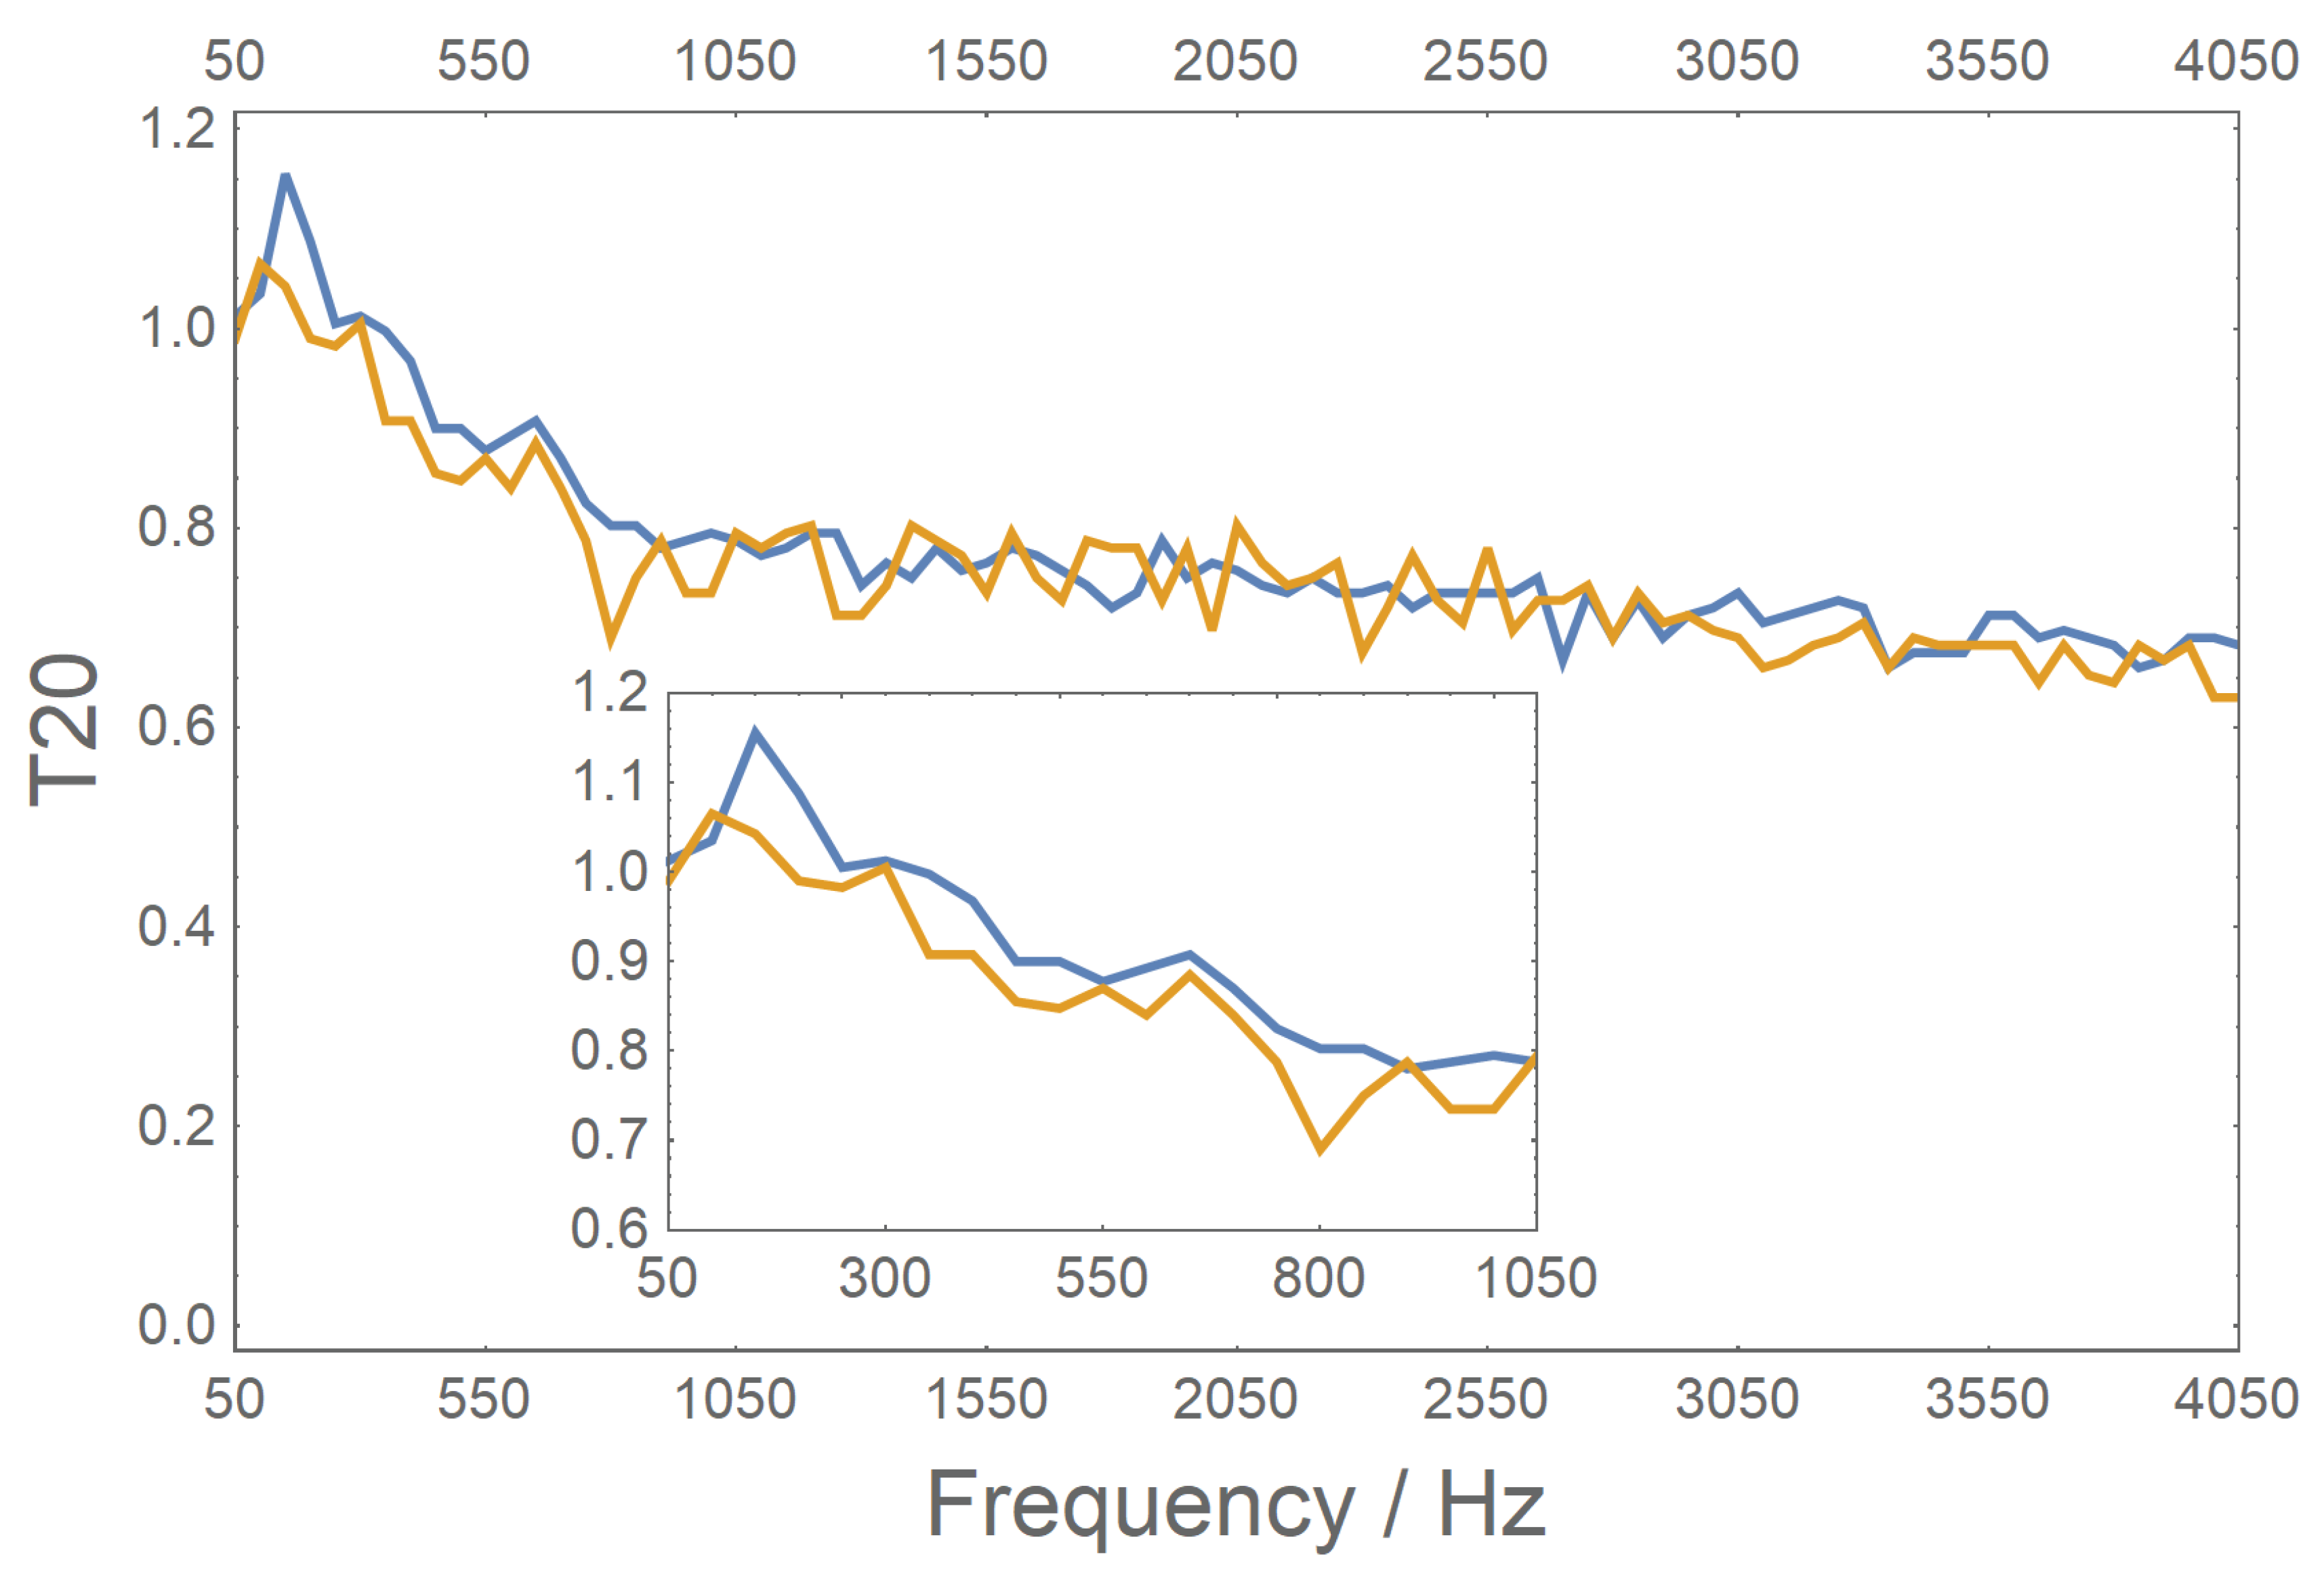
As expected, the impact of the metamaterial wall of only 10.98 m2 in the restaurant was not sufficient to attenuate the mid frequencies considerably. Figure 6 shows frequency-dependent T20 for the venue before (blue) and after (yellow) implementation. The inset in the figure zooms into the region up to 1 kHz.
Clearly, a damping effect considerably appears for low frequencies up to 300 Hz, which continues up to about 1 kHz. Above 1 kHz, the difference measured is within measurement precision.
Applying the DIN 354 formula to the change of T20 of the frequency responses with and without metamaterial walls, an absorption coefficient of a = 0.37 was calculated. This is close to a = 0.45 of the reverberating chamber measurement. The algorithm is not meant to be used in real situation, still it is interesting to see related results in both cases.
3. Conclusions
The absorption of a labyrinth metamaterial wall covered with glass is outperforming typical glass by about 4 times. Especially in the low-frequency range, damping is exceptional for glass. This frequency range is the most demanding in terms of room acoustic damping, and therefore, the proposed metamaterial structure is a low-cost, small-sized solution for damping low frequencies in room acoustics.
The reason for this behavior is not perfectly clear. If glass reflects sound at low frequencies to about or over 90 %, it is not clear how the sound enters the metamaterial to be damped there. The sound might enter the wall through the sides of the structure, which are built of wood in this case. It might also be an altered behavior of the glass covering a resonating labyrinth of air. Future investigations could clarify this point.
Starting from this considerations, the damping behavior is expected to be considerably improved with several measures. Glass could be replaced by alternative materials with different absorption behaviors but still be translucent to act as lightning in restaurants. It could also be replaced by non-translucent materials in cases this feature is not needed in the venue design. Also, the sides of the wall could be replaced by alternative material or built with holes or even as open space, making it easier for sound to enter the wall. Finally, the interior of the labyrinth and its boundaries could be covered with absorbing materials, not disturbing the translucent feature.
Such alternations would be expected to considerably improve the absorption behavior of the wall, especially in the mid-frequency range, for which the present wall is not built.
Funding
The research was not funded by any third party.
Institutional Review Board Statement
The study does not include ethical issues.
Acknowledgments
Many thanks to Prof. Wolfgang Gleine, Prof. Robert Mores and their team Daniele Usai und Christian Wischmann for letting us measure in their reverberating chamber and all their help and support. A great thank you to Hannelore Witzendorf and her team to allow the implementation in the Kutscherscheune. Also many thanks to Roman Stracke for his support).
Conflicts of Interest
There are no conflicts of interest.
References
- Adelman-Larsen, N. W.: Rock and Pop Venues. Acoustic and Architectural Design. Springer 2014.
- Alpert, J.I.; Alpert, M.I. Music influences on mood and purchase intentions. Psychol. Mark. 1990, 7, 109–133. [Google Scholar] [CrossRef]
- Andersson, P.K.; Kristensson, P.; Wästlund, E.; Gustafsson, A. Let the music play or not: the influence of background music on consumer behavior. J. Retail. Consum. Serv. 2012, 19, 553–560. [Google Scholar] [CrossRef]
- Bader, R. & Kontopidis, P.: Acoustic Metamaterials Sonically Designing Musical Instruments and Room Acoustics. In: Alexander Jensenius: Sonic Design, Springer Series ’Current Research in Systematic Musicology’, Vol 12, 2024 (in print).
- Bader, R., Gernert, S., Mischo, J.: Metamaterial labyrinth wall for very low and broad-band sound absorption. Preprint 2020. 2020. [CrossRef]
- Bader, R.; Fischer, J.L.; Munster, M.; Kontopidis, P. Metamaterials in Musical Acoustics: A modified frame drum. In JASA; 2019; Volume 145, pp. 3086–3094. [Google Scholar]
- Bader, R., & Schneider, A.: Playing ’Live’ at the Star-Club: Reconstructing the Room Acoustics of a Famous Music Hall. Albrecht Schneider & Arne von Ruschkowski (eds.): Systematic Musicology: Empirical and Theoretical Studies. Hamburger Jahrbuch für Musikwissenschaft 28. Peter Lang Verlag, 185-210, 2012.
- Berglund, B., Lindvall, T., Schwela, D., and Goh, K.-T.: Guidlines for Community Noise. World Health Organisation 2000.
- Barry, R.; Sulsky, S.T.; Kreiger, N. Using residential proximity to wind turbines as an alternative exposure measure to investigate the association between wind turbines and human health. J. Acoust. Soc. Am. 2018, 143, 3278–3282. [Google Scholar] [CrossRef]
- Blauert, J.; Lindemann, W. Auditory spaciousness: Some further psychoacous+ic analysis. J. Acoust. Soc. Am. 1986, 80, 533–542. [Google Scholar]
- Brown, C.A.; Bacon, S.P. Low-frequency speech cues and simulated electric-acoustic hearing. J. Acoust. Soc. Am. 2009, 125, 1658–1665. [Google Scholar] [CrossRef]
- Caldwell, C.; Hibbert, S.A. Play That One Again: The Effect of Music Tempo on Consumer Behavior in a Restaurant. European Advances in Consumer Research 1999, 4, 58–62. [Google Scholar]
- Colombi, A.; Roux Ph Guenneau, S.; Rupin, M. Directional cloaking of flexural waves in a plate with a locally resonant metamaterial. J. Acoust. Soc. Am. 2015, 137, 1783–1789. [Google Scholar] [CrossRef] [PubMed]
- Coutinho, E.; Dibben, N. Psychoacoustic cues to emotion in speech prosody and music. Cognition and Emotion 2013, 27, 658–684. [Google Scholar] [CrossRef]
- Deymier, P. A. (ed.): Acoustic Metamaterials and Phononic Crystals. Springer Berlin Heidelberg 2013.
- Eerola, T. (2018). Music and Emotions. In R. Bader (ed.), Springer Handbook of Systematic Musicology, 539-554. Springer.
- Farina, A.: Advancements in impulse response measurements by sine sweeps. Proceedings 122nd Convention Audio Engineering Society, Paper 7121, 2007.
- Grewe, O.; Nagel, F.; Kopiez, R.; Altenmuller, E. Emotions over time: Synchronicity and development of subjective, physiological, and facial affective reactions to music. Emotion 2007, 7, 774–788. [Google Scholar] [CrossRef]
- Haberman, M.R.; Norris, A.N. Acoustic Metamaterials. Acoustics Today 2016, 3, 31–39. [Google Scholar] [CrossRef]
- Juslin, P.; Vastfjall, D. Emotional responses to music: The need to consider underlying mechanisms. The Behavioral and Brain Sciences 2008, 31, 559–575. [Google Scholar] [CrossRef]
- Juslin, P.N.; Laukka, P. Communication of emotions in vocal expression and music performance: Different channels, same code? Psychological Bulletin 2003, 129, 770–814. [Google Scholar] [CrossRef] [PubMed]
- Juslin, P.N. & Sloboda, J.A. (2013). Music and emotion. In D. Deutsch (ed.), Psychology of Music (3), Academic Press.
- Krushynska, A.O.; Bosia, F.; Miniaci, M.; Pugno, N.M. Spider web-structured labyrinthine acoustic metamaterials for low-frequency sound control. New J. Phys. 2017, 19, 105001. [Google Scholar] [CrossRef]
- Leventhall, H.G. Low-frequency noise and annoyance. Noise and Health 2004, 6, 59–72. [Google Scholar] [PubMed]
- Michel, A.; Baumann, C.; Gayer, L. Thank you for the music - or not? The effects of in-store music in service settings. J. Retail. Consum. Serv. 2017, 36, 21–32. [Google Scholar] [CrossRef]
- Nielsen, N. O., Marschall, M., Santurette, S. & Jeong, Ch.-H.: Subjective Evaluation of Restaurant Acoustics in a Virtual Sound Environment. Internoise Hamburg 2016.
- Reybrouck, M.; Podlipniak, P. Preconceptual Spectral and Temporal Cues as a Source of Meaning in Speech and Music. Brain Sciences 2019, 9(3), 1–18. [Google Scholar] [CrossRef] [PubMed]
- Scherer, K.R.; Clark-Polner, E.; Mortillaro, M. In the eye of the beholder? Universality and cultural specificity in the expression and perception of emotion. International Journal of Psychology 2011, 46, 401–436. [Google Scholar] [CrossRef] [PubMed]
- Snowdon, C.T.; Zimmermann, E.; Altenmuller, E. Music emotion and neuroscience. Progress in Brain Research 2013, 127, 17–34. [Google Scholar]
- Sun, W.; Chang, E.-C.; Xu, Y. The effects of background music tempo on consumer variety-seeking behavior: the mediating role of arousal. Front. Psychol. 2023, 14, 1236006. [Google Scholar] [CrossRef] [PubMed]
- Van Summers, W.; Pisoni, D.B.; Bernacki, R.H.; Pedlow, R.I.; Stokes, M.A. Effects of noise on speech production: Acoustic and perceptual analyses. J. Acoust. Soc. Am. 1988, 84, 917–928. [Google Scholar] [CrossRef] [PubMed]
- Steffens, J. & Weinzierl, St.: noise for Dinner - Twoards a Comprehensive Statistical Model of the Acoustical and Overall Quality of Restaurants. Forum Acusticum 2023.
- Tarlao, C., Fernandez, P., Frissen, I. & Guastavino, C.: Influence of Sound Level on Diner’s Perceptions and Behaviour in a Montreal Restaurant. Applied Acoustics 174, 2021.
- Tian, H.; Wang, X.; Zhou, Y.-H. Theoretical model and analytical approach for a circular membrane–ring structure of locally resonant acoustic metamaterial. Applied Physics A. Materials Science & Processing 2014, 114, 985–990. [Google Scholar]
- World Health Organization Regional Office For Europe (2018) Environmental Noise Guidelines for the European Region. Available online: http://www.euro.who.int/en/health-topics/environment-and-health/noise/environmental-noise-guidelines-for-the-european-region.
- Yeung, T.M.; Chen McCain, S.-L.; Lolli, J.C.; Larson, B. The Influence of Background Sounds, Physical Sounds, and Managers’ Proactive Customer Service Regarding Situational Sounds on Customer Satisfaction in the Restaurant Industry. Journal of Small Business Strategy 2021, 31, 64–74. [Google Scholar] [CrossRef]
Figure 1.
Two labyrinth elements placed next to each other.
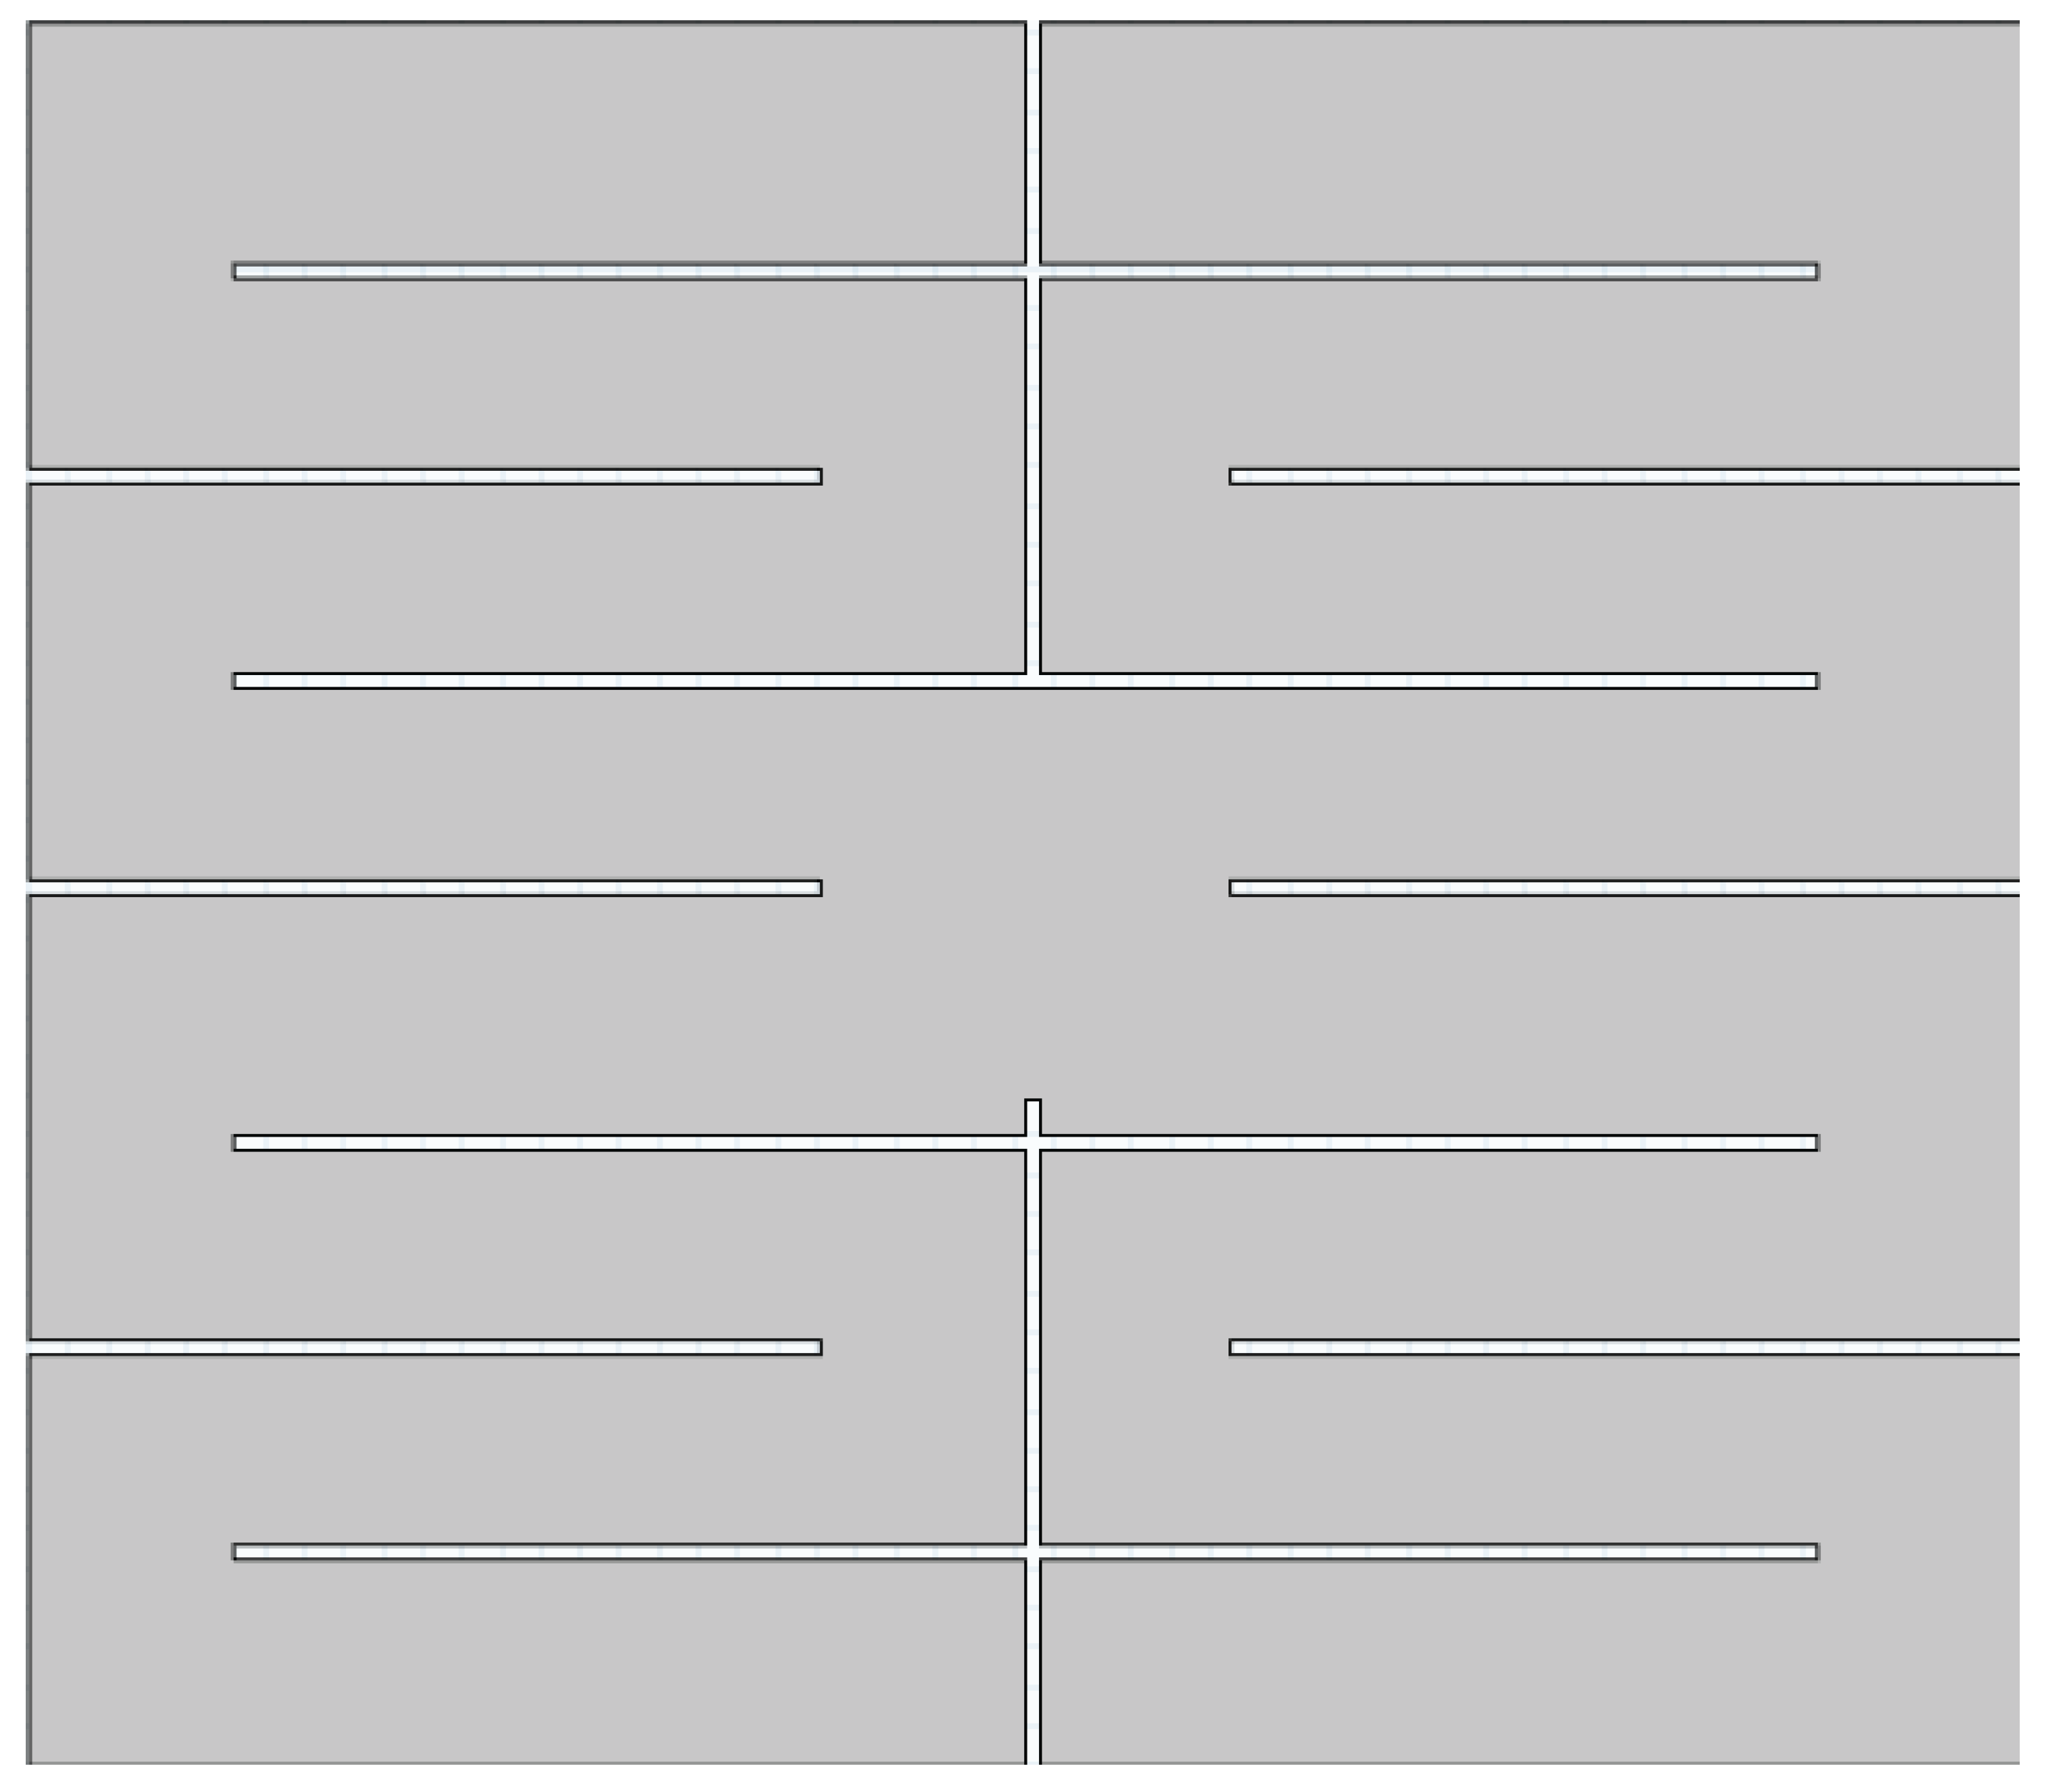
Figure 2.
Two impressions of the metamaterial wall in the restaurant. Top: in the back on the left three elements are shown, where the middle element is a dashboard. At the right one element hangs over the counter. Bottom: The lighted element at the other side of the room which is the foto position of the top foto.
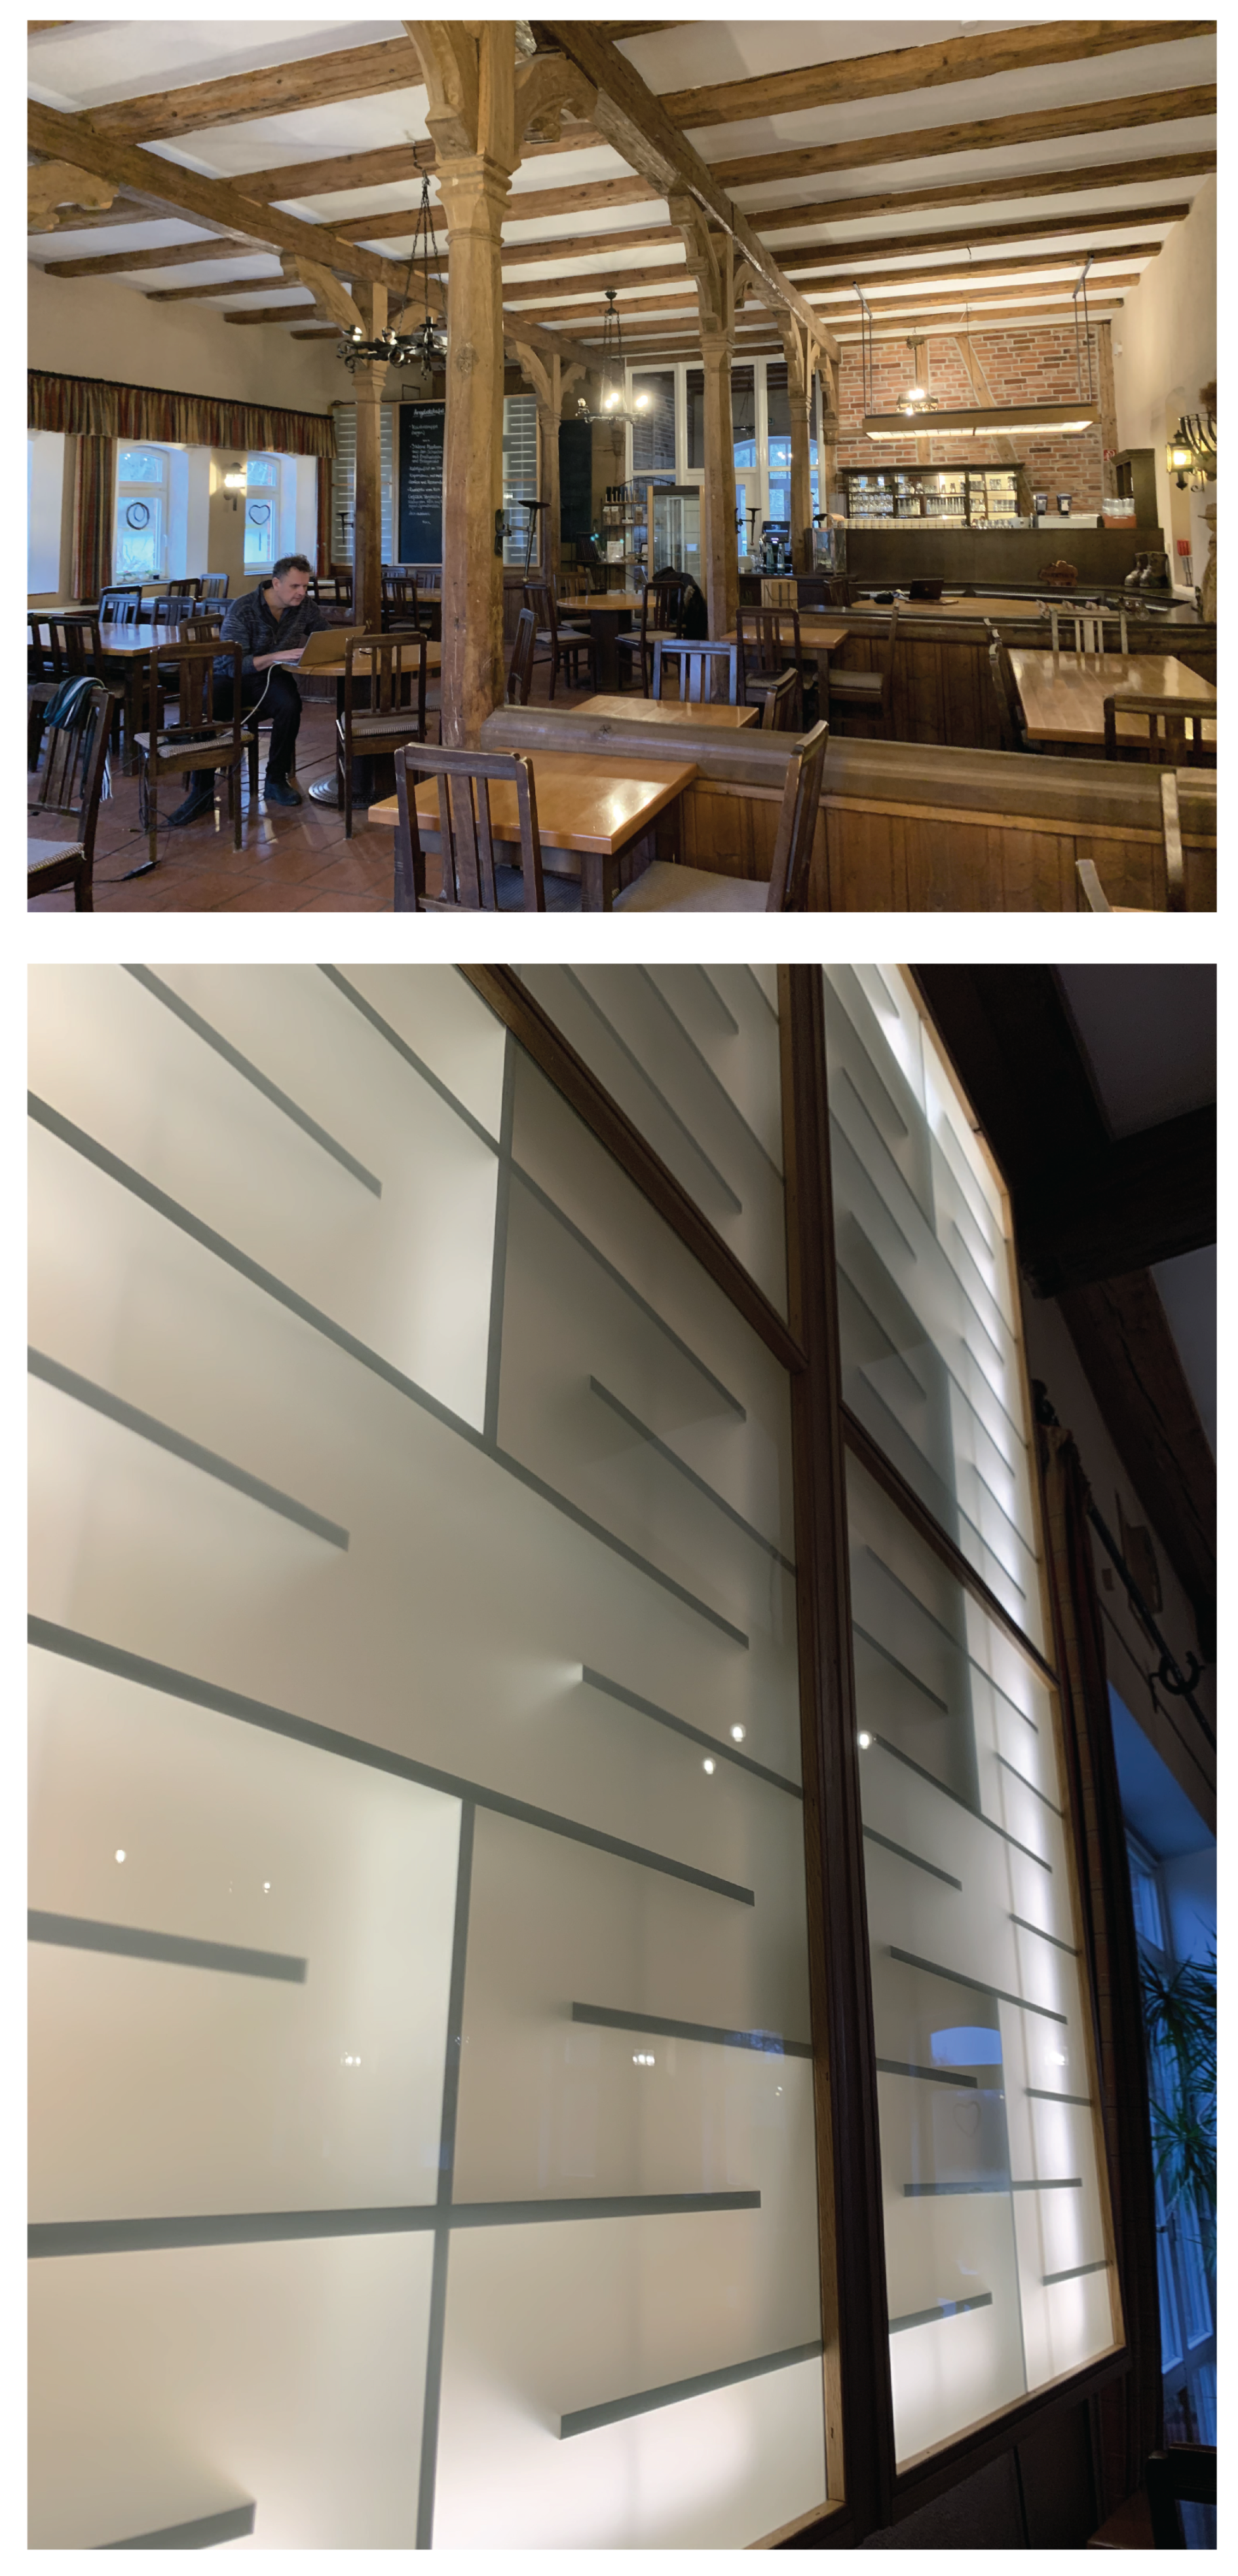
Figure 3.
Impression of the wall and measurement assembly at the reverberating chamber of the University of Applied Science in Hamburg.
Figure 3.
Impression of the wall and measurement assembly at the reverberating chamber of the University of Applied Science in Hamburg.
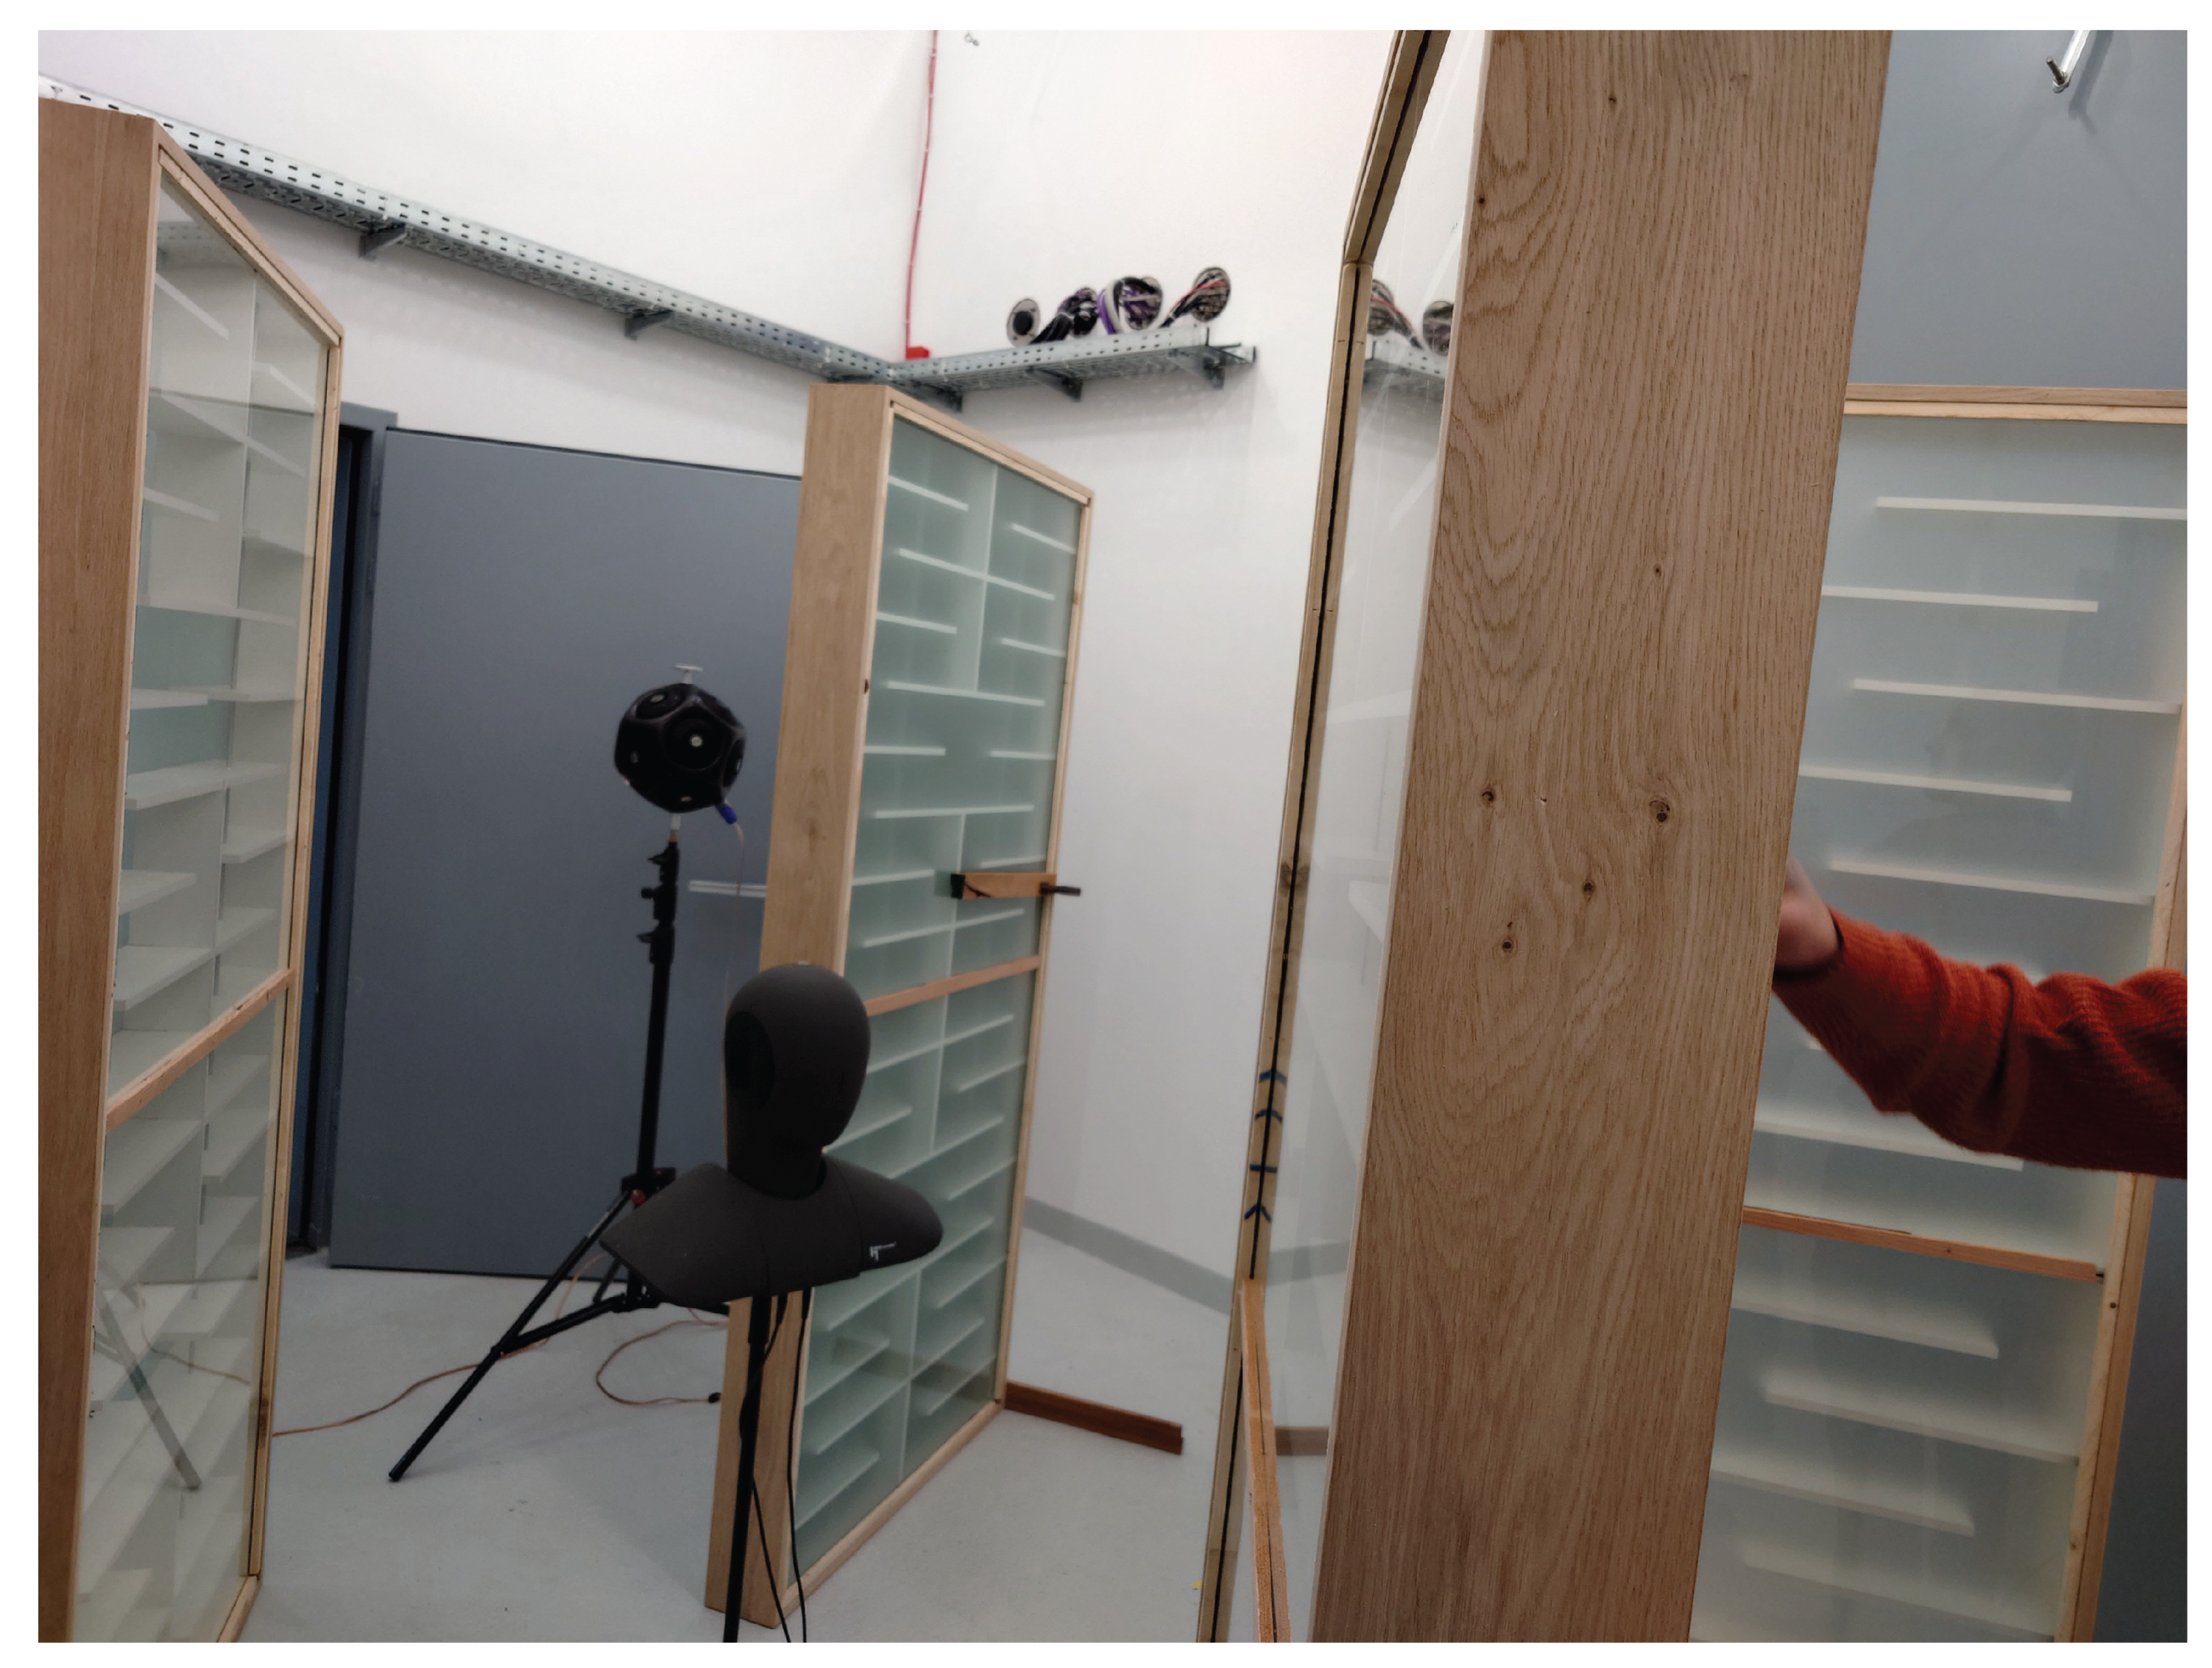
Figure 4.
Frequency dependent T20 reverberation times of reverberating chamber measurements with (blue) and without (yellow) metamaterial wall in the chamber.
Figure 4.
Frequency dependent T20 reverberation times of reverberating chamber measurements with (blue) and without (yellow) metamaterial wall in the chamber.
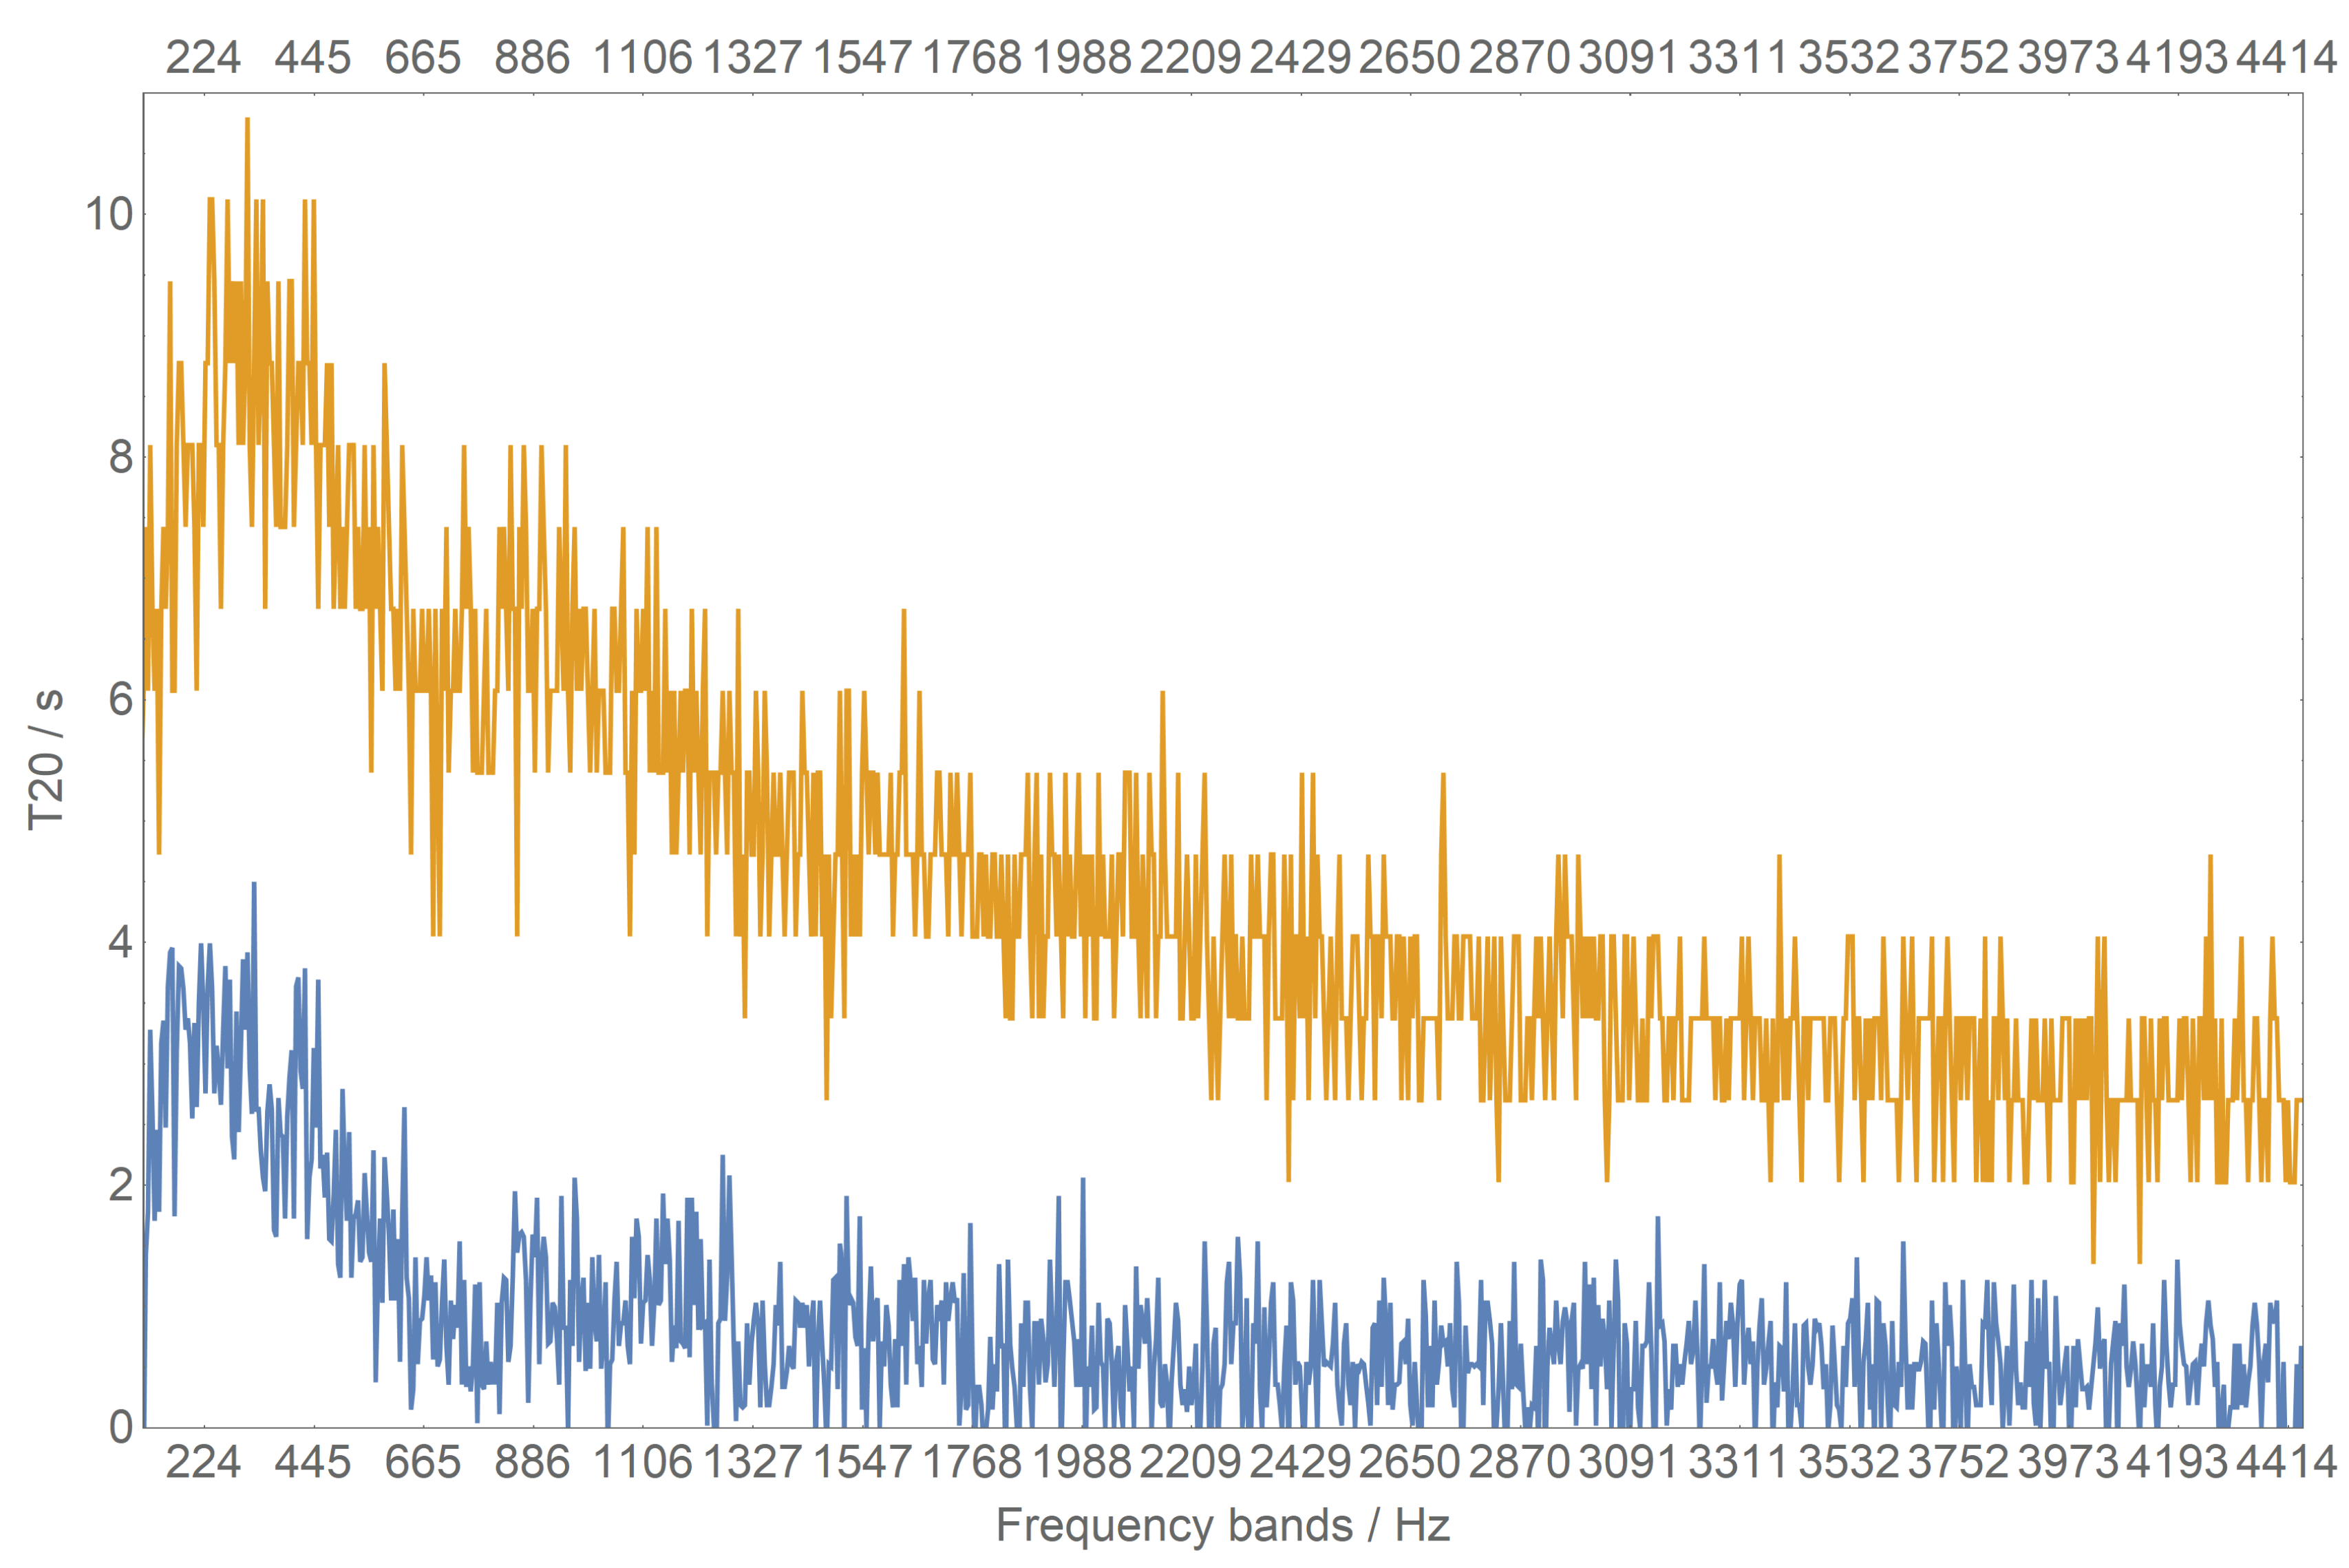
Figure 5.
Absorption coefficient spectrum of the metamaterial wall as measured in the reverberating chamber (red line). The blue dots correspond to the typical absorption coefficients of glass.
Figure 5.
Absorption coefficient spectrum of the metamaterial wall as measured in the reverberating chamber (red line). The blue dots correspond to the typical absorption coefficients of glass.
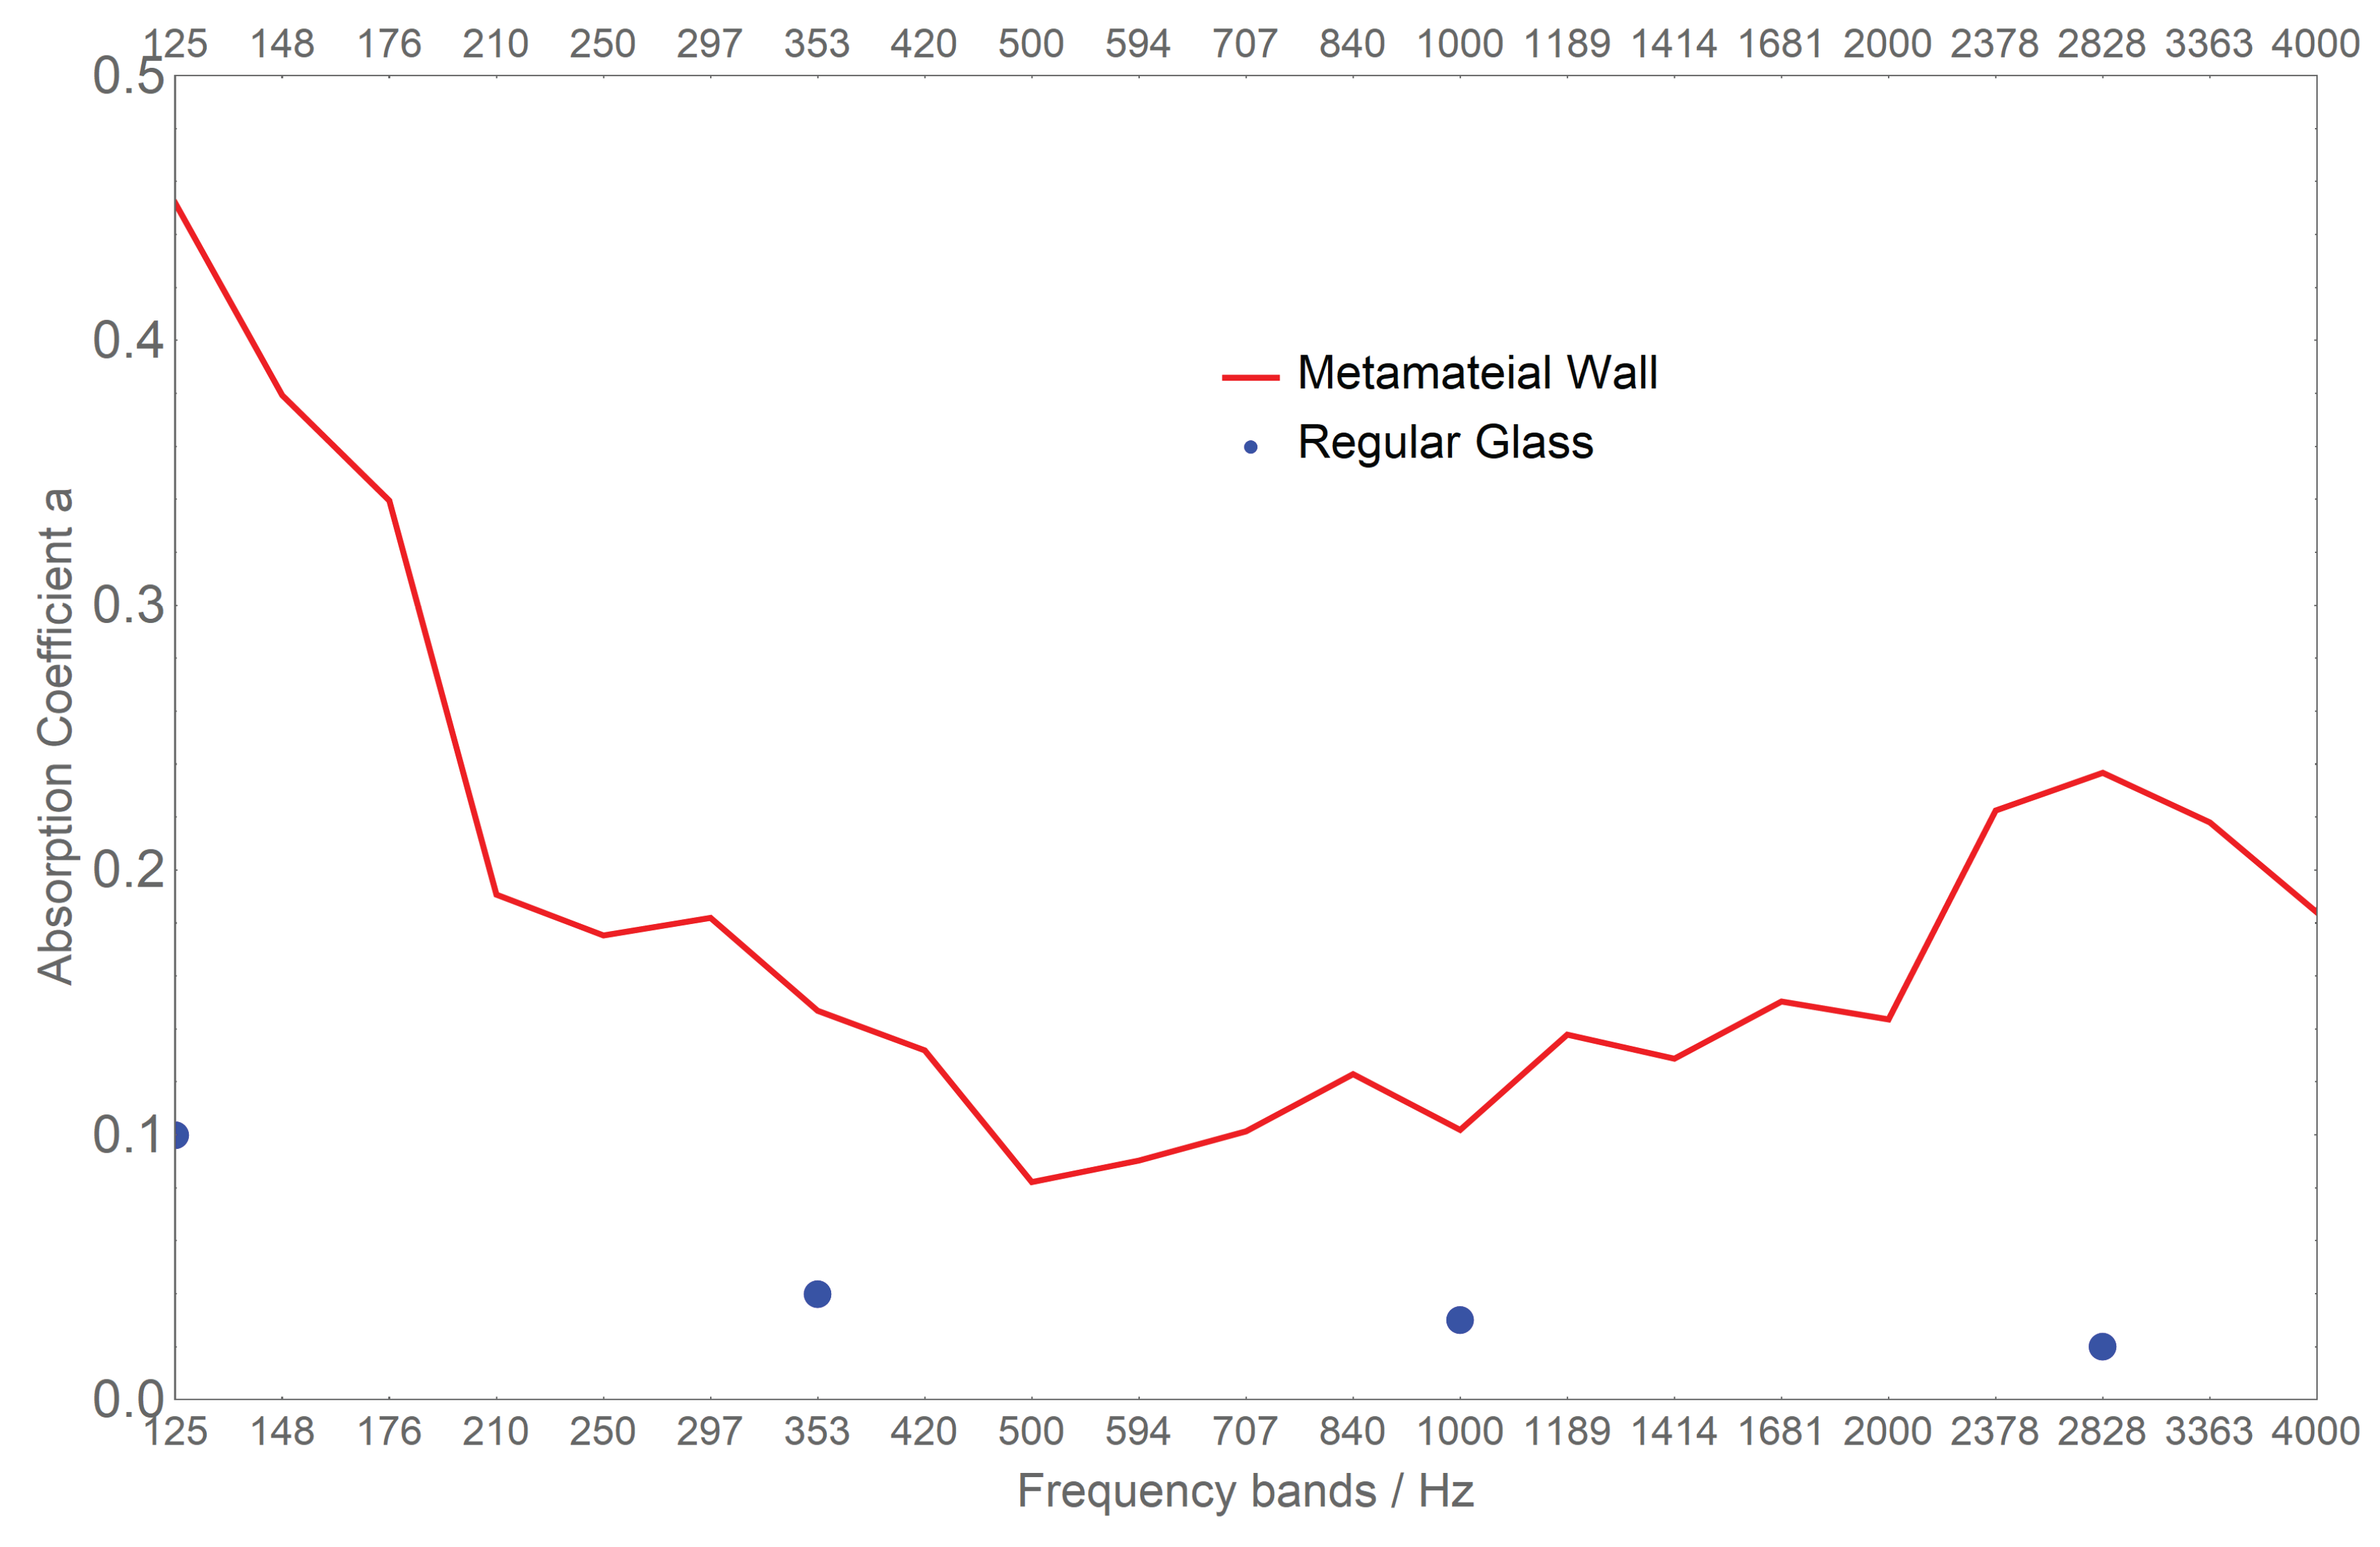
Figure 6.
T20 as measured before (blue) and after (yellow) implementation of metamaterial wall in the restaurant. Inset: zoomed into low-frequency region. As the applied area of 12 m2 is low, the difference is slight, still referring to an overall absorption coefficient of a = 0.37.
Figure 6.
T20 as measured before (blue) and after (yellow) implementation of metamaterial wall in the restaurant. Inset: zoomed into low-frequency region. As the applied area of 12 m2 is low, the difference is slight, still referring to an overall absorption coefficient of a = 0.37.
Disclaimer/Publisher’s Note: The statements, opinions and data contained in all publications are solely those of the individual author(s) and contributor(s) and not of MDPI and/or the editor(s). MDPI and/or the editor(s) disclaim responsibility for any injury to people or property resulting from any ideas, methods, instructions or products referred to in the content. |
© 2024 by the authors. Licensee MDPI, Basel, Switzerland. This article is an open access article distributed under the terms and conditions of the Creative Commons Attribution (CC BY) license (http://creativecommons.org/licenses/by/4.0/).
Copyright: This open access article is published under a Creative Commons CC BY 4.0 license, which permit the free download, distribution, and reuse, provided that the author and preprint are cited in any reuse.


