
Submitted:
18 March 2024
Posted:
19 March 2024
You are already at the latest version
Abstract
Leaf mass per area (LMA) is a key structural parameter that reflects the functional traits of leaves and plays a vital role in simulating the material and energy cycle of plant ecosystems. In this study, vertical whorl-by-whorl sampling of LMA was conducted in a young Larix principis-rupprechtii plantation during the growing season at the Saihanba Forest Farm. The vertical and seasonal variations in LMA were analysed. Subsequently, a predictive model of LMA was constructed. The results revealed that the LMA varied significantly between different crown whorls and growing periods. In the vertical direction of the crown, the LMA decreased with increasing crown depth, but the range of LMA values from the tree top to the bottom was, on average, 30.4 g/m2, which was approximately 2.5 times greater in the fully expanded phase than in the early leaf-expanding phase. The LMA exhibited an allometric growth trend that increased during the leaf-expanding phase and then tended to stabilize. However, the range of LMA values throughout the growing period was, on average, 40.4 g/m2. Among the univariate models, the leaf dry matter content (LDMC) performed well (Ra2=0.45, RMSE=13.48 g/m2) in estimating the LMA. The correlation between LMA and LDMC significantly differed at different growth stages and at different vertical crown whorls. The dynamic predictive model of LMA constructed with the RDINC and DOY as independent variables was reliable in both the assessments (Ra2=0.68, RMSE=10.25 g/m2) and the validation (MAE=8.05 g/m2, FI=0.682). Dynamic simulations of crown LMA provide a basis for elucidating the mechanism of crown development and laying the foundation for the construction of an ecological process model..
Keywords:
Larix principis-rupprechtii
; leaf mass per area
; leaf dry matter content
; crown whorl
; leaf growth phase
1. Introduction
The Leaf economics spectrum (LES) is a set of interconnected and synergistic functional traits, which quantitatively represent a range of steadily shifting plant resource trade-off strategies [1,2]. At the heart of this complex and multifaceted trait network lies leaf mass per area (LMA) [3]. LMA is the ratio of dry leaf mass to the corresponding leaf area and is a combination of various leaf anatomical characteristics [4]. It is widely used to estimate leaf area indices [5,6] and simulate canopy photosynthesis [7,8]. LMA values vary among different tree species, different environmental conditions and different leaf developmental stages. Thus, the accurate and swift measurements of LMA and its dynamic changes are highly important for understanding the growth processes of trees, simulating canopy photosynthesis, and estimating forest productivity.
The crown is the primary organ responsible for photosynthesis in trees. Its intricate three-dimensional structure of branches and leaves affects the local microenvironment of the crown, resulting in spatial differences in leaf functional traits in different areas of the crown [9,10,11]. Studies have shown that the LMA of crowns in various forest types tends to increase from the bottom to the top of the crown [12,13,14]. This increasing pattern of LMA is usually associated with the light gradient through the crown and the water potential gradient from the root to the crown [15,16,17]. In addition to the vertical variation in the crown, LMA also varies significantly across the different developmental stages of trees. Nouvellon et al. [19] reported that LMA changes drastically over different months, which was also confirmed by Rossatto's research [20] on savanna grassland tree species and forest tree species in central Brazil. This variation in LMA can be attributed to differences in temperature, precipitation and solar radiation among the different periods.
The alteration of LMA typically depends on the leaf dry matter content (LDMC). Plants can acclimate to diverse circumstances through varied dry matter investments. Consequently, the correlation between traits is strongly associated with the resources and environment in which plants are located. Previous studies have demonstrated that there is a significant correlation between LMA and LDMC, and the association is significantly disparate under diverse environmental conditions [21,22]. For trees with a conspicuous canopy structure, the gradient discrepancy of the canopy microenvironment in the vertical direction [23] will cause a shift in the correlation between different canopy depths. Zhang [24] studied the vertical changes in the LMA and LDMC of Pinus yunnanensis with canopy height. The results showed that different LMA and LDMC values exhibited distinct changes with canopy height. Tian et al. [25] reached the same conclusion. Additionally, alterations in the temperature, precipitation and solar radiation of plants during different growing seasons will make the environment in which leaves are situated highly heterogeneous. This will lead to different changes in LMA and LDMC with canopy height at different growth stages.
Due to the limitations of leaf area measurement technology [26], it is very difficult to measure LMA. Currently, LMA is measured by retaining some leaves of the analysed tree and establishing a single tree leaf biomass model based on the leaf biomass of the analysed tree and its diameter at breast height [27] or by directly calculating LMA from the measured total leaf area and leaf dry mass. However, for coniferous plants, these methods require considerable manpower and material resources [28,29] because of their three-dimensional structure and large number of leaves. To address this issue, an increasing number of researchers are estimating LMA by establishing regression models between LMA and plant traits, leaf morphology, or environmental conditions such as leaf length, leaf width [30,31], branch height [32,33], and LDMC [34,35,36]. As the correlation between LMA and vertical direction in a tree crown is significant, variables related to vertical height, such as branch height, depth into crown and relative depth into crown, are often used as the main fitting factors. LDMC is also a common fitting factor, and many studies have discussed the relationship between these two parameters, and typical linear models or nonlinear models are used to fit LMA based on LDMC [37]. Peng's research [38] showed that the LMA of Chinese fir can be estimated by the LDMC and that the model meets the estimation requirements. Therefore, it is important to establish a simple and accurate LMA prediction model for the purpose of simplifying canopy models. Determining LDMC and RDINC is simpler than determining LMA, and both methods meet the estimation requirements of LMA. However, previous studies have taken only leaf samples at one particular point in time or at a specific canopy position. It is yet to be determined whether different leaf development stages and depths of the canopy have an effect on LMA prediction models. Few studies have examined which vertical factor or LDMC can most accurately predict LMA. Furthermore, whether leaf development time can be used as a single factor to predict LMA has not been tested.
Larix principis-rupprechtii is one of the most widely planted trees in North China; it is characterized by strong light tolerance, rapid growth, and longevity and is a valuable native species. This study used a 17-year-old L. principis-rupprechtii from the Saihanba Forest Farm in Chengde city, Hebei Province, as the object of study to compare the differences in the LMA of needles at various crown layers and various leaf development stages, analyse the changes in LMA, and compare the correlations between LMA and other indicators at various crown depths and various leaf development stages. Finally, the best prediction model of LMA for L. principis-rupprechtii plantations was established, which can be used to simulate crown photosynthesis and estimate regional primary productivity.
2. Results
2.1. Correlations between LMA and DOY, RDINC and LDMC
It was evident from the results (Figure 1) that there was a significant negative correlation between LMA and RDINC, with a correlation coefficient of -0.614. However, LMA had a significant positive correlation with LDMC (r=0.697). LMA had no significant correlation with DOY but showed a unimodal trend with increasing DOY..
2.2. Variation in LMA at Different Crown Depths and Leaf Development Stages
The results of two-factor ANOVA (Table 1) revealed that the LMA of L. principis-rupprechtii significantly differed among leaf development stages and crown layers, and the interaction between the two factors had a significant effect on the LMA. There were significant differences between the upper, middle and lower layers of the crown at different stages of leaf development (Figure 2). At the start of leaf development, the LMA decreased from the upper crown (66.68 g·m-2) to the lower crown (38.31 g·m-2). At the middle stage of leaf development, the LMA ranged from 92.38 g·m-2 at the top of the crown to 46.80 g·m-2 at the bottom of the crown. At the end of leaf development, the LMA decreased from 68.24 g·m-2 at the top of the crown to 47.17 g·m-2 at the bottom of the crown.
2.3. Standard Spindle Analysis Results
There was a significant positive correlation between LMA and LDMC across different crown layers and leaf growth phases (Figure 3). The slopes decreased from the upper crown to the lower crown (Figure 3a), and the slopes decreased from the early growth phase to the late growth phase (Figure 3b). On average, the correlations between LMA and LDMC were greater when grouped by leaf growth phase than when grouped by crown layer.
2.4. Model Fitting and Validation Results
Table 2 illustrates the goodness-of-fit results of the 7 basic models that were established with RDINC (Model 1~4), DOY (Model 5) and LDMC (Model 6~7). The models that were established based on DOY and LDMC showed better fitting performance than those that were established based on RDINC, with a high modified determination coefficient (Ra2), low root mean square error (RMSE) and akaike information criterion (AIC). Model 7 showed the best goodness-of-fit, with the highest Ra2 value (0.447) and lowest RMSE value (9.38 g·m-2).
The method of reparameterization was used to establish bivariate models based on the basic models (Table 2), resulting in Model 8~Model 13 (Table 3). The results showed that the fitting performances of the bivariate models were better than those of the univariate models (Table 2). Model 13 was the only model with a Ra2 greater than 0.6 and a RMSE lower than 11 g·m-2. The validation result of Model 13 also performed best, with the lowest value of MAE (MAE = 8.05) and the highest value of IF (0.682). The MEs of Model 8~Model 13 were all negative, indicating that those models were slightly overestimated.
3. Discussion
3.1. Temporal and Spatial Variation in LMA
Our results showed that LMA decreased gradually with increasing RDINC. Studies by Marshall and Monserud [32], Burgess and Dawson [33], Zhou et al. [34] and Tian et al. [25] on the vertical variation in crown LMA in Pinus monticola, Sequoiadendron giganteum, Betula platyphylla and Platycladus orientalis have shown that crown structure is the most direct and active interface between plants and their external environment. Complex crown structures usually exhibit different microenvironmental conditions, such as light, temperature and water vapour deficit pressure [8]. The upper leaves of the crown, which are exposed to strong light radiation and other conditions (e.g., temperature, wind speed, humidity), increase dry matter input to produce more protective tissues to resist the external environment [39,40]. Additionally, the upwards movement of water from roots to crowns inevitably leads to a decrease in the upper water potential [41]. Under water stress conditions, leaves increase investment in vascular tissues and promote water transport to compensate for the impact of lower leaf water potential, resulting in an increase in LMA [42,43]. Conversely, leaves face strong neighbourhood interference and fierce competition for light resources at the bottom of the crown, resulting in a lower LMA with a large and thin morphology.
During the leaf-spreading process, LMA showed a unimodal relationship with DOY (Figure 1) due to an increase in mesophyll cell numbers, inclusions, and cell wall thickness, as well as the maturation of mechanical tissue [15]. May and June are the periods of leaf spread and early leaf growth, and leaves spread quickly to enhance light-capturing abilities, resulting in a lower LMA. During this period, leaves grow rapidly with the division and expansion of leaf cells, which is consistent with the results of Meinzer et al. [44]. LMA significantly increased in the middle growth phase, particularly in the upper crown (Figure 2), which was similar to the finding that the LMA of leaves developing outside the tree crown was significantly greater than that of leaves developing inside the crown [45,46] because of light induction. In addition, LDMC in the form of nonstructural carbohydrates accumulates in cells [47] at the same time, and plants increase leaf thickness to improve leaf photosynthesis and stress resistance, which leads to an increase in LMA. Subsequently, the leaves enter the senescence stage, nutrients are translocated to the branches, the leaves lose water, and the LMA decreases [48]. Using time-integrated irradiance (PPFDINT), Colbe et al. [49] elucidated the seasonal increase in LMA in sugar maple leaves and demonstrated that the leaves are a long-term adaptation to light, with both seasonal accumulation and light intensity having significant impacts on LMA.
3.2. Changes in the Correlations between LMA and LDMC in Various Crown Layers (CLs) and Leaf Growth Phases (LGPs)
LMA and LDMC are interdependent leaf features. The distinct LMA and LDMC distributions revealed two plant resource allocation strategies, namely, accelerated expansion of the light absorption capacity and efficient storage of materials for leaf structure formation [50,51]. Leaf LMA and LDMC not only vary in a wide range of environments but also respond to different situations caused by alterations in crown depth or the leaf growth phase [52,53]. Our study revealed that there was a positive correlation between LMA and LDMC, but the patterns of their correlations differed among different CLs and LGPs (Figure 3). The increase rate of LMA with LDMC decreased from the upper crown layer to the lower crown layer (Figure 3a), implying that plants allocate more dry matter to the highest region of the crown for the same unit of fresh foliage area [54]. Leaves in the upper crown exposed to intense light may face an environment with increased investment in water transportation and relatively less availability of water [55,56]. Thus, leaves increase dry matter input and vascular tissue investment to improve their competitiveness and survival [13]. A denser cell structure and narrow air space could accelerate the exchange rate of leaf water, nutrients, etc., thus optimizing photosynthetic income and resulting in a greater LDMC. On the other hand, the light in the lower crown was weak, and the leaves should adapt to weak light and relatively low dry matter input, resulting in a larger leaf area [57]. This was in line with the research results of Tobias et al. [58].
As the development process of leaves increased, the slopes of the relationships between LMA and LDMC decreased (Figure 3b). The lowest LMA (31.25 g/m2) and LDMC (0.10 g) were observed in the early leaf growth phase (May-June). During this period, leaves tended to allocate less LMA and lower LDMC to enhance the capacity for capturing light, which was beneficial for competition [54]. During the middle leaf growth phase (July August), the leaves had the highest values of LDMC (0.60 g) and LMA (133.33 g/m2). During this period, the leaves were fully mature, displaying the strongest photosynthetic activity and dry matter production capability [14,59]. This finding was consistent with the research of Liu et al. [60], who showed that the crown of Larix olgensis had the greatest photosynthetic capacity in July and August. During the late leaf growth phase, the photosynthetic ability and carbon assimilation rate decrease to a certain extent with low temperature and nutrient depletion, leading to decreases in LDMC and LMA [61,62].
3.3. Optimal Model Selection
The vertical indices of crowns are the most commonly used leaf functional indicators [12,32]. Previous studies have shown that linear, power and exponential models, which were constructed based on RDINC, achieved good fitting performance. However, Peng et al. [38] demonstrated that the model using LDMC as a separate element performed well, which was consistent with our results (Table 2). The Ra2 values for Models 6 and 7 exceeded 0.44, and the RMSEs were lower than 14.0 g·m-2. Fewer previous studies have considered the influence of different leaf growth phases, especially in the early and later leaf growth phases, on the accuracy of the model. Coble et al. [63] demonstrated that disregarding seasonal factors would cause a biased estimation of LMA. Bivariate modelling could improve the goodness-of-fit (Table 3). After reparameterization, the accuracy of Model 8~Model 13 significantly improved, and the Ra2 value increased by more than 0.2 compared to that of the univariate model. Model 13 was chosen as the optimal model with the highest Ra2 (0.678) and lowest RMSE (10.25 g/m2). Interestingly, LDMC, which had the highest correlation with LMA, was not included in the optimal model (Model 13). Fortunately, model 13 had the ability to dynamically predict the DOY.
4. Materials and Methods
4.1. Site Description
The study site was located the Saihanba Forest Farm, Hebei Province, northern China (42°02′ ~ 42°36′N, 116°51′ ~ 117°39′E), with an altitude of 1010 ~ 1939.9 m. The main soil type is sand. The climate type is a typical temperate continental monsoon climate, with an annual average temperature of -1.3 °C, an extreme minimum temperature of -43.3 °C, an extreme maximum temperature of 33.4 °C, an annual average snow cover of 7 months, an annual average precipitation of 460 mm, an average annual frost-free period of 64 days, and an annual average windy day of 53 days. The main tree species are L. principis-rupprechtii, Picea asperata, Betula platyphylla, P. sylvestris var. Mongolica sylvestris, etc. The forest coverage rate is 82%, and the total forest stock is 5.025 million m3.
4.2. Sample Selection
In this research, five sample plots (20 m x 30 m) were established within a 17-year-old, pure L. principis-rupprechtii plantation of the same habitat. All trees with a diameter at breast height (DBH) larger than 5 cm in the sample plot were measured, and factors such as DBH, tree height (H), crown width (CW) and relative coordinates (X,Y) were included. Subsequently, five sample trees with a DBH similar to the quadratic mean diameter (Dg), representing the average state of each sample plot, were chosen. The basic information of the sample plots and sample trees is displayed in Table 1.

Table 1.
The attributes of the sample plots and the photosynthetic sample trees were outlined.
| Sample plots | Sample trees | ||||||
| Plot number | Age (year) |
Quadratic mean diameter (cm) | Mean tree height (m) | Stand density (trees·hm-2) | Tree number | Diameter at breast height (cm) | Tree height (m) |
| P1 | 17 | 12.0 | 11.95 | 2489 | I | 11.2 | 10.5 |
| P2 | 15 | 10.0 | 9.95 | 2461 | II | 11.0 | 11.3 |
| P3 | 16 | 13.5 | 13.80 | 2383 | III | 11.7 | 10.8 |
| P4 | 16 | 12.7 | 12.81 | 2112 | IV | 11.2 | 11.5 |
| P5 | 17 | 11.9 | 12.98 | 2049 | V | 11.9 | 10.9 |
4.3. Measurement of LMA
For a single tree, the crown was divided into various whorls by the whorls of branches from top to bottom. In each group, 3-4 healthy clusters were chosen as samples. The relative depth into the crown (the ratio of depth into the crown to crown length, RDINC) of every sample cluster was recorded, and then the samples were immediately removed and taken back to the laboratory for scanning. The scanned needle samples were dried to a constant weight of 85 °C and weighed (WD). The images were analysed using image analysis software (Image-Pro Plus 6.0, Media Cybernetics, Inc., Bethesda, MD, USA), resulting in a projected leaf area (LA, m2). The LMA and LDMC of each cluster of needle samples were then calculated. The data were collected every half month during the growing phases (approximately from June 1st to September 15th) in 2017.
The LMA and LDMC of each cluster of needle samples were calculated:
where i represents the sample whorls, j represents the date of the measurement, WD represents the dry weight, and FD represents the fresh weight.
LMAi,j=WDi,j/LAi,j (1)
LMAi,j=WDi,j/LAi,j (2)
Table 2. The attributes of LMA and LDMC.
| Layer | Growth phase | LMA(g/m2) | LDMC(g) | ||||||
| Mean | S.D. | Max. | Min. | Mean | S.D. | Max. | Min. | ||
| UC | EG | 74.07 | 16.98 | 108.84 | 39.88 | 0.334 | 0.072 | 0.526 | 0.175 |
| MG | 87.62 | 16.49 | 133.33 | 49.39 | 0.419 | 0.066 | 0.596 | 0.312 | |
| LG | 60.52 | 14.86 | 84.00 | 40.00 | 0.332 | 0.038 | 0.430 | 0.260 | |
| MC | EG | 63.23 | 16.72 | 94.86 | 31.37 | 0.291 | 0.070 | 0.511 | 0.141 |
| MG | 70.65 | 10.33 | 105.04 | 48.28 | 0.343 | 0.056 | 0.538 | 0.233 | |
| LG | 56.86 | 11.78 | 78.70 | 36.86 | 0.317 | 0.032 | 0.460 | 0.263 | |
| LC | EG | 52.83 | 14.23 | 78.08 | 31.25 | 0.288 | 0.085 | 0.527 | 0.100 |
| MG | 59.44 | 7.48 | 84.29 | 44.70 | 0.293 | 0.044 | 0.542 | 0.204 | |
| LG | 46.55 | 10.15 | 61.03 | 32.10 | 0.304 | 0.024 | 0.353 | 0.263 | |
| Pooled | 67.75 | 18.12 | 133.33 | 31.25 | 0.333 | 0.077 | 0.596 | 0.099 | |
Note: UC, MC and LC represent the upper, middle and lower canopies, respectively, while EG, MG and LG represent the early growth phase (June 1–July 15th), middle growth phase (July 16–August 31th) and late growth phase (September 1–defoliation), respectively. The same applies below.
4.4. Model Descriptions
4.4.1. Basic Model Selection
Based on previous research and the scatter plot distribution and correlation between LMA and LDMC, as well as spatial position and leaf growth phase (LGP) obtained in this study, a basic model was established with RDINC, date of year (DOY), and LDMC as independent variables (see Table 3).
Table 3. Model forms.
| No. | Model form | Parameter |
| Model 1 | LMA=a0×RDINC+a1 | a0,a1 |
| Model 2 | LMA=b0×exp(b1×RDINC) | b0,b1 |
| Model 3 | LMA=c0×RDINC2+c1×RDINC+c2 | c0,c1,c2 |
| Model 4 | LMA=d0×RDINCd1 | d0,d1 |
| Model 5 | LMA=e0×(DOY-120)2+e1×(DOY-120)+e2 | e0,e1,e2 |
| Model 6 | LMA=f0×LDMC+f1 | f0,f1 |
| Model 7 | LMA=g0×exp(g1×LDMC) | g0,g1 |
Note: LMA represents leaf mass per area; RDINC represents relative depth into crown; DOY represents date of year. Leaves started to germinate when DOY=120; thus, DOY-120 represents the initial development time of the leaves.
4.4.2. Discrete Analysis and Reparameterization
According to prior research, the relationships between LMA and LDMC, leaf spatial position, and leaf growth phase are evident. Thus, to improve the accuracy of the model, it is necessary to further discretize the LMA data for feature analysis. Models 1-4 simulated the LMA in 9 groups, with intervals of 0.1, based on RDINC. Model 5 simulated the LMA in 6 groups, with groupings of 150, 165, 180, 195, 210, and 225, based on the DOY. Models 6-7 simulated the LMA on RDINC and DOY. Then, the reparameterization was conducted in Models 1-7 according to the correlations between the parameters and RDINC and DOY to form 6 new models with multiple independent variables (RDINC, DOY and LDMC). Finally, the optimal LMA model for L. principis-rupprechtii was selected based on its goodness-of-fit (Equations (1)–(3)) and validation performance (Equations (4)–(6)). The LMA prediction model was then established through parameterization.
4.4.3. Model Assessment and Validation
When fitting the model, 80% of the data are randomly chosen for model fitting, and 20% are used for model validation. The indicators chosen to assess the model's goodness-of-fit are the adjusted determination coefficient (R2), root mean square error (RMSE) and Akaike information criterion (AIC). The indicators for validation are the mean error (ME), absolute mean error (MAE) and fit index (FI). The formulas for computing each index are as follows:
where yi is the observed value, ӯi is the average of the observed values,ŷi is the predicted value, n is the number of samples, and p is the number of parameters.
4.5. Data Analysis
Two-factor ANOVA was utilized to examine whether the LMA of L. principis-rupprechtii significantly differed between different trees and different ring whorls at various growth and developmental stages. Furthermore, Pearson correlation coefficients among LMA, LDMC, RDINC, and DOY were computed, and the correlations between LMA and other factors were analysed. The LMA and LDMC of different canopies and different growth periods were fitted by standardized principal axis analysis. Tests were conducted to determine whether there was a significant difference in slope among the different groups to ascertain whether different canopy depths and growth periods had a significant influence on the correlation between LMA and LDMC.
Microsoft Excel 2010 was used to collate the data of the study; descriptive statistical analysis was performed using SPSS 24; model fitting was completed by the nls package in R 4.0.5; standardized principal axis analysis was completed by the smatr package in R 4.0.5; and diagrams were drawn with the ggplot2 package in R 4.0.5 and Origin 2019.
5. Conclusions
Tree leaves (such as L. principis-rupprechtii) can adapt to complex crown structures by altering their own morphological characteristics, which results in significant spatial heterogeneity within the tree crown. In addition, the morphological characteristics of leaves from different crown layers exhibited different seasonal patterns (such as LMA and LDMC). The LMA prediction model using the reparameterization method (Model 13) had the best fitting performance (R2=0.68, RMSE=10.25 g/m2), and the best validation result was obtained (MAE=8.05 g/m2, FI=0.682). Furthermore, Model 13 exhibited dynamic predictions that benefited from the incorporation of DOY.
Author Contributions
Conceptualization, J.W. and Q.L.; methodology, software, J.W.; Y.Z. and Z.Z.; validation, L.X. and Q.L.; investigation, data curation, J.W. and C.J.; writing—original draft preparation, J.W.; writing—review and editing, Q.L. and Z.Z.; visualization, J.W. and L.X.; supervision, Q.L.; project administration, Q.L.; funding acquisition, Z.Z. All authors have read and agreed to the published version of the manuscript.
Funding
This research was funded by the State Key Research and Development Program, grant number 2023YFD2200803, and the National Natural Science Foundation of China, grant number 32201556.
Data Availability Statement
Data are available upon request to the corresponding authors
Acknowledgments
The authors thank Saihanba Forest Farm for supporting experiment and Zewen Zhang, Liqin Wu, and Yu Jiang who helped collect the data.
Conflicts of Interest
The authors declare no conflicts of interest.
References
- Wright, I.J.; Reich, P.B.; Westoby, M.; Ackerly, D.D.; Baruch, Z.; Bongers, F.; Cavender-Bares, J.; Chapin, T.; Cornelissen, J.H.C.; Diemer, M.; et al. The worldwide leaf economics spectrum. Nature 2004, 428, 821–827. [Google Scholar] [CrossRef]
- Wright, I.J.; Reich, P.B.; Cornelissen, J.H.C; Falster, D.S.; Garnier, E.; Hikosaka, K.; Lamont, B.B.; Lee, W.; Oleksyn, J.; Osada, N.; et al. Assessing the generality of global leaf trait relationships. New Phytologist 2005, 166, 485–496. [Google Scholar] [CrossRef] [PubMed]
- Osnas, J.L.; Lichstein, J.W.; Reich, P.B.; Pacala, S.W. Global leaf trait relationships: mass, area, and the leaf economics spectrum. Science 2013, 340, 741–744. [Google Scholar] [CrossRef] [PubMed]
- Liu, M.X.; Liang, G.L. Research progress on leaf mass per area. Chinese Journal of Plant Ecology 2016, 40, 847–860. [Google Scholar]
- Diao, J.; Guo, H.; Lu, J. Leaf Area Estimation Model and Specific Leaf Area of Chinese Pine. Forest Research 2013, 26, 174–180. [Google Scholar]
- Xie, Y.L.; Lei, X.D.; Wang, H.Y. Leaf area regression model and specific leaf area estimation of Larix olgensis. Forest Research 2019, 32, 57–63. [Google Scholar]
- Lachapelle, P.P.; Shipley, B. Interspecific prediction of photosynthetic light response curves using specific leaf mass and leaf nitrogen content: effects of differences in soil fertility and growth irradiance. Annals of Botany 2012, 109, 1149–1157. [Google Scholar] [CrossRef]
- Liu, Q.; Li, F.R. Spatial and seasonal variations of standardized photosynthetic parameters under different environmental conditions for young planted Larix olgensis Henry trees. Forests 2018, 9, 522. [Google Scholar] [CrossRef]
- Ellsworth, D.S.; Reich, P.B. Leaf Mass Per Area, Nitrogen Content and Photosynthetic Carbon Gain in Acer saccharum Seedlings in Contrasting Forest Light Environments. Functional Ecology 1992, 6, 423–435. [Google Scholar] [CrossRef]
- Reich, P.B.; Uhl, C; Walters, M. B.; Ellsworth, D.S. Leaf lifespan as a determinant of leaf structure and function among 23 amazonian tree species. Oecologia (Berlin) 1991, 86, 16–24. [Google Scholar] [CrossRef]
- Siefert, A.; Violle, C.; Chalmandrier, L.; Albert, C.H.; Taudiere, A.; Fajardo, A.; Aarssen, L.W.; Baraloto, C.; Carlucci, M.B.; Cianciaruso, M.V.; et al. A global meta-analysis of the relative extent of intraspecific trait variation in plant communities. Ecology Letters 2015, 18, 1406–1419. [Google Scholar] [CrossRef]
- Williams, G.M.; Nelson, A.S. Spatial variation in specific leaf area and horizontal distribution of leaf area in juvenile western larch (Larix occidentalis Nutt.). Trees 2018, 32, 1621–1631. [Google Scholar] [CrossRef]
- Coble, A.P.; Autio, A.; Cavaleri, M.A.; Binkley, D.; Ryan, M.G. Converging patterns of vertical variability in leaf morphology and nitrogen across seven Eucalyptus plantations in Brazil and Hawaii, USA. Trees 2014, 28, 1–15. [Google Scholar] [CrossRef]
- Xia, G.W.; Sun, X.M.; Cheng, D.S.; Zhang, S.G. Spatial Variation of Photosynthetic Characteristics in Canopy of Larix kaempferi. Scientia Silvae Sincae 2019, 55, 13–21. [Google Scholar]
- Niinemets, Ü. Distribution patterns of foliar carbon and nitrogen as affected by tree dimensions and relative light conditions in the canopy of Picea abies. Trees 1997, 11, 144–154. [Google Scholar]
- Niinemets, Ü.; Kull, O.; Tenhunen, J.D. Variability in Leaf Morphology and Chemical Composition as a Function of Canopy Light Environment in Coexisting Deciduous Trees. International Journal of Plant Sciences 1999, 160, 837–848. [Google Scholar] [CrossRef] [PubMed]
- Zhou, H.L.; Zhou, G.S.; He, Q.J.; Zhou, L.; Ji, Y.H.; Zhou, M.Z. Environmental explanation of maize specific leaf area under varying water stress regimes. Environmental and Experimental Botany 2020, 171, 103932. [Google Scholar] [CrossRef]
- Woodruff, D.R.; Bond, B.J.; Meinzer, F.C. Does turgor limit growth in tall trees? Plant, Cell and Environment 2004, 27, 229–236. [Google Scholar] [CrossRef]
- Nouvellon Y, Laclau JP. Epron D. Nouvellon, y.; Laclau, J.P.; Epron, D.; Kinana, A.; Mabiala, A.; Roupsard, Q.; Bonnefond, J.M.; Maire, G.L.; Marsden, C.; Bontemps, J.D. Within-stand and seasonal variations of specific leaf area in a clonal Eucalyptus plantation in the Republic of Congo. Forest Ecology and Management 2009, 259, 1796–1807. [Google Scholar]
- Rossatto, D.R.; Hoffmann, W.A.; Franco, A.C. Differences in growth patterns between co-occurring forest and savanna trees affect the forest–savanna boundary. Functional Ecology 2009, 23, 689–698. [Google Scholar] [CrossRef]
- Miguel, A.; Munguía, R.; Angulo, D.F; Gerardo, A.G.; Víctor, P.T. Variation in leaf traits across a precipitation gradient in coastal sand dunes in Yucatan Peninsula. Journal of Arid Environments 2019, 162, 10–17. [Google Scholar]
- Jin, M.Y.; Jiang, F.; Jin, G.Z.; Liu, Z.L. Variations of Specific Leaf Area in Different Growth Periods and Canopy Positions of Betula platyphylla at Different Ages. Scientia silvae sinicae 2018, 54, 18–26. [Google Scholar]
- Liu, Q.; Dong, L.H.; Li, F.R.; Li, X. Spatial heterogeneity of canopy photosynthesis for Larix olgensis. Chinese Journal of Applied Ecology 2016, 27, 2789–2796. [Google Scholar] [PubMed]
- Zhang, L.; Luo, T.X.; Deng, K.M.; Li, W.H. Vertical variations in specific leaf area and leaf dry matter content with canopy height in Pinus yunnanensis. Journal of Beijing Forestry University 2008, 30, 40–44. [Google Scholar]
- Tian, J.X.; Wei, L.P.; He, N.P.; Xu, L.; Chen, Z.; Hou, J.H. Vertical variation of leaf functional traits in temperate forest canopies in China. Acta Ecologica Sinica 2018, 38, 8383–8391. [Google Scholar]
- Cornelissen, J.H.; Lavorel, S.; Garnier, E.; Diaz, S.; Buchmann, N.; Gurvich. A handbook of protocols for standardized and easy measurement of plant functional traits worldwide. Australian Journal of Botany 2003, 51, 335–380. [Google Scholar] [CrossRef]
- Song, L.; Sun, Z.H. Measurement of Leaf Area Index of Larix olgensis Plantations in Hilly Area of Sanjiang Plain. Journal of northeast forestry university 2012, 40, 6–33. [Google Scholar]
- Wilson, P.; Thompson, K.; Hodgson, J. Specific leaf area and leaf dry matter content as alternative predictors of plant strategies. New Phytologist 1999, 143, 155–162. [Google Scholar] [CrossRef]
- Roche, P.; Díaz-Burlinson, N.; Gachet, S. Congruency analysis of species ranking based on leaf traits: Which traits are the more reliable? Plant Ecology 2003, 174, 37–48. [Google Scholar] [CrossRef]
- Liu, Z.L.; Zhu, Y.; Li, F.R.; Jin, G.Z. Nondestructively predicting leaf area, leaf mass and specific leaf area based on a linear mixed-effect model for broadleaf species. Ecological Indicators 2017, 78, 40–350. [Google Scholar] [CrossRef]
- Sala, F.; Arsene, G.G.; Iordnescu, O.; Boldea, M. Leaf area constant model in optimizing foliar area measurement in plants: A case study in apple tree. Scientia Horticulturae 2015, 193, 218–224. [Google Scholar] [CrossRef]
- Marshall, J.D.; Monserud, R.A. Foliage height influences specific leaf area of three conifer species. Canadian Journal of Forest Research 2003, 33, 164–170. [Google Scholar] [CrossRef]
- Burgess, S.S.; Dawson, T.E. Predicting the limits to tree height using statistical regressions of leaf traits. New Phytologist 2007, 174, 626–636. [Google Scholar] [CrossRef]
- Wang, C.Y.; Liu, J.; Zhou, J.W.; Xiao, H.G. Differences in leaf functional traits between exotic and native Compositae plant species. Journal of Central South University 2017, 24, 2468–2474. [Google Scholar] [CrossRef]
- Li, Y.L.; Cui, J.H.; Su, Y.Z. Specific leaf area and leaf dry matter content of some plants in different dune habitats. Acta Ecologica Sinica 2005, 25, 304–311. [Google Scholar]
- Liu, R.H.; Liang, S.C.; Long, W.X.; Jiang, Y. Variations in Leaf Functional Traits Across Ecological Scales in Riparian Plant Communities of the Lijiang River, Guilin, Southwest China. Tropical Conservation Science 2018, 11, 194008291880468. [Google Scholar] [CrossRef]
- Hu, Y.K.; Pan, X.; Liu, X.Y.; Fu, Z.X.; Zhang, M.Y. Above- and Belowground Plant Functional Composition Show Similar Changes During Temperate Forest Swamp Succession. Frontiers in Plant Science 2021, 12, 658883. [Google Scholar] [CrossRef] [PubMed]
- Pen, X.; Yan, W.D.; Wang, F.Q.; Wang, G.J.; Wang, F.Y.; Zhao, M.F. Specific leaf area estimation model building based on leaf dry matter content of Cunninghamia lanceolata. Chinese Journal of Plant Ecology 2018, 42, 209–219. [Google Scholar]
- Buajan, S.; Liu, J.F.; He, Z.S.; Feng, X.P.; Muhammad, A. The effect of light on microenvironment and specific leaf area within the gap, subtropical forest, China. Pakistan Journal of Botany 2017, 49, 273–282. [Google Scholar]
- Puglielli, G.; Varone, L.; Gratani, L.; Catoni, R. Specific leaf area variations drive acclimation of Cistus salvifolius. Photosynthetica 2017, 55, 31–40. [Google Scholar] [CrossRef]
- Rijkers, T.; Pons, T.L.; Bongers, F. The Effect of Tree Height and Light Availability on Photosynthetic Leaf Traits of Four Neotropical Species Differing in Shade Tolerance. Functional Ecology 2000, 14, 77–86. [Google Scholar] [CrossRef]
- Cavaleri, M.A.; Oberbauer, S.F.; Clark, D.B.; Clark, D.A.; Ryan, M.G. Height is more important than light in determining leaf morphology in a tropical forest. Ecology 2010, 91, 1730–1739. [Google Scholar] [CrossRef]
- Ishii, H.T.; Jennings, G.M.; Sillett, S.C.; Koch, G.W. Hydrostatic constraints on morphological exploitation of light in tall Sequoia sempervirens trees. Oecologia 2008, 156, 751–763. [Google Scholar] [CrossRef]
- Meinzer, F.C.; Bond, B.J.; Karanian, J.A. Biophysical constraints on leaf expansion in a tall conifer. Tree Physiology 2008, 28, 197–206. [Google Scholar] [CrossRef]
- Fellner, H.; Dirnberger, G.F.; Sterba, H. Specific leaf area of European Larch (Larix decidua MILL.). Trees 2016, 30, 1237–1244. [Google Scholar] [CrossRef]
- Munguia, A.; Munguía, R.; Angulo, D.F.; Arceo, G.G.; Víctor, P.T. Variation in leaf traits across a precipitation gradient in coastal sand dunes in Yucatan Peninsula. Journal of Arid Environments 2019, 162, 10–17. [Google Scholar] [CrossRef]
- Römermann, C.; Bucher, S.F.; Hahn, M.; Römermann, M.B. Plant functional traits-fixed facts or variable depending on the period. Folia Geobotanica 2016, 51, 143–159. [Google Scholar] [CrossRef]
- Misson, L.; Tu, K.; Boniello, R.A.; Goldstein, A. Seasonality of photosynthetic parameters in a multispecific and vertically complex forest ecosystem in the Sierra Nevada of California. Tree Physiology 2006, 26, 729–741. [Google Scholar] [CrossRef] [PubMed]
- Coble, A.P.; Cavaleri, M.A. Light acclimation optimizes leaf functional traits despite height-related constraints in a canopy shading experiment. Oecologia 2015, 177, 1131–1143. [Google Scholar] [CrossRef] [PubMed]
- Corina, V.; Peter, R. Constraints on Leaf Structural Traits in Wetland Plants. American Journal of Botany 2009, 96, 1068–1074. [Google Scholar]
- Zhao, J.; Wang, F.M.; Li, J.; Zou, B.; Wang, X.L.; Li, Z.A.; Fu, S.L. Effects of experimental nitrogen and/or phosphorus additions on soil nematode communities in a secondary tropical forest. Soil Biology and Biochemistry 2014, 75, 1–10. [Google Scholar] [CrossRef]
- Diaz, S.; Cabido, M.; Casanoves, F. Plant functional traits and environmental filters at a regional scale. Journal of Vegetation Science 1998, 9, 113–122. [Google Scholar] [CrossRef]
- Wang, F.; Gou, X.H.; Zhang, F.; Wang, Y.F.; Yu, A.L.; Zhang, J.Z.; Fonti, P.; Liu, J.G. Variations in leaf traits of Juniperus przewalskii from an extremely arid and cold environment. Science of The Total Environment 2019, 689, 434–443. [Google Scholar] [CrossRef]
- Denis, V.; Eric, G.; Bill, S.; Gérard, L.; Marie-Laure, N.; Catherine, R.; Sandra,L; Sandra, D. ; John, G.H.; Francisco, L.; et al. Specific leaf area and dry matter content estimate thickness in laminar leaves. Annals of Botany 2005, 96, 1129–1136. [Google Scholar]
- Smart, S.M.; Glanville, H.C.; Blanes, M.C.; Mercado, L.M.; Emmett, B.A.; Jones, D.L.; Cosby, B.J.; Marrs, R.H.; Butler, A.; Marshall, M.R.; et al. Leaf dry matter content is better at predicting above-ground net primary production than specific leaf area. Functional Ecology 2017, 31, 1336–1344. [Google Scholar] [CrossRef]
- Cavaleri, M.A.; Oberbauer, S.F.; Clark, D.B.; Clark, D.A.; Ryan, M.G. Height is more important than light in determining leaf morphology in a tropical forest. Ecology 2010, 91, 1730–1739. [Google Scholar] [CrossRef]
- Jin, W.; Cecilia, C.B.; Neill, P.; Shawn, P.S.; Kaiyu, G.; Loren, P.A.; Xi, Y.; Willem, J.D.; Anthony, J.G.; Giordane, M.; et al. Convergence in relationships between leaf traits, spectra and age across diverse canopy environments and two contrasting tropical forests. New Phytologist 2016, 214, 1033–1048. [Google Scholar]
- Proß, T.; Bruelheide, H.; Potvin, C.; Sporbert, M.; Trogisch, S.; Haider, S. Drivers of within-tree leaf trait variation in a tropical planted forest varying in tree species richness. Basic and Applied Ecology 2020, 50, 6–19. [Google Scholar]
- Gara, T.W.; Darvishzadeh, R.; Skidmore, A.K.; Wang, T.J.; Heurich,M. Evaluating the performance of PROSPECT in the retrieval of leaf traits across canopy throughout the growing season. International Journal of Applied Earth Observation and Geoinformation 2019, 83, 101919. [Google Scholar] [CrossRef]
- Liu, Q.; Zhang, Z.D.; Wang, D.Z.; Li, F.R.; Xie, L.F. Main drivers of vertical and seasonal patterns of leaf photosynthetic characteristics of young planted Larix Olgensis trees. Forestry Research 2024, 4, e001. [Google Scholar] [CrossRef]
- Bucci, S.J.; Goldstein, G.; Meinzer, F.C.; Franco, A.C.; Campanello, P.; Scholz, F.G. Mechanisms contributing to seasonal homeostasis of minimum leaf water potential and predawn disequilibrium between soil and plant water potential in neotropical savanna trees. Trees 2005, 19, 296–304. [Google Scholar] [CrossRef]
- Nouvellon, Y.; Laclau, J.P.; Epron, D.; Kinana, A.; Mabiala, A.; Roupsard, O.; Bonnefond, J.M.; Maire, G.L.; Marsden, C.; Bontemps, J.D.; et al. Within-stand and seasonal variations of specific leaf area in a clonal eucalyptus plantation in the republic of Congo. Forest Ecology Management 2009, 259, 1796–1807. [Google Scholar] [CrossRef]
- Coble, A.P.; VanderWall, B.; Mau, A.; Cavaleri, M.A. How vertical patterns in leaf traits shift seasonally and the implications for modelling canopy photosynthesis in a temperate deciduous forest. Tree Physiology 2016, 36, 1077–1091. [Google Scholar] [CrossRef] [PubMed]
Figure 1.
Scatter plot and cor plot.
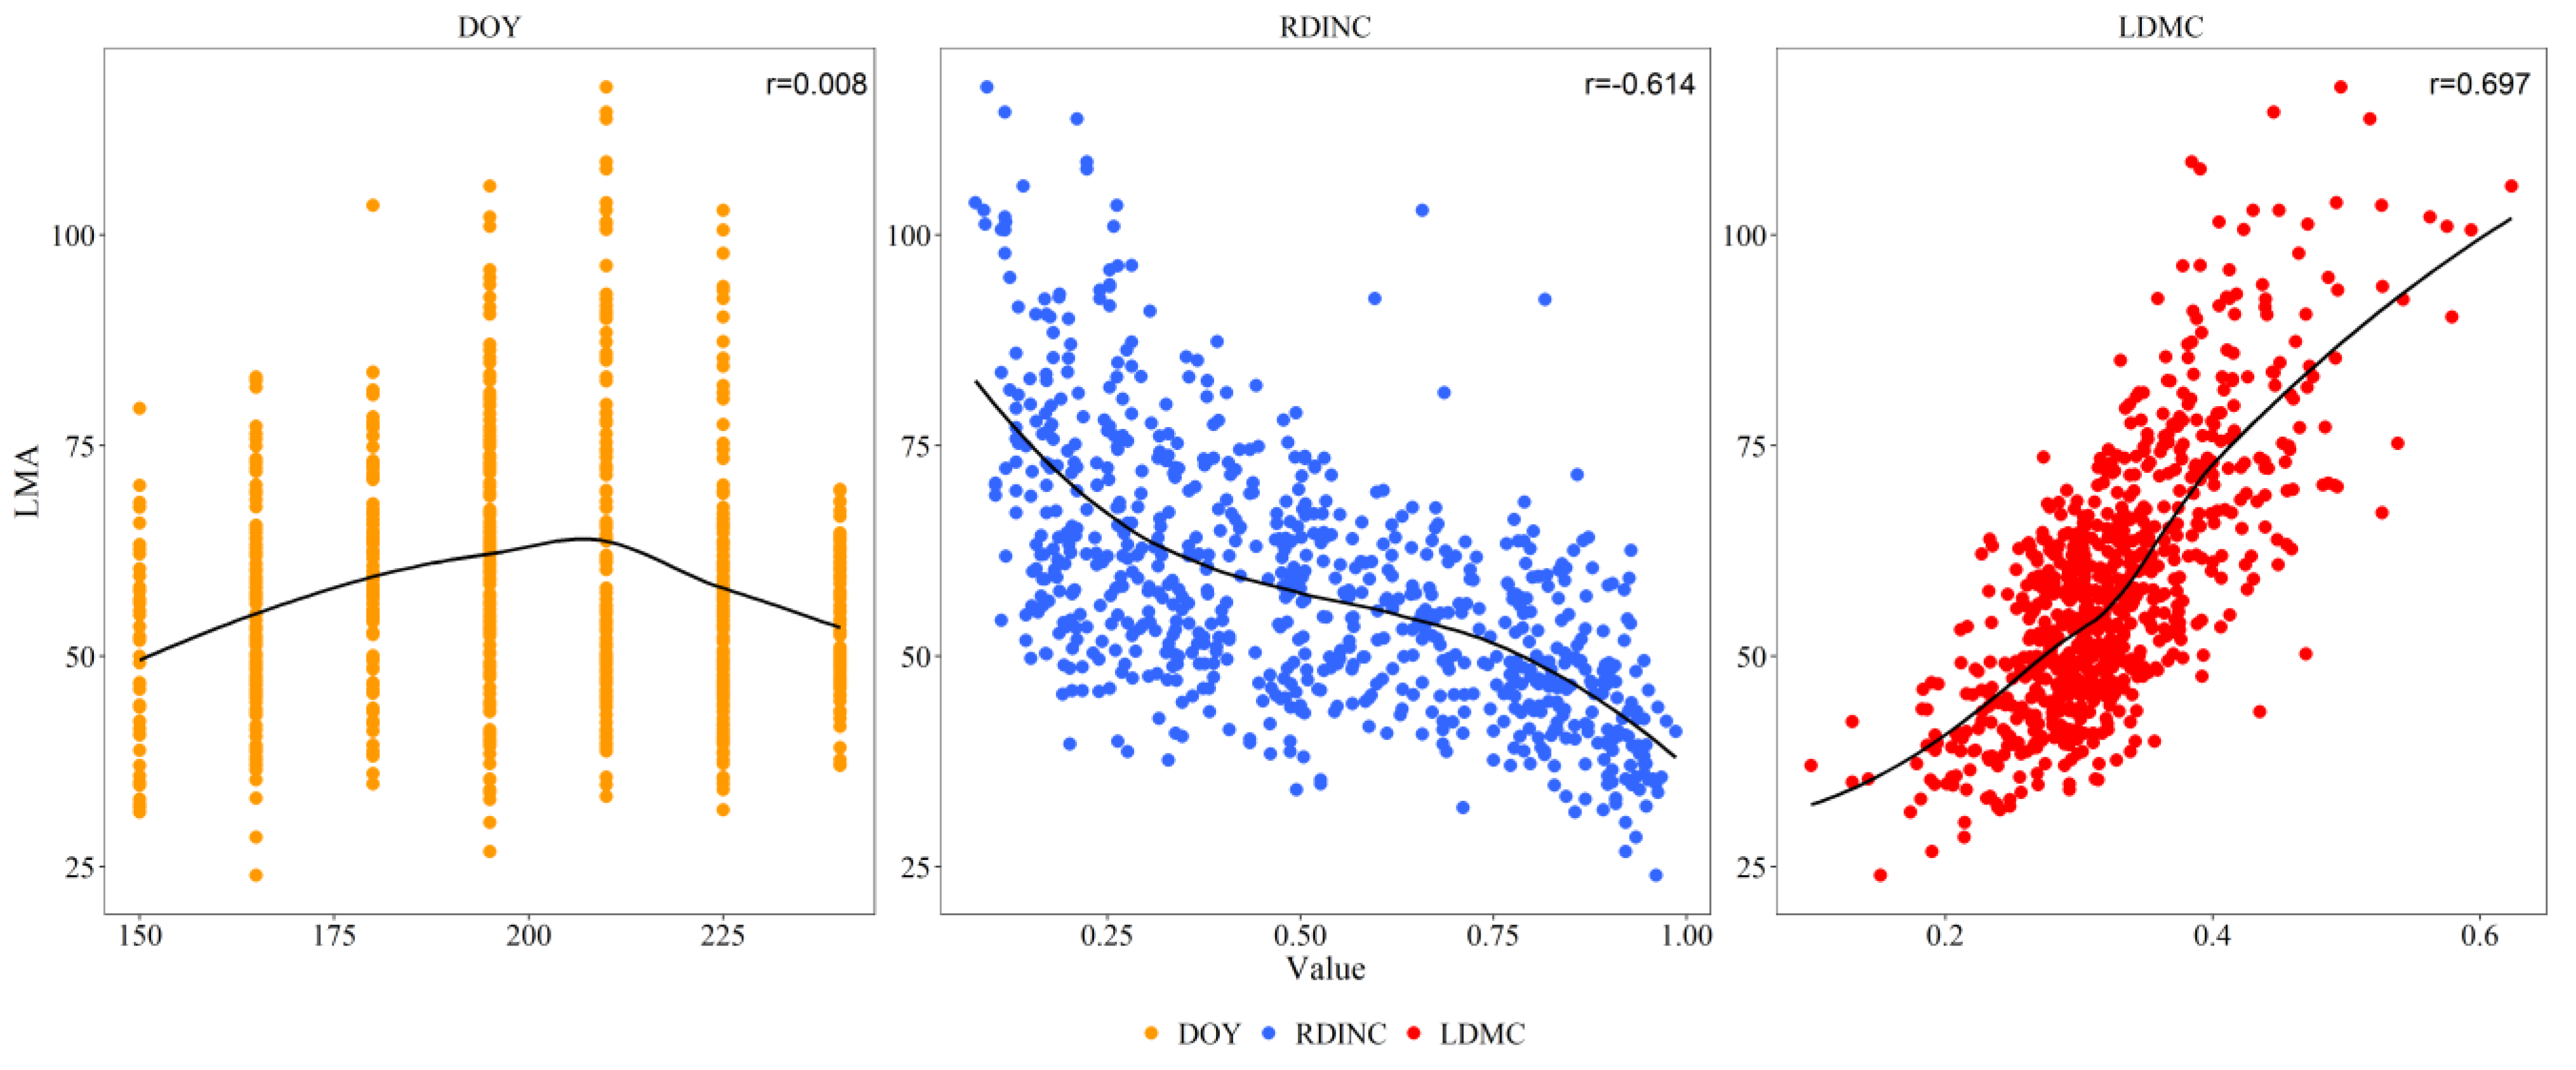
Figure 2.
Vertical patterns of leaf mass per area at different leaf growth phases.
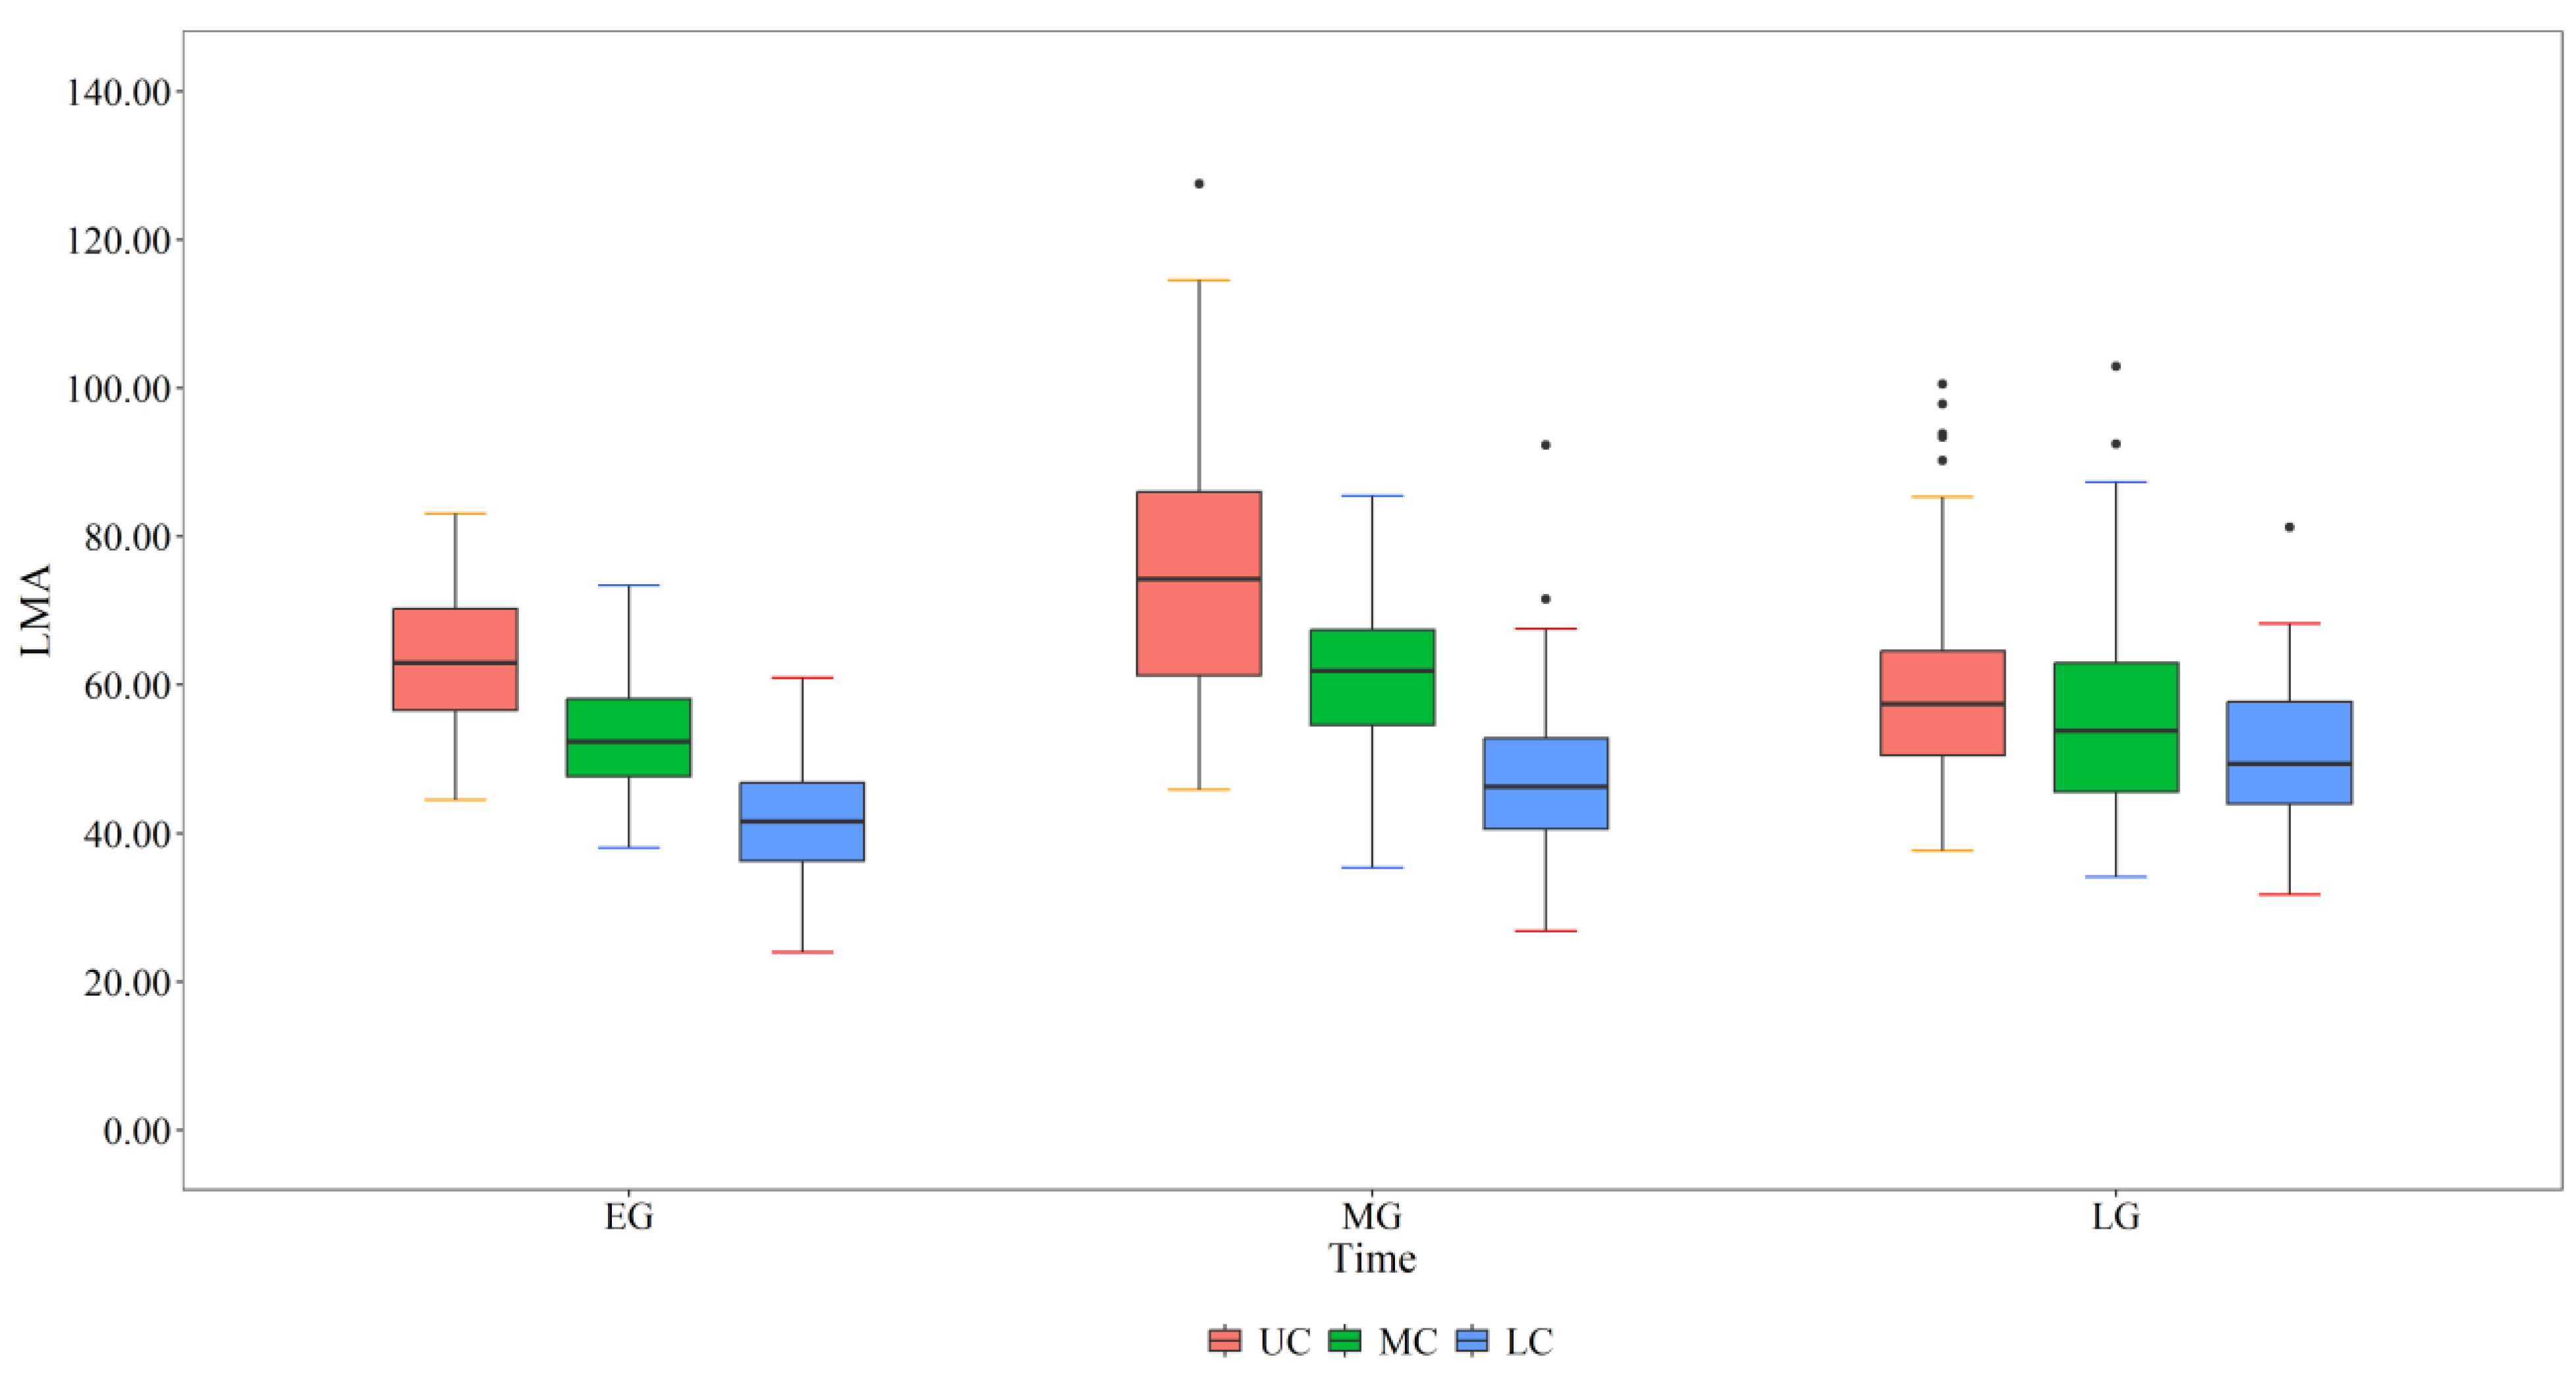
Figure 3.
Regression analysis of standard spindles: (a) Relationships between leaf mass per area and leaf dry matter concentration in the lower crown (LC), middle crown (MC) and upper crown (UC); (b) Relationships between leaf mass per area and leaf dry matter concentration in the early growth phase (EG), middle growth phase (MG) and late growth phase (LG).
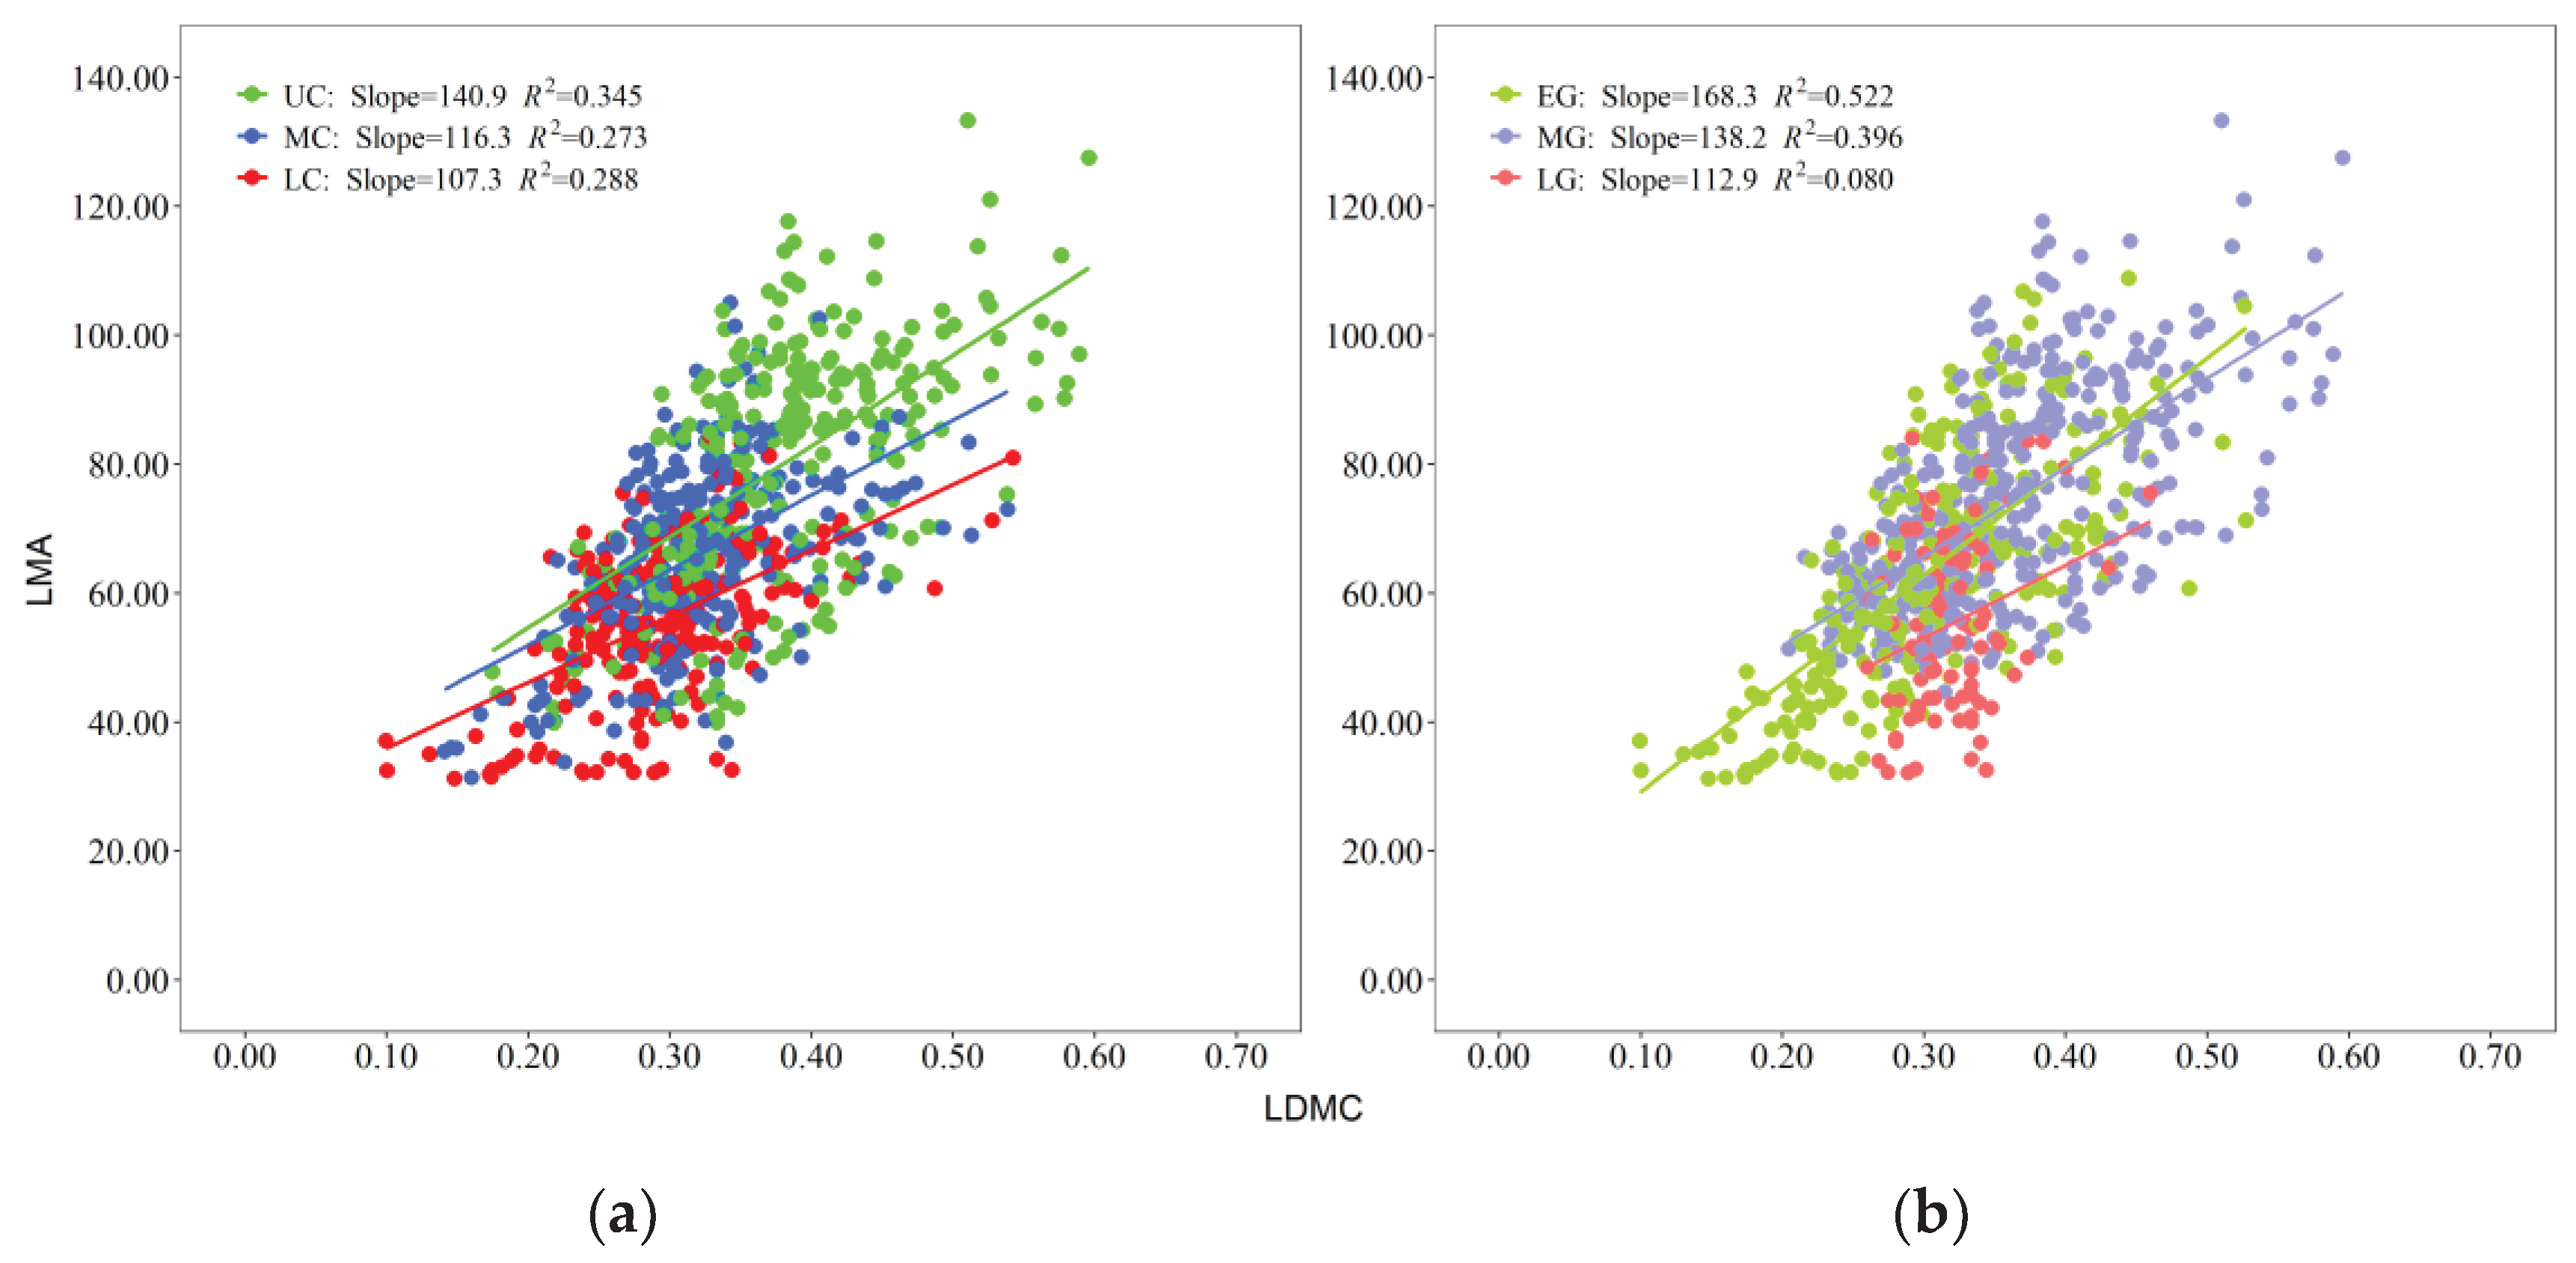
Table 1.
Two-way ANOVA of the LMA of L. principis-rupprechtii.
| Variables | Statistics | ||
| df | F | Sig. | |
| Intercept | 1 | 1203.943 | <0.001 |
| Leaf growth phase | 5 | 15.929 | <0.001 |
| Crown Layer | 2 | 57.877 | <0.001 |
| Leaf growth phase * Crown Layer | 10 | 10.645 | <0.001 |
Table 2.
The goodness-of-fit results of different basic models.
| No. | Model form | Ra2 | RMSE | AIC |
| Model 1 | LMA=-38.47×RDINC+87.60 | 0.297 | 15.194 | 6452.82 |
| Model 2 | LMA=90.53×exp(-0.58×RDINC) | 0.302 | 15.143 | 6447.61 |
| Model 3 | LMA=27.98×RDINC2-68.36×RDINC+93.72 | 0.304 | 15.116 | 6446.85 |
| Model 4 | LMA=55.33×RDINC-0.24 | 0.299 | 15.171 | 6450.54 |
| Model 5 | LMA=-22.92+2.62×(DOY-120)+0.02×(DOY-120)2 | 0.403 | 14.002 | 6327.61 |
| Model 6 | LMA=156.76×LDMC+15.56 | 0.443 | 13.524 | 6271.50 |
| Model 7 | LMA=157.82×LDMC0.76 | 0.447 | 13.479 | 6266.29 |
Table 3.
Results of model fitting and validation.
| No. | Model from | Goodness-of-fit | Validation | ||||
| Ra2 | RMSE | AIC | ME | MAE | IF | ||
| Model 8 | LMA=(-1.32×(DOY-120)+258.30) ×LDMC+0.31× (DOY-120)-7.52 | 0.470 | 13.16 | 4682.5 | -0.092 | 10.753 | 0.474 |
| Model 9 | LMA=(-62.38×RDINC+150.84)×LDMC+27.67 | 0.507 | 12.69 | 4638.0 | -0.106 | 10.176 | 0.514 |
| Model 10 | LMA=(-41.15×RDINC+150.95)×LDMC0.59 | 0.515 | 12.59 | 4629.0 | -0.099 | 10.040 | 0.523 |
| Model 11 | LMA=(0.0003×(DOY-120)3-0.114×(DOY-120)2+11.38×(DOY-120)-217.1)×LDMC+32.28 | 0.598 | 11.46 | 4522.8 | -0.236 | 9.353 | 0.615 |
| Model 12 | LMA=(-0.0215×(DOY-120)2+3.256×(DOY-120)+20.264)×LDMC0.574 | 0.593 | 11.54 | 4528.3 | -0.205 | 9.318 | 0.611 |
| Model 13 | LMA=(-37.08×RDINC-0.44)+(0.003×RDINC+2.524)×(DOY-120)-0.016×(DOY-120)2 | 0.678 | 10.25 | 4390.5 | -0.154 | 8.050 | 0.682 |
Disclaimer/Publisher’s Note: The statements, opinions and data contained in all publications are solely those of the individual author(s) and contributor(s) and not of MDPI and/or the editor(s). MDPI and/or the editor(s) disclaim responsibility for any injury to people or property resulting from any ideas, methods, instructions or products referred to in the content. |
© 2024 by the authors. Licensee MDPI, Basel, Switzerland. This article is an open access article distributed under the terms and conditions of the Creative Commons Attribution (CC BY) license (http://creativecommons.org/licenses/by/4.0/).
Copyright: This open access article is published under a Creative Commons CC BY 4.0 license, which permit the free download, distribution, and reuse, provided that the author and preprint are cited in any reuse.


