Submitted:
15 March 2024
Posted:
18 March 2024
You are already at the latest version
Abstract
Polymer inclusion membranes (PIMs), which contained cellulose tri-acetate used as a polymer base, a plasticizer in the form of o-NPOE, and meso-tetra methyl tetrakis-[methyl-2-(4-acetlphenoxy)] calix[4]pyrrole (KP) used as a carrier, were prepared and tested for the effective purification of aqueous solutions of methylene blue dye. The scanning electron microscope (SEM), thermogravimetric analysis (TGA), and attenuated total reflection Fourier transform infrared (ATR-FTIR) were used to define the microstructure and surface of PIMs. Experimental results showed that with the increased concentration of methylene blue in an aqueous solution, the removal percentage also increased. Further observation also showed that the flux increased with the rise of the source phase pH values from 3 to 10. The carrier and plasticizer content in the membrane significantly influenced the membrane’s transport properties. The optimal composition of the membrane in per cent by weight was for KP: 74% plasticizer; 18% support; 8% carrier. It was shown that the membrane with optimal composition showed good reusability and enabled the easy and spontaneous separation of methylene blue from aqueous solutions.
Keywords:
polymer inclusion membrane
; methylene blue dye
; organic dye
; calixpyrroles
1. Introduction
Methylene blue (MB) is classified as an organic dye (OD) released as an effluent after various industrial operations and is one of the aquatic environment’s most abundant pollutants [1]. Dyes are applied to the substrates to give them permanent colour, which is resistant to fading when exposed to water, illumination, oxidizing agents, sweat, and microbial attack [2]. Because of these qualities, various dyes have numerous applications in textiles, food, rubber, printing, cosmetics, medicine, plastic, concrete, and paper industries [3,4,5]. These industries generate a tremendous amount of wastewater containing carcinogenic and toxic dyes. The effluents pollute water resources, which become unfit for human consumption [6]. Of all industrial branches, highest quantities of dyes are consumed by the textile industry, with textile dyes being compounds of high complexity and comprising a diverse range of structural groups [7]. They include multiple structural varieties, for example, acidic, reactive, basic, disperse, azo, diazo, anthraquinone-based and metal complex dyes. Basic dyes are characterized by solublility in water; they carry a positive charge when in a solution and are subject to electrostatic attraction to negatively charged substrates. Cationic dyes are able to hold either a positive charge which is localized on an ammonium group, or the charge can be delocalized over the dye cation’s skeletal structure [8].
Methylene blue, a cationic dyestuff for which the chemical formula is C16H18N3SCl, is one of the materials most highly consumed in the dye industry, commonly used to colour silk, wool, cotton, and paper [9,10,11].
Due to its potential toxicity, the removal of MB from wastewater is currently considered a matter of necessity. The treatment of textile dyeing wastewater involves the application of numerous analytical techniques, including adsorption, precipitation, membrane techniques, photochemical degradation, and electrolytic treatments [12]. The processes of adsorption and coagulation result in the creation of large amounts of sludge, while heavy metal ions and inorganic salts are highly resistant to being removed through the processes of oxidation and biodegradation. Large quantities of solvents are consumed in the processes of removing organic pollutants through the extraction-based separation method. Liquid membrane technology, including polymer inclusion membranes (PIMs), can serve as an interesting alternative to conventional separation methods and could potentially help overcome this drawback [13]. The use of this technology is largely determined by the effectiveness and stability of a polymer membrane material, which depends on the physicochemical properties of the polymer and the ion carrier incorporated in it. Modified polymer materials, i.e. containing immobilized macrocyclic compounds, due to their high efficiency and selectivity, could constitute an attractive approach for toxic dye removal from wastewater.
The PIMs are one of the new type liquid membrane which, due to their structure and high resistance against elution of an ion carrier, are now more often used in a variety of industries for removing dyes and metal ions from aqueous solutions and upgrading and purifying a variety of elements and chemicals [14,15,16,17,18,19]. The technology is utilised in a wide variety of applications, including pharmaceuticals, agriculture, industrial chemicals, petrochemicals, the food industry, base metal purification, and precious metal refinement. As a result of the rapid industrial development, connected with the necessity of utilizing (separating) dyestuffs from aqueous solutions, the study of transport and separation of dyes by PIMs was strongly intensified [8,20,21]. The increasing progress (especially in recent years) of studies of macrocyclic compounds as potential receptors of organic molecules in PIMs is determined by their easy syntheses from the commonly accessible materials, high thermal and chemical stability, and the ability for selective complexation of organic molecules.
Designing and synthesis of new generation carriers, particularly calixpyrroles to increase their practical applications have recently received a lot of attention. Calixpyrroles are macrocycles consisting of pyrrole rings linked by tetrahedral configuration of carbon atoms through the pyrrolic 2- and 5-positions [22]. Ester group-containing calixpyrroles frequently perform cation bonding through the cation’s cooperative interaction with their cavity and the ionic (ester) group. The change in pH causes the ionic interaction to eliminate, thus freeing the cation; such behavior makes the above-mentioned compounds usable as ion carriers. There is no exact relation between the transfer mechanism and the co-transport mechanism, i.e. the ion pair released as a result of opening of ring, is impacted by the changes of the pH value [16,22]. Calixpyrroles are good potential complexing agents because of their highly specific ligand properties and potential applications as hosts and sensing agents for various analytes. Additionally, it is possible to easily modify the scaffold of calixpyrroles using a variety of new compounds to enhance their selectivity and specificity for given cations, anions and neutral molecules.
This study aimed to develop and characterize PIM with a cellulose triacetate, meso-tetra methyl tetrakis-[methyl-2-(4-acetylphenoxy)] calix[4]pyrrole and o-NPOE, used as a matrix, as a carrier, and as a plasticizer, respectively. Obtained membrane can be applied to effectively eliminate MB from the aqueous solution. For this purpose, the effect of different parameters on the transport of MB across the PIM, such as various pH or MB concentration of the source phase and acidity of the receiving phase, were studied. The effect of the carrier concentration on the transport processes and characterized the membrane with SEM, ATR-FTIR, and DSC-TG were also investigated.
2. Materials and Methods
2.1. Reagents
Analytical grade chemicals reagents including sodium hydroxide (NaOH), and hydrochloric acid (HCl) were acquired from (POCh, Gliwice, Poland). Analytical grade organic reagents, i.e., methyl-2-(4-acetylphenoxy)acetate, cellulose triacetate (CTA, molecular weight Mw= 72.000 – 74.000), o-nitrophenyl octyl ether (o-NPOE), and dichloromethane (CH2Cl2) (all from Merck Life Science Sp.z.o.o., Poznan, Poland) were used without further purification. Dye - methylene blue (MB) was purchased from Chempur (Krupski Mlyn, Poland). The preparation of all aqueous solutions involved the use of analytical reagent grade chemicals and deionized water (conductivity, 0.10 μS/cm).
2.2. Synthesis
Meso-tetra methyl tetrakis-[methyl-2-(4-acetylphenoxy)] calix[4]pyrrole (KP) synthesis (Figure 1) was performed through a pyrrole and ketones reaction, with acids serving as a catalyst. The condensation products were primarily four-membered calixpyrrole ring isomers. The meso-tetra methyl tetrakis-[methyl-2-(4-acetylphenoxy)] calix[4]pyrrole from pyrrole and methyl-2-(4-acetylphenoxy)acetate according to data available in the literature [23] have been obtained. Methyl-2-(4-acetylphenoxy)acetate was poured into a round-bottomed flask with pyrrole in dry CH2Cl2, methyl-2-(4-acetylphenoxy)acetate. The resulting mixture was subjected to cooling to 0 0C and later stirred for 5 min. Through a 10 min process of bubbling using Ar, the mixture resulting from the reaction was degassed. Afterwards, for another 10 min. in a nitrogen atmosphere, HCl was added dropwise over the mixture. The solution created through this process was subject to stirring for 2 h at 00C and then stored overnight at room temperature. After removing the solvent, ethyl acetate was used in order to dissolve the crude product. The resulting solid was subjected to multiple washing cycless using water and dried with MgSO4. Chromatographic purification (silica gel, chloroform/methanol: 1/1) yielded a white solid (80%). The NMR spectra were recorded on a Bruker Advance 3HD 400 MHz spectrometer working at 400 MHz and 100 MHz for 1H and 13C, respectively. NMR spectra were recorded in a chloroform-d (CDCl3), 99.8% atom %D solution.
The structure of KP was confirmed by 1HNMR (Bruker Advance, 400 MHz, CDCl3, 298 K, ppm): 7.53-7.46 (s; 4H, NH); 6.90-6.88 (d, 8H, ArH); 6.69-6.67 (d, 8H, ArH); 5.85-5.66 (d, 8H, PyH); 4.52 (s, 8H, CH2); 1.8 (s, 12H, CH3); 1.2 (s, 12H, CH3) and 13C NMR (Bruker Advance, 101 MHz, CDCl3, 298 K, ppm): δ 168.95, 156.36, 140.73, 136.85, 136.61, 128.47, 113.96, 106.1, 105.49, 77.34, 77.02, 76.71, 67.95, 65.50, 61.34, 58.41, 44.10, 29.69, 29.61, 18.35, 14.18.
2.3. Preparation of PIMs and Stability Test
The preparation of PIMs was carried out following a procedure previously described by Nowik-Zajac [16]. The following solutions were used in order to prepare PIMs (in CH2Cl2 as an organic solvent): cellulose triacetate (CTA) serving a support role, o-nitrophenyl octyl ether used as a plasticizer, and meso-tetra methyl tetrakis-[methyl-2-(4-acetylphenoxy)] calix[4]pyrrole (KP) (Figure 1) performing the function of carrier. The defined CTA solution, plasticizer, and carrier volumes were mixed, and the resulting mixture was transferred to a 5.0 cm glass ring attached to a plate glass using CTA - dichloromethane glue. The glass ring was set aside to rest overnight at room temperature until the evaporation of CH2Cl2. By wetting it in cold water, the membrane obtained as a result of this process was detached from the glass plate. The membrane’s effective surface area was 4.9 cm2. Using a digital micrometer (PosiTector 6000 Advance (USA)), measurement of the membrane’s thickness was performed with an accuracy of 1.0 μm standard deviation over four readings. The CTA membrane’s average thickness was 24 μm.
The PIMs stability was investigated considering the loss of mass, which is related to carrier and/or plasticizer leaching. For that purpose, PIMs were subjected to immersion in 100 mL of ultrapure water and 24 hours of shaking. Prior to and after this procedure, the membranes were weighed, and the weighing data served as a basis for calculating the mass loss. Examination of membrane masses was also performed prior to and after the MB transport.
2.4. Transport Studies
The experiments involving transport were conducted in a permeation cell discussed in our prior study [16] incorporating a two-compartment cell in which the membrane film was tightly clamped between the source and receiving phases. MB (50 cm3) served as the source phase, whereas hydrochloric acid (50 cm3) performed the function of the aqueous receiving phase. The experimental procedures were perfoermed at room temperature (23÷25 0C) and synchronous stirrers were used to agitate both the source and receiving aqueous phases at 600 rpm. Aqueous phase samples were piodically removed through a sampling port using a syringe and were subjected to analysis in order to ascertain the concentration of MB. The acidity and basicity of both aqueous phases were controlled by a pH-meter (multifunctional pH-meter, CX-731 Elmetron, with a combined pH electrode, ERH-136, Hydromet, Poland).
The parameters describing transport such as the rate constant k, permeability P, and initial flux Ji, were calculated from the following relationships [24]:
where c is the MB concentration (mol/dm3) in the source phase at a given time, c1 is the initial MB concentration in the source phase (mol/dm3), k is the rate constant (s−1), and t is the transport time (s), V is the volume of the aqueous source phase, and A is the area of the membrane.
To describe the efficiency of MB removal from the source phase, the recovery factor (RF) was calculated as:
Within the scope of transport experiments, the quantification of MB was performed using a UV/Vis spectrophotometer (Shimadzu 2401). The findings, on the basis of prior studies concerning methylene blue [8] there was no effect of the aqueous solution’s pH on the MB absorption of the characteristic band in UV/Vis spectroscopy by UV-Vis at λ= 663 nm.
2.5. Characteristics of Developed Polymer Inclusion Membranes (PIMs)
The thickness of the PIM samples was measured using a digital micrometer (PosiTector 6000 Advance (USA)) with an accuracy of 0.1 µm. The thickness of the membrane was measured 10 times for each case and given as the average value of these measurements, with the standard deviation below 1%. The thickness of membranes before and after transport was found to bethe same. The average PIMs thickness varied of 25 µm. Experimental reproducibility was high with standard deviation below 1% of the measured values.
2.5.1. Morphology
A 5 KV scanning electron microscope - SEM (Quanta 3D FEG, FEI Company, Hillsboro, OR, USA) (Hitachi S4500) was used to perform the KP network’s membrane morphology analysis. Samples of the membrane were frozen in liquid nitrogen (70 K) and subjected to rapid fracturing. Afterwards, the samples were mounted to metal stubs with the fractured edge using a conductive glue, and further coated with gold using a sputtering method. Then, SEM inspection of the samples was performed at a magnification of approximately 50 μm.
2.5.2. Analysis of Thermal Properties: Differential Scanning Calorimetry (DSC), Thermogravimetric Analysis (TGA) of PIMs
Thermal analysis of the membranes was conducted using differential scanning calorimetry (DSC) and thermogravimetric analysis (TGA) incorporating a simultaneous analyzer for DSC-TGA research (STA 409C, Netzsch, Germany) to determine their heat resistance. The analysis was carried out under a nitrogen flow of 100 mL/min and at a heating rate of 10 0C/min. The TGA experiment was performed in a temperature range of 30 – 450 0C, and the samples were placed in sealed, non-hermetic, aluminum pans. The DSC experiments were conducted in a temperature range of 30–450 0C, and the samples were placed in sealed aluminum pans. The TGA analysis was described as a mass percentage change during heating and as differential thermogravimetry (DTG), which made it possible to accurately identify exhibited processes. The DSC analysis was described to indicate phase transition behavior dependent on heating.
2.5.3. Analysis of Structure: Attenuated Total Reflection Fourier Transform Infrared (ATR-FTIR) of PIMs
The ATR-FTIR spectra were recorded using a Bruker Alpha-PFT-IR device with a diamond attenuated total reflectance (ATR) accessory and were recorded within a wavenumber range of 500–4000 cm−1.
3. Results and Discussion
3.1. Kinetics and Repeatability of the Methylene Blue (MB) Dye Transport across Polymer Inclusion Membranes (PIMs)
In order to ascertain the MB separation process kinetics and repeatability by the PIM containing KP, measurements were performed of the dye concentration changes in the source and receiving phases as a function of the transport time through the membrane, enabling to formulate a concentration change profile over time.
The c/ci relationship curves in the function of time (Figure 2) are exponential, reflecting the primary transport kinetic model as proposed by Danesi et al. [25] for metal ions in relation to the supported liquid membranes (SLM) [25].
The rates of transport at the source phase and membrane boundary, as well as boundary of the membrane and receiving phase, are comparable, i.e. there is an equivalent rate of complexation and decomplexation reactions.
Estimation of the average transport process constants (k) was performed on the basis of linear relationship slopes: ln(c/ci) = f(t) obtained for the applied PIM (Figure 3), and served as a basis for calculating the MB initial flux values from the source phase (Ji).
The determination coefficient (r2) of the linear relationship ln(c/ci) as a function of time for the KP carrier was 0.9962, which pointed to a correlation with a high level of significance. The relative error burden of the obtained results did not exceed 1%, and was simultaneously obtained with a high determination coefficient value. Considering the kinetic parameter values and their statistical assessment, one can assume a good degree of repeatability of MB transport results via PIM.
3.2. The Effect of Carrier Concentration
The role and composition of the carrier are important in the context of transportation of the MB dye through the PIM. Hence, to improve transport efficiency, it is necessary to optimize the relative KP content in the liquid membrane [26].
The effect of the carrier quantity in the PIM on MB dye permeation was examined. Membranes with a fixed content of CTA (25 mg) and plasticizer (2 mL o-NPPE / 1.0 g CTA) were prepared, while the concentration of carrier in the membrane was changed in the range of 0.010 M to 0.10 M (based on plasticizer volume). Each experiment was conducted for 6 hours. MB was not transported by membranes without the carrier, which indicates that the carrier concentration is crucial to facilitate MB transport through the PIM.
The lower KP content in the PIM was insufficient to allow MB transport through the membrane. The transport efficiency increased with the KP content of the membrane to 0.050 M (Figure 4). The saturation of the PIM with the carrier occurred at the KP carrier concentration in the membrane of 0.050 M (based on the plasticizer volume). The transport rate determined for that carrier concentration was at the maximum level, reaching 3.42 μmol/m2s. Further KP content increase did not cause any transport efficiency enhancement; it has rather decreased to some extent beyond 0.050 M which can be a result of steric hindrance due to excess KP [27]. This phenomenon described in other studies [28,29] is explained by the organic membrane phase’s viscosity increase, resulting in the membrane’s resistance restricting complex diffusion through the membrane [30], or by a transport mechanism change from diffusion to jumping, which is induced by the process of carrier crystallization within the membrane [29]. The membrane’s low wettability reduces its permeability which consequently leads to a low transport rate. Hence, we have selected 0.050 M KP for the PIM synthesis for further studies. The optimal composition of the membrane in per cent by weight was for KP: 74% plasticizer; 18% support; 8% carrier.
3.3. Modification of Source Phase Composition
The affect of the source phase acidity/basicity within pH range of 3.0 ÷ 12.0 on the MB dye transport through the PIM was examined. The dependence of initial fluxes of the MB dyes transport on pH of the source phase containing 100.0 μM MB dyes through the PIM to the receiving phase containing 0.10 M HCl is presented in Figure 5.
As was indicated, the values of the initial fluxes transport increased with the rise in the source phase pH from 3.0 to 10.0. For pH = 10.0, the maximum MB ions transport initial flux value from the aqueous source phase containing 100.0 μM of MB through the PIM equaled 3.42 μmol/m2s; however, the transport flux was stabilized within a 10.0 - 12.0 pH range. The aqueous phase basicity had a significant impact on the MB transport rate by the PIM containing an ester derivative calix[4]pyrrole. The findings were, that raising the pH (up to 10) increased the effectiveness of MB transport (Table 1); an increase in the aqueous source phase solution’s pH correspondingly resulted in raising the initial MB flux when the receiving phase HCl concentration equaled 0.1 M. The initial flux increase at higher pH arises from the ester group’s influence, resulting in improvement to the formation of extractable target complex species in the organic membrane phase (occurs as a counterion). The esters’ essential nature arises from the ester group’s C=O bond polarization. Indeed, MB absorption from the bulk solution rises with pH at the base region. Lower absorption capacity in the acidic region can be caused by the repulsion between extracting sites and MB, while the higher absorption capacity noted at a base pH could be a result of the hydrophobic MB conversion into ester-methylene blue, which is hydrophilic. Therefore, the KP carrier interacts with the formed ester-methylene blue intermediate complex. In contrast, a pH value of 10 is favorable to extraction due to the higher polar species groups present. The MB-KP carrier complex is transported through the PIM from the source to the receiving phase while the counter-ions are transferred in the opposite direction. As the increase in the pH of the aqueous source phase up to 10 causes a rise in MB transport, the pH gradient becomes a driving force for the MB transport across the PIM.
Five MB solutions at pH 10.0, containing 10.0 μM; 25.0 μM; 50.0 μM, 100.0 µM and 150.0 μM of MB were prepared, which were used as the source phases for the purpose of determining the PIM process kinetics due to the MB concentration in the source phase. The 0.10 M HCl was used as the receiving phase. The impact of the initial MB dye concentrations on the transport efficiency through the PIM in the source phase is presented in Figure 6.
The initial flux increased with the rise of MB dye concentration up to 100.0 μM; its further growth, however, did not improve the transport efficiency. The increased MB concentration results in membrane saturation, which in turn decreases the effective area available for transportation and hinders MB cation mobility within the source phase [31]. Therefore, 100.0 μM solution of MB was selected to optimize other parameters of the experiment.
3.4. Modification of Receiving Phase Composition
The effect of different concentrations of hydrochloric acid (ranging from 0.1 ÷ 1.0 M HCl) in the receiving phase were tested on the flow of MB through the PIM (Table 2).
The acid concentration decrease in the receiving phase increases the MB transport efficiency across the PIM. The maximum MB removal (93.10%) was achieved at 0.1 M HCl solution as the receiving phase. An explanation of these results lies in the high acid concentration that causes reduction in the dissociation of the carrier-dye complex formed within the liquid membrane.
3.5. Membrane Reusability and Proposed Transport Mechanism
Reusability, among other properties of PIMs, is the greatest advantage, ensuring its industrial applicability [19]. In the repeated MB transport (6 cycles), both aqueous phases were renewed each time with no change in the optimal PIM compared to the first run.
The RF values (Figure 7) exceeded 93% in the first four transport cycles (each cycle lasting 6 h), then dropped inconsiderably (to approx. 90%). The obtained recovery factors (RF) indicate that the efficiency of the MB removal by the PIM is repeatable. The PIM with an optimal composition seems to be effective when used repeatedly in the process of removing MB.
Because MB is a cationic dye, as is exhibited by its structural pattern (Figure 1b), it is deprotonated in the source phase into the non-ionic form owing to the reaction of MB+ with OH- ions. The deprotonated MB easily diffuse into the membrane, more precisely is complexed with the KP carrier. The complexation is based on the inclusion complex between the KP as a host and the MB as a guest molecule. The guest molecule is inserted into the host cavity, in this case, pyrrole units and alkyl chain with ester-bound cover dye molecules, presumably. The hydrophobic interactions, hydrogen bondings and slightly π-electron interactions could behave as binding forces. Diffusion through the membrane may result in the release of MB into the receiving phase, but only in an acidic environment according to the experimental data. It is connected to the protonation of the MB which results in decomplexation with the KP. Then, the MB molecule becomes positively ionised and cannot be preserved due to decreasing strength of hydrophobic interactions [20]. The proposed mechanism of MB separation through the PIM containing the KP is dependent on the pH gradient as the driving force.
3.6. Physical-Chemical Characterization of the Developed PIMs
3.6.1. Morphology of the Developed PIMs
The SEM images of the PIM based on the mixture of 0.01 g KP, 2 mL CTA and 1 mL o-NPOE before and after the transport of MB are presented in Figure 8.
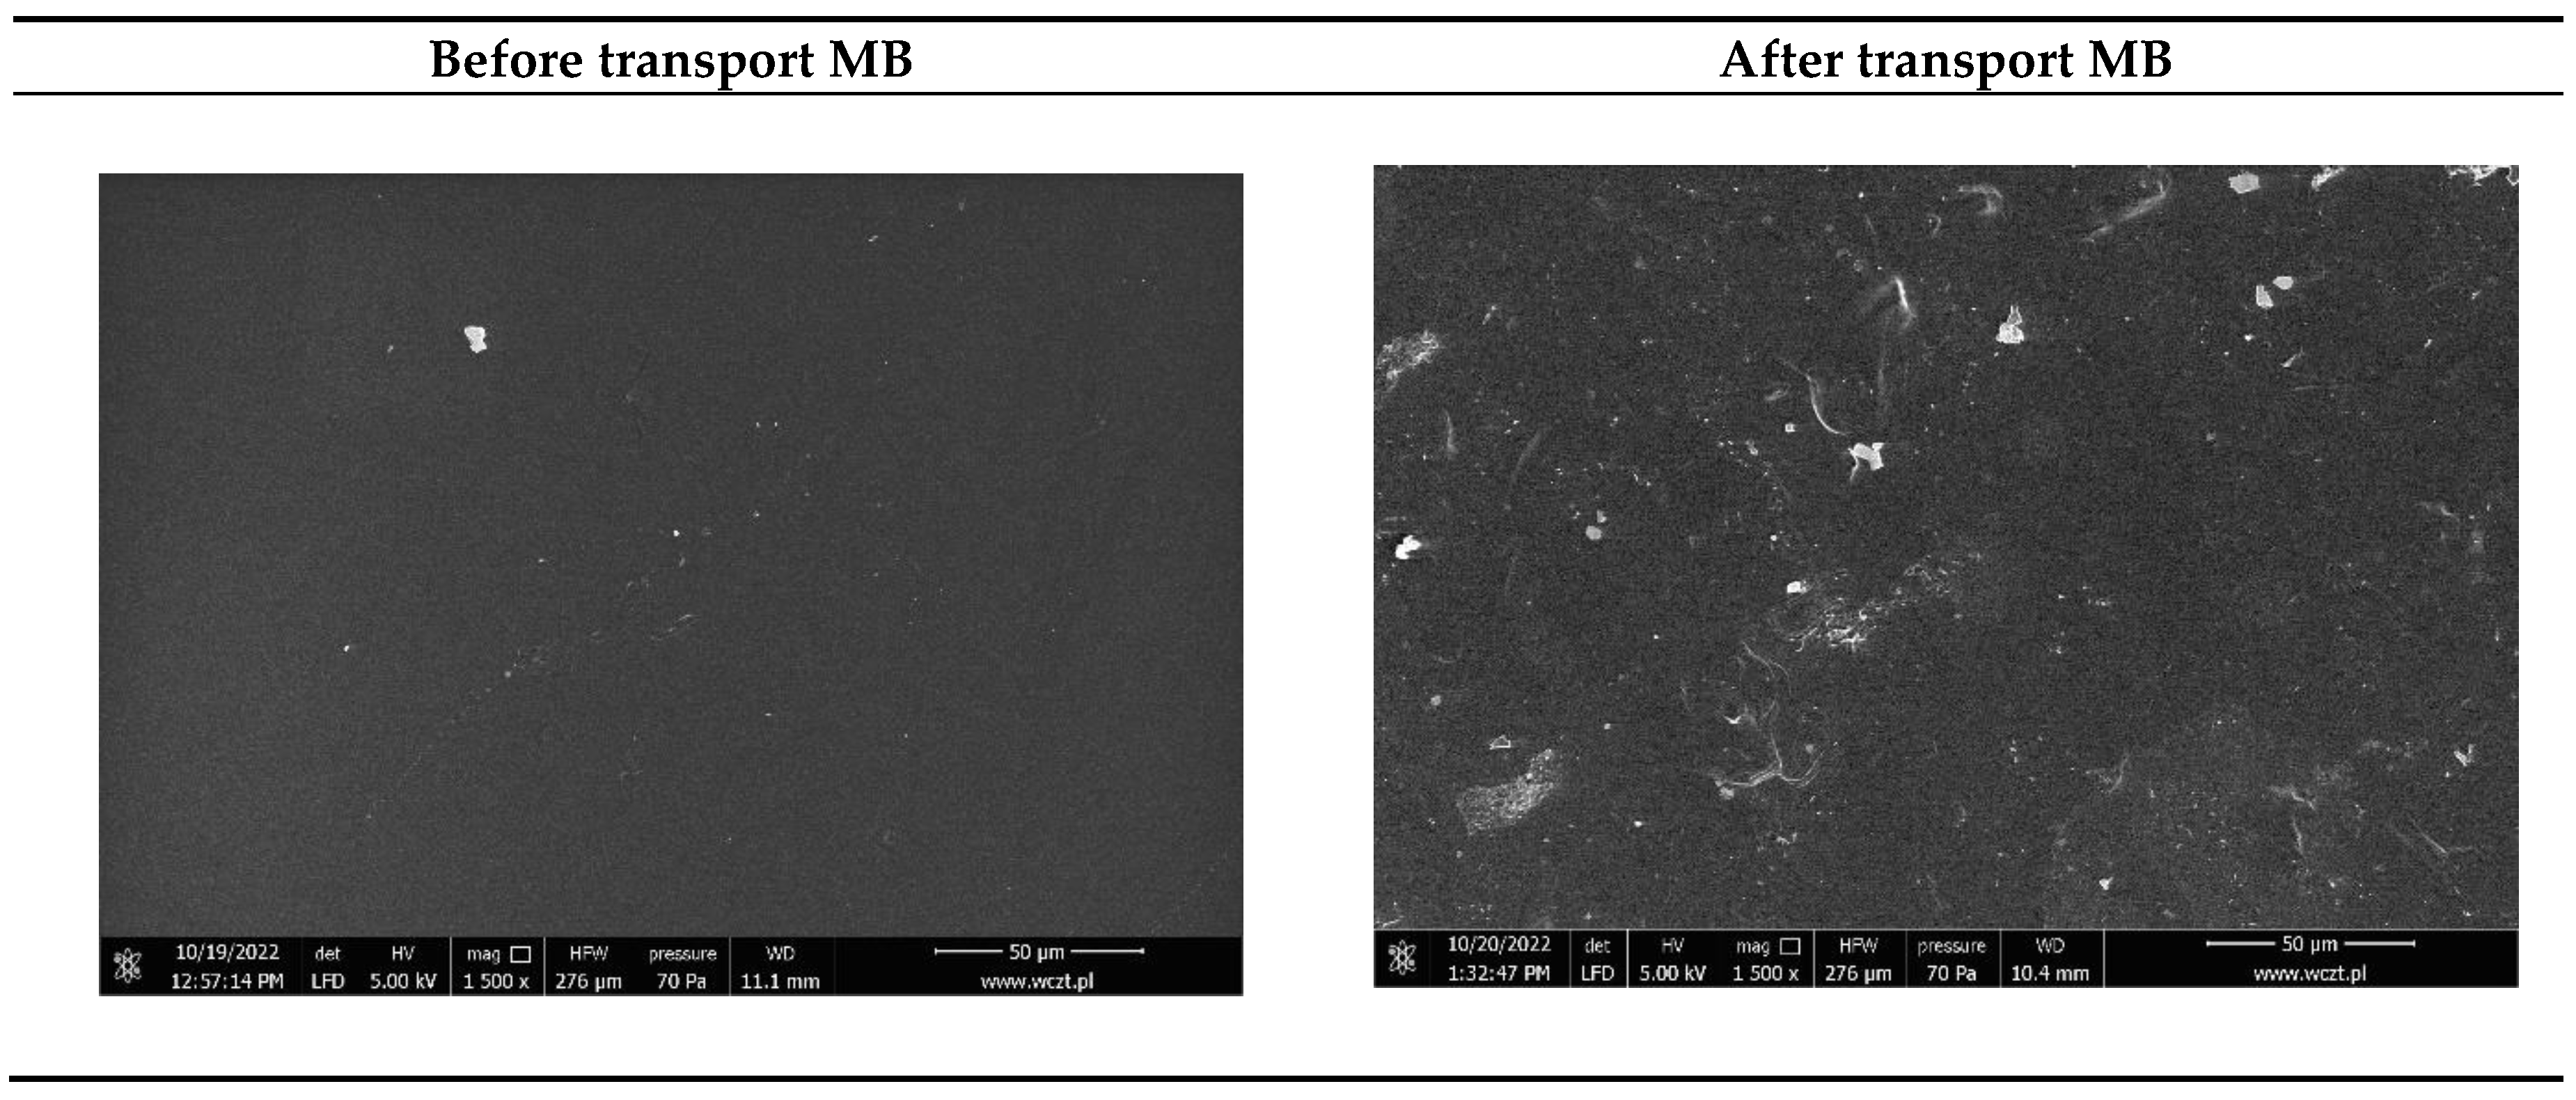
Figure 8.
SEM images of PIMs containing KP (magnification 50 µm).
A comparison of surface microstructure demonstrates the differentiation in membrane matrix materials in terms of quantity and sediment distribution because of the MB accumulation in the membrane phase as a result of the plasticization of the PIM [32]. The SEM images show a smaller and larger particle composition with non-uniform shapes and no macropores. The surfaces of polymeric particles are flat and covered with small particles found on partially smooth surfaces. Furthermore, the images illustrated a perceivable film surface roughness. It was possible for crystallization of carriers to occur in the membrane.
3.6.2. Thermal Properties Analysis Results
The TGA and DSC analyses were conducted simultaneously with DTG addition in order to accurately explain the thermal PIMdegradation processes. The resulting thermograms (Figure 9) exhibited long mass loss up to 118 0C, related to slow dehydration of pprox. 13% of the mass. The most significant mass change began at 196 0C, with the loss of half of the mass, according to the DTG. The curve change is related to a depolymerization process resulting in KP thermos degradation and ester linkage cleavage [33]. Thermos degradation of KP occurred at 220 0C. Depolymerization ends at about 320 0C when the DTG curve indicates the appearance of another important process lasting up to 360 0C, which is responsible for the thermodegradation of phenyl units.
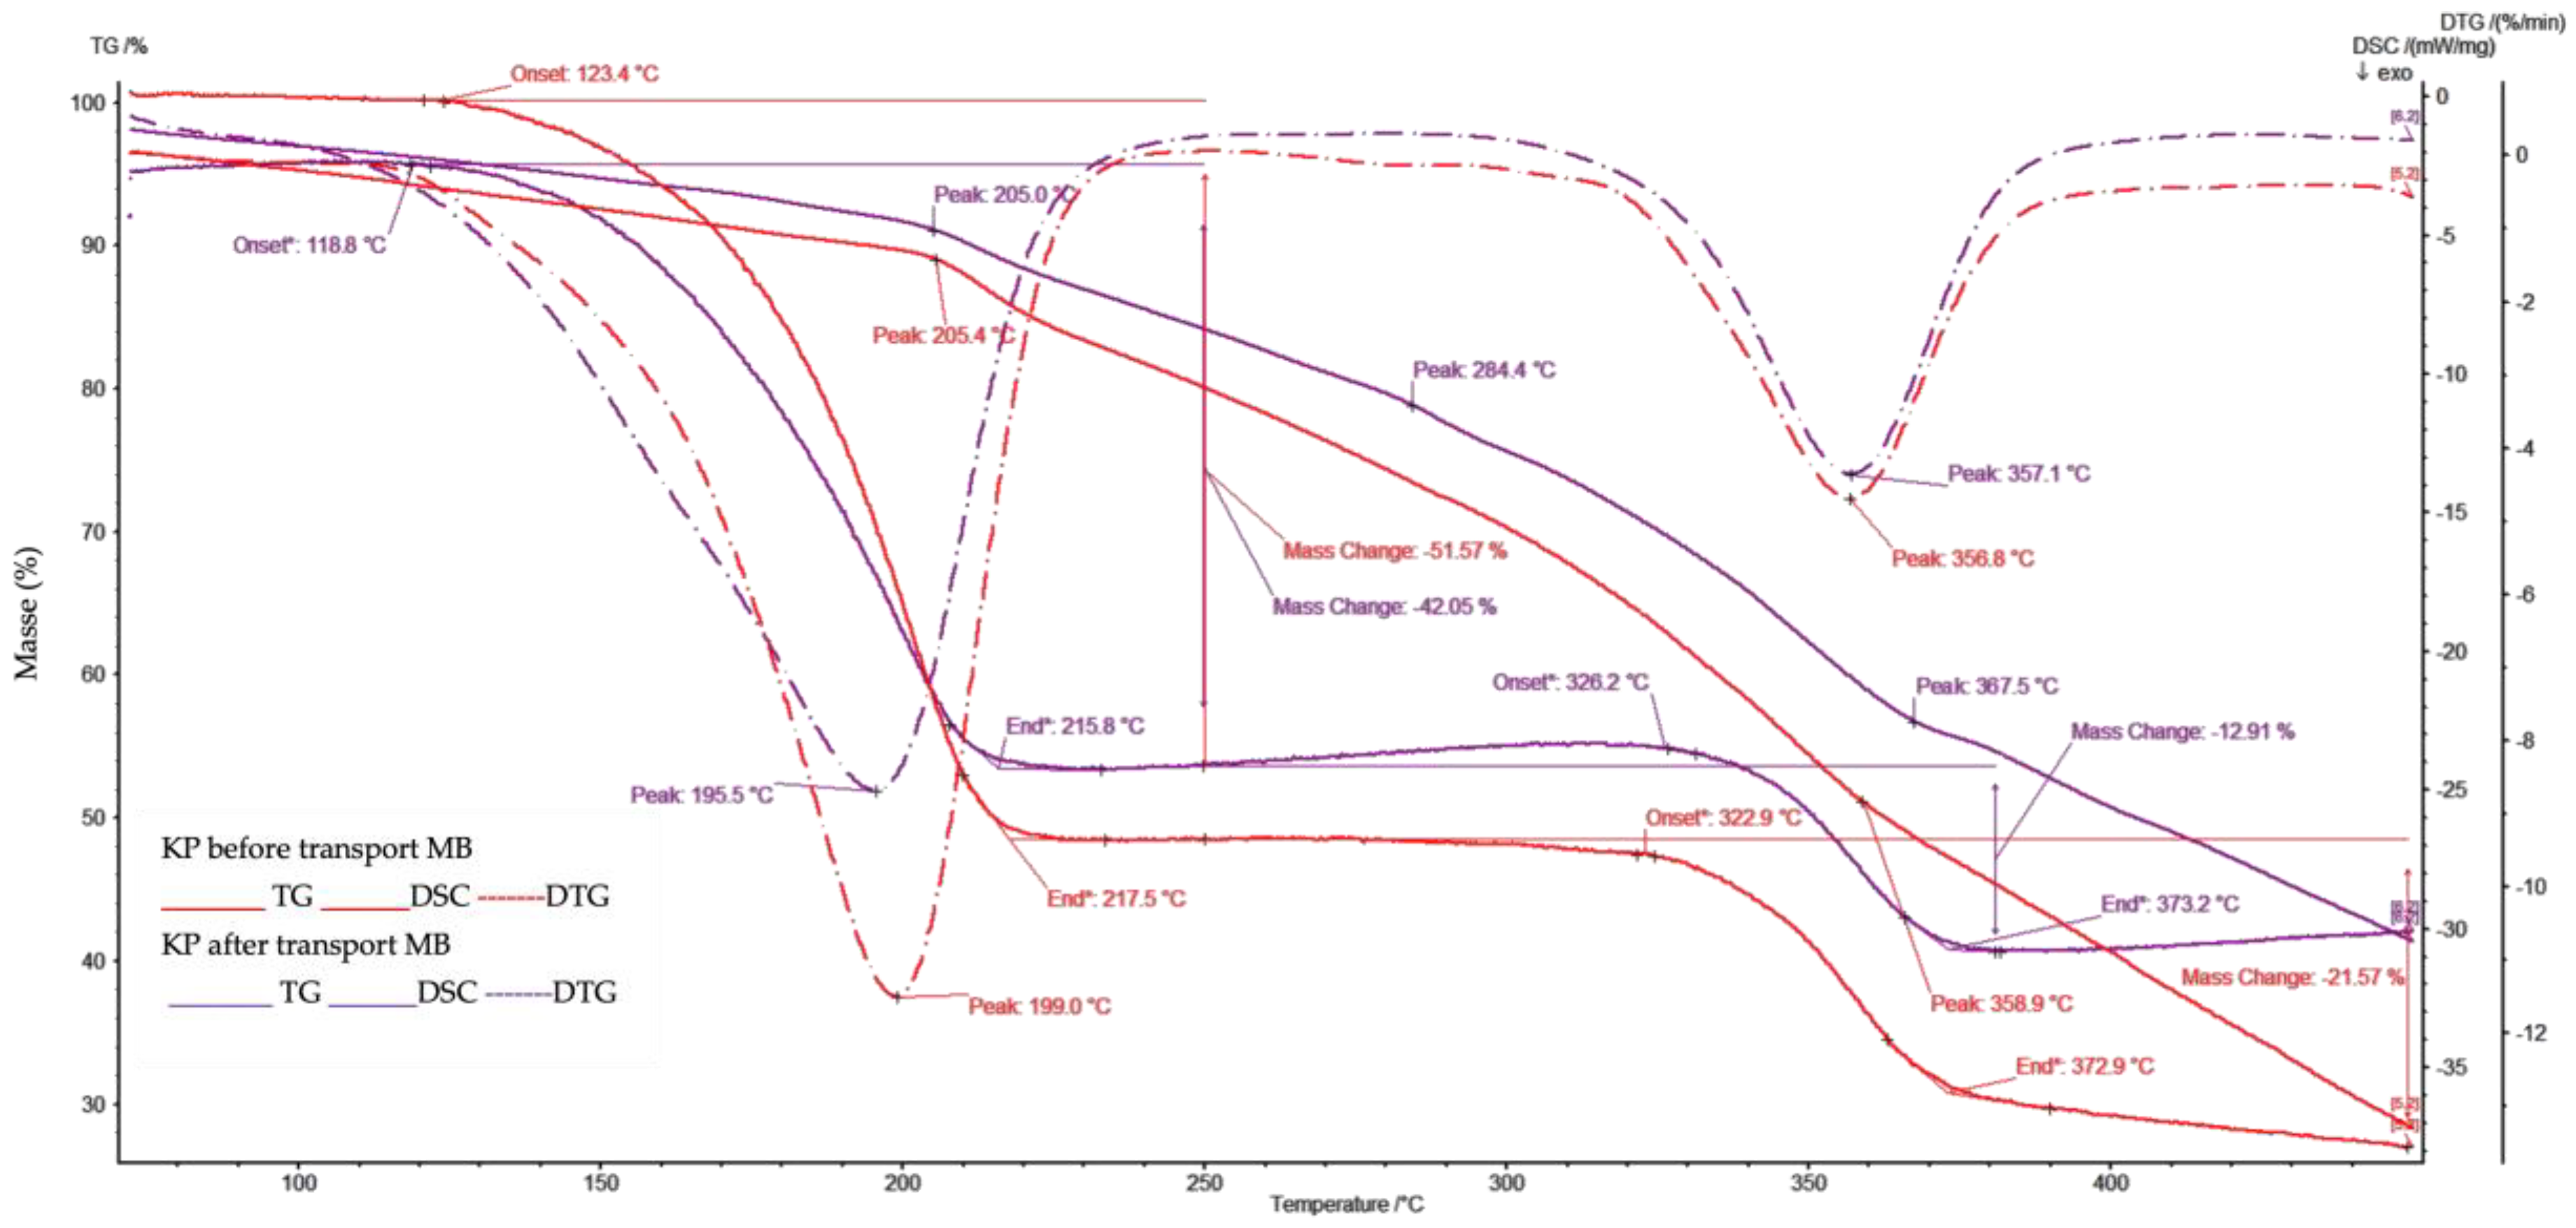
Figure 9.
Thermograms analysis of developed PIMs.
Thermal decomposition of the examined PIM is an irreversible process, observed in the first and second stages influenced by externally supplied heat, while in further stages by the heat released during the combustion. According to the information available in literature, the primary distribution of unplasticized CTA matrix takes place at temperatures of 292°C – 320°C which corresponds to the breaking of the polymer chains [34,35], while CTA membranes plasticized with o-NPPE exhibit thermal stability only to approximately 200°C [36]. A conclusion can, therefore, be drawn that introducing KP increased the thermal stability of our PIM.
3.6.3. ATR-FTIR
The following figures show the infrared spectra of investigated membranes with optimal composition: before (Figure 10A) and after (Figure 10B) transport process.
The interpretation of the above infrared spectra was made using the IRPal 2.0 Tabledriven Infrared Application. The most intensive bands identified on the ATR-FTIR spectrum were summarised in Table 3.
The visibility of all characteristic bands on the above ATR-FTIR spectra confirm the presence of individual components in the membranes: a polymer - CTA, a plasticizer - o-NPOE and the carriers - meso-tetra methyl tetrakis-[methyl-2-(4-acetlphenoxy)] calix[4]pyrrole (KP). The ATR-FTIR spectra of both membranes are similar, and that evidence the stability during / after the transport process. Carrier and any other components did not wash out from the structures of the membrane.
4. Conclusions
It was possible to successfully utilize the developed CTA-based polymer inclusion membrane (PIM) in the role of base polymer, as well as meso-tetra methyl tetrakis-[methyl-2-(4-acetlphenoxy)] calix[4]pyrrole (KP) functioning as a complexing agent in the recovery of methylene blue (MB) from the aqueous solution. Experimental results showed that the MB removal percentage from wastewater streams increased with raising the MB concentration from 10 to 100 μM. It was also observed that the flux increased with the increase in the pH values from 3 to 10. The carrier’s content in the membrane significantly influenced the characteristics of PIMs. The highest flux value of 3.42 μmol/m2s was obtained with 0.05 M KP as the carrier in the PIM at pH = 10.0 in the source and 0.10 M HCl in the receiving phases, respectively, when the initial MB concentration was 100 μM. The PIM we have developed exhibited good reusability and high MB removal efficiency from aqueous solutions.
Author Contributions
Conceptualization, A. N-Z.; methodology, A. N-Z and J. L.; validation, A.N-Z. and I.Z.; formal analysis, A.N-Z.; investigation, A.N-Z.; K.J.; K.W. and J.L.; data curation, A.N-Z.; writing—original draft preparation, A.N-Z.; writing—review and editing, I.Z.; visualization, A.N-Z.; supervision, G.M. and V.S. All authors have read and agreed to the published version of the manuscript.
References
- Sivakumar, R.; Lee, N.Y. Adsorptive removal of organic pollutant methylene blue using polysaccharide-based composite hydrogels. Chemosphere 2022, 286, 131890. [CrossRef]
- Khan, I.; Khan, I.; Usman, M.; Imran, M.; Saeed, K. Nanoclay-mediated photocatalytic activity enhancement of copper oxide nanoparticles for enhanced methyl orange photodegradation. J. Mater. Sci. Mater. Electron. 2020, 31, 8971–8985. [CrossRef]
- Alencar, L.V.T.D.; Passos, L.M.S.; Soares, C.M.F.; Lima, A.S.; Souza, R.L. Efficiency Method for Methylene Blue Recovery Using Aqueous Two-Phase Systems Based on Cholinium-Ionic Liquids. J. Fash. Technol. Text. Eng. 2020, 6, 13–20. [CrossRef]
- Ahmad, A.; Mohd-Setapar, S.H.; Chuong, C.S.; Khatoon, A.; Wani, W.A.; Kumar, R.; Rafatullah, M. Recent advances in new generation dye removal technologies: novel search for approaches to reprocess wastewater. RSC Adv. 2015, 5, 30801–30818. [CrossRef]
- Ahmad, M.; Rehman, W.; Khan, M.M.; Qureshi, M.T.; Gul, A.; Haq, S.; Ullah, R.; Rab, A.; Menaa, F. Phytogenic fabrication of ZnO and gold decorated ZnO nanoparticles for photocatalytic degradation of Rhodamine B. J. Environ. Chem. Eng. 2021, 9, 104725. [CrossRef]
- Pandey, S.; Do, J.Y.; Kim, J.; Kang, M. Fast and highly efficient removal of dye from aqueous solution using natural locust bean gum based hydrogels as adsorbent. Int. J. Biol. Macromol. 2020, 143, 60–75. [CrossRef]
- Fong, W.M.; Affam, A.C.; Chung, W.C. Synthesis of Ag/Fe/CAC for colour and COD removal from methylene blue dye wastewater. Int. J. Environ. Sci. Technol. 2020, 17, 3485–3494. [CrossRef]
- Benosmane, N.; Boutemeur, B.; Hamdi, S.M.; Hamdi, M. Removal of methylene blue dye from aqueous solutions using polymer inclusion membrane technology. Appl. Water Sci. 2022, 12, 1–11. [CrossRef]
- Derakhshan, Z.; Baghapour, M.A.; Ranjbar, M.; Faramarzian, M. Adsorption of Methylene Blue Dye from Aqueous Solutions by Modified Pumice Stone: Kinetics and Equilibrium Studies. Heal. Scope 2013, 2, 136–144. [CrossRef]
- Allouche, F.-N.; Yassaa, N. Potential adsorption of methylene blue from aqueous solution using green macroalgaePosidonia oceanica.. IOP Conf. Series: Mater. Sci. Eng. 2018, 323, 012006. [CrossRef]
- Han, T.H.; Khan, M.M.; Kalathil, S.; Lee, J.; Cho, M.H. Simultaneous Enhancement of Methylene Blue Degradation and Power Generation in a Microbial Fuel Cell by Gold Nanoparticles. Ind. Eng. Chem. Res. 2013, 52, 8174–8181. [CrossRef]
- Ashraf, M.W. Removal of methylene blue dye from wastewaters by using supported liquid membrane technology. Pol. J. Chem. Technol. 2016, 18, 26-30.
- Konczyk, J.; Nowik-Zajac, A.; Kozlowski, C.A. Calixarene-based extractants for heavy metal ions removal from aqueous solutions. Sep. Sci. Technol. 2016, 51, 2394–2410. [CrossRef]
- Nghiem, L.D.; Mornane, P.; Potter, I.D.; Perera, J.M.; Cattrall, R.W.; Kolev, S.D. Extraction and transport of metal ions and small organic compounds using polymer inclusion membranes (PIMs). J. Membr. Sci. 2006, 281, 7–41. [CrossRef]
- Benosmane, N.; Boutemeur, B.; Hamdi, S.; Hamdi, M. Citric acid removal from aqueous solutions using a polymer inclusion membrane based on a mixture of CTA and CA. Desalination Water Treat. 2018, 114, 163–168. [CrossRef]
- Nowik-Zajac, A.; Zawierucha, I.; Kozlowski, C. Selective Transport of Ag(I) through a Polymer Inclusion Membrane Containing a Calix[4]pyrrole Derivative from Nitrate Aqueous Solutions. Int. J. Mol. Sci. 2020, 21, 5348. [CrossRef]
- Zawierucha, I.; Nowik-Zajac, A.; Lagiewka, J.; Malina, G. Separation of Mercury(II) from Industrial Wastewater through Polymer Inclusion Membranes with Calix[4]pyrrole Derivative. Membranes 2022, 12, 492. [CrossRef]
- Zawierucha, I.; Nowik-Zajac, A.; Kozlowski, C.A. Removal of Pb(II) Ions Using Polymer Inclusion Membranes Containing Calix[4]resorcinarene Derivative as Ion Carrier. Polymers 2019, 11, 2111. [CrossRef]
- Zawierucha, I.; Nowik-Zajac, A.; Malina, G. Selective Removal of As(V) Ions from Acid Mine Drainage Using Polymer Inclusion Membranes. Minerals 2020, 10, 909. [CrossRef]
- Minhas, M.A.; Rauf, A.; Rauf, S.; Minhas, F.T.; Memon, N.; Jabbar, A.; Bhanger, M.I.; Malik, M.I. Selective and efficient extraction of cationic dyes from industrial effluents through polymer inclusion membrane. Sep. Purif. Technol. 2021, 272, 118883. [CrossRef]
- Lagiewka, J.; Nowik-Zajac, A.; Pajdak, A.; Zawierucha, I. A novel multifunctional β-cyclodextrin polymer as a promising sorbent for rapid removal of methylene blue from aqueous solutions. Carbohydr. Polym. 2023, 307, 120615. [CrossRef]
- Gale P.A.; Sessler J.L.; Kràl, V. Calixpyrroles. Chem. Commun. 1998, 1-8.
- Gale, P.A.; Sessler, J.L.; Král, V.; Lynch, V. Calix[4]pyrroles: Old Yet New Anion-Binding Agents. J. Am. Chem. Soc. 1996, 118, 5140–5141. [CrossRef]
- Zawierucha, I.; Nowik-Zajac, A.; Kozlowski, C. Application of Cr(VI) transport across the polymer inclusion membrane with calixresorcin [4]arene derivative as ion carrier. Sep. Sci. Technol. 2020, 55, 2204–2210. [CrossRef]
- Danesi, P.R. Separation of Metal Species by Supported Liquid Membranes. Sep. Sci. Technol. 1984, 19, 857–894. [CrossRef]
- Nowik-Zajac, A.; Zawierucha, I.; Kozlowski, C. Selective removal of silver(i) using polymer inclusion membranes containing calixpyrroles. RSC Adv. 2019, 9, 31122–31132. [CrossRef]
- Kebiche-Senhadji, O.;Mansouri, S.; Tingry, P.; Seta, M.; Benamor, M. Faciliated Cd(II) transport across CTA polymer inclusion membrane using anion (Aliquat 336) and cation (D2EHPA) metal carriers. J. Membr. Sci. 2008, 310, 438-445. [CrossRef]
- Scott, K. Handbook of Industrial Membranes; Elsevier BV: Amsterdam, NX, Netherlands, 1995; ISBN: 9781856172332.
- Cox, M. Solvent Extraction in Hydrometallurgy, in: Solvent Extraction. Principles and Practice, Eds. J. Rydberg; M. Cox; C. Musikas, C.R. Choppin; M. Dekker, 2004.
- Rodríguez de San Miguel, E.; Aquilar, J.C.; De Gyves, J. Structural effects on metal ion migration across polymer inclusion membranes: Dependence of transport profiles on nature of active plasticizer. J. Membr. Sci. 2008, 307, 105-116.
- Forgacs, E.; Cserháti, T.; Oros, G. Removal of synthetic dyes from wastewaters: a review. Environ. Int. 2004, 30, 953–971. [CrossRef]
- Cho, Y.; Xu, C.; Cattrall, R.W.; Kolev, S.D. A polymer inclusion membrane for extracting thiocyanate from weakly alkine solutions. J. Membr. Sci. 2011, 367, 85. [CrossRef]
- Sabzi, N.E.; Kiasat, A.R. β-Cyclodextrin Based Nanosponge as a Biodegradable Porous Three-Dimensional Nanocatalyst in the One-Pot Synthesis of N- Containing Organic Scaffolds. Catal. Lett. 2018, 148, 2654–2664. [CrossRef]
- Benosmane, N.; Guedioura, B.; Hamdi, S.M.; Hamdi, M.; Boutemeur, B. Preparation, characterization and thermal studies of polymer inclusion cellulose acetate membrane with calix[4]resorcinarenes as carriers. Mater. Sci. Eng. C 2010, 30, 860–867. [CrossRef]
- Arous, O.; Amara, M.; Kerdjoudi, H. Selective transport of metal ions using polymer inclusion membranes containing crown-ether and cryptands. Arab. J. Sci. Eng. 2010, 35, 79-93.
- Mohapatra, P.; Lakshmi, D.; Bhattacharyya, A.; Manchanda, V. Evaluation of polymer inclusion membranes containing crown ethers for selective cesium separation from nuclear waste solution. J. Hazard. Mater. 2009, 169, 472–479. [CrossRef]
Figure 1.
Structures of: a) meso-tetra methyl tetrakis-[methyl-2-(4-acetlphenoxy)] calix[4]pyrrole (KP), b) methylene blue (MB).
Figure 1.
Structures of: a) meso-tetra methyl tetrakis-[methyl-2-(4-acetlphenoxy)] calix[4]pyrrole (KP), b) methylene blue (MB).
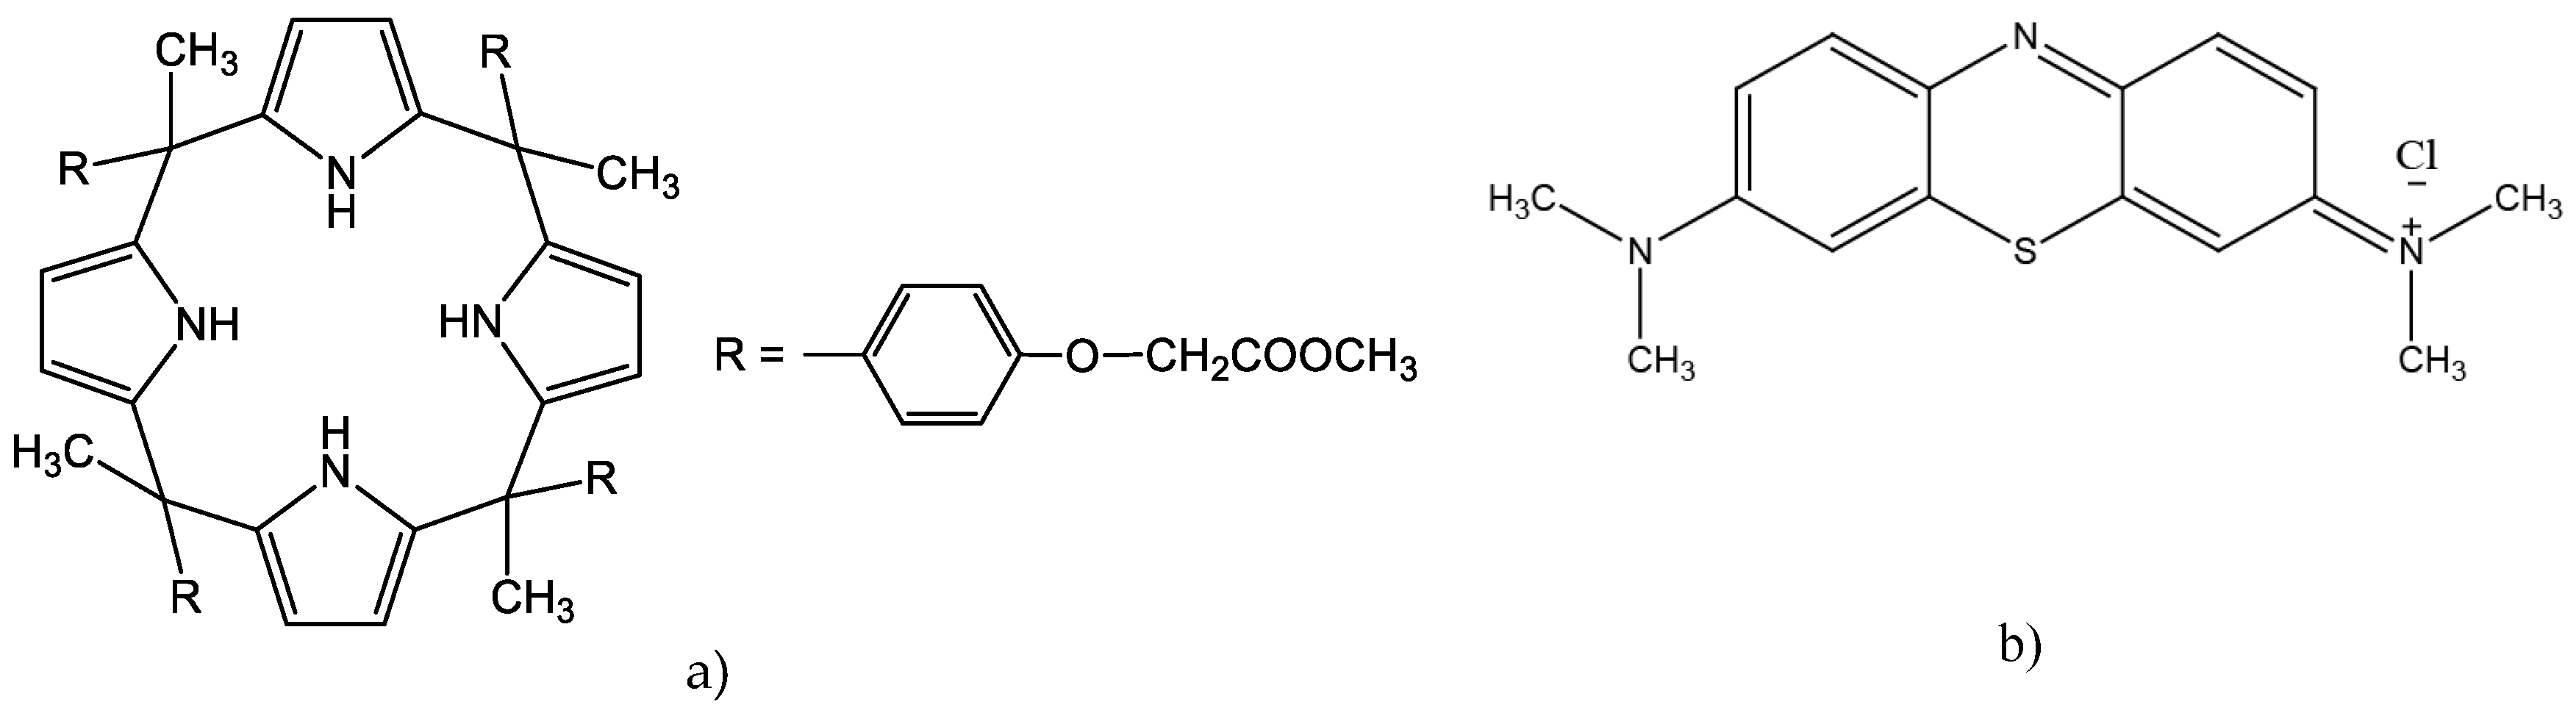
Figure 2.
The profiles of MB concentrations in the source, membrane and receiving phases during transport across PIM containing KP. Source phase: 100.0 μM MB, pH source phase = 10.0; membrane: 2.0 mL o-NPPE / 1.0 g CTA; 0.050 M KP, receiving phase: 0.10 M HCl.
Figure 2.
The profiles of MB concentrations in the source, membrane and receiving phases during transport across PIM containing KP. Source phase: 100.0 μM MB, pH source phase = 10.0; membrane: 2.0 mL o-NPPE / 1.0 g CTA; 0.050 M KP, receiving phase: 0.10 M HCl.
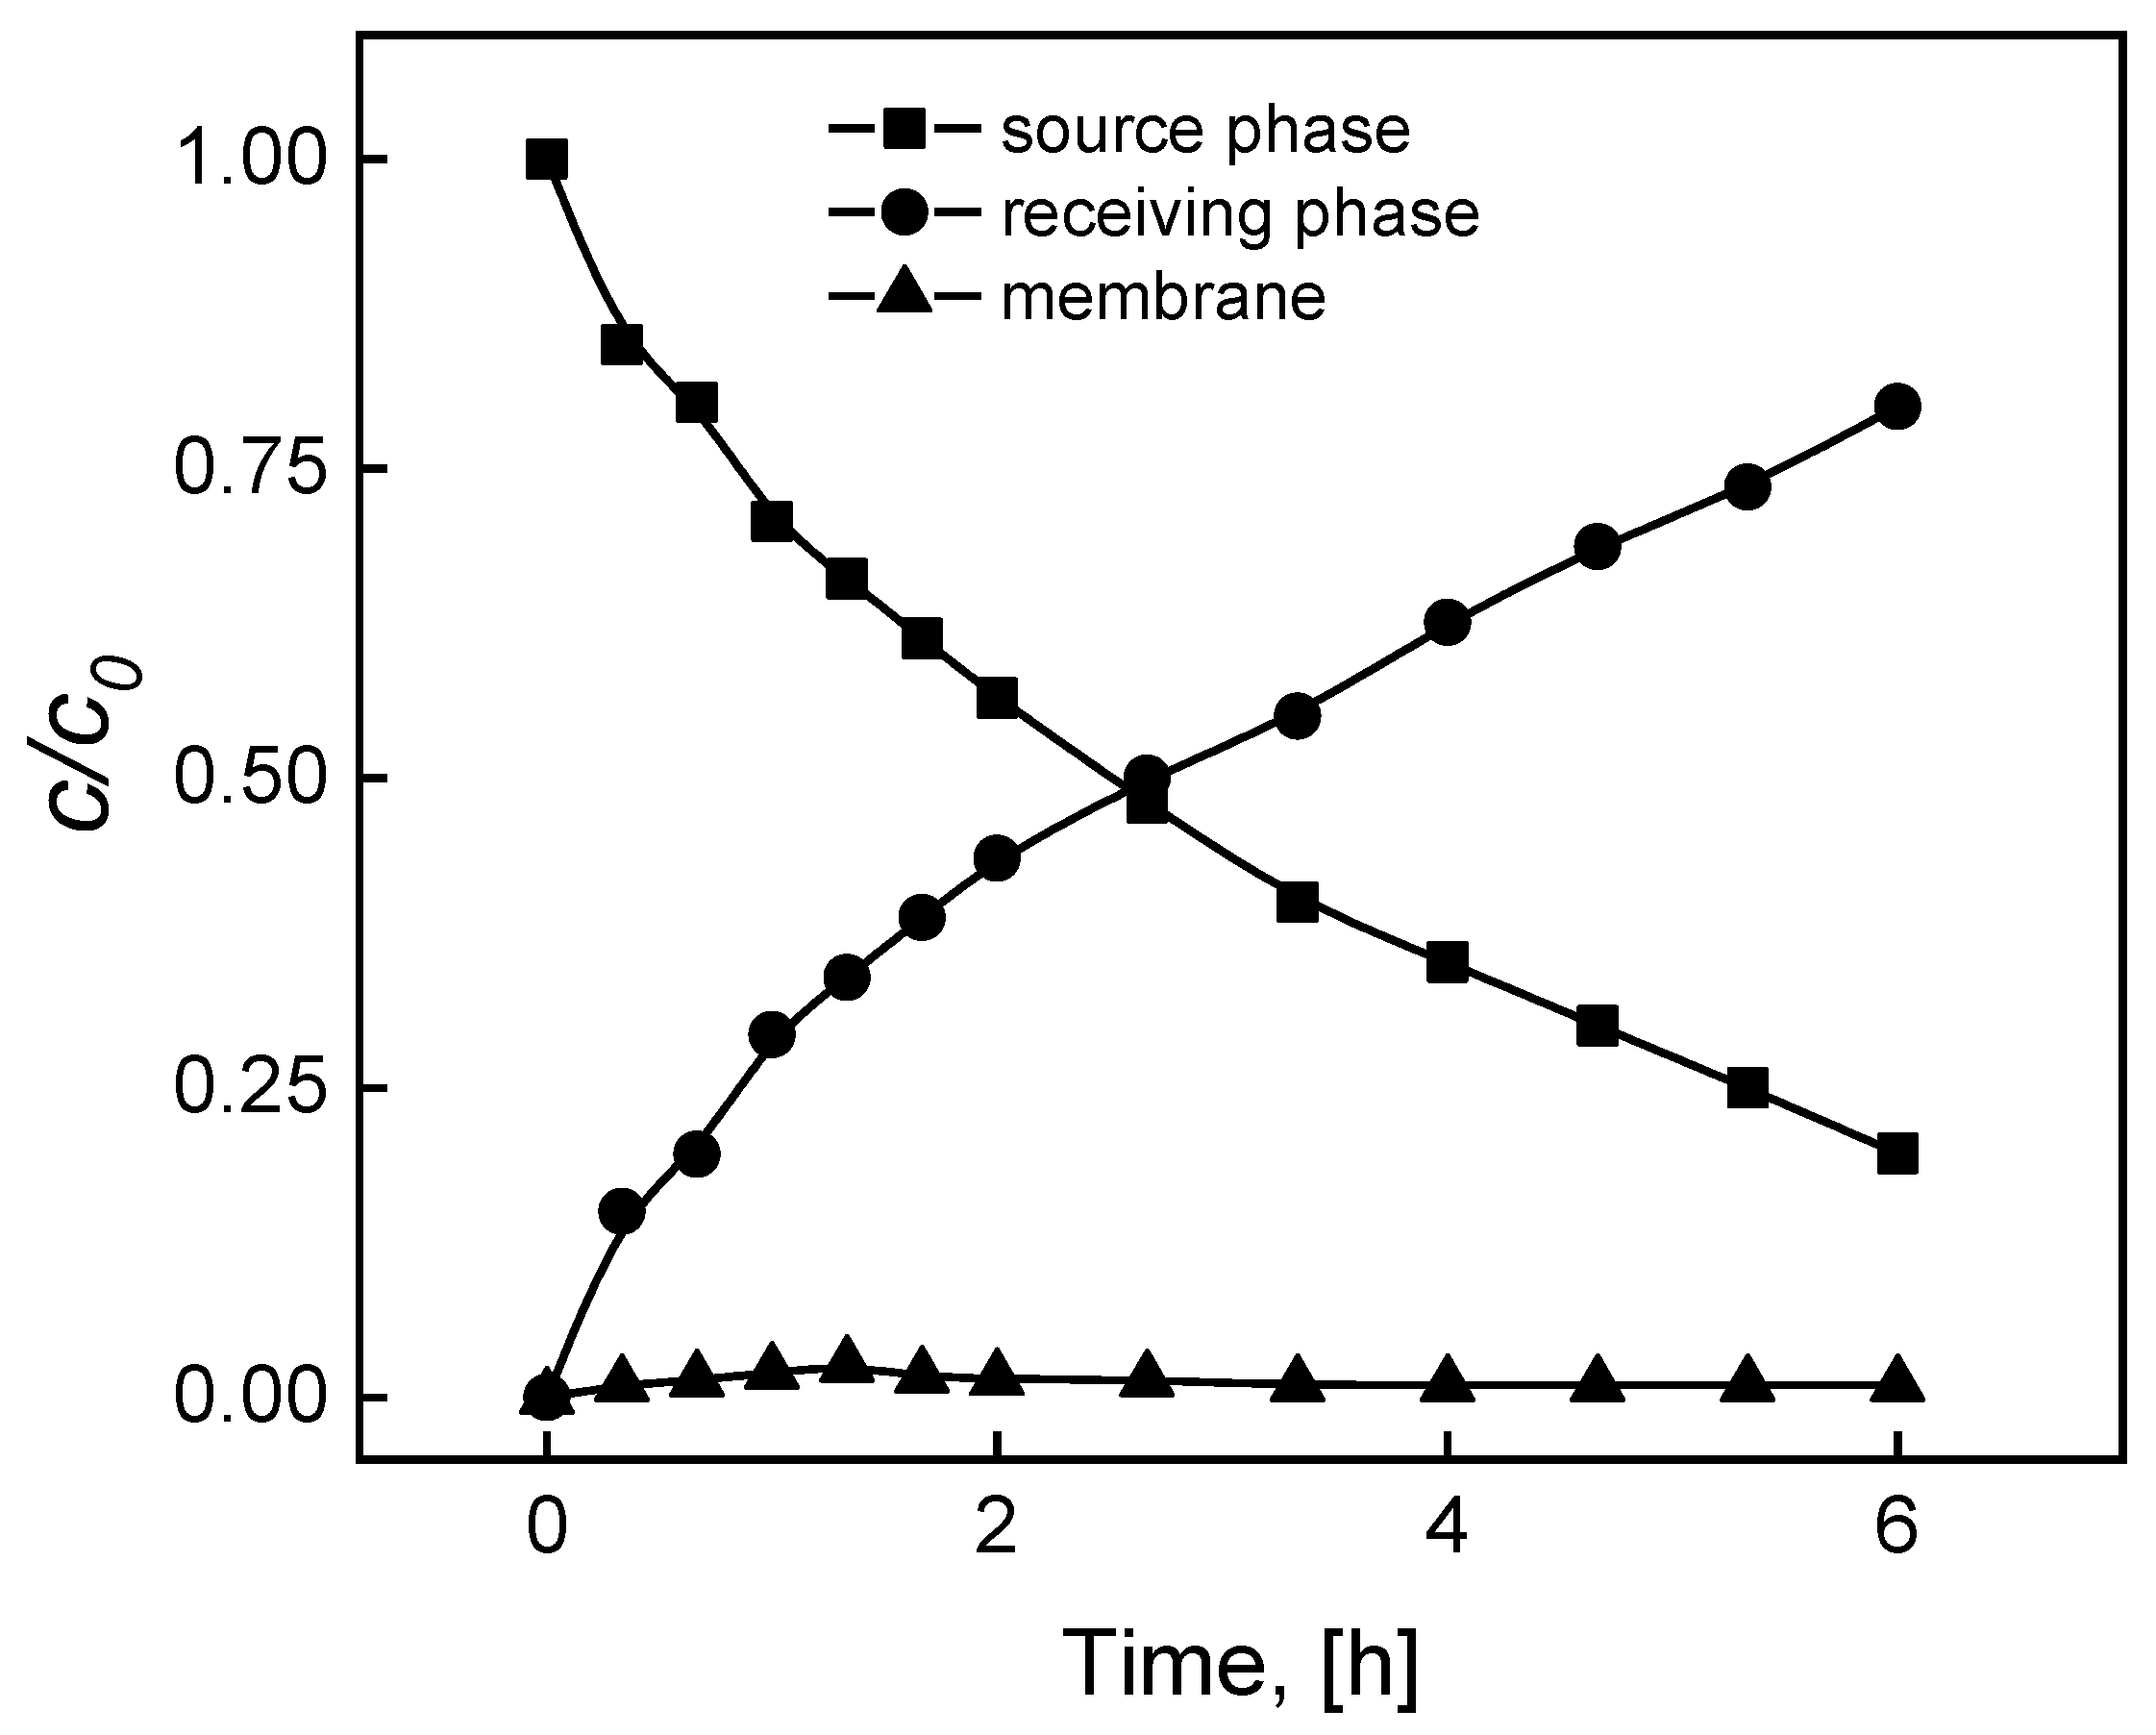
Figure 3.
The relationship ln(c/ci) vs. transport time of MB across the PIM with KP. Source phase: 100.0 μM MB, pH source phase = 10.0; membrane: 2.0 mL o-NPPE / 1.0 g CTA; 0.050 M KP, receiving phase: 0.10 M HCl.
Figure 3.
The relationship ln(c/ci) vs. transport time of MB across the PIM with KP. Source phase: 100.0 μM MB, pH source phase = 10.0; membrane: 2.0 mL o-NPPE / 1.0 g CTA; 0.050 M KP, receiving phase: 0.10 M HCl.
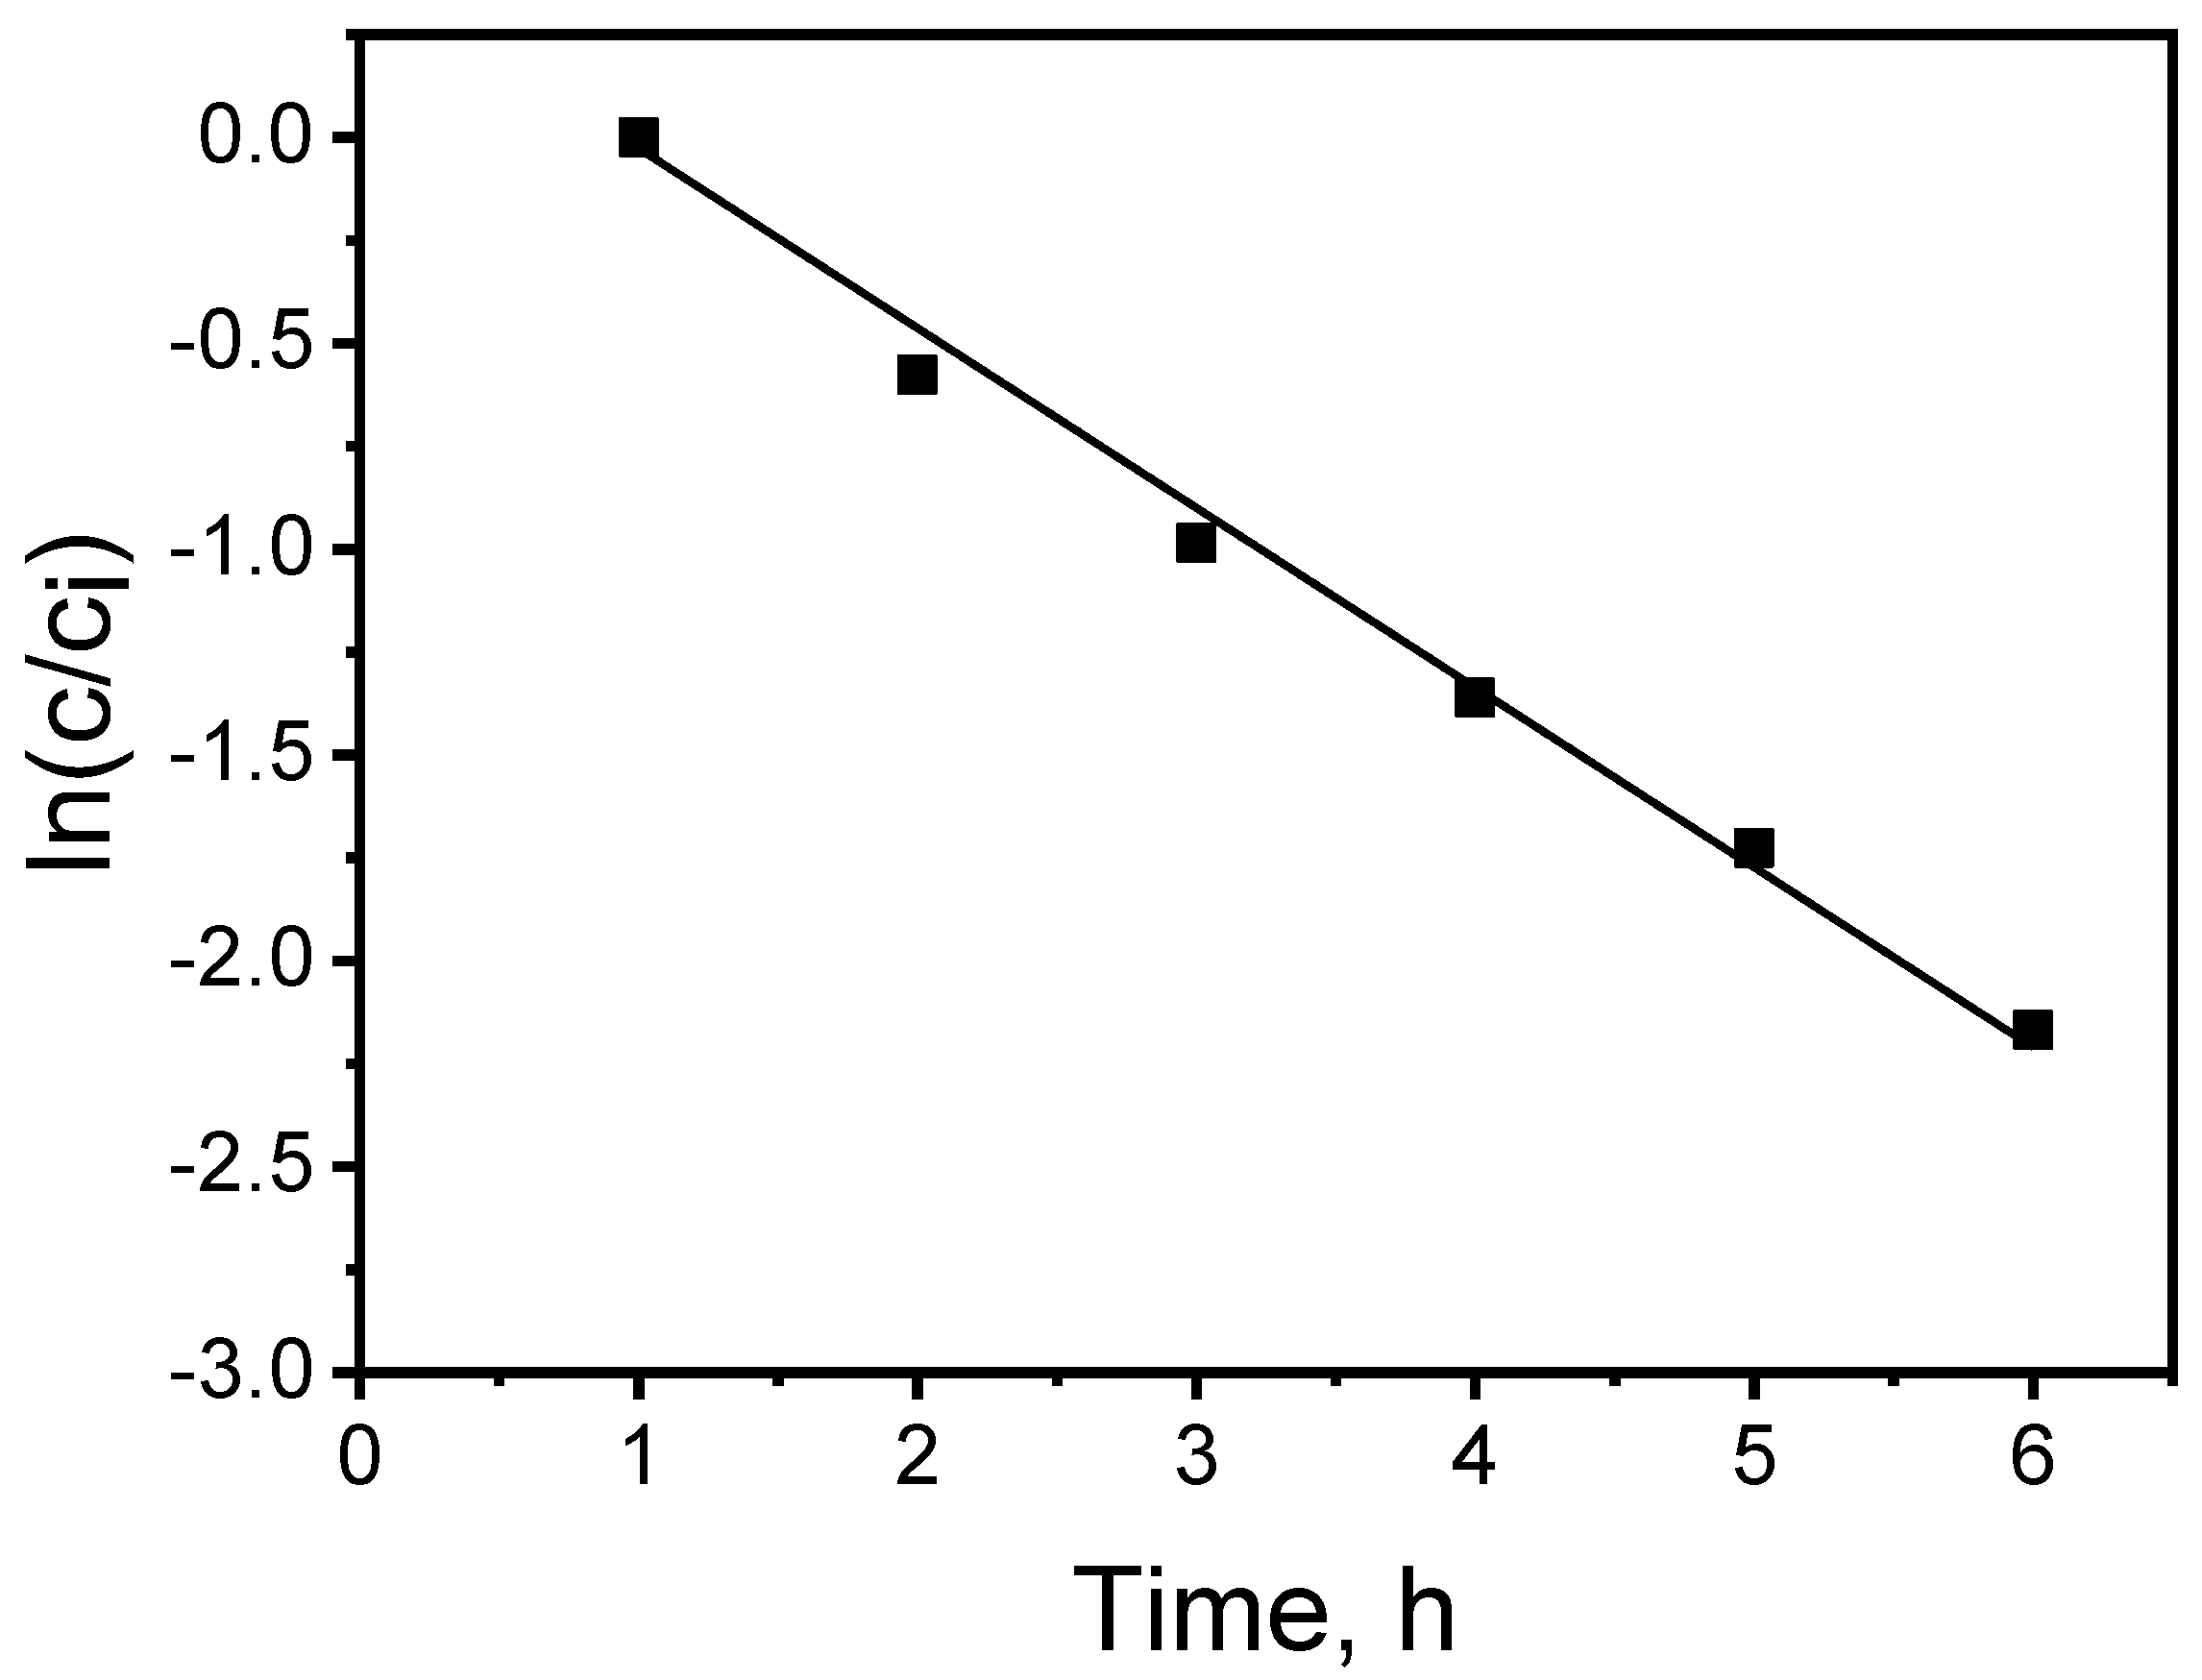
Figure 4.
The MB transport fluxes vs. carrier concentration in the PIM. Source phase: 100.0 μM MB, pH source phase = 10.0; membrane: 25 mg CTA; 2.0 mL o-NPPE / 1.0 g CTA; receiving phase: 0.10 M HCl.
Figure 4.
The MB transport fluxes vs. carrier concentration in the PIM. Source phase: 100.0 μM MB, pH source phase = 10.0; membrane: 25 mg CTA; 2.0 mL o-NPPE / 1.0 g CTA; receiving phase: 0.10 M HCl.
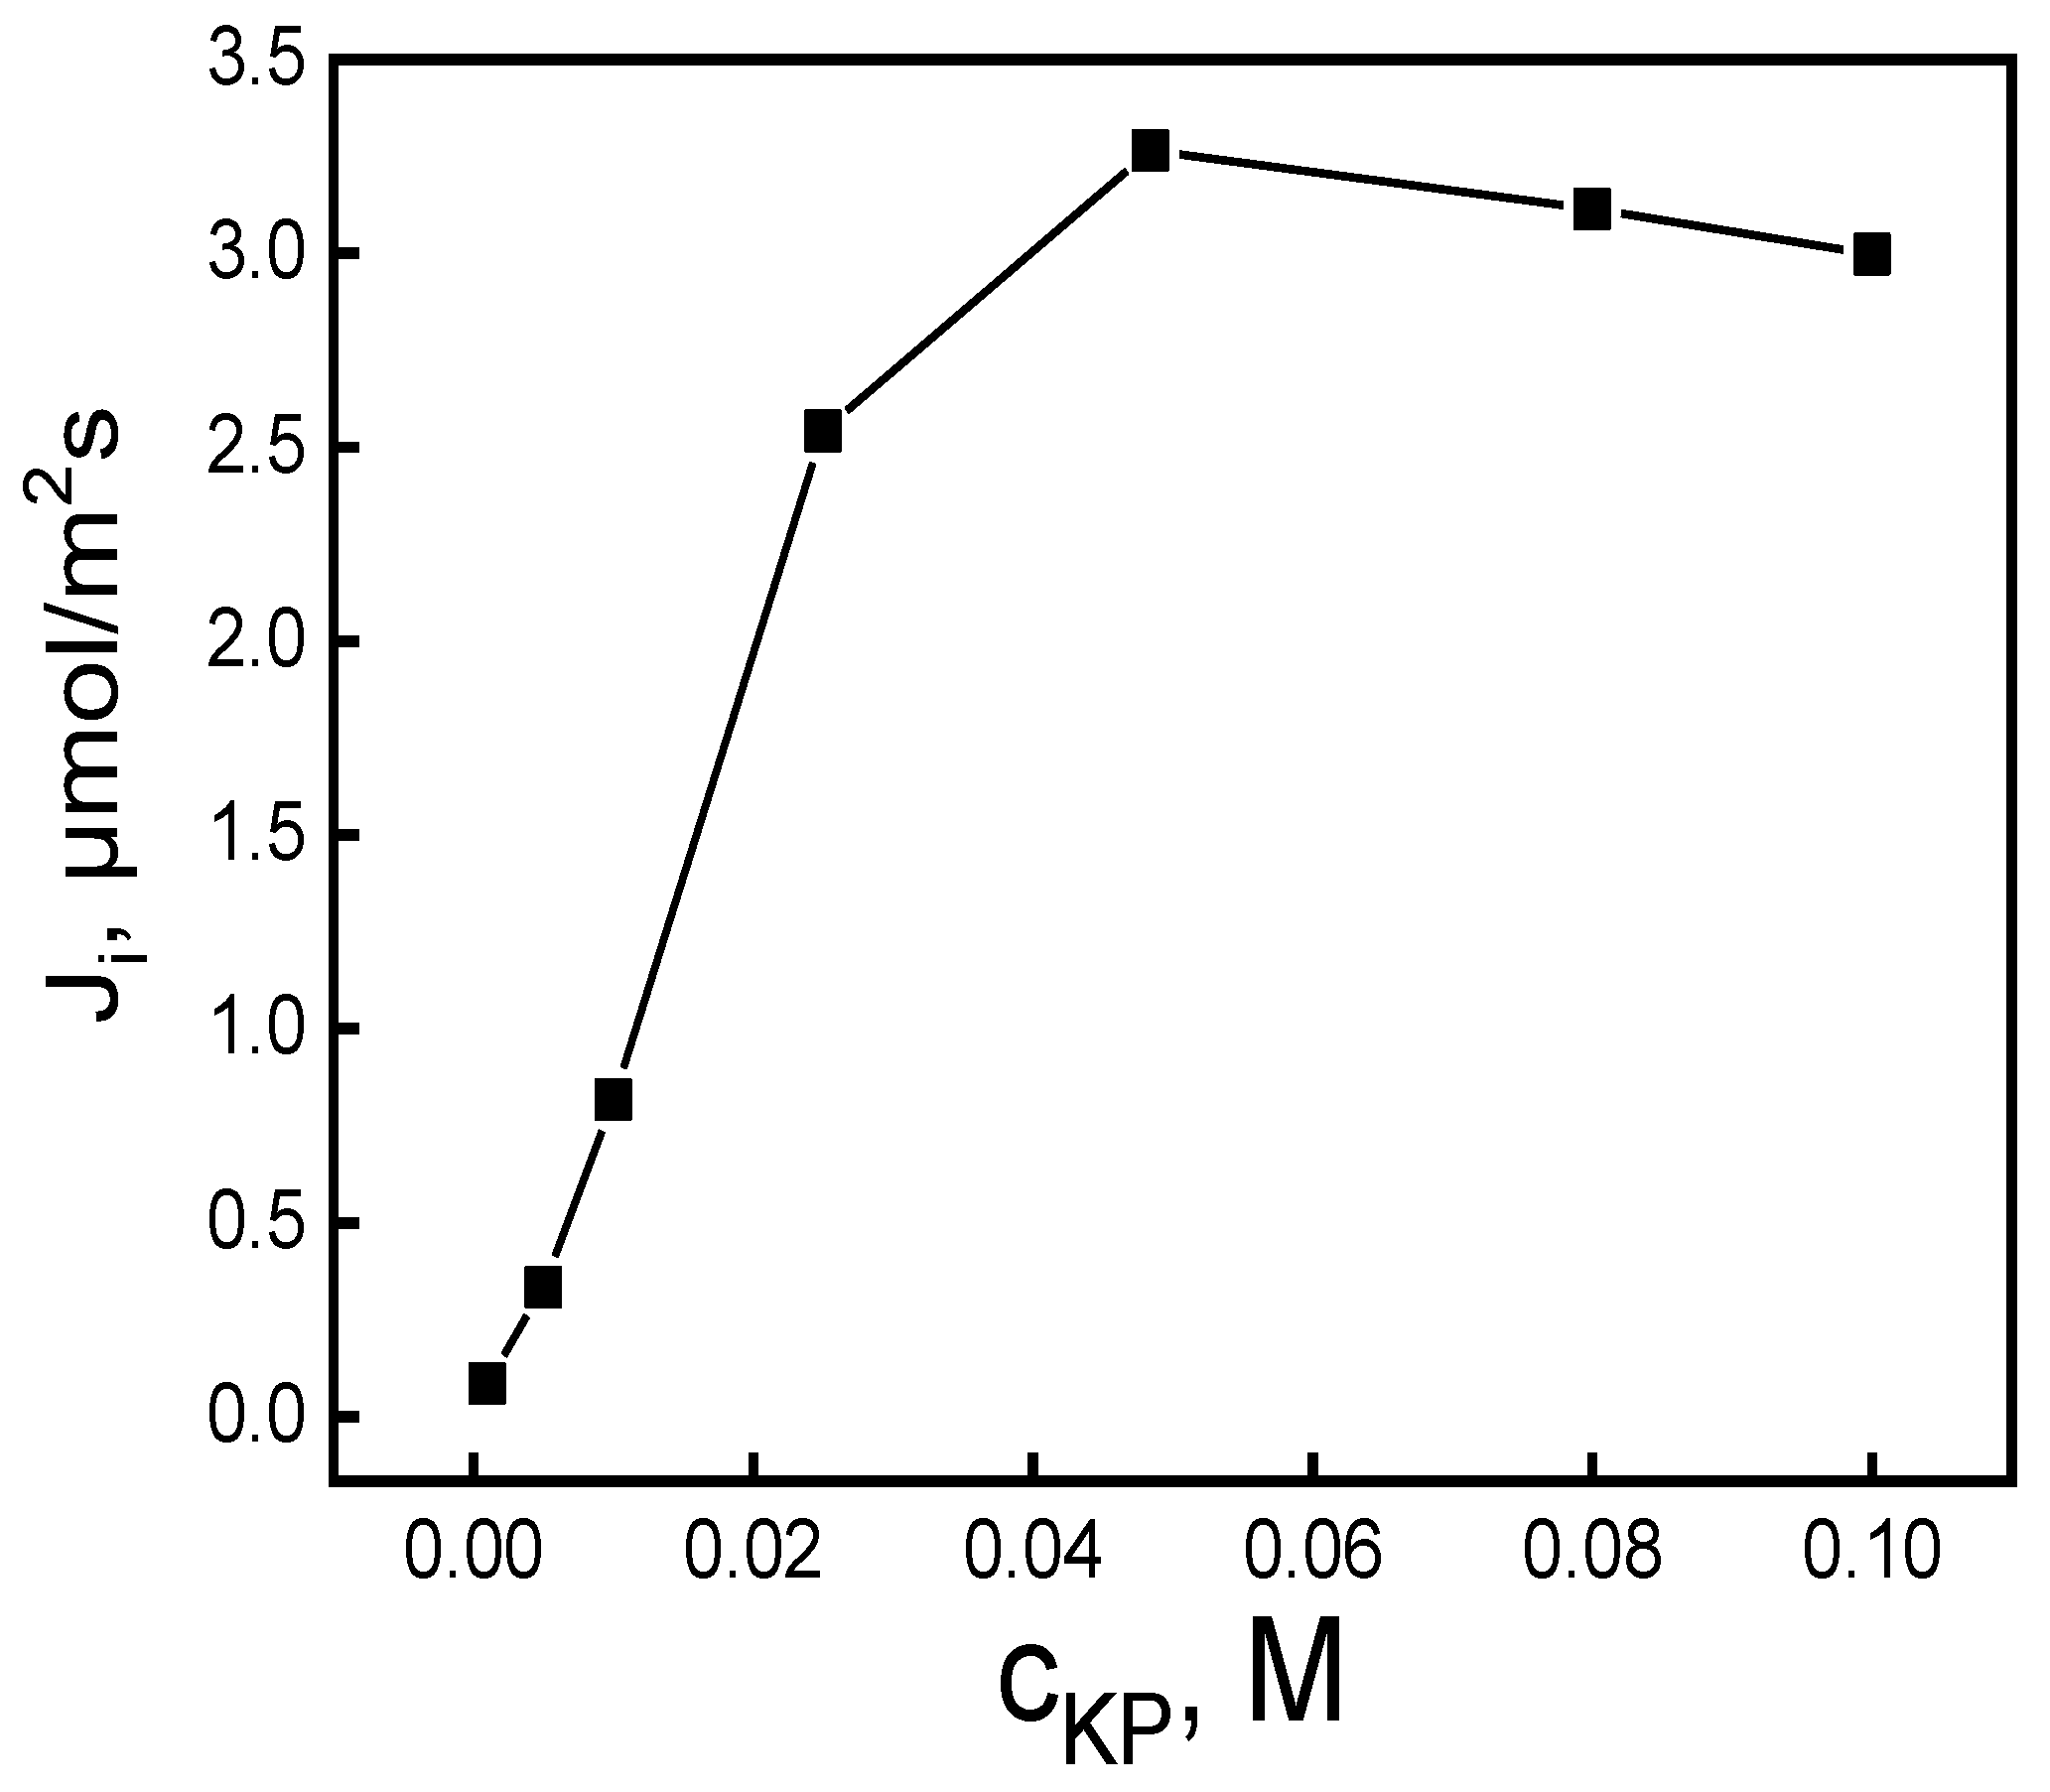
Figure 5.
The relationship of the initial MB ion flux transport across the PIM vs. pH of the source phase. Source phase: 100.0 μM MB; membrane: 2.0 mL o-NPPE / 1.0 g CTA; 0.050 M KP, receiving phase: 0.10 M HCl.
Figure 5.
The relationship of the initial MB ion flux transport across the PIM vs. pH of the source phase. Source phase: 100.0 μM MB; membrane: 2.0 mL o-NPPE / 1.0 g CTA; 0.050 M KP, receiving phase: 0.10 M HCl.
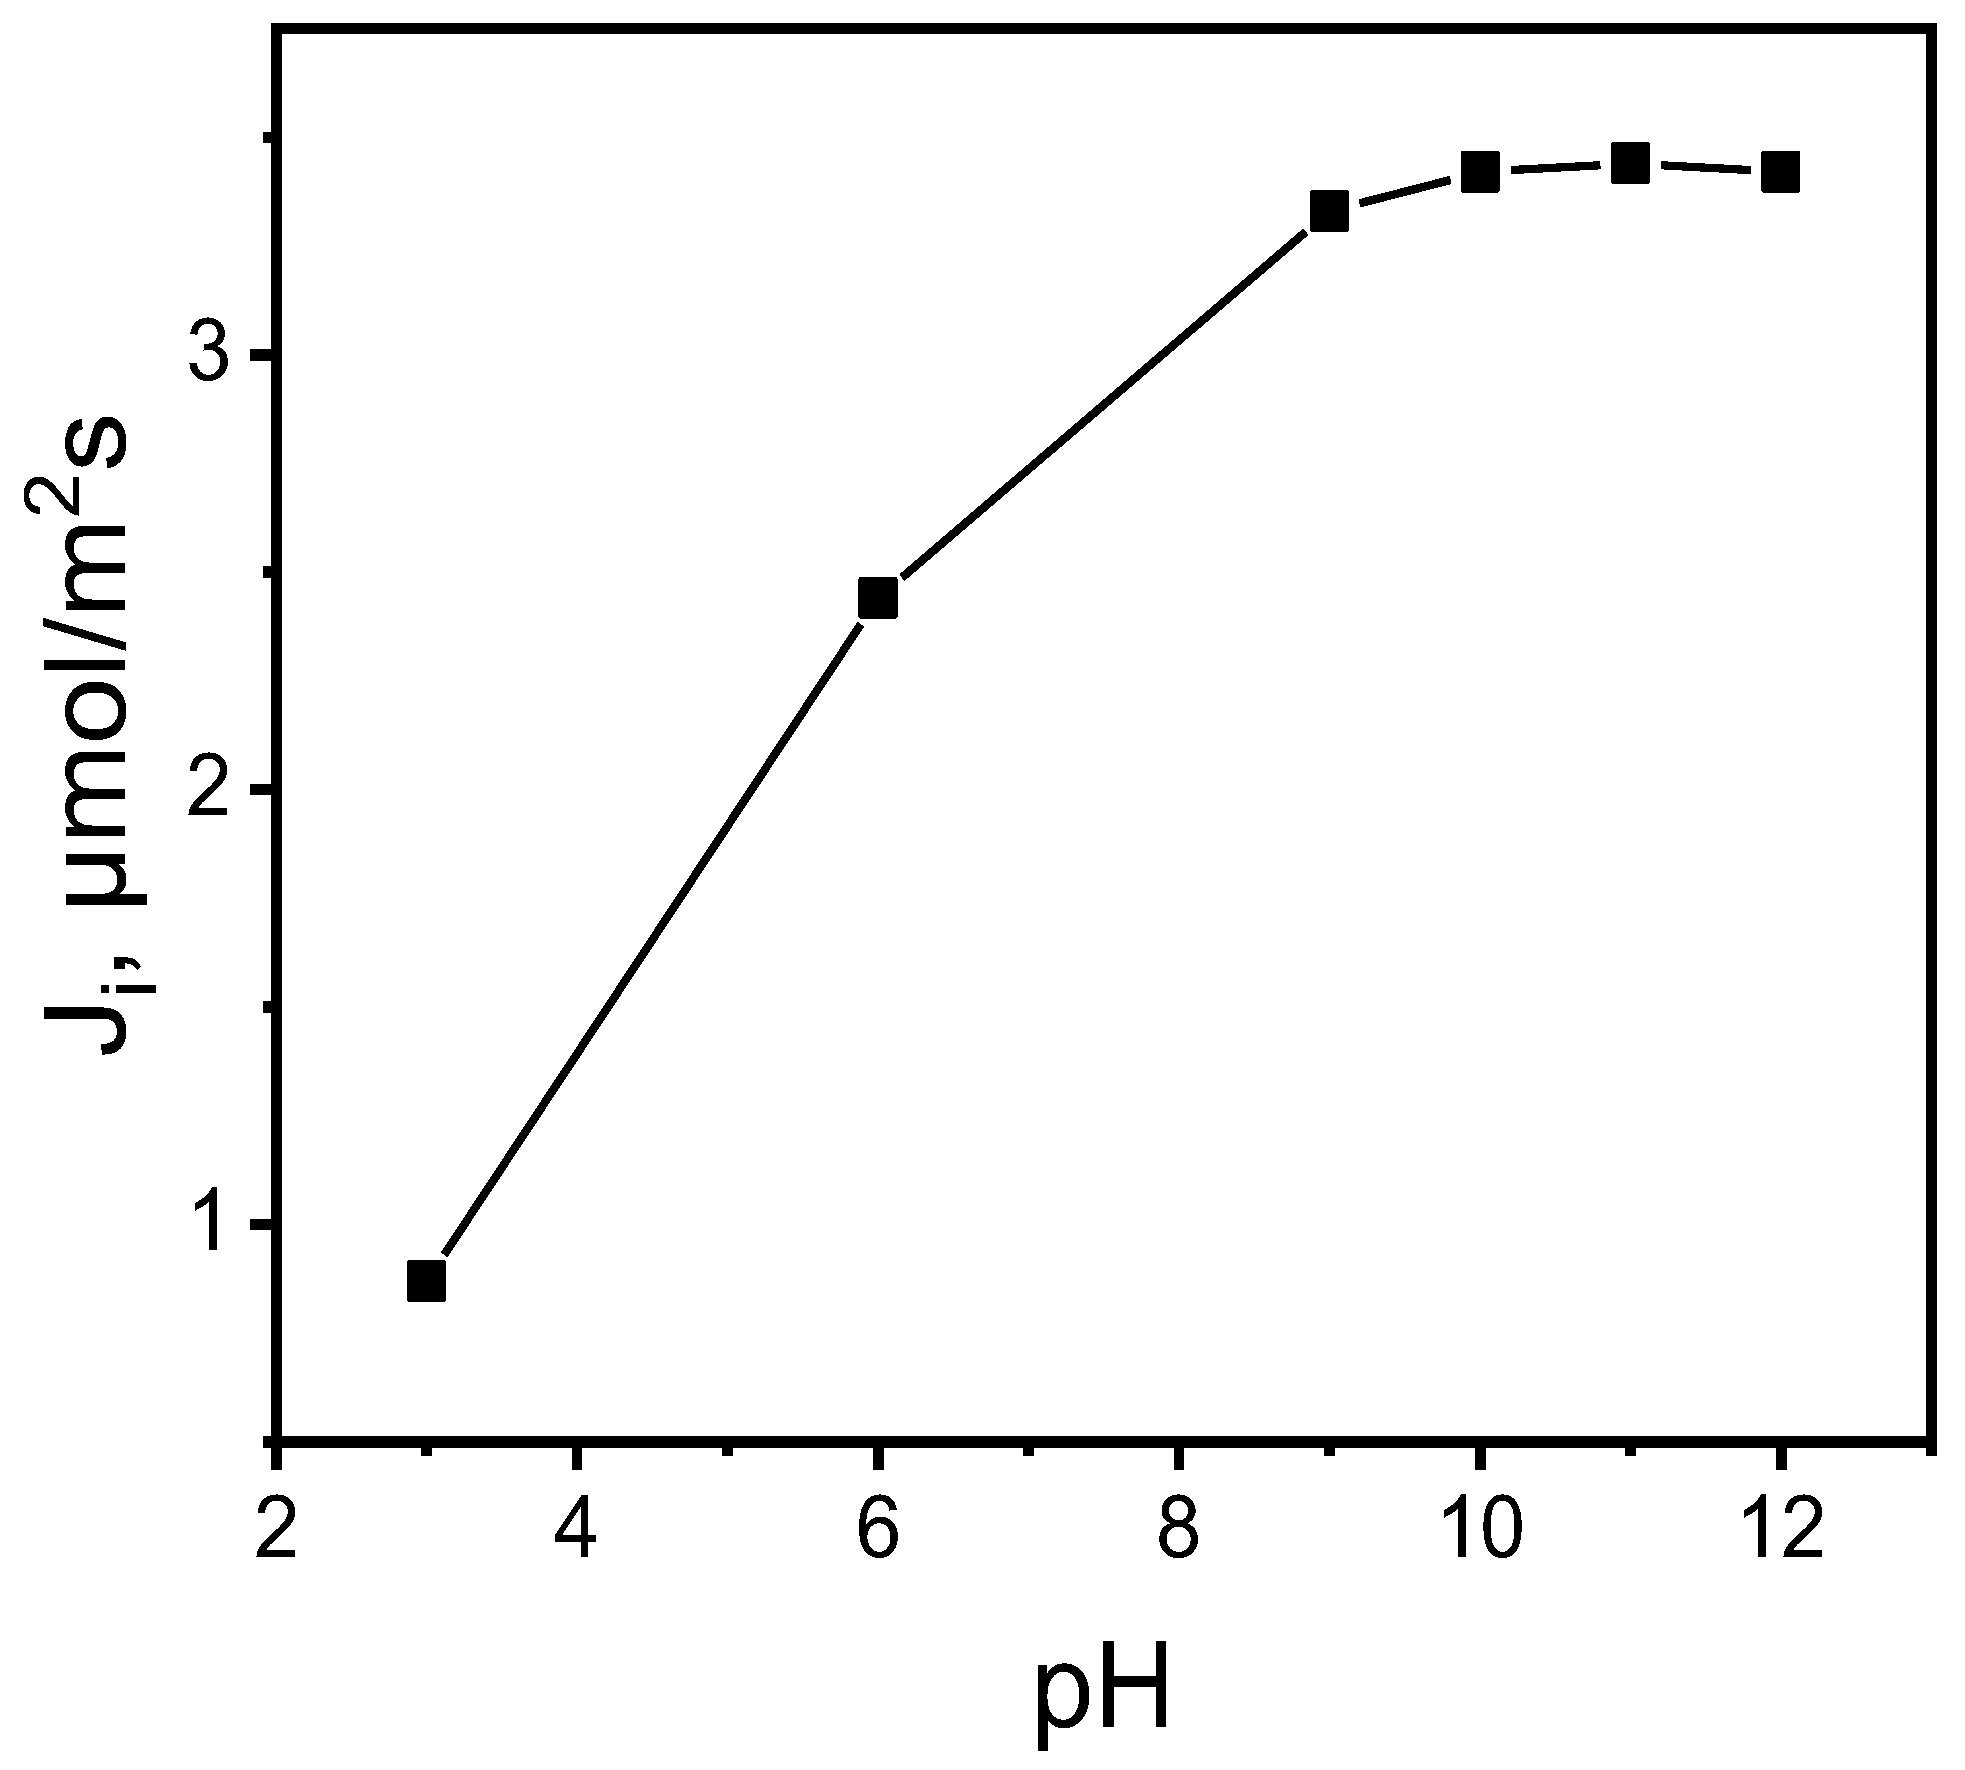
Figure 6.
The effect of MB concentrations in the source aqueous phase. Source phase: various concentrations of MB, pH source phase = 10.0; membrane: 2.0 mL o-NPPE / 1.0 g CTA; 0.050 M KP, receiving phase: 0.10 M HCl.
Figure 6.
The effect of MB concentrations in the source aqueous phase. Source phase: various concentrations of MB, pH source phase = 10.0; membrane: 2.0 mL o-NPPE / 1.0 g CTA; 0.050 M KP, receiving phase: 0.10 M HCl.
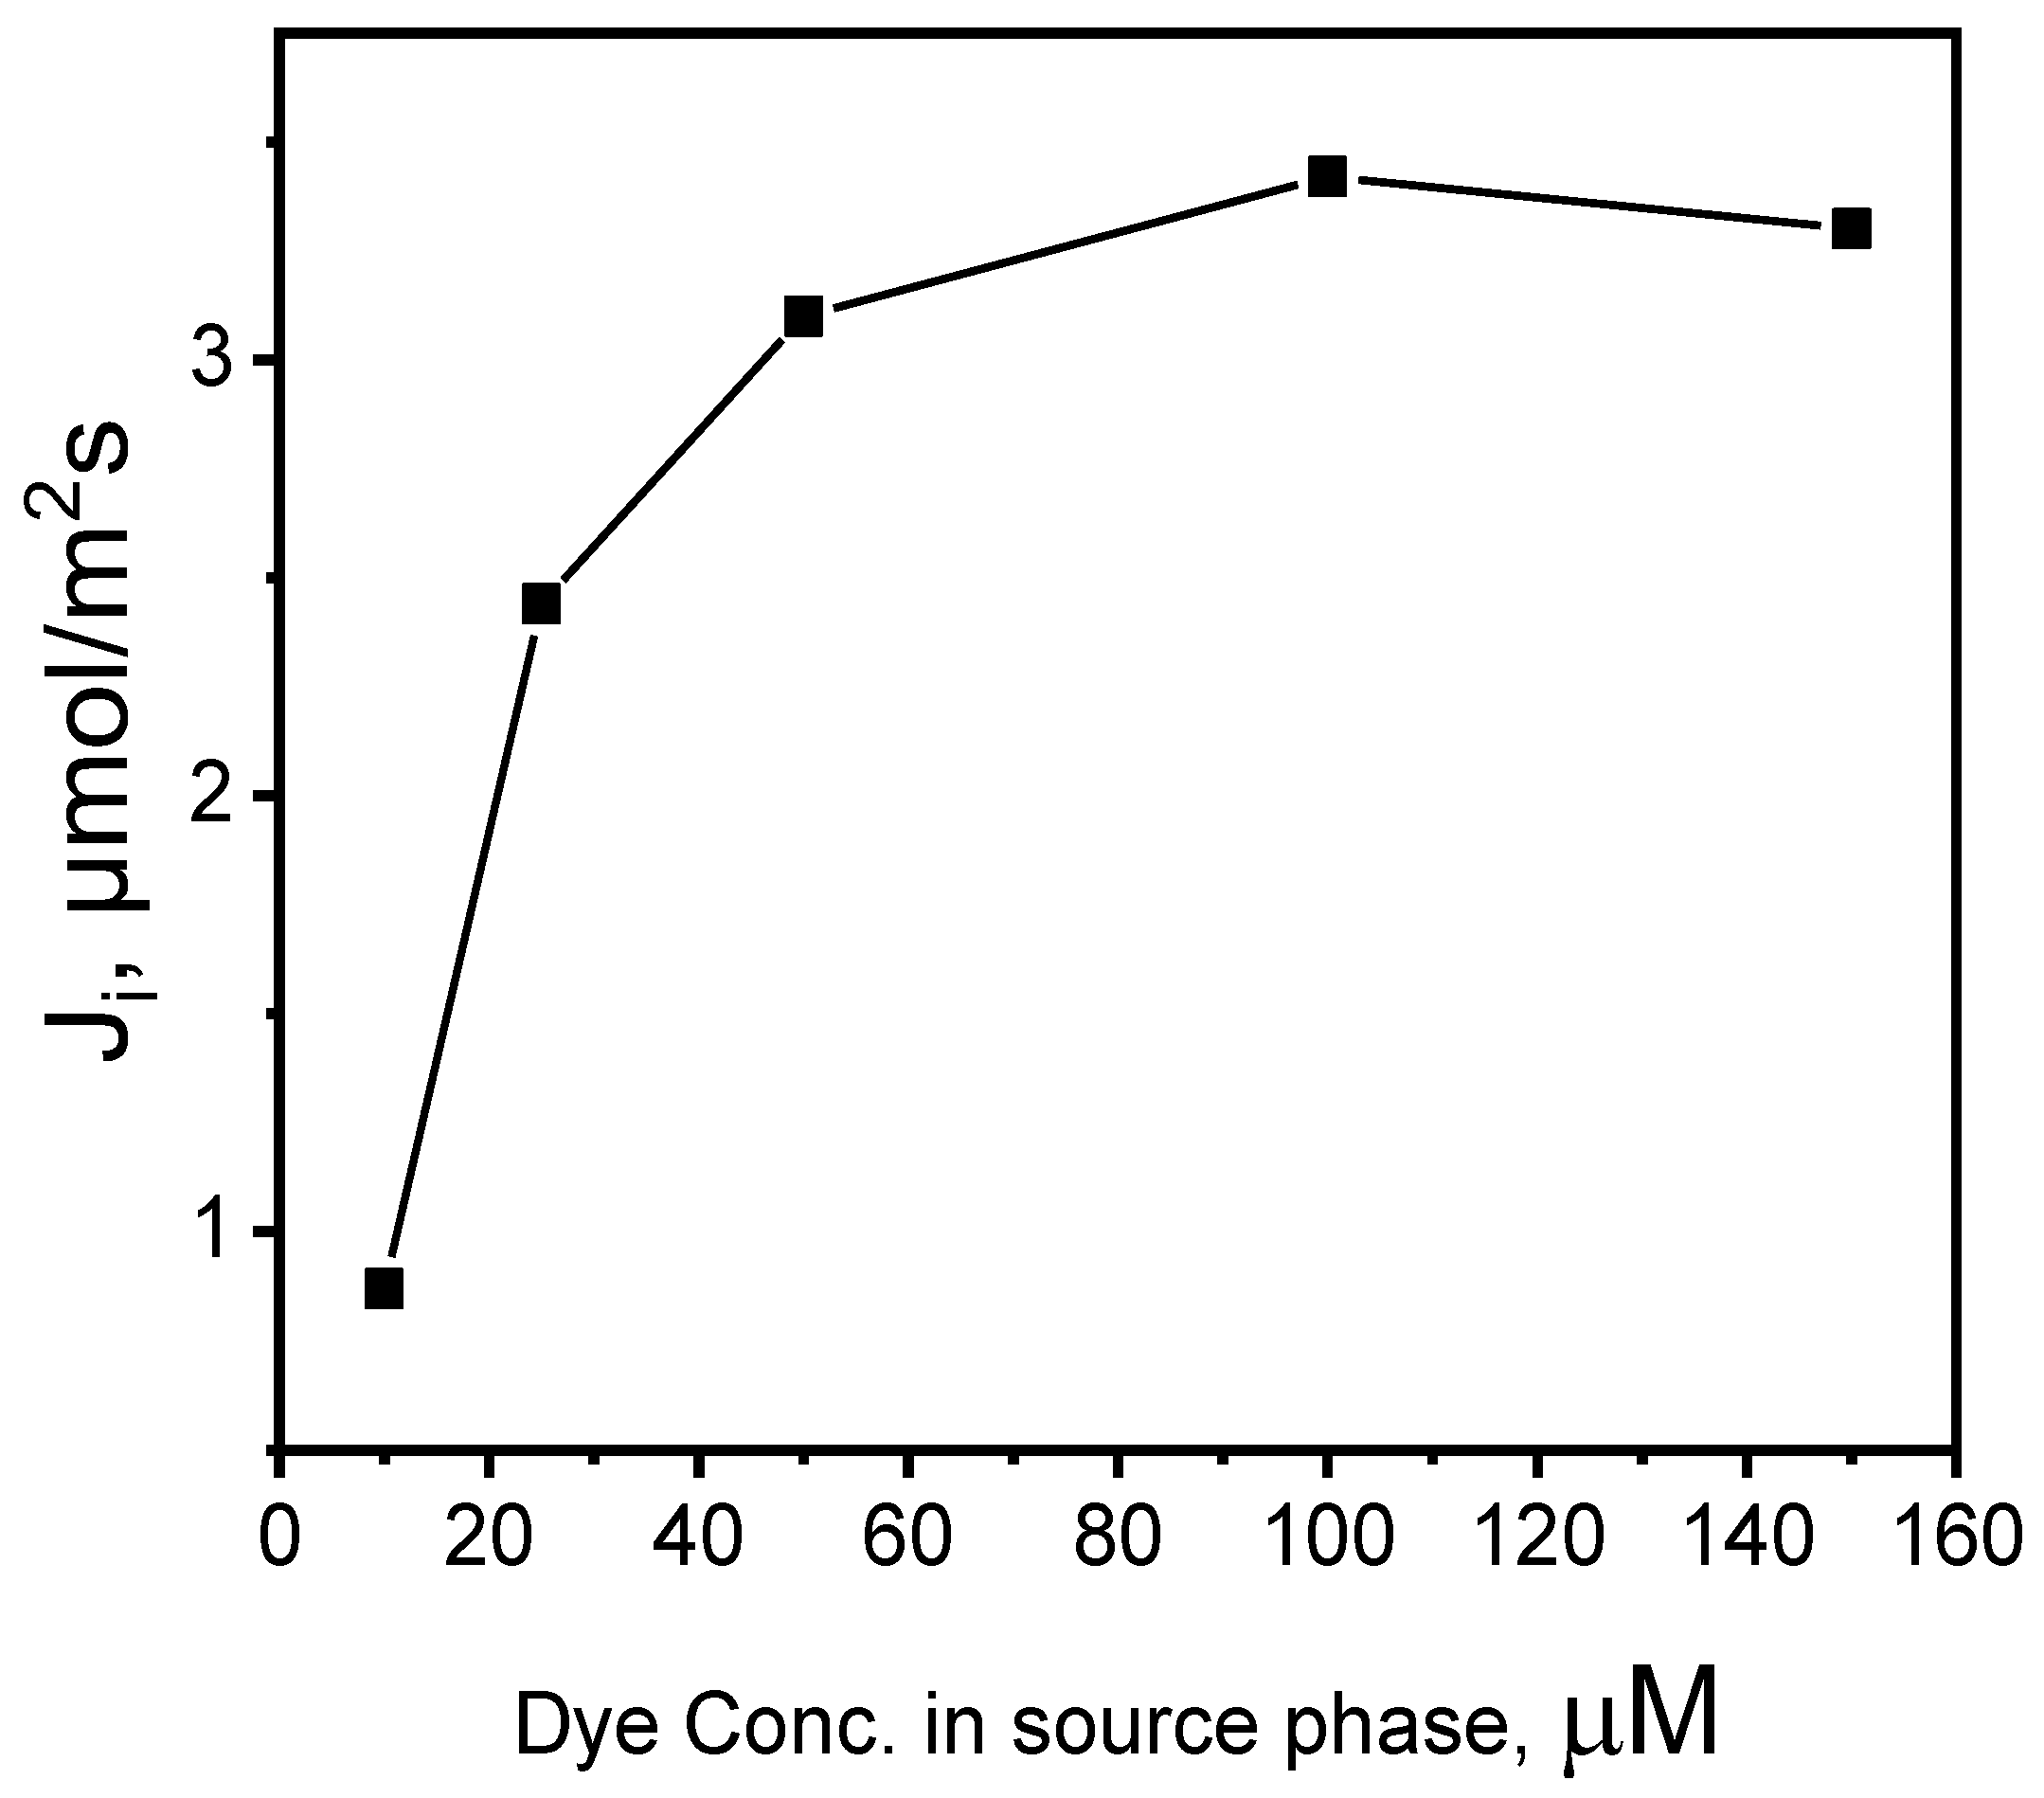
Figure 7.
The recovery factor (RF) of MB vs. the cycle number. Source phase: 100.0 μM MB, membrane: 18 wt.% of CTA, 8 wt.% of KP, 74 wt.% of o-NPOE; receiving phase: 0.10 M HCl.
Figure 7.
The recovery factor (RF) of MB vs. the cycle number. Source phase: 100.0 μM MB, membrane: 18 wt.% of CTA, 8 wt.% of KP, 74 wt.% of o-NPOE; receiving phase: 0.10 M HCl.
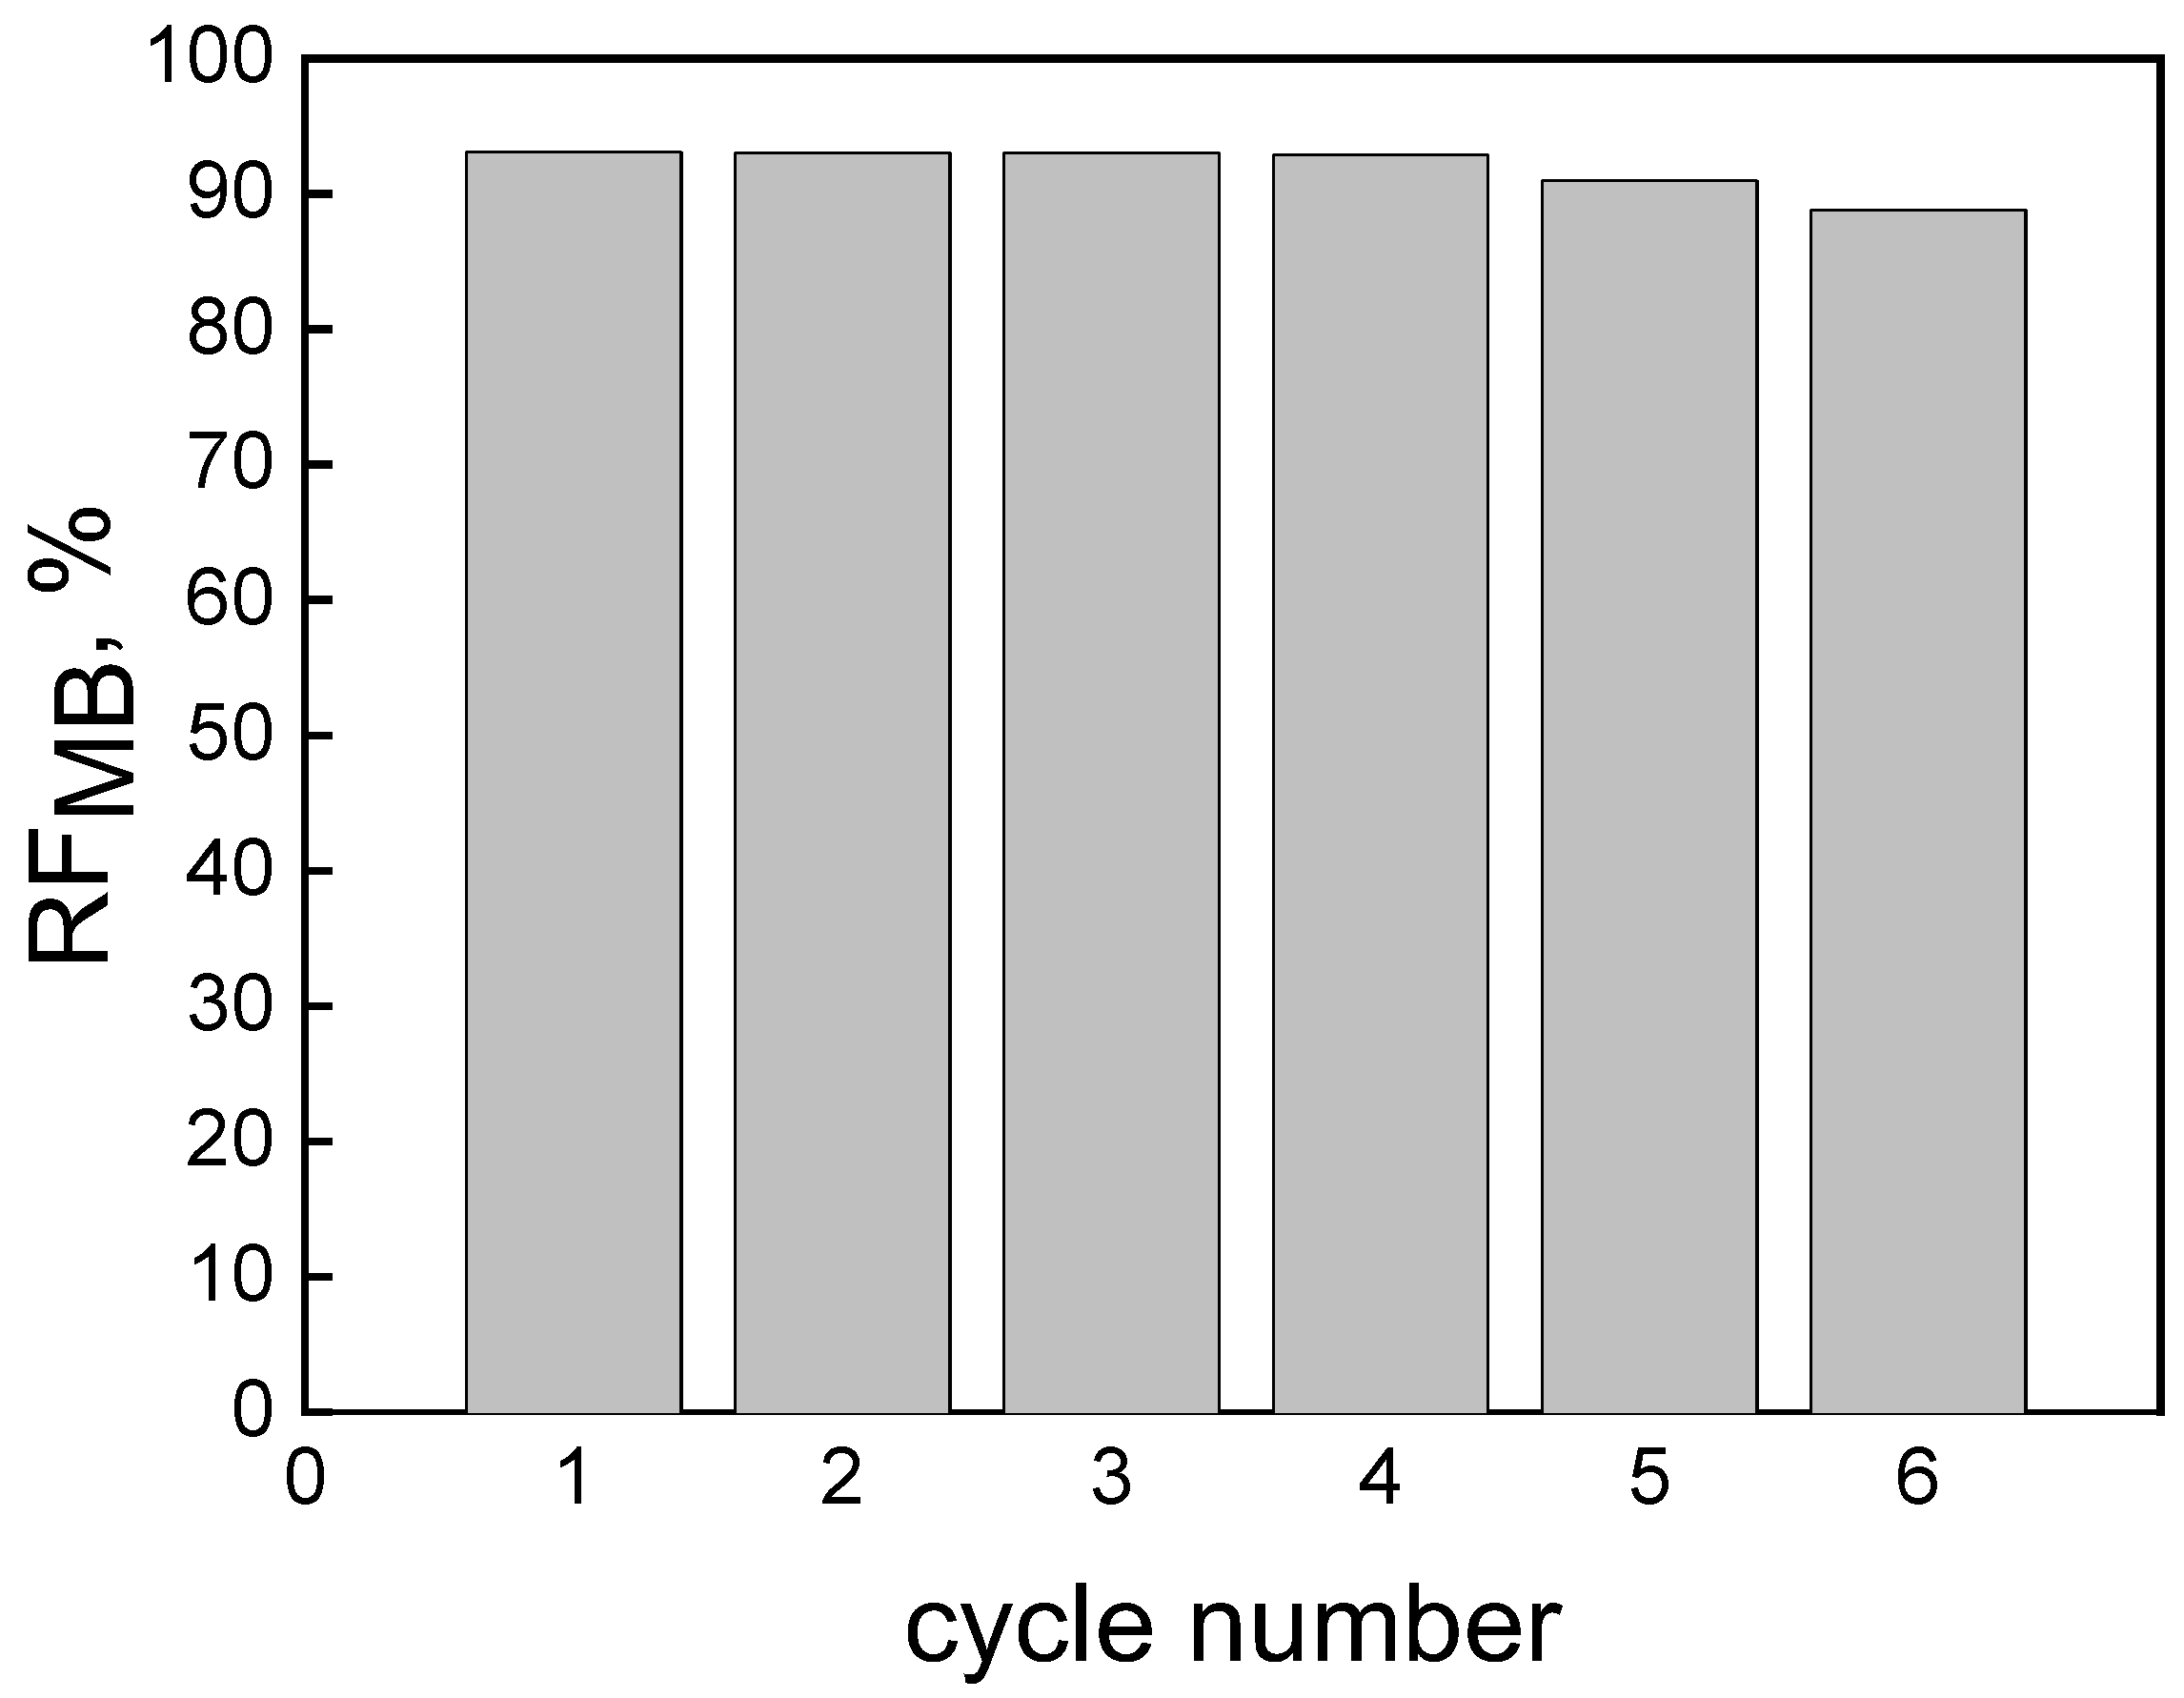
Figure 10.
The infrared spectrum of: A. membrane before, and B. membrane after, transport process.
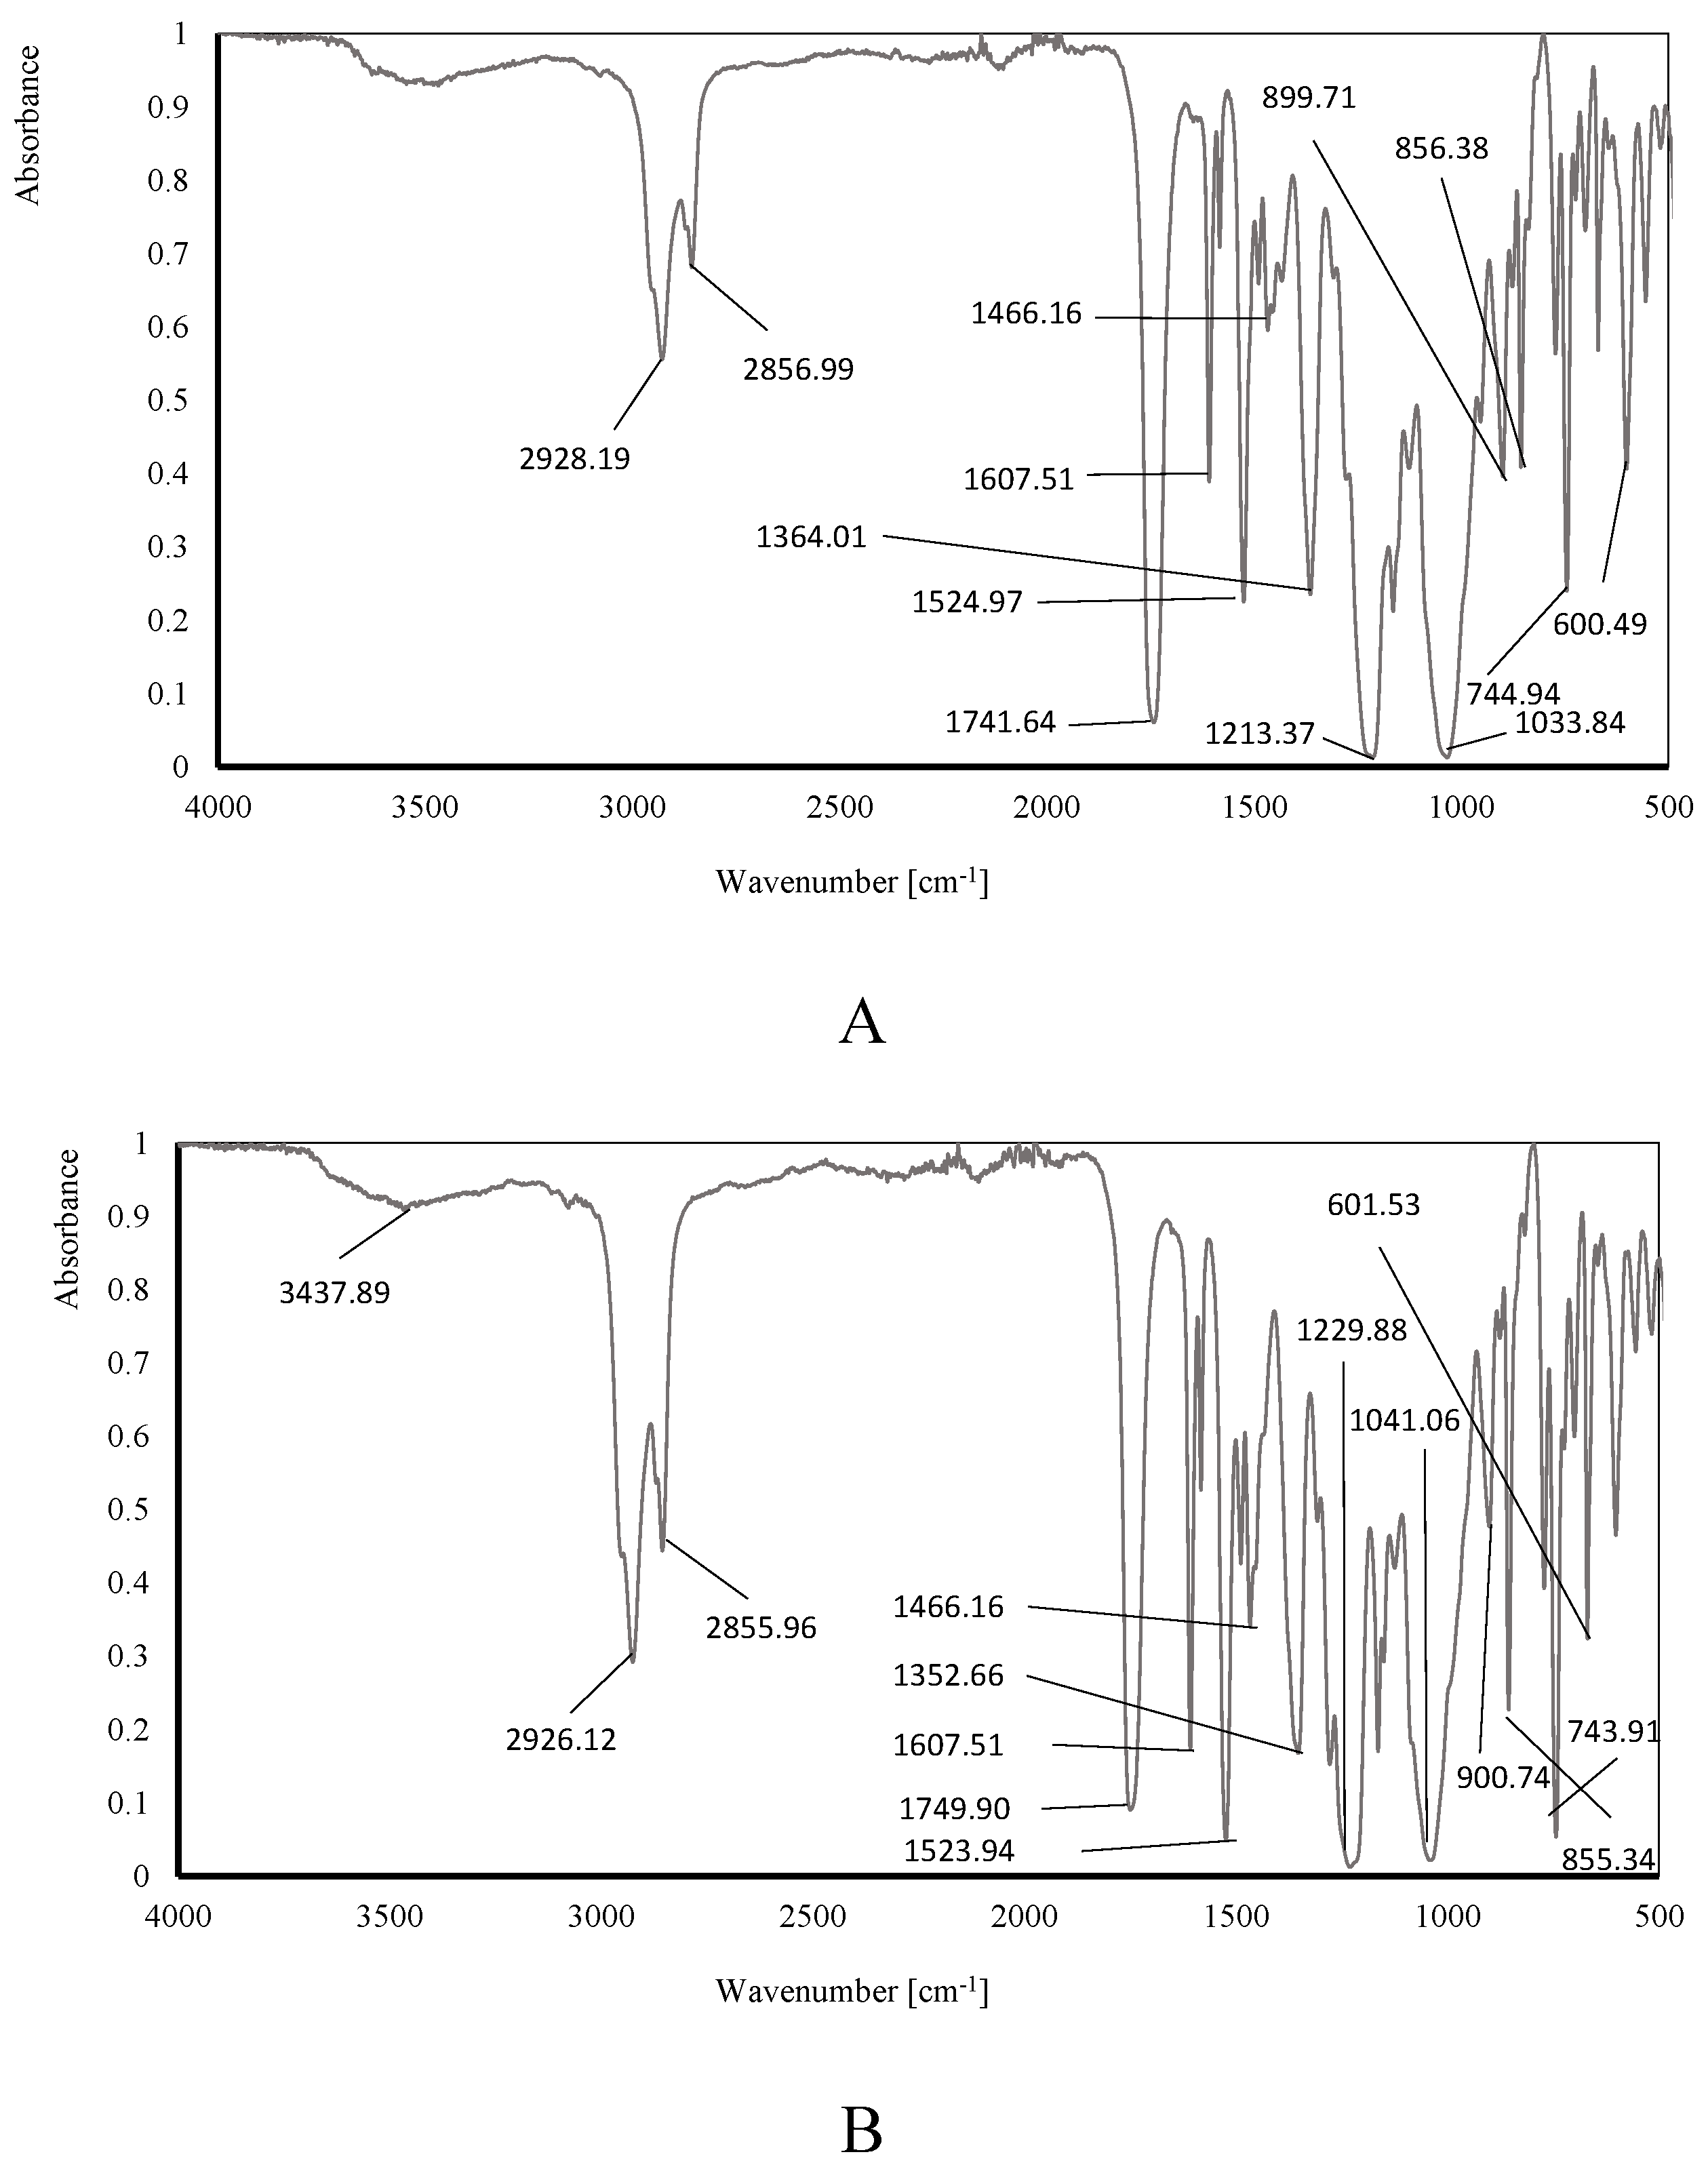

Table 1.
The effect of the source phase pH on the removal of MB.
| pH of source phase | Receiving phase | % Removal of MB |
|---|---|---|
| 3 | 0.1 M HCl | 5.48 |
| 6 | 18.43 | |
| 9 | 74.57 | |
| 10 | 93.10 | |
| 11 | 92.12 | |
| 12 | 91.89 |
Table 2.
The Effect of acid concentration in the receiving phase.
| Concentration of HCl in receiving phase | % Removal of MB |
|---|---|
| 0.1 M | 93.10 |
| 0.2 M | 89.75 |
| 0.3 M | 88.48 |
| 0.5 M | 70.58 |
| 1.0 M | 65.54 |
Table 3.
Interpretation of obtained ATR-FTIR.
| Bond | Membrane before transport process (A) | Membrane after transport process (B) | Typical absorption range [cm-1]* |
|---|---|---|---|
| Wavenumber [cm-1] | |||
| R-X alkyl halides | 600.50 | 601.53 | 500-680 |
| C-H aromatics | 744.94 | 743.91 | 705-745 |
| C-H aromatics | 856.37 | 855.34 | 862 |
| N-H amines groups | 899.71 | 900.74 | 665-910 |
| RCO-OH carboxylic groups RCOOR’ C-O |
1033.84 | 1041.06 | 1000-1320 |
| Ar-O-R ethers groups | 1213.37 | 1229.88 | 1220-1260 |
| C-H alkanes | 1364.01 | 1352.66 | 1360, second 723 |
| RCH2CH3 alkanes CH2. CH3 |
1466.16 | 1466.16 | 1460 |
| N-O nitro groups | 1524.97 | 1523.94 | 1520, second 1350 |
| C=C alkenes | 1607.51 | 1607.51 | 1611 |
| RCOOR’ esters groups | 1741.64 | 1749.90 | 1735 |
| -CH2- alkanes C=C CO-OH carboxylic groups dimer OH |
2856.99 | 2855.96 | 2850 2800-3400 |
| -CH2- alkanes | 2928.19 | 2926.12 | 2925 |
| RCONHR’ | 3437.89 | 3437.89 | 3440 |
*data source: IRPal 2.0 Tabledriven Infrared Application.
Disclaimer/Publisher’s Note: The statements, opinions and data contained in all publications are solely those of the individual author(s) and contributor(s) and not of MDPI and/or the editor(s). MDPI and/or the editor(s) disclaim responsibility for any injury to people or property resulting from any ideas, methods, instructions or products referred to in the content. |
© 2024 by the authors. Licensee MDPI, Basel, Switzerland. This article is an open access article distributed under the terms and conditions of the Creative Commons Attribution (CC BY) license (http://creativecommons.org/licenses/by/4.0/).
Copyright: This open access article is published under a Creative Commons CC BY 4.0 license, which permit the free download, distribution, and reuse, provided that the author and preprint are cited in any reuse.


