Submitted:
15 March 2024
Posted:
18 March 2024
You are already at the latest version
Abstract
Poultry litter was converted to biochar by torrefaction and to hydrochar by hydrothermal carbonisation. Many parameters were measured for the resulting chars, to investigate the effect of production method and production temperature. SEM showed the presence of large quantities of crystalline material on the surface of the biochars. The elemental composition of some crystals was determined as 35% K and 31% Cl. This was confirmed as sylvite (KCl) crystals, which explains the high levels of water extractable potassium in the biochar and may also be important in germination inhibition. Biochars almost totally inhibited germination, whilst hydrochars decreased germination. Although germination occurred on hydrochar, root growth was severely inhibited. Consequently, germination index may be better to determine total phytotoxicity as it measures both effects and could be used as a bioassay for chars used as soil amendments. Washing removed germination inhibition in a low temperature char (3500C), possibly by removing KCl, however root toxicity remained. There were very low levels of heavy metals, suggesting they are not the source of toxicity. In biochars, pore mean size decreased with temperature from 3500C to 6000C, due to changes in pore size distribution. Mean pore size was measured directly using SEM. The merits of this method are discussed. Low temperature biochars seem best suited for fuel as they have high calorific value, high hydrophobicity, low ash content and high yield. Higher temperatures are better for soil amendment and sequestration applications with a smaller mean pore size, higher surface area, and higher pH.
Keywords:
Poultry litter
; torrefaction
; hydrothermal carbonisation
; biochar
; hydrochar
; germination
; sylvite
; morphology
1. Introduction
In the 21st century there are several major environmental challenges that need to be solved; these include reduction of greenhouse gas (GHG) emissions, maintenance of soil fertility and disposal of organic wastes. The discovery of the Terra Preta dark earth soils in Amazonia caused a surge of research interest in the applications of a special form of charcoal – biochar. The Amazonian soils appear to have retained their fertility for thousands of years because of the presence of biochar (Glaser and Birk, 2012). Therefore, converting organic wastes into biochar instead of combusting or landfilling them and then applying the biochar to soil has the potential to solve all three challenges simultaneously. Biochar is thus one of the most important emergent technologies for environmental management. Initial studies focused on biochar obtained from plant material (Lehmann and Joseph, 2009), but there are now a number of studies on biochar from animal manure feedstocks, poultry litter (PL) and sewage sludge (Méndez et al., 2013; Cantrell et al., 2012; Dhungana et al., 2012; de Figueiredo et al., 2019). What is more, recent research studies have proved that the biochar produced from poultry litter releases more water-soluble dissolved P and K concentrations and increases soil plant available P and K concentrations as compared to lignocellulosic-based biochars (Novak et al., 2018).
Biochar has complex physio-chemical and biological properties; it is also extremely heterogeneous due both to differences in the feedstock and variations in manufacturing. Heating organic matter to low temperatures causes a decrease in mass - due to loss of water and volatile organics. The loss of hydrogen and oxygen increases the proportion of carbon. At 250 – 350°C cellulose is depolymerised, converting organic material into a carbon honeycomb structure, where macropores are formed with their size and distribution determined by the cellular structure of the original biomass. There is further mass loss due to volatilization and carbon is converted into aromatic structures. These aromatic structures are not easily broken down, giving biochar resistance to decay (Verheijen et al., 2010).
Above 600°C the main process occurring is carbonisation where most non-carbon atoms are lost. Very high temperatures cause a loss of structural complexity due to melting of cell structure - which is why lower temperatures produce a more effective biochar (Lehmann and Joseph, 2009). As well as this change in structure, the surface of the biochar changes chemically in a very varied manner. During thermal degradation potassium and chloride ions are highly mobile and can produce crystals on the surface of the biochar, as can other inorganics, producing a range of minerals. Silicon and calcium are present in cell walls and are released at higher temperatures, whilst nitrogen can be released at low temperatures. Potassium and phosphorus can start to vaporise above 760°C and, above 800°C, other elements follow (Gaskin et al., 2008). As these are plant nutrients, biochar preparation temperatures must be kept below these values to retain them. In general, the biochar surface can be hydrophilic or hydrophobic, acidic or basic and may be coated with bio-oil containing aromatic compounds. Biochar’s basicity is due to the presence of alkali metals (K, Ca, Na and Mg) present as carbonates and hydroxides (Song and Guo, 2012).
The removal of water and volatiles creates a better fuel by increasing energy density - making fuel transport and storage easier. For example, woody biomass torrefied material contains 90% of the energy in 70% of the mass. The 30% mass loss is caused by the production of gas which only contains 10% of the energy but can still be used as a fuel. Torrefaction gives a less heterogeneous product than the original biomass (van der Stelt et al., 2011). Ash content varies depending on the biomass used - this is important commercially as ash produced needs disposal. Woody feedstock only produces very low amounts of ash (<1%), grasses, due to their high silica content, give higher values (up to 24%), whilst manures can produce up to 45% (Lehmann and Joseph, 2009). Apart from ash production, non-lignocellulose feedstock, such as manure and sewage sludge behave in much the same way as woody feedstock (Dhungana et. al., 2012). One problem with the manufacture of biochar is the possible production of toxic polyaromatic hydrocarbons (PAH) which could be released in the gases from the furnace or remain in the biochar and be passed into the soil.
Disposal of poultry litter is a growing problem in industrialised countries, as it is the disposal of other organic wastes, including human sewage. Broiler chicken numbers are increasing rapidly in the UK so the amount of litter to be disposed of will also increase. Presently, as for example, Northern Ireland produces 260ktpa of poultry litter waste which needs disposal. This may rise to 400ktpa within 5-10 years, assuming a 50% increase in capacity. Previously, poultry litter, which consists of a mixture of poultry manure and bedding material from poultry farms, was used on soil as manure. However, land application of manure without any treatment threatens the environment due to high concentrations of organics, ammonia, and other toxic pollutants (Shalini and Kurian, 2012).
Animal manure biochars are different in many ways to plant waste biochars in having a less regular and more heterogeneous nature. They also contain large quantities of plant nutrients, N, P, K, and may contain heavy metals. N, P, K can be seen as a problem as they can be leached out and cause eutrophication, but they should be viewed as a source of nutrients to replace fertilisers instead. If these nutrients are to be used as a soil amendment, then it is important to know the chemical form of the element in the biochar. For example, K can be present as potassium chloride (KCl), or potassium carbonate (K2CO3), or some other complex form. The form of K present is important as some minerals are far more water soluble than others. Sylvite (KCl in natural mineral form) is very soluble in water but struvite (KMgPO4.6H2O), which may be present, has a far lower solubility so will be less available in soil (Prakongkep et al., 2013). The same is true of heavy metals; they may be present but not bioavailable and thus not harmful to living organisms.
The most used technology to produce biochar from poultry litter is slow pyrolysis, as it maximises the amount of char and minimises the amount of bio-oil produced. Slow pyrolysis typically takes place at temperatures between 350 and 800°C, with residence times from minutes to hours and a heating rate from 0.5 to 60°C min-1. The characteristics of biochars will depend on the type of feedstock (Lu et al., 2015), particle size of the biochar (Liang et al., 2016), temperature (de Figueiredo et al., 2019; Adhikari et. al., 2019), heating rate and residence time (Zhao et al., 2018). Higher pyrolysis temperature will lead to more alkaline biochars (Dai et al., 2017) and to products with a higher surface area and a lower H/C ratio, indicating the formation of more aromatic structures (Gascó et al., 2018). One of the most important characteristics is the biochar’s content on N, P and K, referred as the primary macronutrients, because without them plants could not survive.
Despite of the recent interest in biochars produced from animal origins as soil amendments for improving soil quality and increasing soil carbon sequestration, there is inadequate knowledge on the amounts, speciation, and availability to plants of the nutrients. There is also limited knowledge on how the different pyrolysis regimes and operating conditions affect the soil amendment properties of these materials produced from different feed stocks (Chan et al., 2008).
When waste is converted to biochar, this can then be utilised for three main applications: as fuel, as a soil amendment or as an adsorbent. Use of chars as soil amendments is still controversial. The importance of biochar to reduce GHG and dispose of organic waste hinges on its complementary role in soil improvement. Without this, burying biochar is similar to land fill; consequently, soil improvement is the application considered here. Many experiments show that biochar increases soil fertility and therefore crop yields (Lehmann and Joseph, 2009), but the actual mechanism is still unknown.
Pot trials of biochar showed large increases in lettuce yield, particularly in unfertilised soil (Shackley and Sohi, 2011). The addition of the biochar increased soil pH, Cation Exchange Capacity (CEC) and nutrient supply. Their experiment was on acidic soils and the basic nature of biochar increased pH thus improving fertility. Although these seem positive results, application rates were very high, and yields dropped after three years, contradicting the evidence from Amazonian soils where fertility was retained for thousands of years. The study of lettuce yield did at least show positive effects. Another recent study applied PL biochar produced at 5500C to field grown corn, along with fertiliser. PL char alone gave the highest yield, but when urea was added with PL char the yield was reduced (Van Zwieten et al., 2013).
In germination trials most biochars show no inhibition. Germination testing is an example of a bioassay used to test phytotoxicity. These tests have been used for some years, initially to test new agricultural chemicals and then to assess ecological risks in contaminated soils (Gong et al., 2001). As such, they should now be used to assess chars which are added to soils. A bioassay is a test that determines levels of toxic chemicals by their direct effects on living organisms, in this case by the effect on germination. In germination, seeds take up water by imbibition which bursts the testa (seed coat). This allows more water uptake by osmosis. Enzymes are activated and convert insoluble stored food to soluble components, which move to the growing points of the radicle (root) and plumule (shoot). Respiration of stored food occurs to release energy. Most seeds do not need light for germination, only water, oxygen and a suitable temperature. Germination inhibition is usually caused by factors that interfere with water uptake or direct toxic effects on enzymes at a later stage when enzymes become active.
This paper aims at making a significant contribution to the knowledge of the physical, chemical and biological properties of the poultry litter biochar for agricultural use, including morphology, structure, mineralogy, chemical composition, hydrophobicity and germination, and at identifying the way the method and conditions of manufacture affect these properties. The emphasis is on the characterisation of the different char samples’ morphology, mainly of the macropore structure and size, surface composition, and speciation. To the best of our knowledge this is for the first time when such a detailed morphology characterisation is performed not only on PL char but on any other biochar.
2. Procedure
2.1. Poultry Litter Samples Collection
Poultry litter was supplied from a broiler farm in Northern Ireland. It was split into 20 samples and placed in a freezer. An equal amount was taken from each of ten subsamples and then mixed together to give the working sample. This was homogenised in a food processor and then oven dried at 105°C for at least 12 hours. The moisture content was about 30%.
2.2. Poultry Litter Samples Preparation
2.2.1. Biochar Samples Obtained by Torrefaction
Biochar samples were generated by Carbogen Ltd., through the project funded by the Technology Strategy Board via the Small Business Research Initiative and Invest Northern Ireland. Biochar was produced by torrefaction (mild pyrolysis), in bulk (about 1 kg), under reducing conditions, at specific temperatures. The residence time for all samples was 30 minutes. The samples were labelled TOR followed by torrefaction temperature, e.g., TOR 350. Subsequently, some of these samples were “stripped”, that is boiled with 0.3M nitric acid for 30 minutes. They are labelled TOR 350 stripped. Ashes were also produced from both stripped and non-stripped char samples using the ashing furnace as described below.
2.2.2. Biochar Samples Obtained by Using a Tube Furnace
These samples were produced at Teesside University with a Carbolite Tube Furnace (model CTF 12/75/700) following standard operating practice. All samples used oven dried PL (between 0.4 and 0.5g) which was heated in a crucible at a rate of 300C min-1 to the specified temperature under nitrogen flow at 500ml min-1. Residence time was 30 minutes, but for high temperatures it often took over 12 hours to cool down, thus residence time at high temperature was effectively longer than the stated time. These samples were labelled TF followed by temperature used, e.g., TF 200.
2.2.3. Biochar Samples Obtained by Hydrothermal Carbonisation
Hydrothermal carbonisation biochar samples were produced at Teesside University in a Buchi AG miniclave with a Julabo 4 20 -250 thermal heat system. In all cases 40ml 0.1M citric acid was used with 2g of poultry litter. The set point temperature was noted; however, a sensor gave the actual internal temperature. Pressure was up to 20bar, unless otherwise specified. Residence time was usually 120min. The samples were labelled HTC followed by temperature used, e.g., HTC 80. Samples were also produced in larger quantities by Carbogen in a pressure cooker at temperature of about 1200C and pressure of 2bar. These samples were washed and dried. Subsequently they were used in a second HTC run at Teesside. These samples were labelled HTC-C followed by temperature used; C1 had a residence time of 5min, C2 of 30min, e.g., HTC-C1-210.
2.3. Characterisation of Biochar Samples
2.3.1. Total Digestion Method
A weighed sample of 0.1g was mixed with 20ml concentrated nitric acid (70% analar) in a conical flask with anti-bumping granules. This was boiled on a hot plate under air reflux for 3 hours. Narrow mouth reflux tubes were used. Samples were cooled and diluted to 100ml with distilled water in a volumetric flask. The flask and reflux tube were washed three times into volumetric flask, leaving anti bumping granules in flask. This gives 1/100 dilution which can be diluted further for AAS and ICP-MS. Due to time constraints only one digestion was performed for each char.
2.3.2. pH
1g of sample was weighed and added to a 250ml HDPE (high density polyethylene) bottle. 20ml of distilled water was added and the bottle was shaken at 100rpm for 30 minutes on a Stuart Orbital Shaker. The solutions were filtered using Whatmans no.1 paper and the pH was read using a calibrated Hanna pH meter.
2.3.3. X-ray Diffraction (XRD)
The structure of the biochar samples was assessed by XRD measurements taken with a Siemens diffractometer (D500) at a voltage of 40kV, using Cu Kα radiation. Both low- and wide-angle runs were performed. Low-angle used a 0.018º slit, wide-angle used 0.15º. Wide angle originally used 2θ of 5 – 90º but a later run used 5 – 70º with a step size of 0.02º. Identification of compounds was performed by comparing peak values to the RRUFF database.
2.3.4. Scanning Electron Microscopy (SEM)
A Hitachi 3400N Scanning electron microscope having the capability of energy dispersive X-ray spectroscopy (EDX) was used to assess the morphology and elemental composition of the biochar samples.
The pulverised samples were placed on 14mm aluminium stubs with 12mm double sided carbon tabs. Samples were blown with compressed air to ensure there were no loose particles. The samples were viewed at x50 magnification and an area that was well covered with sample was chosen. Then a transect was performed to give a minimum of three sites for the elemental analysis from which a mean value was calculated. The whole area of the view was used for this analysis. The samples were then viewed at a higher magnification (x250 or x500) to find pore structures. These pores were measured in their largest dimension using the SEM software – at least ten pores per site if available, with a minimum of three sites per sample analysis from which a mean value was calculated. The distribution of pore size was also plotted as a histogram in bands of 10µm as it would be expected that there would be different groups of pore sizes. Any crystalline or other unusual structures were viewed at higher magnification; up to x2000, depending on size. Elemental analysis was performed on the structure using EDX with the point and ID facility.
2.3.5. Flame Photometry (FP)
A Sherwood Flame Photometer 410 was used to determine the potassium levels. After flame ignition, deionised water was aspirated for 10 minutes. Then zero was set using deionised water and 10ppm standard was set at 100 (to give greater accuracy). Blanks and standard were rechecked until steady and then a set of standards was read at 2.5, 5, 7.5 and 10 ppm to plot a calibration curve. These standards were made up by diluting a bought 1000ppm standard with distilled water (for comparison the standards were diluted with deionised water the same as the samples, although the standard is in nitric acid). Then a sample was aspirated, and the reading noted. Samples were prepared by total digestion method and diluted 1:10. Other samples were prepared by water extraction as for pH. In some cases, the reading was too high for the machine to read; in these cases, the sample was diluted.
2.3.6. Atomic Absorption Spectroscopy (AAS)
AAS was performed on a Thermo-scientific iCE 3000 AA with an air acetylene flame, with acetylene at a flow rate of 0.9dm3 min-1. A distilled water blank with a small amount of nitric acid and three standards with varied concentrations for the different metals were used. As the lamp must be changed for each element it is more time consuming than ICP-MS.
2.3.7. Inductively Coupled Plasma – Mass Spectrometry (ICP-MS)
Samples from total digestion were diluted 1:100 by serial dilution. They were stored in HDPE containers in the fridge (important as metals can stick to glass). Samples were measured using an Agilent 7500 series ICP-MS machine with an octapole detector. A blank of nitric acid was used to calibrate the machine then standards of 10 and 100ppb were run for 28 elements (details in results). The samples were then aspirated and read. A two-minute wash of nitric acid was performed between each sample. To check the accuracy of the machine three replicates of each standard were read to give an idea of machine error. A total digestion blank of a standard was also performed to quantify method errors. A comparison was also performed between AAS and ICP-MS by calculating mg g-1 of metals. This was also used to compare the results with other studies.
2.3.8. Germination
The method was based on the International biochar initiative technical paper (International Biochar Initiative, 2010). However, that method suggested mixing with soil which would add more variables. So, germination was performed on biochar only. A few grams of biochar were used to cover the bottom of a petri dish. 50 seeds of cress (Lepidium sativum) were placed on the char (Bargmann et al., 2013). The seeds were not surface sterilised as germination occurs within about 48 hours, so sterilisation was deemed unnecessary. 2ml of water was added over the seeds. The dish was closed, and germinated seeds were counted roughly each day to gain an idea of germination rate. It is not possible to do a perfect count without untangling the seeds which could damage them so, final germination was counted accurately after 7 days. Germination was considered to have occurred when the cotyledon became visible.
Observation showed that root growth was affected in some germination so a sample of 25 roots from each germination were measured after 7 days. This allowed calculation of a germination index (GI) (Tiquia, 2010)
2.3.9. Thermogravimetric Analysis (TGA)
This was performed on pulverised samples using Perkin Elmer STA-1500 (Simultaneous Thermal Analyser) with Infinity Pro thermal analysis software. A small quantity of sample (between 12 – 28mg depending on density) was placed in the crucible. The furnace was run at 25 - 800°C at a heating rate of 10°C min-1 and a residence time of 60 minutes. The heating was performed under argon at 50ml min -1.
2.3.10. Statistics and Calculations
All calculations and graph plots were performed using Excel 2010. The add-on data analysis package was used to perform univariate analysis of variance (ANOVA).
3. Results and Discussion
3.1. Prepared Samples and Characterisation Methods

Table 1.
Prepared samples and the characterisation methods used for each of them. Number of ticks indicates number of replicates.
Table 1.
Prepared samples and the characterisation methods used for each of them. Number of ticks indicates number of replicates.
| Sample | pH | ICP-MS | AAS | TGA | Pore size | EDX | XRD | LOI and Ash | FP | Yield | Germination |
| PL | ✓✓ | ✓ | ✓ | ||||||||
| TOR 350 | ✓✓ | ✓ | ✓ | ✓ | ✓✓✓ | ✓✓✓ | ✓ | ✓✓ | ✓ | ✓ | |
| TOR 400 | ✓✓✓ | ✓ | ✓✓✓ | ✓✓✓ | |||||||
| TOR 450 | ✓✓ | ✓ | ✓ | ✓✓✓ | ✓✓✓ | ✓ | ✓✓✓✓ | ||||
| TOR 500 | ✓ | ✓✓✓ | ✓✓✓ | ✓ | |||||||
| TOR 550 | ✓✓ | ✓ | ✓✓✓ | ✓✓✓ | ✓✓ | ✓ | |||||
| TOR 600 | ✓✓ | ✓ | ✓ | ✓ | ✓✓✓ | ✓✓✓ | ✓ | ✓✓ | ✓ | ✓ | |
| TF 135 | ✓✓✓ | ✓✓✓ | ✓ | ||||||||
| TF 200 | ✓✓ | ✓ | ✓✓✓ | ✓✓✓ | ✓ | ✓ | ✓ | ||||
| TF 275 | ✓✓ | ✓ | ✓ | ✓✓✓ | ✓✓✓ | ✓ | ✓ | ✓ | |||
| TF 350 | ✓ | ✓ | ✓ | ✓✓✓ | ✓✓✓ | ✓ | ✓ | ||||
| TF 400 | ✓ | ||||||||||
| TF 450 | ✓ | ✓ | |||||||||
| TF 500 | ✓ | ✓ | |||||||||
| HTC 80 | ✓ | ✓ | ✓✓✓ | ✓ | ✓ | ||||||
| HTC 95 | ✓ | ✓ | ✓✓✓ | ✓ | ✓ | ||||||
| HTC 120 | ✓ | ✓ | ✓✓✓ | ✓ | ✓ | ✓ | ✓ | ✓ | |||
| HTC-C1-210 | ✓ | ✓ | ✓ | ||||||||
| HTC 250 | ✓ | ✓ | ✓ | ✓ |
3.2. Effect of Production Method and Temperature on PL Biochars’ pH
Figure 1 above shows the influence of temperature on biochar’s pH in the case of tube furnace and torrefied samples, merged together to give changes over a greater temperature range, as compared with the poultry litter’s pH. Poultry litter is neutral, but as temperature increases, so does pH, levelling out at about 10.7 from 400°C onwards, demonstrating that the most of acidic groups were lost during the pyrolysis process and as all the volatile matters were leached from the pyrolytic structure, the pH became constant. Other studies have found similar pH values of 9.5 at 300°C to 11.5 at 600°C (Song and Guo, 2012). Gaskin et al. (2008) reported that biochars generated from PL, peanut hulls, and pine chips through 400°C pyrolysis had pH 10.1, 10.5, and 7.6, respectively. Higher pH at the higher pyrolysis temperatures is expected because of the increased relative concentration of non-pyrolyzed inorganic elements in the feedstocks and the formation of hydroxides and basic surface oxides (Cao and Harris, 2010). It is reported that inorganic carbonates were the major alkaline components of the biochar generated at high temperature, and that organic anions contributed to the alkalinity of biochar generated at low temperature (Uchimiya et al., 2011).
There is a consensus in literature that pH increases with pyrolysis temperature, but the magnitude of this increment depends on the raw material characteristics (Cely et al., 2015).
Hydrothermal carbonisation produces also a liquor (process water) along with the solid biochar samples. Therefore, the pH of the HTC samples was measured for both, as a function of temperature and residence time. Although the HTC was run at increasing temperatures, from 80°C to 237°C, there was insufficient solid formed at temperatures higher than 120°C to do the pH tests. Therefore, there are only results for two temperatures, i.e., 80°C and 120°C, respectively. For each temperature, the residence time to run the HTC varied from 5 – 120 minutes. The pH of the solid samples was 3.8 at 80°C and 5.6 at 120°C, respectively.
Figure 2 shows the pH variation of the liquor as a function of the residence time for the HTC temperature of 120°C. The primary determinants of the pH of the HTC liquor are the raw material, PL in this case, and the liquid added, which was citric acid. Therefore, as expected, the pH was acidic, varying slightly with the residence time. This is another expected result, as the pH of the liquor was measured when the system was cooled down, therefore, the actual residence time was much longer than the HTC’s running time.
Figure 3 shows the pH of the process’ water as a function of temperature. For all temperatures, the pH of the liquor was acidic, with values from 2.97, at lower temperatures, to 4.57 at higher temperatures. Poultry litter’s pH in the HTC medium (citric acid) at 20°C was 2.44.
Acidic pH was observed for the process water samples even when the HTC was performed in pure water. The pH of the spent liquor from hydrothermal carbonization of PL, at the PL to water ratio of 1:5, 225°C and 15 min residence time, was 5.5 and unchanged by recirculation (Catalkopru et al., 2017). This finding supports the approach of using the spent liquor as a HTC medium for fresh HTC treatments, although, at one point in time, the process water should be disposed of, which will be a challenge due to the acidic nature.
However, the initial pH of the HTC medium is important as it impacts on the yields and properties of the hydrochar (HC). It has been found that undertaking HTC in the presence of acids (CH3COOH, H2SO4) significantly affects the yields and properties of HC. The C content and HHV of the HC increased with decreasing initial pH. In the presence of H2SO4, the hydrochar yield increased while the ash content was significantly reduced. The lowest ash content and the highest hydrochar yield were measured in the HC produced from the suspension with an initial pH of 2 using H2SO4.
The acidic pH is due to the formation of organic acids that dissolve in the process water.
As it is well-known, HTC is an exothermic process that lowers both the oxygen and hydrogen content of the feed (described by the molecular O/C and H/C ratio) by five main reaction mechanisms which include hydrolysis, dehydration, decarboxylation, polymerization and aromatization (Funke and Ziegler, 2010; Hoekman et al., 2011).
Although the catalytic effect of the acidic pH on hydrolysis and dehydration of biomass is acknowledged, the effects of acidic conditions on other reaction mechanisms, such as decarboxylation and condensation polymerization, is largely unknown. It has been reported, however, that weakly acidic conditions improve the overall rate of reaction of hydrothermal carbonization (Titirici et al., 2007).
It is important that the pH of different biochars to be accurately determined because changes of pH have great impacts on many soil processes, such as nitrogen mineralization, mineral precipitation, ion exchange, and greenhouse gas emissions (Zhang et al., 2018).
3.3. Effect of Production Method and Temperature on Samples’ Morphology, Composition, and Structure
SEM-EDX measurements were performed over most of the samples (Table 2). The SEM micrographs showed the presence of different structures, some crystalline ones, coating the biochar particles or grown on the surface of a complex 3D lattice, some amorphous ones, while the morphology of the char samples was mainly a macroporous one. The composition of the different surface structures was determined, and the identification of their type and provenience was done based on the EDX results alone or by comparing them with those obtained on barley, feathers, or wheat straws. An attempt was made to determine the pores size and their distribution.
- Amorphous structures:
As shown in Figure 4, two more obvious structures are present in the mixture of the HTC chars, one white and round and the other one which looks like a grass epidermis, showing stomata and phytoliths. The elemental analysis proved that the round structures are siliceous and about 10-20 µm in size. These siliceous structures were found in many of the chars and appear to be loosely attached to the surface (see Figure 5.).
In order to identify the provenience of these siliceous structures, EDX measurements were performed on them and on the background material, and the results were compared with those obtained on siliceous structures in wheat and barley. The stems did not show the siliceous structures, but the leaves did, showing that these structures are not caused by torrefaction. Elemental composition in wheat and barley is just C, O, and Si. However, these non-torrefied structures contain more oxygen which would be expected as combustion reduces oxygen content. The other elements on the char samples may be material deposited on the surface during torrefaction (Figure 6, Figures S1 and S2).
Figure 6 shows the results obtained on the TOR 600 sample, while Figures S1 and S2 present the SEM-EDX results obtained on the oven dried wheat straw and barley leaves, respectively.
As shown in Figure S1, the wheat sample presents siliceous structures and stomata. Barley (see Figure S2) has similar structures, although the elemental composition is more varied containing K, Cl and Na. Stomata are also visible.
The size of the siliceous structures was measured for torrefied samples as well and compared with the size of the siliceous structures in PL, wheat, and barley. The average size decreases as temperature increases, i.e., for TOR 400 is 20.4µm, while for TOR 500 the value is 15µm. The size of the siliceous structures in PL is, in average, 15.6 µm, for wheat is 17.6µm, while for barley is 13.6µm, respectively. The size comparison and appearance suggest that the siliceous structures are probably wheat. However, the sample is too small to be certain – it is possible that both are present.
What is more, SEM images of PL (Figure 7) reveal the presence of other siliceous structures which do not look like those found in either oven dried wheat straw or barley leaves.
For PL, the structures seem to be in hollows. Also visible are what appear as wiggly lines between cells. These are probably phytoliths and can be seen in greater detail on the barley leaf (Figure S3). They are about 124 µm in length and are composed mainly of silicon. Phytoliths are used in archaeology to identify species as they are resistant to decay, so could be used to identify the plant material a char is derived from (Jenkins, 2009). Phytoliths are primarily silica and can be a problem if feedstock is used as a fuel (Cennatek, 2011).
These phytolith structures remained and were visible in ash samples – not surprising as they are separated from plant material by ashing (Jenkins, 2009) (see Figure 8).
There were other amorphous structures found in torrefied material that looked like feathers (see Figure S4) and had a similar chemical composition. To test their provenience, feathers and torrefied feathers were analysed.
As can be seen, the actual feather structure is a main rib with side branches emerging, similar to the structure shown in TF135. These branches appear to be strap-like and narrow as they get further from the main rib. Torrefaction causes feathers to lose most of its fine structure. The size is also similar. Elemental analysis also suggests that this is a feather (results not shown). The C and O percentages are similar for the actual feathers and the structures in TF135. Feathers are made of the protein keratin, which has high levels of S, as seen in the elemental analysis. The TF135 feather has a low S value, but this could be a result of natural variation. Another problem is the difference between the feather heated to 450°C and that heated to 105°C (oven dried). Heating seems to cause a loss of Na and Ca; however, the difference may be because feather was not of the same type, it was taken from a local bird rather than from the PL.
As for the hydrothermal carbonisation samples, some more and different amorphous structures were shown (see Figure 9). Many fine white structures, 700nm – 2µm long, are visible. These could be cellulose fibrils as literature suggests that HTC treatment breaks down hemicellulose, which causes individual cellulose fibres to separate. Debris from the cell wall is then deposited on the surface of the hydrochars (Kristensen et al., 2008). However, microfibrils are 28nm in diameter so these fibres are too large – they may be aggregations of microfibrils.
Structures like roots were also observed. Diameter of these structures is about 20µm for larger ones, going down to 2µm for finer branches. These are about the correct size and similar structure to roots.
- Crystalline structures:
Many structures appear crystalline with very regular shapes and distinct angles. These structures, which are found on the surface, seem primarily inorganic and may, therefore, be very important when PL is used as a soil amendment.
The crystalline structures found on the TOR 350, TOR 450 and TOR 550 sample, respectively, along with those found on the TF 350 and TF 275 samples were studied in detail. Results are as follows.
Figure 10 presents the SEM images of the crystalline structures observed on the complex 3D network of the TOR 350 char sample along with their composition. These crystals are about 2µm on one face and appear cuboid. The elemental analysis shows high amounts of K and Cl, so these crystals could be potassium chloride.
In order to support this statement, pure KCl crystals were characterised by SEM/EDX (Figure S5). The K:Cl ratio is 1.1 for the pure KCl crystal, very close (+/- 1%) to the published value (Royal Society of Chemistry, 2019), while for the TOR 350 char sample, this ratio is 1.4. Therefore, even all the Cl is in the form of KCl, that still leaves some K and, with high amounts of carbon and oxygen present, also suggests a possible presence of potassium carbonate, K2CO3, which is deliquescent. KCl crystals are also hydroscopic.
Crystalline structures are found in other samples as well, in some cases in very large quantities as for the TOR 450 char sample. There are two types of crystalline structures observed, some bright white ones and some grey ones, with very similar composition, but with far lower Cl and higher Ca percentage, respectively, for the grey ones. The K:Cl ratio for the bright white ones is 1.5, which supports the assumption that they are most probably KCl crystals. These crystals are about 2µm on one face and appear cuboid (see Figure 11).
The SEM/EDX results on the TOR 550 sample are presented in Figure 12. The crystalline structure measured has a high percentage of P, K and Mg, confirmed as pyrocoproite (K2MgO7P2) ((Prakongkep et al., 2013)) via XRD. Also, although it has a very high concentration of K but only little Cl it means that K is present in forms other than KCl.
Wide-angle XRD measurements were performed in order to identify the nature of all crystals present on the torrefied samples.
Figure 13 shows the diffractograms for the three torrefaction samples, namely TOR 350, TOR 450 and TOR 550, respectively.
The samples are broadly similar except TOR 450 has a high intensity peak at 2θ of 21º. It is difficult to explain why this peak is only present in TOR 450, although this sample was analysed at a later date and used the modified method with adhesive tape. However, there are several other peaks which are at the same positions for all chars - these are considered more reliable and will be analysed below.
TOR 350 and TOR 550 (low and high production temperature) show a similar general shape and peaks, although the intensity of the peaks seems higher for the higher temperature. Generally, higher intensity and a narrower peak indicate a larger crystal size. The crystal size can be calculated using the Scherrer equation. For TOR 450 the peak at about 2θ = 21º could be an amorphous silica peak, as seen in rice husk char at 2θ = 22.5º. TOR 350 shows a more obvious broad peak at 22.5º, suggesting more silica at lower temperatures. Amorphous carbon also shows a peak in this area (Prakongkep et al., 2013, Treacy and Higgins, 2007).
Table 3 presents the peak’s identification for the three torrefaction samples. The conclusion from the XRD measurements is that sylvite is present in all samples; calcite and quartz are also present. There are some diffraction peaks in TOR 550 which are difficult to identify. The complex mixture of minerals that might be present causes problems with identification. In rice husk char for example, as well as sylvite and calcite, a number of complex potassium minerals were present: archerite (KH2PO4), chlorocalcite (KCaCl3), kalicinite (KHCO3), pyrocoproite (K2MgO7P2), struvite (KMgPO4.6H2O) (Prakongkep et al., 2013). All of these are possibly present given the elemental composition found by EDX but may be present in only small quantities and be undetectable.
Another XRD study of chicken manure identified calcite, hydroxyapatite, struvite, dolomite, quartz and magnesium phosphate (Joseph et al., 2008). This study found calcite and quartz - again the others may be present in low quantities in the studied PL, but the fact that sylvite is not present is surprising. This implies that the sylvite possibly originates from the plant material, which is not present in manure. This is supported by another study which found sylvite in a 300°C biochar from straw (Brassica campestris). In this case the higher temperature biochars had no sylvite but did show calcite and dolomite (Yuan et al., 2011).
The size of the sylvite crystallites was determined by using Scherrer equation. For 2θ around 28º, the size of the sylvite crystal was 28.5 at 350°C, 21.4 at 450°C, and 21.4 at 550°C, respectively. As for 2θ around 40, the size of the sylvite crystal was 24.6 at 350°C, 22.1 at 450°C, and 22.1 at 550°C, respectively. There is no obvious trend for crystal size with temperature, with all values being similar for a given peak.
One problem with XRD is that it is best suited to analysis of homogenous material rather than these heterogeneous chars. It has a detection limit of 2% for components in mixtures, so substances present in low concentrations may not be detected (Dutrow and Clark, 2013).
A variety of crystalline structures were observed as well on the surface of the biochar samples prepared in the tube furnace. Figure 14 presents the SEM micrograph along with EDX composition for the TF 275 sample, while Figure 15 shows SEM/EDX results on the TF 350 biochar sample.
The large crystal observed on the TF 275 sample is probably calcium carbonate (calcite), whilst the flat crystal is possibly some type of phosphate. The round crystal could be potassium carbonate (K2CO3) or possibly pyrocoproite (K2MgP2O7) which was found to be present in the XRD results (not shown).
The crystalline structure shown on the TF 350 sample is most probably aluminosilicate.
To the best of our knowledge this is the first time that the crystalline structures on the surface of the poultry litter biochar were identified, and their composition determined.
Some of the feedstock nutrients, namely P, K, Ca and Mg, were concentrated on the surface and their content increases with increasing the pyrolysis temperature. It is important to know the type and composition of the crystalline structures on the surface of the biochars as these crystals are the first to be released into the soil, to cycle nutrients back into agricultural fields. As a measure of the direct nutrient value of biochars, it is not the total content but, rather, the availability of the nutrient that is an important consideration.
Hydrochar samples showed no crystals on the surface as they, presumably, dissolved in the process water.
- Macroporosity and elemental composition (surface, subsurface and bulk) of biochar samples:
SEM/EDX technique was also employed to visualise the porous structure and to determine the pore size and the elemental composition of the biochar samples, and to assess their changes with the biochar production conditions. As seen in Figure 16 and Figures S6–S10), distinct morphologies of increasing porous structure are present.
The represented microscopic honeycomb like structures, typical of fibrous plant materials, are present in the PL biochar from the wood shavings used as bedding material. These microstructures evolve in shape and complexity as the torrefaction temperature is increased. The TOR 600 sample, for example, shows a very regular pore structure, but still has a wide range of pore size, from 4.2µm to 12.3µm (Figure 10 A).
Along with the external macroporosity between the biochar’s particles and the residual macroporosity based on plant cellular structure shown in SEM images, a pyrogenic nanoporosity develops within the solid biochar volume and increases with production temperature but constitutes only a small portion of total porosity, even in higher production temperature biochars (Gray et al., 2014). What is more, the pyrogenic nano-pores are formed because of chemical changes at higher pyrolysis temperature, higher than 600°C, which was the maximum torrefaction temperature used to prepare the samples in this study.
Due to this reason, our study focused mainly on the macroporosity of the biochar samples, which is a key parameter influencing their water uptake.
Using the SEM software, the pore size was directly measured. Figure 17 presents the variation of the mean pore size with temperature.
Mean pore size decreases with torrefaction temperature as expected but TOR 500 seems anomalous. In fact, there are many problems with this method of measuring pore size. It is often difficult to decide where the maximum diameter is, as this involves subjective judgement. Also, some pores are seen in oblique view so that the measurement is larger. Most studies which find a decrease in pore size with temperature are considering single feedstock (Gray et al., 2014). One of the main features of poultry litter is its heterogeneous nature. Pore size is linked to the cell size of the feedstock - here there are many different plant species present, including grasses and wood shavings as well as inorganic material. The SEM images and EDX composition of such an inorganic structure on TOR 350 are presented in Figure 18. Its elemental analysis shows very little carbon suggesting its inorganic nature. It looks mineral and contains both calcium and potassium at high levels with magnesium and sodium also present.
The heterogeneity of the PL means that not all SEM measurements are from the same material, thus the observed variation of morphology. However, there are some advantages of the SEM direct measurement of the pore size method. The pores are seen, so the wide variation in size, in even a single site, can be seen and measured.
In a heterogeneous feedstock like PL it potentially allows the contributions of different materials to pore size to be identified. It is also possible to see how the pores are formed from cell walls. Perhaps a more representative measurement of pore size would use only one type of pore, such as what will be called a “true honeycomb”, as seen for TOR 600 (Figure S10B). The outer layer of plant material has been lost, exposing the cellular structure. The SEM pore size distribution measurement results are presented in Figure 19.
TOR 350 has the widest range of pore’s sizes and the most frequent size is between 10 - 19.9µm. TOR 600 has a small range, and the most frequent size is 0 - 9.9µm. TOR 500 seems anomalous with a peak frequency at 20 - 29µm.
As for the TF biochar samples, SEM measurements showed that the mean pore size is increasing with temperature (see Figure 20), which was an expected result as well. Since the poultry litter feedstock was a mixture of wood, barley, wheat straws, feathers, chicken excreta, and spilled feed etc., the microscopy images of TF samples show, as for the TOR samples, the presence of different types of biochar particles of varying size and morphology, which led to external pores, i.e., those pores between the biochar particles, of different sizes. The residual macroporosity is formed by the evolution of volatiles from the solid during thermal degradation of the poultry litter. Knowing that the corresponding temperatures for maximum decomposition of hemicellulose and cellulose are 300°C and 355°C, respectively, while lignin decomposition begins at about 280°C with a maximum rate occurring between 350 and 450°C and the completion of the reaction at 450 and 500°C, the increase in the pore size with temperature for the TF sample is most probably due to the volatilisation of hemicellulose and cellulose within the temperature range used in the tube furnace.
As the temperature of the conversion of poultry litter to biochar increases to produce the TOR samples, the pore size decreases since almost all the volatile compounds were lost at temperatures around 350°C.
There is a slight difference between the mean pore size for TF 350 and TOR 350, 25µm compared to 14µm. It might be due to the different amount of poultry litter used to obtain the two samples: two grams were used for the TF samples production, while for the TOR samples, 1kg of poultry litter was used, with the heat transfer for carbonisation being faster for surface samples (TF) than that for the bulk samples (TOR).
Figures S11–S14 show the SEM images and pore size measurements of the TF samples. There is still a wide range of pore sizes in each temperature as in TOR samples. For TF 135, the residual macropores are not very wide, some of them not completely open, so the surface area and volume, respectively, of the pores is low (Figure S11). As the conversion temperature is increased at 200°C, pores with different sizes and appearance (far more open), similar to those observed for the TOR samples, are detected along with pores more likely as those on the TF 135 sample (Figure S12).
At higher temperatures, i.e., 275 and 350°C, respectively, pores are now similar to those found in TOR samples.
Figure 21 shows the frequency distribution of the pore size with temperature for the tube furnace biochar samples. There is a smaller range of pore sizes at lower temperatures, with most pores in the smaller size range for TF 135 and TF 200.
SEM images were taken for the HTC samples as well. Figures S15-S18 show the morphology and size pores measurements of the carbonised samples. As seen in Figure S15, for the HTC 80 sample, despite quite low temperature, there is a large amount of honeycomb morphology with many pores in the process of formation.
True honeycomb morphology, but with no cavity in the centre, was observed for the HTC 95 sample (see Figure S16).
For the HTC 120 sample (Figure S17), the honeycomb has a different structure to previous samples; these are arguably not true pores, or they are pores in the process of forming. The pores may be formed from a different plant material. It is also possible that the differences in pore morphology in HTC samples are due to the different decomposition of polymers in HTC, where hydrolysis is the most important mechanism (Libra et al., 2011). The difference could also be due to pressure although this is a low-pressure sample (2bar).
If they are pores in the process of formation, a higher carbonisation temperature should be beneficial. Therefore, an extra HTC biochar sample was prepared at 221°C, HTC 221. Figure S18 shows the SEM micrograph and pore size measurements for this sample. The microscopic pore morphology seems to be improved but there still are closed cavities. Similar observations were made over PL hydrochars obtained at temperatures of 150 and 175ºC, respectively; SEM micrographs showed incomplete decomposition and a corrugated surface with holes (Ghanim et al., 2016).
As expected, the mean pore size of the HTC samples (slightly) increases with temperature, from 10µm at 80°C to 15µm at 221°C.
Figure 22 presents the frequency distribution for the HTC samples’ pore size against temperature showing a lower range than for the torrefied material with very few pores 20µm or above. However, HTC 221 has the highest number of large pores. HTC 80 and HTC 95 are quite similar, but HTC 120 appears different. This could simply be sample variation; however, HTC 120 was prepared at a lower pressure of about 2bar, as opposed to up to 20bar for other points. This might suggest that pressure is an important factor in pore size.
The elemental composition of the poultry litter biochars is another key parameter in their application as soil amendments. As mentioned above, PL biochars are heterogeneous materials, with complex structure and morphology. Therefore, a heterogeneous composition is expected as well. First, SEM/EDX measurements were used to assess the elemental composition at surface and subsurface level (about 1micron depth) of the different biochar’s samples prepared in this study. Figure S12 shows the SEM images and EDX results of the TF 200 sample, as an example for the heterogeneous nature of the PL biochar’s samples.
The elemental composition of the torrefied samples was measured twice in a six- month time interval. EDX results show significant difference in composition from the fresh biochars to the aged ones (Table 4 and Table 5).
This difference is less obvious for low temperature chars. Thus, results for TOR 350 are quite similar. However, at higher temperatures there are big differences. In TOR 600 carbon has dropped from 70% to 47% whilst oxygen has gone up from 22% to 28%. The most likely explanation is that the stored chars have taken up water, so oxygen increases. This alters all the percentages, but is most obvious for the largest element, carbon. This explanation is supported by the hydrophobicity experiments which showed that the low temperature biochars take up little water compared to the high temperature ones.
The mean EDX composition of the TF samples is given in Table 6.
As for the HTC biochar samples, the EDX measurements, shown in Table 7, reveal that carbon decreases slightly and oxygen increases slightly above 80°C, but there is little change after this temperature. All other elements are present at lower levels and seem to increase slightly with temperature from 80°C but after this stay relatively constant. This is because the chars lose water and hence weight so the solid material is present at a lower level thus elements appear to increase. All minor elements are below 1% apart from Ca and so cannot be considered reliable. The tolerance of the system according to Oxford instruments is 0.1% but below 1% the peaks should be checked manually, which was not done. The higher levels of Ca may mean that Ca present on the surface is not water soluble. K shows an increase, but it is not significant and is very small compared to torrefied chars. This is presumably because the K is present as a soluble salt and dissolves into the surrounding HTC liquor.
The bulk composition of the biochar samples prepared in this study was measured by atomic absorption spectroscopy (AAS) and inductively coupled plasma mass spectrometry (ICP-MS), with the purpose to assess the presence of potentially toxic elements (heavy metals) such as Cu, Pb and As. Both methods were considered as the concentration of the heavy metals in the biochar samples determined by AAS was very low and, as such, ICP-MS was then used, as its sensitivity is better. What is more, using the two techniques allows an accuracy check to see if the two give similar values as the same total digestion was used for both. Comparative results for two TOR samples, TOR 350 and TOR 600, respectively, are shown in Table 9.
Table 8.
AAS and ICP-MS results for TOR 350 and TOR 600 biochar samples.
| Element | TOR 350 | TOR 600 | ||
| AAS (ppm) | ICP-MS (ppm) | AAS (ppm) | ICP-MS (ppm) | |
| Fe | 1.11 | ND | 3.41 | 0.17 |
| Ni | 0.14 | ND | 0.05 | 0.00 |
| Cu | 0.40 | 0.16 | 0.48 | 0.09 |
| Pb | ND | ND | 0.00 | 0.00 |
| Cd | ND | ND | 0.00 | 0.00 |
| Zn | 1.09 | 0.79 | 1.22 | 0.31 |
| Cr | ND | ND | 0.00 | 0.00 |
The values are the same order of magnitude, but not identical. Iron is probably more accurate using AAS, but the other values in AAS are below the lowest standards. The calibration curves are not necessarily linear between the lowest standard and zero, so machine readings are estimates and may not be reliable. However, calibration curves were produced for lower standards and do show a linear relationship between zero and the lowest AAS standard for most metals. With such low values and only one reading it is impossible to determine if temperature has any effect on the concentration of these heavy metals. Another study found that Cd was below detection as it was found in this study and the trend was the same with Zn present at the highest level, followed by Cu - other values were higher possibly because a different digestion method was used. This study also showed a concentration effect in the char with double the values in the char compared to the PL (Farrell et al., 2013).
Taking into consideration the above findings, ICP-MS was used to characterise all other samples (see Table 9 for the results).
Concentration levels in the low temperature chars are not much different to those in PL. However, at higher temperatures, levels of magnesium, manganese and aluminium increase. This is presumably a simple concentration effect. Standards were taken through the whole method to give an indication of both method and machine error. Errors are due to dilutions, variable loss of water during reflux, and metals taken up from anti-bumping granules, nitric acid and glassware. This gave a total error of about -1% for Cu, -7% for Zn and Ni, -10% for Cd and -35% for Fe. Levels of most metals are low and are very close to detection limits so values may not be accurate. As expected, there is good agreement between the 350°C results for the TF and those for TOR. The highest values were for Ca, Mg, Na and K, but these are all very susceptible to environmental contamination and the blank is high for all four. However, K shows a very different trend. The other three elements increase and then level off, presumably this is an artefact caused by the fact that the char weighs less so the percentage for a given weight is higher. K drops sharply, which may be important and therefore will be checked using a flame photometer; Zn, Al, Mn and Cu, though present at lower concentrations, show the same trend as K.
As KCl crystals have been found on the surface of the char it is important to know K levels, therefore the flame photometer was used on both water-extracted and total digestion samples.
The results are presented in Figure 23. As can be seen, over 60% of the total K in the TOR samples is water extractable (WE). This is important in terms of plant nutrients as water extractable K is available to plants, but it may also be leached before it can be used. Soluble K may also affect germination as it is mainly on the biochar surface. This was tested using a KCl solution in the germination test. Other studies have found lower levels of water extractable K of about 46% at 300°C going up to 49% at 600°C (Song and Guo, 2012). A similar trend was observed, with WE % staying fairly constant until 550°C when it increases, whilst in this study the increase was observed above 550°C. TF and TOR biochars show an increase in both water extractable and total K with increased production temperature. The TF 350 value is slightly higher than the TOR 350 value.
The HTC material has little K presumably because soluble K has been extracted into the HTC liquor. Flame photometry measurements showed a maximum of 1% K (TD) for the HTC 120, while for the PL, the value was 2.3% or 22.9mg g-1. This value is lower than the published data of 41.8mg g-1 for raw PL (Song and Guo, 2012). Another study measured between 5.65% and 7.59% total K in PL; again, the value measured in this study is lower (Agblevor et al., 2010), as the source of PL is different.
3.4. Effect of production method and temperature on samples’ thermal stability
As it is well-known, the conversion of poultry litter, a nutrient-rich organic residue, into biochars is an alternative to stabilize its carbon through conversion to aromatic and recalcitrant forms, because the ability of biochar to retain carbon in relatively stable forms is considered as one of its most important properties, either for carbon sequestration or soil conditioner use. However, despite the widespread expectation of high biochar stability in the environment, a considerable portion of its carbon content is labile, and it can be decomposed under its usage conditions (da Silva Carneiro et al., 2018). The evaluation of the biochars’ carbon stability was done by TGA analysis under inert (Ar) environment at 800°C.
Figure 24 shows the TGA curves for PL and three of the TOR samples, i.e., 350, 450 and 600, respectively. There is a slight loss of weight at a consistent rate for all chars up to 150°C due to water loss. Although the chars and PL have previously been heated, so should be dry, they have been stored for 6 months so will have taken up water. It is noticeable that TOR 600 loses the most weight of the chars in this initial phase, presumably because higher temperature chars have a larger surface area and are less hydrophobic so take up more water whilst stored. The second weight loss of volatile substances (organic carbon) occurs at different temperatures for the different samples. It starts at about 280°C for PL, 370°C for TOR 350, 430°C for TOR 450 – all fitting well with the fact that these chars have already lost volatiles up to their torrefaction temperature. There is no steep drop for TOR 600, just a smooth curve, showing it has already lost most volatiles. TOR 350 loses the most weight of the TORS as would be expected as it has not lost as many volatiles due to torrefaction. The last section is the further weight loss during the 60 minutes residence time. The final weight value would be expected to be residual ash.
As for the first derivatives of thermograms, the first small peak at 100°C is due to water loss (Kim et al., 2012). Then the derivative shows a major exothermic reaction starting at 300°C for TOR 350 and a lower peak at 430°C for TOR 450. TOR 600 does not show this peak indicating that this component has already been lost during torrefaction. The PL peak starts at about 210°C and it is higher than the TOR 350 peak. The peak for TOR 350 may be a double peak, with the second peak coinciding with the exothermic heat flow peak at 450°C. The peaks are caused by the thermal degradation of hemicellulose, cellulose and lignin. The 300°C peak is hemicellulose, 350°C peak is cellulose and lignin peaks at 450°C (Kim et al., 2012). Chen and Kuo, (2011) studied the thermal degradation of pure hemicellulose, cellulose, lignin, xylose and glucose. They found that torrefaction of hemicellulose at 230°C gave an exothermic peak. Hemicellulose contains oxygen having a general formula of (C5H8O4)n - this oxygen is used in thermal degradation. At temperatures below about 230°C some hemicellulose in the chars will have been broken down during the torrefaction process; at higher temperatures, above 310°C, the hemicellulose is totally broken down. For cellulose total breakdown occurs at 361°C. Lignin pyrolysis is an exothermic reaction and occurs at about 400°C. The peak in PL starting at 210°C is hemicellulose. In TOR 350 hemicellulose will have broken down so this peak is not seen, but cellulose and lignin have not broken down. Consequently, when the char is reheated in TGA, the weight loss is due to the decomposition of cellulose and lignin. For TOR 450 all components should have been lost and further weight loss should be due to inorganic components, such as carbonates. However, there is a larger drop in TOR 450 at a higher rate than for TOR 600, suggesting that not all organic components have been lost. This suggests that the components left in the different temperature chars are different. Their properties as fuels will therefore be different as shown by the decrease in calorific value (CV) with increased production temperature. Xylan is a component of hemicellulose and it shows a decrease in weight prior to 100°C so it may be that the drop-in weight previously attributed to water might be due to xylan. However, this would not fit with TOR 600 losing the most weight as it will have least xylan since the pyrolysis temperature for xylan is 300°C, so should not be present in the TOR 600.
The same decomposition behaviour was observed for the TF samples.
Figure 25 presents the TGA curves for TOR 350 in comparison with TF 350. As can be seen, TF 350 results agree well with those obtained for the TOR 350; this would be expected as they are produced at the same temperature. Heat flows and derivatives are very similar however, TOR 350 shows a higher peak which starts slightly earlier. Also, TF loses more weight at above 100°C and then drops more gradually so, by the end of the process, the weight loss is very similar.
HTC biochar samples showed a different behaviour although the feedstock decomposition is dominated by reaction mechanisms similar to those in dry pyrolysis, which include hydrolysis, dehydration, decarboxylation, aromatization and recondensation (Libra et al., 2011). However, the hydrothermal degradation of biomass is initiated by hydrolysis, which exhibits a lower activation energy than most of the pyrolytic decomposition reactions.
As seen in Figure 26, the weight loss seems to be more gradual than for the torrefied samples, with less of a distinct step change. The very broad derivative peak explains why there is not such an obvious step change.
Therefore, the principle biomass components are less stable under hydrothermal conditions, which leads to lower decomposition temperatures. Hemicellulose decomposes between 180 and 200°C, most of the lignins between 180 and 220°C, and cellulose above approximately 220°C. So, the bulk of the polymer left will be cellulose (Libra et al., 2011). The 400°C peak is presumably lignin that has not yet decomposed, but the broad peak up to 300°C is cellulose. There is less hemicellulose present.
It is possible to attach a MS to a TGA device to see what gases are evolved at the different temperatures (Florin et al., 2009). The results for PL suggest that the main gas lost at 375°C is water, so dehydration reactions are occurring, whilst the second peak at 450°C coincides with CO2, higher hydrocarbons (C2H2+, C2H3+) and aldehydes. This gives more information about the reactions occurring and the gases being lost during torrefaction.
The weight loss for the TOR, TF and HTC samples measured in this study is presented in Table 10.
3.5. Effect of Production Temperature on Samples’ Hydrophobicity
As confirmed by literature, low-temperature biochars were observed to be hydrophobic (Figure 27), which has implications for storage and also breakdown of char in soils and adsorption of water (Lehmann and Joseph, 2009).
3.6. Effect of Production Method and Temperature on Germination
Germination was tested in two separate experiments. The data cannot be amalgamated as these experiments were not carried out in controlled environmental conditions. Consequently, germination must be compared to the relevant control (Figure 28 and Figure 29).
For the first experiment, as seen in Figure 28.A, TOR 600 biochar sample showed no germination and TOR 350 showed only minimal germination. HTC 120 showed germination although germination started later and gave a lower value than the control at 7 days. The anomalous reading on day 3 for the control was due to the plate drying out on a very hot day. 2ml DI water were added to all plates immediately and then 1ml of water was added each time they were measured. Observation suggested that although germination occurred in the HTC 120 root growth was severely inhibited and roots seemed more twisted than the control. Possibly the roots could not grip the substrate. Consequently, at day 7 as well as measuring total germination root length was also measured (Figure 28.B). There was considerable mould/fungal growth on HTC 120 which started on day 4.
The ANOVA for this experiment is extremely significant with a P value of 8.9 x 10⁻¹⁹. This does not detail which results are significantly different, although obviously the two chars are significantly different to the control. However, a t-test was performed to show which results were significantly different to the control. This is important to test whether differences between the hydrochar and the control are significant.
For the second experiment the following solid substrates were used: PL, HTC-C1-210 and washed TOR 350 char against the control. Figure 29 presents the germination results. It was good germination for the HTC-C1-210 sample (84%) and washed TOR 350 sample gave some germination (34%). There was little germination in PL and the few seeds that germinated were not observed until day 7, showing a major delay in germination. Root growth was low in HTC-C1-210 and severely inhibited in TOR 350 washed and PL. Mould growth on PL started on day 4 and by day 7 the plate was almost completely covered. Germination was variable in PL with one plate showing 28% and another zero. The variation did not seem to correlate with mould growth. There is still a significant difference in the ANOVA for this experiment with P < 0.05 (P =1.24 x 10⁻⁶). Again, a t-test was performed to show whether the difference between PL, HTC and control were significant.
The Student’s t-test shows all results are significantly different to the control at P <0.05.
All the germination results can be compared using a germination index (GI) as shown in Table 11.
The literature suggests that biochars do not inhibit germination, but that hydrochars do inhibit germination (Busch et al., 2013). These results appear to contradict this, with germination occurring in hydrochars but not in biochars. However, the high germination index in HTC 120 can be explained by the fact that it was a low temperature hydrochar that had been washed. This washing should remove soluble substances and some toxic oils from the surface allowing germination. Initial seed germination is mainly dependent on water availability for imbibition and the hydrochar showed good water retention, allowing good germination. However, after initial germination, substrate toxicity is demonstrated as reduced root growth showing toxic substances still remain, even after washing. If there is no toxicity the roots should be white and show root hairs just behind the growing tip. Root growth should be fairly straight with a consistent diameter, reducing towards the root tip.
Germination in the TOR samples was almost completely inhibited. As stated earlier, this can be due to lack of water for imbibition by the seeds. As water was physically present, a lack of water for imbibition could be due to two factors. Firstly, the lower temperature chars are very hydrophobic and when water was added it formed discrete bubbles on the surface meaning the water did not disperse, consequently only some seeds had access to water (see Figure 27).
However, hydrophobicity is more pronounced in low temperatures chars, whereas the high temperature TOR 600 showed poorer germination; indicating toxic compounds might be more important.
Secondly, physiological drought can occur i.e., water is present, but the concentration of soluble salts is so high that osmosis cannot occur into the seeds to allow germination. If it was simple lack of water that produced the lack of germination, then transfer of the seeds from the char to filter paper should allow germination. This did happen for TOR 350 where 21% germination occurred on transfer to filter paper, although germination had started on the char before transfer occurred. Full germination did eventually occur for those seeds where germination had already started.
Figure 30 shows cotyledon emergence, but the stunting of the root is clearly visible. The brown coloration on the root is also visible as is the lack of growth. The control shows the difficulty in measuring root growth as the root blends into the stem with no obvious discontinuity. This makes the actual measured values for root length estimates. If the testa is still attached this indicates the line between root and shoot. Also, there is often a colour difference from white to green at the junction. It is thought that the total lack of germination is due to toxic salts and physiological drought.
To test whether soluble salts were important in causing germination inhibition a sample of char was washed as for pH determination to provide a washed char and a washing extract. If the hypothesis is correct the washed char should allow germination, whilst the extract should inhibit germination. In experiment 2 the washed TOR 350 char did allow germination at 35% (Figure 31). However, mean root length is still negligible indicating a two- stage germination/growth inhibition. Washing removes the first inhibition but not the second which could be due to bio-oils and tars deposited on the char. It is also still possible that it is hydrophobicity which causes the initial inhibition as the washed char was very wet. To investigate further the char should be dried after washing and then used in a germination experiment; however, this adds another variable as it means more volatiles will be lost. Some experiments have tried to separate volatiles and direct contact effects on germination inhibition (Buss and Mašek, 2014). This would have been an interesting experiment to perform as volatiles are definitely present on the TOR samples as evidenced by smell. A further experiment was performed where seeds were placed on biochars that had equilibrated with a moist atmosphere in the hydrophobicity experiment. No germination occurred, probably due to insufficient water. However, as they were kept in a sealed box, volatiles could also be implicated.
In order to explain the germination results observed during the experiment 1, it was assumed that soluble salts, such as KCl, could be inhibiting germination. EDX showed about 10% of K present on the surface of chars, probably as KCl. So, a 10% solution of KCl was used in an extra experiment along with a TOR 350 wash extract. What is more, literature suggested that the hydrochar liquors are more toxic than the solids, so two liquor samples were tested, HTC 87 and HTC 250, respectively.
The KCl completely inhibited germination either through physiological drought or due to toxicity which supported the hypothesis.
The total lack of germination in the high temperature HTC extract and low GI for the low temperature liquor also supported the toxicity of HTC extracts. This liquor toxicity could be due to a number of factors. The liquor is acid (pH for HTC 87 is 3.27 while for HTC 250 is 4.57) which may be a problem because pH affects germination. Acidity also increases the solubility of many metals which can also cause germination inhibition, although levels of heavy metals (as shown by AAS) were generally low. There is also a complex mix of organics including phenols and PAH in HTC liquor.
TOR 350 and HTC 87 extracts show good germination at almost the same rate as the control although root growth is decreased in both with HTC 87 showing almost no root growth. Roots were so short they were difficult to measure. KCl and HTC 250 show no germination. The KCl seeds were washed and placed in deionised water after failing to germinate, but still did not germinate, suggesting toxicity as well as osmotic effects.
As stated above, the TOR 350 extract had no effect on germination suggesting that soluble salts do not inhibit germination. However, the extract was far more dilute (1:40) than concentration would be on the seeds. A second germination was performed at 1:20; this also had no effect on germination. It would be useful to perform a concentration sequence using higher concentrations.
In summary, biochars totally inhibit germination whilst hydrochars slightly inhibit germination. However, after germination hydrochars inhibit root growth. Washing of both biochars and hydrochars reduces germination inhibition, but root inhibition remains. It is suggested that the initial germination inhibition in biochars is due to the presence of soluble salts such as KCl. Root inhibition is probably due to insoluble organic compounds deposited on the char surface. Surprisingly PL also showed almost total germination inhibition. The fact that PL is used successfully as a fertiliser suggests that lower concentrations do not adversely affect plant growth; possibly the chars could be used as soil amendments if used in low concentrations.
4. Preliminary Kinetic Analysis of Poultry Litter Thermochemical Conversion via Torrefaction
Kinetic studies of the thermal decomposition of poultry litter are a matter of major interest for investigating its use for energy.
Kinetic studies allow a better understanding of the mechanism and provide the basis for the most appropriate reactor design.
As the SEM micrographs shown, the poultry litter used in this study is a mixture of poultry manure, feathers, spilled feed and bedding materials, which increased the complexity of the torrefaction process. The main components of poultry litter are lignin, cellulose and hemicellulose (as in any other biomass) plus protein.
TGA analysis evidenced that the high temperature starts to break the bonds of groups bound to carbon, as carbon polymers such as hemicellulose, cellulose and lignin are broken down. Figure 32 below shows the varied reactions involved in the torrefaction of the lignin present in the poultry litter.
Several methods of studying torrefaction kinetics have been postulated by different researchers. The methods are classified as model-fitting and model-free methods, respectively. In model-fitting methods, different types of kinetic models are fitted into experimental data until the best statistical fit is obtained. Kinetic parameters are then calculated based on the best fit model.
Coats-Redfern method is the most popular model-fitting technique (Cai, J. and Bi, L., 2008). In contrast, model- free methods allow the estimation of kinetic parameters without a priori knowledge of the kinetic model by utilizing TGA measured data generated at different heating rates. Common examples of model-free methods include the Kissinger-Akahira-Sunose (KAS), Ozawa-Flynn-Wall (OFW), Friedman, Starink, and Distributed Activation Energy (Xiao et al., 2009). These methods are also called iso-conversional because they use the iso-conversional principle to analyse the experimental data. The iso-conversional principle states that the reaction rate at a constant extent of conversion is only a function of temperature. Although the model-free methods are relatively simple, they are sensitive to the accuracy and precision of the analytical techniques employed.
As TGA experiments were performed at only one heating rate, i.e., 10°C min-1, the iso-conversional methods were not appropriate to be used for the kinetic parameters determination. Instead, the Coats- Redfern method was used in this study. The method is described in detail in (Cai, J. and Bi, L., 2008), while the application of this method to poultry litter pyrolysis can be found in (Zikhali et al., 2023).
The TGA data of PL are presented in Figure 24A.
From the recorded mass loss curve (mass loss versus temperature), the reaction conversion curve (the extent of the reaction versus temperature) was obtained easily (data not shown).
Briefly, the method consists of the following steps (Zikhali et al., 2023).
The pyrolytic conversions (Y) for each temperature were determined using Eq. 1.
where w represents the mass loss, initial (i), at a certain temperature and final (f), respectively,
The pyrolytic decomposition of chicken waste in the reactor can be modelled as a function of conversion as follows.
The conversion function can be written as follows.
where n is the reaction order.
By substituting Eq. (3) and the general form of the Arrhenius equation into Eq. (2), we obtain
If the reactor heating rate ß (°C/min), given by Eq. (5) is constant, we can make use Eq. (4) to obtain Eq. (6).
The Coats-Redfern method is a model-fitting that requires the integration of Eq. (6). As a result, we obtain the following expressions in Eqs. (7) and (8), for n = 1 and n = 2, respectively.
where T is the absolute temperature (K), A is the pre-exponent factor in the Arrhenius equation, R is the universal gas constant (0.0083 kJ/(mol∙°C) and Ea is the activation energy (kJ/mol).
The pyrolysis kinetic parameters, that is, the activation energy and the pre-exponential factor can then be evaluated by linearising Eqs. 7 and 8 and determining the slope and y-intercept of the resultant plots. Furthermore, the rate constant (k) can be calculated by Eq. 9. In this case, T is taken as the median value of the selected temperature range.
Following the above steps, the apparent activation energy was 112 kJ/mol, assuming that the pyrolysis process follows 1st order kinetics, and 153 kJ/mol, assuming 2nd order kinetics, in good agreement with literature data.
5. Conclusions
The aim of this study was to investigate the effect of temperature and treatment on morphology (most and foremost), structure and composition of PL chars. It has succeeded as an almost comprehensive overview of the most important parameters in PL chars has been produced, which does allow the linking of various parameters to char functions and will allow recommendations to be made as to the best production methods for a particular application. It has also discovered several interesting new facts in certain areas, although further research will be needed to elucidate the exact importance of these discoveries.
The main new discoveries are the presence of sylvite (KCl) crystals on the surface of TOR samples; the variation in pore structure leading to the significant variation in pore size at a given temperature; the inhibition of germination in TOR biochars and the suppression of growth in HTC hydrochars. The hydrophobicity differences between different temperatures of TOR chars have also been demonstrated. In some cases, methods have had to be modified to allow measurement of chars and this research allows recommendations to be made about the importance of certain methods used to evaluate chars.
Basic tests were performed on the biochars. Some of these parameters measured are dependent on the feedstock, which was also analysed in this study. Moisture content of the PL used in this paper was 30%, within the range of 22 -33%, found in another study (Agblevor et al., 2010). Biochar pH, residual ash and weight loss increased with increasing temperature. Higher temperature chars have been shown to be less hydrophobic and have a larger surface area for adsorption of water. This is important in char storage and may also affect analysis. These results broadly agree with values in literature, especially with respect to trends. However, actual values are very variable because they depend on the exact composition of the PL.
There is little in the literature which indicates a detailed study of char morphology. In terms of morphology the major characteristic of the biochars is their heterogeneity which suggests an explanation for wide variations in published data. Many distinct structures were observed and identified in PL using the SEM technique. These included wheat and barley leaves, with round siliceous structures on their surface, roots, feathers and phytoliths. These phytoliths are very resistant and remain in ash. Phytoliths can be a serious problem when chars are used as fuels (Cennatek, 2011). As well as these discrete multicellular structures, there is obvious cellular structure present in the plant material. Gross and cellular structures found in the PL morphology remain in the biochars. However, the structure of these areas changes as the cell wall materials are converted to carbonised material to give the characteristic honeycomb structures in the chars. In some of the micrographs it can be seen that the external epidermal covering has disappeared showing the carbonised honeycomb underneath.
These honeycomb structures are the most obvious characteristic of the biochars and are found at all temperatures. The pore size of these honeycombs and other structures containing pores were investigated. Pore size decreases with temperature because of the shrinkage caused by the heating. The bulk of the macropores in biochars are derived from the cellular structure of the plant material and the honeycomb structure of pores of about 10µm is the origin of most of the macropores in biochars (Lehmann and Joseph, 2009). When charcoal is used as an adsorbent these macropores are only considered useful as feeders to the mesopores and micropores (Lehmann and Joseph, 2009). However, when chars are used as a soil amendment, these macropores are the most important. All pores are important as they increase soil surface area. BET (Brunauer-Emmet-Teller) surface area increases with temperature up to about 700°C, due to the formation of localized regions of graphene and so is an intrinsic property of the char (McLaughlin, Shields and Reed, 2009). However, BET surface area is not really a valid way of measuring surface area in soil. It was developed to investigate gas adsorption and it uses a partial vacuum at -196°C so may not give a valid prediction of actual surface area in soil for use by microbes (McLaughlin et al., 2009). Certainly, this study showed the massive, interconnected network in some biochars that could not be measured simply by pore size; in fact, it is difficult to even define pore size in this context. Recent research has emerged which addresses this issue measuring pore volume, not by direct observation in SEM as used in this paper but using an envelope density method in conjunction with helium pycnometer. This research also suggests that SEM measurements are a good method for measuring macropores but suffer from limitations as discussed earlier (Brewer et al., 2014). SEM measurements are, however, direct and, if sampling consideration can be overcome, could be a useful addition to characterisation studies where chars are to be used in soil.
One of the most interesting findings in this study was the presence of large numbers of crystals on the surface of the chars. These crystals had a regular structure, although size was very variable. The most obvious contained large amounts of K and Cl so were probably KCl. This was confirmed by the presence of sylvite (KCl) in the XRD results. These crystals help to explain other properties of the chars, including some of the germination inhibition and the water extractability of K from the biochars. There were many other crystals present and those confirmed by XRD include calcite and quartz.
The decrease in pore size with temperature for TOR samples and hence increased surface area, improves plant growth by increasing air and water retention in the soil. Pores lower than 10µm hold capillary water well and increase the water holding capacity of soil. The results found here show that above 500°C the mean pore size is below 10µm. However, even with the lower temperature biochars where mean pore size is higher, there are many pores that are below 10µm, e.g., TOR 350 has a mean pore diameter of about 14µm but 20% of pores are below 10µm.
There are many studies investigating the effect of chars on plant growth and the results are variable. A recent meta-analysis showed a small mean increase in yield of 10%, but the range of effects on yield was minus 28% to plus 39% (Jeffery et al., 2011). The greatest positive effect was seen in acidic and neutral soils and in soils with a medium or coarse texture. This fits with previous research suggesting increased pH was a major factor improving yield (Shackley and Sohi, 2011). This suggests that the beneficial effects of biochar application are due to a liming effect where basic chars neutralise acidity and that biochar also affects water holding capacity. In the review PL showed the largest positive effect on yield at 28% (Jeffery et al., 2011) and this could be explained by decreased pore size in biochars increasing water holding capacity. Also, the high pH of the biochars would neutralise acidic soils.
Pores are also important for microbes providing a habitat and protecting them from predators and desiccation. A review of biochar effects on soil organisms found that biochar increased microbial biomass, affected community structure and changed enzymes (Lehmann et al., 2011).
In terms of composition, elemental composition is mainly C and O as seen by EDX. EDX cannot detect lighter elements so there is no data for hydrogen which means H/C ratio could not be determined. Neither does EDX detect nitrogen which is a major omission if the char is to be used as a soil amendment because nitrogen is a major plant nutrient. In the case of minor elements detected there was most K with about 10% at high temperatures, followed by Ca 5%, P 3%, Mg 2%, Cl 3% and Na 1%. Many temperature effects are simply concentration effects caused by mass loss thus all elements appear to increase with increased torrefaction temperature. However, K levels increase dramatically after 400°C. This is because the K is present as crystals on the surface and therefore will show high levels using EDX, which only samples the top few microns of the surface. These crystals have a major effect on biochars used as soil amendments.
ICP-MS shows a similar trend with levels in the biochars not much different to those in PL for low temperature biochars.
In TGA, as oven dried material is used, weight loss above 100°C is due initially to further water evaporation and then to loss of volatiles. As this occurs in an inert atmosphere there is little oxidation. The high temperature starts to break the bonds of groups bound to carbon, as carbon polymers such as hemicellulose, cellulose and lignin are broken down and the products are lost as gases and oils (Chen and Kuo, 2011). At 260°C 38% of hemicellulose weight is lost, by 290°C, 58%. Most cellulose has degraded by 360°C, lignin degrades at higher temperatures. Thus, in terms of lignocellulose content (sawdust, wood shavings, straw) most weight loss by biochars in TGA will be due to breakdown of lignin. Lower temperature chars will also have some cellulose and so will lose more weight than higher temperature chars. Inorganics such as carbonates start to breakdown above 450°C and are lost. In high temperature biochars such as TOR 600 only small quantities of lignin and inorganics should be left to cause weight decrease, so weight loss is small at 12.5%.
The germination results were not what would be expected from the literature where it is stated that biochars do not significantly affect germination (Busch et al., 2013). It was expected that, as PL is commonly used as a soil amendment, it would not affect germination. This was not the case, with almost complete germination inhibition at seven days, which agrees with another study which found zero germination of T. aestivum (wheat) grown on PL (Farrell et al., 2013). In this study biochars showed almost total germination inhibition, which needs explanation. As seen in other parts of the study volatile compounds are lost during torrefaction. When cellulose and other compounds break down, they form low molecular weight compounds such as organic acids, alcohols, phenols and poly-aromatic hydrocarbons (PAH). These can recondense on the surface of the char and can be toxic (Buss and Mašek, 2014). These volatile organic compounds (VOC) are not important if the char is to be used as a fuel but become potentially very important if the char is to be used as a soil amendment.
The most likely factor causing germination inhibition is an osmotic effect as initial germination is dependent on water availability. The presence of large amounts of soluble salts including KCl crystals on the surface of the biochar, as seen in the SEM study, would cause a major osmotic effect. This could inhibit germination by reducing imbibition of water. As seen here, washing the soluble salts off the biochar increased germination, but then another toxicity factor became important with the germinated seeds showing severe root inhibition. So germination inhibition is not removed by thirty minutes washing although, further soluble toxic compounds could be removed by additional washing.
Hydrochar samples are markedly different to biochars in gross properties. They are softer, lighter in colour and, smear rather than fragment, when pulverised. HTC is also a less well understood process and produces two product streams, solid hydrochars and liquor. Morphologically, hydrochar is fairly similar to biochar with the same gross morphology, though having more fibrous structures visible and more cell wall debris on the hydrochar surface (Kristensen et al., 2008). This is due to differences in the temperatures at which the cell wall components decompose (discussed in TGA section). Pore size showed little variation with temperature however, there were only a small number of samples, and the temperature range was not large. The mean pore size for low temperature hydrochars is 10µm - smaller than that for the lowest temperature biochar which was 14µm. The pore structure is also different, true honeycombs are found in HTC120, but lower temperature honeycombs could be considered different: there are no true pores as there is no cavity in the centre. It is possible the pores are in the process of forming, or this too could be connected to the different decomposition sequence of cell wall components. There are some crystalline structures present, but they seem small and diffuse, unlike the defined structures in the chars, presumably because many crystals are soluble and dissolve in the liquor.
Hydrochars are acidic, in this case, because citric acid was used as the liquid medium. However, pH rises with production temperature so high temperature hydrochars are pH 4 and above. This is still quite acidic and could have detrimental effects on plant growth. EDX shows far lower levels of K in hydrochar, presumably because the soluble K salts are in the liquor. All elements appear to increase slightly with temperature presumably due to the fact that the hydrochars lose weight. The only element found by EDX on the surface is Ca possibly because it is present as an insoluble salt such as calcium carbonate (CaCO3). Total K values in the HTC material are very low presumably because the K is in the liquor.
The TGA for HTC char samples shows a different curve to torrefied samples. The curve is far smoother with no distinct step changes. There is a very broad derivative peak which starts earlier, but at a lower level, which suggests that there is less cellulose and hemicellulose and fits with the fact that HTC breaks down hemicellulose at low temperatures (Kristensen et al., 2008). This then frees the cellulose microfibrils which then break down more easily at lower temperatures. So, the hydrochar would have lower amounts of cellulose and hemicellulose. The residual ash, at 46%, was higher than the TF 275 (37.5%) value but lower than TOR 350 (56%) so relatively high considering it was produced at a lower temperature (216°C).
The HTC samples were expected to show germination inhibition (Busch et al., 2013), but actually germinated well. However, root growth was severely inhibited suggesting that the seeds would never establish. Again, this suggests that GI is a better measure of phytotoxicity than simple germination testing. In one study, where germination was inhibited, it was stated that the source of inhibition was unknown and various treatments were used to try to remove the inhibition. These treatments included washing five times with water, mixing with H2O2 to remove oxidizable components, composting, aeration and straining to remove excess water/ liquor. None of these treatments improved germination (Busch et al., 2013).
There was good fungal growth on both the HTC and PL plates, suggesting that the substrate is biodegradable. Theoretically, as cell wall breakdown is mainly hydrolytic in HTC, there could be many monomers or small polymers present, which could be used by the fungi. In the case of the HTC samples, germination occurred before major fungal growth, thus it was not the fungal growth that allowed germination. This was not the case with the PL where germination only occurred after fungal growth. Further investigation is needed to investigate whether fungal growth breaks down potentially toxic substances.
A major conclusion of this study is the amazing variety of morphology, structure and composition found in chars produced at the same temperature from the same feedstock.
Based on the findings of this study, the following recommendations can be made:
- High temperature biochars are best suited to soil amendment, whilst low temperature biochars are better suited for use as a fuel.
- GI should be adopted as a bioassay to assess phytotoxicity especially for chars used in soil amendment.
- Genotoxicity tests should be adopted for all chars used for soil amendment.
- More studies should be multidisciplinary and consider the whole range of char parameters.
- More attention should be paid to surface chemistry and its effects on char properties.
- Direct measurement of pore size by SEM should be considered as this gives a more accurate measure of macropore size.
- Hydrophobicity is an important feature of biochars and methods should be developed to test it on powder chars. Once the methods are developed, it should be studied in all chars.
- More studies should consider detailed morphology and structure, especially for mixed feedstock such as poultry litter, to determine what components are important in generating specific char parameters. It may then be possible for farmers to change the components of the litter to produce a particular type of char, i.e., one designed for fuel or one for soil amendment.
Supplementary Materials
The following supporting information can be downloaded at the website of this paper posted on Preprints.org, Figure S1: SEM/EDX results on wheat samples.; Figure S2: SEM/EDX results on barley leaves.; Figure S3: SEM of barley leaves showing phytolith structures. Figure S4: SEM images: left) feathers from TF 135 (its provenience is PL); right) Actual feather.; Figure S5: SEM/EDX results on pure KCl.; Figure S6: SEM images of TOR 400 sample showing complex macroporosity: A) Pores formed by the open ends of cells; B) Size range of pores compared to crystal size.; Figure S7: SEM images of TOR 450 sample showing complex macroporosity: A) Pores size; B) Pore size at 2 x higher magnification.; Figure S8: SEM images of TOR 500 sample showing complex macroporosity: A) True honeycomb porous structure with mean pore size of 7.9µm; B) Non-empty pores.; Figure S9: SEM images of TOR 550 sample showing complex microporosity.; Figure S10. SEM images of TOR 600 sample showing complex macroporosity: A) Pore size measurements; B) True honeycomb of the cellular structure.; Figure S11. SEM images and pore size measurements of the TF 135 biochar sample.; Figure S12. SEM images and pore size measurements for the TF 200 sample: A) Pores with appearance and sizes different from TF 135 sample; B) Pores with similar appearance and sizes similar to TF 135 sample.; Figure S13. SEM images and pore size measurements for the TF 275 sample.; Figure S14. SEM images and pore size measurements for the TF 350 sample.; Figure S15. SEM images and pore size measurements for the HTC 80 sample.; Figure S16. SEM images and pore size measurements for the HTC 95 sample.; Figure S17. SEM images and pore size measurements for the HTC 120 sample: A) Open pores; B) Pores in the process of forming.; Figure S18. SEM images and pore size measurements for the HTC 221 sample.
Author Contributions
Both authors contributed to the study conception and design. Material preparation, data collection and analysis were performed by J. Clarke. The first draft of the manuscript was written by J. Clarke, while the co-author commented on previous versions of the manuscript. Both authors read and approved the final manuscript.
Funding
Research was performed as part of a Master’s dissertation in Biotechnology at the University of Teesside. No other funding was received for conducting this study. Samples were generated by Carbogen, funded by the Technology Strategy Board via the Small Business Research Initiative and Invest Northern Ireland.
Data Availability Statement
The datasets used or analyzed during the current study are available from the corresponding author on reasonable request. More information can be found here: https://www.springer.com/journal/44246/submission-guidelines#Instructions%20for%20Authors_Research%20Data%20Policy%20and%20Data%20Availability%20Statements.
Acknowledgments
The authors thank Dr. Chris Ennis who provided some of the methods used as part of the project.
Conflicts of Interest
The authors have no relevant financial or non-financial interests to disclose. The authors have no competing interests to declare that are relevant to the content of this article. All authors certify that they have no affiliations with or involvement in any organization or entity with any financial interest or non-financial interest in the subject matter or materials discussed in this manuscript. The authors have no financial or proprietary interests in any material discussed in this article.
References
- Acharya, B., 2013. Torrefaction and Pelletization of Different Forms of Biomass of Ontario. MSc thesis. University of Guelph. Available at: http://citeseerx.ist.psu.edu/viewdoc/download?doi=10.1.1.463.9888&rep=rep1&type=pdf (Accessed: 10 October 2019).
- Adhikari, S., Gascó, G., Méndez, A., Surapaneni, A., Jegatheesan, V., Shah, K., Paz-Ferreiro, J., 2019. Influence of pyrolysis parameters on phosphorus fractions of biosolids derived biochar. Sci. Total Environ. 695, 133846. [CrossRef]
- Agblevor, F.A., Grysko, D., Revelle, K., 2010. Pyrolysis Technology: Environmentally friendly solution to nutrient management in the Chesapeake Bay. Available at: http://www.chesapeake.org/stac/presentations/63_agblevor.pdf (Accessed: 5 Oct 2019).
- Anon (2008) Identify minerals: to know composition and structure. Available at: http://www.geology.wisc.edu/~g203/s2008/pdf08/class13.pdf (Accessed: 10 September 2019).
- Bargmann, I., Rillig, M.C., Buss, W., Kruse, A., Kuecke, M., 2013. Hydrochar and biochar effects on germination of spring barley. J. Agron. Crop Sci. 199, 360-373. [CrossRef]
- Baskin, C.C. and Baskin, J.M. (2001) Seeds: Ecology, Biogeography, and, Evolution of Dormancy and Germination. [CrossRef]
- Brewer, C.E., Chuang, V.J., Masiello, C.A., Gonnermann, H., Gao, X., Dugan, B., Driver, L.E., Panzacchi, P., Zygourakis, K., Davies, C.A., 2014. New approaches to measuring biochar density and porosity. Biomass and Bioenergy 66, 176-185. [CrossRef]
- BSI (2011) Soil improvers and growing media - determination of plant response. London: BSI.
- Busch, D., Stark, A., Kammann, C.I. and Glaser, B. (2013) ‘Genotoxic and phytotoxic risk assessment of fresh and treated hydrochar from hydrothermal carbonization compared to biochar from pyrolysis’, Ecotoxicology and Environmental Safety, 97(0), pp. 59-66. [CrossRef]
- Buss, W. and Mašek, O., 2014. Mobile organic compounds in biochar – A potential source of contamination – Phytotoxic effects on cress seed (Lepidium sativum) germination. J. Environmen. Management, 137, 111-119. [CrossRef]
- Cai, J., Bi, L., 2008. Precision of the Coats and Redfern Method for the Determination of the Activation Energy without Neglecting the Low-Temperature End of the Temperature Integral. Energy & Fuels, 22, 2172-2174. [CrossRef]
- Cao, X.D., Harris, W., 2010. Properties of dairy-manure-derived biochar pertinent to its potential use in remediation. Bioresour Technol. 101, 5222–5228. [CrossRef]
- Cantrell, K.B., Hunt, P.G., Uchimiya, M., Novak, J.M., Ro, K.S., 2012. Impact of pyrolysis temperature and manure source on physicochemical characteristics of biochar. Bioresour. Technol. 107, 419-428. [CrossRef]
- Catalkopru, A.K., Kantarli, I.C., Yanik, J., 2017. Effect of spent liquor recirculation in hydrothermal carbonization. Bioresour. Technol. 226, 89-93. [CrossRef]
- Cely, P., Gascó, G., Paz-Ferreiro, J., et al., 2015. Agronomic properties of biochars from different manure wastes. J. Anal Appl Pyroly. 111, 173–183. [CrossRef]
- Cennatek (2011), Feasibility of improving biomass combustion by extraction of nutrients. Available at: https://ofa.on.ca/wp-content/uploads/2017/11/Improving_Biomass_Combustion_-utrient_Extraction-2_RAAC.pdf (Accessed: 24 September 2019).
- Chan, K.Y., Van Zwieten, L., Meszaros, I., Downie, A., Joseph, S., 2008. Using poultry litter biochars as soil amendments. Australian J. Soil Res. 46, 437-444. [CrossRef]
- Chen, W., Kuo, P., 2011. Isothermal Torrefaction kinetics of hemicellulose, cellulose, lignin and xylan using thermogravimetric analysis. Energy 36, 6451-6460. [CrossRef]
- Chun, Y.; Sheng, G.; Chiou, C.; Xing, B., 2004, Compositions and sorptive properties of crop residue-derived chars. Environ. Sci. Technol. 38, 4649–4655. [CrossRef]
- Dai, Z., Zhang, X., Tang, C., Muhammad, N.,Wu, J., Brookes, P.C., Xu, J., 2017. Potential role of biochars in decreasing soil acidification - a critical review. Sci. Total Environ. 581–582, 601–611. [CrossRef]
- da Silva Carneiro, J.S., Lustosa Filho, J.F., Nardis, B.O., Ribeiro-Soares, J., Lopes Zinn, Y., Azevedo Melo, L.C., 2018. Carbon Stability of Engineering Biochar-Based Phosphate Fertilizers. ACS Sustainable Chem. Eng. 6, 14203-14212. [CrossRef]
- de Figueiredo C.C., Chagas J.K.M., da Silva J., Paz-Ferreiro, J., 2019. Short-term effects of a sewage sludge biochar amendment on total and available heavy metal content of a tropical soil. Geoderma 344, 31-39. [CrossRef]
- Dhungana, A., Dutta, A. and Basu, P., 2012.Torrefaction of non-lignocellulose biomass waste. Canadian J. Chem. Eng. 90, 186-195. [CrossRef]
- Dutrow, B.L., Clark, C.M., 2013. X-ray powder diffraction. Available at: http://serc.carleton.edu/research_education/geochemsheets/techniques/XRD.html (Accessed: 4 October, 2019).
- Farrell, M., Rangott, G., Krull, E., 2013. Difficulties in using soil-based methods to assess plant availability of potentially toxic elements in biochars and their feedstocks. J. Hazard. Mater. 250–251, 29-36. [CrossRef]
- Felfli, F.F., Luengo, C.A., Suárez, J.A., Beatón, P.A., 2005. Wood briquette Torrefaction. Energy Sustain. Dev. 93, 19-22. [CrossRef]
- Florin, N.H., Maddocks, A.R., Wood, S., Harris, A.T., 2009. High-temperature thermal destruction of poultry derived wastes for energy recovery in Australia. Waste Manag. 29, 1399–1408. [CrossRef]
- Funke, A., Ziegler, F., 2010. Hydrothermal carbonization of biomass: a summary and discussion of chemical mechanisms for process engineering. Biofuels, Bioprod. Biorefin. 4, 160–177.
- Gascó, G., Paz-Ferreiro, J., Alvarez,M.L., Saa, A.,Méndez, A., 2018. Biochars and hydrochars prepared by pyrolysis and hydrothermal carbonisation of pig manure. Waste Manag. 79, 395–403. [CrossRef]
- Gaskin, J.W., Steiner, C., Harris, K., Das, K.C., Bibens, B., 2008. Effect of low-temperature pyrolysis conditions on biochar for agricultural use. Transactions of the ASABE, 51, 2061-2069. [CrossRef]
- Gell, K., van Groenigen, J. and Cayuela, M.L. (2011) ‘Residues of bioenergy production chains as soil amendments: Immediate and temporal phytotoxicity’, Journal of Hazardous Materials, 186(2–3), pp. 2017-2025. [CrossRef]
- Ghanim, B.M., Pandey, D.S., Kwapinsky, W., Leahy, J.J., 2016. Hydrothermal carbonisation of poultry litter: Effects of treatment temperature and residence time on yields and chemical properties of hydrochars. Bioresource. Technol. 216, 373-380. [CrossRef]
- Glaser, B., Birk, J.J., 2012. State of the scientific knowledge on properties and genesis of Anthropogenic Dark Earths in Central Amazonia (terra preta de Índio). Geochim. Cosmochim. Acta 82, 39-51. [CrossRef]
- Gong, P., Wilke, B.M., Strozzi, E., Fleischmann, S., 2001. Evaluation and refinement of a continuous seed germination and early seedling growth test for the use in the ecotoxicological assessment of soils. Chemosphere 44, 491-500. [CrossRef]
- Gray, M., Johnson, M.G., Dragila, M.I., Kleber, M., 2014. Water uptake in biochars: The roles of porosity and hydrophobicity. Biomass Bioenergy 61, 196-205. [CrossRef]
- Hoekman, S., Broch, A., Robbins, C., 2011. Hydrothermal carbonization (HTC) of lignocellulosic biomass. Energy Fuels 25, 1802–1810. [CrossRef]
- International Biochar Initiative (2010) Technical bulletin 101. Available at: http://www.biochar-international.org/sites/default/files/Technical_bulletin_101_english.pdf (Accessed: 10 March 2019).
- Jenkins, E., 2009. Phytolith taphonomy: a comparison of dry ashing and acid extraction on the breakdown of conjoined phytoliths formed in Triticum durum. J. Archaeol. Sci., 36, 2402-2407. [CrossRef]
- Jeffery, S., Verheijen, F.G.A., van der Velde, M., Bastos, A.C., 2011. A quantitative review of the effects of biochar application to soils on crop productivity using meta-analysis. Agr. Ecosyst. Environ.144, 175-187. [CrossRef]
- Joseph, S., Munroe, P., Lin, Y., Downie, A., Hook, J., Shasha, A., van Zweiten, L., Kimber, S., Cowie, A.L., Singh, B.P., Lehmann, J., Amonette, J.E., Carter, E., 2008. Towards an Understanding of the Properties and Structure of High Mineral Ash Biochars. Available at: http://www.biochar-international.org/images/Joseph_IBI_poster_PMb.pdf (Accessed: 14 September 2019).
- Kim, S., Agblevor, F.A., Lim, J., 2009. Fast pyrolysis of chicken litter and turkey litter in a fluidized bed reactor. J. Ind. Eng. Chem. 15, 247-252. [CrossRef]
- Kim, Y., Lee, S., Lee, H., Lee, J. 2012 Physical and chemical characteristics of products from the Torrefaction of yellow poplar (Liriodendron tulipifera), Bioresource Technol. 116, 120-125. [CrossRef]
- Kristensen, J.B,.Thygesen, L.G., Felby, C.,Jørgensen, H., Elder, T., 2008. Cell-wall structural changes in wheat straw pretreated for bioethanol production. Biotechnol. Biofuels 1:5. Available at: https://biotechnologyforbiofuels.biomedcentral.com/track/pdf/10.1186/1754-6834-1-5 (Accessed 24 September 2019). [CrossRef]
- Lehmann, J., Joseph, S., 2009. Biochar for Environmental Management Science and Technology, Routledge, London.
- Liang, C., Gascó, G., Fu, S., Méndez, A., Paz-Ferreiro, J., 2016. Biochar from pruning residues as a soil amendment: effects of pyrolysis temperature and particle size. Soil Tillage Res. 164, 3–10. [CrossRef]
- Libra, J.A., Ro, K.S., Kammann, C., Funke, A., Berge, N.D., Neubauer, Y., Titirici, M-M., Fühner, C., Bens, O., Kern, J., Emmerich, K-H., 2011. Hydrothermal carbonization of biomass residuals: a comparative review of chemistry, processes and applications of wet and dry pyrolysis. Biofuels 2, 89-124.
- Lu, H., Li, Z., Fu, S., Mendez, A., Gasco, G., Paz-Ferreiro, J., 2015. Effect of biochar in cadmium availability and soil biological activity in an anthrosol following acid rain deposition and aging. Water Air Soil Pollut. 226, 164. DOI 10.1007/s11270-015-2401-y. [CrossRef]
- McLaughlin, H., Anderson, P.S., Shields, F.E., Reed, T.B., 2009. All biochars are not created equal and how to tell them apart. North American Biochar Conference. Boulder, Colarado, USA, August 2009. Available at: https://www.researchgate.net/publication/312453546_All_biochars_are_not_created_equal_and_how_to_tell_them_apart (Accessed: 7 October 2019).
- Méndez, A., Terradillos, M., Gascó, G., 2013. Physicochemical and agronomic properties of biochar from sewage sludge pyrolysed at different temperatures. J. Anal. Appl. Pyrolysis 102, 124-130. [CrossRef]
- Novak, J.M., Johnson, M.G., Spokas K.A., 2018. Concentration and Release of Phosphorus and Potassium from Lignocellulosic- and Manure-Based Biochars for Fertilizer Reuse. Front. Sustain. Food Syst. 2:54, doi: 10.3389/fsufs.2018.00054. [CrossRef]
- Oram, N.J., van de Voorde, T.F.J., Ouwehand, G., Bezemer, T.M., Mommer, L., Jeffery, S. and Groenigen, J.W.V. (2014) ‘Soil amendment with biochar increases the competitive ability of legumes via increased potassium availability’, Agriculture, Ecosystems & Environment, 191(0), pp. 92-98. [CrossRef]
- Prakongkep, N., Gilkes, R., Wiriyakitnateekul, W., Duangchan, A., Darunsontaya, T., 2013. The Effects of Pyrolysis Conditions on the Chemical and Physical Properties of Rice Husk Biochar. Intern. J. Mater. Sci. 3, 97-103.
- Royal Society of Chemistry (2019) ChemSpider. Available at: http://www.chemspider.com/Chemical-Structure.4707.html (Accessed: 24 September 2019).
- Schumacher, B.A., 2002. Methods for determination of total organic carbon in soils and sediments. Available at: http://epa.gov/esd/cmb/research/papers/bs116.pdf (Accessed: 7 May 2019).
- Shackley, S., Sohi, S., 2011. An assessment of the benefits and issues associated with the application of biochar to soil. Available at: http://www.geos.ed.ac.uk/homes/sshackle/SP0576_final_report.pdf (Accessed: 20 August 2019).
- Shafizadeh, F., Sekiguchi, Y., 1983. Development of aromaticity in cellulosic chars. Carbon 21, 511-516. [CrossRef]
- Shalini, S.S. and Kurian J., 2012. Nitrogen management in landfill leachate: Application of SHASRON, ANAMMOX and combined SHARON_ANAMMOX process. Waste Manag. 32, 2385-2400.
- Solaiman, Z.M., Murphy, D.V. and Abbott, K., 2012. Biochars influence seed germination and early growth of seedlings, Plant and Soil, 353(1-2), pp. 273. [CrossRef]
- Song, W., Guo, M., 2012. Quality variations of poultry litter biochar generated at different pyrolysis temperatures. J. Anal. Appl. Pyrolysis 94, 138-145. [CrossRef]
- Tiquia, S.M., 2010. Reduction of compost phytotoxicity during the process of decomposition. Chemosphere 79, 506-512. [CrossRef]
- Titirici, M.M., Thomas, A., Antonietti, M., 2007. Back in the black: hydrothermal carbonization of plant material as an efficient chemical process to treat the CO2 problem? New J. Chem. 31, 787–789.
- Treacy, M.M.J., Higgins, J.B., 2007. Collection of simulated XRD powder patterns for zeolites. 5th edn.
- Tsai, W., Liu, S., Chen, H., Chang, Y., Tsai, Y., 2012. Textural and chemical properties of swine-manure-derived biochar pertinent to its potential use as a soil amendment. Chemosphere 89, 198-203. [CrossRef]
- Uchimiya M., Wartelle L.H., Klasson, K.T., et al., 2011.Influence of pyrolysis temperature on biochar property and function as a heavy metal sorbent in soil. J Agric. Food Chem. 59, 2501–2510. [CrossRef]
- van der Stelt, M.J.C., Gerhauser, H., Kiel, J.H.A., Ptasinski, K.J., 2011. Biomass upgrading by Torrefaction for the production of biofuels: A review. Biomass and Bioenergy 35, 3748-3762.
- Van Zwieten, L., Kimber, S.W.L., Morris, S.G., Singh, B.P., Grace, P.R., Scheer, C., Rust, J., Downie, A.E., Cowie, A.L., 2013. Pyrolysing poultry litter reduces N2O and CO2 fluxes. Sci. Total Environ. 465, 279-287. [CrossRef]
- Wen, J-L., 2014. Understanding the chemical and structural transformations of lignin macromolecule during torrefaction. Appl. Energy 121, 1–9. [CrossRef]
- Verheijen, F., Jeffery, S., Bastos, A.C., van der Velde, M., Diafas, I., 2010. Biochar application to soils. Available at: http://eusoils.jrc.ec.europa.eu/esdb_archive/eusoils_docs/other/eur24099.pdf (Accessed: 29 August 2019).
- Yang, H.; Yan, R.; Chen, H.; Lee, D.H.; Zheng, C., 2007. Characteristics of hemicellulose, cellulose and lignin pyrolytic. Fuel 86, 1781–1788. [CrossRef]
- Yuan, J., Xu, R., Zhang, H., 2011. The forms of alkalis in the biochar produced from crop residues at different temperatures. Bioresour. Technol. 102, 3488-3497. [CrossRef]
- Xiao, H.-M., Ma, X.-Q., and Lai, Z.-Y. 2009. Isoconversional kinetic analysis of co-combustion of sewage sludge with straw and coal. Appl. Energy 86, 1741–1745. [CrossRef]
- Zhang, J., Huang, B., Chen, L., Li, Y., Li, W., Luo, Z., 2018. Characteristics of biochar produced from yak manure at different pyrolysis temperatures and its effects on the yield and growth of highland barley. Chem. Spec. Bioavailab. 30, 57-67. [CrossRef]
- Zhao, B., O’Connor, D., Zhang, J., Peng, T., Shen, Z., Tsang, D.C.W., Hou, D., 2018. Effect of pyrolysis temperature, heating rate, and residence time on rapeseed stem derived biochar. J. Clean. Prod. 174, 977–987. [CrossRef]
- Zikhali, V. N., Mpofu, C., Nyama, D., Nyoni, B., Mushonga, K., 2023. Kinetic and Thermodynamic Analysis of Chicken Manure Pyrolysis for Sustainable Waste Management in the Poultry Industry. Sch. Int. J. Chem. Mater Sci. 6(6), 135-140. [CrossRef]
Figure 1.
Effect of temperature on mean pH of char.
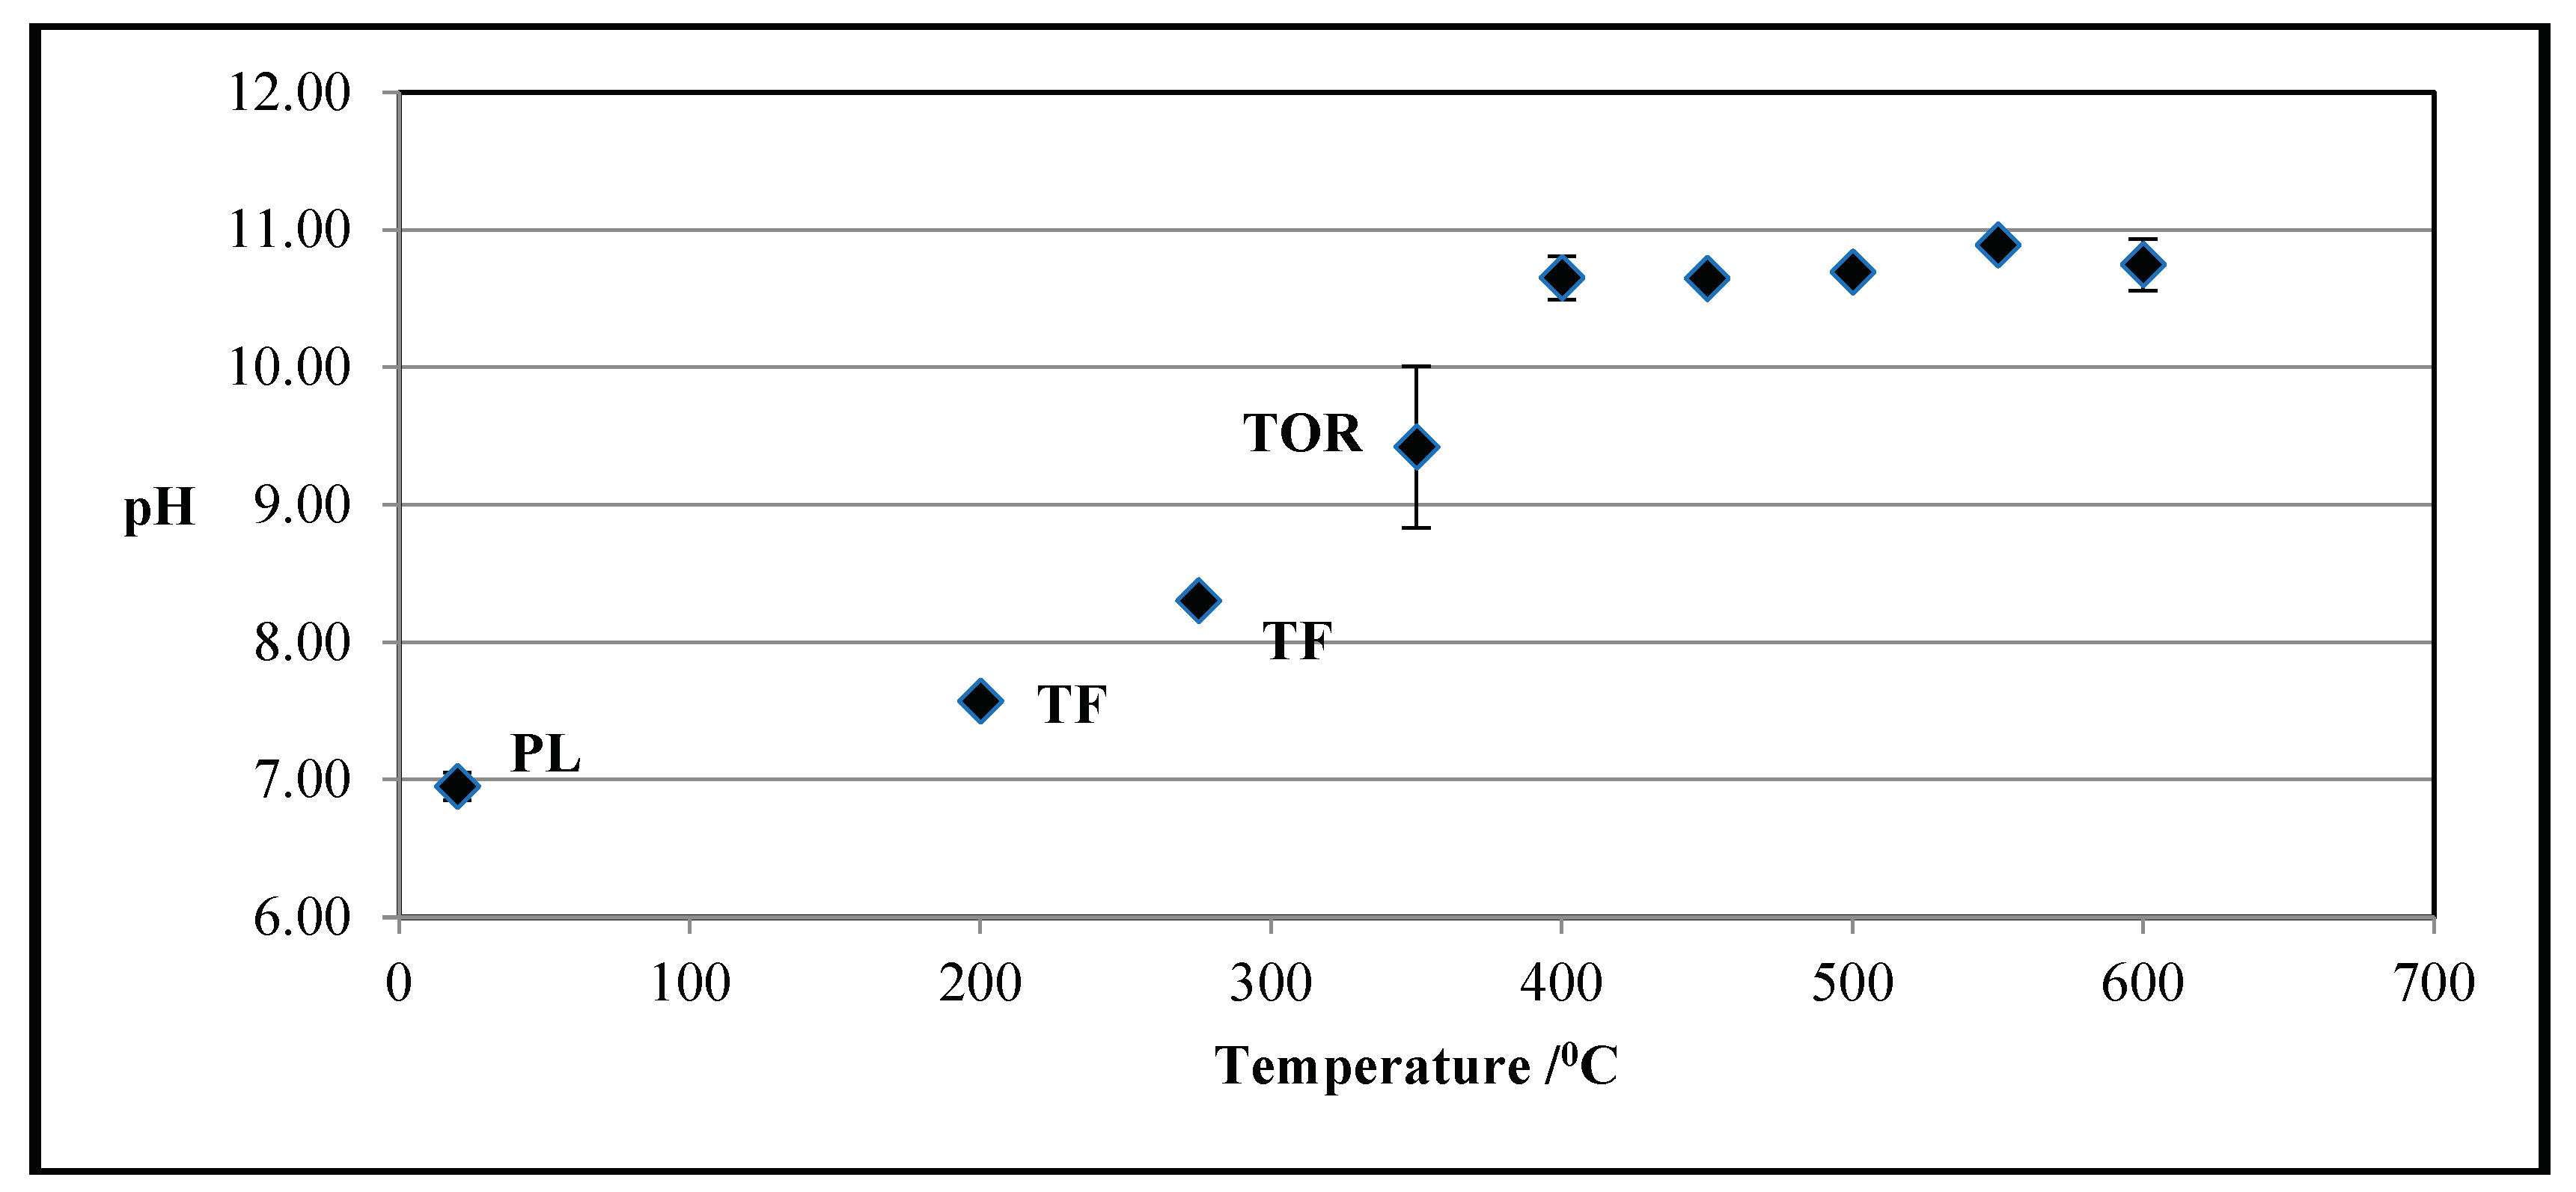
Figure 2.
Effect of HTC residence time on pH.
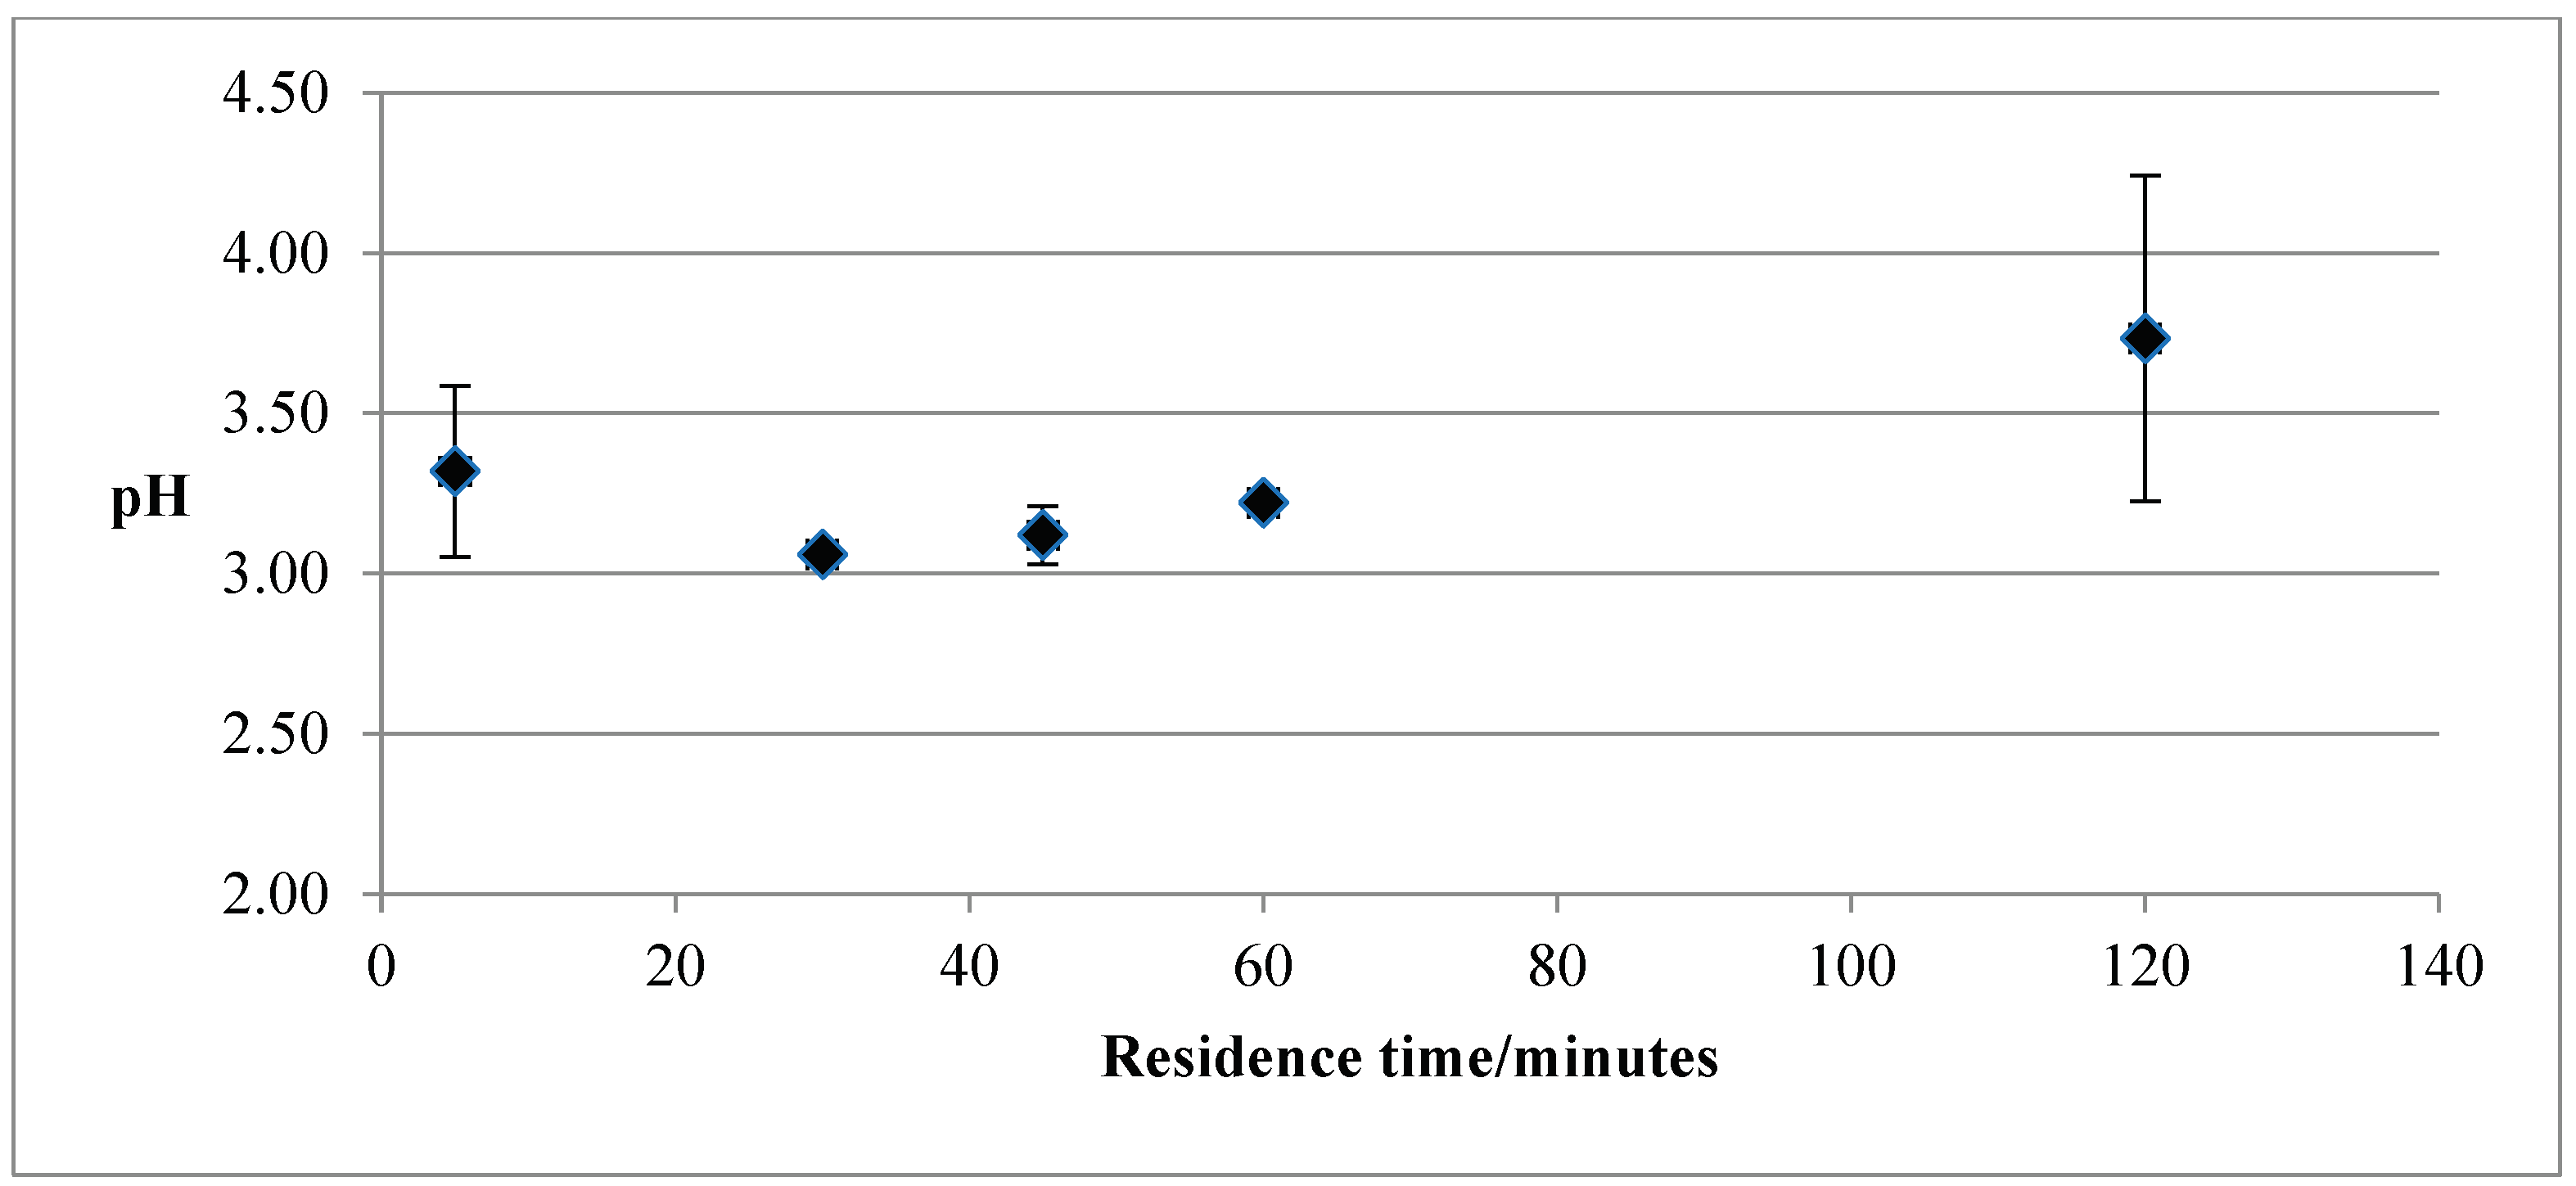
Figure 3.
Variation in pH of HTC liquor with temperature.
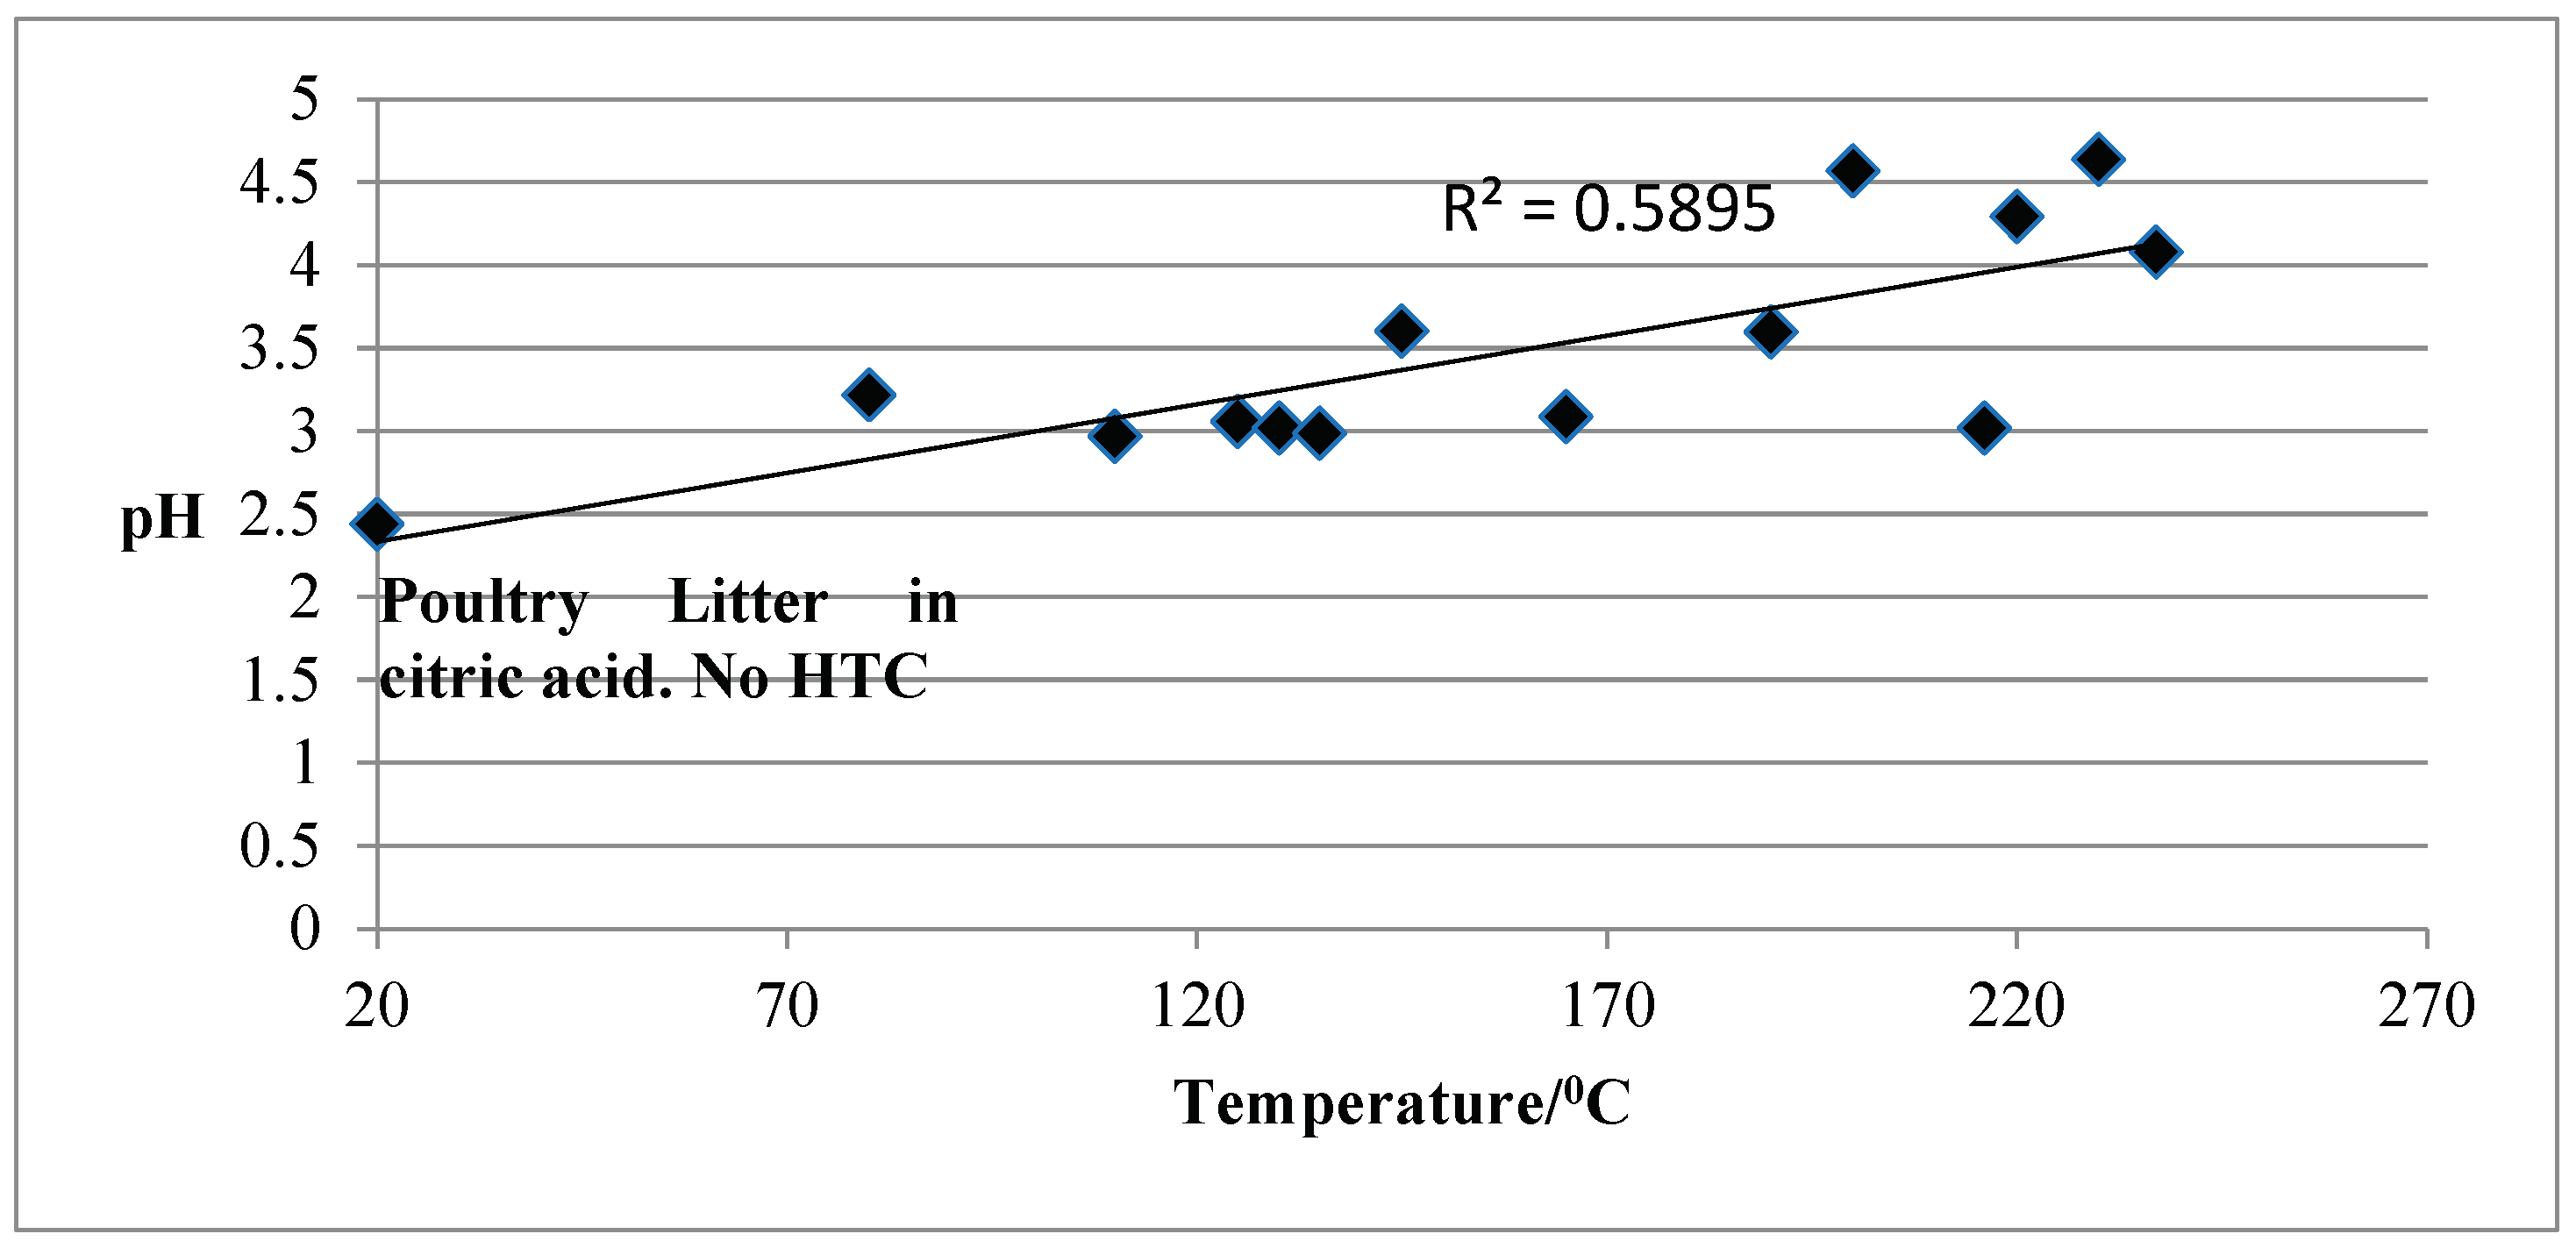
Figure 4.
SEM micrograph of a mixture of chars obtained by HTC at 120°C, but with different residence times.
Figure 4.
SEM micrograph of a mixture of chars obtained by HTC at 120°C, but with different residence times.
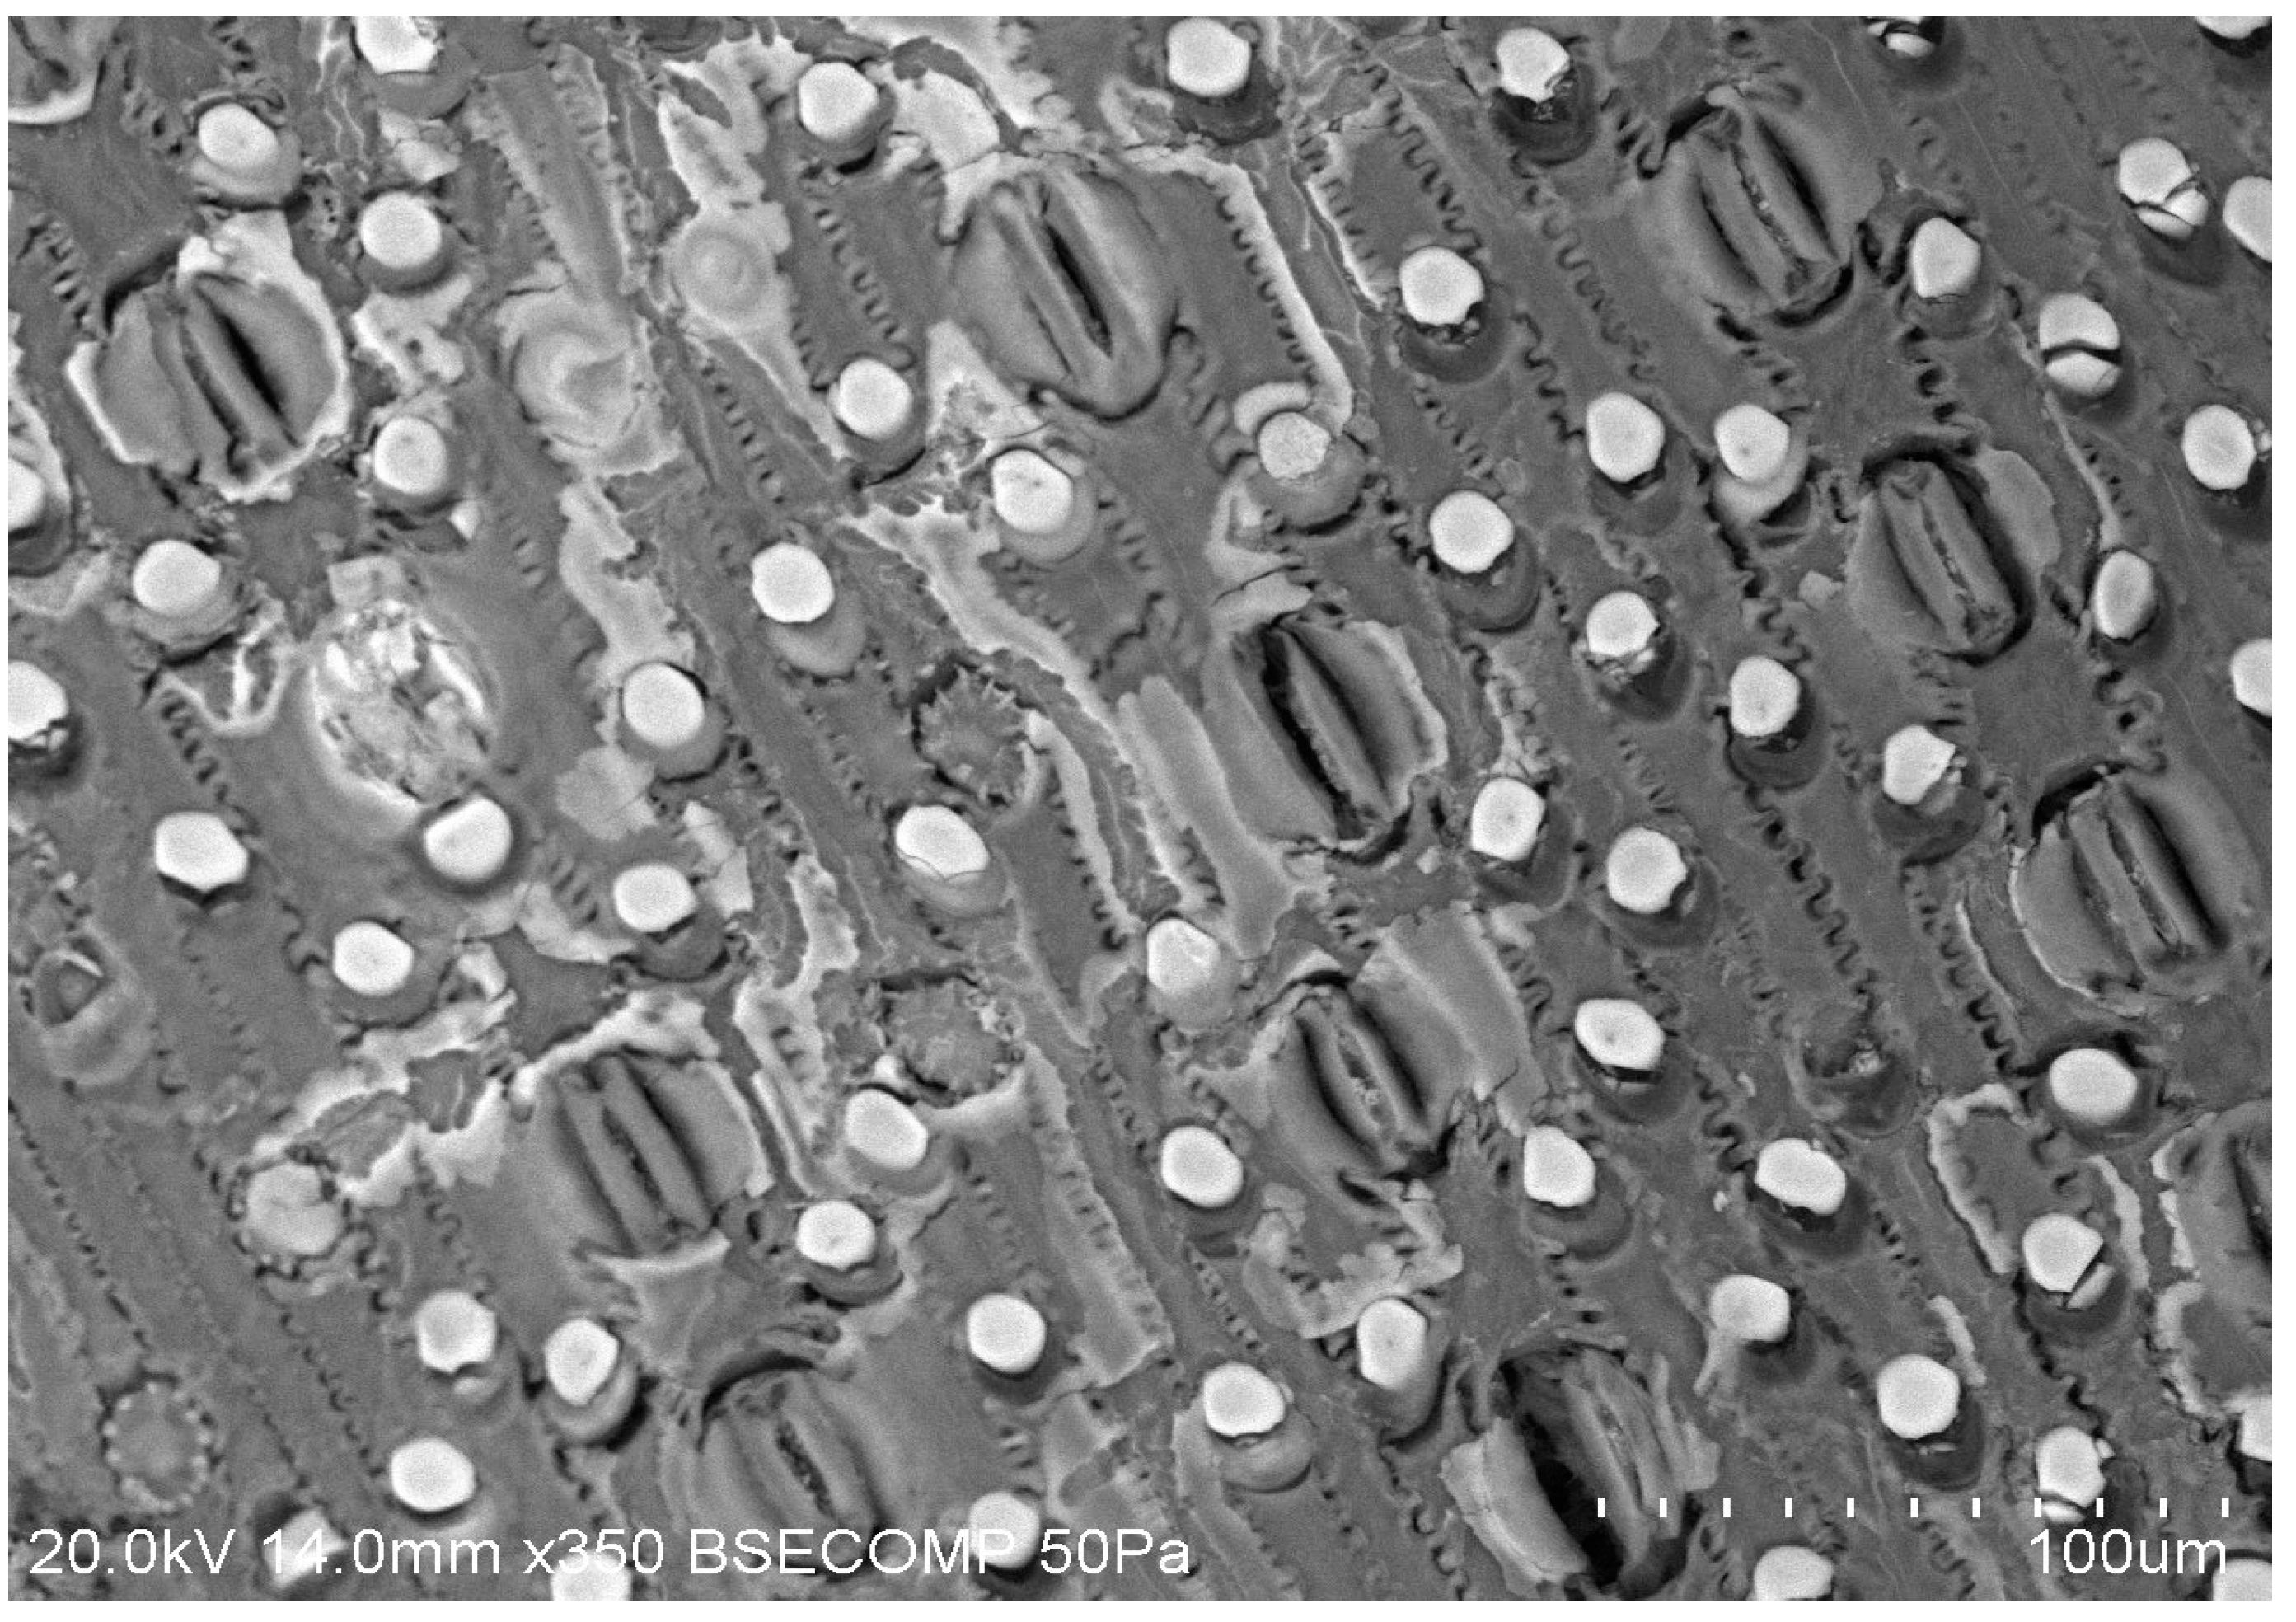
Figure 5.
SEM micrograph showing the round structures present in HTC mixture of chars’ sample.
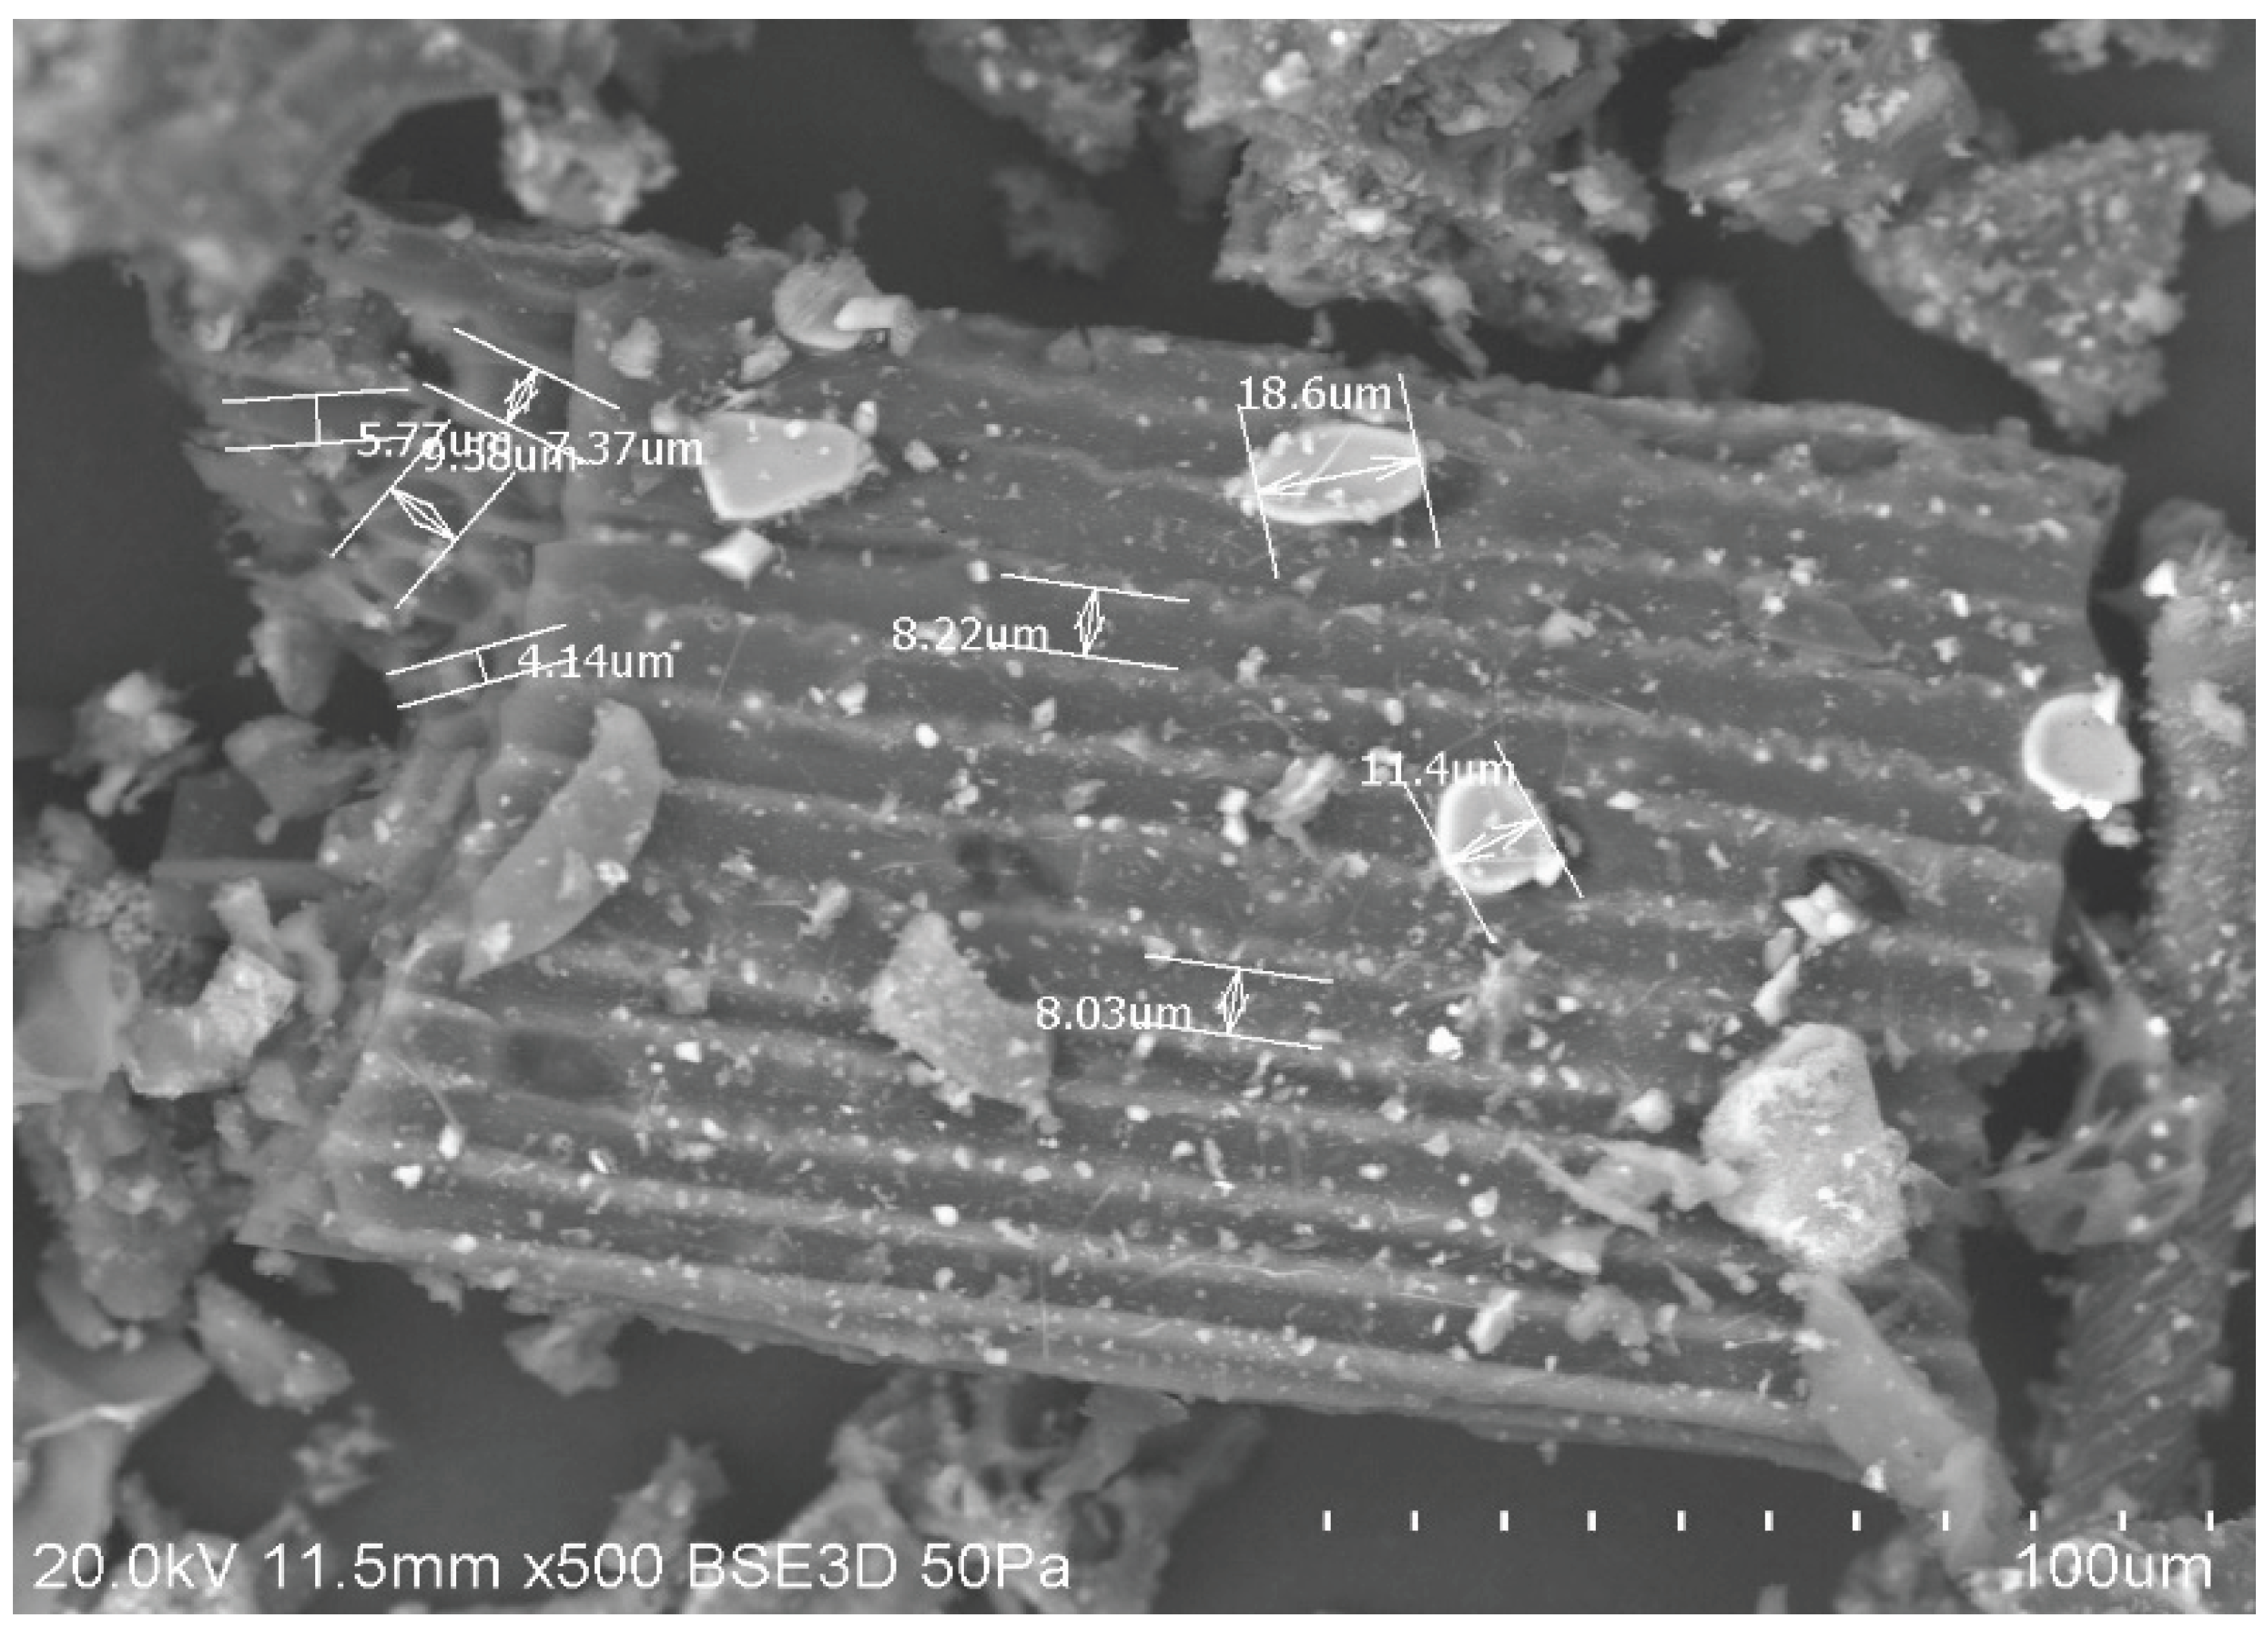
Figure 6.
SEM/ EDX results on TOR 600 sample.
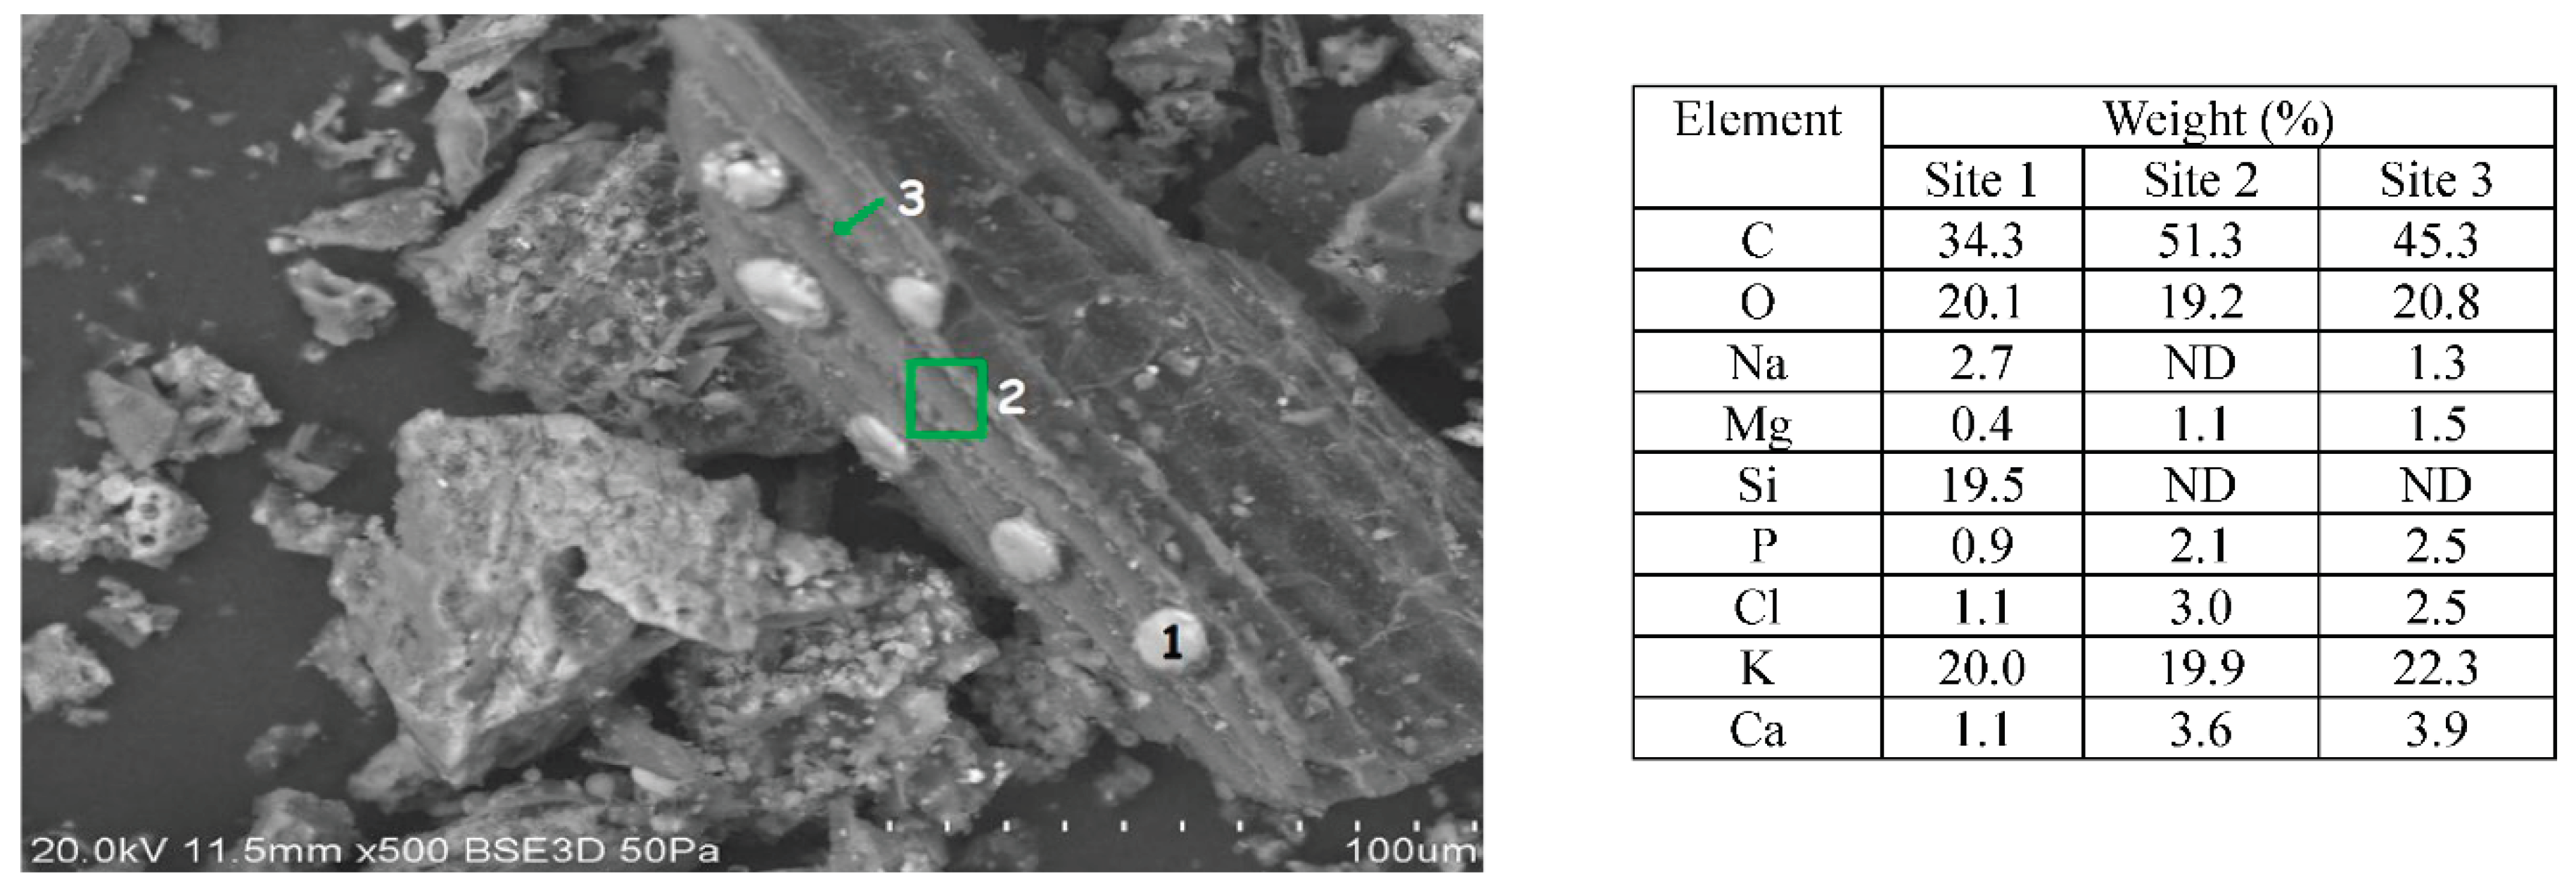
Figure 7.
SEM micrograph of PL sample.
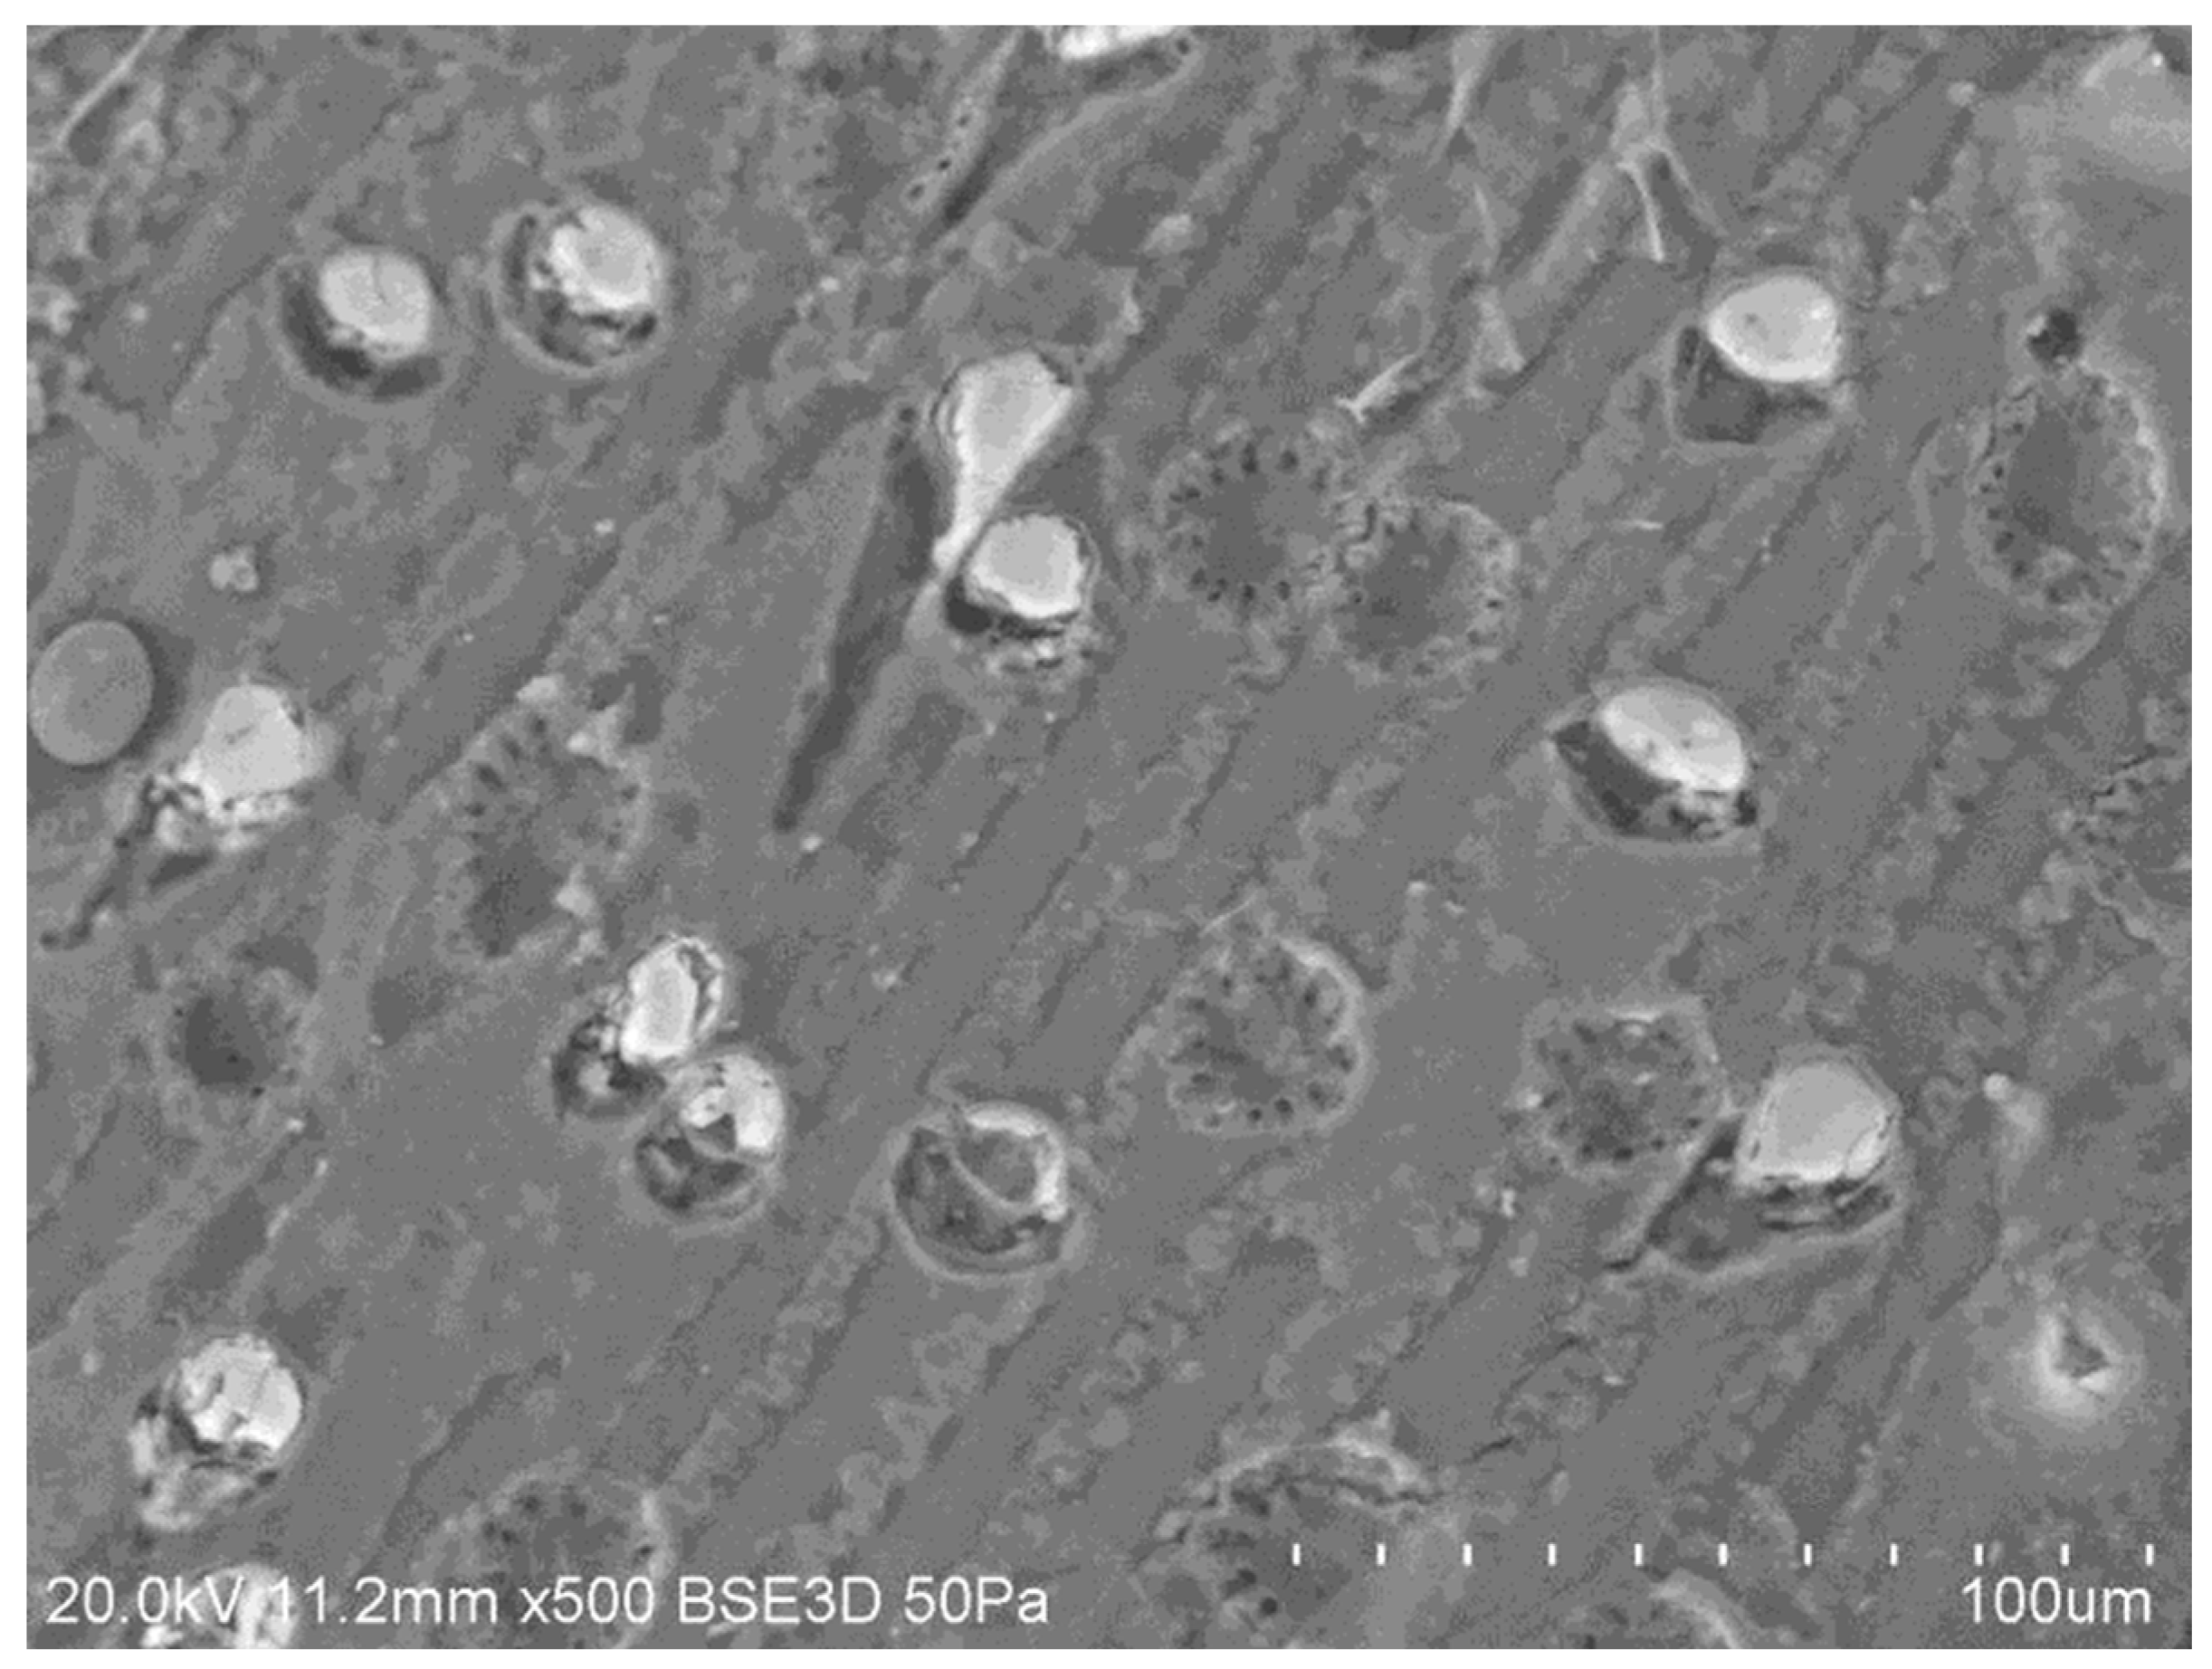
Figure 8.
SEM micrograph of phytoliths in the ash of the TOR 550 stripped sample.
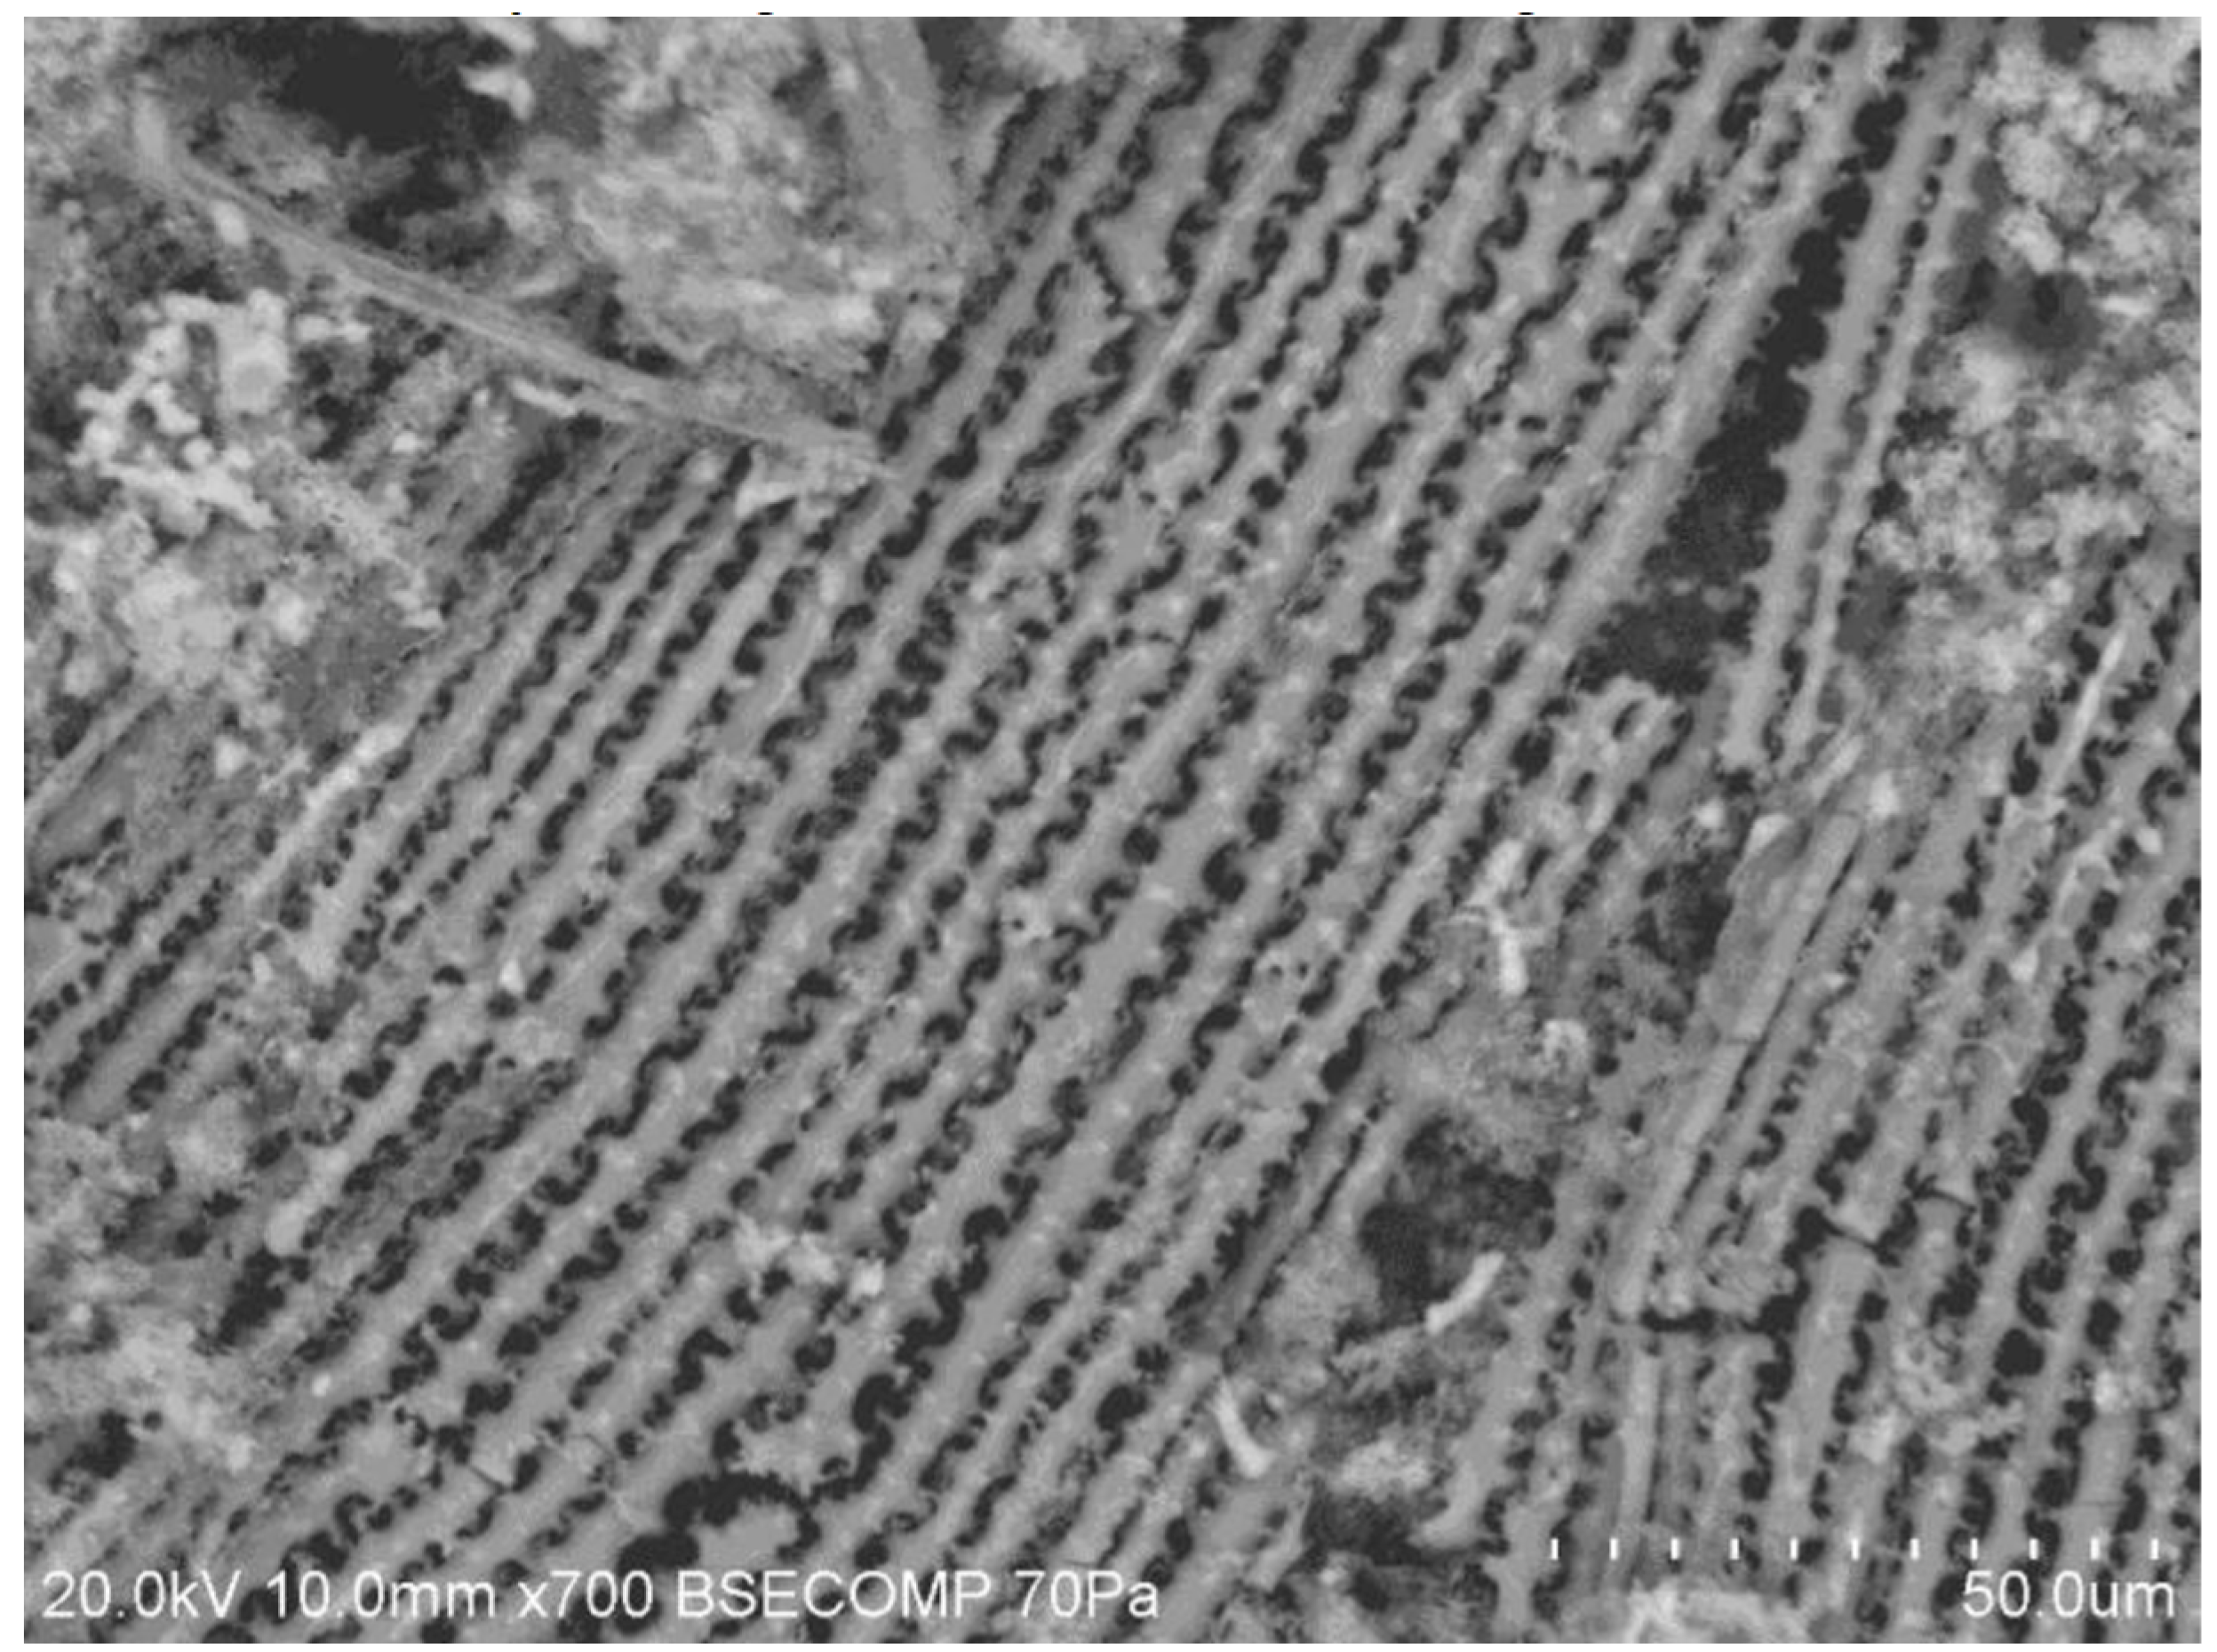
Figure 9.
SEM images of HTC 250 sample.
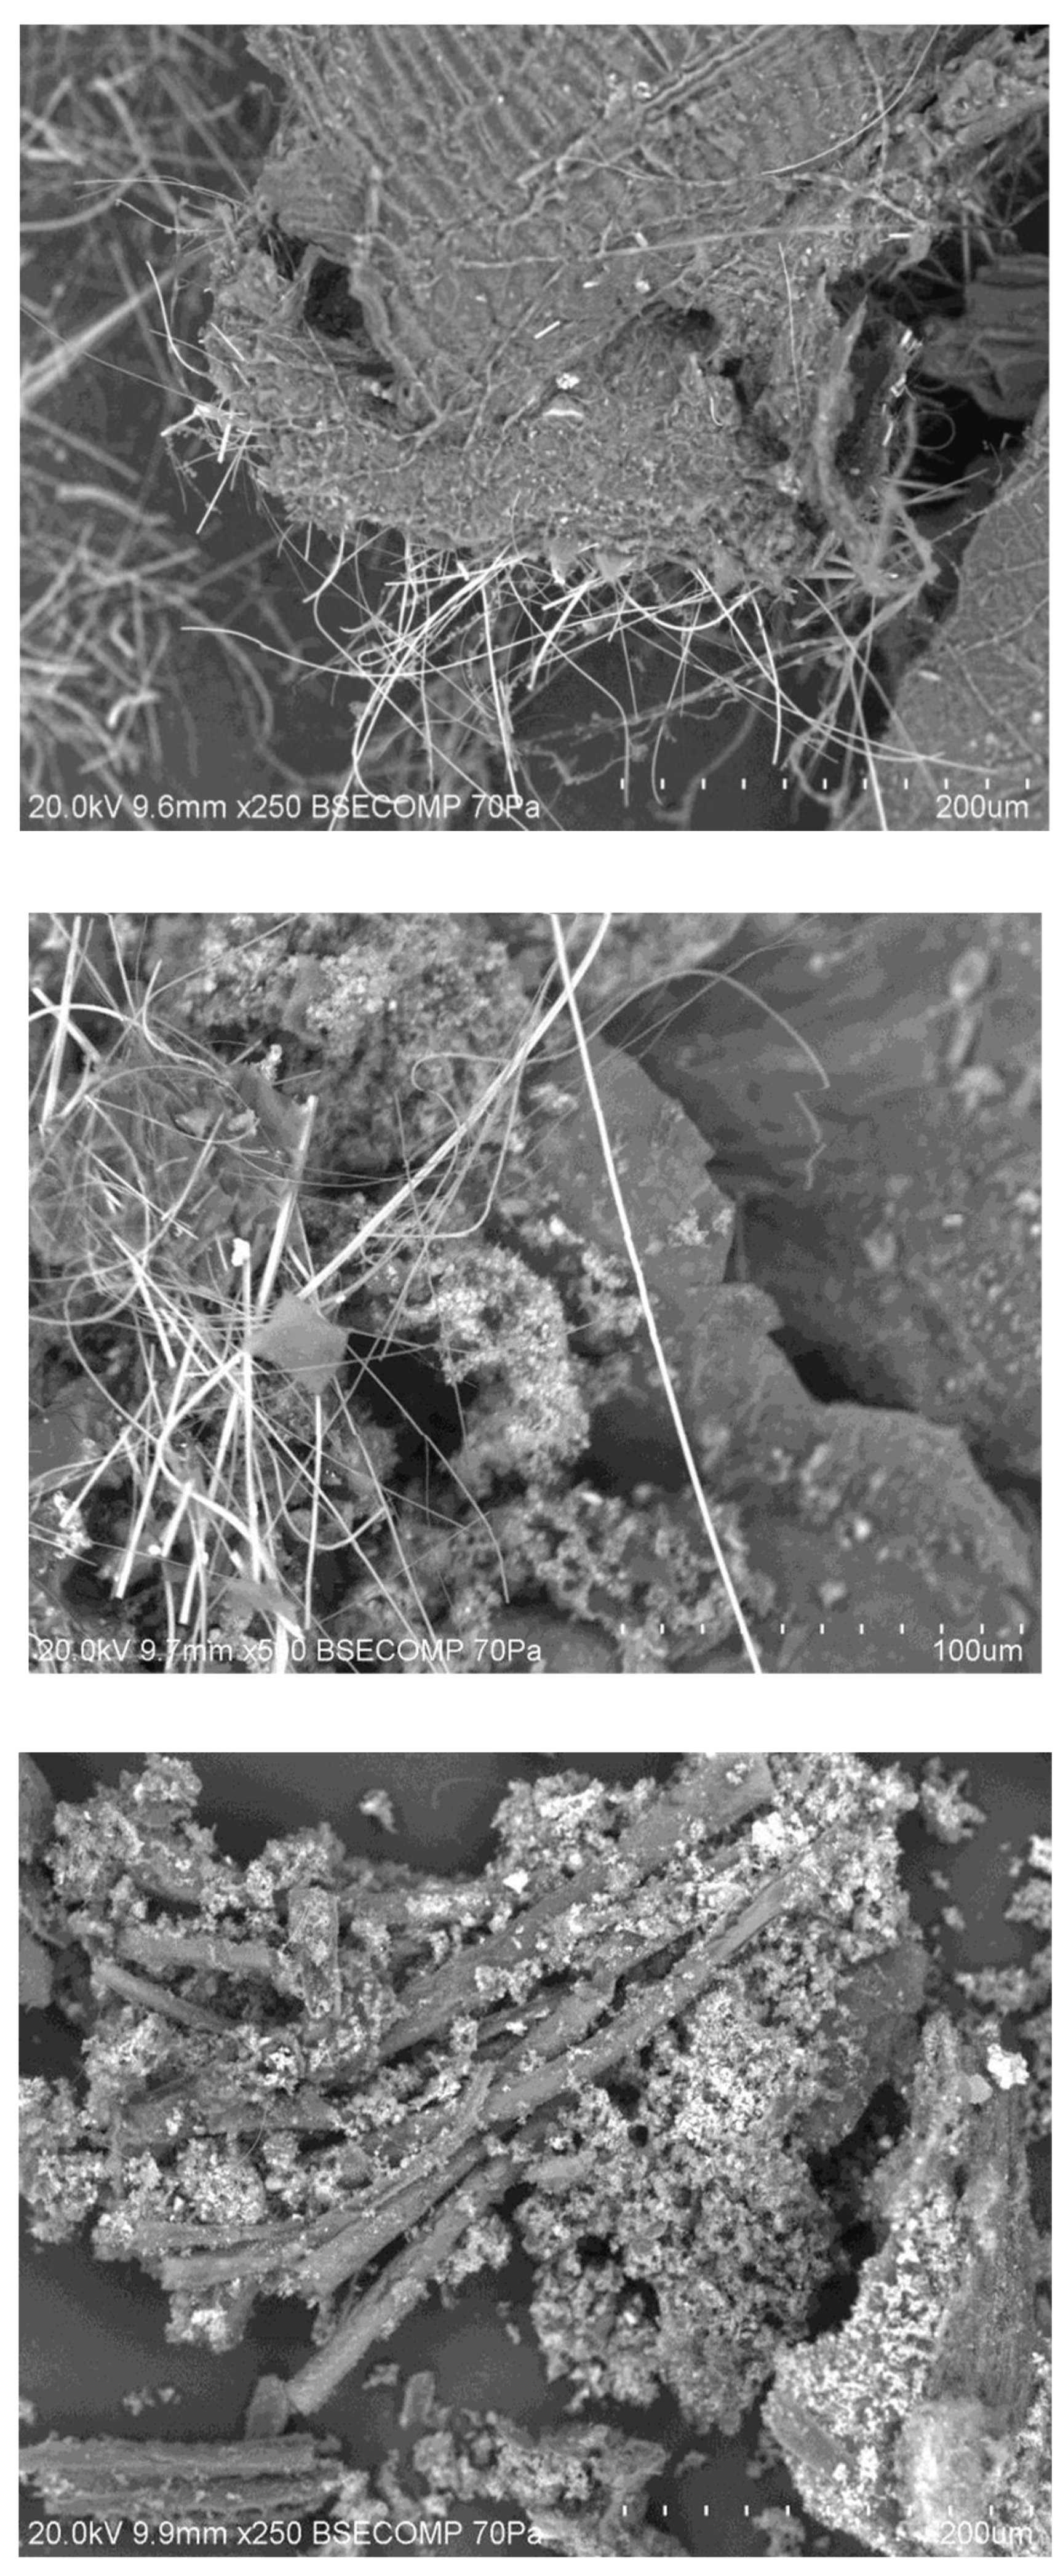
Figure 10.
SEM/EDX results on TOR 350 char sample.
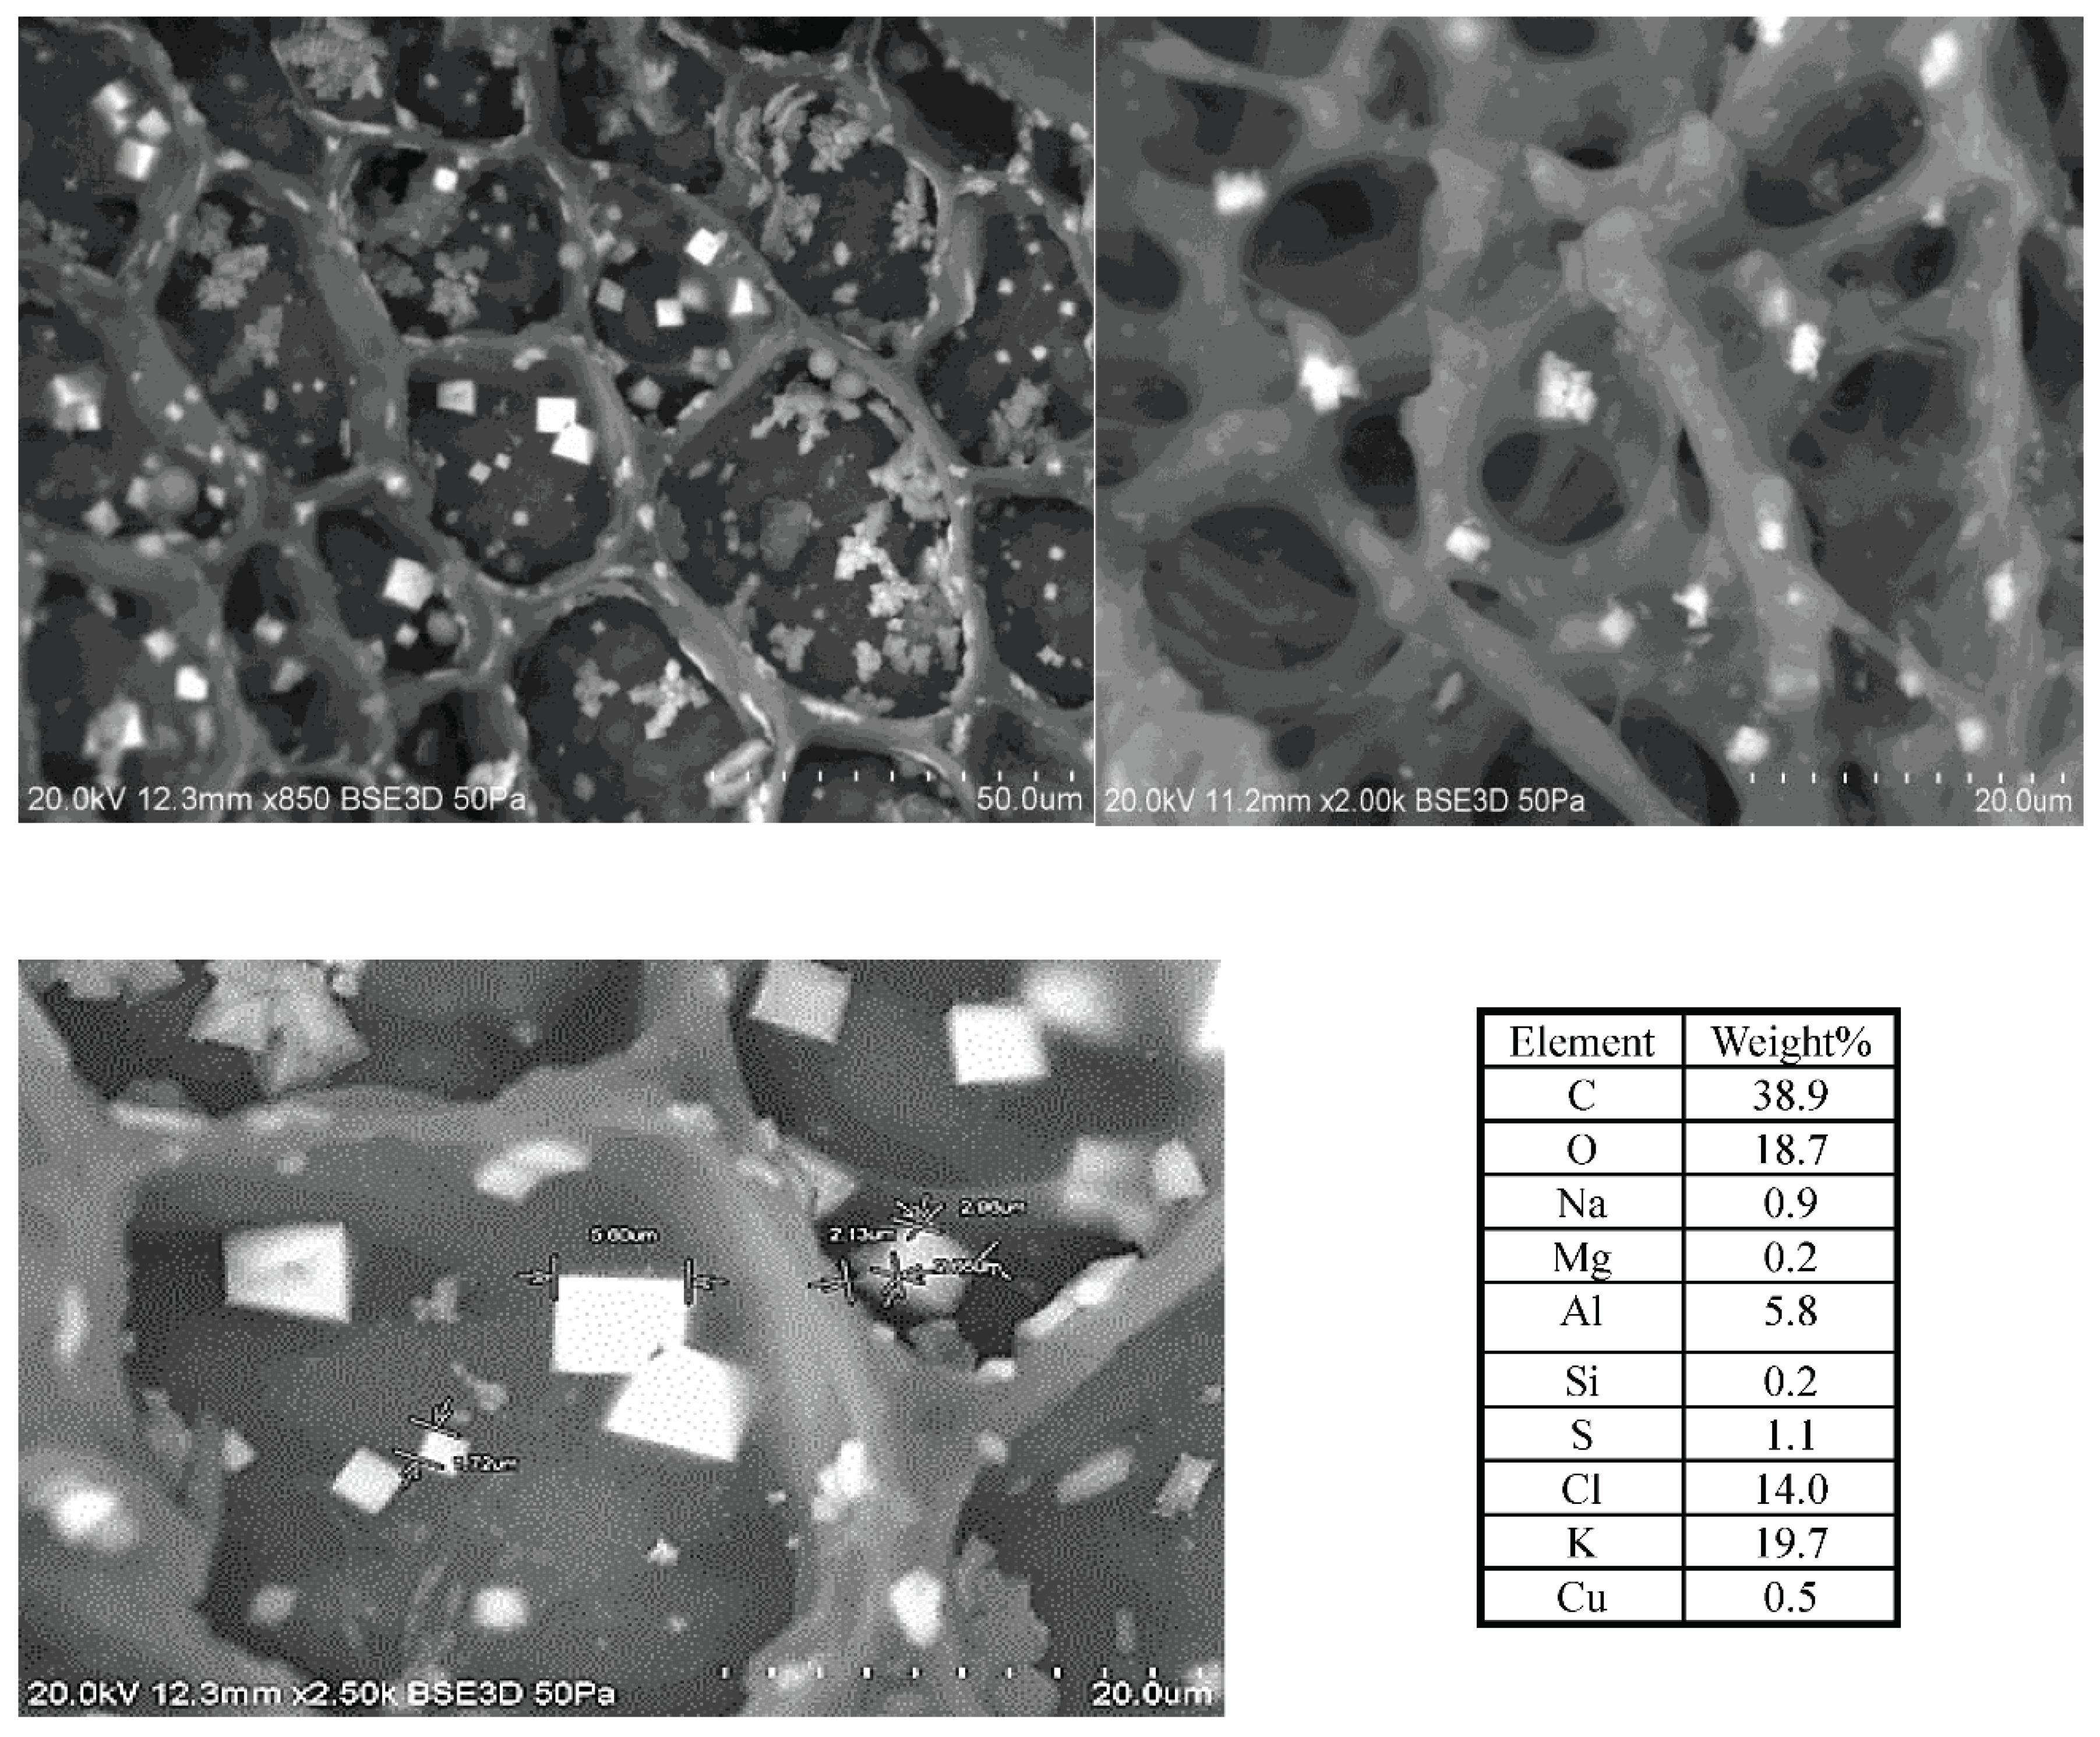
Figure 11.
SEM/EDX results on TOR 450 char sample.
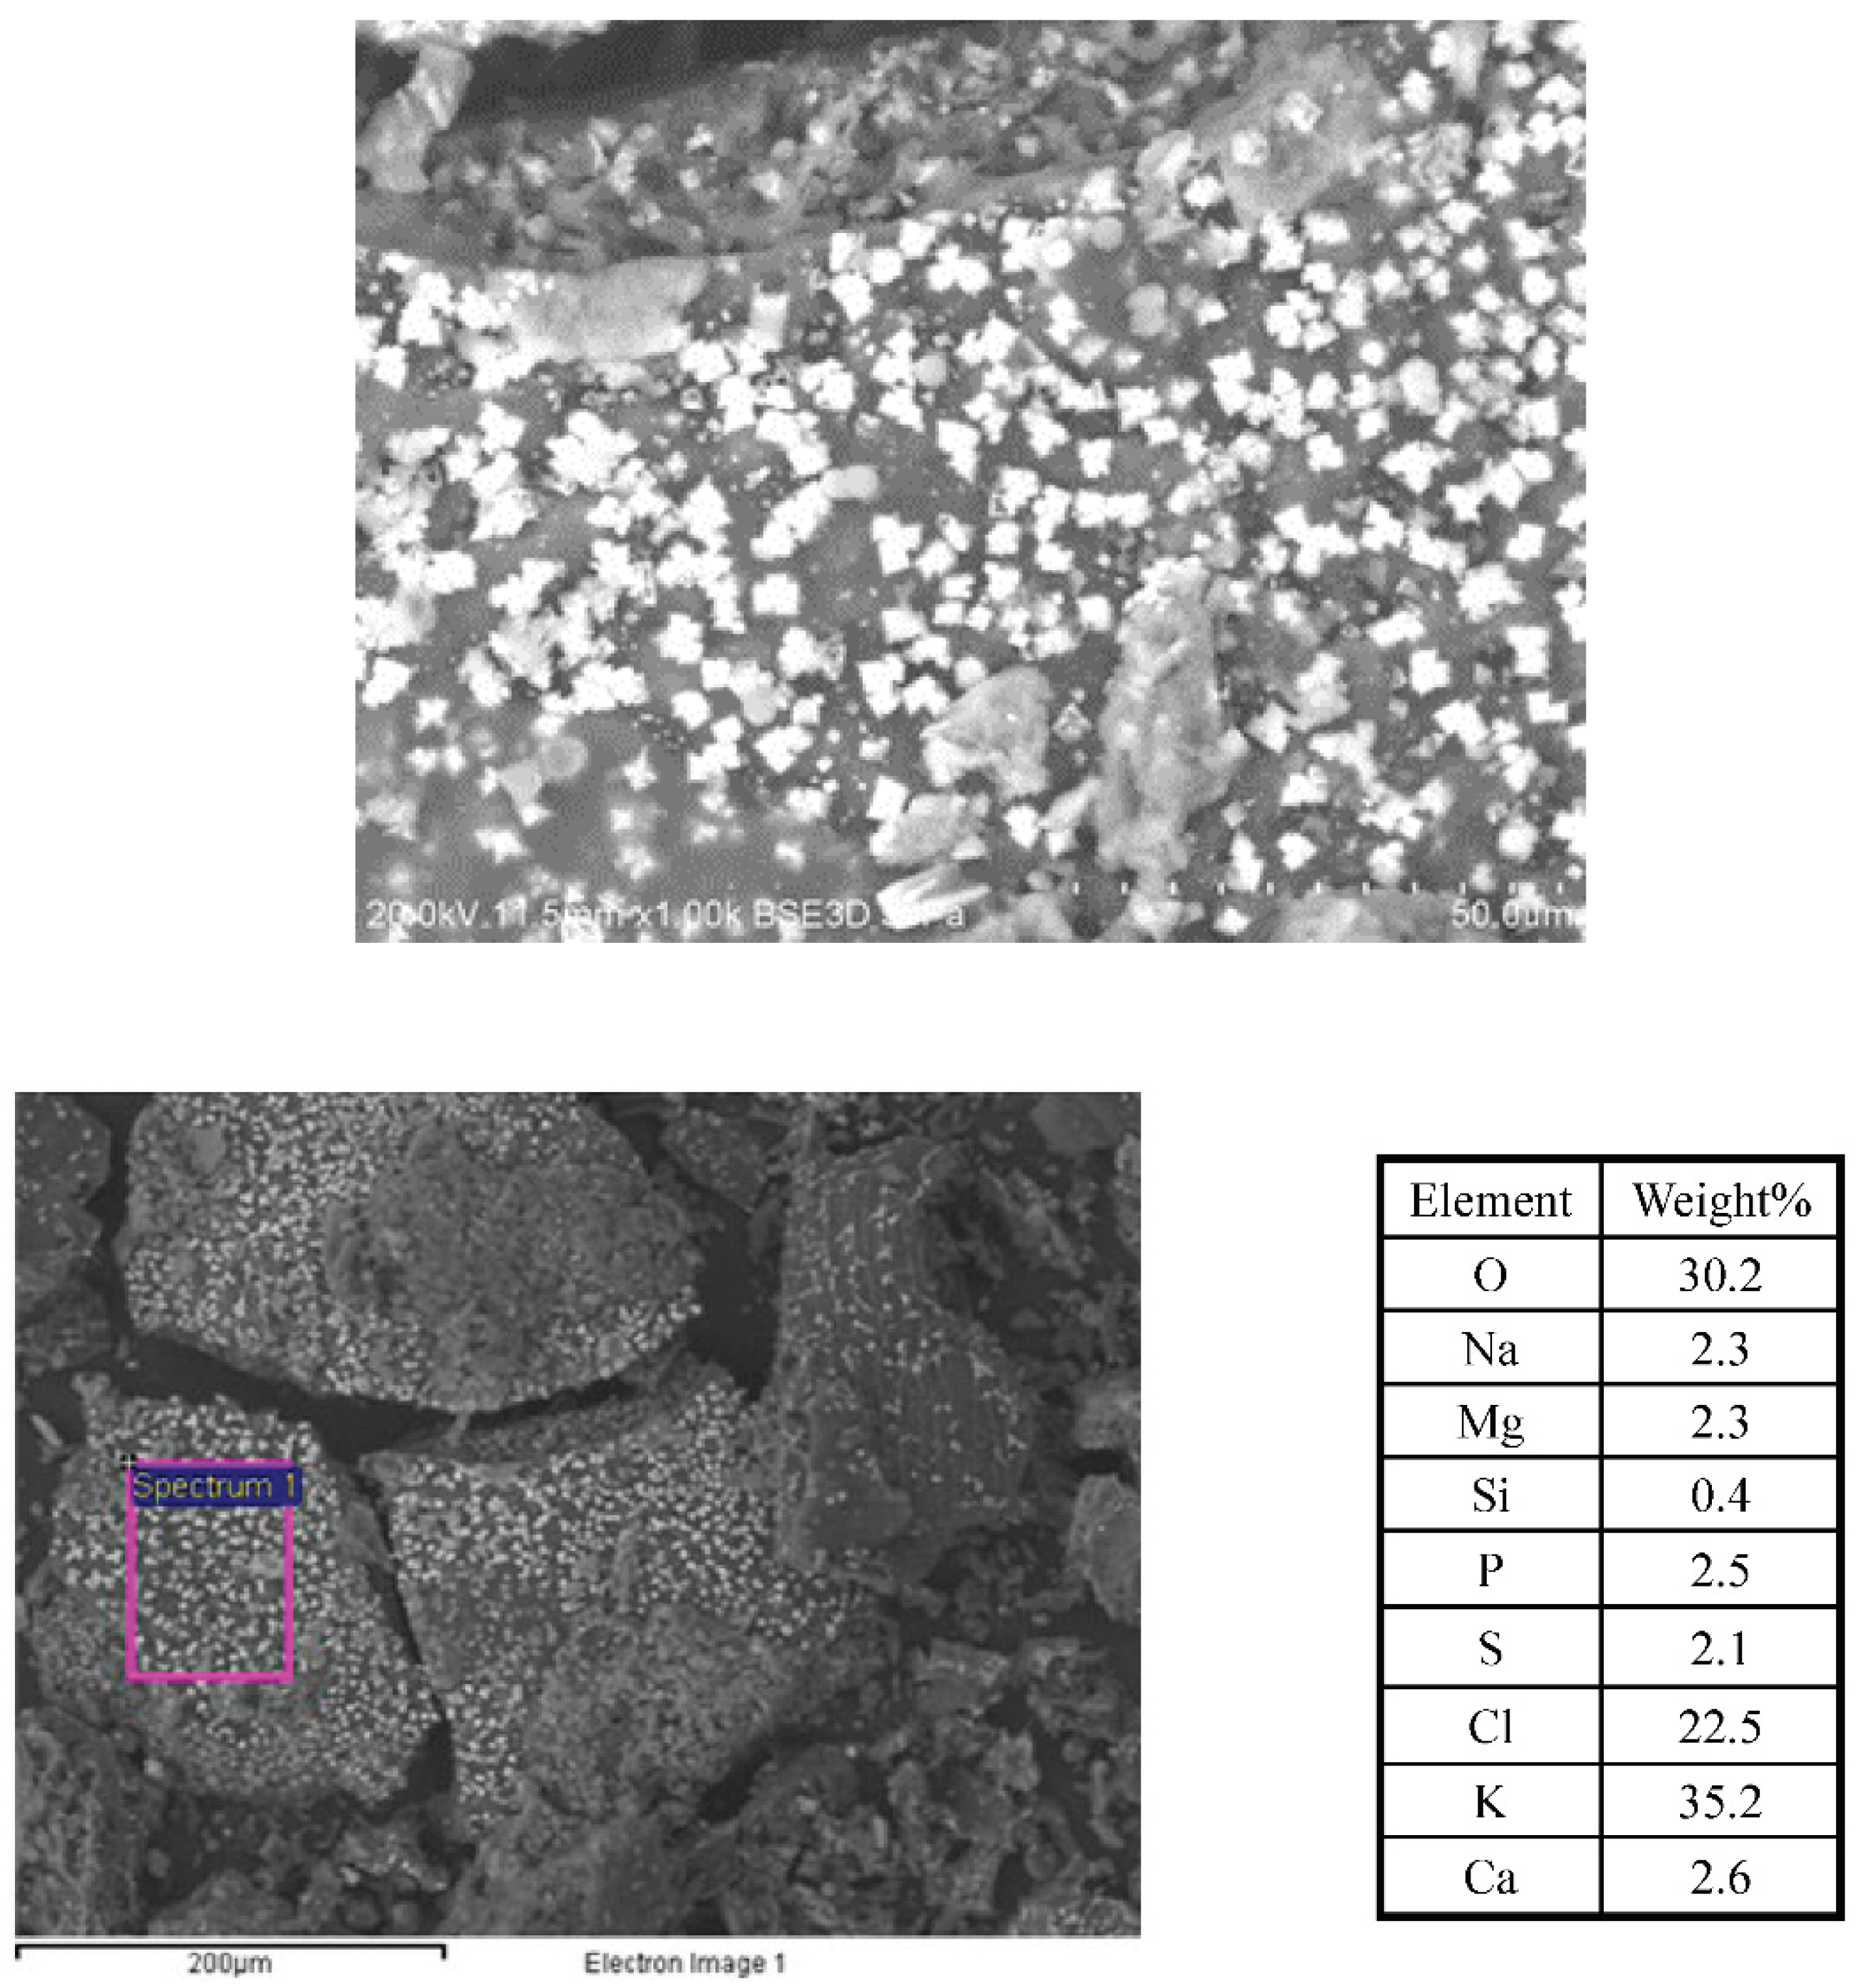
Figure 12.
SEM/EDX results on TOR 550 char sample.
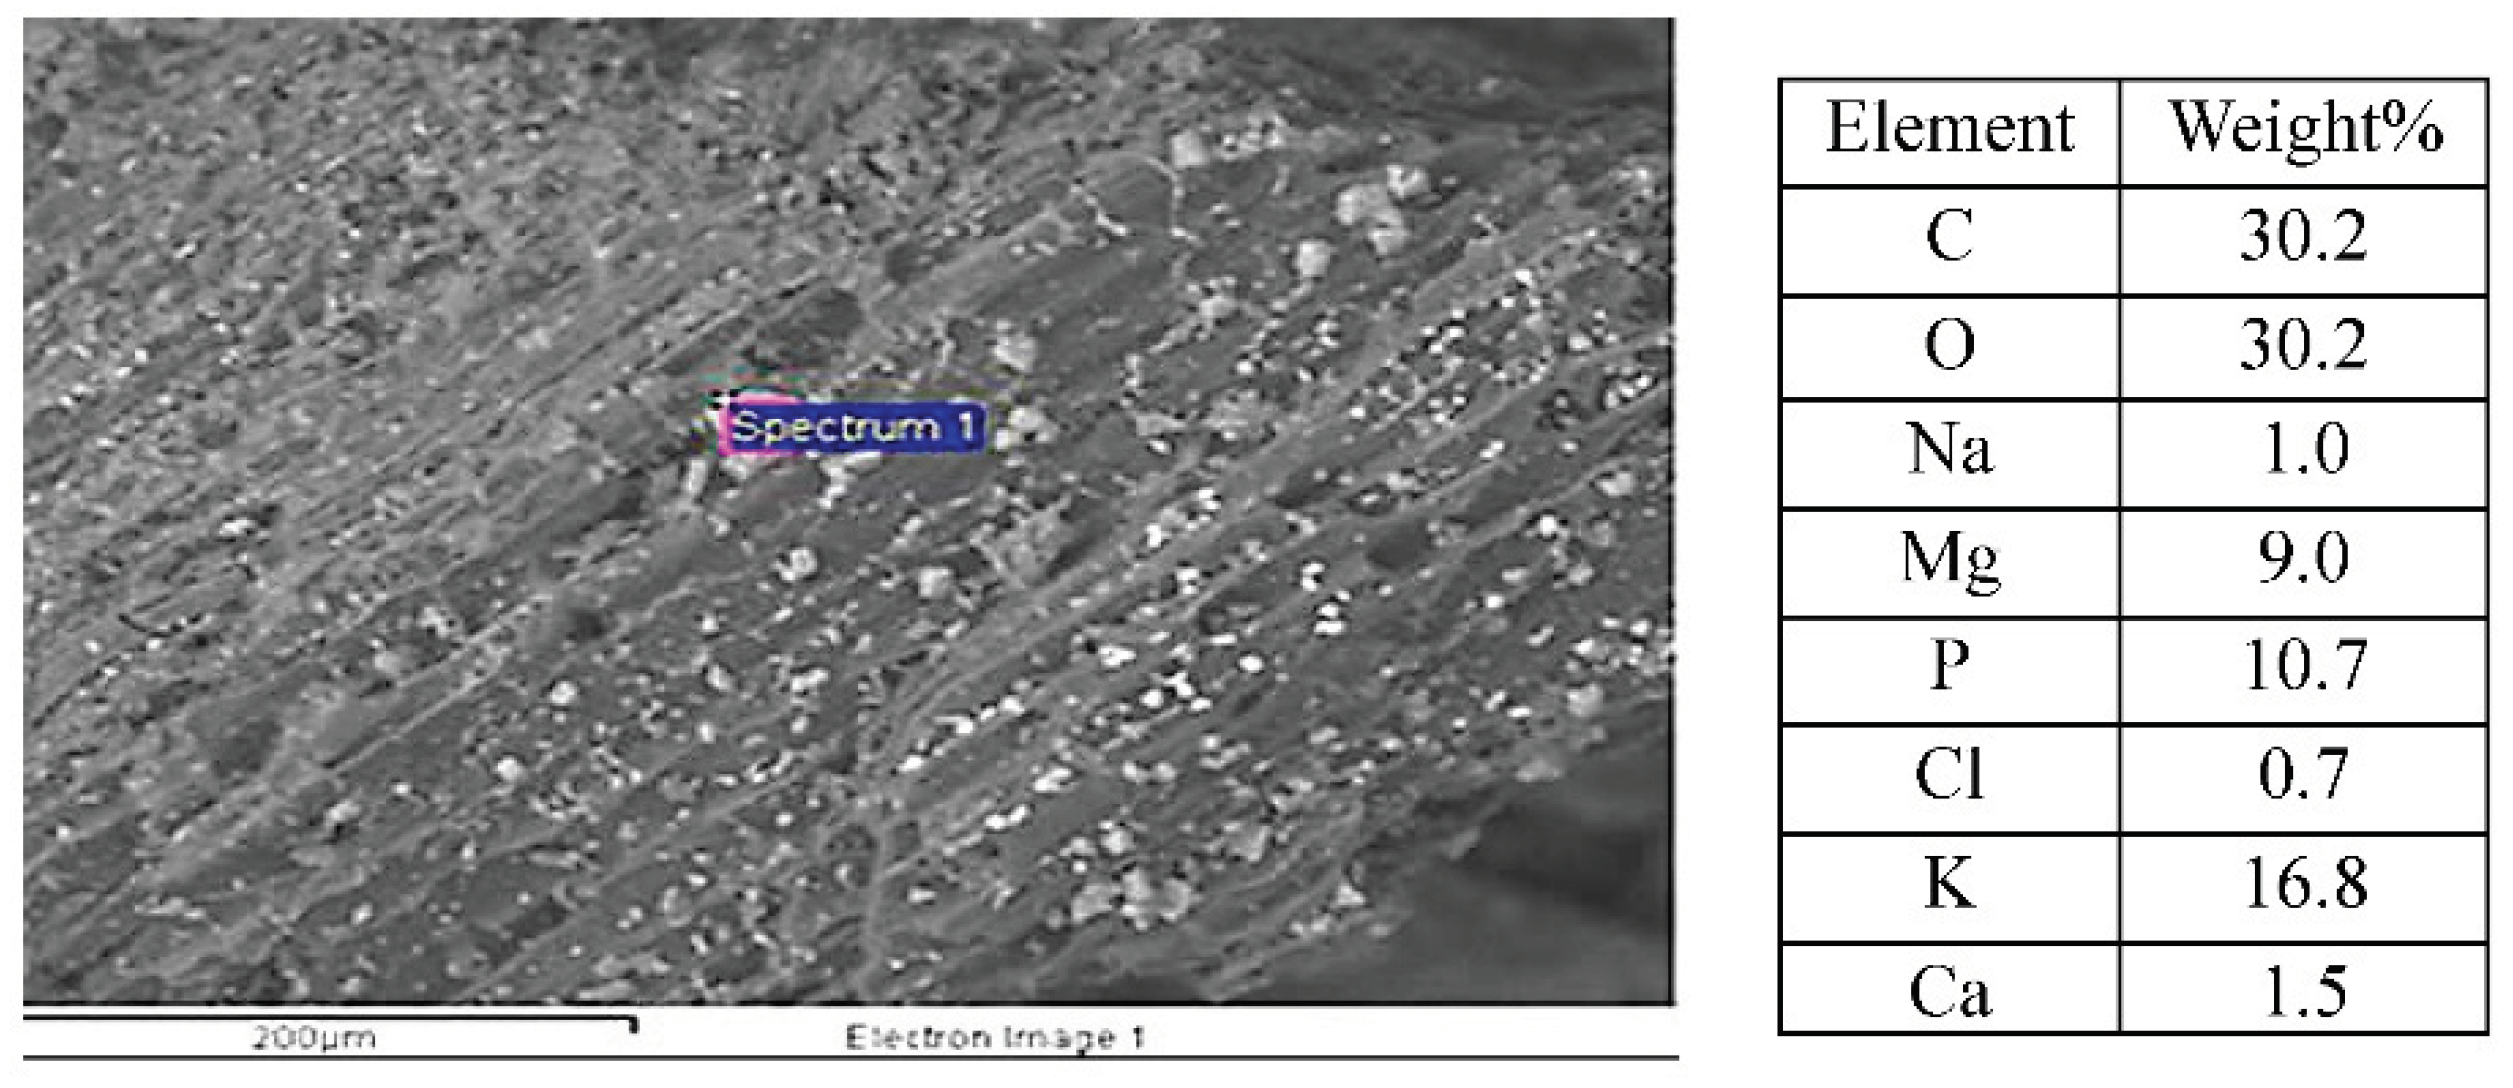
Figure 13.
Wide-angle XRD for the TOR 350, TOR 450 and TOR 550 char sample, respectively.
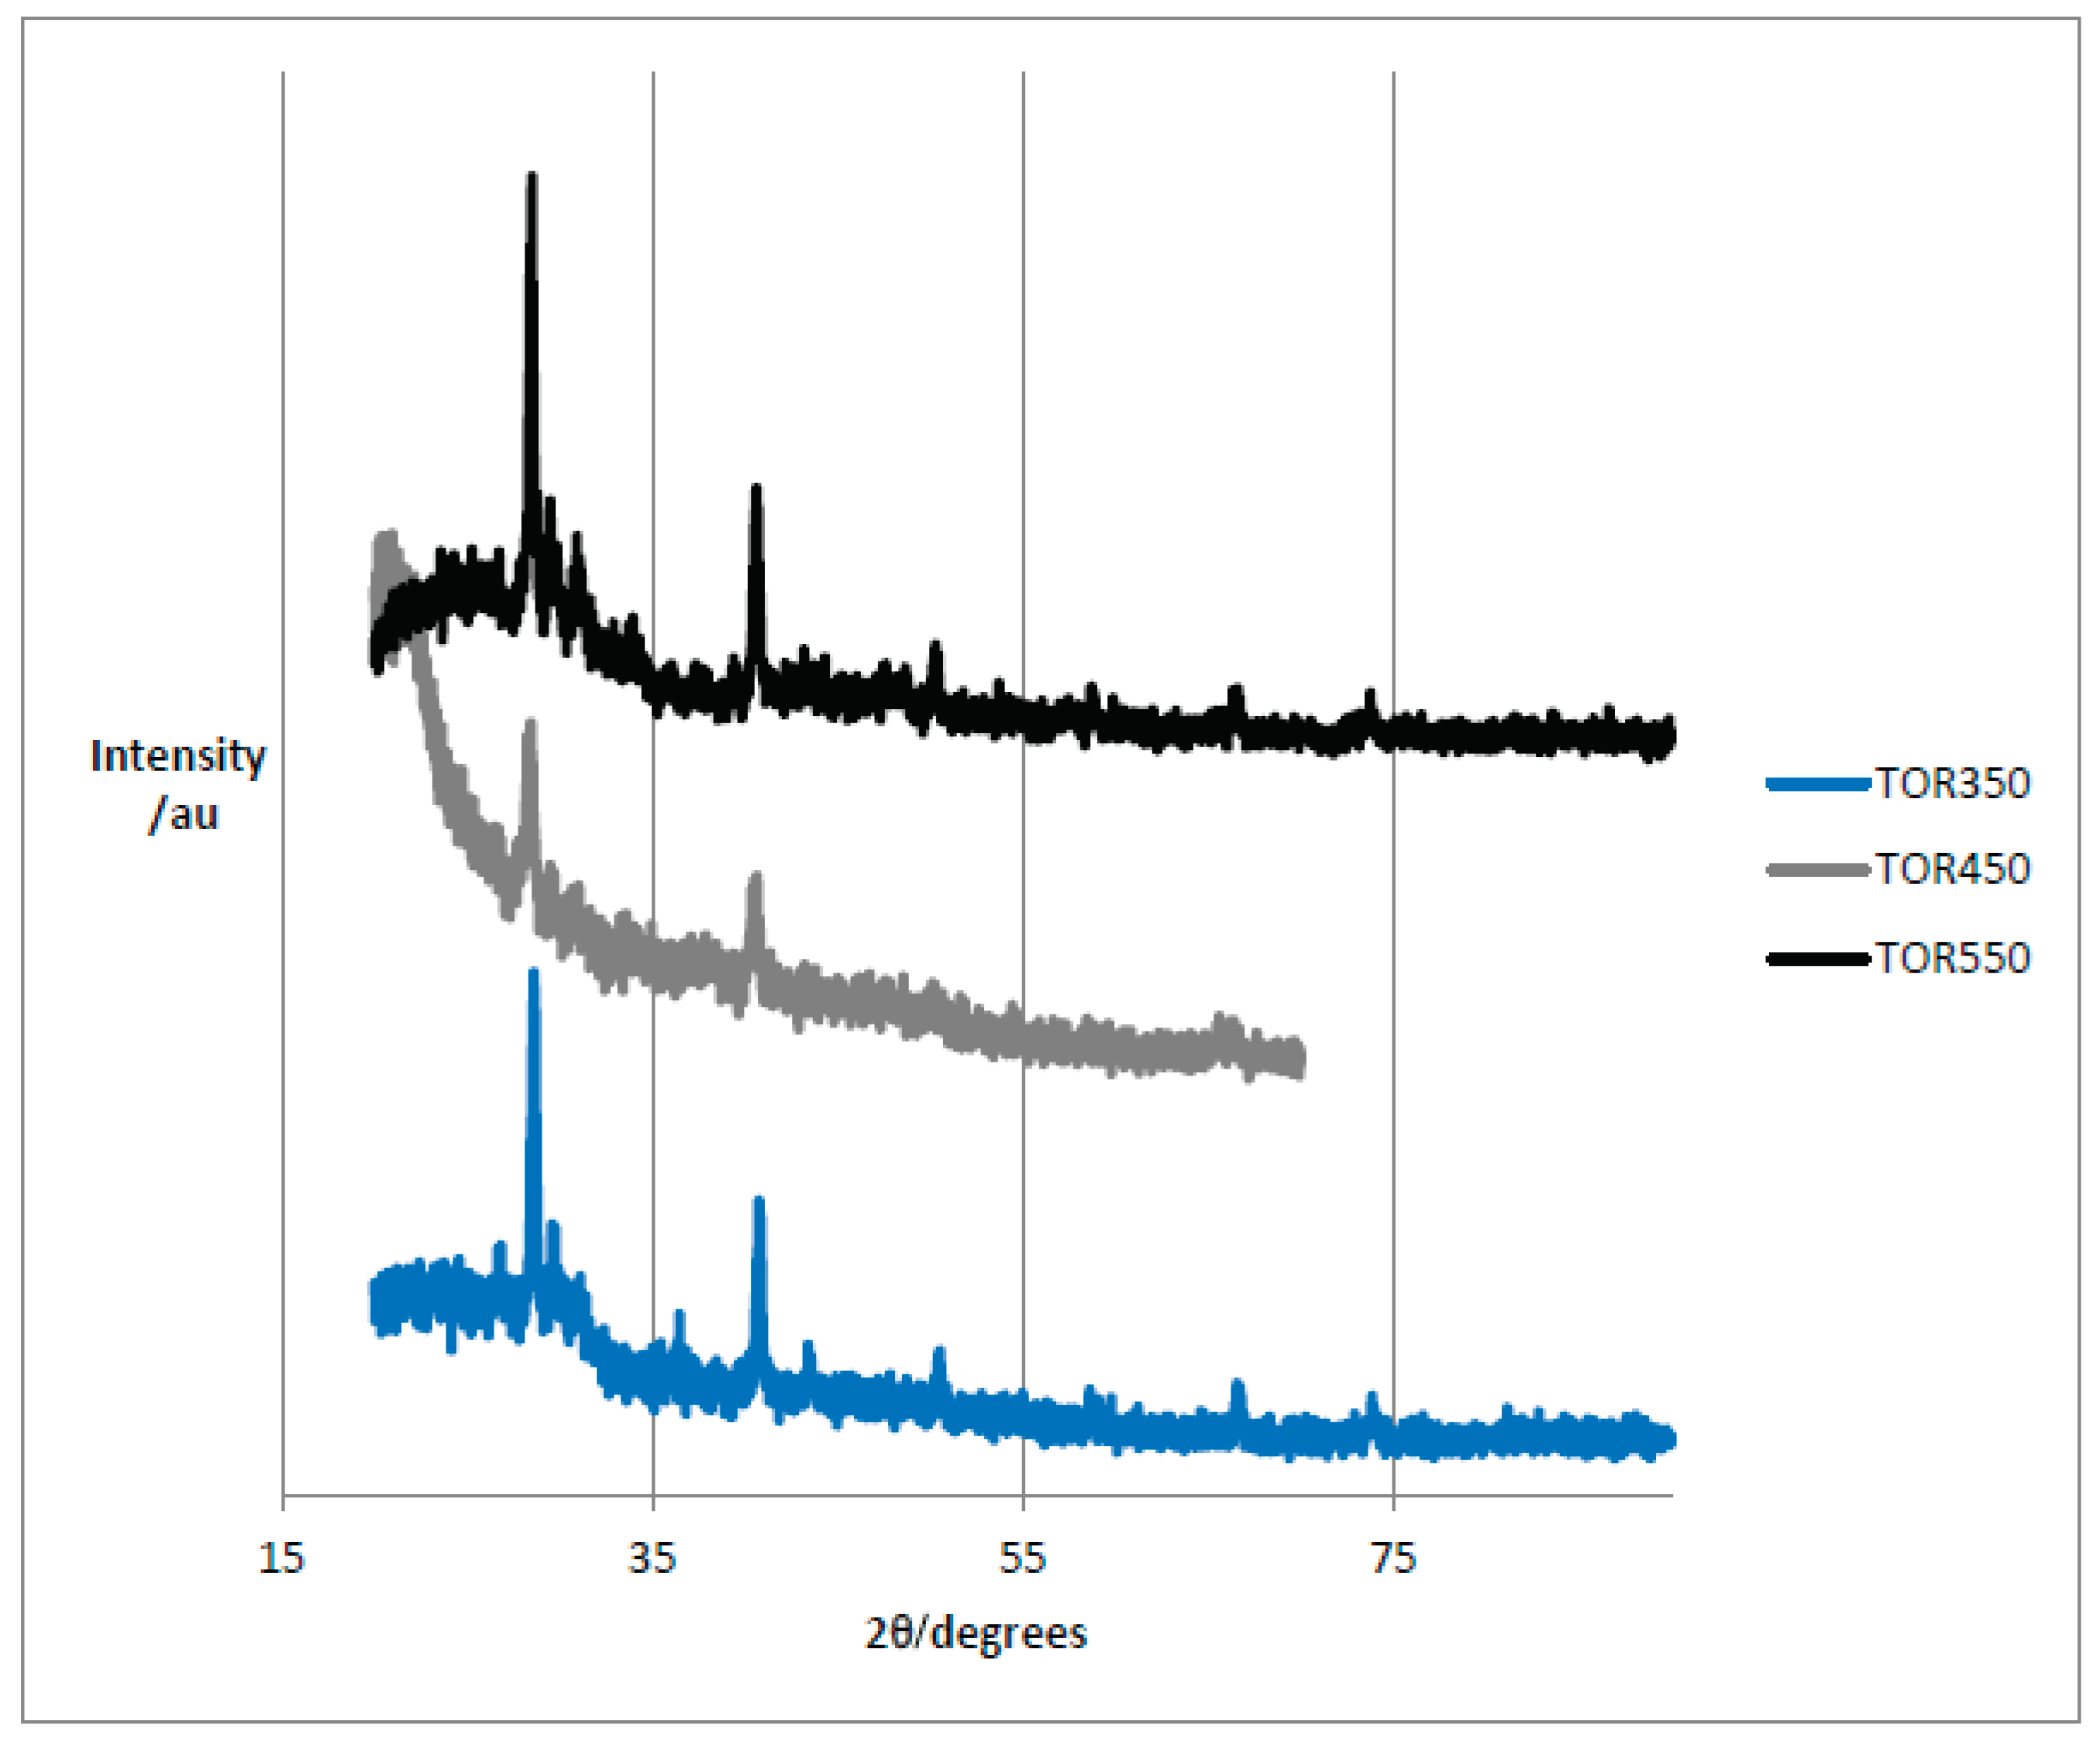
Figure 14.
SEM/ EDX results on TF 275 char sample.
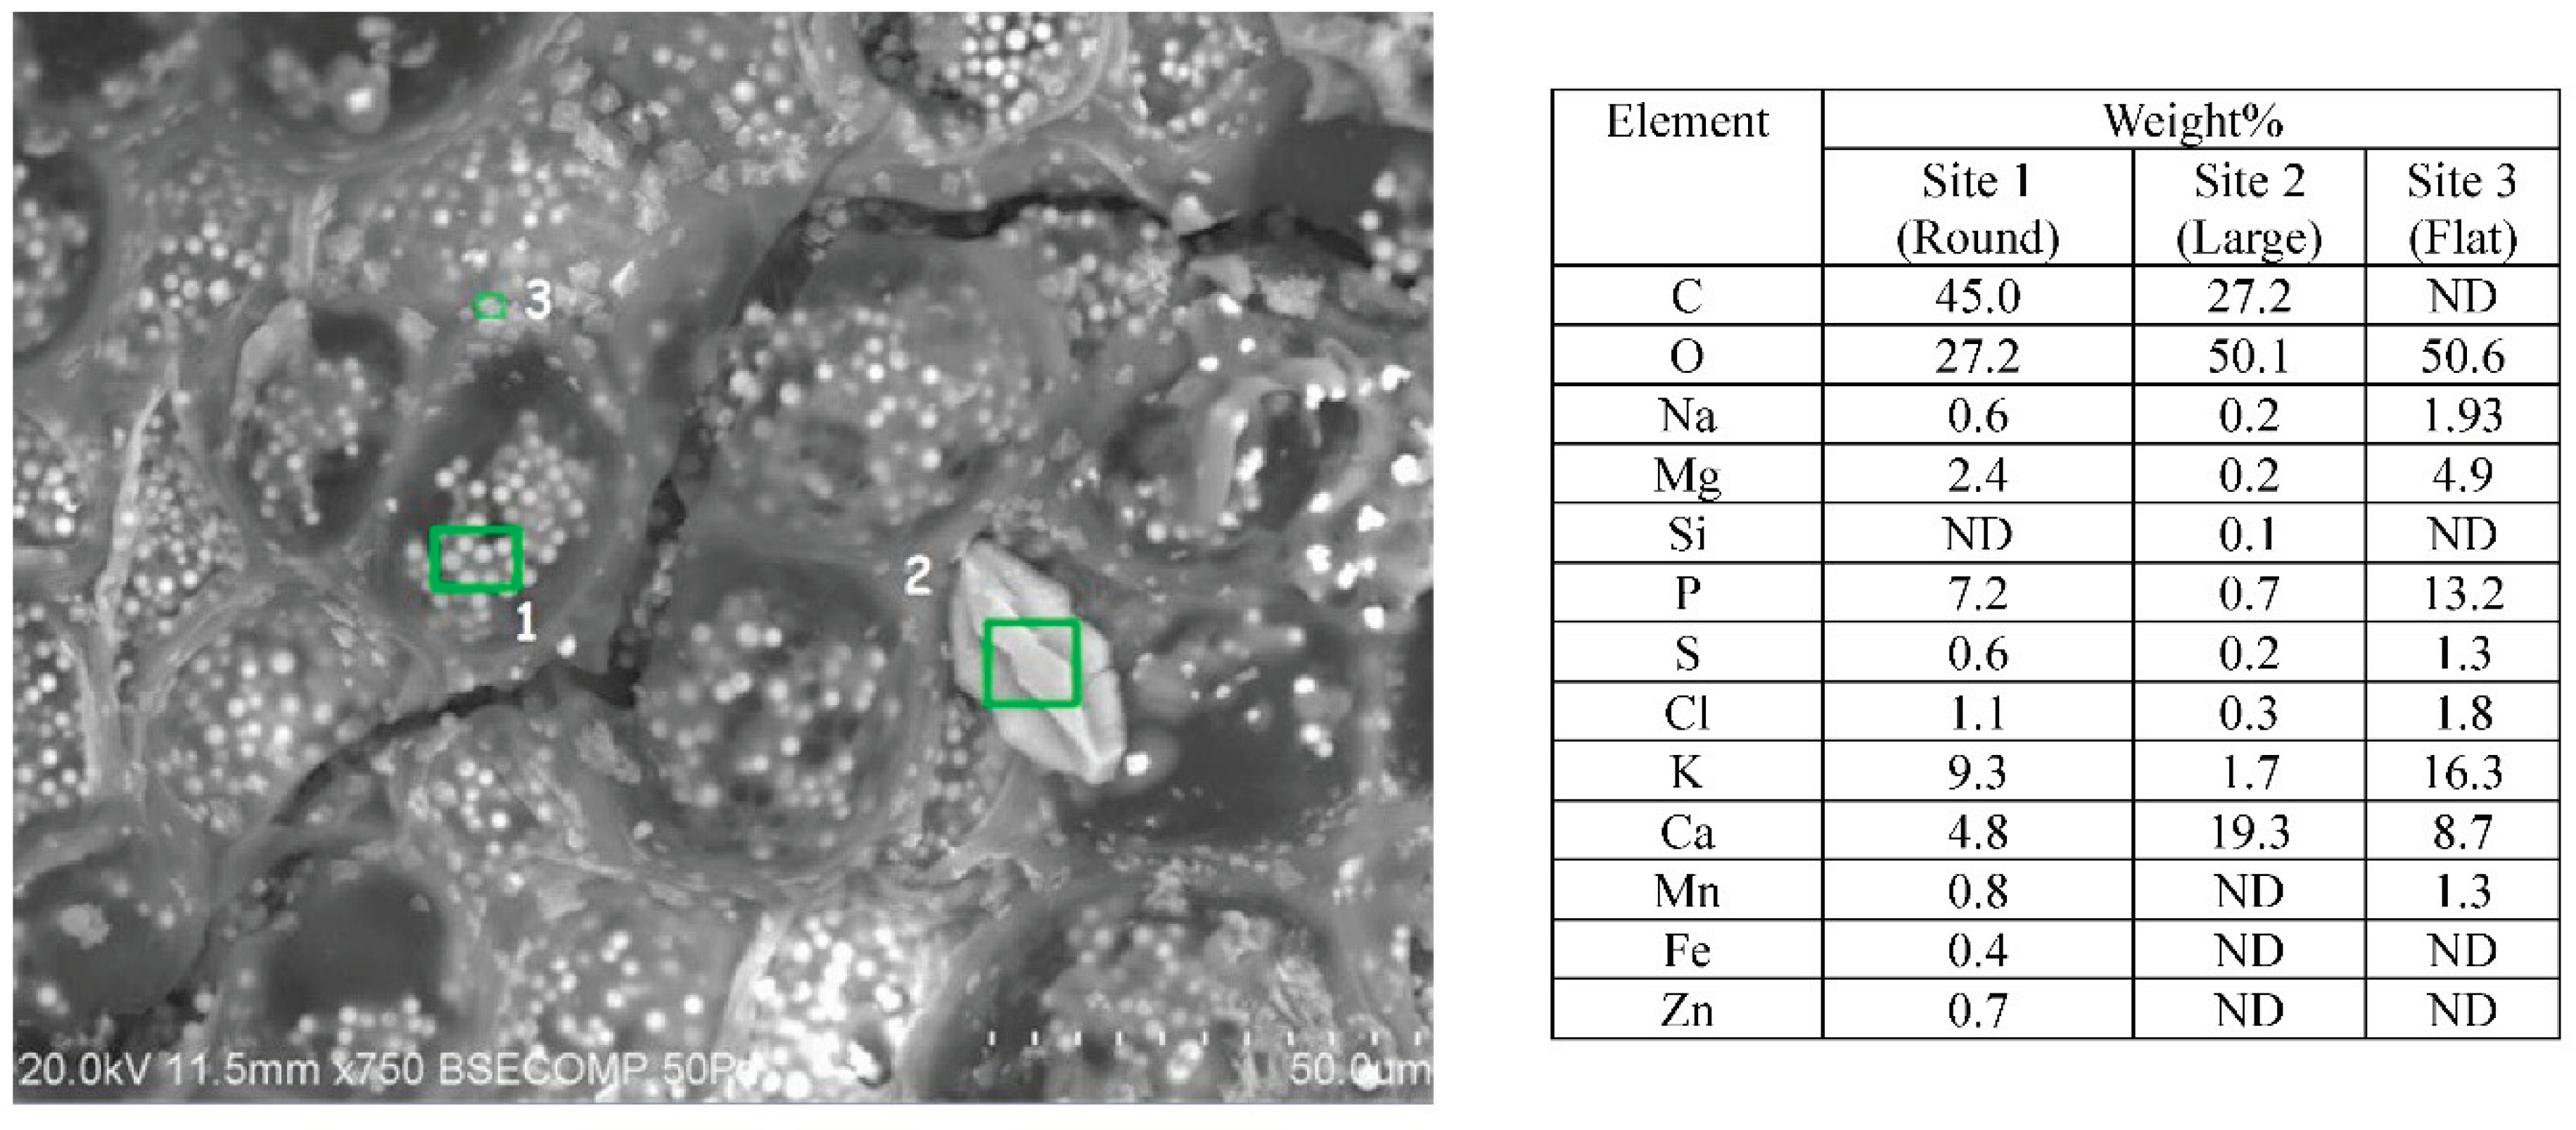
Figure 15.
SEM/EDX results on TF 350 char sample.
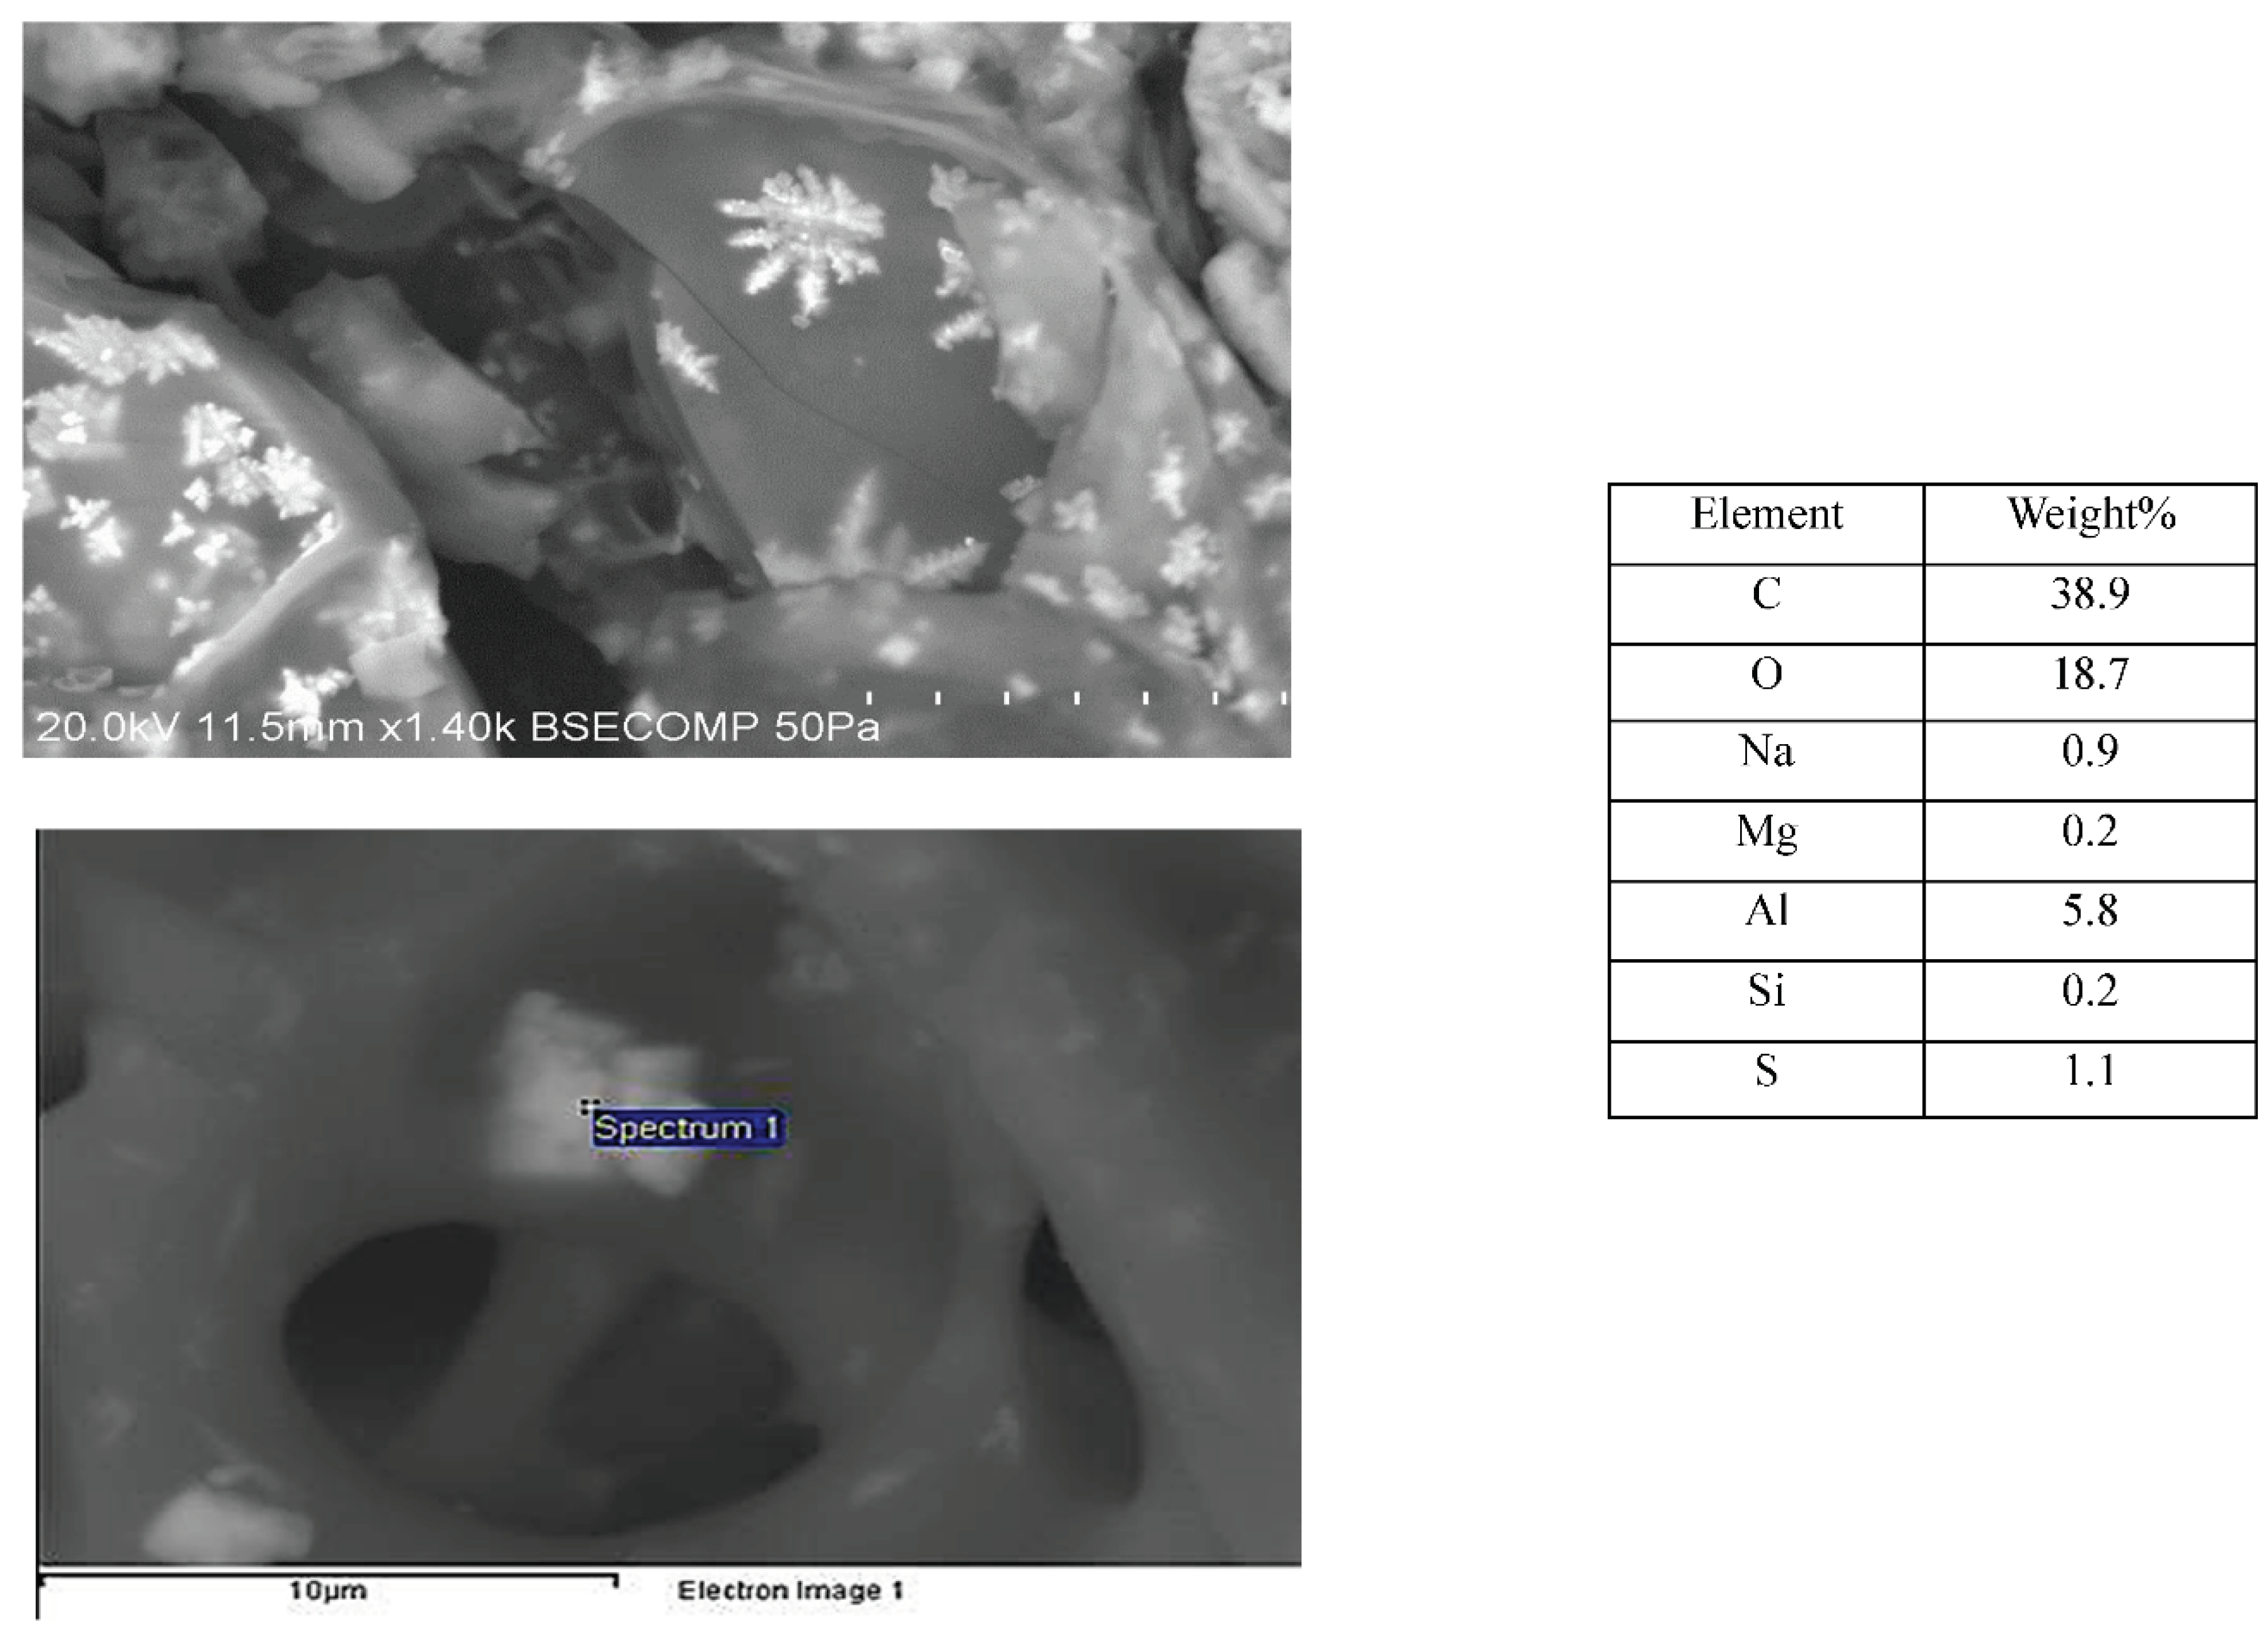
Figure 16.
SEM images of TOR 350 sample showing complex macroporosity: A) Pores formed by the open ends of cells; B) Complex 3D lattice; C) True honeycomb lattice.
Figure 16.
SEM images of TOR 350 sample showing complex macroporosity: A) Pores formed by the open ends of cells; B) Complex 3D lattice; C) True honeycomb lattice.
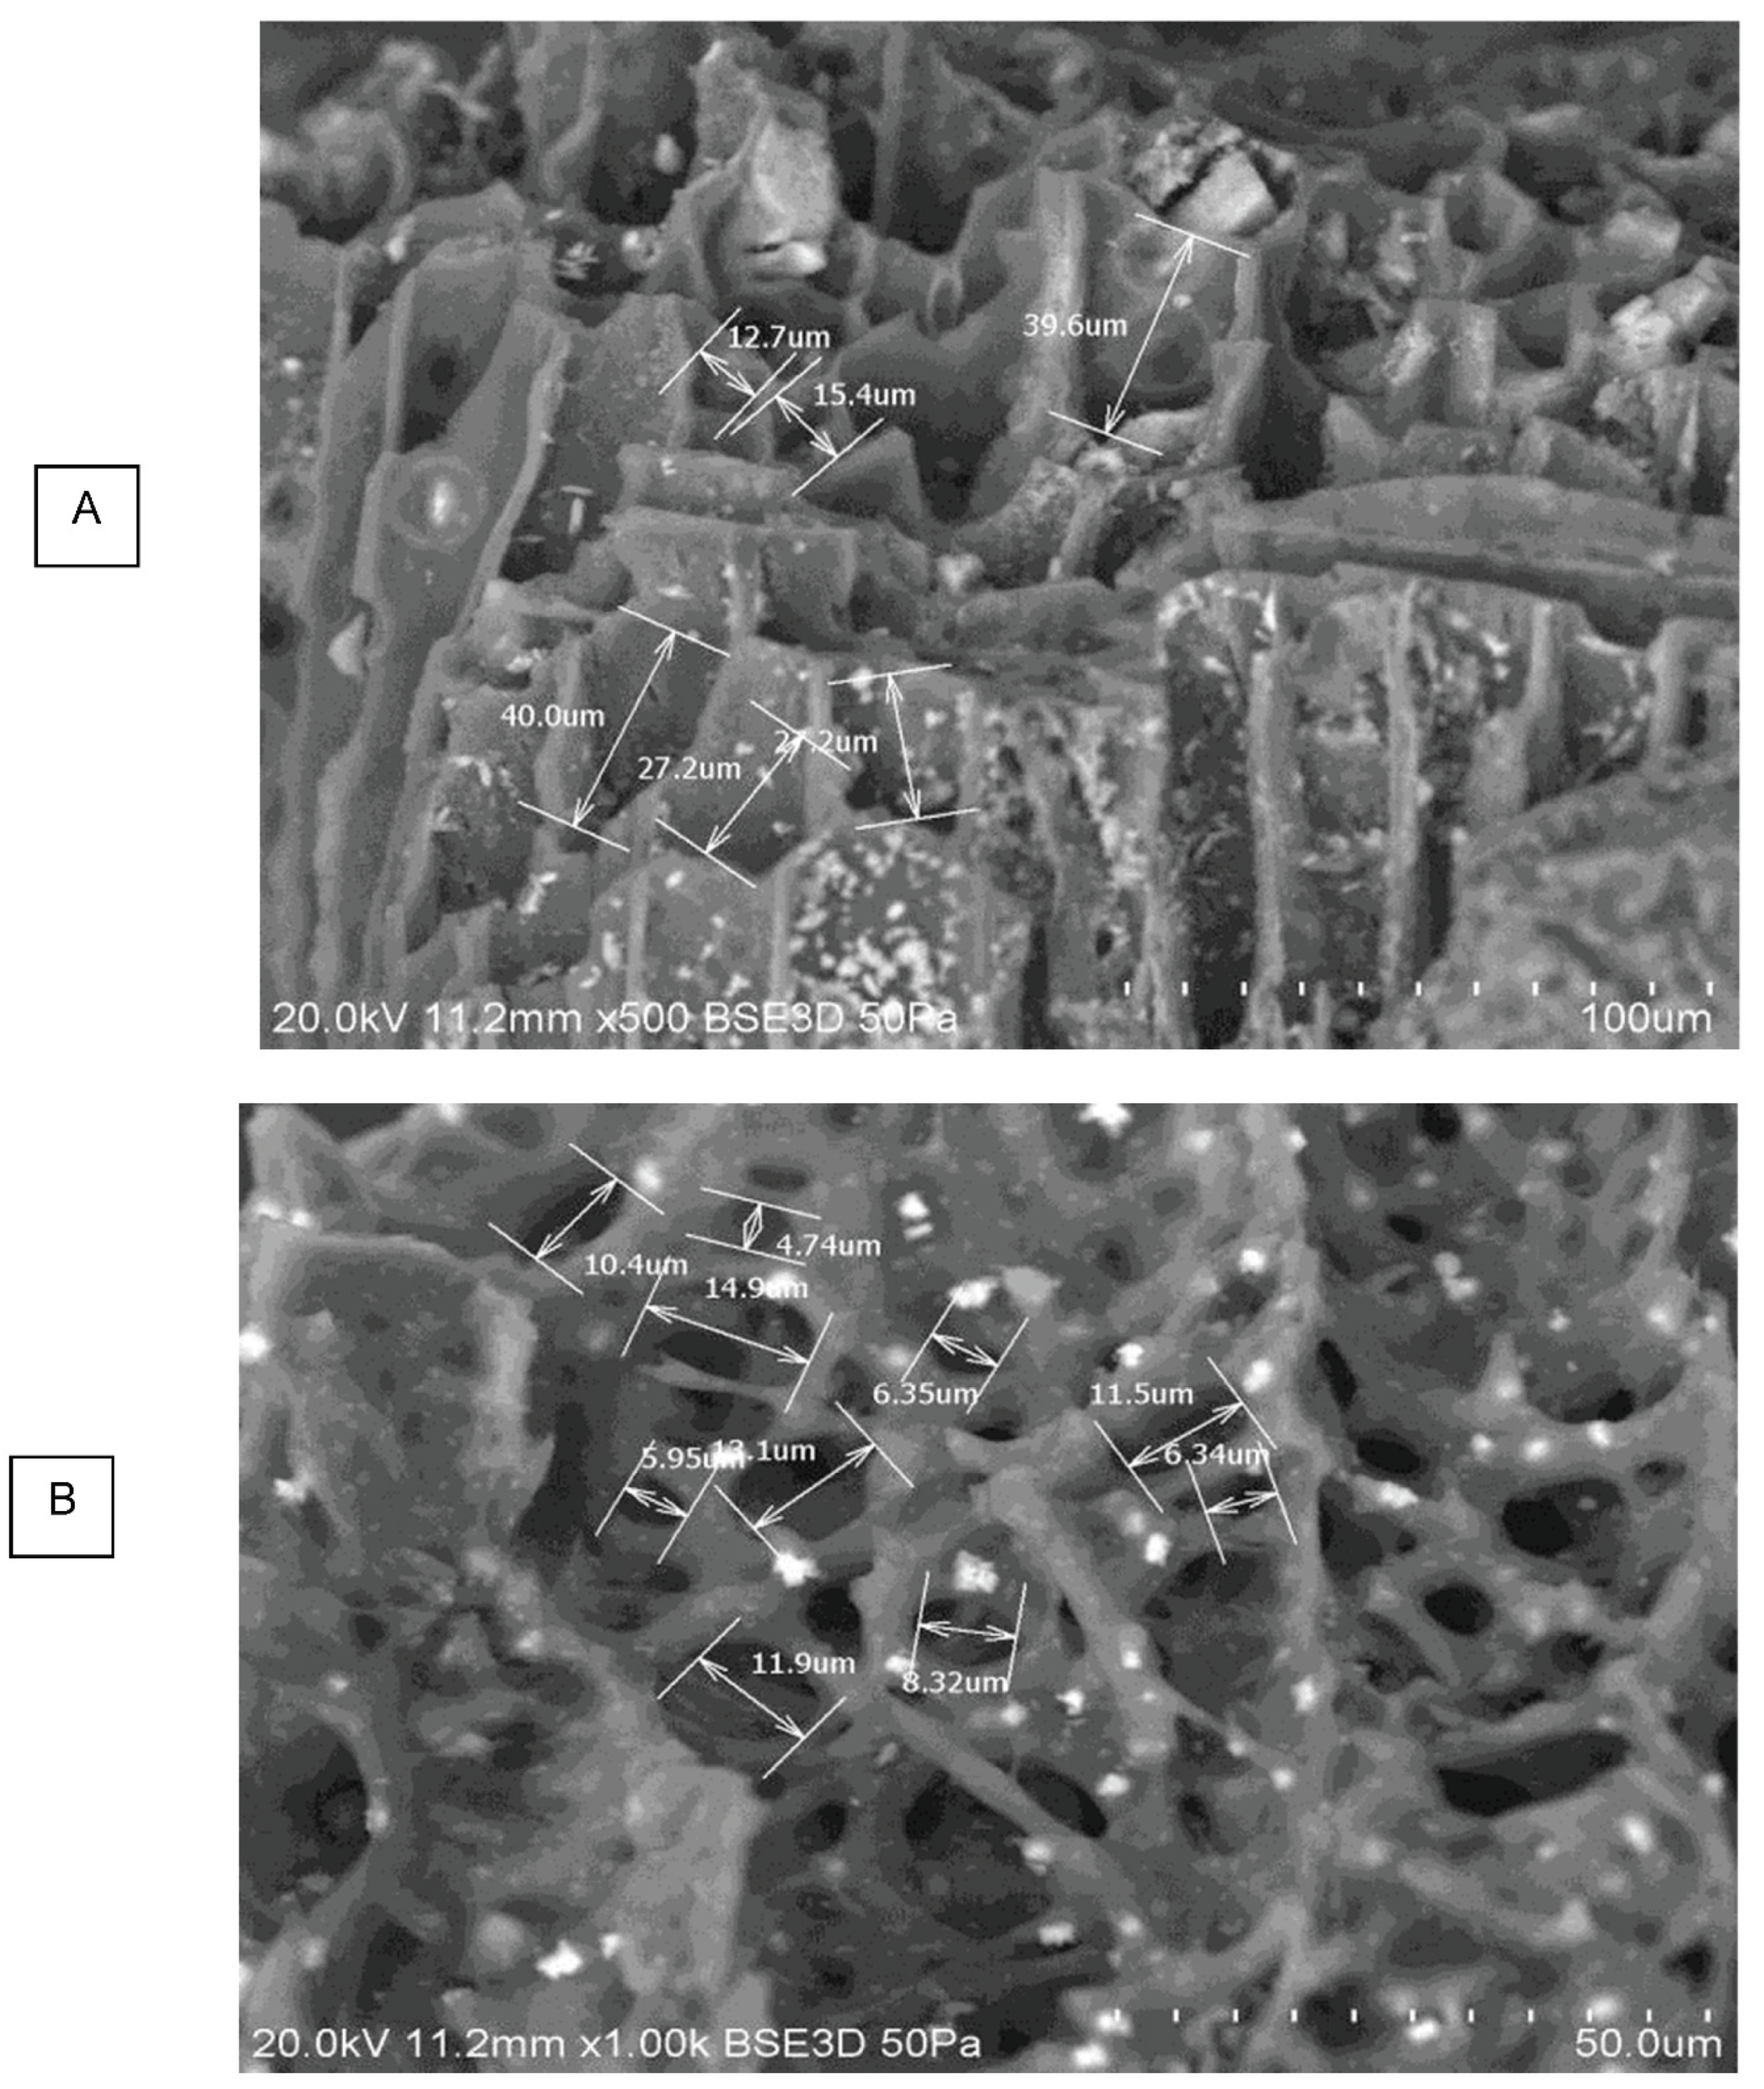
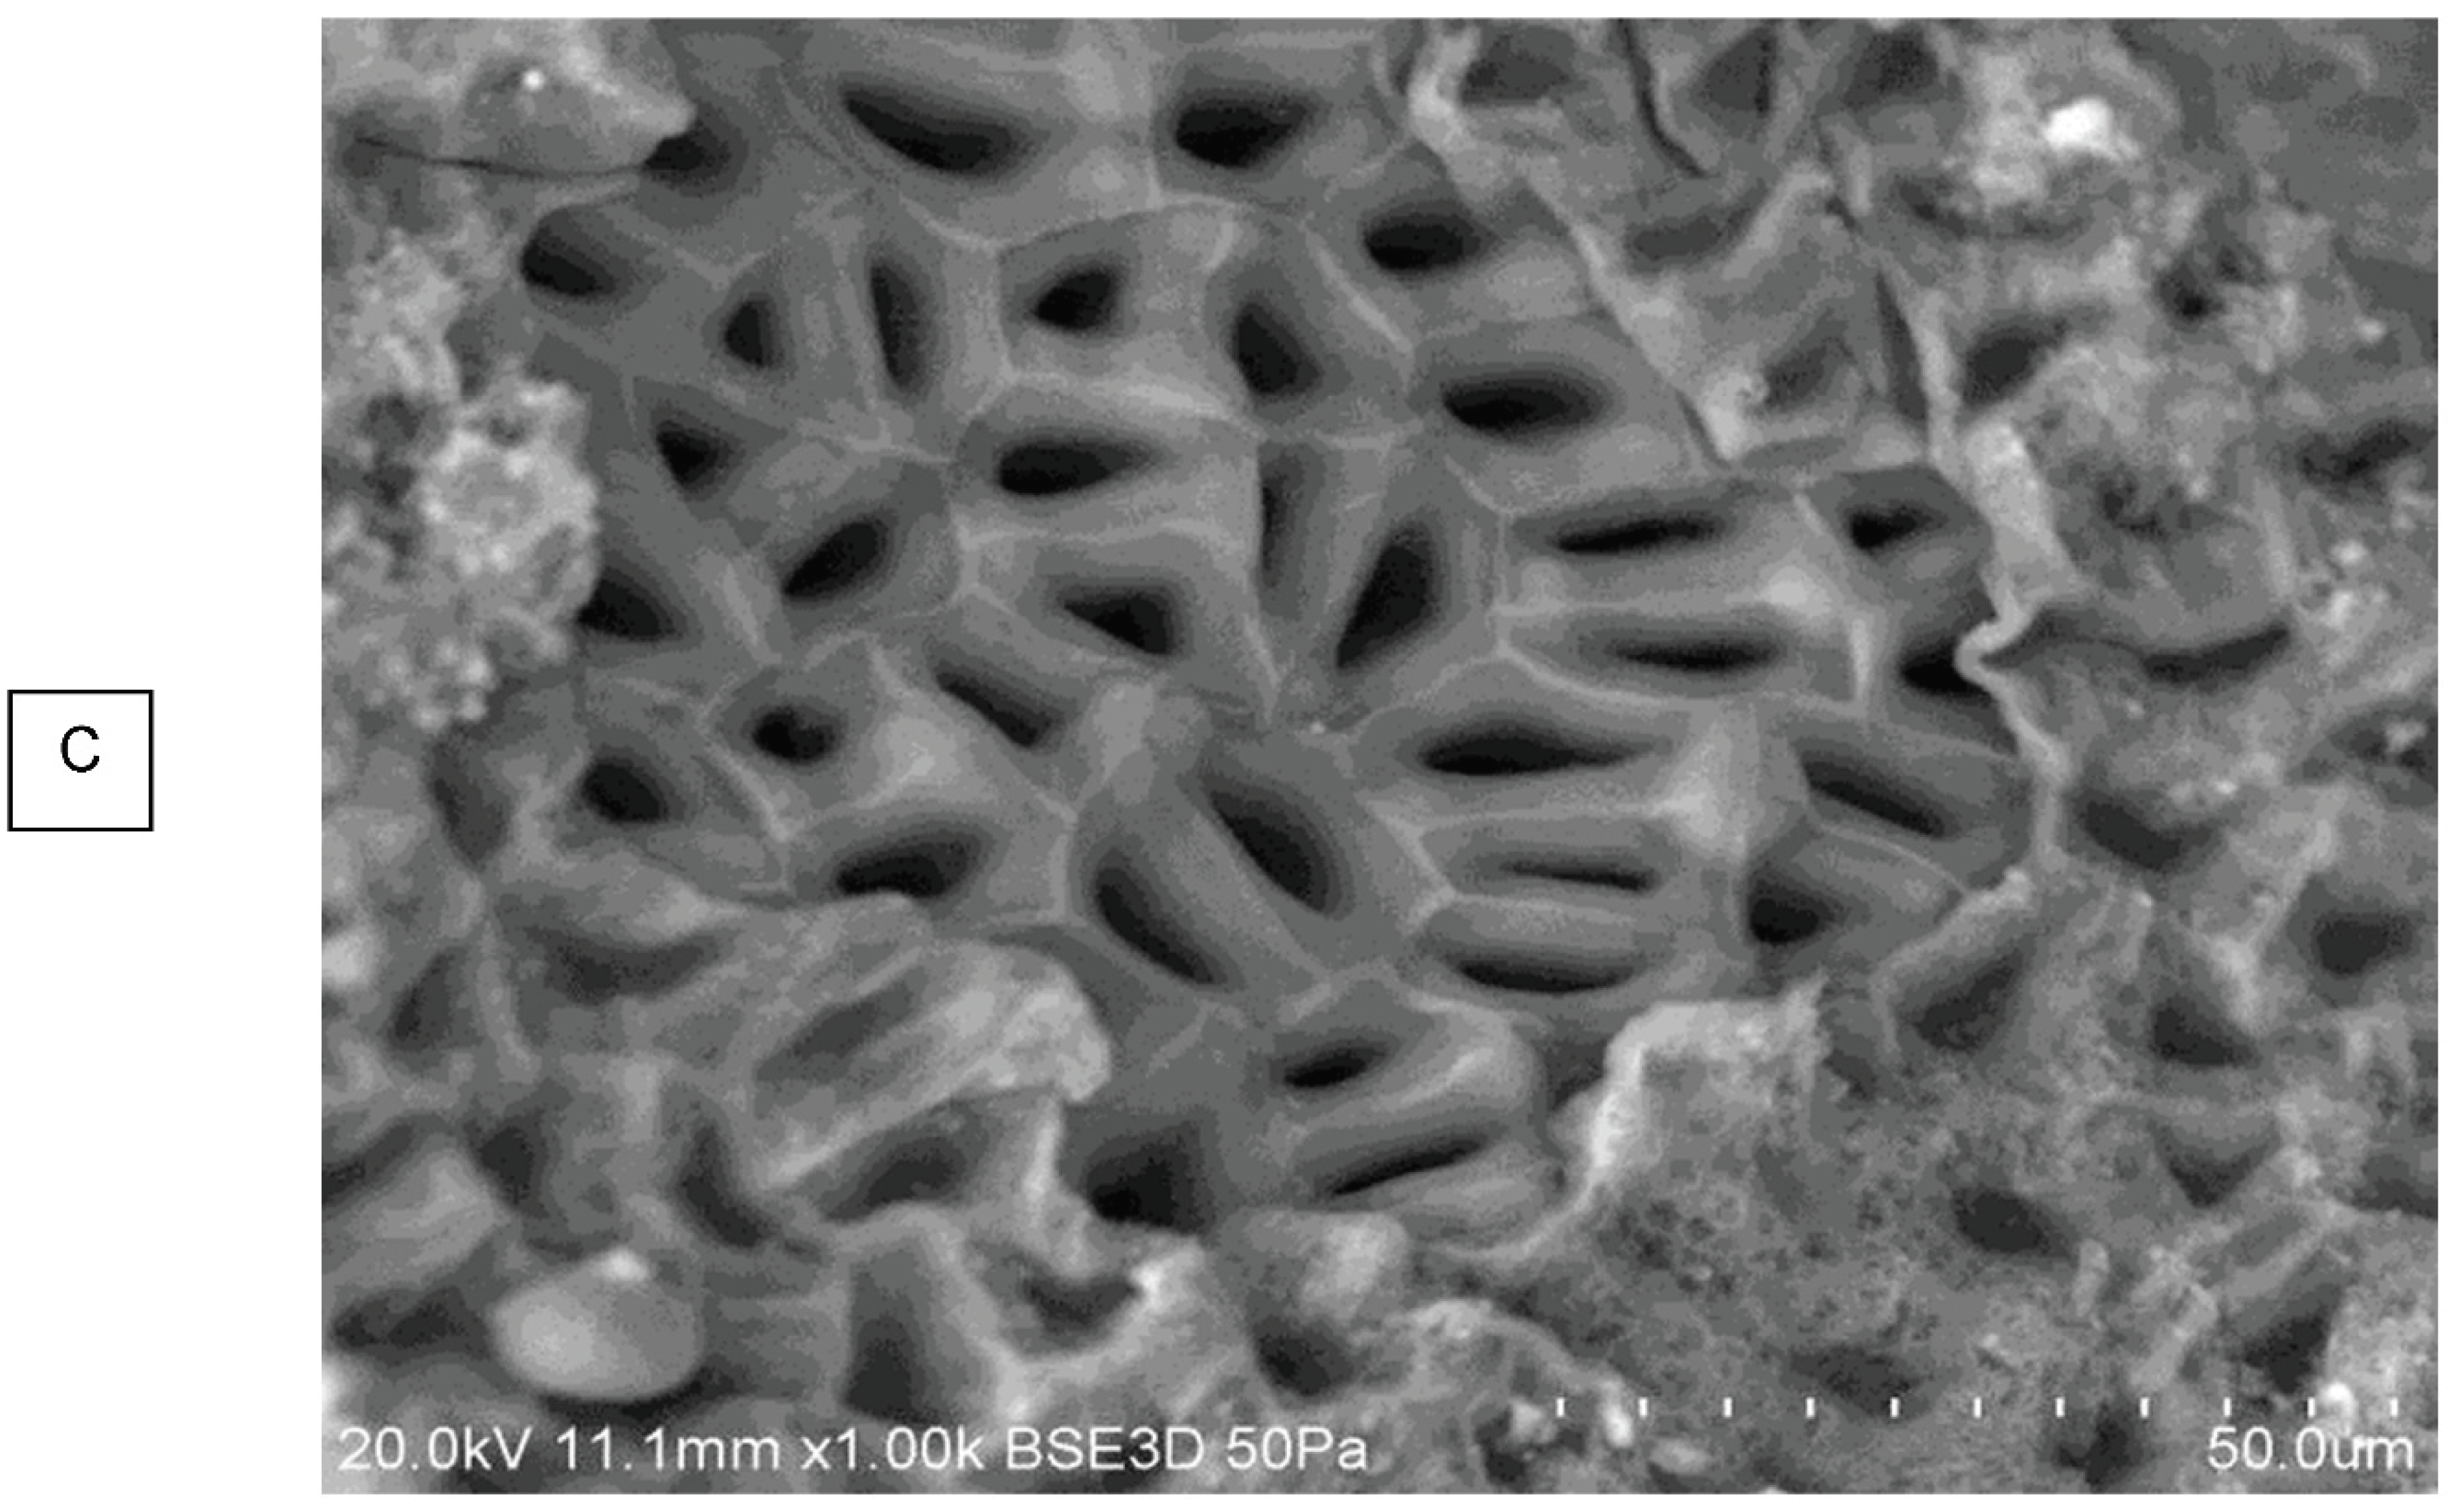
Figure 17.
Variation of the mean pore size with temperature for the TOR biochar samples.
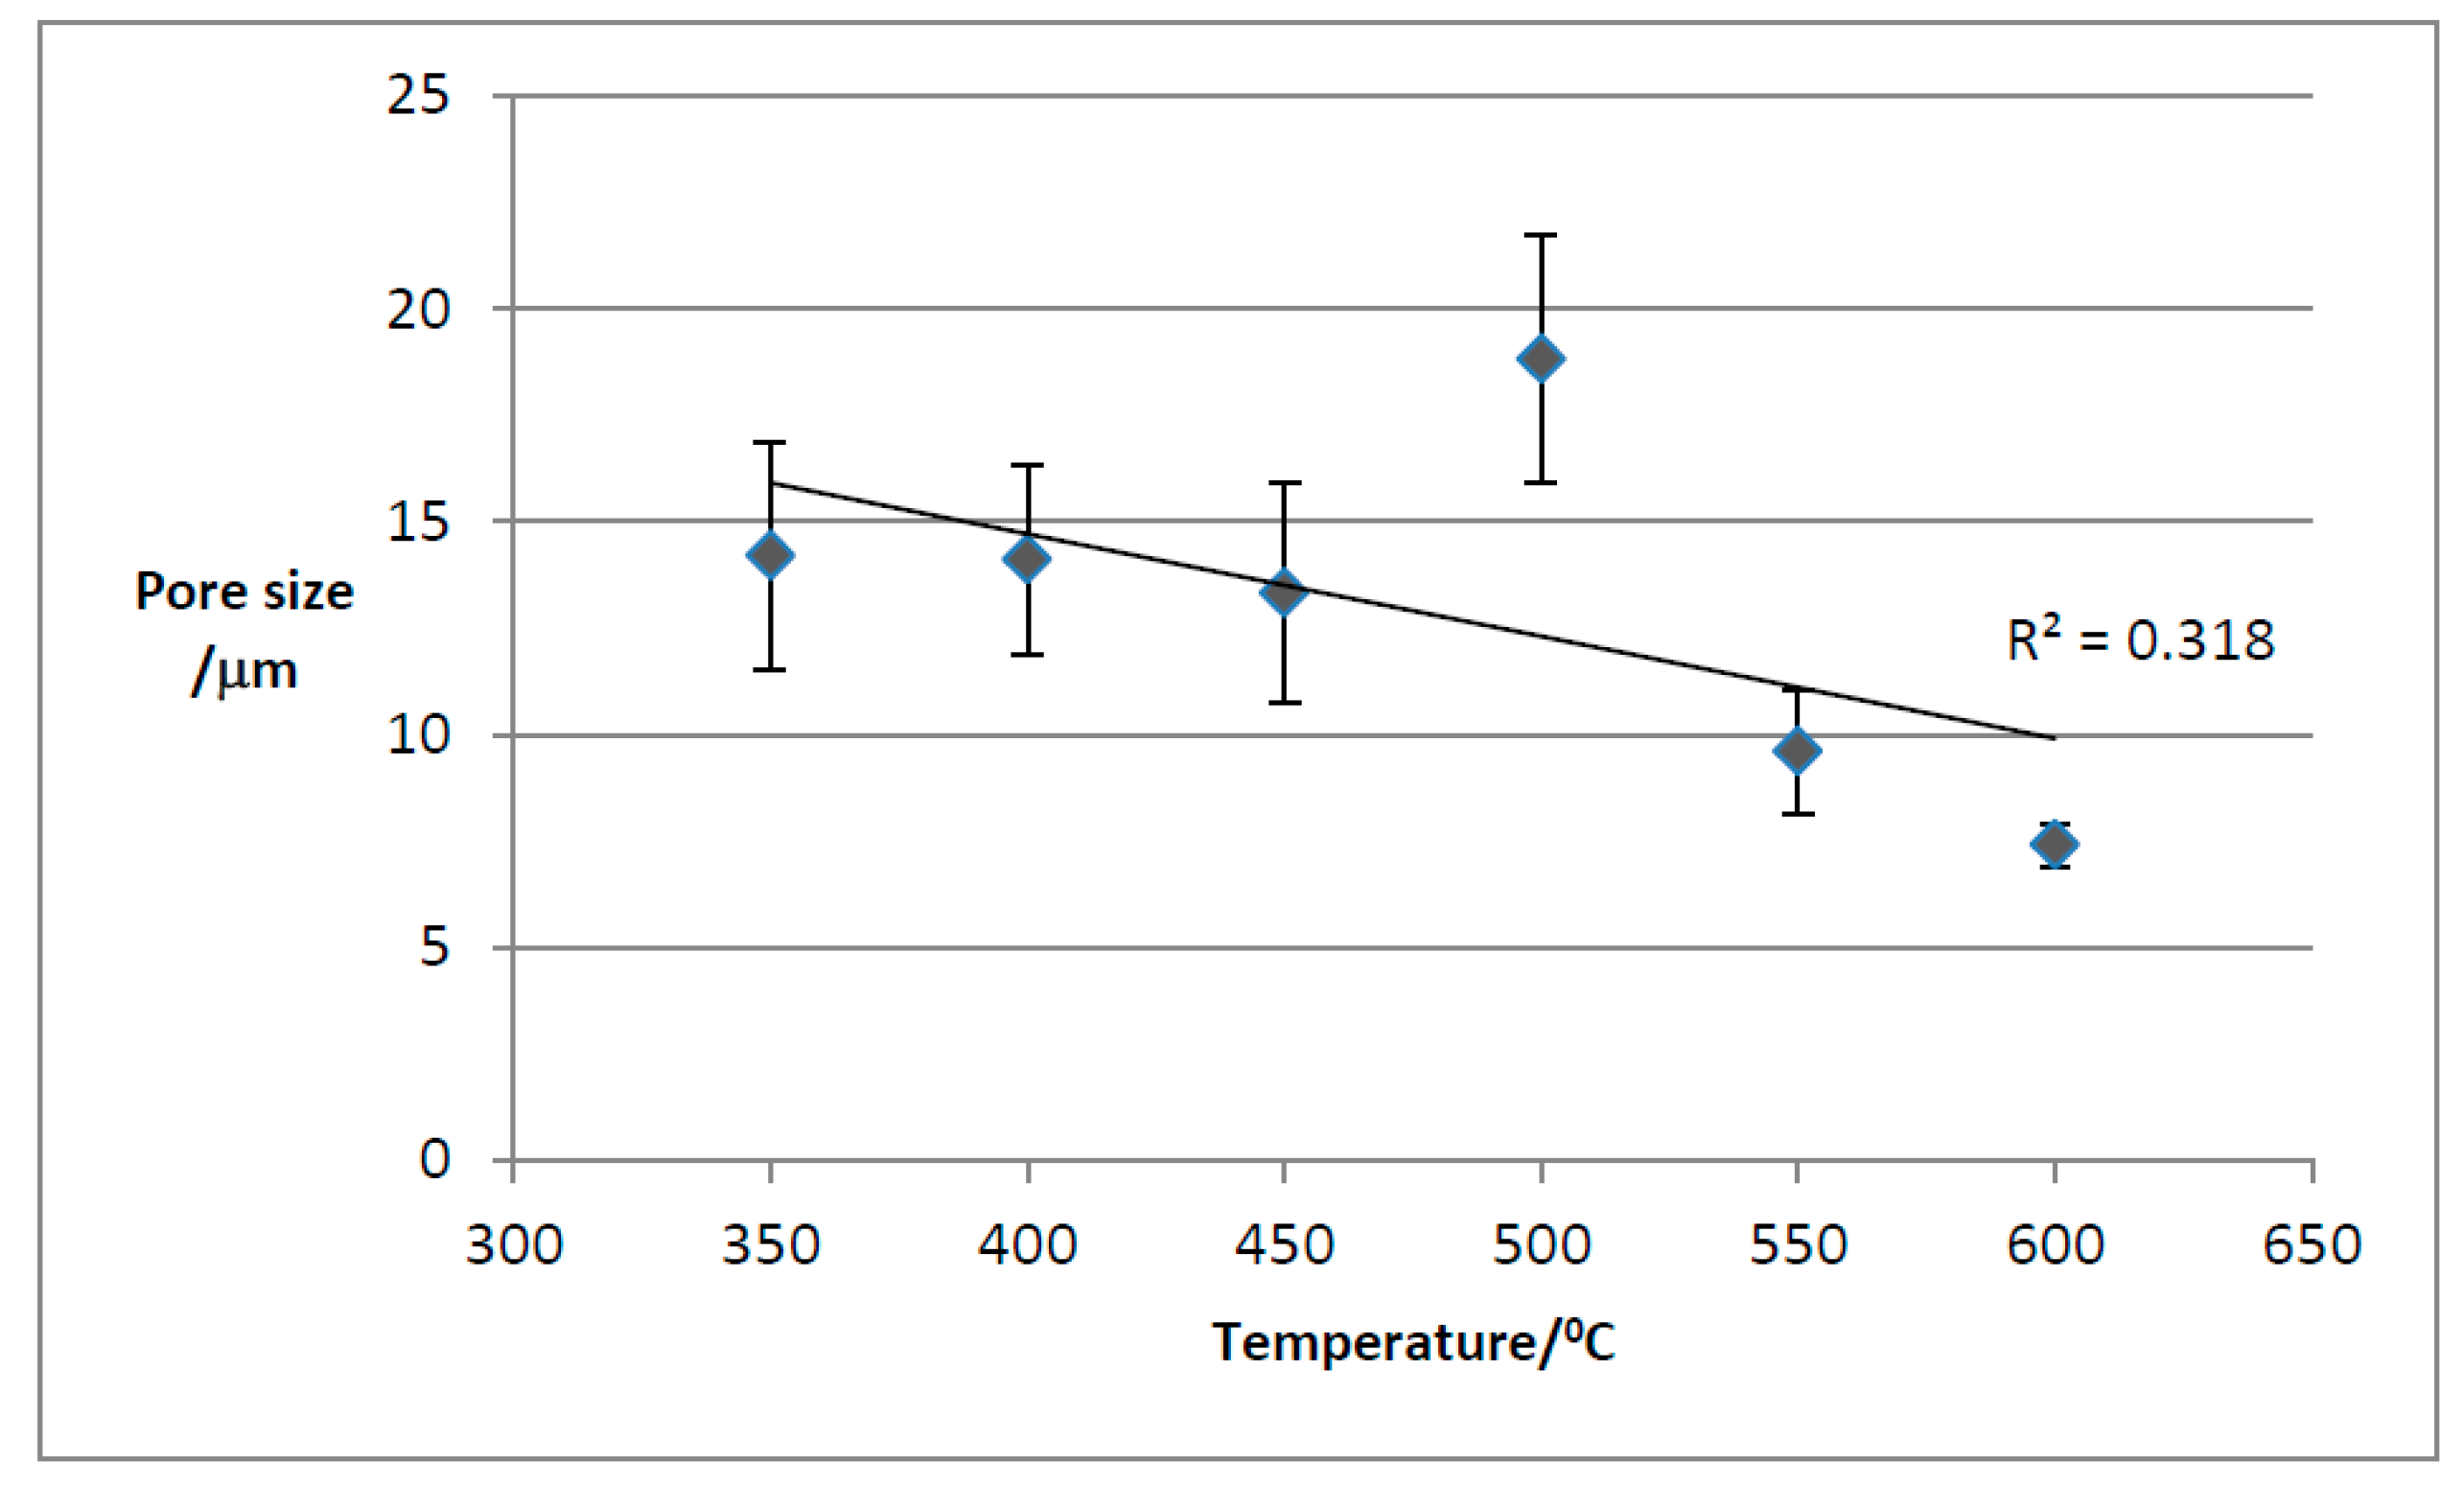
Figure 18.
SEM images of an unusual structure on TOR 350 along with its EDX composition.
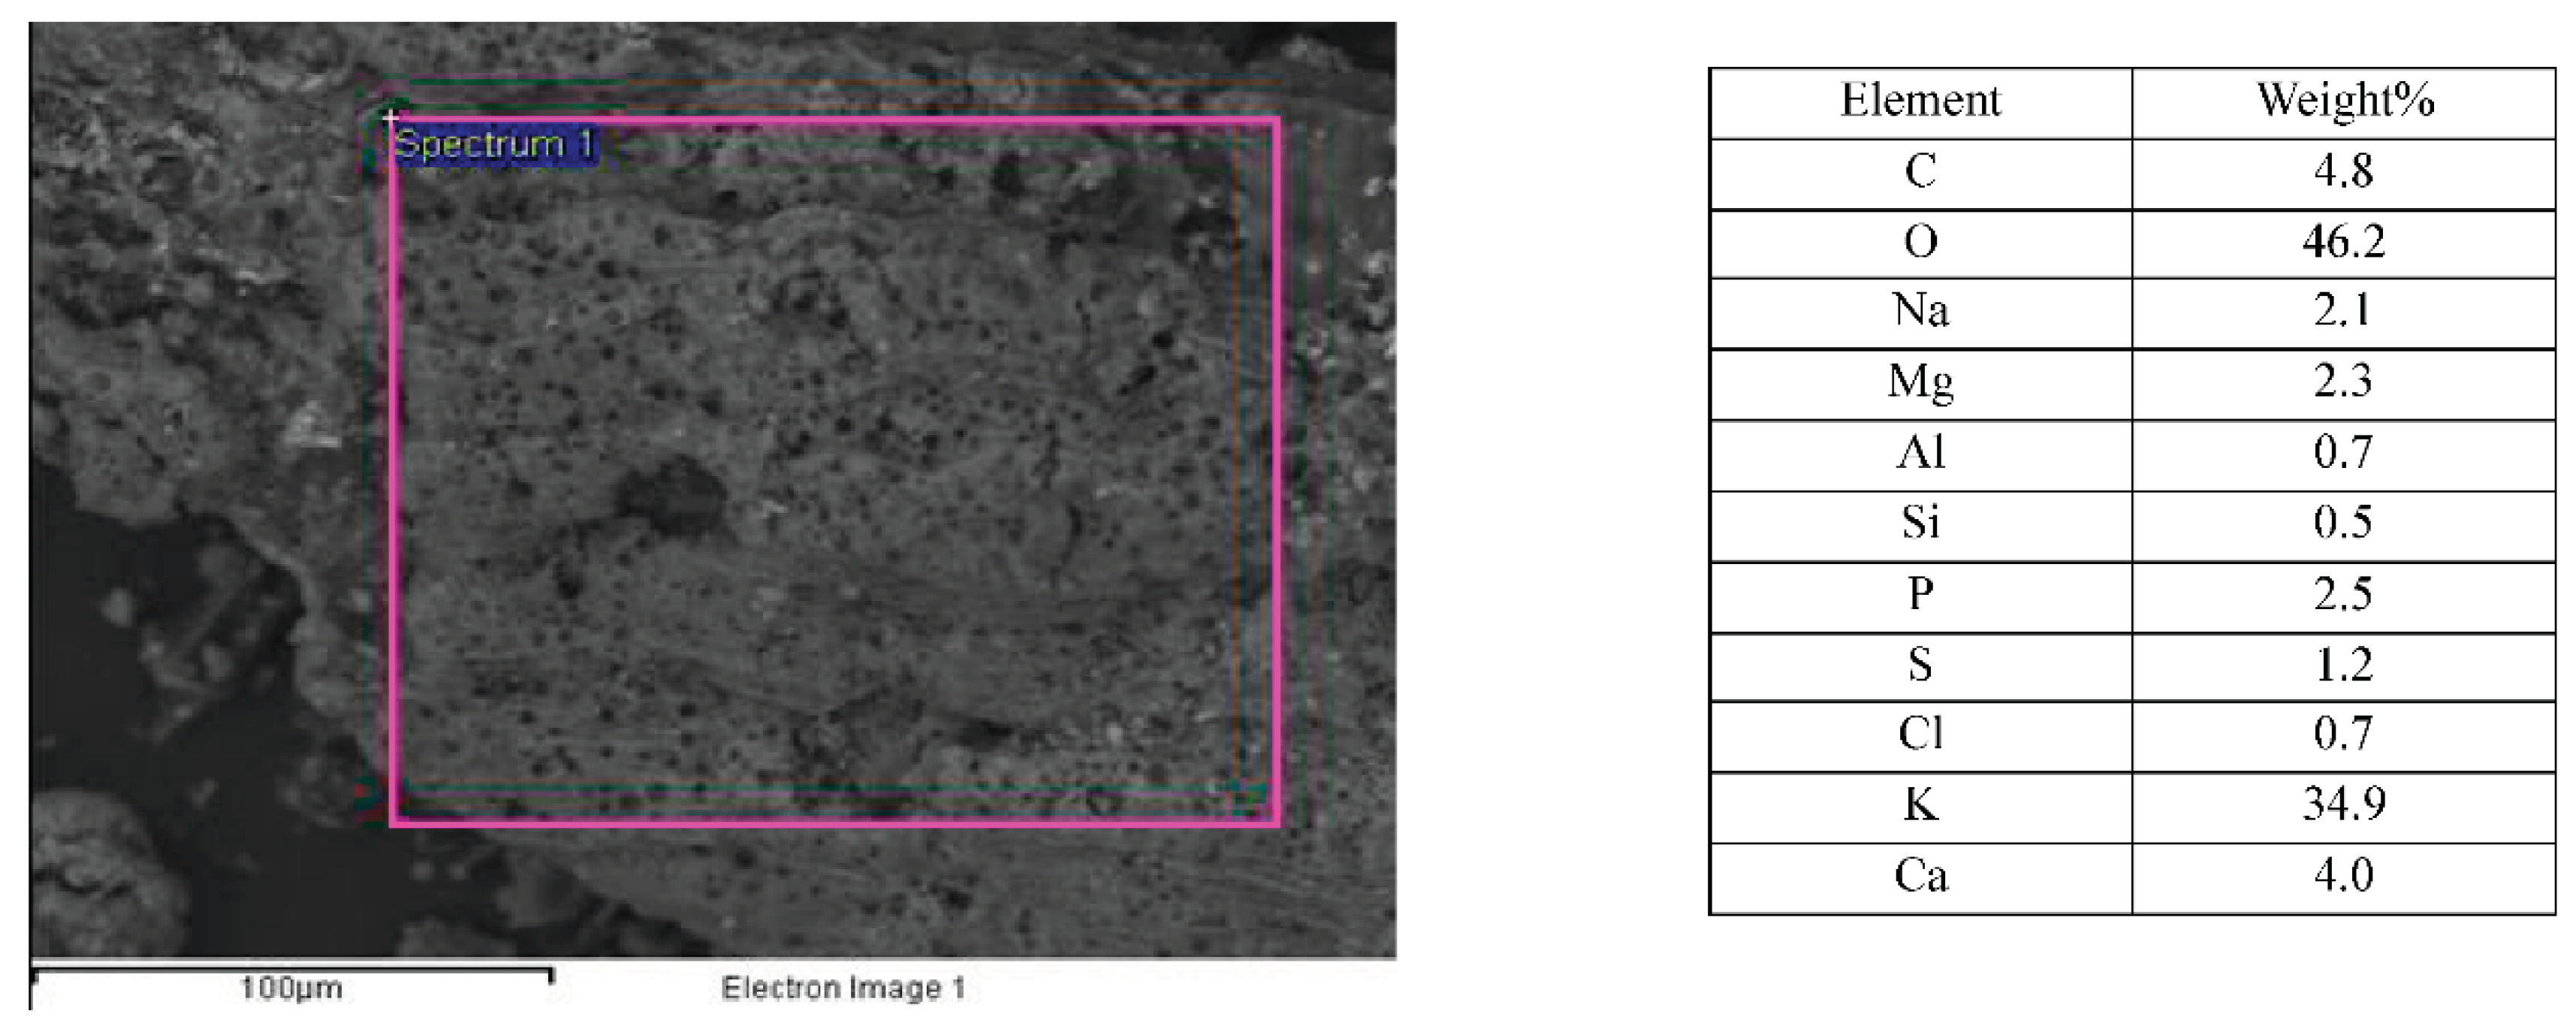
Figure 19.
Frequency distribution of pore size with temperature for torrefied biochar samples.
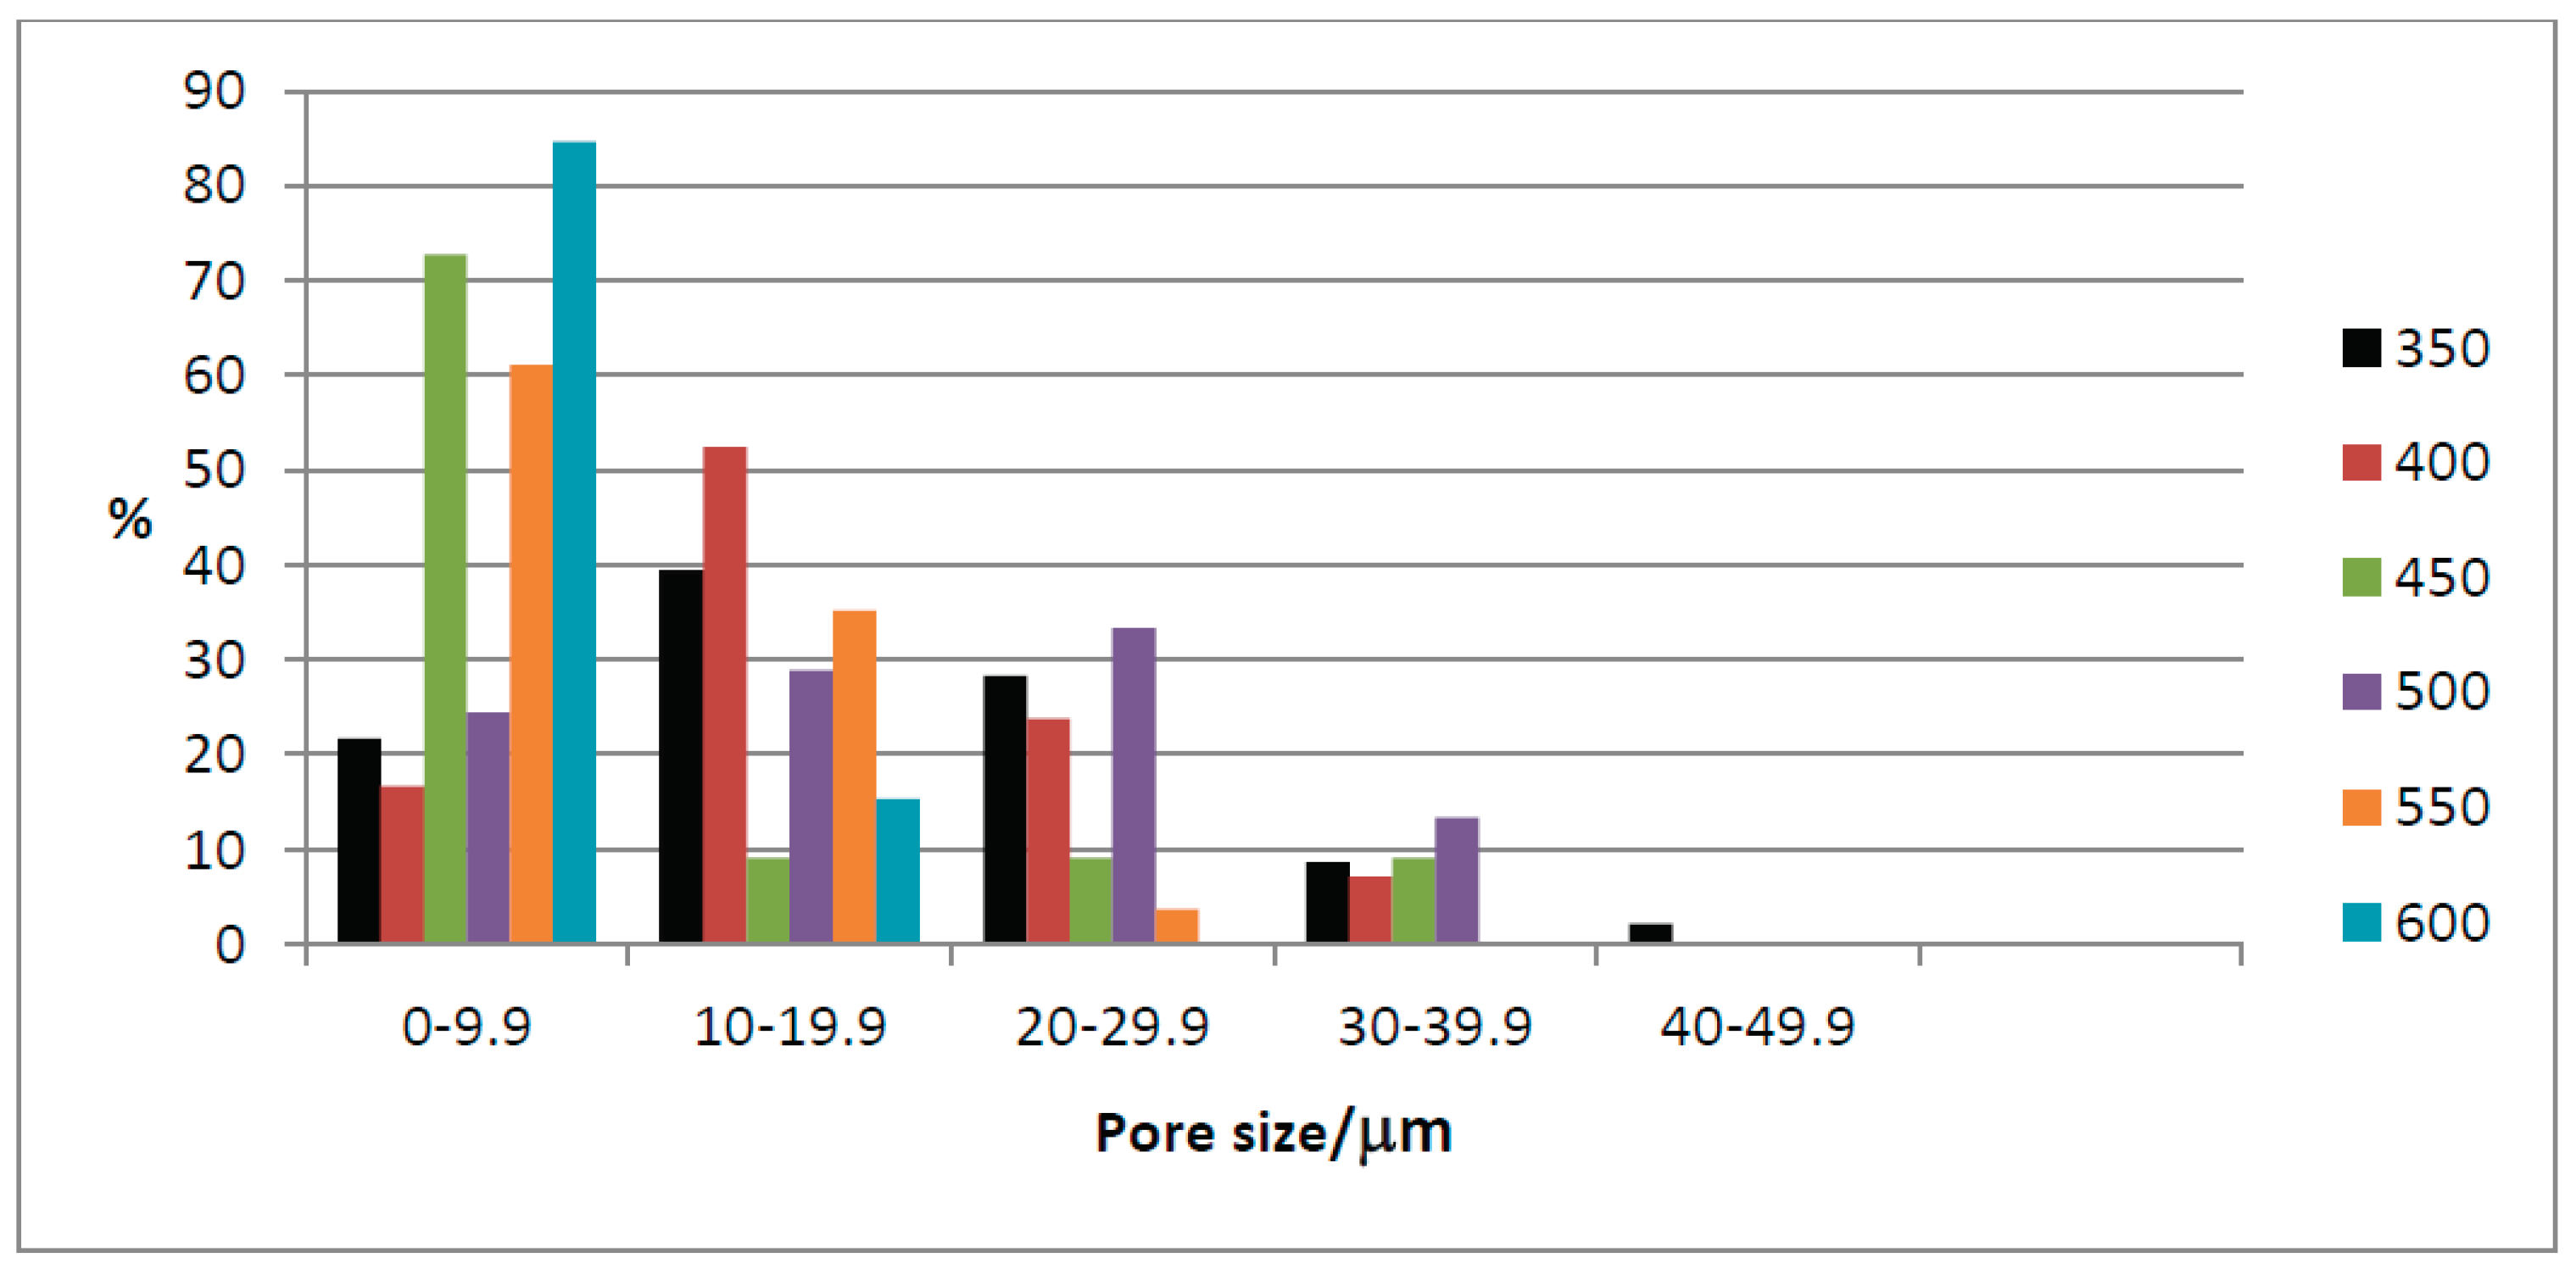
Figure 20.
Mean pore size variation with temperature for the TF biochar samples.
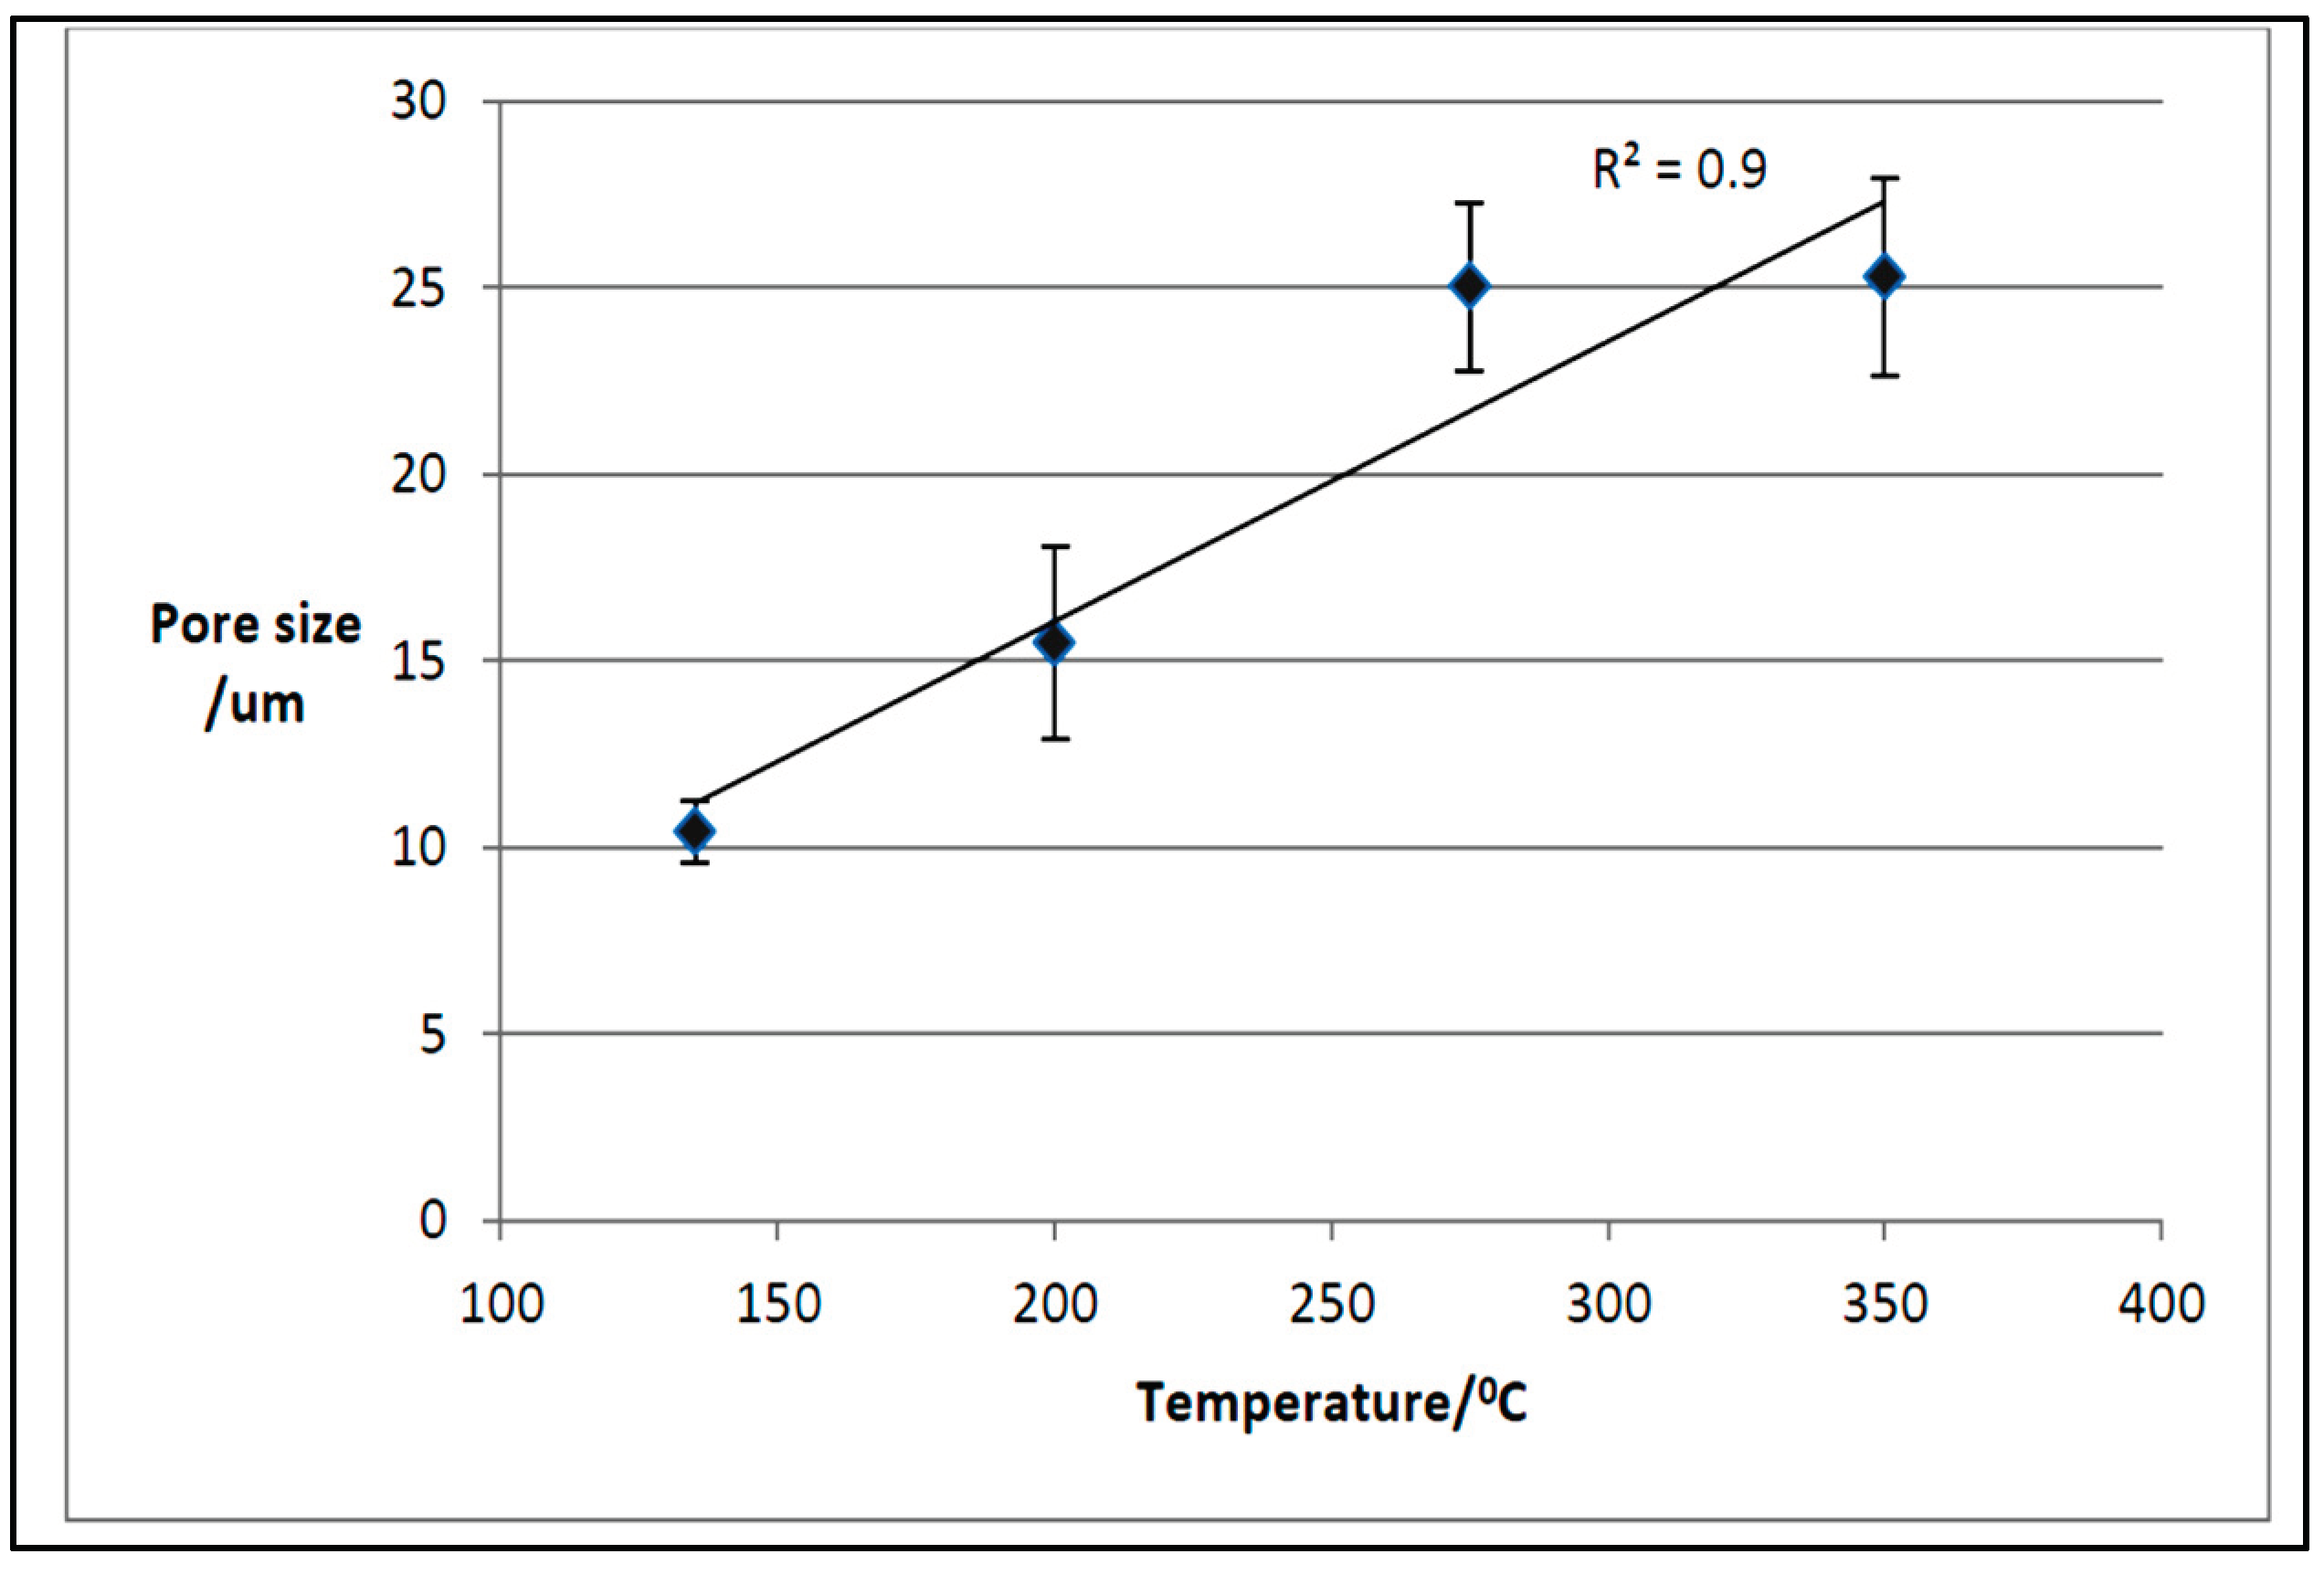
Figure 21.
Frequency distribution of pore size with temperature for tube furnace biochar samples.
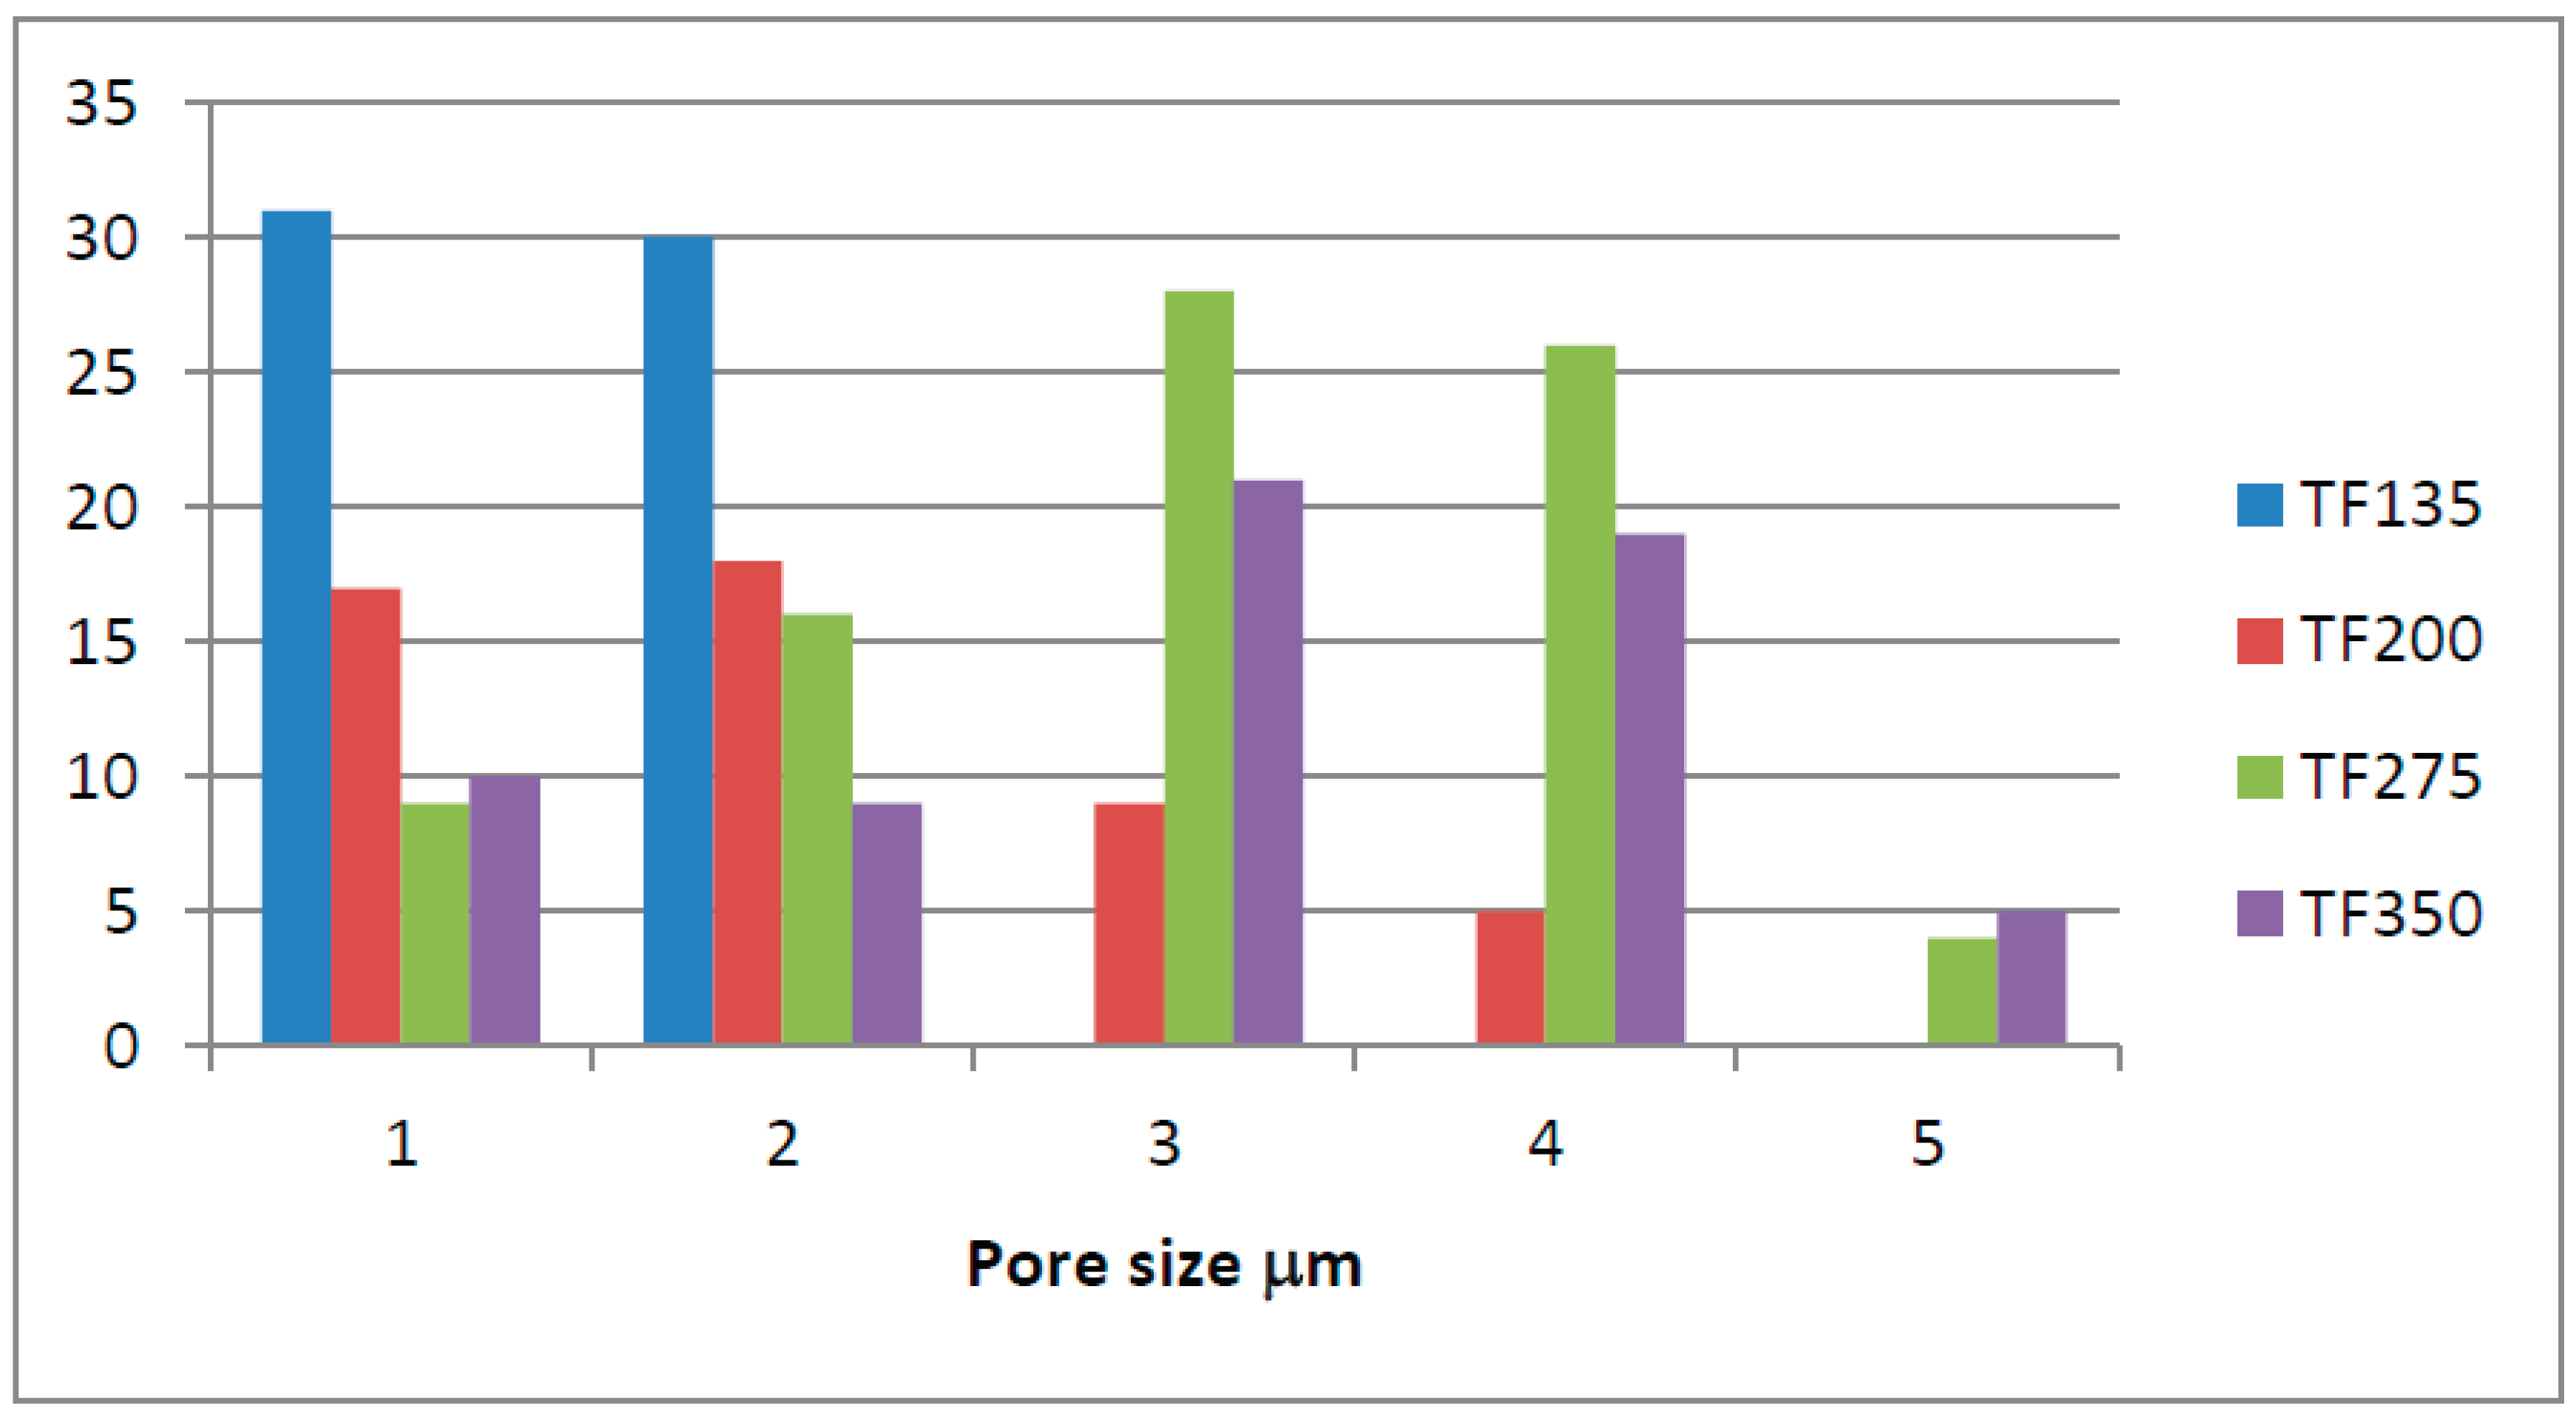
Figure 22.
Frequency distribution of pore size with temperature for HTC samples.
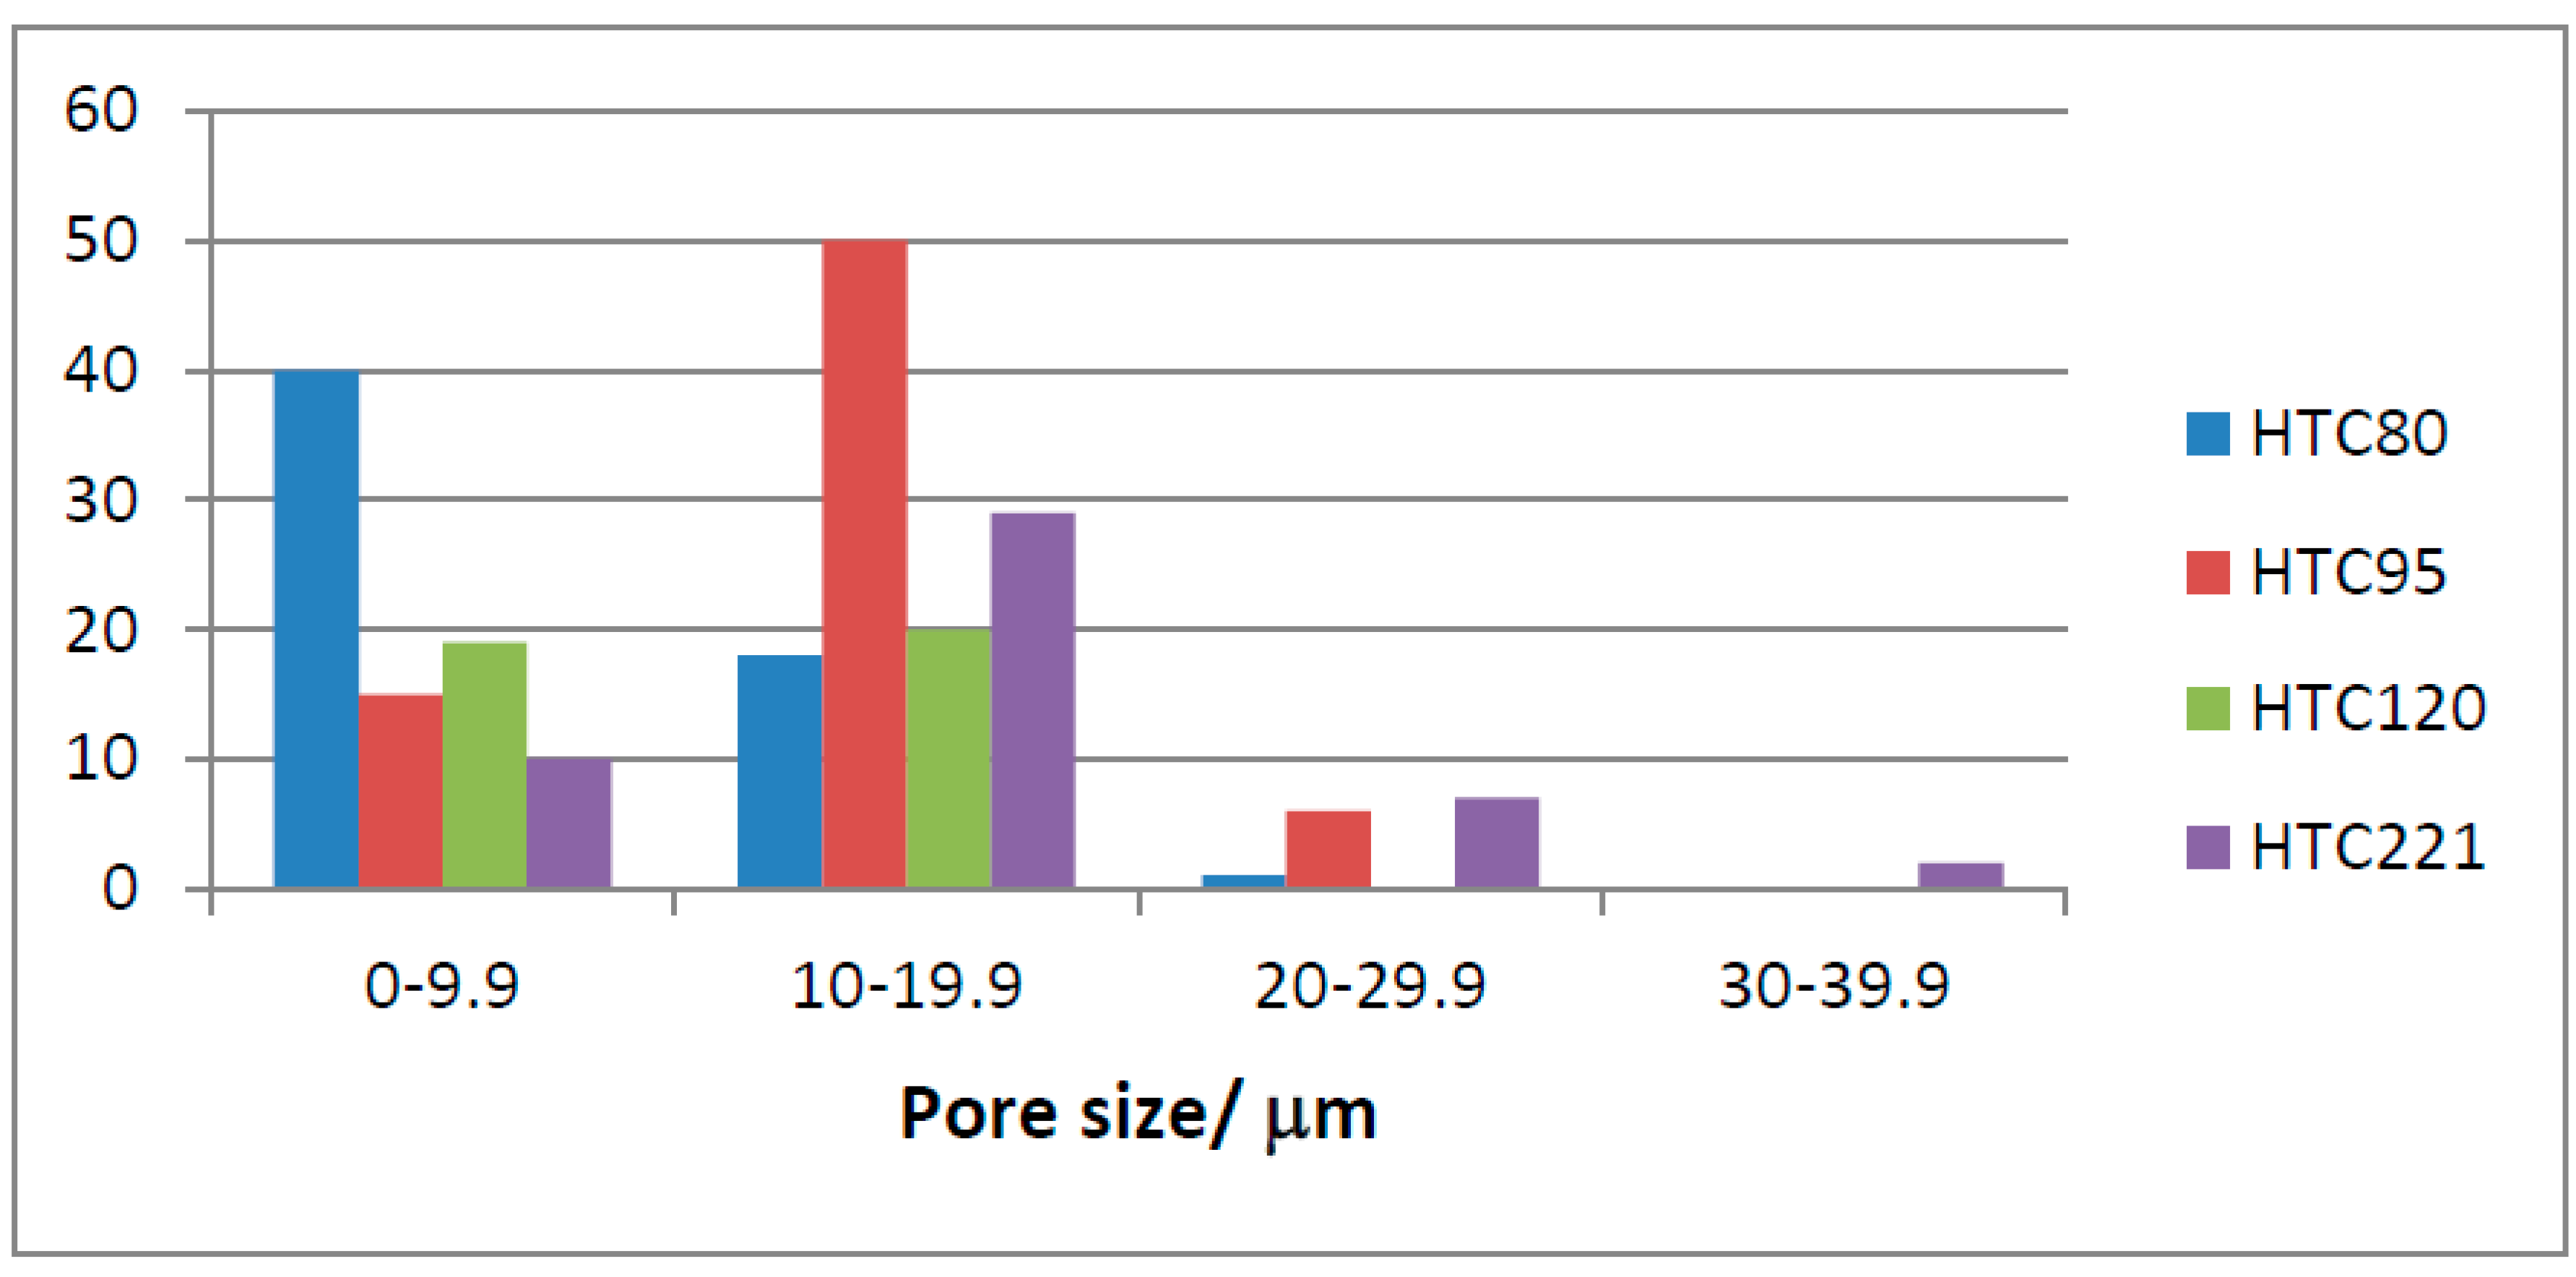
Figure 23.
Water extractable (WE) and total digestion (TD) potassium concentrations for TOR and TF samples.
Figure 23.
Water extractable (WE) and total digestion (TD) potassium concentrations for TOR and TF samples.
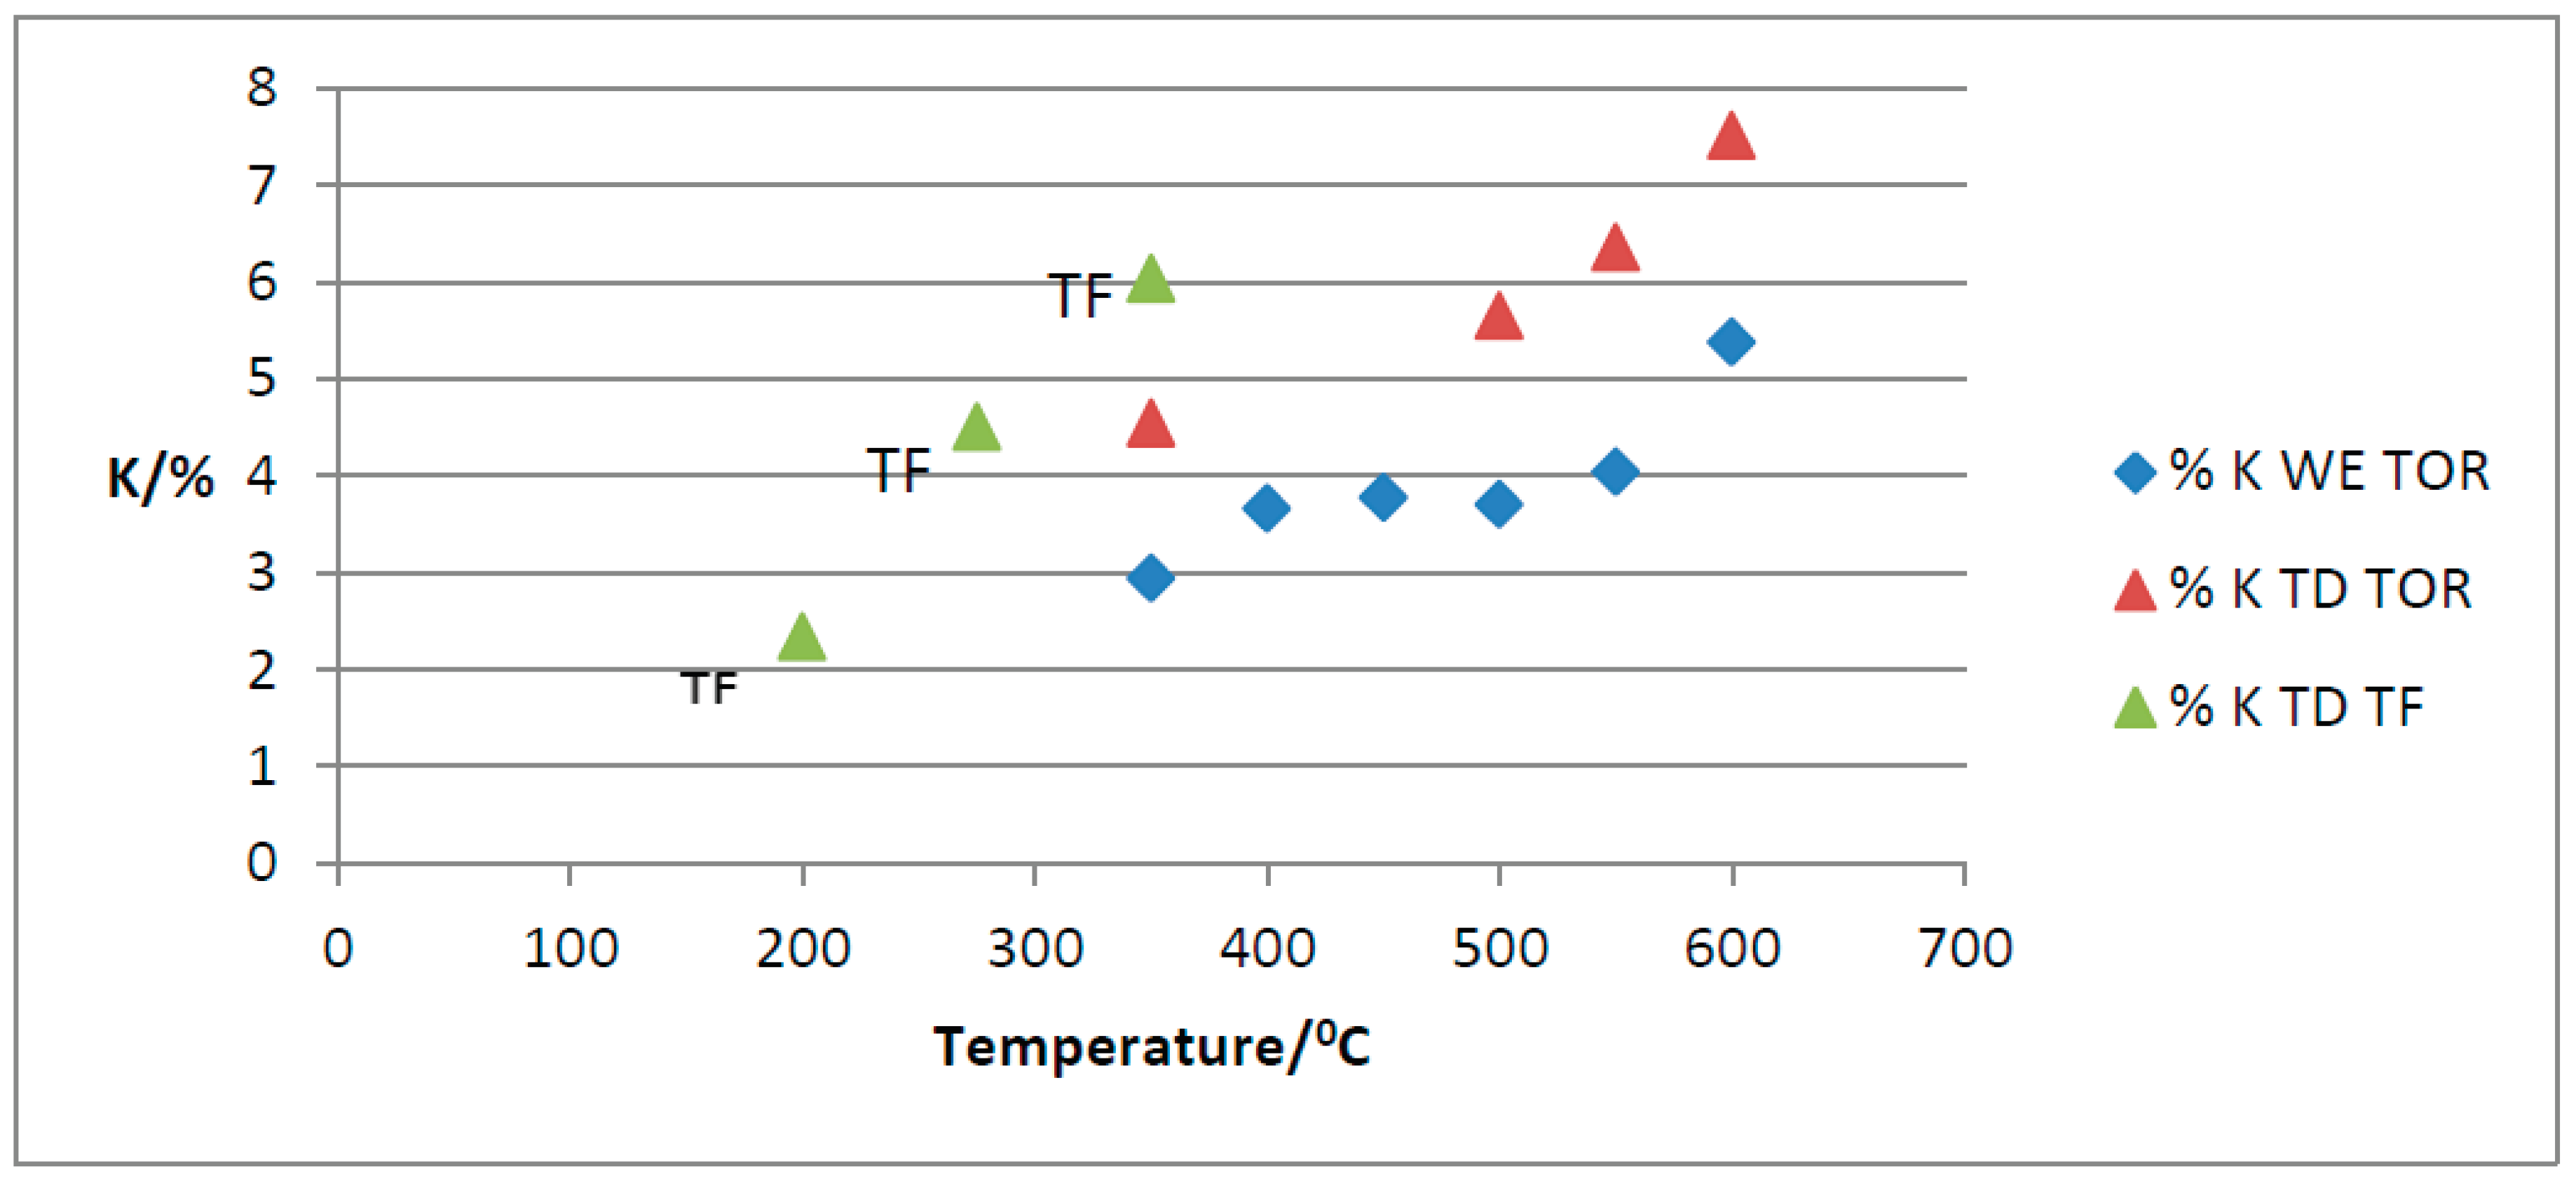
Figure 24.
Thermogravimetric analysis (TGA) under N2 atmosphere of PL and TOR 350, TOR 450 and TOR 600 sample, respectively: A) Thermograms and first derivatives of the thermograms; B) Heat flow.
Figure 24.
Thermogravimetric analysis (TGA) under N2 atmosphere of PL and TOR 350, TOR 450 and TOR 600 sample, respectively: A) Thermograms and first derivatives of the thermograms; B) Heat flow.
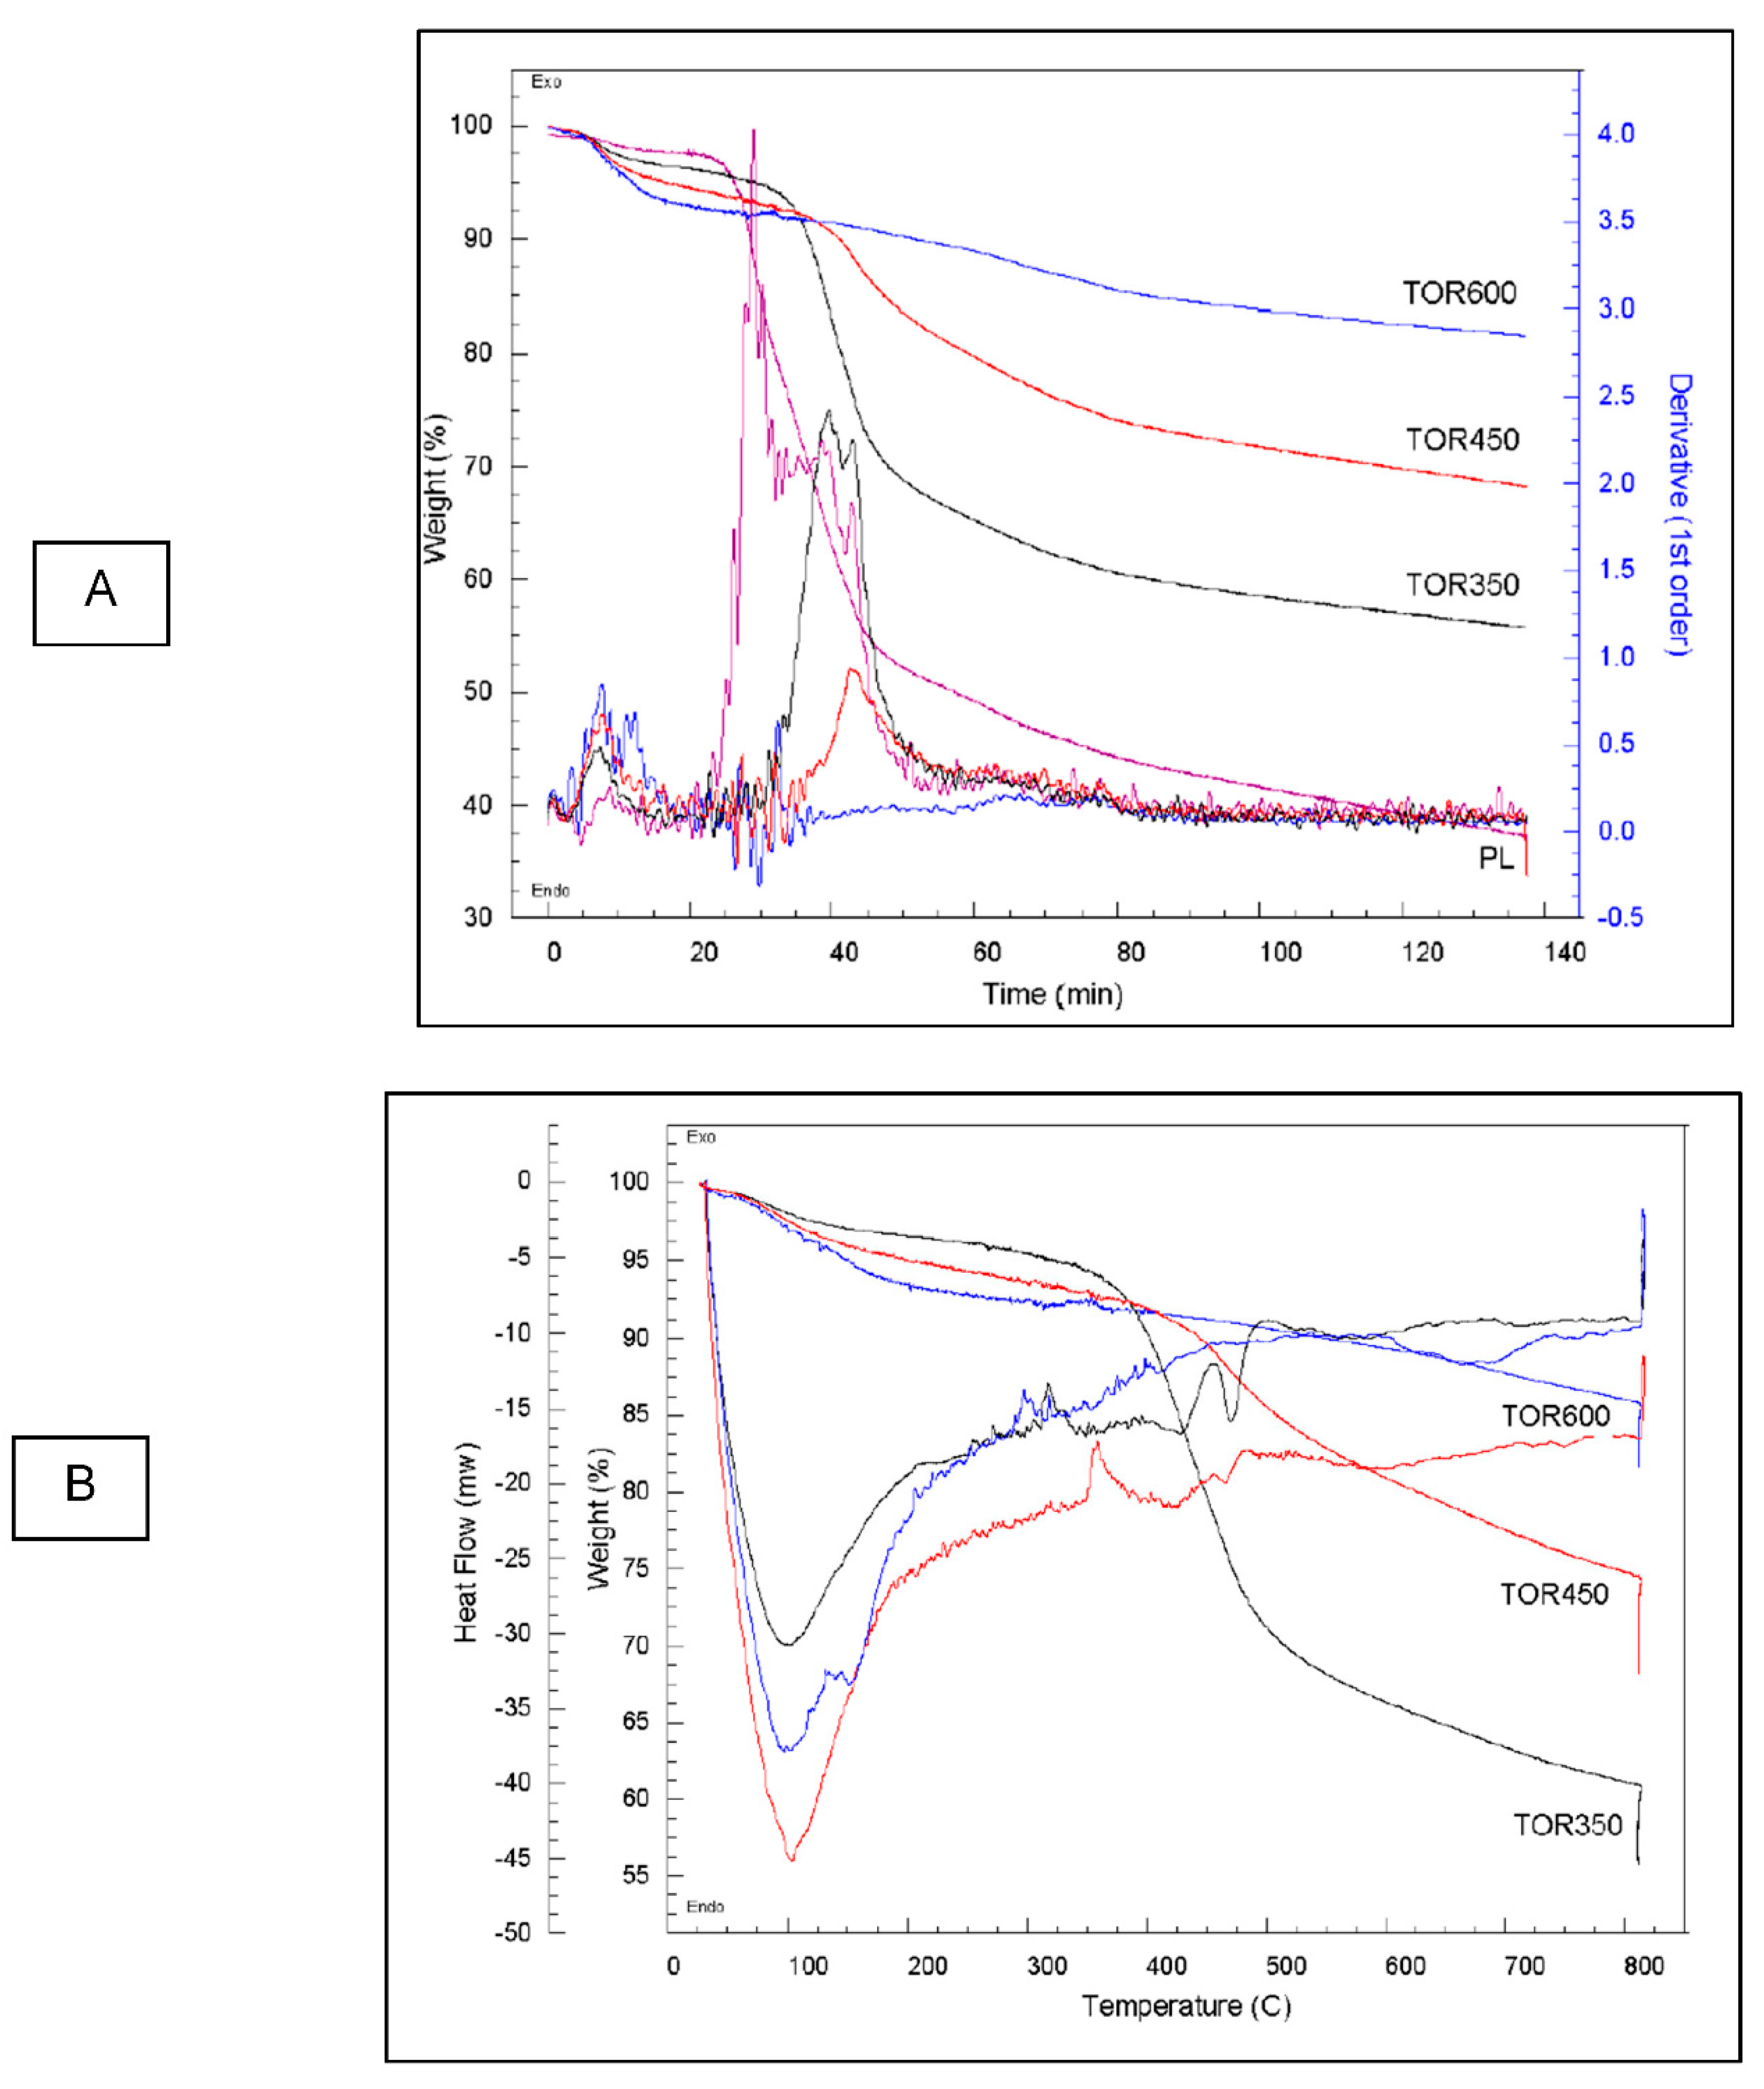
Figure 25.
TGA curves (TG, DTG, Heat flow) for TF 350 and TOR 350 samples.
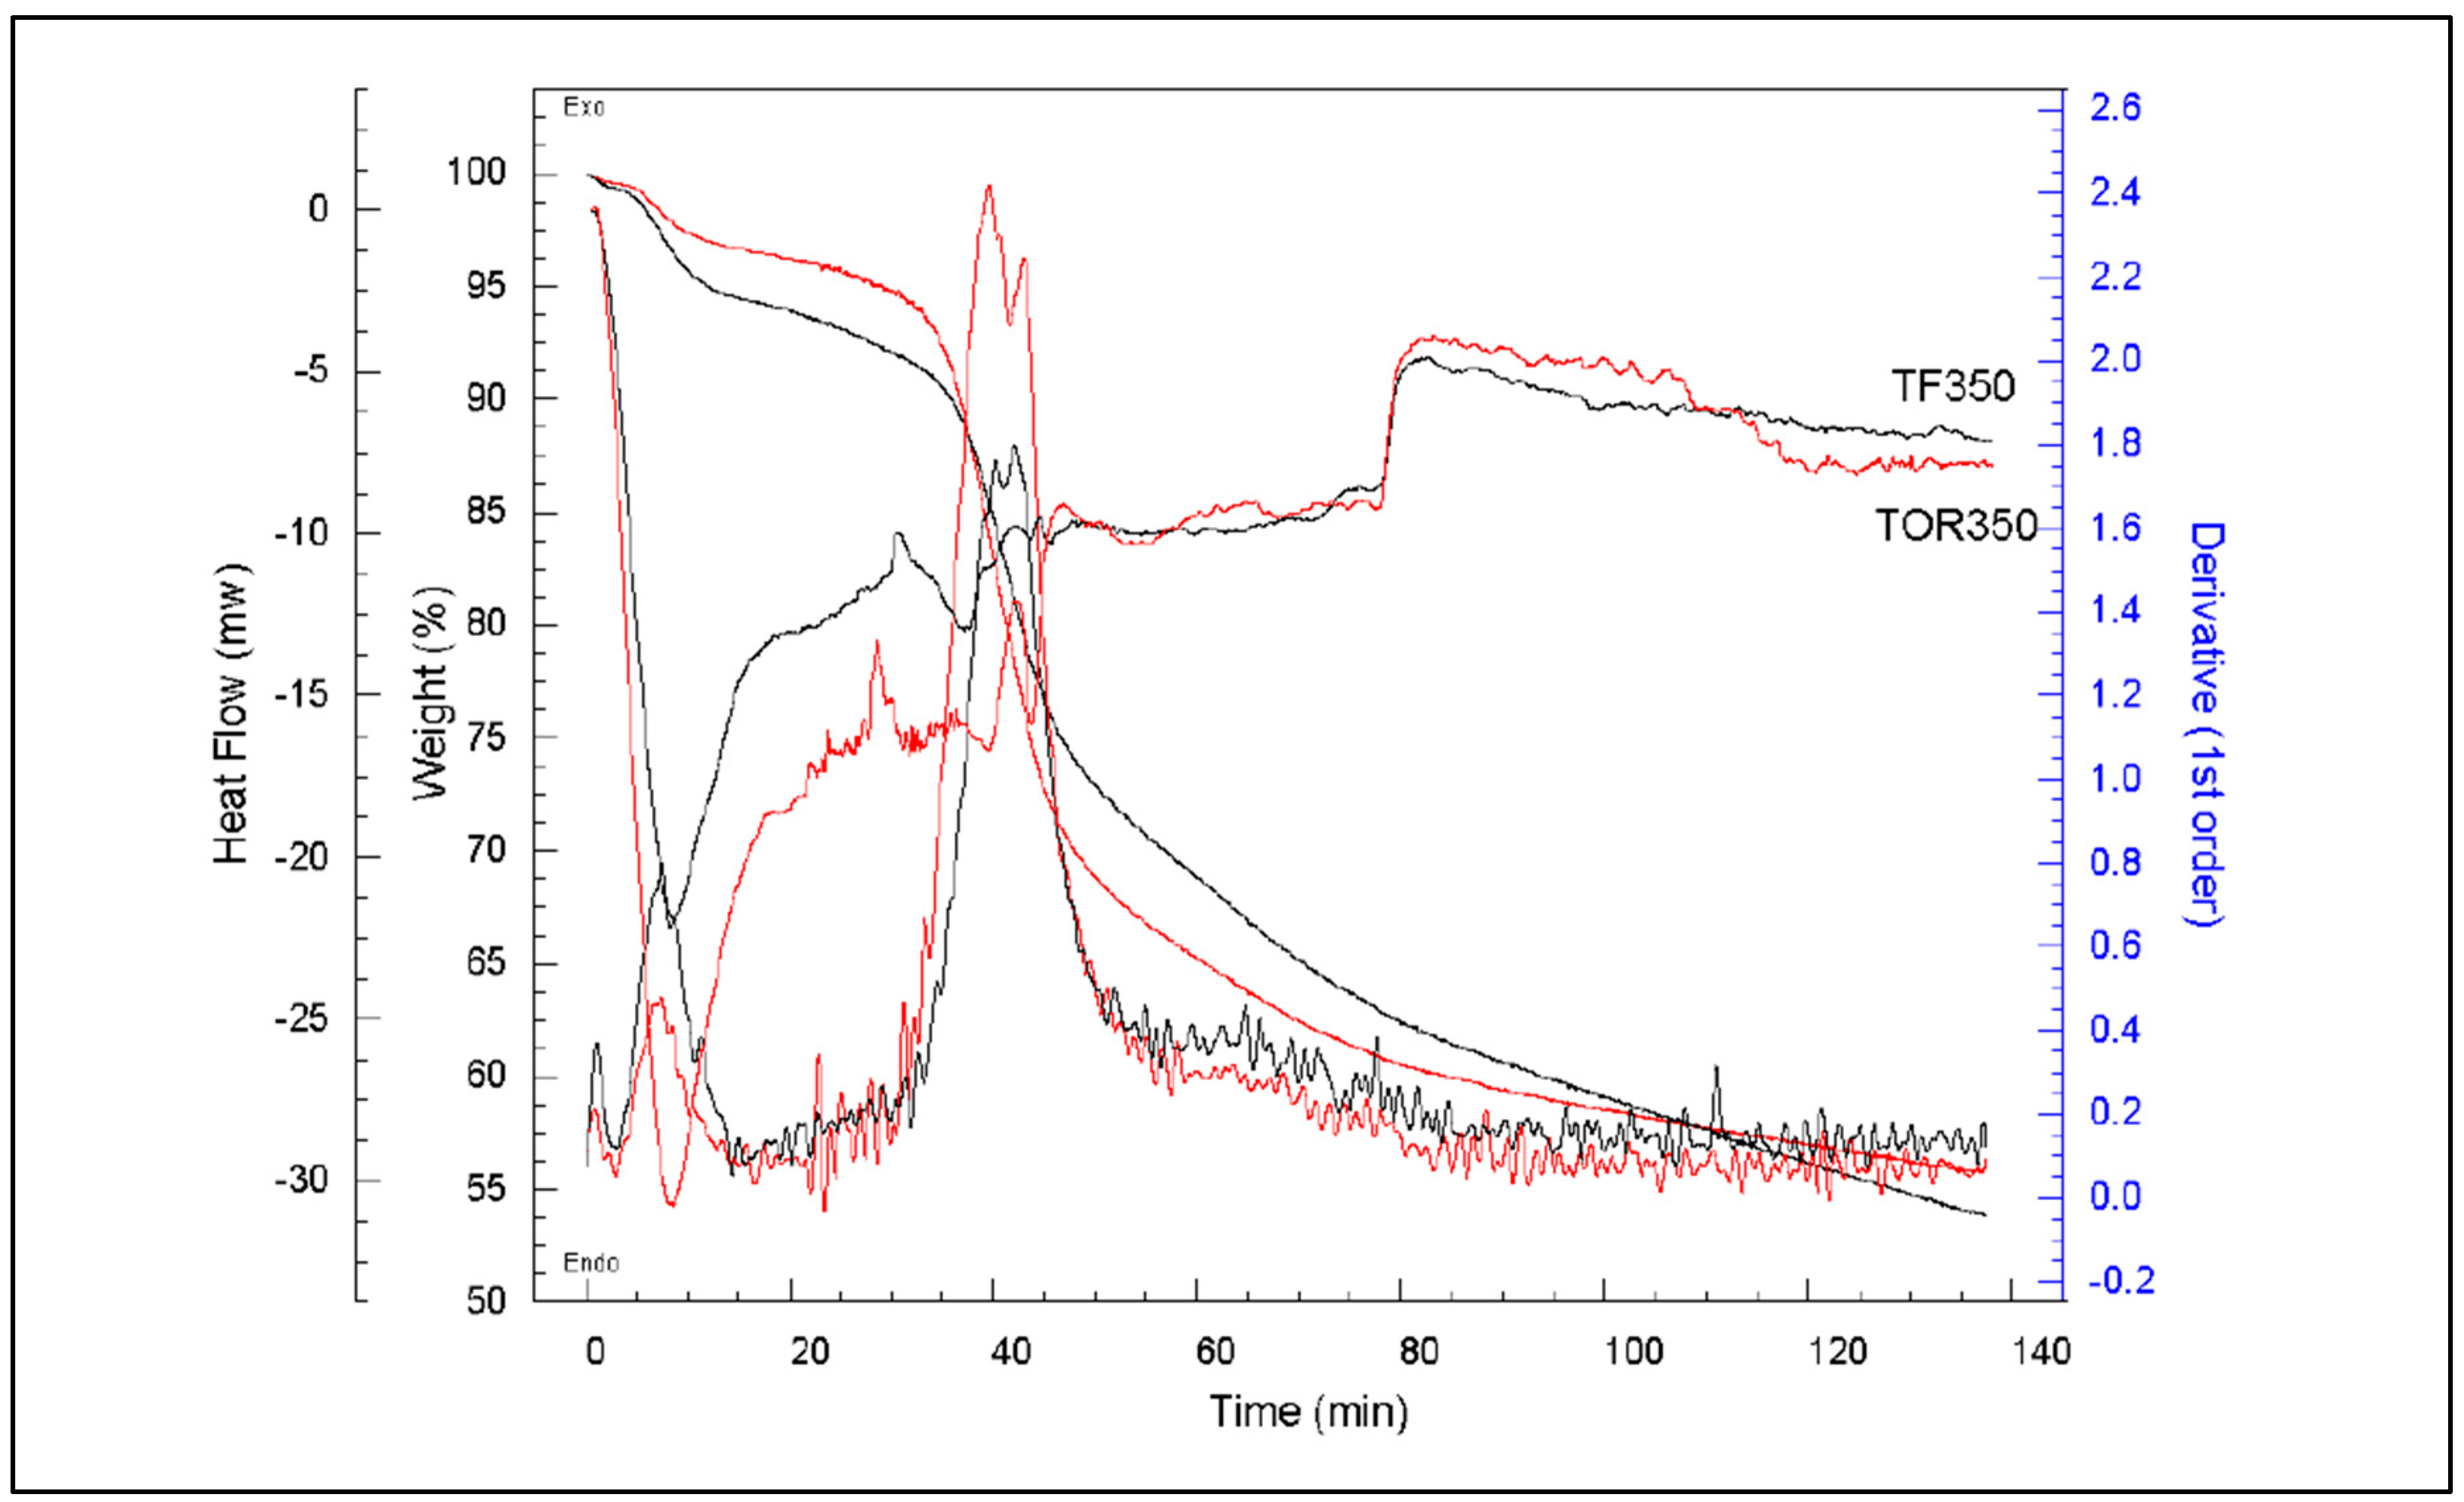
Figure 26.
TGA curves (TG, DTG, Heat flow) for HTC 216 biochar sample.
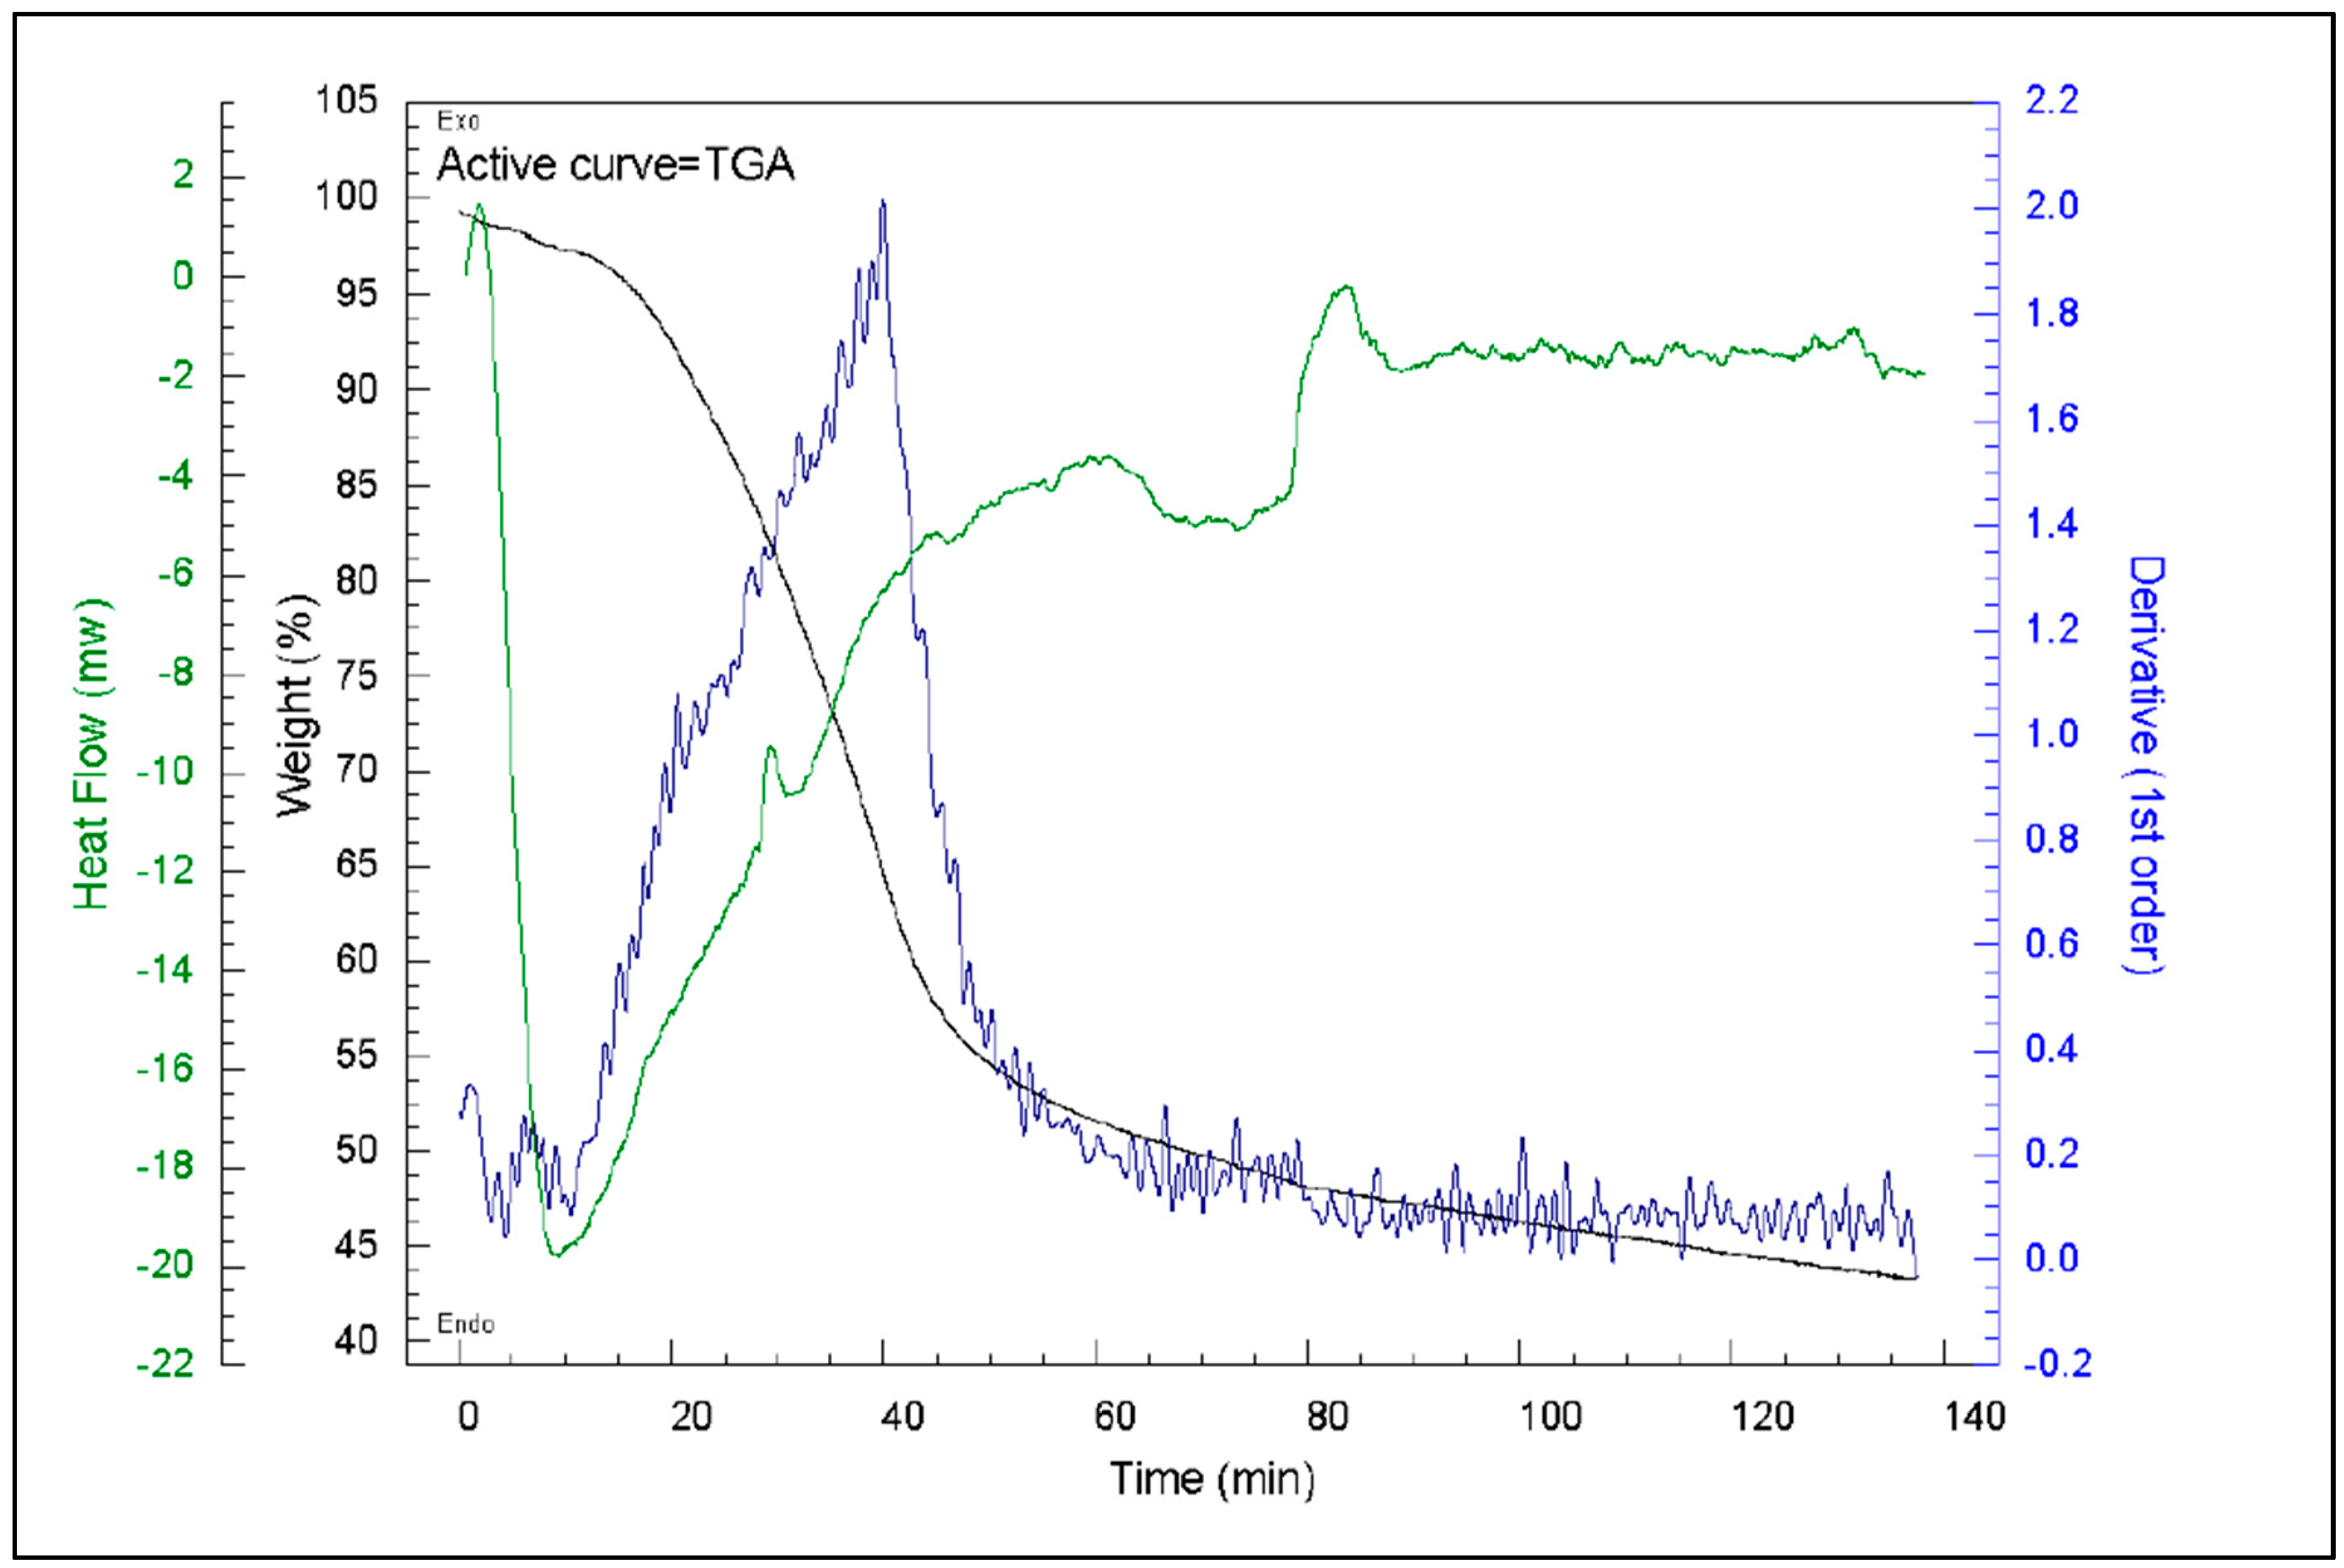
Figure 27.
Bubbles of water on the surface of TOR 350 demonstrating char hydrophobicity.
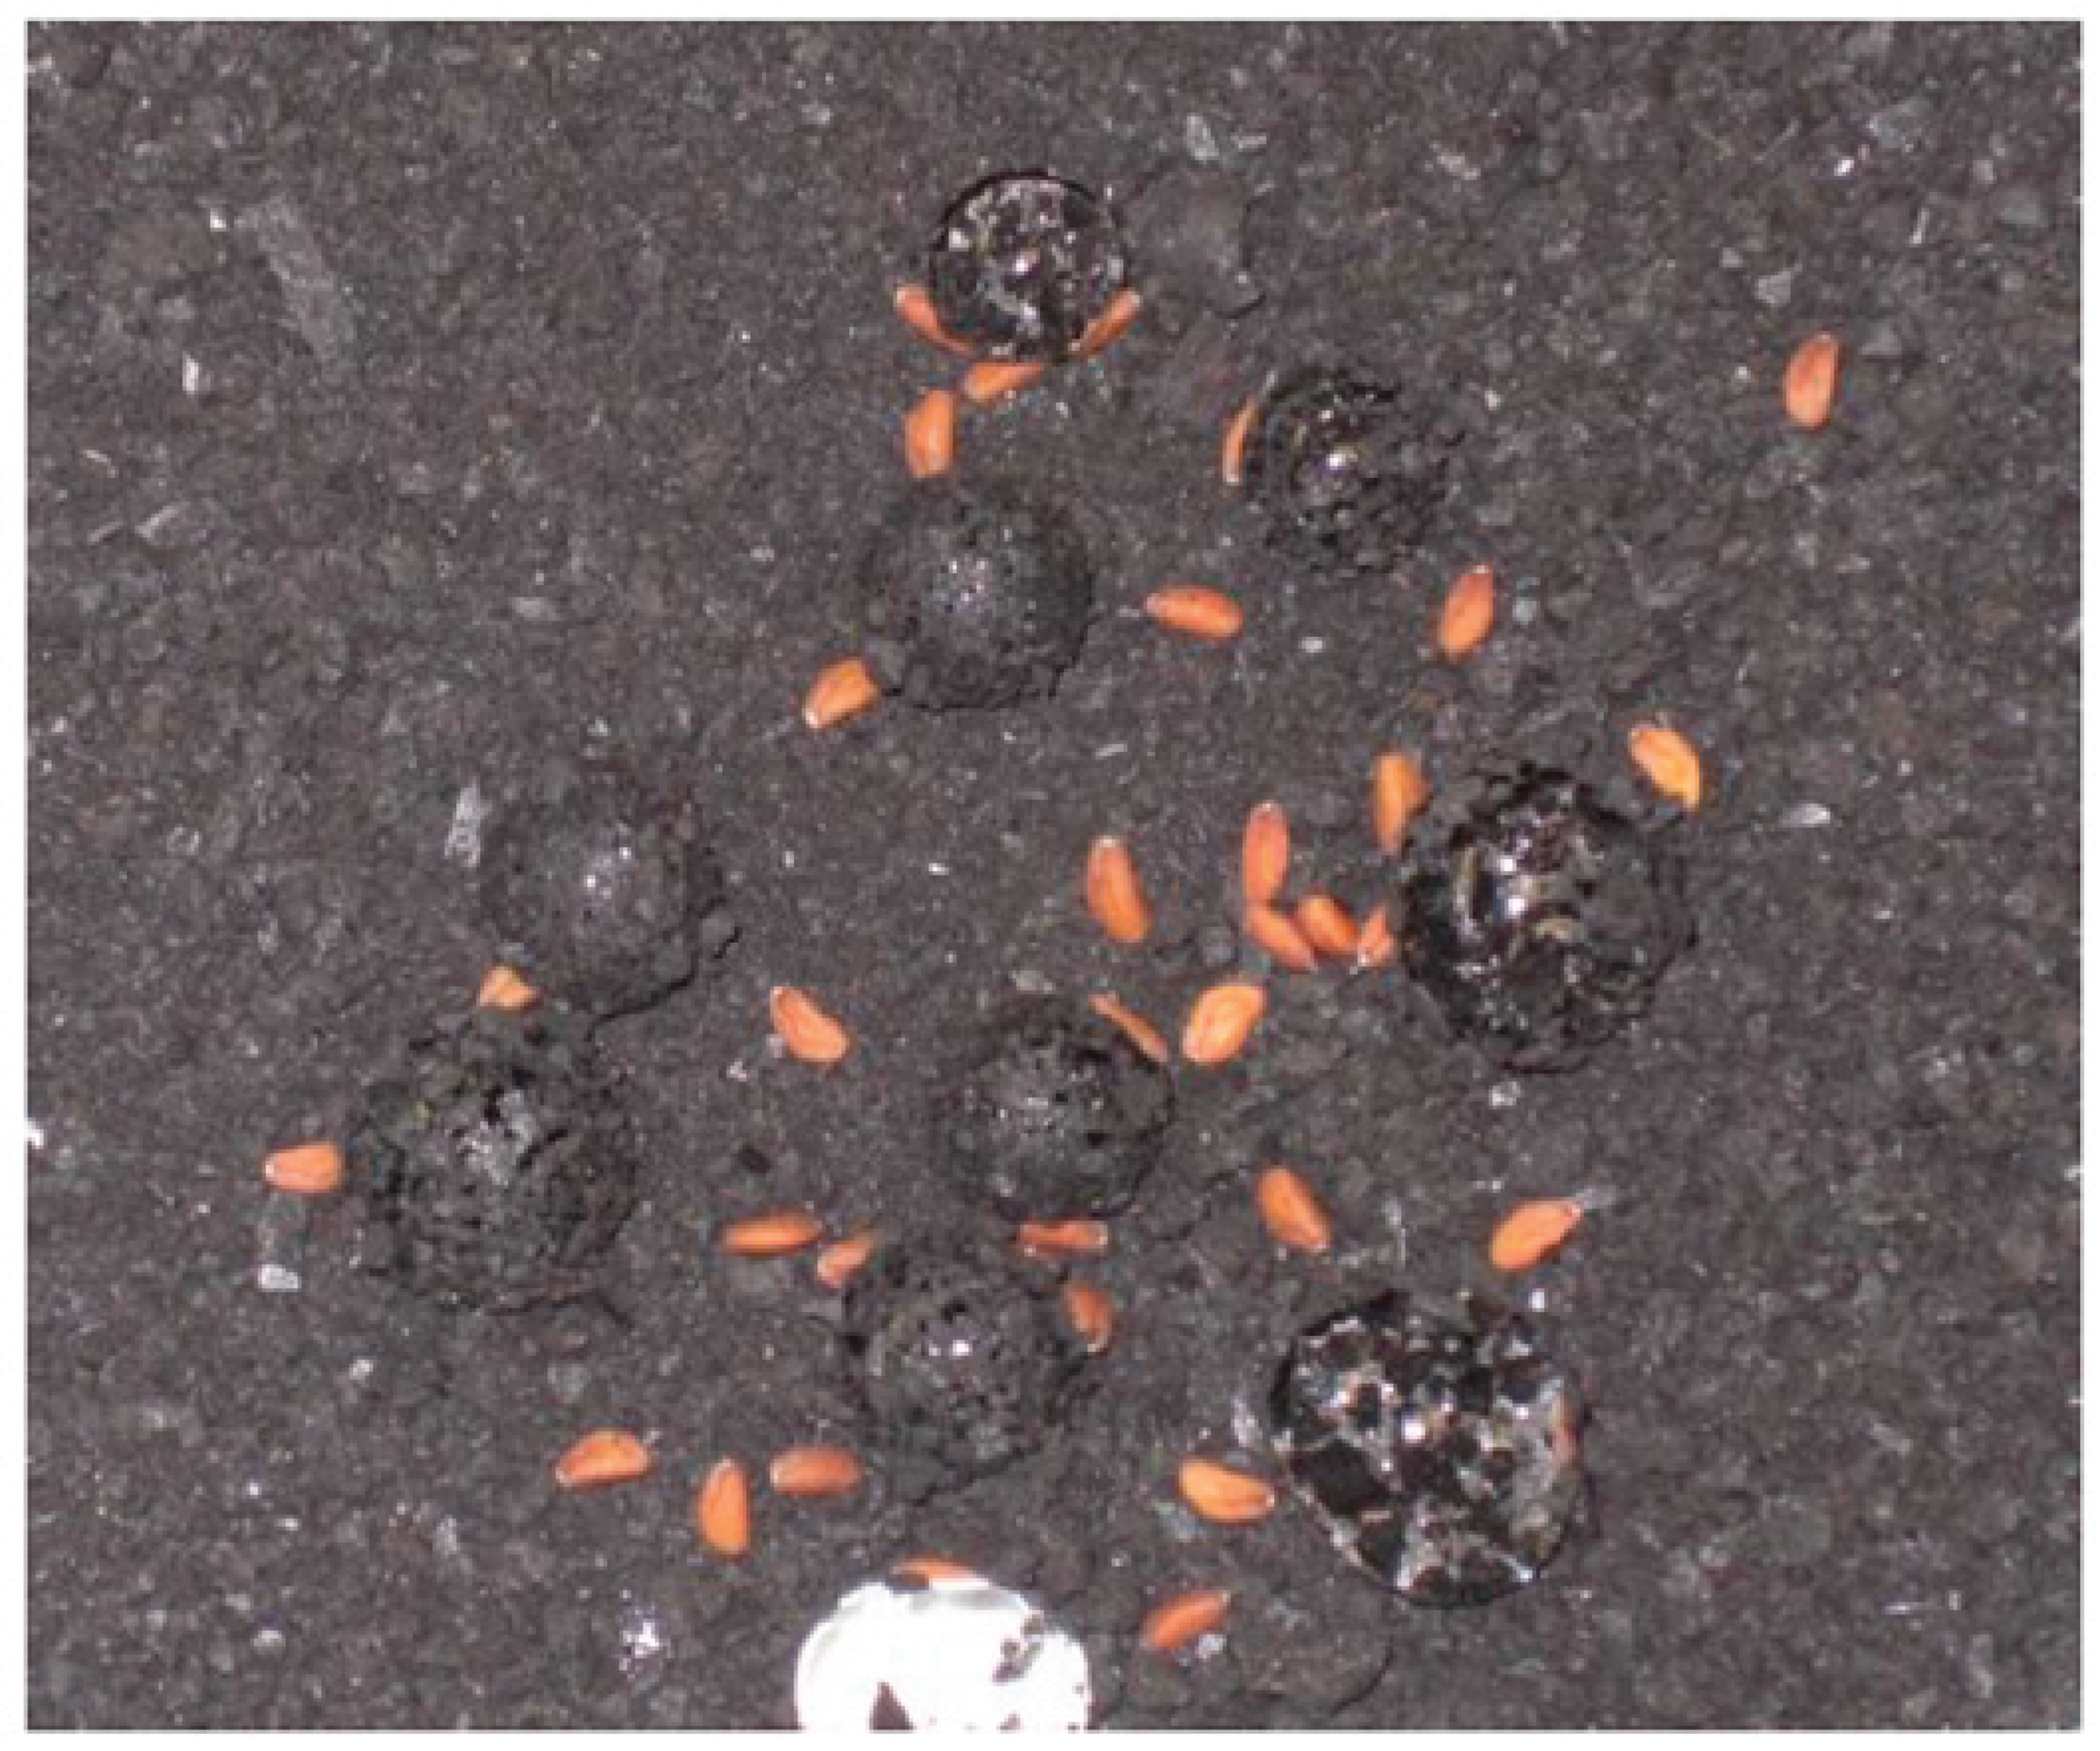
Figure 28.
Mean germination percentage over time (A) and root length at 7 days (B) for experiment 1.
Figure 28.
Mean germination percentage over time (A) and root length at 7 days (B) for experiment 1.
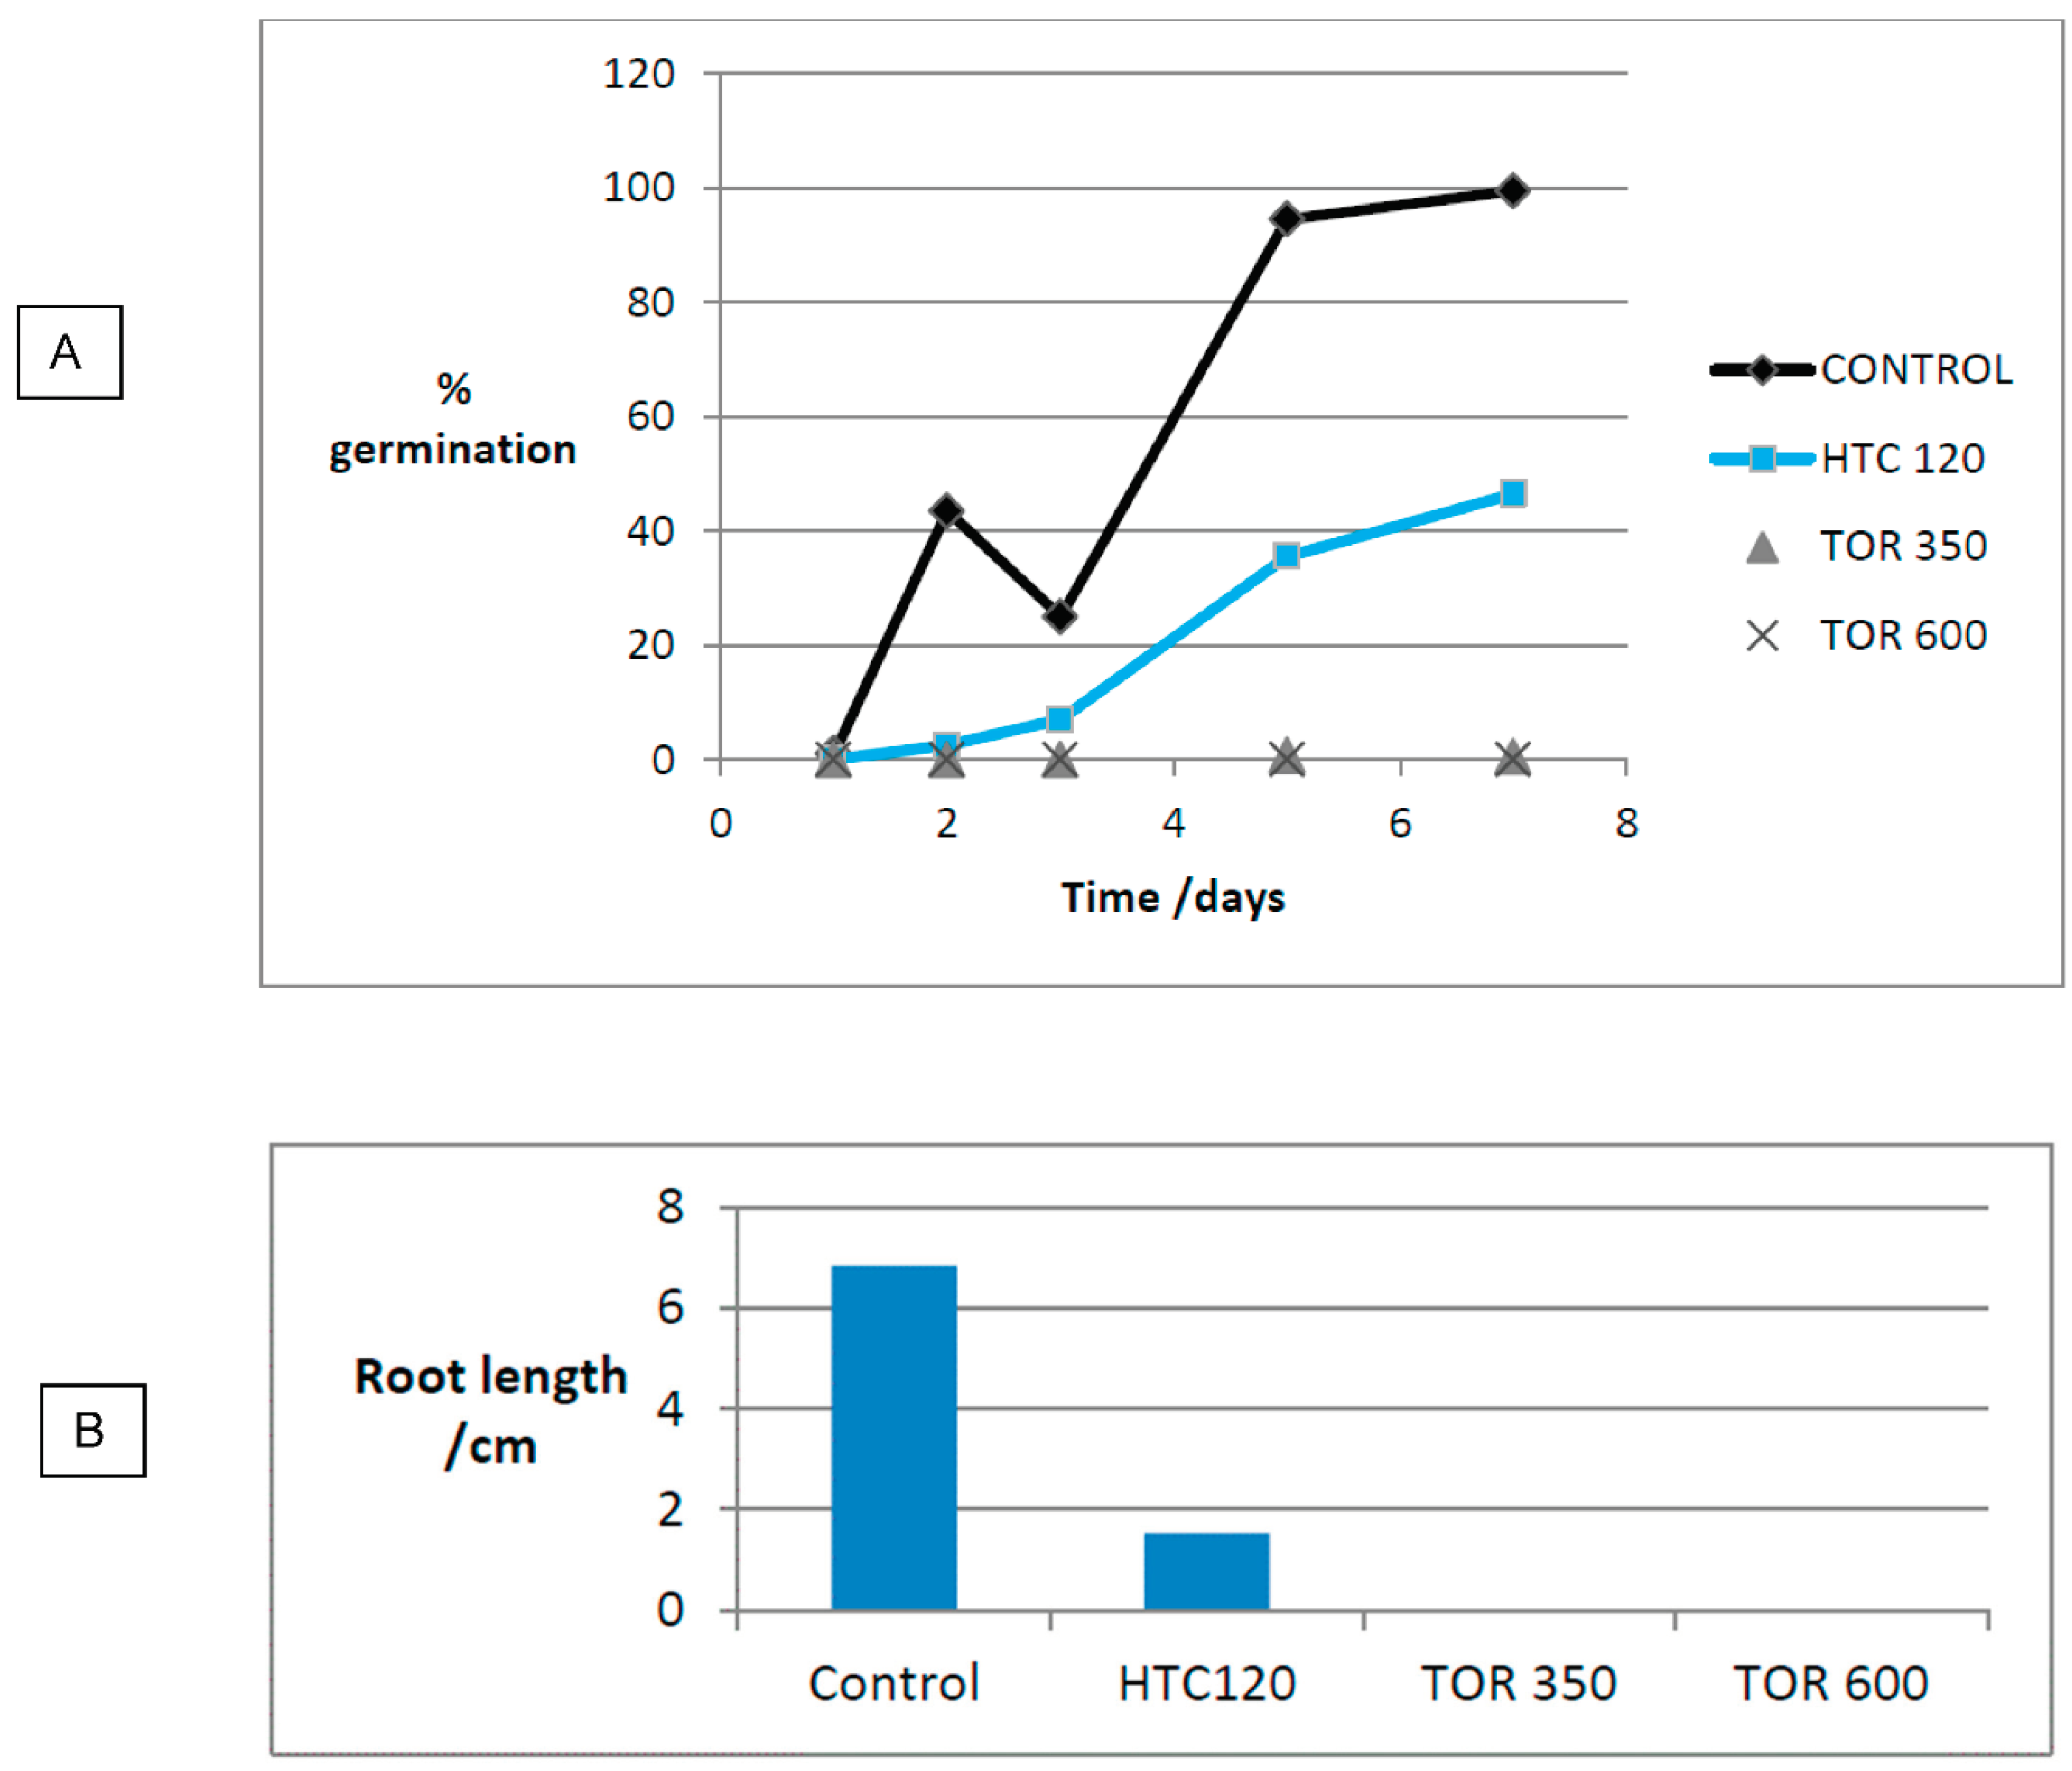
Figure 29.
Mean germination percentage (A), root length (B), and germination on PL day 7 (C) for experiment 2.
Figure 29.
Mean germination percentage (A), root length (B), and germination on PL day 7 (C) for experiment 2.
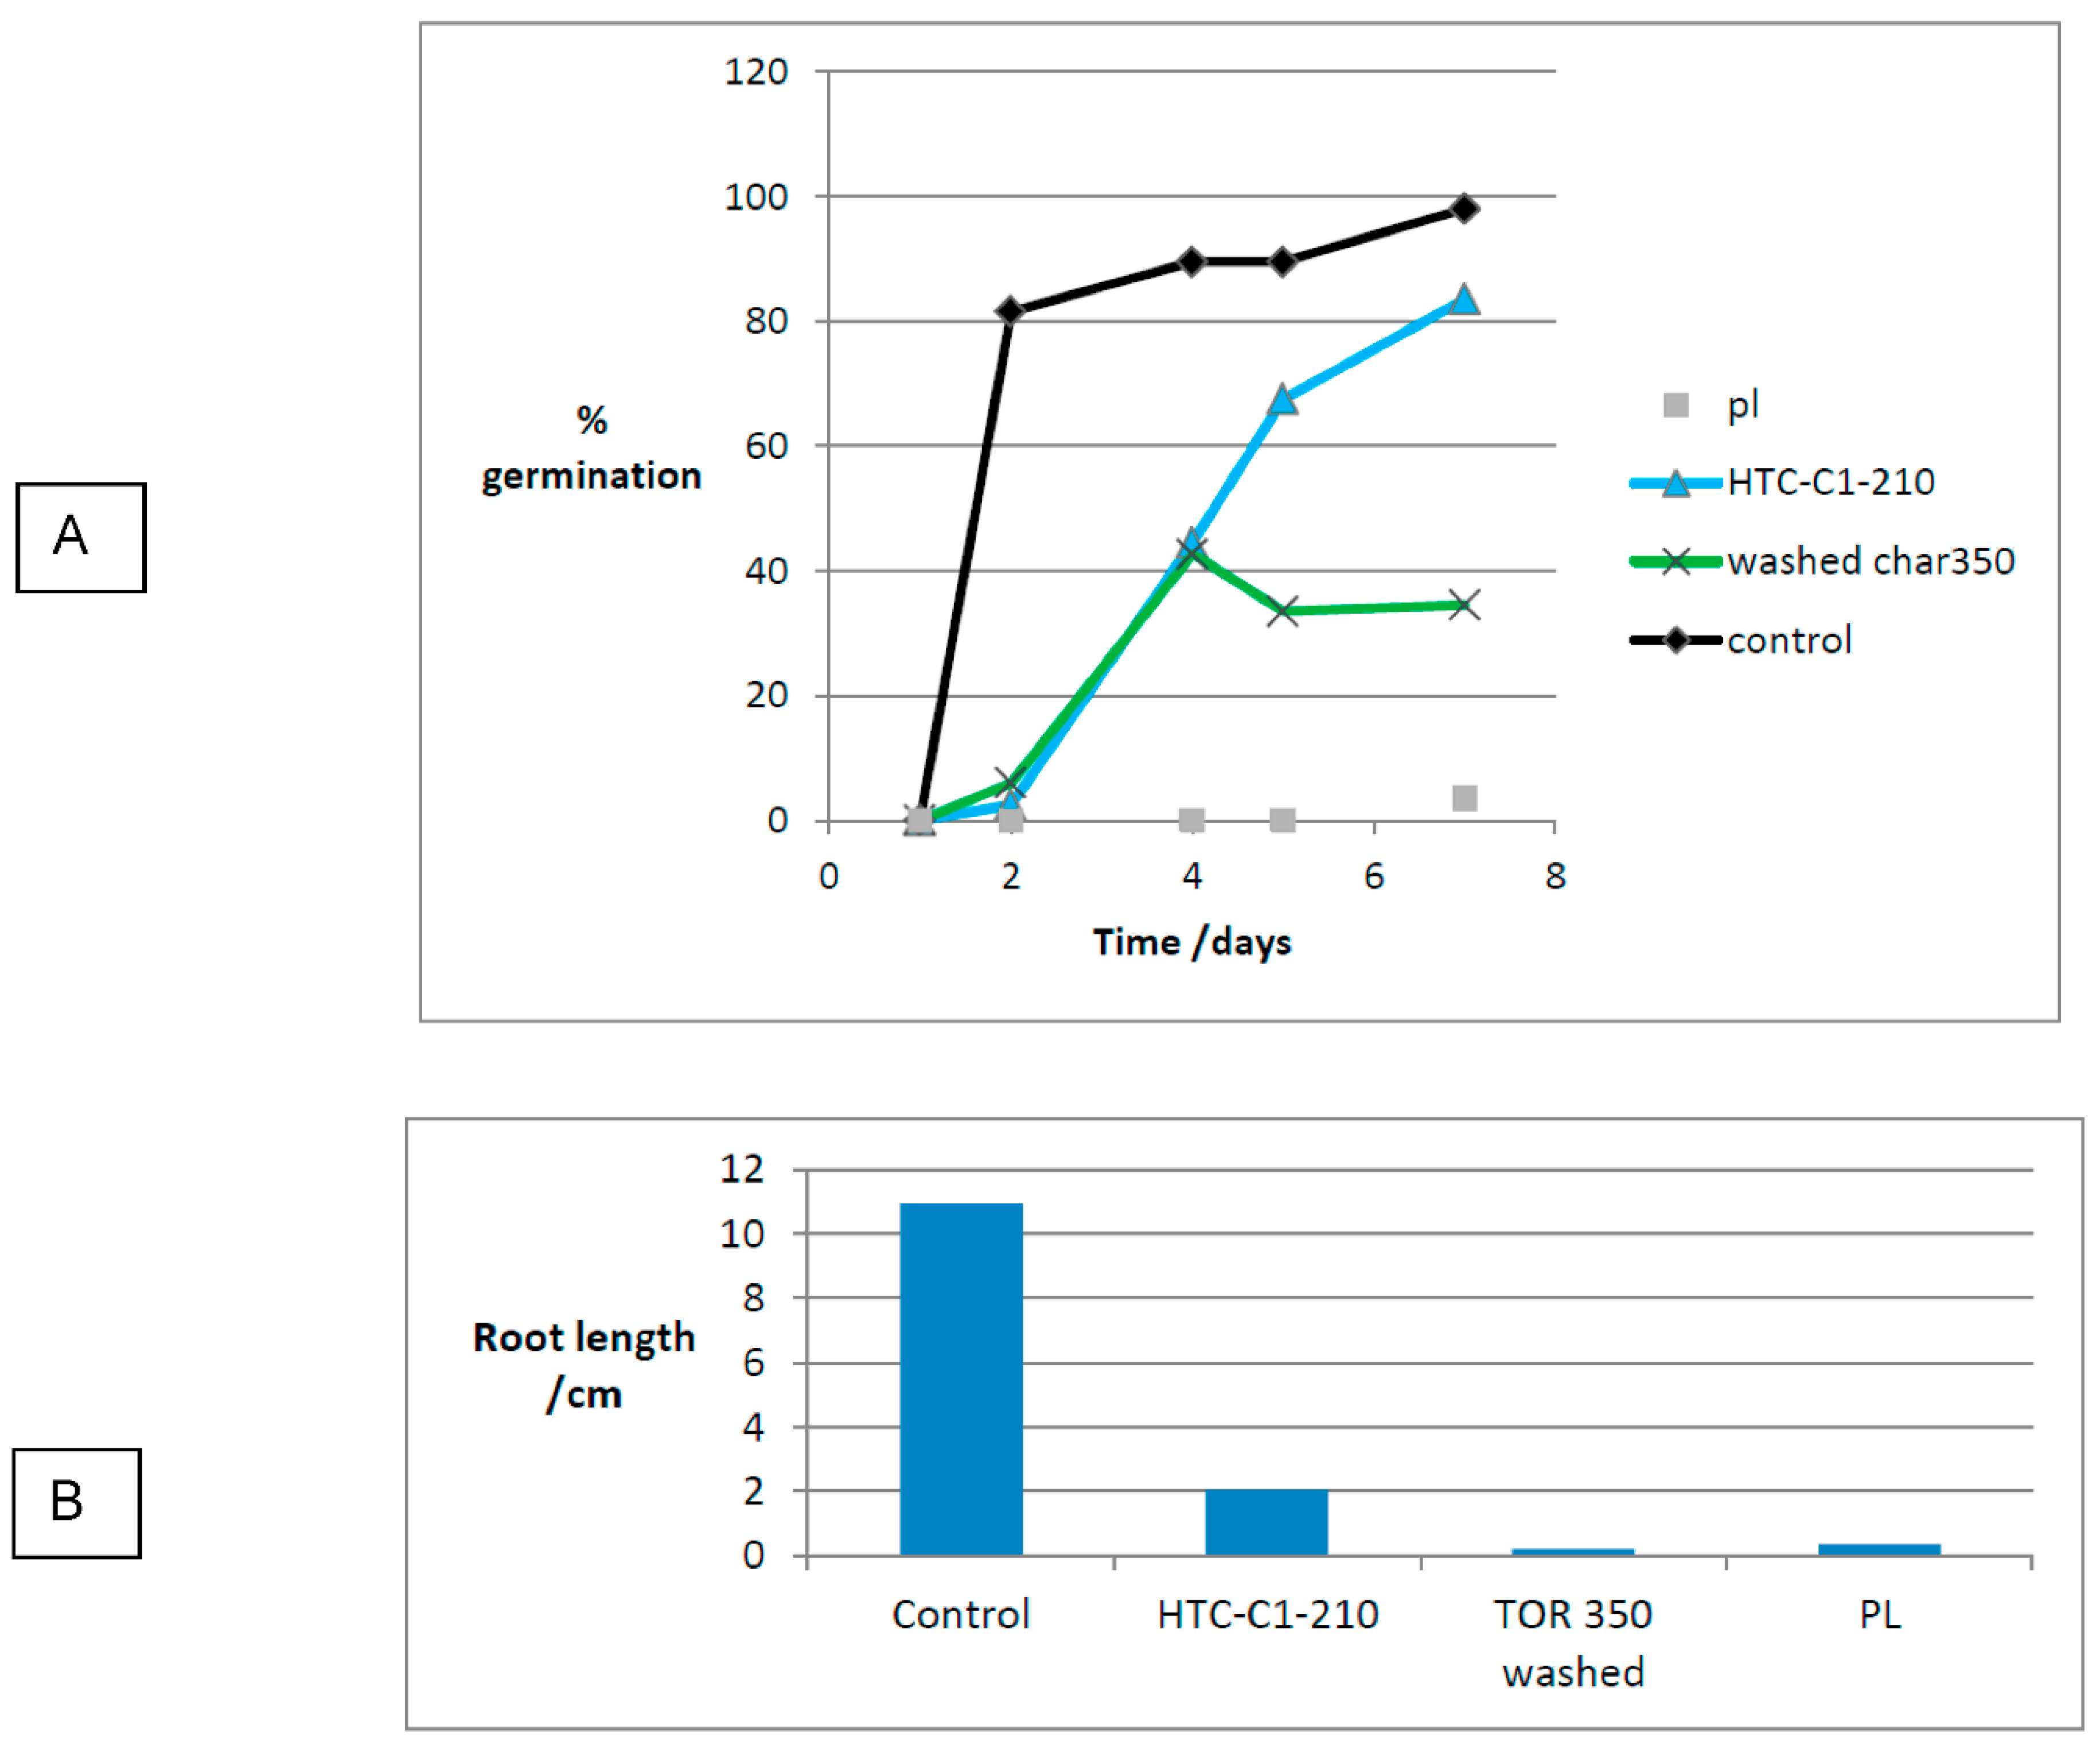
Figure 30.
Seeds after removal from experiment 1 on TOR 350.
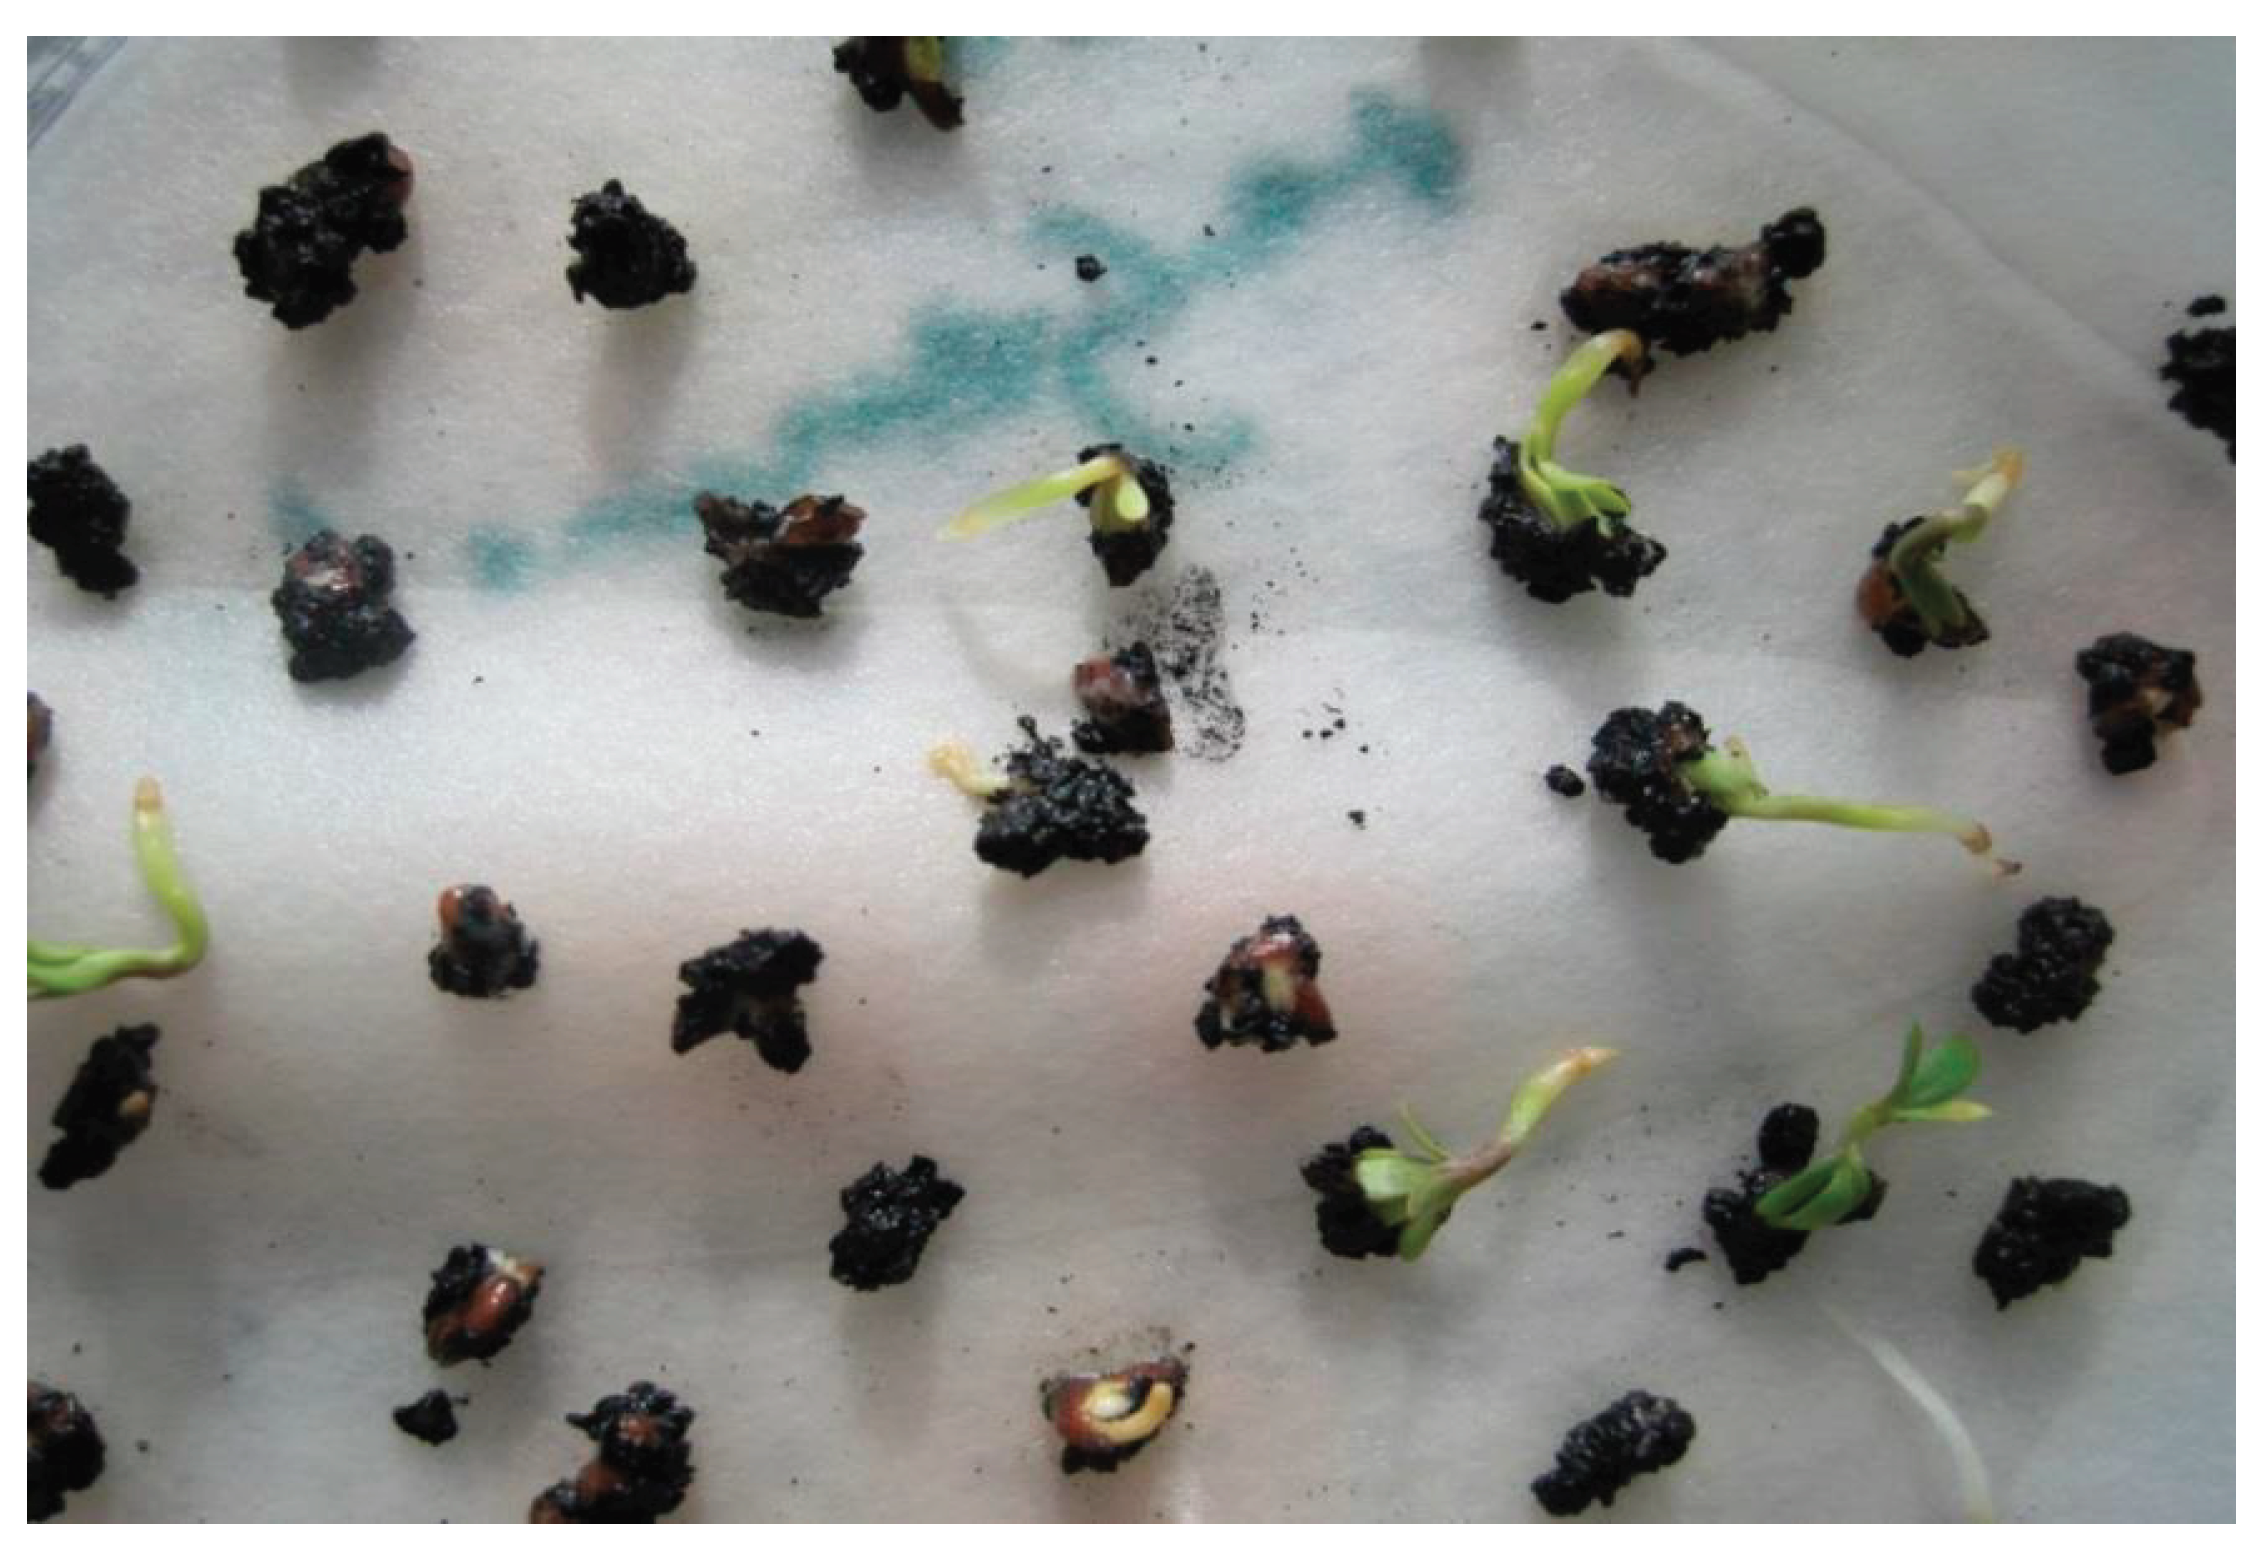
Figure 31.
Seeds germinating on washed TOR 350 showing wetness of biochar.
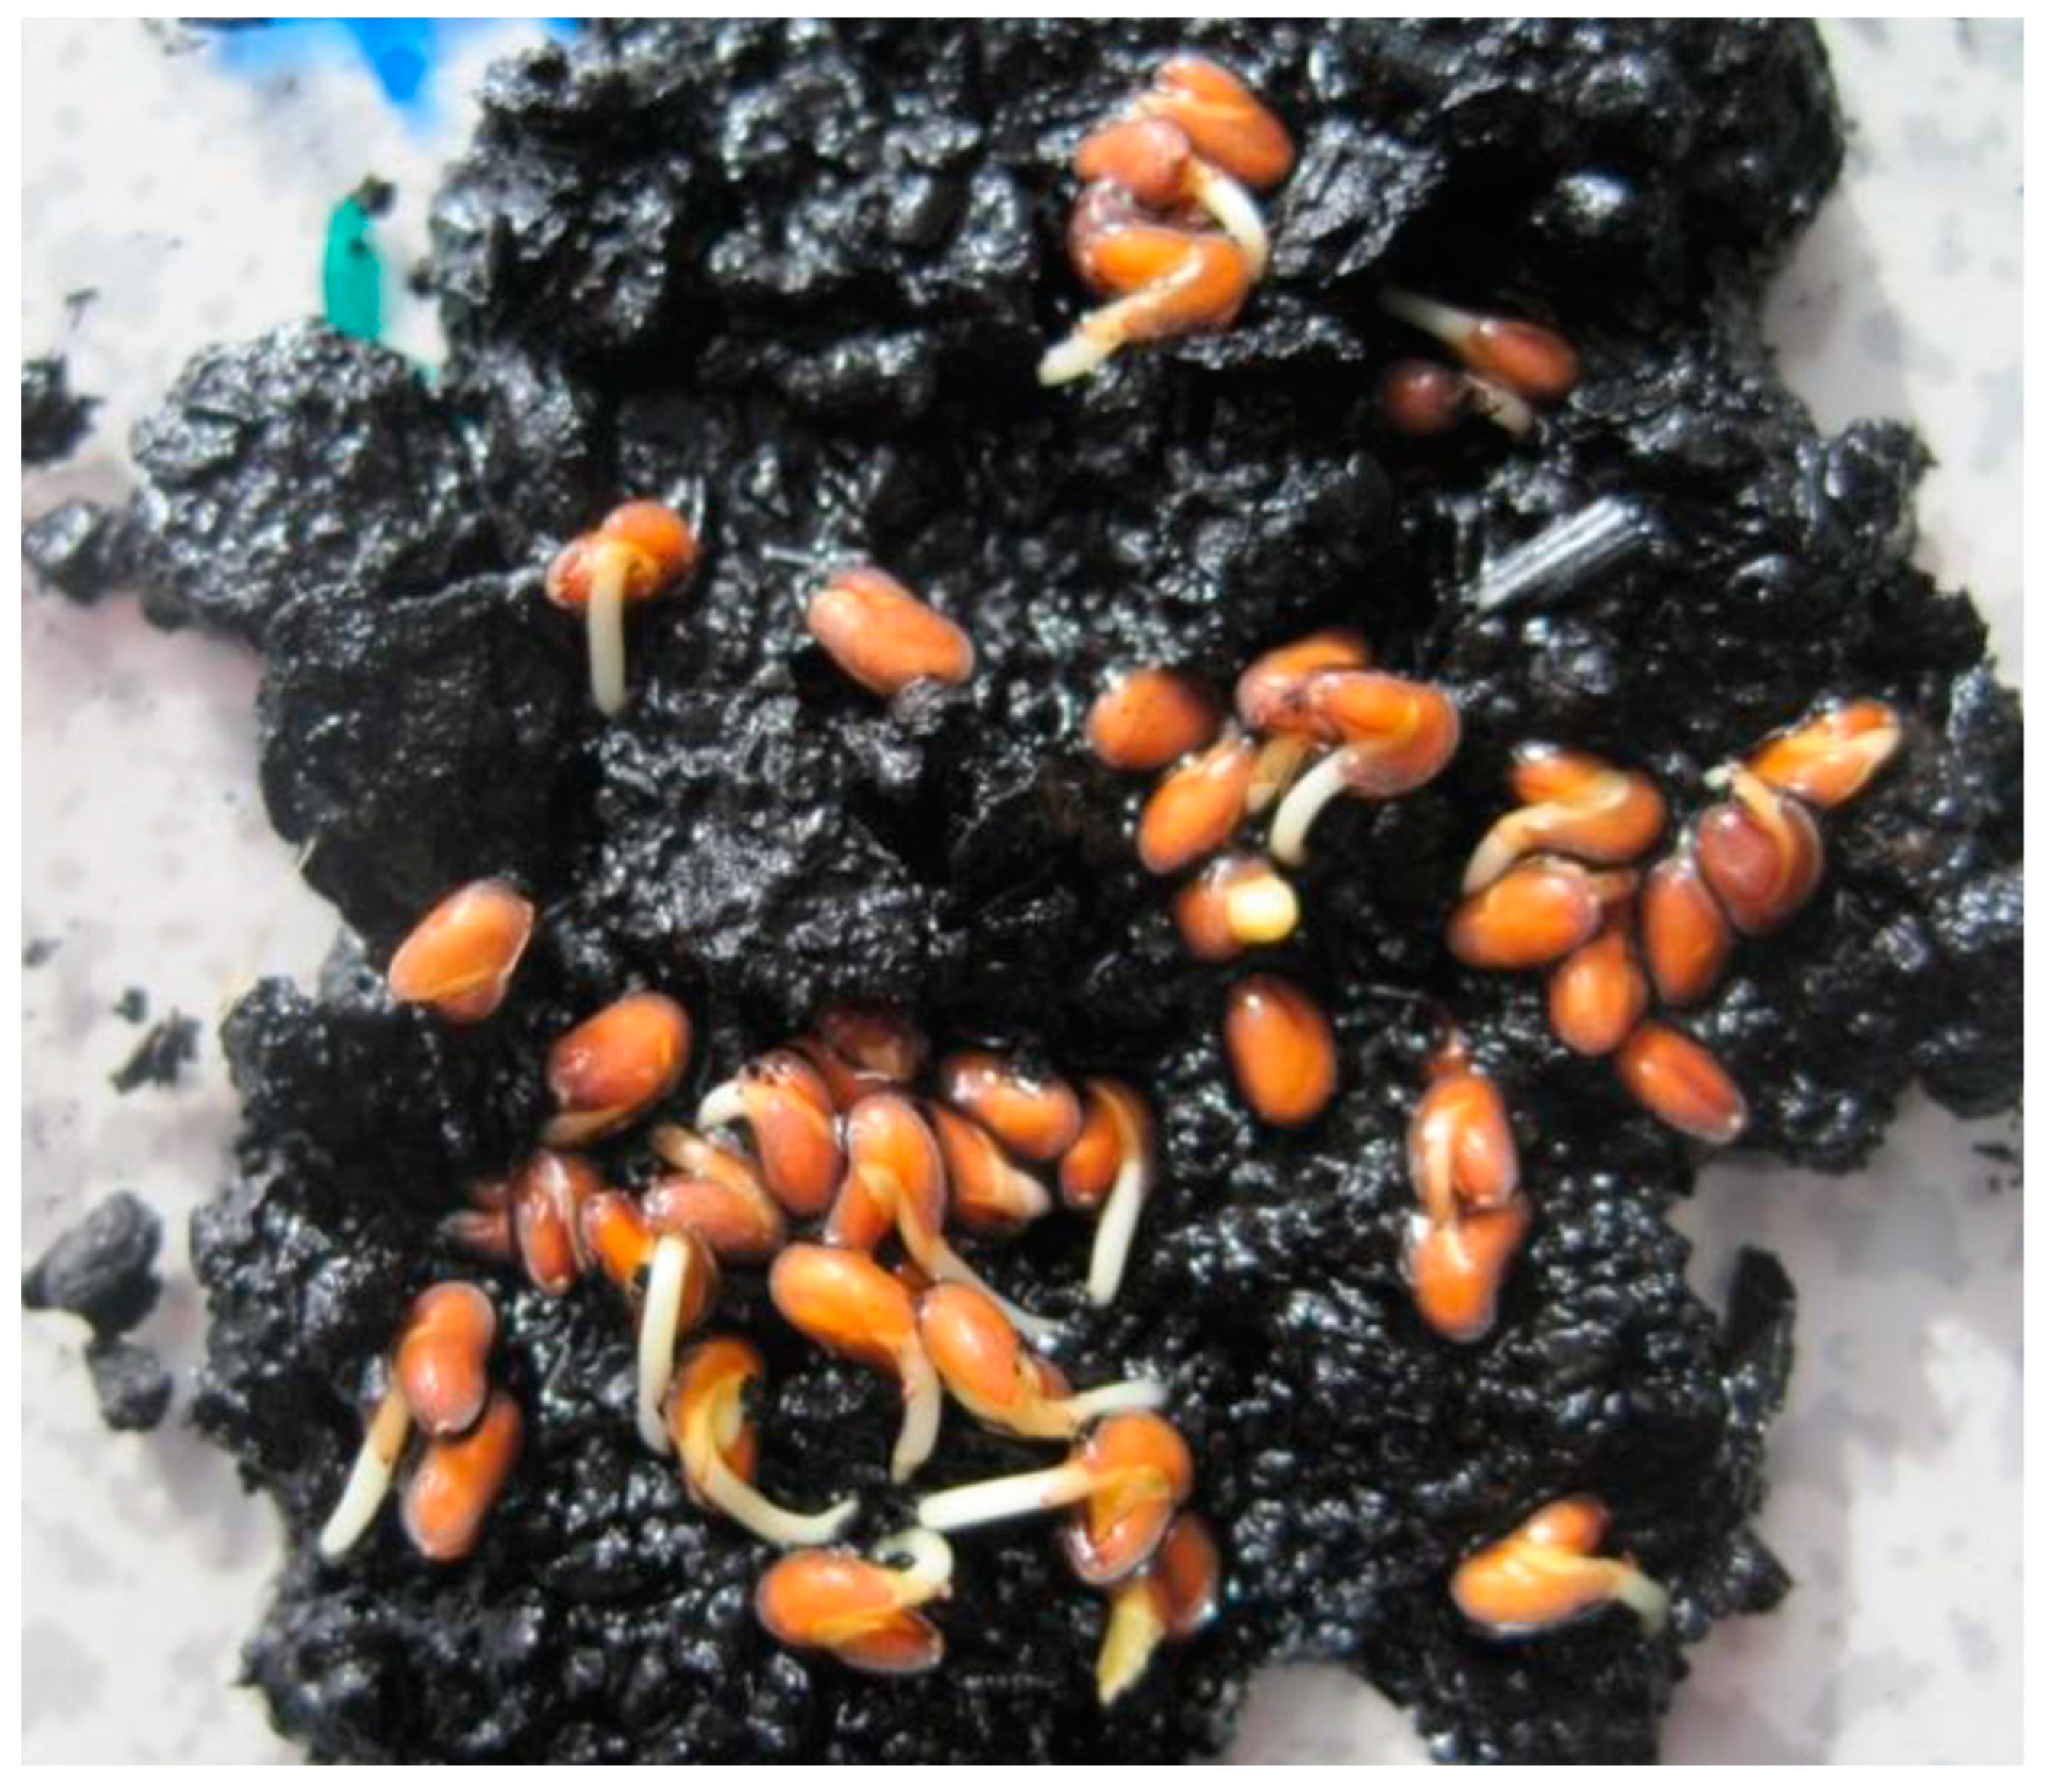
Figure 32.
Lignin torrefaction reactions. Reprinted with permission from Wen et al., 2014, Elsevier Ltd.
Figure 32.
Lignin torrefaction reactions. Reprinted with permission from Wen et al., 2014, Elsevier Ltd.
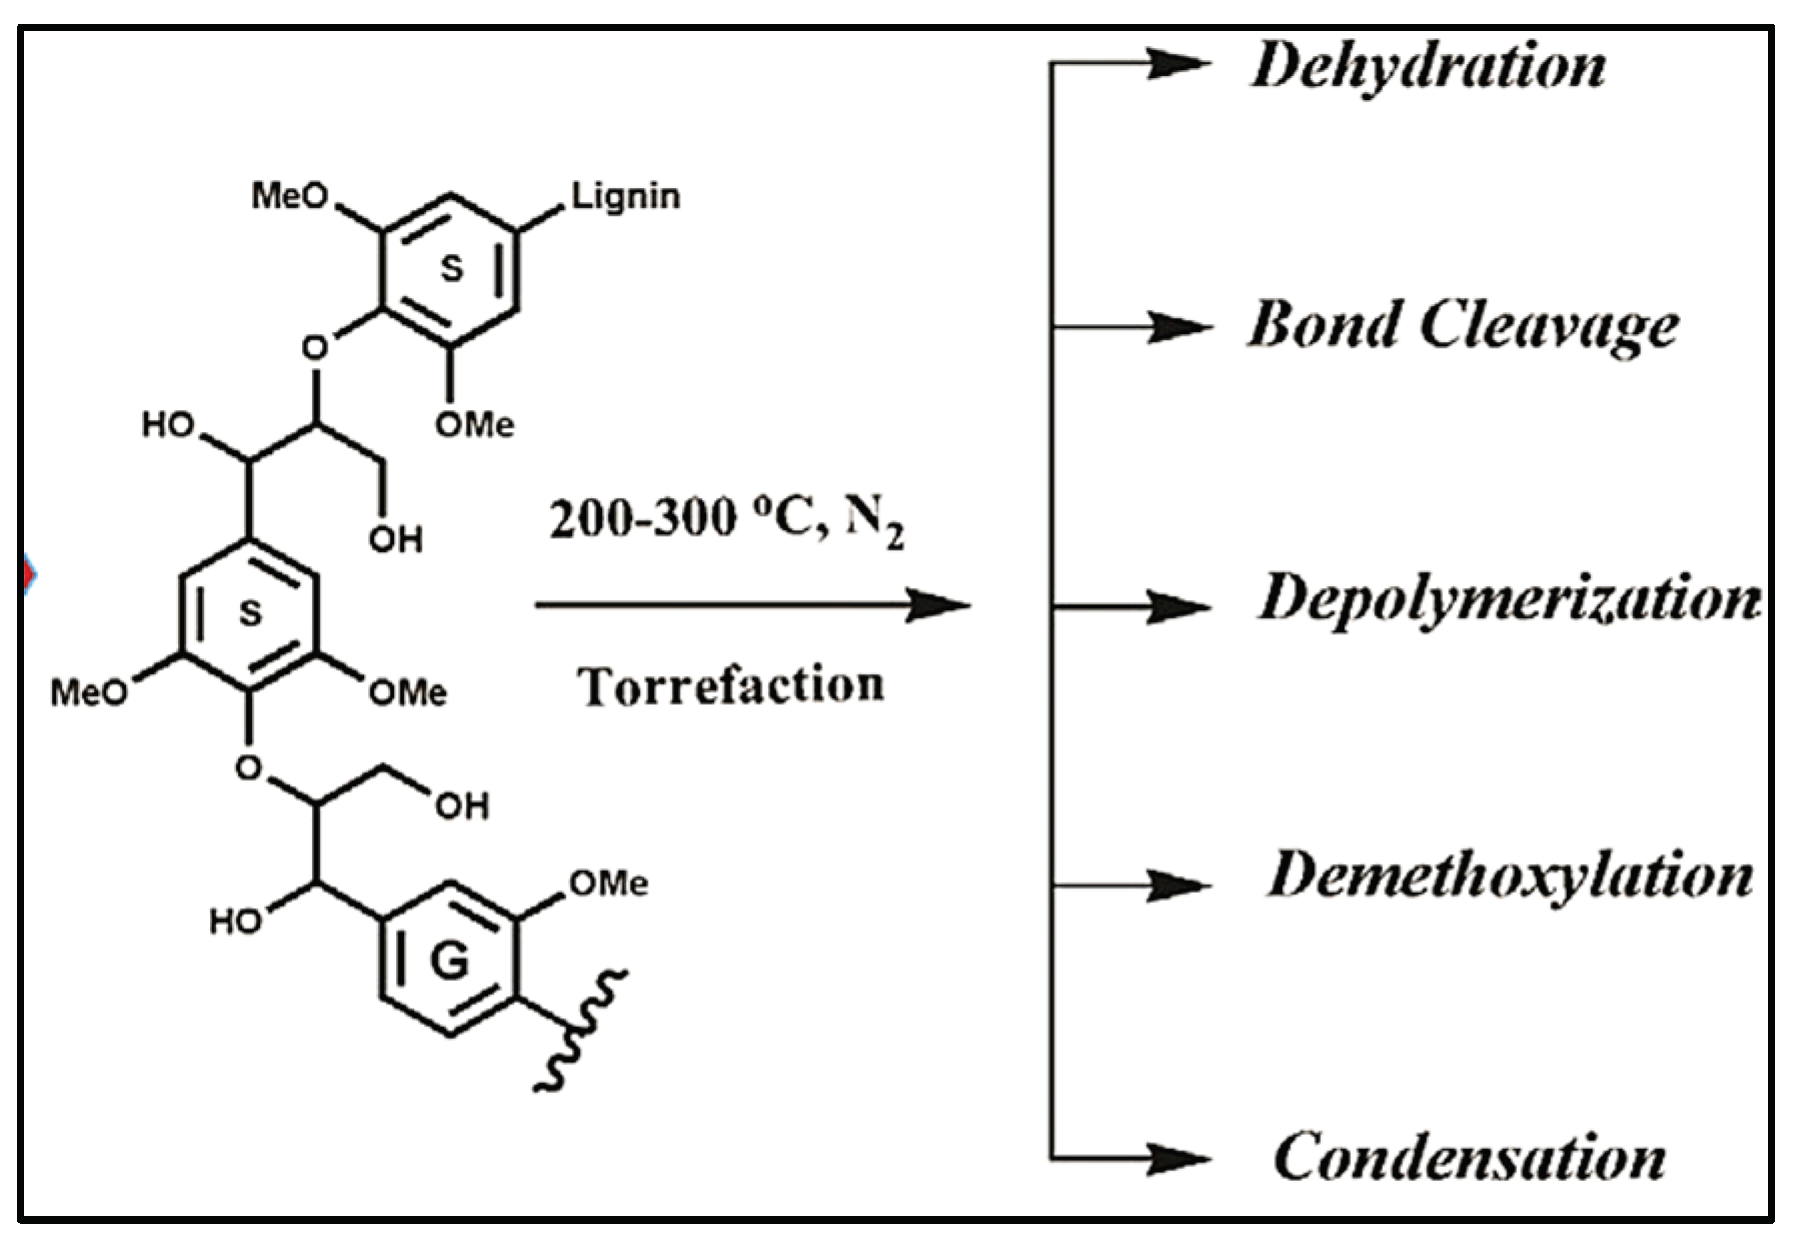
Table 2.
Biochar samples characterised by SEM only.
| Sample | Pore size | EDX | Structures and crystals |
| TOR 350 Strip | ✓✓✓ | ✓✓✓ | ✓✓✓ |
| TOR 600 Strip | ✓✓✓ | ✓✓✓ | ✓✓✓ |
| TOR 350 Ash | ✓✓✓ | ✓✓✓ | ✓✓✓ |
| TOR 400 Ash | ✓✓✓ | ✓✓✓ | ✓✓✓ |
| TOR 450 Ash | ✓✓✓ | ✓✓✓ | ✓✓✓ |
| TOR 500 Ash | ✓✓✓ | ✓✓✓ | ✓✓✓ |
| TOR 550 Ash | ✓✓✓ | ✓✓✓ | ✓✓✓ |
| TOR 600 Ash | ✓✓✓ | ✓✓✓ | ✓✓✓ |
| TOR 550 Ash strip | ✓✓✓ | ✓✓✓ | ✓✓✓ |
| TOR 600 Ash strip | ✓✓✓ | ✓✓✓ | ✓✓✓ |
| Feather | ✓✓✓ | ✓✓✓ | |
| Wheat | ✓✓✓ | ✓✓✓ | |
| Barley | ✓✓✓ | ✓✓✓ | |
| Egg shell | ✓✓✓ | ✓✓✓ | ✓✓✓ |
| KCl crystals | ✓✓✓ | ✓✓✓ |
Table 3.
XRD peaks’ identification for TOR 350. TOR 450, and TOR 550 biochar samples, respectively.
| TOR 350 | TOR 450 | TOR 550 |
Identification |
|||
| 2θ | Intensity (counts) | 2θ | Intensity (counts) | 2θ | Intensity (counts) | |
| 28.6 29.6 30.46 36.46 40.74 43.4 50.52 60.56 73.84 |
514 266 178 178 290 148 142 110 98 |
28.44 40.64 |
390 239 |
28.44 29.48 30.92 40.62 50.28 58.7 59.86 66.34 73.74 83.56 86.62 |
504 278 244 291 137 96 84 93 90 70 74 |
Sylvite Calcite (Tsai et al., 2012) Pyrocoproite (K2MgP2O7) Quartz (SiO2) Sylvite Quartz (SiO2) Sylvite Sylvite Quartz (SiO2) Sylvite Sylvite (Anon, 2008) Unidentified Unidentified |
Table 4.
EDX composition of the fresh torrefied biochar’s samples.
| Element | Mean (weight %) | ||||
| Production temperature (°C) | |||||
| 350 | 400 | 500 | 550 | 600 | |
| C | 60.4 | 69.7 | 69.0 | 68.5 | 69.8 |
| O | 24.2 | 22.8 | 21.3 | 19.2 | 21.5 |
| Na | 0.7 | 0.5 | 0.6 | 0.5 | 0.6 |
| Mg | 1.1 | 0.6 | 0.8 | 0.8 | 0.6 |
| P | 1.7 | 0.9 | 1.3 | 1.3 | 1.1 |
| S | 0.5 | 0.5 | 0.5 | 0.5 | 0.5 |
| Cl | 2.0 | 0.7 | 0.9 | 1.2 | 0.7 |
| K | 7.2 | 3.1 | 4.2 | 6.5 | 3.7 |
| Ca | 1.7 | 1.0 | 1.3 | 1.4 | 1.2 |
| Si | 0.3 | 0.2 | 0.2 | 0.5 | 0.2 |
| Cu | ND | ND | ND | ND | 0,2 |
| Al | 0.1 | ND | 0.2 | ND | ND |
| Y | 0.6 | ND | ND | ND | ND |
Table 5.
EDX composition of the 6-month aged torrefied biochar’s samples.
| Element | Mean (weight %) | |||||
| Production temperature (°C) | ||||||
| 350 | 400 | 450 | 500 | 550 | 600 | |
| C | 58.3 | 60.3 | 50.6 | 49.4 | 45.0 | 47.1 |
| O | 26.3 | 25.0 | 25.2 | 27.3 | 30.0 | 27.5 |
| Na | 0.7 | 0.7 | 0.9 | 0.9 | 1.3 | 1.1 |
| Mg | 1.2 | 1.2 | 1.8 | 1.8 | 2.1 | 1.9 |
| P | 1.9 | 1.9 | 2.9 | 2.8 | 3.0 | 3.1 |
| S | 0.8 | 0.7 | 1.0 | 0.9 | 0.8 | 1.0 |
| Cl | 1.4 | 1.3 | 2.4 | 2.0 | 2.4 | 2.2 |
| K | 6.7 | 6.1 | 10.8 | 10.4 | 11.1 | 11.0 |
| Ca | 2.3 | 2.2 | 4.2 | 3.7 | 3.8 | 4.6 |
| Si | 0.4 | 0.4 | 0.3 | 0.6 | 0.7 | 0.7 |
| Fe | ND | ND | ND | ND | 0.3 | ND |
| Mn | ND | ND | ND | ND | ND | ND |
| Y | ND | ND | ND | ND | ND | ND |
| Cu | ND | ND | ND | ND | ND | ND |
| Al | 0.2 | 0.3 | ND | ND | ND | ND |
| Br | ND | ND | 0.6 | ND | ND | ND |
Table 6.
EDX composition of the TF biochar samples.
| Element | Mean (weight %) | |||
| Production temperature (°C) | ||||
| 135 | 200 | 275 | 350 | |
| C | 48.3 | 44.2 | 48.4 | 48.9 |
| O | 42.4 | 44.3 | 35.5 | 31.4 |
| Na | 0.4 | 0.5 | 0.7 | 0.8 |
| Mg | 0.8 | 1.1 | 1.4 | 1.8 |
| P | 1.2 | 1.6 | 2.0 | 2.6 |
| S | 0.8 | 0.6 | 0.9 | 0.9 |
| Cl | 0.7 | 0.8 | 1.4 | 1.4 |
| K | 3.8 | 4.5 | 6.8 | 9.0 |
| Ca | 1.3 | 2.0 | 2.5 | 2.9 |
| Si | 0.2 | 0.3 | 0.3 | 0.3 |
| Mn | ND | ND | ND | 0.1 |
Table 7.
EDX composition of the HTC biochar samples.
| Element | Mean (weight %) | ||
| Production temperature (°C) | |||
| 80 | 120 | 221 | |
| C | 58.2 | 49.8 | 51.9 |
| O | 39.7 | 46.0 | 44.3 |
| Na | 0.0 | 0.0 | 0.0 |
| Mg | 0.1 | 0.2 | 0.2 |
| P | 0.3 | 0.4 | 0.4 |
| S | 0.4 | 0.6 | 0.5 |
| Cl | 0.1 | 0.2 | ND |
| K | 0.4 | 1.0 | 0.9 |
| Ca | 0.4 | 1.8 | 1.4 |
| Si | 0.1 | 0.3 | 0.2 |
| Fe | ND | ND | ND |
| Mn | ND | ND | 0.1 |
| Y | ND | ND | ND |
| Cu | ND | ND | ND |
| Al | ND | ND | ND |
| Br | 0.1 | ND | ND |
Table 9.
ICP-MS results for TOR and TF biochars samples compared to PL.
| Chars | Concentration minus blank sample’s concentration (ppb) | |||||||||
| Na | Mg | Al | K | Ca | Mn | Cu | Zn | Sr | Ba | |
| TOR 350 | 61.3 | 95.0 | 3.1 | 20.5 | 106.6 | 7.0 | 1.6 | 7.9 | 0.4 | 0.2 |
| TOR 450 | 24.3 | 131.8 | 4.9 | 0.0 | 157.5 | 9.6 | 2.7 | 6.5 | 0.7 | 0.5 |
| TOR 550 | 69.5 | 146.0 | 4.4 | 0.0 | 155.5 | 12.1 | 1.3 | 5.2 | 0.7 | 0.5 |
| TOR 600 | 77.9 | 138.5 | 3.8 | 0.0 | 177.9 | 10.6 | 0.9 | 3.1 | 0.7 | 0.5 |
| TF 200 | 0.0 | 45.5 | 0.0 | 57.4 | 0.0 | 3.9 | 0.0 | 0.0 | 0.0 | 0.0 |
| TF 275 | 33.1 | 98.1 | 0.0 | 71.5 | 121.0 | 8.0 | 0.6 | 3.0 | 0.3 | 0.2 |
| TF 350 | 44.3 | 136.2 | 2.9 | 0.0 | 129.0 | 10.3 | 1.6 | 4.7 | 0.6 | 0.3 |
| PL | - | 83.0 | 4.3 | - | - | 4.4 | 1.8 | 9.0 | 0.9 | 0.6 |
Table 10.
TGA results for PL, TOR 350, TOR 450, TOR 600, TF 275, TF 350, and HTC 216 samples, respectively.
Table 10.
TGA results for PL, TOR 350, TOR 450, TOR 600, TF 275, TF 350, and HTC 216 samples, respectively.
| Sample | Weight remaining at 800°C (weight %) |
Weight remaining after 60 min (weight %) | Loss over 60 min residence time (weight %) | Residual ash (weight %) |
Loss of volatiles at 400°C (weight %) |
| PL | 26.0 | 22.0 | 4.0 | 22.0 | 55.0 |
| TOR 350 | 62.0 | 56.0 | 6.0 | 56.0 | 10.0 |
| TOR 450 | 76.0 | 69.0 | 7.0 | 69.0 | 8.0 |
| TOR 600 | 87.5 | 82.5 | 5.0 | 82.5 | 8.0 |
| TF 275 | 45.0 | 37.5 | 7.5 | 37.5 | 30.0 |
| TF 350 | 64.0 | 55.0 | 9.0 | 55.0 | 10.0 |
| HTC 216 | 50.0 | 37.5 | 7.5 | 37.5 | 28.0 |
Table 11.
Germination results compared by using germination index (GI) at day 7.
| Substrate | Germination (%) | Germination (% of Control) | Mean root length (cm) | Mean root length (% of Control) | GI |
| Control 1 | 99.5 | 6.8 | |||
| Poultry litter | 3.5 | 3.5 | 0.3 | 3.2 | 0.1 |
| TOR 350 | 0.5 | 0.1 | 0 | 7.3 | 0.01 |
| TOR 600 | 0 | 0 | 0 | 0 | 0 |
| Control 2 | 98.0 | 11.0 | |||
| Washed TOR 350 | 34.5 | 32.2 | 0.2 | 1.8 | 0.6 |
| HTC 120 | 46.5 | 46.7 | 1.5 | 22.4 | 10.5 |
| HTC-C1-210 | 83.5 | 85.2 | 0.3 | 18.6 | 15.8 |
| Extract | |||||
| KCl | 0.0 | 0.0 | 0.0 | 0.0 | 0.0 |
| Washed TOR 350 | 99.3 | 101.4 | 3.7 | 33.8 | 34.3 |
| HTC 250 | 0.0 | 0.0 | 0.0 | 0.0 | 0.0 |
| HTC 87 | 89.0 | 90.8 | 0.3 | 2.6 | 2.4 |
Disclaimer/Publisher’s Note: The statements, opinions and data contained in all publications are solely those of the individual author(s) and contributor(s) and not of MDPI and/or the editor(s). MDPI and/or the editor(s) disclaim responsibility for any injury to people or property resulting from any ideas, methods, instructions or products referred to in the content. |
© 2024 by the authors. Licensee MDPI, Basel, Switzerland. This article is an open access article distributed under the terms and conditions of the Creative Commons Attribution (CC BY) license (http://creativecommons.org/licenses/by/4.0/).
Copyright: This open access article is published under a Creative Commons CC BY 4.0 license, which permit the free download, distribution, and reuse, provided that the author and preprint are cited in any reuse.


