
Submitted:
15 March 2024
Posted:
15 March 2024
You are already at the latest version
Abstract
In Tunisia, olive is the most cultivated fruit crop while in the north where rainfall exceeded 400mm.year-1, the olive growing area is in widely extension in marginal soil with high slope gradient. Thus, the inclusion of cover crops is a sustainable solution to increase the ecosystem productivity, improve the soil fertility and oil yields. But, in Tunisia a few study were investigated the effect of legumes cover crop on the olive productivity. Therefore, the aim of this study was to evaluate the short-term (two cropping seasons s 2021 and 2022) effects of different seeded cover crops and soil management practices on the cover crops and soil characteristics, as well as enzymes activities and related microbial diversity. Six intercropping were tested in rainfed olive orchards (cv.Chétoui): Spontaneous vegetation (Spont), Wheat, Vetch, Oat, Fenugreek, mixture Vetch-Oat and compared to control (3 periodic tillage/year without intercropping). During the first cropping season, cover crops were cut as animal feed and only residues were incorporated into the soil. While, during the second year, all cover crops biomass were incorporated into the soil. Results indicate that the dry biomass and carbon uptake were significantly higher in grasses species (Wheat and Oat). But, highest level of nitrogen was found in Fenugreek cover crops. As compared to control, all cover crops including spontaneous vegetation increased soil organic matter and macronutrient level, mainly phosphorus. The most activity of β-glucosidase, phosphatase and arysulphatase was found in the cover crops plot of wheat and oat. In addition, this study improve that the utilization of the carbon sources was dominated by amides, amine and amino-acids in the fenugreek plot; while it was dominated by polymers and carboxylic acids in the case of wheat and oat.
Keywords:
cover crops
; Olive tree
; legumes and grasses
; dehydrogenase
; carbon utilization sources.
1. Introduction
In Tunisia, the olive oil industry holds significant importance in economic, environmental, and social aspects. Olive trees cover 36% of the total agricultural land and make up 79% of the area committed to tree farming. Notably, 95% of Tunisian olive farming is traditional, relying on dry land cultivation and minimal chemical fertilizers input. Consequently, Tunisia is recognized as one of the leading global producers and exporters of organic olive oil. The country produces the fourth-largest amount of olive oil in the world (193,700 t per year), and the olive industry supports 65 percent of all agricultural operators and more than one million people directly or indirectly [1,2]. A total of 196,000 tons of olive oil were expected was produced between 2015 and 2019; 165,000 of those tons were exported, accounting for 84% of the total amount. The volume of oil exported by Tunisia represents 20% of olive oil world exports. Both in terms of quantity and dollar value, the export of olive oil leads all other agricultural and food exports to Tunisia and accounts for more than half of those exports' overall value [3,4]. Notably, 95% of Tunisian olive farming is traditional, relying on dry land cultivation and minimal chemical fertilizers [1,4]. Consequently, Tunisia is recognized as one of the leading global producers and exporters of organic olive oil. However, despite the success of the olive oil industry, there are also challenges facing olive growers in Tunisia. The national production of olive oil experienced, during the 2022/2023 campaign, a drop of 25% compared to the past campaign, to reach 180 thousand tons. The production is below the national average recorded over the last decade, which is estimated at 211,000 tons [5]. One of the most significant challenges is the threat of climate change as well as the lowest soil organic matter content and acceleration of their degradation factors [6,7]. This has led to a decrease in olive yields, as well as an increase in pests and diseases, affecting the sustainability of the olive production system and environment security. Meanwhile, Olive productions systems differ from the north to the south Tunisian zone, due to climatic condition, mainly rainfall. In the north, olive production is conducted as mono-cropping and represents the third speculation, after wheat and animal production. The olive crop is marginalized and is generally cultivated as mono-culture in bad soil quality under high slope, with low recorded yields of olive. While, olive oil produced from Chétoui cultivar has a very good chemical and sensory quality attributes [8,9]. More recently, the agricultural ministry has programmed in the north of Tunisia, the extension number of olive trees by about 10 millions trees between 2020-2030 years. To improve the olive oil production under organic farming system, increased the olive ecosystem productivity (production of animal feed, industrial crops, human food) and preserve the environment, the intercropping using different cover crops species (grasses, legumes) will be the most sustainable technical solutions [10,11]. Several studies have indicated that cover crops improve agricultural productivity, with many focusing on biomass production, physical, chemical and soil biological properties. Cover crops root growth may provide soil benefits such as increased soil organic carbon content, accessible nutrients, and soil aggregation [12]. Annual crops association to perennial trees play a significant role in soil-based ecosystem services because of above- and below-ground organic inputs that supply the nutrients and carbon substrates required by soil organisms engaged in carbon transformations and nutrient cycling [7]. When organic inputs break down, decomposer organism’s work together to fragment organic fraction, resulting in C transformations (e.g. termites, millipedes, mites, and earthworms). C transformations and nutrient cycling occur through the coordinated interaction of decomposers and nutrient transformers and are treated here as a functional continuum [11,12]. This transformation in turn facilitates the enzymatic action by fungi and bacteria that results in the release of nutrients to the soil matrix, loss of C to the atmosphere, primarily as CO2, and the synthesis of soil organic matter [13]. The use of cover crops in agriculture has been shown to be an effective method for mitigating soil erosion and nutrient loss. Various studies have demonstrated the ability of cover crops to significantly reduce rill erosion, sediment transport and enhancement of surface roughness as well as promotion of water infiltration [14]. Additional physical characteristics that can be improved by the implementation of cover crops are increasing aggregate stability and enhancing hydraulic properties by protecting the soil surface from raindrop impact, increasing macroporosity and pore connectivity [15]. Cover crops can alter soil properties by increasing organic matter in high C:N ratio mixtures, thereby increasing soil nutrients available for subsequent crops. Cover crops also increase N availability through biological N fixation and retain excess soil N for the following growing season [16]. Because CCs (cover crops) increase soil C and N content, they help reduce the harmful effects of global warming by increasing the sequestration of atmospheric CO2 and N2O [17]. Combined with conservation tillage, CCs contribute to a system that improves soil quality and crop production [18]. It has been found that the use of legumes as cover crops in olive grove has beneficial effects on soil quality as well as olive tree performances [7]. But, theses effects depends largely on the cover crops species and the primary dry matter production [16,17]. For instance, cover crops increased olive rhizospher soil's bacterial and fungal diversity. These changes in microbial diversity were positively related to an increase in soil organic matter content and the decomposition of complex polymers in olive orchards [19,20,21]. Soil enzyme activities are fundamental regulator of litter decomposition and may significantly influence the fractions of labile organic carbon on the soil [22], the biological nitrogen fixation, and the immobilization of nutrients. Cover crops incorporation in the soil stimulated a significant increase in the soil enzymatic activities [23]. Annual cover crops increased activities of most soil enzymes and were correlated with microbial biomass [24,25]. Among the most studied soil enzymes, we found β-glucosidase, phosphatase, dehydrogenase which intervene in the C, N an P cycles [26]. Metabolic activity of microorganisms can be evaluated using different techniques such as cell cultures, microbial biomass, enzyme activity and recently by community level physiological profiling (CLPP). CLPP is based on the carbon source utilization [27]. The aim of the present study was to boost the olive ecosystem production using different cover crops species (spontaneous seeds, grass, legumes and their mixture) compared to periodic tilled soil, and to assess their impacts on primary production, carbon fixation, nutrient status and various biological indicators of soil quality during two consecutive cropping seasons s (2021/2022). The activities of the most soil enzymes (β-glucosidase, phosphatase, dehydrogenase and arylsulphatase) representative of C, N, P and S cycles were estimated. Soil microbial diversity was also estimated by Biolog-EcoMicroplates method in the second cropping seasons in mature olive orchards (cv.Chétoui) under rainfed conditions in Northern Tunisia.
2. Materials and Methods
2.1. Description of the Study Area and Experimental Design
The field experiment was carried out on the Ben Ismail Olive Farm in Toukaber located in Beja province in the Medjerda Valley in Northwest of Tunisia, 36°42'34.0"N, 9°30'33.9"E. 400 m.a.s., with a Mediterranean type climate. The average annual temperature and rainfall were 18.5 and 500 mm, occurred mostly between October and April. Weather data recorded during the experimental period are presented in Figure 1. Rainfalls registered were 460 mm and 300 mm during the 2021 and 2022 cropping seasons s respectively. The mean temperatures were about 18.7°C.
The common textural soil throughout the olive orchard is of clay 47%, loam (20%), and sand (23%) with a pH= 8.2; EC =1523µs.m-1 and Da=1.5. The farm has a surface area of 30hawith a slope within the farm of between 5 and 18%. The olive trees of the Chétoui cultivar, were approximately 45 years old being under organic farming production, with trees density of 10 m x10m (100 trees.ha-1). Olive trees were characterized by their high and canopy diameter of about 3 m and 4 m respectively. The organic fertilization was applied biannually using a small quantity of cow manure localized between trees rows.
2.2. Experimental Design
A completely randomized experimental design with three replicates per treatment had 21 subplots of 400 m2 each (Figure 2). During 2021 and 2022 cropping seasons, 6 treatments were tested and compared to control (Farm management: tillage 3 times by chisel ploughing soil at 15 cm depth in Mars, June and October of 2021 and 2022). The treatments applied in olive orchards were: 1-Spontaneous vegetation, 2-Oat (Avena sativa), 3-Wheat (Triticum aestivum), 4-Fenugreek (Trigonella foenum-graecum),5-Vetch (Vicia sativa) and a mixture of 6-Vetch-Oat (1:1). On 2021 and 2022 cropping seasons s, cover crops seeds were sown manually in the whole olive field, in November, and were buried longitudinally and transversely by a cultivator. During the first cropping season (2021), cover crops were cut in April 2021 and were served as animal feed, and only residues were incorporated in to the soil. While, during the second cropping season (2022) total cover-crops mowing was done in April 2022.
2.3. Cover Crops Sampling and Analysis
Aboveground and belowground biomass of the cover crops were randomly sampled in each blockduring spring, employing a five replicates squareof 50 x 50 cm (0.25 m2). The entire plants of the square were removed with a shovel and transported to the laboratory in plastic bags during the day of collection. Once in the lab, the aerial parts were separated from the roots. Soil particles attached to the roots were gently separated by immersing the roots in plastic tray with distilled water. The aerial and root biomass were dried (70 °C for 7 days) and weighted. Net aboveground and belowground biomass production were calculated from the dry biomass of both in the 0.25 m2 squares and extrapolated to one hectare taking into account the area covered.
Aliquots of the aerial and root biomass were powdered by an electrical mill and sieved with 1 mm mesh. Total carbon (C), nitrogen (N), phosphorus (P) and potassium (K) was determined in aliquots pf the powdered biomass. C and N were measured in a CHN elemental analyzer CHN(Leco TruSpect Micro) and P and K in a ICP-MS mass spectrometer(Agilent 7900) after the digestion with perchloric-nitric (3:5 v/v).
Carbon, nitrogen, phosphorus, and potassium in the cover crops (kg element ha−1 y−1) was calculated from the net primary production of biomass in the sampling square (kg DM in 0.25 m²).
2.4. Soil Sampling and Analysis
Soil samples were collected between 3 to 5 weeks after incorporating/cutting the covercrops during the two studied seasons. Top 30 cm soil samples were taken in the inter-row area , stored in a plastic bag and transported to the lab. Then, the samples were air dried for a week and sieved at 2 mm before analyses (total nitrogen, POlsen, total potassium and soil organic carbon). Other samples in the top 10 cm were taken and kept at 4°C for soil functional quality (enzymatic activity and the Biolog® EcoPlate™).
Soil total nitrogen was measured by CHN elemental analyzer (Leco TruSpect Micro), total potassium by IPC-MS mass spectrometer (Agilent 7900) after digestion with perchloric-nitric acid. The determination of soil organic carbon was based on oxidation with potassium dichromate in an acid (Nelson & Sommers, 1982).Soil available phosphorus POlsen was determined by following the method oulined by Olsen as described by Chehab et al. [7].
2.5. Soil Functional Quality
2.5.1. Enzymatic Activity
The activity of the phosphomonoesterase was determined following the methodologies [28]. The substrate, p-nitrophenyl phosphate, was added to the soil sample and incubated for 1 hour in a water bath; then the reaction was finished by adding sodium hydroxide and filtered. The amount of p-nitrophenol (pNP) released was measured by colorimetry at a wavelength of 420 nm. The β-glucosidase activity was estimated with the method of [28] whose principle is similar to that of phosphomonoesterase: a colorimetric estimate of the p-nitrophenol released by the enzyme from the incubation of the soil with its specific substrate (p-nitrophenyl-β-D- glycoside). The arylsulfatase activity was determined following the method of Tabatabai [28], based on the release of p-nitrophenol after incubating soil with potassium p-nitrophenyl sulphate. Dehydrogenase activity is indicative of microbial biomass, since it is an intracellular enzyme directly related to functional microorganisms (unlimited catalytic oxidations are carried out that imply H2 losses in microbial cells, including all electron transfer processes). The dehydrogenase assay was carried out according to the method using triphenyl-tretrazolium chloride as a substrate, incubating for 16 hours at 25 C and measuring the triphenyl-formazan formed by colorimetry at 546 nm.
2.5.2. Microbial Diversity
The Biolog® EcoPlate™ method cited by Grzadiel [29] was used to evaluate the catabolic potential of a variety of organic carbon sources by soil microorganisms. Every plate includes 96 wells containing 31 different carbon sources, plus a blank well, in three replications. The substrates in the wells can be subdivided into five groups: carbohydrates (n = 10), carboxylic acids (n = 9), amines and amides (n = 2), amino acids (n = 6), and polymers (n = 4). Freshly collected samples of soil were taken 10 g and suspended in 0.85 % NaCl solution followed by shaking for 30 min. The suspension was then left to settle, and the supernatant was filtered through a filter to avoid transmission of the remaining plant and soil particles that could affect further reads. Inoculation was accomplished by pipetting 120 μL of each sample into each well of the EcoPlate™. Plates were incubated at 28 °C, for 144 h, and the absorbance at 590 nm was measured. The microbial activity was expressed by the average well color development (AWCD). Each of measurements was performed in triplicate.
2.6. Statistical Analysis
The effects of the different cover crop on the variables analysed were tested using ANOVA (IBM-SPSS 27 for Windows). Data were tested for normality to verify the model assumptions, and differences of p < 0.05 were considered statistically significant.
3. Results
3.1. Cover Crops and Residues Dry Biomass Incorporated into the Soil
The total dry biomass incorporated in to the soil showed significant differences between the two copping seasons (Figure 3) because during the 2021 cropping seasons cover crops were cut for animal feed, and only residues were incorporated. The higher dry biomass values were recorded in Wheat and Oat plots, and were about 4000 Kg.ha-1. The lowest value was obtained for the spontaneous vegetation (Figure 3). During the second cropping seasons (2022) total dry biomass was incorporated in to the soil with significant differences between treatments. Wheat plots had the maximum value, while the minimum was recorded in the spontaneous plots, and were 16793 and 4000 Kg.ha-1. No significant differences were observed between Vetch, Fenugreek and Vetch-Oat plots during the two cropping seasons s (Figure 3).
3.2. Nutrients and Carbon Retention by Cover Crops and Residues Incorporated in the Soil
The carbon fixed by the cover crops and residues during the 2021 and 2022 copping seasons were shown in Figure 4. During the first cropping seasons (2021) residues of Wheat and Oat had the highest carbon rate of about 1914 and 1760 Kg.ha-1 respectively. The lowest value was 475 Kg.ha-1 recorded in spontaneous vegetation plot. Similarly, during the second season Wheat cover crop incorporated in to the soil had highest significant value of carbon (6936 Kg.ha-1) as compared to others plots (Figure 4A).
Nitrogen uptake and incorporated into the soil by residues and cover crops during 2021 and 2022 cropping seasons s respectively is depicted Figure 4B. The higher significant production was in fenugreek cover crops 399.23 kg.ha-1 in 2022 compared to 285.19kg.ha-1 in 2021. Vetch, Vetch-Oat marked 52.4 kg.ha-1 and 60.56 kg.ha-1 respectively in 2021 and increased respectively by 300 % and 245 % during 2022. Wheat, Oat, and spontaneous vegetation marked the lowest N production with respectively 38.6 ; 51 and 21.44 kg.ha-1 in 2021 and increased similarly by about 220 %, 200 % and 300 % respectively in 2022 cropping season.
P accumulation in residues incorporated into the soil during 2021 cropping seasons showed higher significant level on Oat plot (1.95kg.ha-1), and decreased in Wheat, Fenugreek and Vetch-Oat to reach values 1.5 ; 1.62 and 1.45 respectively (Figure 4C). During 2022, high significant values were reported in Vetch-Oat, Fenugreek, Wheat and Oat plots and ranged between 5.2 and 5.5 kg.ha-1.
In the case of K retention (Figure 4D), Oat leaded the production of 27.3 kg.ha-1 in 2021 and increased to 73.44 kg/ha in 2022. Values of potassium content during 2021 on Wheat, Vetch- Oat Fenugreek and Oat ranged between 15.44 and 9.7 kg.ha-1. But during 2022, in the Vetch-Oat and Wheat plots K recorded 57 kg.ha-1. Finally, the spontaneous vegetation has the lowest rates during the two cropping seasons s.
3.3. Soil Organic Matter and Macronutrients Availabilities after Residues and Cover Crops Incorporation
Table 1 resume the organic matter (OM) and macronutrients contents (N,P,K) of different olive plots soils measured after the residues and cover crops incorporation into the soil during 2021 and 2022 cropping seasons s. In 2021, the lowest value of OM was recorded in control, and it increased significantly for all treatments except Oat and it reached maximum value in Vetch-Oat plot (3.24%). During the second season (2022), the maximums increased rates were registered for the Weat and Oat plots, and soil OM contents were 3.72% and 4.12% respectively. Similarly, for the soil carbon content, during 2021 and 2022 cropping seasons s, control showed the lowest values (1.07 and 1.2%respectively). Soil nitrogen contents were at minimums values in control plot during the two cropping seasons s 2021 and 2022 and were 0.88 and 1.22 % respectively. The spontaneous vegetation and cover crops increased significantly the soil N, except in the Oat plot during the first season (2021). Values recorded reached maximums N levels in Vetch-Oat plot of 1.57% and 1.68 % in 2021 and 2022 cropping seasons s respectively (Table 1). The incorporation of residues increased significantly the rate of soil phosphorus from 2.68 in the control to reached 4.04 µg.g-1 in Fenugreek plot. Similarly, for the cover crops with values ranged from 4.08 and 5.88 µg.g-1 in Spontaneous vegetation and Wheat plots (Table 1). In the control plot, soil potassium levels were at the lowest during 2021 and 2022 cropping seasons s. While, high values were recorded after the incorporation of the residues into the soil (2021 cropping seasons ) for which maximum level (4.3 mg.g-1) was observed in Vetch-Oat plot (Table 1). Compared to 2021, soil K values decreased for all treatments during 2022 cropping seasons for which the highest value (3.56 mg.g-1) was recorded in Vetch plot (Table 1).
3.4. Soil Functional Quality
3.4.1. Soil Enzymatic Activities
β-Glucosidase reached higher significant values in Wheat and Oat plots and were 554.55 µg PNP g-1.h-1 and 547.55 µg PNP g-1.h-1 respectively. The lowest rate was marked in Spontaneous treatment of about 258.97 µg PNP g-1.h-1. Whereas, the other treatments did not show significant difference and rates were varied between 305.08 and 379.051 µg PNP g-1.h-1(Figure 5A). Dehydrogenase activity recorded the lowest value for the control plot (62.5107µg TPF g-1.h-1), it increased significantly to reach their highest levels in Wheat and Fenugreek plot of about 112 and 107µg TPF g-1.h-1 respectively (Figure 5B). The Wheat and Oat achieved the highest Phosphatase activities of 337.54 µg PNP g-1 h-1 and 314.88 µg PNP g-1.h-1 respectively. For others treatments, phosphatase soil activities varied between 267.55 µg PNP g-1 h-1 and 200.41 µg PNP g-1 h-1 (Figure 4C). Arylsulfatase enzyme showed higher activity in Wheat and Oat plots, and were 121.91 µg PNP g-1 h-1 and 117.08 µg PNP g-1.h-1 respectively. The spontaneous vegetation treatment marked the lowest values of about 84 PNP g-1.h-1. Arysulfatase activities of the rest treatments were carried between 94.125µg PNP g-1.h-1 and 97.54 µg PNP g-1.h-1(Figure 5D).
3.4.2. Carbon Utilization Sources
The analysis of the metabolism of carbon substrates presented in the Figure 6A show that the cumulative AWCD calculated reported the lowest value in Spontaneous vegetation plot (39). Highest levels of AWCD of about 45 were registered in Fenugreek and Vetch-Oat treatments. The carbon utilizations sources were mainly dominated by carbohydrates and polymers in plots of Control, Spontaneous, Wheat, Oat, and Vetch with low contribution of carbohydrates and polymers. Whereas, Vetch-Oat and fenugreek plots were dominated by the utilization of amino acids, amine and amides compounds (Figure 6B).
4. Discussion
The cover crops and residues biomass incorporated into the soil depend on the crops species during the two consecutive cropping seasons 2021 and 2022. Our investigation revealed that grass cover crops, mainly Wheat, yielded substantially higher biomass compared to legume cover crops and their mixtures. While, numerous studies have underscored the significance of cover crops in Tunisian olive groves, biomass production has garnered insufficient attention. Intercropped cover crops in olive orchards have shown varying levels of biomass production. Our results agrees with those of many studies released in Morocco highlighted olive-based agroforestry systems founded that cereals produced significantly more above-ground biomass than legumes, barley having the highest biomass production 1290 kg.ha-1 followed by durum wheat 970 kg.ha-1, chickpea 310 kg.ha-1, and Faba bean 320 kg.ha-1 [30]. [31,32] found a higher production in grass species (barley, durum wheat, soft wheat) compared to legumes (Faba bean and Lentil). In Spain, the annual net primary production of spontaneous vegetation reached out 2000 kg.ha-1[33]. But, in our study high levels of biomass production released seems to be related to the rainfall and cover crop species tested. It has found that a mixture of early maturing and self-reseeding annual legumes resulted in higher ground cover percentages, biomass production, compared to natural vegetation [35]. Indeed, [36] reported that the highest level of areal biomass (7000 kg.ha-1) was recorded in mixtures of Bromus, Medicago and Anthemis seeded cover crop on olive orchards. Additionally, soil fertility and organic matter content can influence cover crop biomass production which can explain high cover crop biomass unregistered in our study. [37] found that cover crops under sustainable management systems had higher biomass production and carbon content compared to natural vegetation, indicating enhanced carbon storage and potential increase in soil organic matter.
In generally, on the olive orchards, total cover crops biomass will be incorporated into the soil as fertilizer and soil protector [7,16,17]. Meanwhile, the biomass production by the different cover crops species can be cut and used as feed for animal’s production, increasing the olive ecosystem profitability and services as well as the income for the farmer. In this case, only residues will be incorporated into the soil and served as bio-fertilizer [38,39]. Carbon fixed by the cover crops and residues were closely related to the respective dry biomass produced. During the two consecutive cropping seasons, grass species fixed the high carbon levels.
For the macronutrients contents, our results coincide with those reported by Ferreira et al. [40], who indicated that legumes fixed high levels N compared to grass species. Nitrogen content in above-ground biomass reached values close to 90, 40 and 10 kg N.ha-1 in legumes, fertilized natural vegetation and non-fertilized natural vegetation respectively [35]. [41] found out that Faba bean and Rye-Vetch produced 105 kg.ha-1 and 89.3 kg.ha- 1 respectively. In our study, legumes species and mixed recorded high values of N fixed by dry biomass, mainly for the Fenugreek crop for which N content varied between 100 and 400 kg.ha-1. High level of N in legume crops and their mixtures can be explained by the main characteristic of legumes as nitrogen-fixing plants make them economically and environmentally available in the soil [42]. Regarding our study in 2021 and 2022 cropping seasons s, spontaneous vegetation retain between 21 and 70kg.N.ha-1; these values were more important of those reported for which natural vegetation N production reached 19.5 kg N ha-1. Differences in N fixed by the cove crops observed can be attributed to cover crops species and the climatic condition (temperature and rainfall) aver the study period, crops spontaneous species as well as the dry mass produced [33]. Many studies showed the importance of phosphorus produced by Cover crops biomass. In our study, the level of P fixed by spontaneous vegetation was 2.3 kg.ha-1 [33]. These others reported that 2.48 kg P ha−1 was accumulated in the biomass on the spontaneous cover crops in olive orchards. Highest values of P retention exceeded 5 kg.ha-1 were observed in Oat, Vetch-Oat, Wheat and Fenugreek crops. These findings can be explained by root density extension and the exudates produced make soil phosphorus more available to the cover crops. The existence of rhizobium in legumes and myccorhize in grasses roots [43] can be also involved in the phosphorus bioavailability in the soil (44). (45) reported that rhizibium could act as phosphate solubizer, hormone producer and to some extent as N-Fixer. The highest levels of K retention were recorded in grass species (Wheat , Oat) and the mix grass-legumes (Vetch-Oat) in the residues and cover crops biomass [46,47]. These findings were attributed to larger root surface area, root length with finest roots and greater affinity of transporter that maximize K uptake by grasses plants [48]. In our research, we discovered that fenugreek outperformed vetch and other cover crops in terms of nitrogen production. We also observed significant rates of phosphorus accumulation in both fenugreek and the vetch-oat mixture, along with grass crops. Additionally, an interesting finding was that the vetch-oat biomass accumulated significant amounts of phosphorus and potassium per hectare.
The impact of grass cover crops on soil carbon sequestration in agricultural systems, including olive farms, has been the subject of many researches. Studies have shown that the use of cover crops, including grasses, can lead to an increase in soil organic matter content, contributing to carbon sequestration which is important for improving the resilience of agro-ecosystems to the impacts of global climate change. The increase of the SOM (soil organic matter) after the use of residues and cover crops is due the incorporation of the dry biomass in to the soil as well as the cumulative effects during the second cropping season (2022). In Tunisia, the use of legume as cover crop in olive orchards increased the soil organic matter reaching 1.5%, three times higher than the control [7]. More recently, [49] tested intercropping olive trees with vetch and barley-vetch mixture resulted in higher soil organic matter. Indeed, [50], found that grass cover crops, when used between olive trees, can act as a sponge to conserve water, prevent flash floods, and increase in soil organic matter content, contributing to soil health and potentially mitigating climate change. In our study, SOM in all cover crops and spontaneous treatments were higher than 3%. The desirable organic matter content in a soil is between 2 and 3% depending on the texture of the soil and it can reach 6% in the most agricultural soil [51]. In summary, the research suggests that grass cover crops can have a positive impact on soil organic matter, potentially contributing to soil nutrient status and functional quality in olive farms. However, the effectiveness of cover crops in increasing soil carbon stocks may depend on various factors, including soil depth cover crop implementation, timeline, and co-management strategies.
The dry biomass generated by the cover crop plays an important role in soil characteristics and nutrient dynamics [33,37]. Soil macronutrients availabilities in the soil surface layer were the results of the organic matter decomposition. During the experiment period on 2021 and 2022 cropping seasons cover crops increased soil N higher than the control [16,38] , with no significant differences between species or their dry biomass incorporated in to the soil. Values were still in the range of N soil limits. [7] Reported that the use of legume as cover crops increased the soil N by about 25% as compared to control plot. Vetch improved soil nitrate content by over 35% with respect to barley and mixture treatments at 0–20 cm soil depth throughout the studied period [33]. A soil phosphorus level seems to be influenced not only by the biomass, but also by the cover crops species. High values reported in soils of plots seeded by grass species (Wheat, Oat) compared to those seeded by legumes (Vetch, Fenugreek). In contrast, P exported by the biomass cover crops was high suggesting a low SOM decomposition process, and the short term of sampling (second year). The decomposition pattern of the organic matter was accelerated when the rainfall recorded and the mild temperatures favored the activity of microorganisms. Long-term cover crops have been found to improve soil P bioavailability and increase the content of total phosphorus (TP), microbial phosphorus, organic phosphorus, and certain forms of inorganic phosphorus in surface soil [52]. Cover crops have been found to have a significant impact on soil phosphorus (P) dynamics. Residues can contribute to the P nutrition of subsequent crops, with the extent of the contribution depending on the quality of the residues and the P status of the soil [53]. The study released in Tunisia found that Vetch increased soil P availabilities with an average ranging from 2.24 to 6.02mg.kg-1 [54,49]. Cover crops and spontaneous vegetation significantly increased potassium soil levels as compared to control, in relation to the dry biomass incorporated in to the soil [7]. The decreased soil K levels during the second season (2022) can be explained the low dry matter decomposition process and also the K fraction exported by olive trees. It has been found that olive tree consumed high levels of potassium (55). β-Glucosidase is a significant soil enzyme involved in the decomposition of plant debris. It is sensitive to changes in soil management practices and serves as an indicator of soil quality and past biological activity. It plays a crucial role in providing energy to soil microorganisms through the production of glucose. Intercropping in olive farms has been found to significantly increase soil enzyme activities, indicating improved soil quality and biological activity. In our experiment, significant highest activities of β-glucosidase, phosphatase and arysulphatase were recorded in wheat and Oat plots, these two crops have the highest levels of carbon contents. [56] reported that soil enzymes activities, mainly dehydrogenase and phosphatase were on average 20% higher in plots under cover crop in comparison to control treatment. A more developed cover crop helps in improving the soil glycosidase and phosphatase activities [57,58]. The intercropping with grasses species , increased also phosphatase activity in short time after incorporation of the cover crops biomass [59]. It has been found that phosphatase activities was related to soil mineral contents, especially Na, K, P , Zn, C and total N concentrations in intercropped olive orchards [57]. While, the use of Oat as cover crop increased both phosphatase and β-glucosidase activities [17]. In concordance with our results, the intercropping of legumes crops in rainfed olive groves led to increased significantly the soil dehydrogenase activity [25,60]. But, in contrast to our results, short-term legume and grass mixtures increased arylsulfatase three times higher to control [58,61]. The enzymes activities are proportional to microbial respiration activity and it is considered a suitable indicator of soil quality and microbial activity [25,56]. Microorganisms are usually higher in sustainable soil managements in general and particularly under cover crops [10,17]. In our case the highest values of the cumulative AWCD reported in Vech-Oat, Fenugreek, Wheat and Vetch plots reflected the higher microbial metabolic activity as a result of a greater input of carbon and nitrogen compounds in theses plots [20]. An agreement with our results, it has been found that cover crops induced significant promotion of AWCD and the utilization ability in different carbon source types [52]. The relative consumption pattern of the carbon sources in this study were different between treatments of cover crops used. Polymers and carbohydrates are the substrates that are the most used by microorganisms from soil plots of Control, Vetch, Vetch-Oat and Wheat, which can be interpreted as microorganisms preferring carbon sources with a high energy input. While, the most substrates consumed by microorganisms in Fenugreek soil plot are amino acids, amines and amides. These findings can be attributed to the fact that consumption of amines and amides contribute to the needs of nitrogen sources by rhizobium [62]. [63] showed that the presence of a cover crop, specifically oats, had some influence on soil ecology and the cover crop treatment overall led to soils utilizing more carbon sources than soils without cover crops.
5. Conclusion
The results of this study revealed that increased cover crop diversity increased the biomass production as compared to monoculture and spontaneous vegetation. Wheat and oat had highest dry biomass production. Cover crops were used as fodder for animal nutrition increasing the olive ecosystem services and only residues were incorporated into the soil as fertilizer. When rainfall was low all cover crops biomass were incorporated into the soil. Cover crop diversity including grasses and legumes produced dry biomass with high and equilibrium N, P and K nutrition balance. The incorporation of cover crops, either for spontaneous vegetation, after mowing increased the soil chemical quality, mainly organic matter, soil nitrogen and phosphorus content. The consequences were profound changes the soil enzymes activities for which dehydrogenase, phosphatase and β-glucosidase increased in the cover crop treatments, mainly grasses plot (Wheat and Oat). It is clear that carbohydrates, carboxylic acids, amides and amino acids were the most utilized carbon sources and the soil microbial functions was greatly affected by the cover crop species (grasses and legumes) and their biomass production. The results from this study confirm the need to advise farmers to regularly monitor the soil organic matter content and select the most methods of soil management and the seeded cover crops species to improve soil functionality, agronomic productivity and the ecosystem services. Therfore, future investigations should be focused on long-term studies of soil funtional quality and olive ecosystem productivity as well as olive oil qualities attributes.
Author Contributions
Conceptualization, F.H. and H.C.; methodology, F.H and J.C.; software, F.H, S.A, H.C., R.G. and J.C.; formal analysis, F.H. and J.C; writing-original draft preparation, F.H., H.C.; writing-review and editing, F.H, S.A, H.C., R.G. and J.C.; project administration, R.G. and J.C., funding acquisition R.G. All authors have read and agreed to the published version of the manuscript.
Funding
This research was funded by the Prima Project “Novel approaches to promote the SUSTAInability of OLIVE cultivation in the Mediterranean”.
Acknowledgments
This study was supported by the Ministry of Agricultural and Water Resources in Tunisia. We express our sincere thinks to the members of the Olive Tree Institution, especially to Mr. Ing. Zoubeir Mahjoub.
Conflicts of Interest
The authors declare no conflict of interest. The funders had no role in the design of the study; in the collection, analyses, or interpretation of data; in the writing of the manuscript, or in the decision to publish the results.
References
- OLIVAE. Official journal of the international olive council.2017, (n.d.). www.internationaloliveoil.
- Ben Abdallah, S.; Elfkih, S.; Suárez-Rey, E. M.; Parra-López, C.; Romero-Gámez, M. Evaluation of the environmental sustainability in the olive growing systems in Tunisia. Journal of Cleaner Production. 2021, 282, 124526. [Google Scholar] [CrossRef]
- Elfkih, S.; Hadiji, O.; Ben Abdallah, S.; Boussadia, O. Water Accounting for Food Security: Virtual Water and Water Productivity in the Case of Tunisian Olive Oil Value Chain. Agriculture, 2023, 13, 13061205. [Google Scholar] [CrossRef]
- DGPA. Document de la Direction Générale de la Production Agricole en Tunisie. 2021.
- ONH. Rapport de l’Office National de l’Huile en Tunisie. 2023.
- Gargouri, K.; Mhiri, A. Relalionship between soil fertility, phosphorus and potassium nutrition on the olive in Tunisia. Opt. Mediterranean’s. 2003, 50, 199–204. [Google Scholar]
- Chehab, H.; Tekaya, M.; Ouhibi, M.; Gouiaa, M.; Zakhama, H.; Mahjoub, Z.; Laamari, S.; Sfina, H.; Chihaoui, B.; Boujnah, D.; Mechri, B. Effects of compost, olive mill wastewater and legume cover cropson soil characteristics, tree performance and oil quality of olive trees cv.Chemlali grown under organic farming system. Scientia Horticulturae. 2019, 253, 163–171. [Google Scholar] [CrossRef]
- Issaoui, M.; Flamini, G.; Brahmi, F.; Dabbou, S.; Ben Hassine, K.; Taamali, A.; Chehab, H.; Ellouz, M.; Zarrouk, M.; Hammami, M. Effect of the growing area conditions on differentiation between Chemlali and Chétoui olive oils. Food Chemistry. 2010, 119, 220–225. [Google Scholar] [CrossRef]
- Ben Youssef, N.; Zarrouk, W.; Carrasco-Pancorbo, A.; Zarrouk, M. Effect of olive ripeness on chemical properties and phenolic composition of Chétoui virgin olive oil. Journal of The Science of Food and Agriculture. 2010, 90, 199–204. [Google Scholar] [CrossRef]
- Li, T.; Wang, Y.; Kamran, M.; Chen, X.; Tan, H.; Long, M. Effects of Grass Inter-Planting on Soil Nutrients, Enzyme Activity, and Bacterial Community Diversity in an Apple Orchard. Frontiers in Plant Science. 2022, 13, 901143. [Google Scholar] [CrossRef] [PubMed]
- Koch, F.; Patterson, J. How can science policy help to deliver the global goals. The Guardian, Science Policy Blog. 2015, 10, 17–25. [Google Scholar]
- Koudahe, K.; Allen, S. C.; Djaman, K. Critical review of the impact of cover crops on soil properties. International Soil and Water Conservation Research. 2022, 10, 343–354. [Google Scholar] [CrossRef]
- Alessandro, Piccolo. The Nature of Soil Organic Matter and Innovative Soil Managements to Fight Global Changes and Maintain Agricultural Productivity. Carbonn Sequestration in Agricultural Soils 2012, 1–19.
- Blanco-Canqui, H.; Mikha, M. M.; Presley, D. R.; Claassen, M. M. Addition of Cover Crops Enhances No-Till Potential for Improving Soil Physical Properties. Soil Science Society of America Journal. 2011, 75, 1471–1482. [Google Scholar] [CrossRef]
- Beniaich, A.; Guimarães, V.D.; Avanzi, J.C.; Silva, B.M.; Salvador, F.A.G.; Santos, W.P.; Silva, M.L.N. Spontaneous vegetation as an alternative to cover crops in olive orchards reduces water erosion and improves soil physical properties under tropical conditions. Agricultural Water Management. 2023, 279, 108186. [Google Scholar] [CrossRef]
- Fernandez, O.R.; Ruibérriz de Torres, M.A.R.; Garcia, J.M., Garcia, M.M., Bojollo, R.M.C.; Legumes used as cover crops to reduce fertilization problems improving soil nitrate in an organic orchard. European Journal of Agronomy. 2018, 95, 1–13. [CrossRef]
- Huertas, A. J.; Cuartero, J.; Ros, M.; Pascual, J. A.; Parras-Alcántara, L.; González-Rosado, M.; Özbolat, O.; Zornoza, R.; Egea-Cortines, M.; Hurtado-Navarro, M.; & Lozano-García, B. How binomial (traditional rainfed olive grove-Crocus sativus) crops impact the soil bacterial community and enhance microbial capacities. Journal of Environmental Management, 2023, 3023, 345.
- Adetunji, A. T.; Ncube, B.; Mulidzi, R.; & Lewu, F. B. Management impact and benefit of cover crops on soil quality: A review. Soil and Tillage Research. 2020, 204.
- Sofo, A.; Palese, A.; Maria, C.; Teresa, C.; Giuseppe, R.P.; Curci, M.; Crecchio, C.; Xiloyannis; C.; Genetic, Functional, and Metabolic Responses of Soil Microbiota in a Sustainable Olive Orchard. Soil Science 2010, 175.
- Sofo, A.; Ciarfaglia, A.; Scopa, A.; Camele, I.; Curci, M.; Crecchio, C.; Xiloyannis, C.; Palese, A. M. Soil microbial diversity and activity in a Mediterranean olive orchard using sustainable agricultural practices. Soil Use and Management. 2014, 30, 160–167. [Google Scholar] [CrossRef]
- Montes-Borrego, M.; Metsis, M.; Blanca B Landa, B.B. Arbuscular Mycorhizal Fungi Associated with the Olive Crop across the Andalusian Landscape: Factors Driving Community Differentiation. PLoS ONE, 2014, 9, e96397. [Google Scholar] [CrossRef] [PubMed]
- Zhang, C.; Xue, W.; Xue, J.; Jing, Z.; Qiu, L.; Chen, X.; Hu, F.; Kardol, P.; Liu, M. Leveraging functional traits of cover crops to coordinate crop productivity and soil health. Journal of Applied Ecology 2022, 59, 2627–2641. [Google Scholar] [CrossRef]
- Samuel, I.; Haruna, N. N. Influence of Cover Crop, Tillage, and Crop Rotation Management on Soil Nutrients. Soil Biology & Biochemistry 2020, 25, 142–149. [Google Scholar]
- Bernnan, B.E.; Veronica, A.M. . Soil microbial biomass and enzyme data after six years of cover crop and compost treatments in organic vegetable production. Soil.Sci.Soc.Am.J. 2019, 83, 624–637. [Google Scholar] [CrossRef]
- Herencia, J. F. Enzymatic activities under different cover crop management in a Mediterranean olive orchard. Biological Agriculture and Horticulture. 2015, 31, 45–52. [Google Scholar] [CrossRef]
- Henriquez, C.; Uribe, L.; Valenciano, A.; Nogales, R. Soil enzyme activity -dehidrogenase, ß-glucosidase, Phosphatase and urease-under different crops. Agron. Costarricense. 2014, 38, 43–54. [Google Scholar]
- Weber K, Legge R.; One-dimensional metric for tracking bacterial community divergence using sole carbon source utilization pat -terns. J Microbiol Methods. 2009, 79, 55–61. [CrossRef]
- Tabatabai, M.A.; Soil enzymes. Methods of Soil Analysis: Microbiological and Biochemical Properties. Part 2. SSSA Book Ser, Madison. 1994, 775–833.
- Grzadiel, J.; Furtak, K.; Galazka, A. Community-Level physiological profiles of microorganism from different types of soil that are characteristic to Poland-a long-term microplot experiment. Sustainability. 2019, 11, 56–62. [Google Scholar] [CrossRef]
- Ben zineb, A.; Barkaoui, K.; Karray, F.; Mhiri, N.; Sayadi, S.; Mliki, A.; Gargouri, M. Olive agroforestry shapes rhizosphere microbiome networks associated with annual crops and impacts the biomass production under low-rainfed conditions. Frontiers in Microbiology. 2022, 13, 977797. [Google Scholar] [CrossRef]
- Amassaghrou, A.; Barkaoui, K.; Bouaziz, A.; Alaoui, S. B.; Fatemi, Z. E. A.; Daoui, K. Yield and related traits of three legume crops grown in olive-based agroforestry under an intense drought in the South Mediterranean. Saudi Journal of Biological Sciences. 2023, 30. [Google Scholar] [CrossRef] [PubMed]
- Temani, F.; Bouaziz, A.; Daoui, K.; Wery, J.; Barkaoui, K. Olive agroforestry can improve land productivity even under low water availability in the South Mediterranean. Agriculture, Ecosystems and Environment. 2021, 307, 107234. [Google Scholar] [CrossRef]
- Torrús-Castillo, M.; Domouso, P.; Herrera-Rodríguez, J. M.; Calero, J.; García-Ruiz, R. Aboveground Carbon Fixation and Nutrient Retention in Temporary Spontaneous Cover Crops in Olive Groves of Andalusia. Frontiers in Environmental Science. 2022, 10, 868410. [Google Scholar] [CrossRef]
- Arruda, B. Manipulation of the soil microbiome regulates the colonization of plants by arbuscular mycorrhizal fungi. Mycorrhiza. 2021, 31, 31–545. [Google Scholar] [CrossRef] [PubMed]
- Rodrigues, M. Â.; Dimande, P.; Pereira, E. L.; Ferreira, I. Q.; Freitas, S.; Correia, C. M.; Moutinho-Pereira, J.; Arrobas, M. Early-maturing annual legumes: an option for cover cropping in rainfed olive orchards. Nutrient Cycling in Agroecosystems 2015, 103, 153–166. [Google Scholar] [CrossRef]
- Soriano, M.; Cabezas, J.M.; Gomez, A.J. Field evaluation of selected autochthonous herbaceous species for cover crops in Mediterranean woody crops. European Journal of Agronomy 2023, 143, 126723. [Google Scholar] [CrossRef]
- Tul, S.; Manolikaki, I.; Digalaki, N.; Psarras, G.; Koufakis, I.; Kalaitzaki, A.; Sergentani, C.; Koubouris, G. Contribution of a Seeded Cover Crop Mixture on Biomass Production and Nutrition Status Compared to Natural Vegetation in a Mediterranean Olive Grove. International Journal of Plant Biology. 2022, 13, 235–244. [Google Scholar] [CrossRef]
- Rodrigues, Â.; Correia, C.M.; Claro, A.M.; Ferreira, I.Q.; Barbosa, J.C.; Moutinho-Pereira, J M.; Bacelar, E.A.; Fernandes-Silva, A.A.; Arrobas, M. Soil nitrogen availability in olive orchards after mulching legume cover crop residues. Scientia Horticulturae. 2014, 158, 45–51. [Google Scholar] [CrossRef]
- Ferreira, I. Q.; Rodrigues, M. Â.; Claro, A. M.; Arrobas, M. Management of Nitrogen-Rich Legume Cover Crops as Mulch in Traditional Olive Orchards. Communications in Soil Science and Plant Analysis. 2015, 46, 1881–1894. [Google Scholar] [CrossRef]
- Stein, S.; Hartung, J.; Perkons, U.; Möller, K.; Zikeli, S. Plant and soil N of different winter cover crops as green manure for subsequent organic white cabbage. Nutrient Cycling in Agroecosystems. 2023, 10306–10309. [Google Scholar] [CrossRef]
- Lee, A.; Neuberger, P.; Omokanye, A.; Hernandez-Ramirez, G.; Kim, K.; Gorzelak, A.; Arbuscular mycorrhizal fungi in oat-pea intercropping. Sci Rep. 2023, 13, 390. [CrossRef] [PubMed]
- Afzal, A.; Bano, A. Rhizobium and phosphate solubilizing bacteria improve the yield and phosphorus uptake in wheat (Ttiticum aestivum). International Journal of Agricultural and Biology. 2010, 1814, 9596. [Google Scholar]
- Rodrigues, M.; Withers, P. J. A.; Soltangheisi, A.; Vargas, V.; Holzschuh, M.; Pavinato, P. S. Tillage systems and cover crops affecting soil phosphorus bioavailability in Brazilian Cerrado Oxisols. Soil and Tillage Research. 2021, 205, 104770. [Google Scholar] [CrossRef]
- Tul, S.; Manolikaki, I.; Digalaki, N.; Psarras, G.; Koufakis, I.; Kalaitzaki, A.; Sergentani, C.; Koubouris, G. Contribution of a Seeded Cover Crop Mixture on Biomass Production and Nutrition Status Compared to Natural Vegetation in a Mediterranean Olive Grove. International Journal of Plant Biology. 2022, 13, 235–244. [Google Scholar] [CrossRef]
- Fernandes, G.; Marques, A.; César, R.; Ribeiro, B. R.; Cardoso, Paula, S. Potassium Uptake Kinetics In Native Forage Grass Species From Pampa Biome. Soil science. Cienc. Rural. 2022, 52, 8478cr2020.
- Guesmi, H.; Aichi, H.; Bendhafer, G.; Fouad, Y.; Menasseri, S.; Chaar, H. Assessment of radial variation of soil properties in an olive tree-barley/common vetch agroforestry system under low-input conditions in a Tunisian semi-arid climate after three cropping seasons s. Journal of Research in Environmental and Earth Sciences. 2022, 11, 330–339. [Google Scholar]
- Porwollik, V.; Rolinski, S.; Heinke, J.; Von Bloh, W.; Schaphoff, S.; Müller, C. The role of cover crops for cropland soil carbon, nitrogen leaching, and agricultural yields -A global simulation study with LPJmL (V. 5.0-tillage-cc). Biogeosciences. 2022, 19, 957–977. [Google Scholar] [CrossRef]
- Rattan, Lal. Regenerative agriculture for food and climate. Journal of Soil and Water Conservation. Journal of Soil and Water Conservation 2020, 79, 0620A. [Google Scholar] [CrossRef]
- Wang, Y.; Huang, Q.; Gao, H.; Zhang, R.; Yang, L.; Guo, Y.; Li, H.; Awasthi, M. K.; Li, G. Long-term cover crops improved soil phosphorus availability in a rain-fed apple orchard. Chemosphere. 2021, 275, 13009. [Google Scholar] [CrossRef]
- Hansen, V.; Müller-Stöver, D.; Gómez-Muñoz, B.; Oberson, A.; Magid, J. Differences in cover crop contributions to phosphorus uptake by ryegrass in two soils with low and moderate P status. Geoderma. 2022, 426, 116075. [Google Scholar] [CrossRef]
- Ferreira, M.A.; Jose´, M.P.; Carlos, C.; Angelo, R.M. Olive response to potassium applications under different water regimes and cultivars Isabel Q. Nutr Cycl Agroecosyst. 2018, 112, 387–401. [Google Scholar] [CrossRef]
- Chavarría, D.; Romina, A.; Verdenelli Dannae, L.; Silvina, S.; Gil, V.; et al. Effect of cover crops on microbial community structure and related enzyme activities and macronutrient availability. European Journal of Soil Biology. 2016, 76, 74–82. [Google Scholar] [CrossRef]
- Martín, M.P.R.; Fernández-Ondoño, E.; Ortiz-Bernad, I.; Abreu, M.M. Influence of Intensive and Super-Intensive Olive Grove Management on Soil Quality—Nutrients Content and Enzyme Activities. Plants. 2023, 12, 12152779. [Google Scholar]
- Feng, H.; Sekaran, U.; Wang, T.; Kumar, S. On-farm assessment of cover cropping effects on soil C and N pools, enzyme activities, and microbial community structure. Journal of Agricultural Science. 2021, 159, 216–226. [Google Scholar] [CrossRef]
- Stegarescu, G.; Reintam, E.; Tõnutare, T. Cover crop residues effect on soil structural stability and phosphatase activity. Acta Agriculturae Scandinavica Section B: Soil and Plant Science. 2021, 71, 992–1005. [Google Scholar] [CrossRef]
- Peregrina, F.; Pérez-Álvarez, E. P.; & García-Escudero, E. The short term influence of aboveground biomass cover crops on C sequestration and β-glucosidase in a vineyard ground under semiarid conditions. Spanish Journal of Agricultural Research 2014, 12, 1000–1007.
- Navas, M.; Benito, M.; Rodríguez, I.; Masaguer, A. Effect of five forage legume covers on soil quality at the Eastern plains of Venezuela. Applied Soil Ecology. 2011, 49, 242–249. [Google Scholar] [CrossRef]
- Roper, M.M.; Ophel-Keller, K.M.; Soil microflora as bio-indicators of soil health. In: Pankhurst CE, Doube BM,Gupta VVSR (eds) Biological Indicators of soil health.CAB International. 1997, New York.
- Marais, A.; Labuschagne, J.; Booyse, M. Influence of oats cover crop preceding dryland lucerne establishment on some aspects of soil microbial ecology. South African Journal of Plant and Soil. 2020, 37, 87–89. [Google Scholar] [CrossRef]
- Gomez, M.B.; Pittroff, S.M.; De Neergaard, A.; Jensen, L.S.; Nicolaisen, M.H.; et al. Penicillium bilaii effects on maize growth and P uptake from soil and localized sewage sludge in a rhizobox experiment. Biol Fert Soil. 2017, 53, 23–35. [Google Scholar] [CrossRef]
- Lucas, M.M. The Symbiosome: Legume and Rhizobia Co-evolution toward a Nitrogen-Fixing Organelle. Front Plant Sci. 2018, 22, 22–2229. [Google Scholar]
Figure 1.
Seasonal pattern of rainfall and tepmerature during 2021 and 2022 cropping seasons s on the Beja experiment site. .
Figure 1.
Seasonal pattern of rainfall and tepmerature during 2021 and 2022 cropping seasons s on the Beja experiment site. .
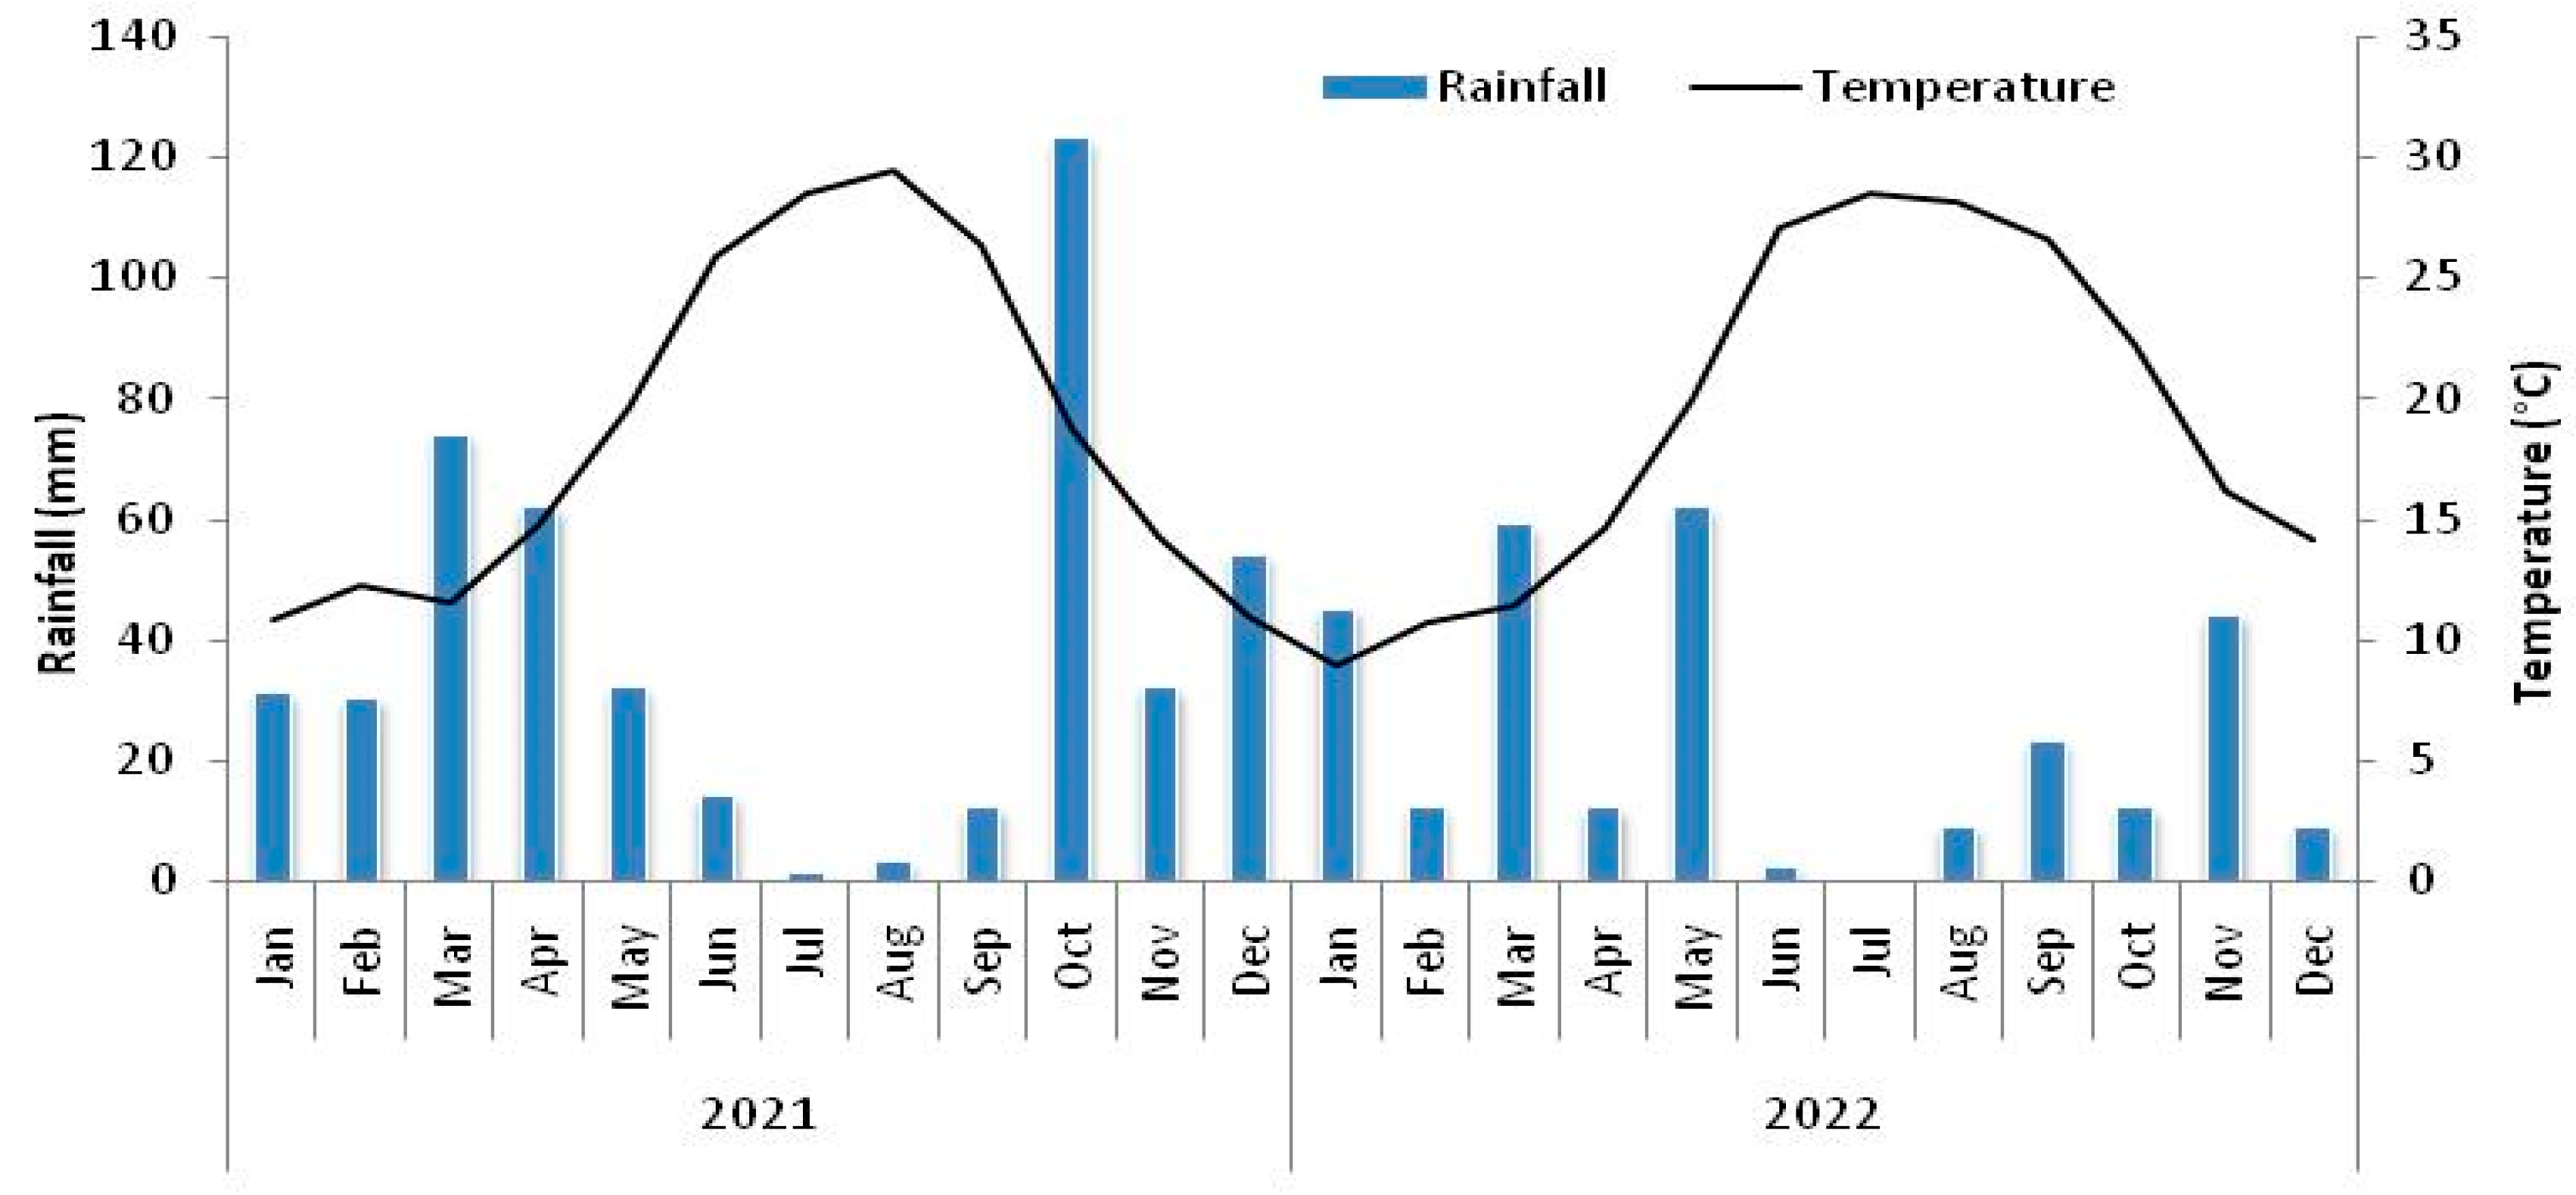
Figure 2.
Experimental site in Beja and seeding scheme.

Figure 3.
Dry biomass production of residues and cover crops inrorporated into the soil during 2021 and 2022 cropping seasons s. Values with different letters (Aa, Bb) indicate significant differences beween treatments (p ≤ 0.05, Tukey tests).
Figure 3.
Dry biomass production of residues and cover crops inrorporated into the soil during 2021 and 2022 cropping seasons s. Values with different letters (Aa, Bb) indicate significant differences beween treatments (p ≤ 0.05, Tukey tests).
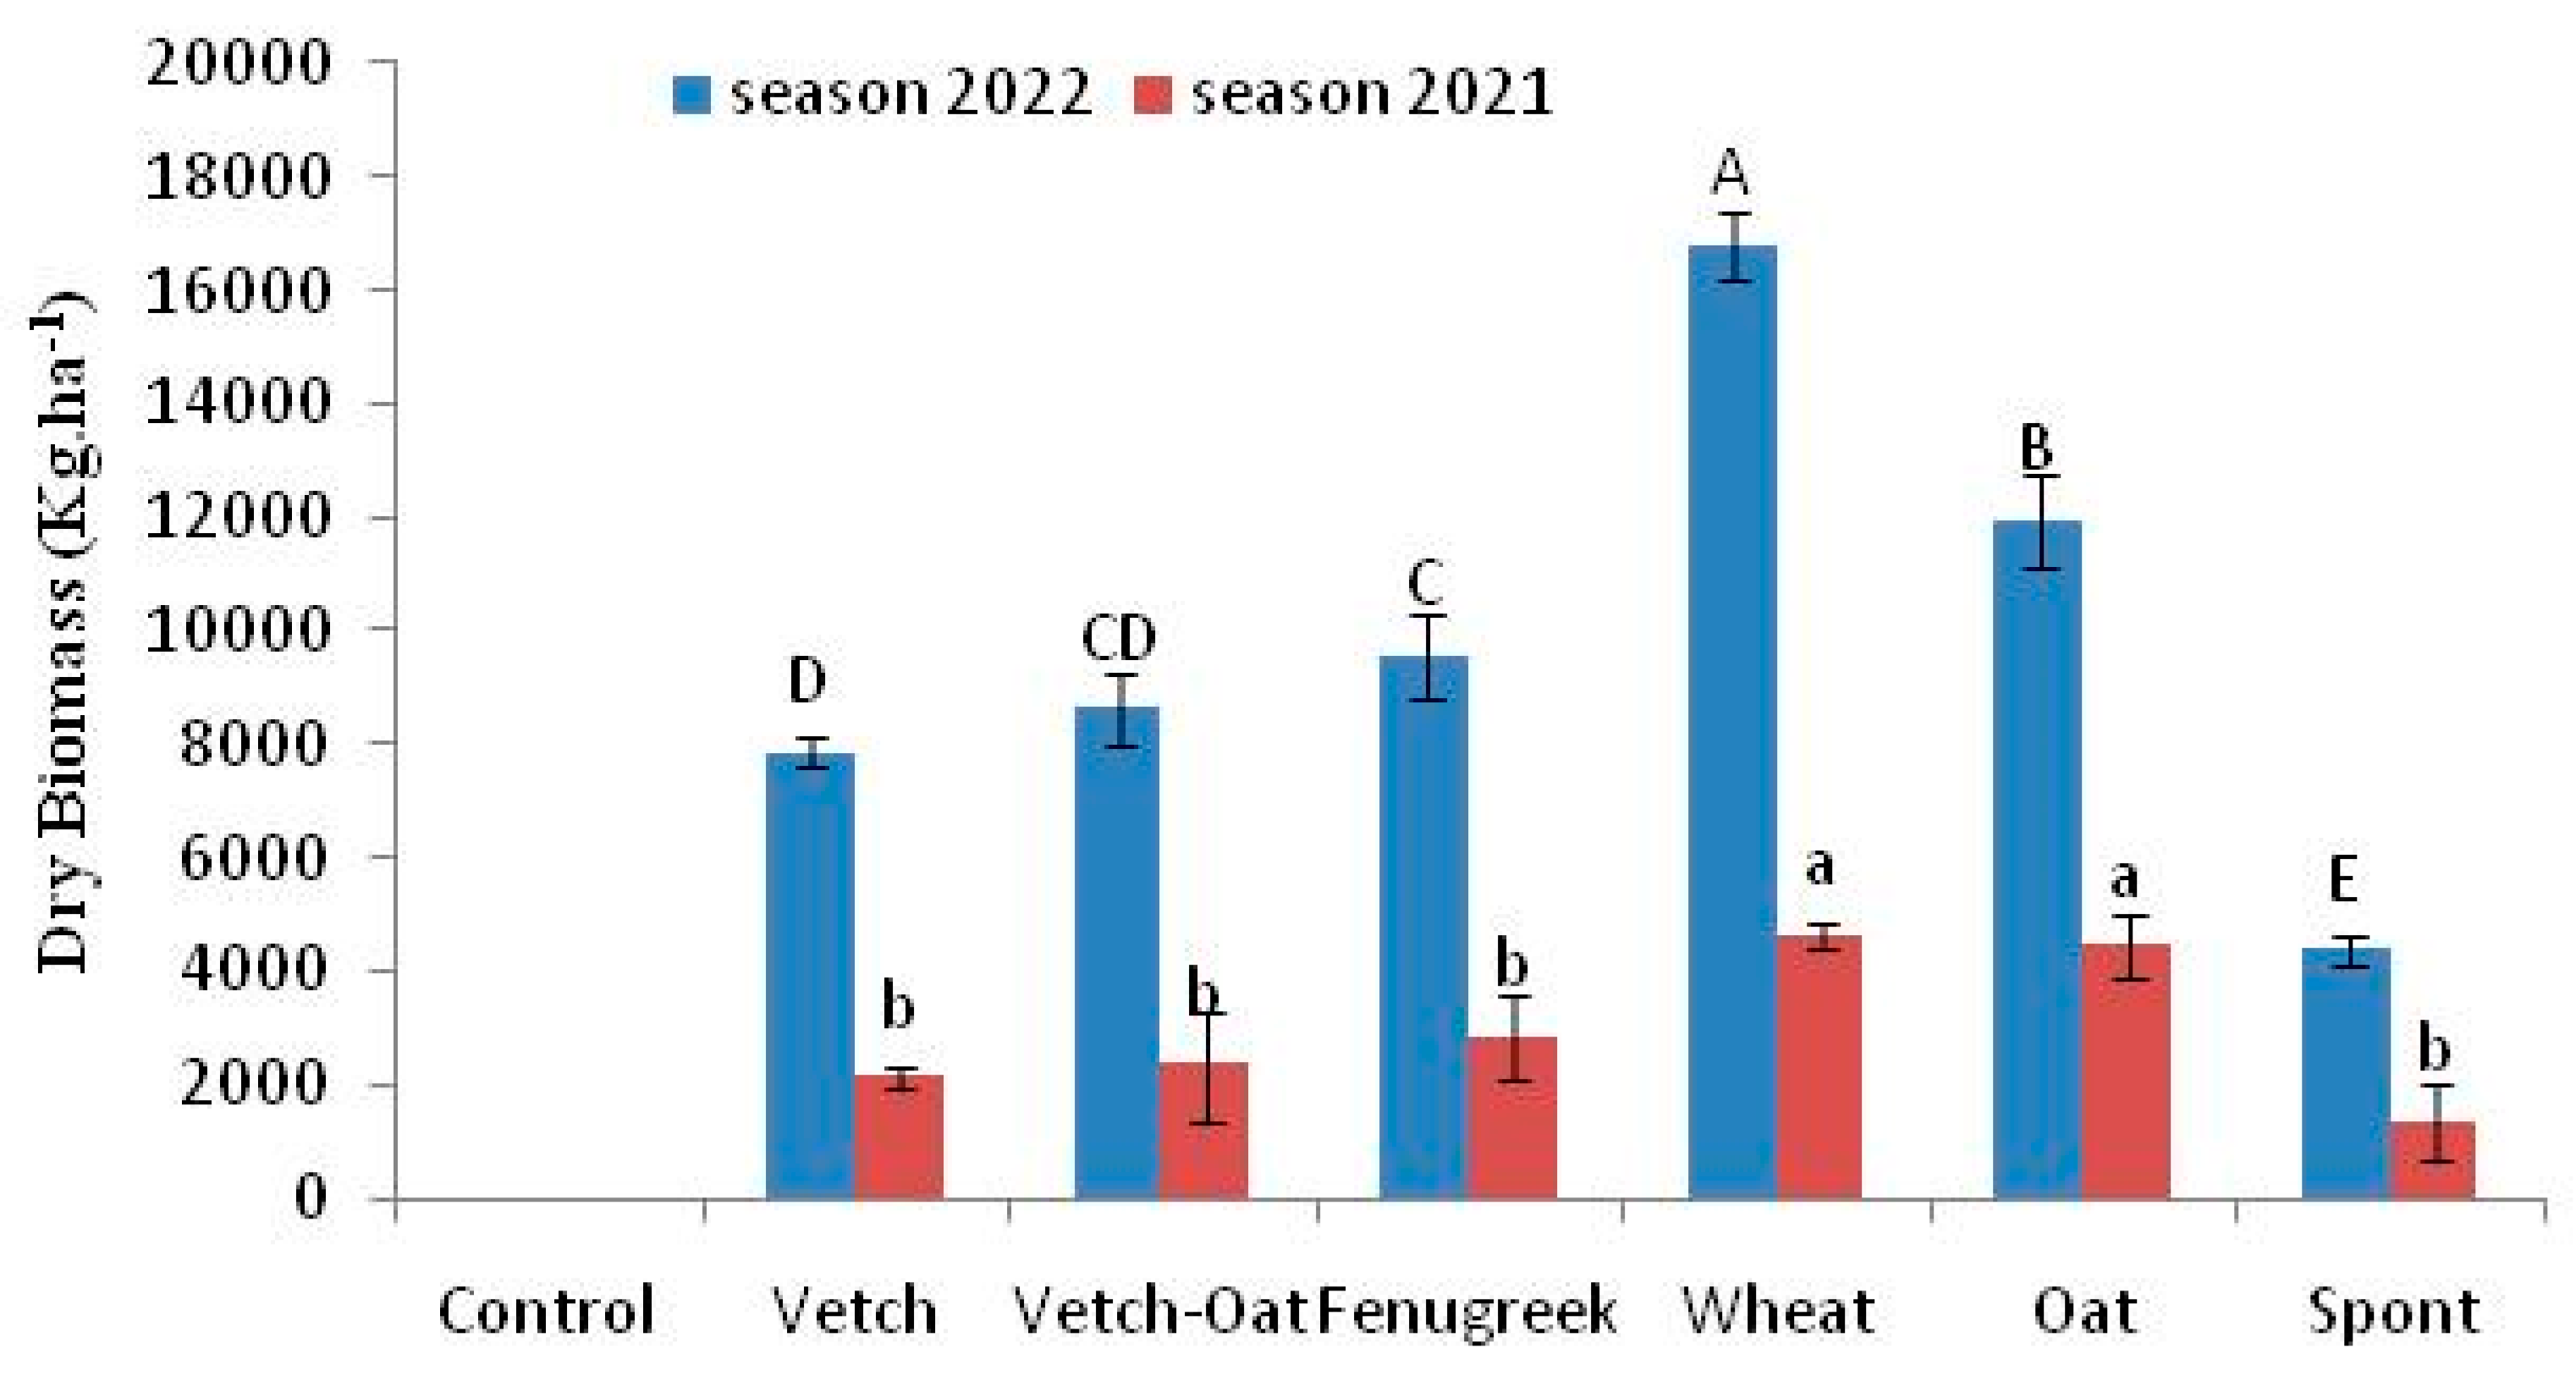
Figure 4.
Dry biomass (A), carbon (B) contents and N (C), P (D) K(E) macronutients of residues and cover crops incorporated into the soil during 2021 and 2022 cropping seasons. Values with different letters (Aa, Bb) indicate significant differences beween treatments (p ≤ 0.05, Tukey tests).
Figure 4.
Dry biomass (A), carbon (B) contents and N (C), P (D) K(E) macronutients of residues and cover crops incorporated into the soil during 2021 and 2022 cropping seasons. Values with different letters (Aa, Bb) indicate significant differences beween treatments (p ≤ 0.05, Tukey tests).
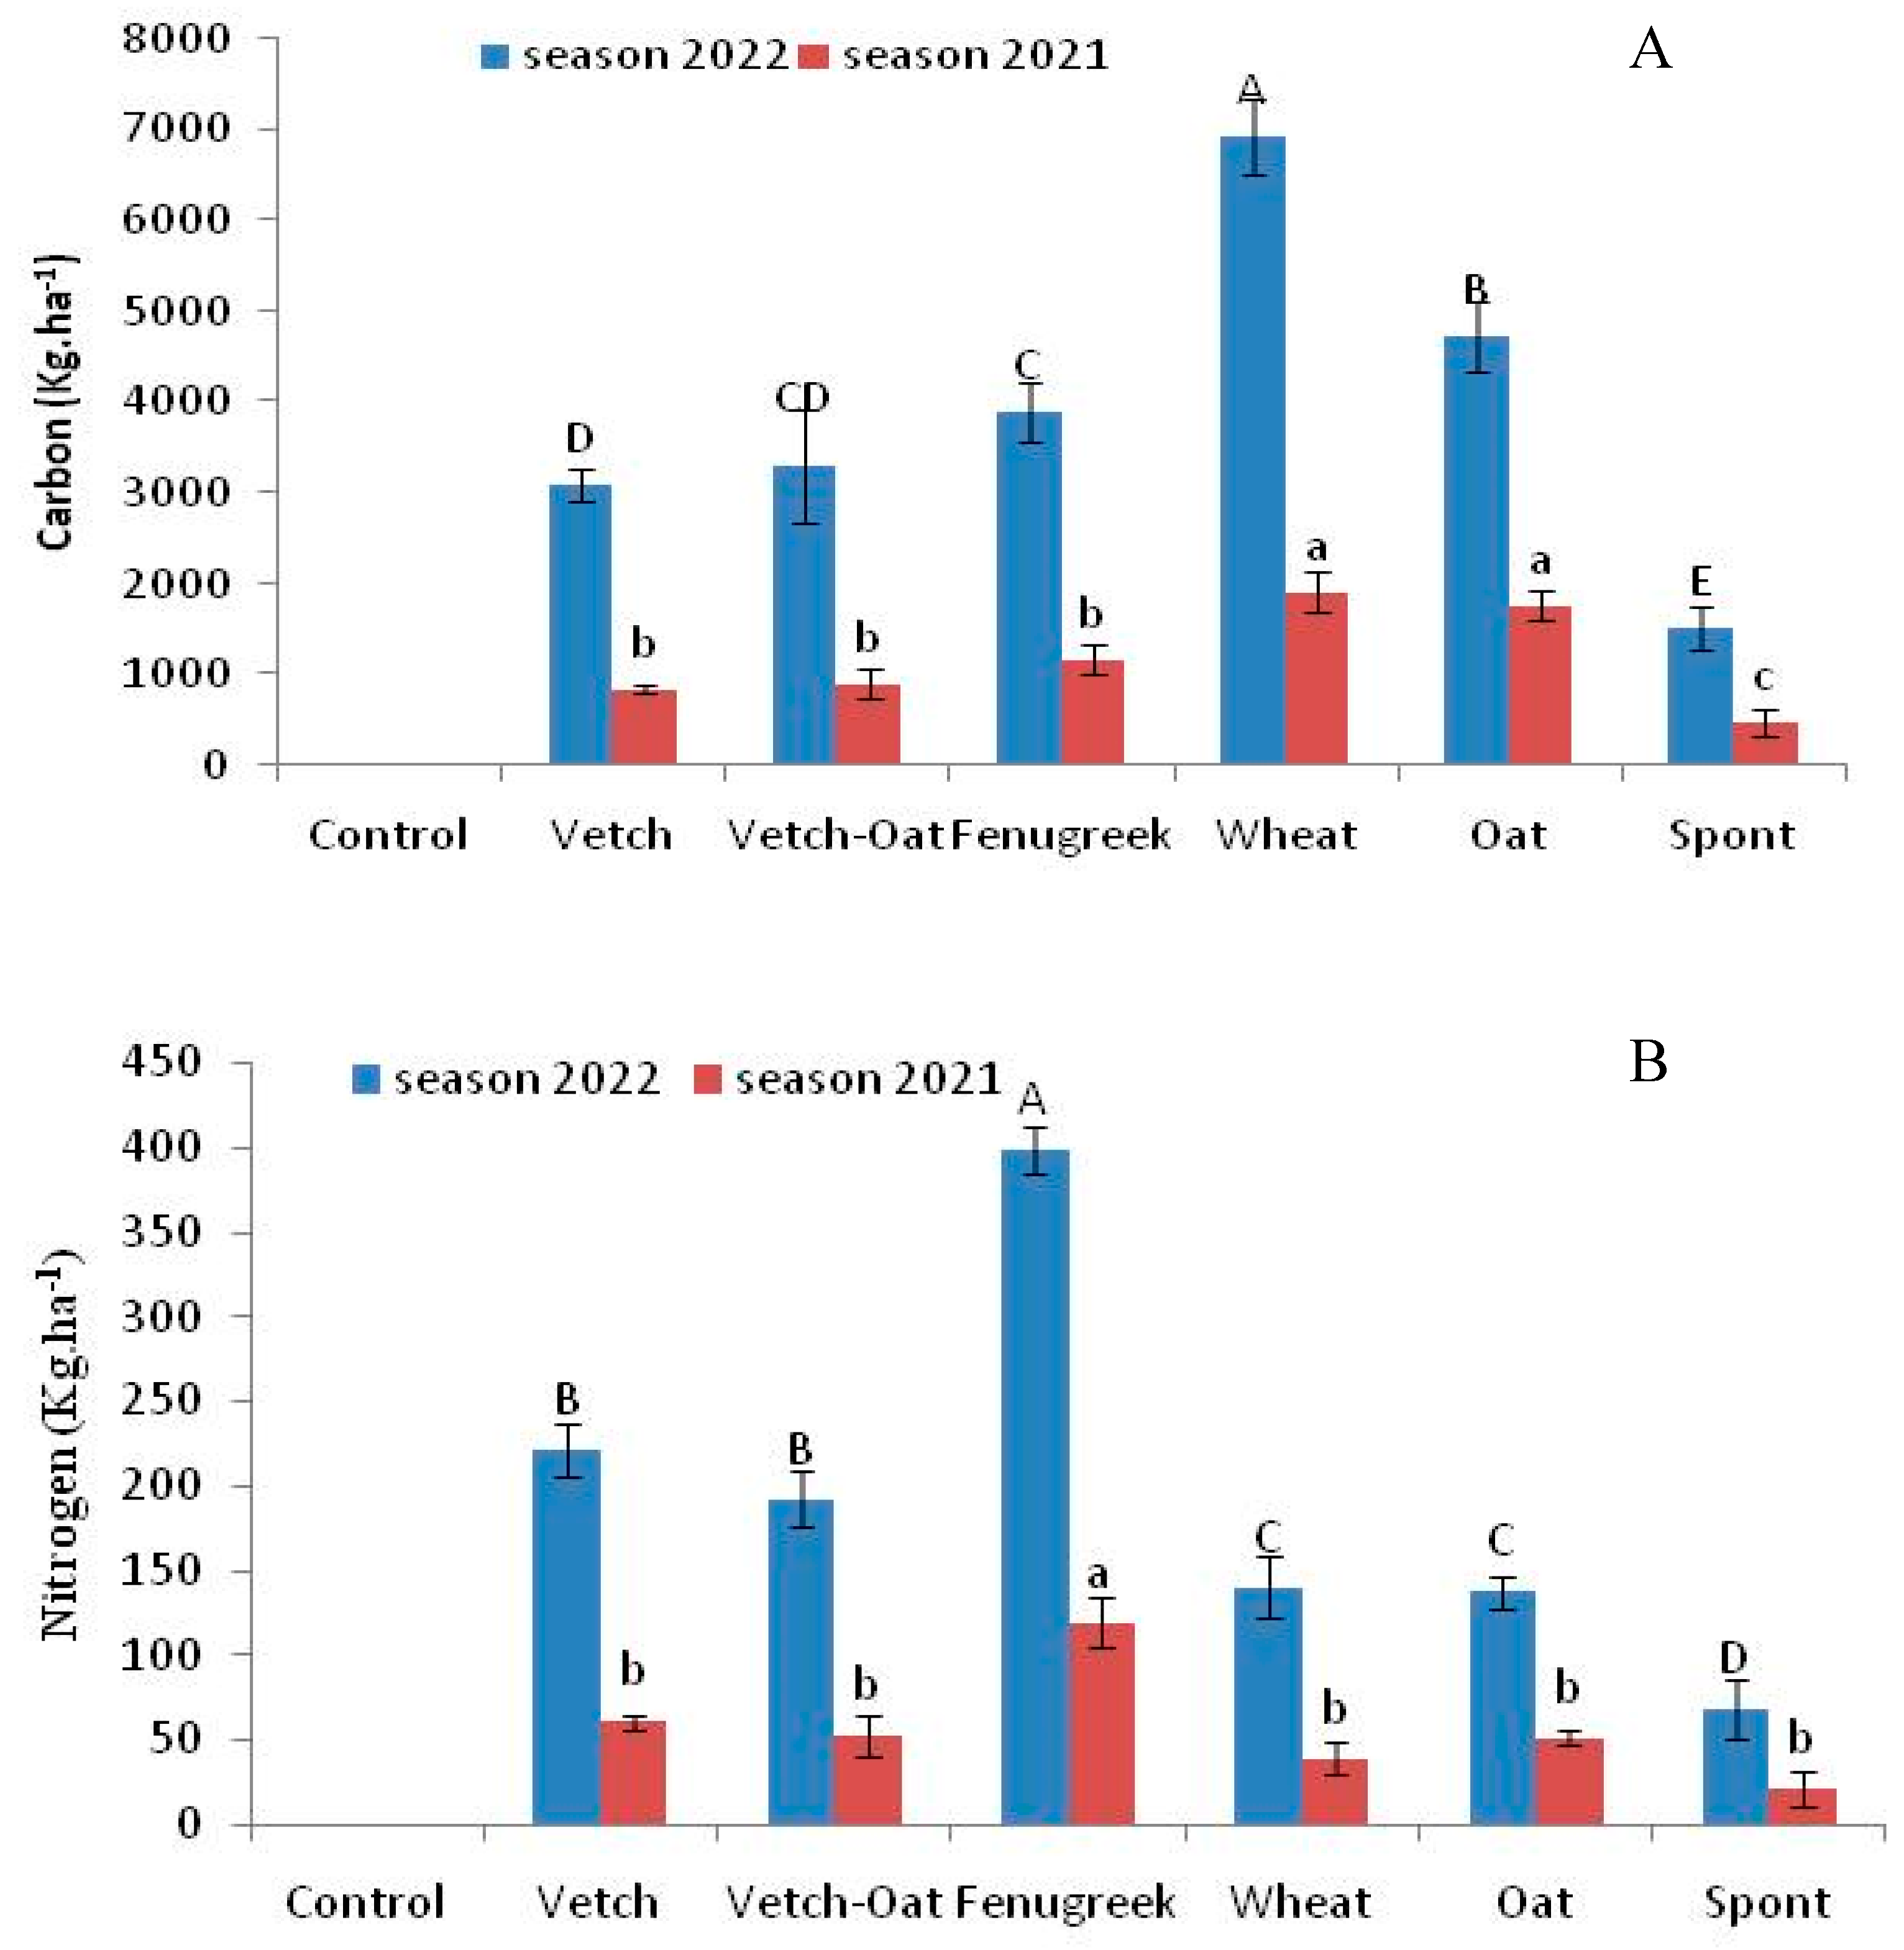
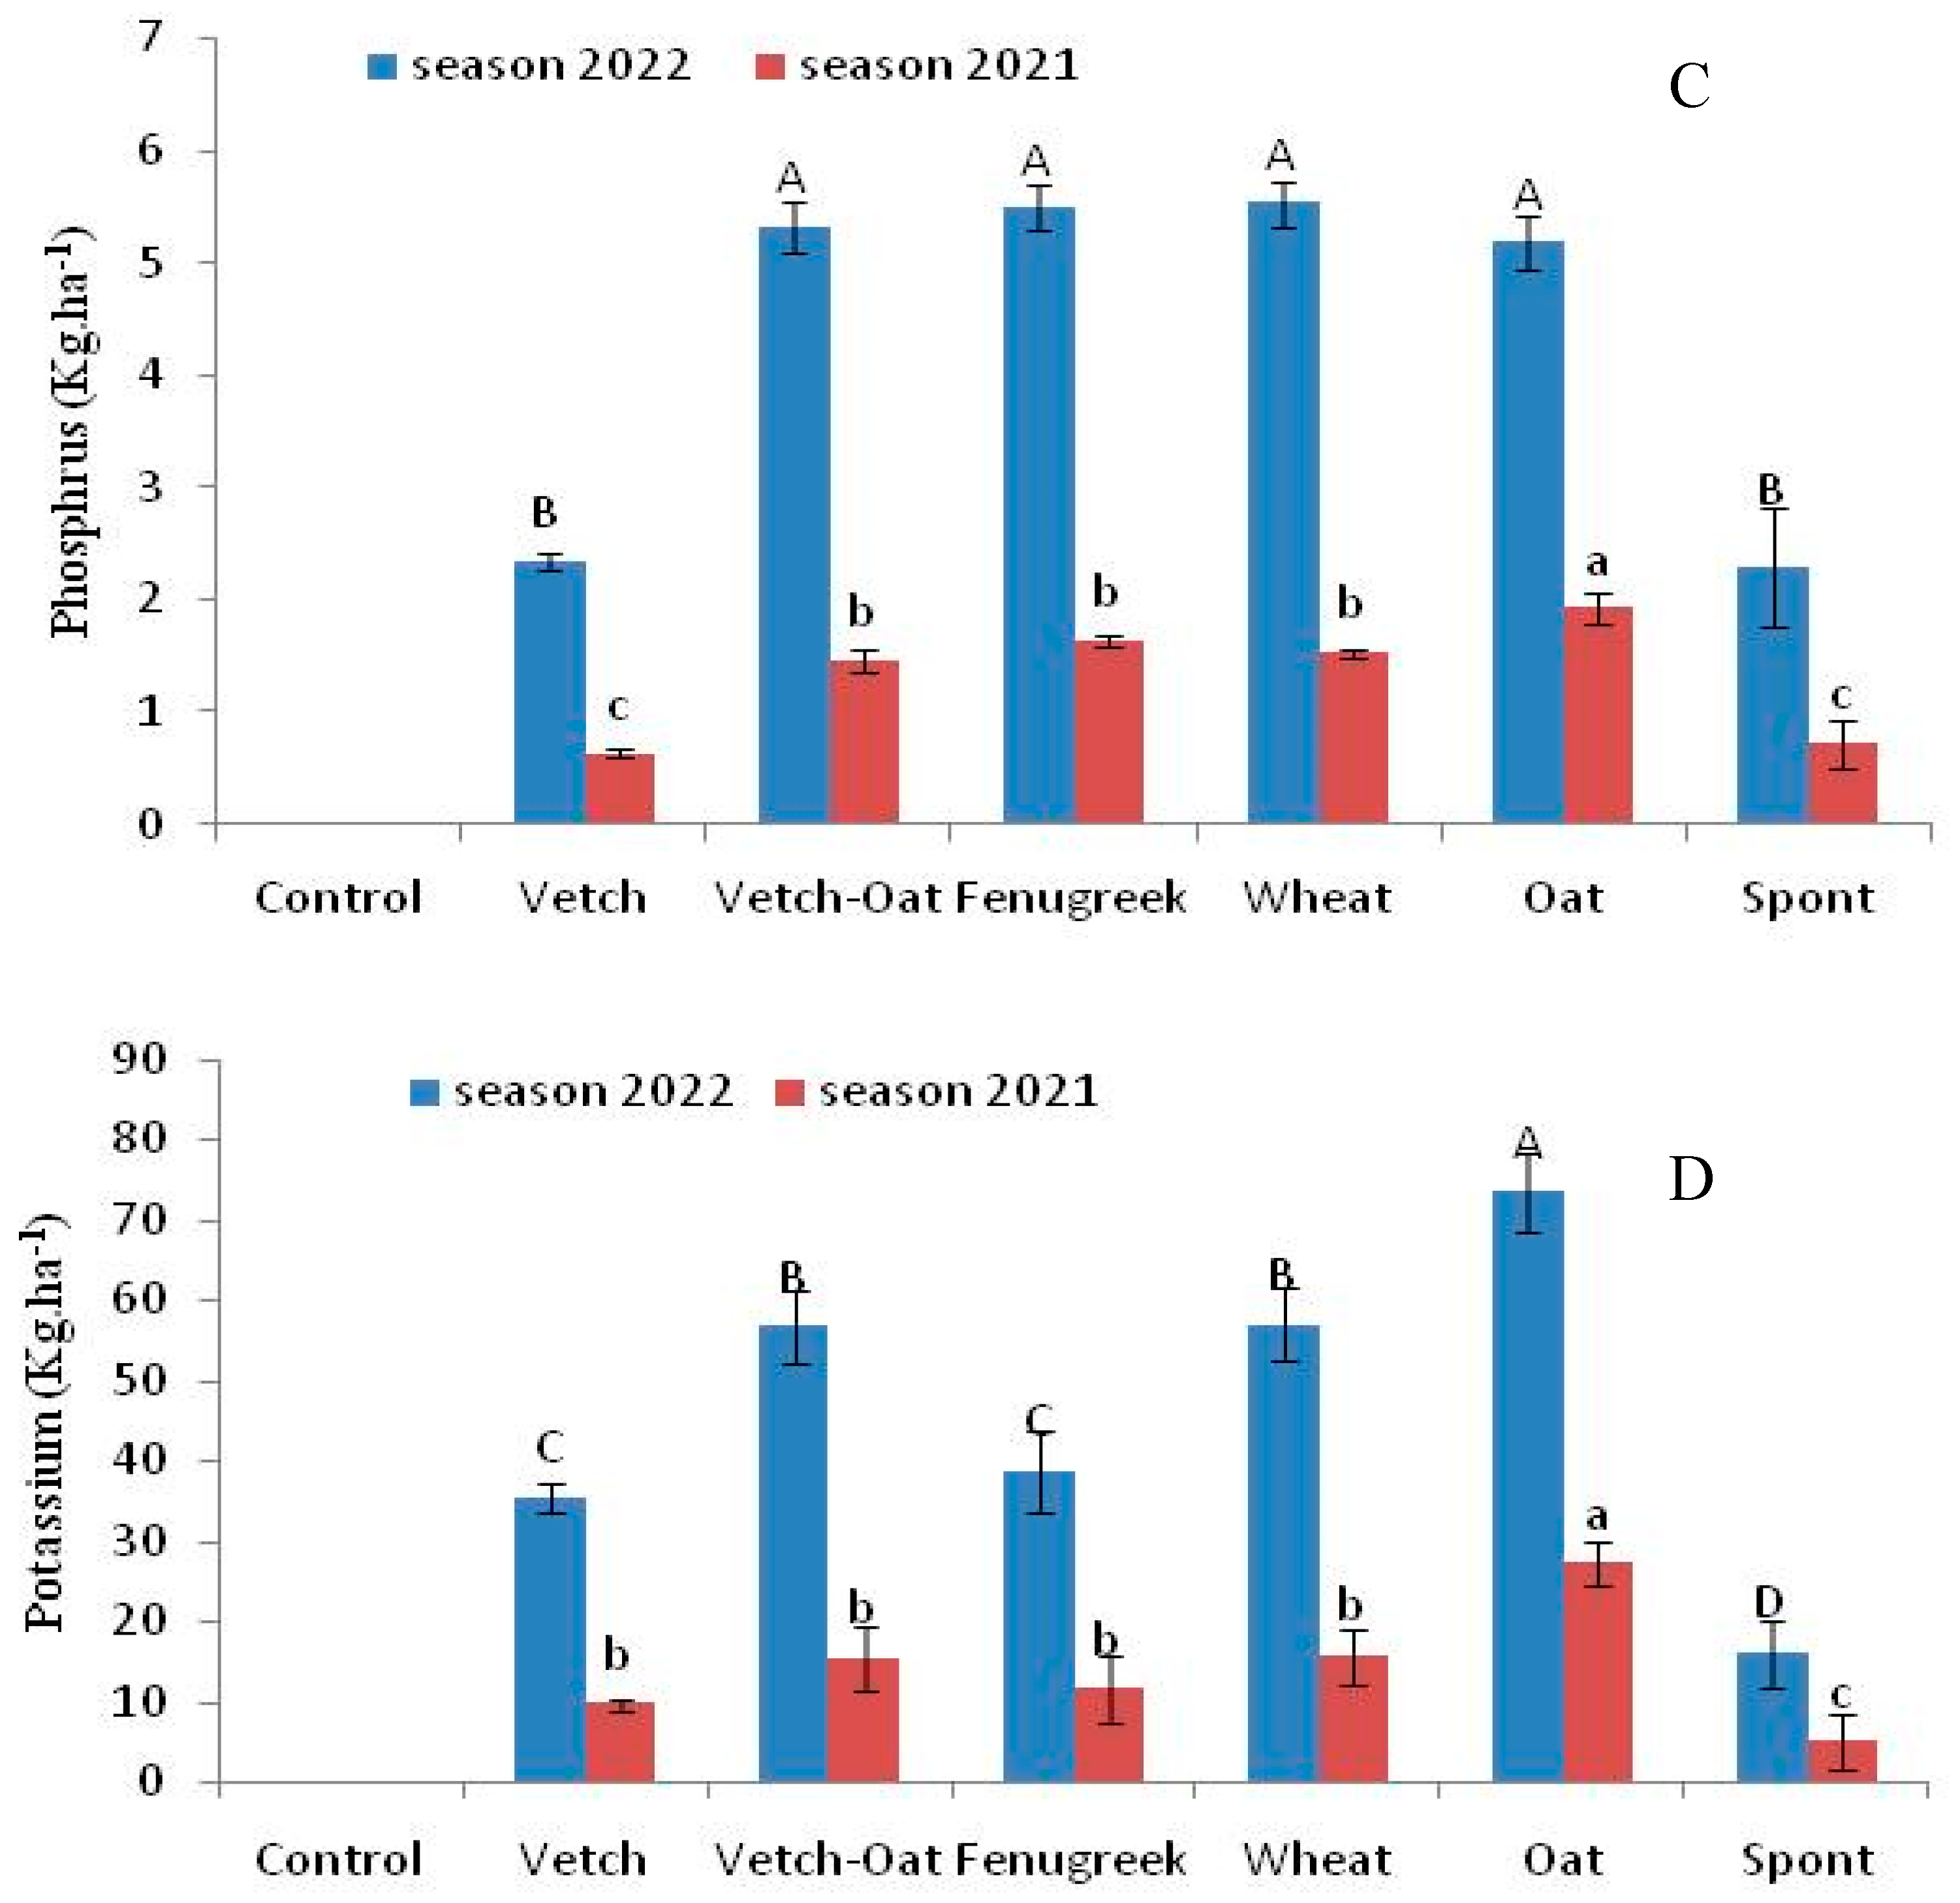
Figure 5.
Effect of cover crops on soil enzymes activities β-glucosidase (A), Dehydrogenase (B), Phosphatase (C) and Arysulfatase (D). Each value is the mean of three replicates. Values with different letters (a, b) indicate significant differences (p ≤ 0.05, Tukey tests).
Figure 5.
Effect of cover crops on soil enzymes activities β-glucosidase (A), Dehydrogenase (B), Phosphatase (C) and Arysulfatase (D). Each value is the mean of three replicates. Values with different letters (a, b) indicate significant differences (p ≤ 0.05, Tukey tests).
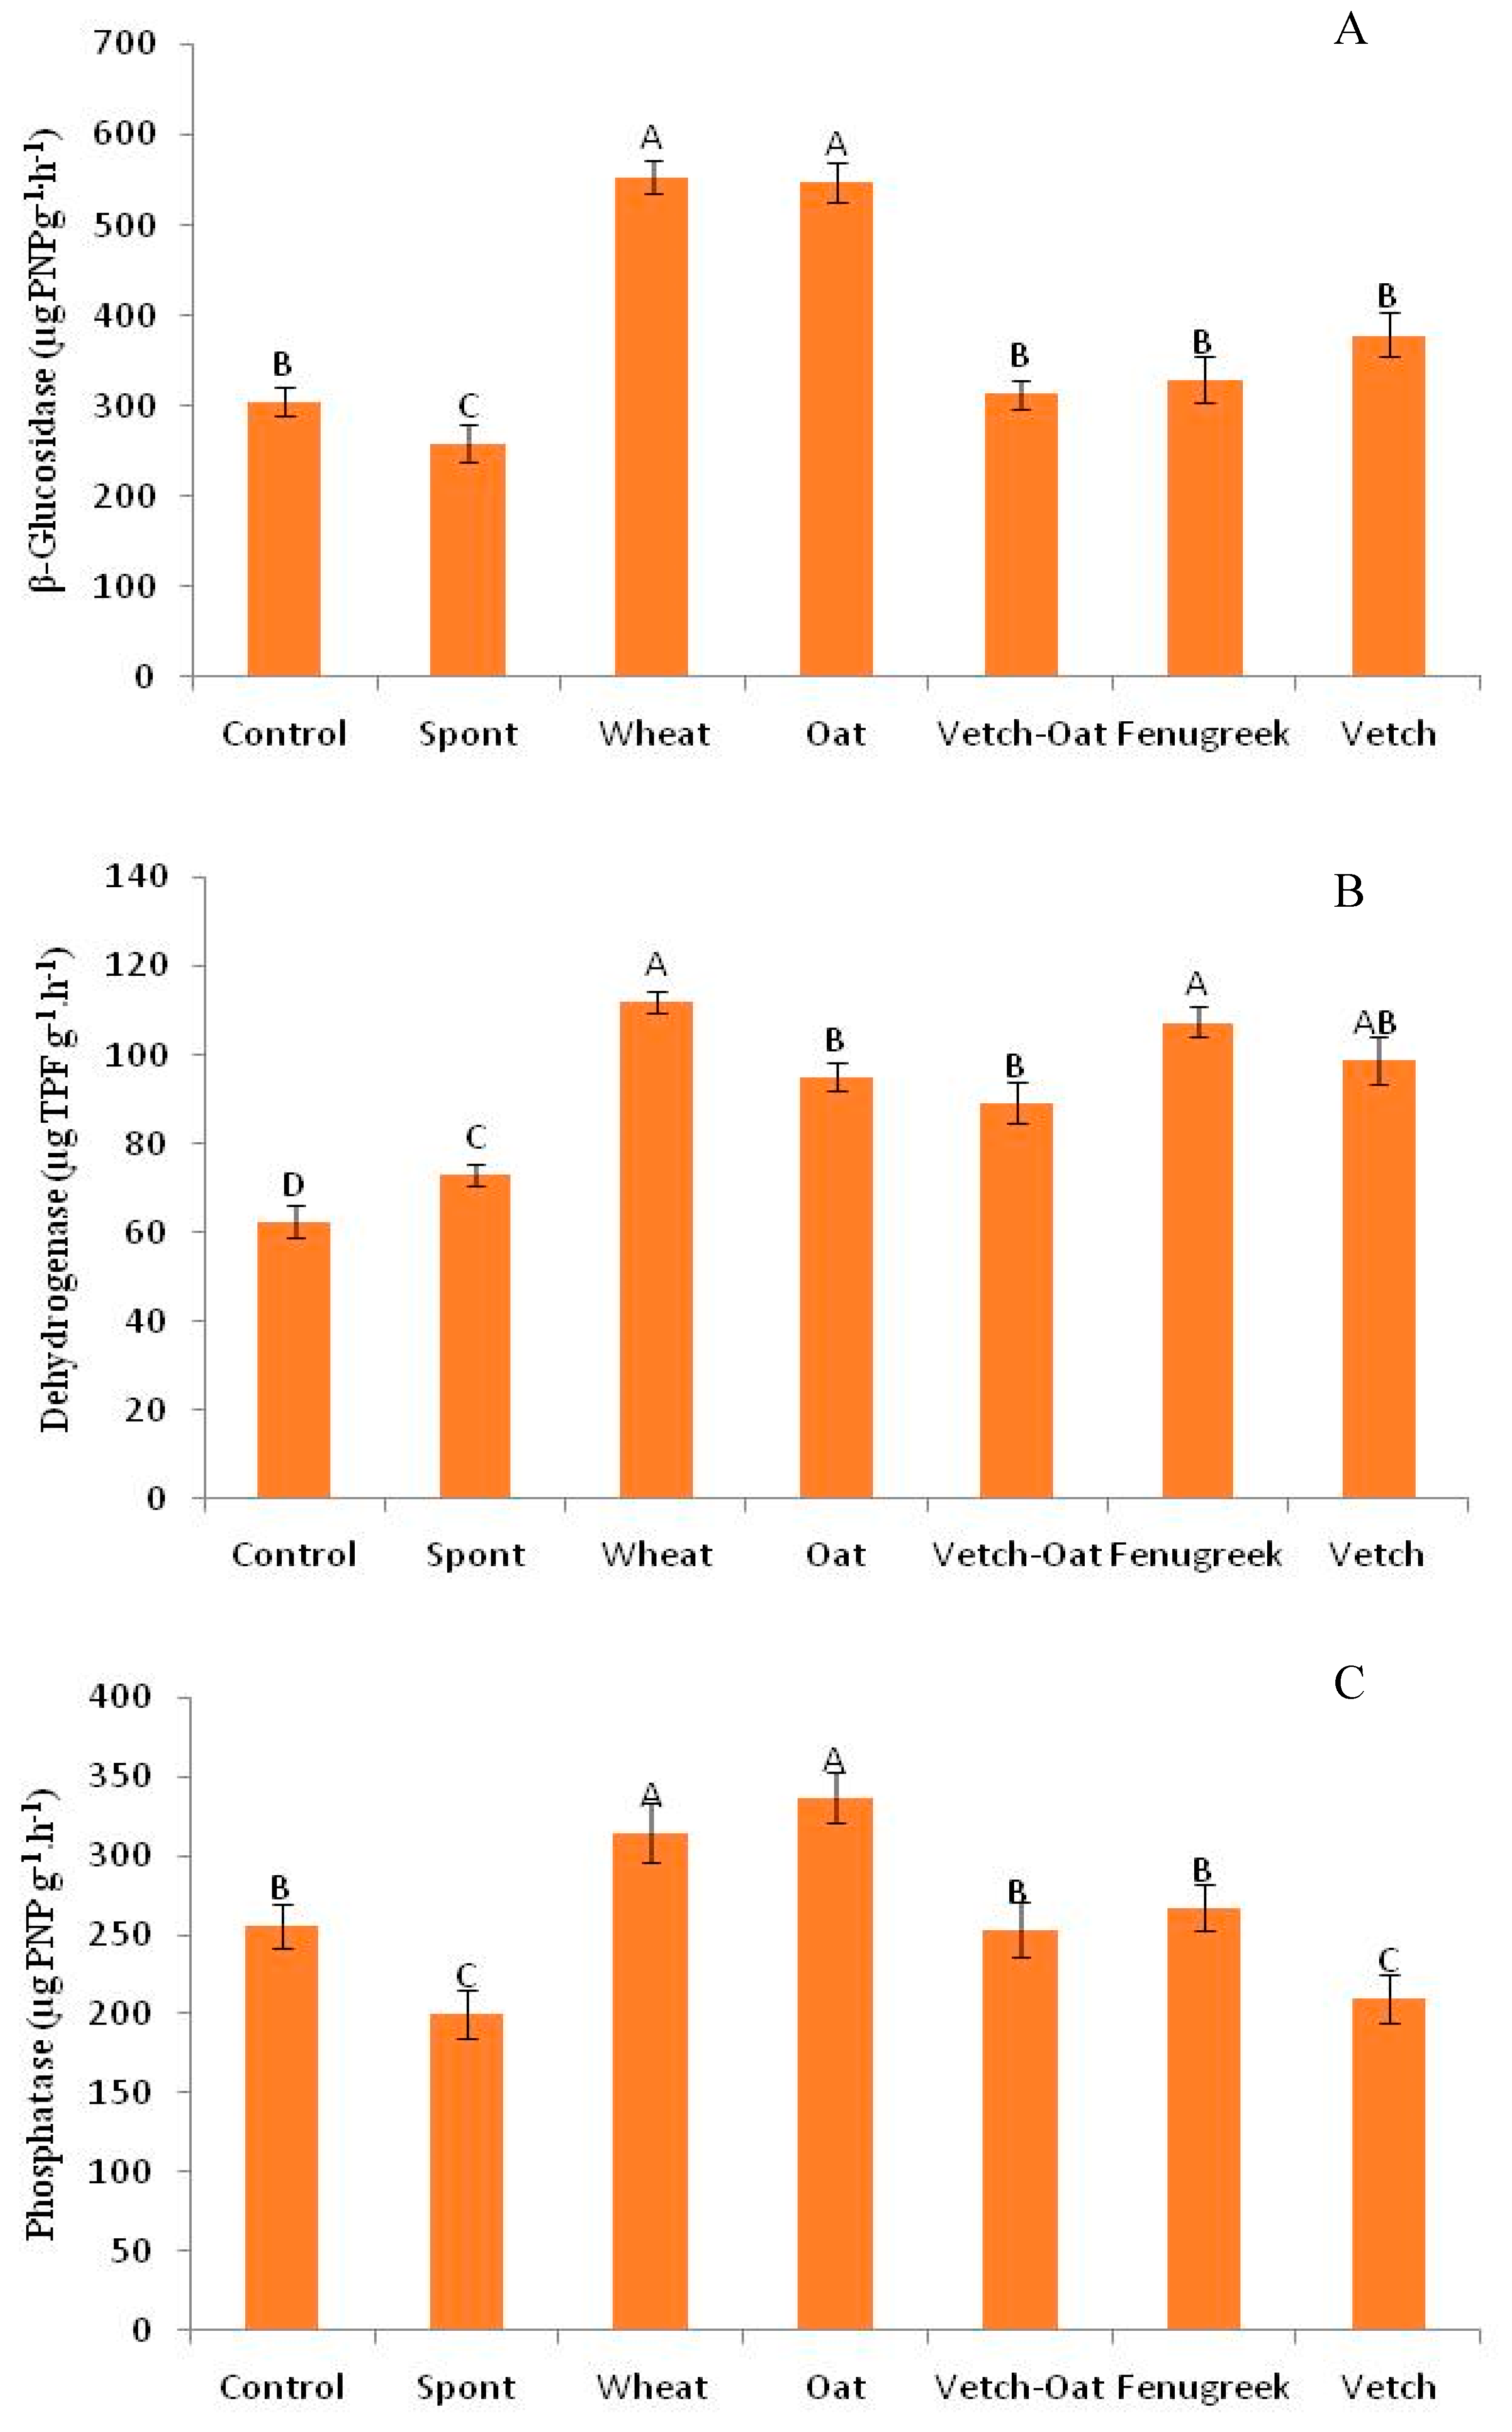
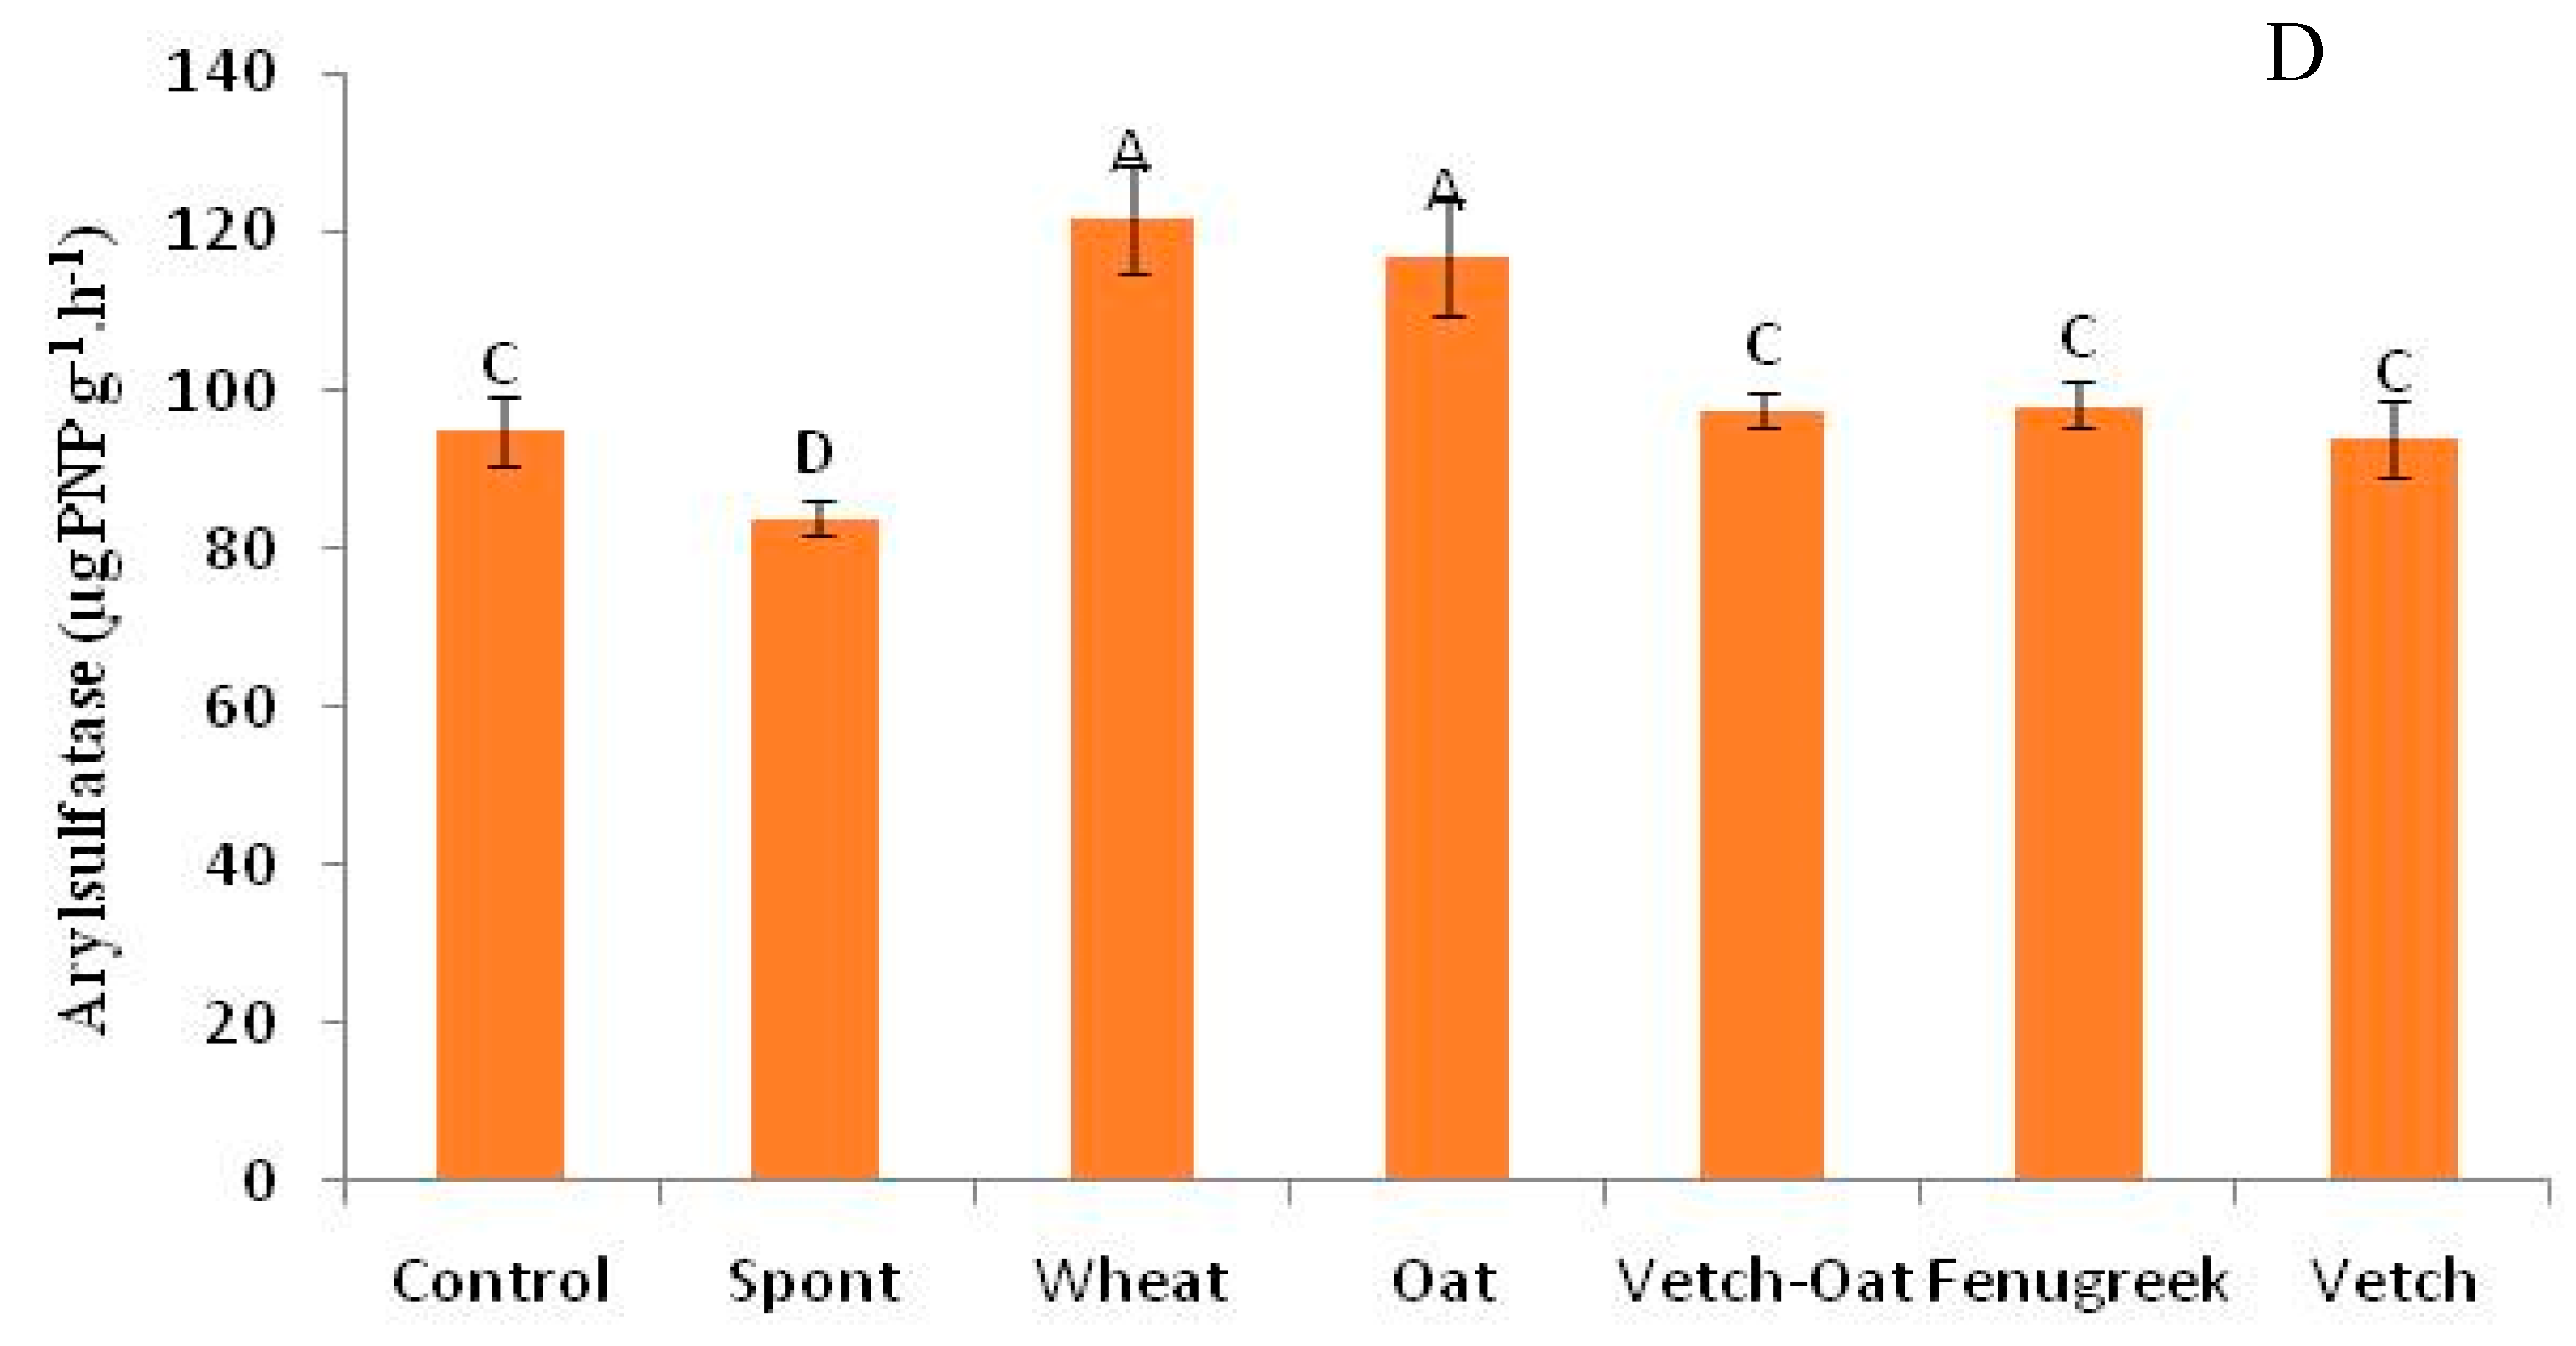
Figure 6.
Average Well Color Developpement (AWCD) of specific substrates (A) and the pourcentage ratio of specific substrate groupings (B). Values with different letters (A, B) indicate significant differences (p ≤ 0.05, Tukey tests).
Figure 6.
Average Well Color Developpement (AWCD) of specific substrates (A) and the pourcentage ratio of specific substrate groupings (B). Values with different letters (A, B) indicate significant differences (p ≤ 0.05, Tukey tests).
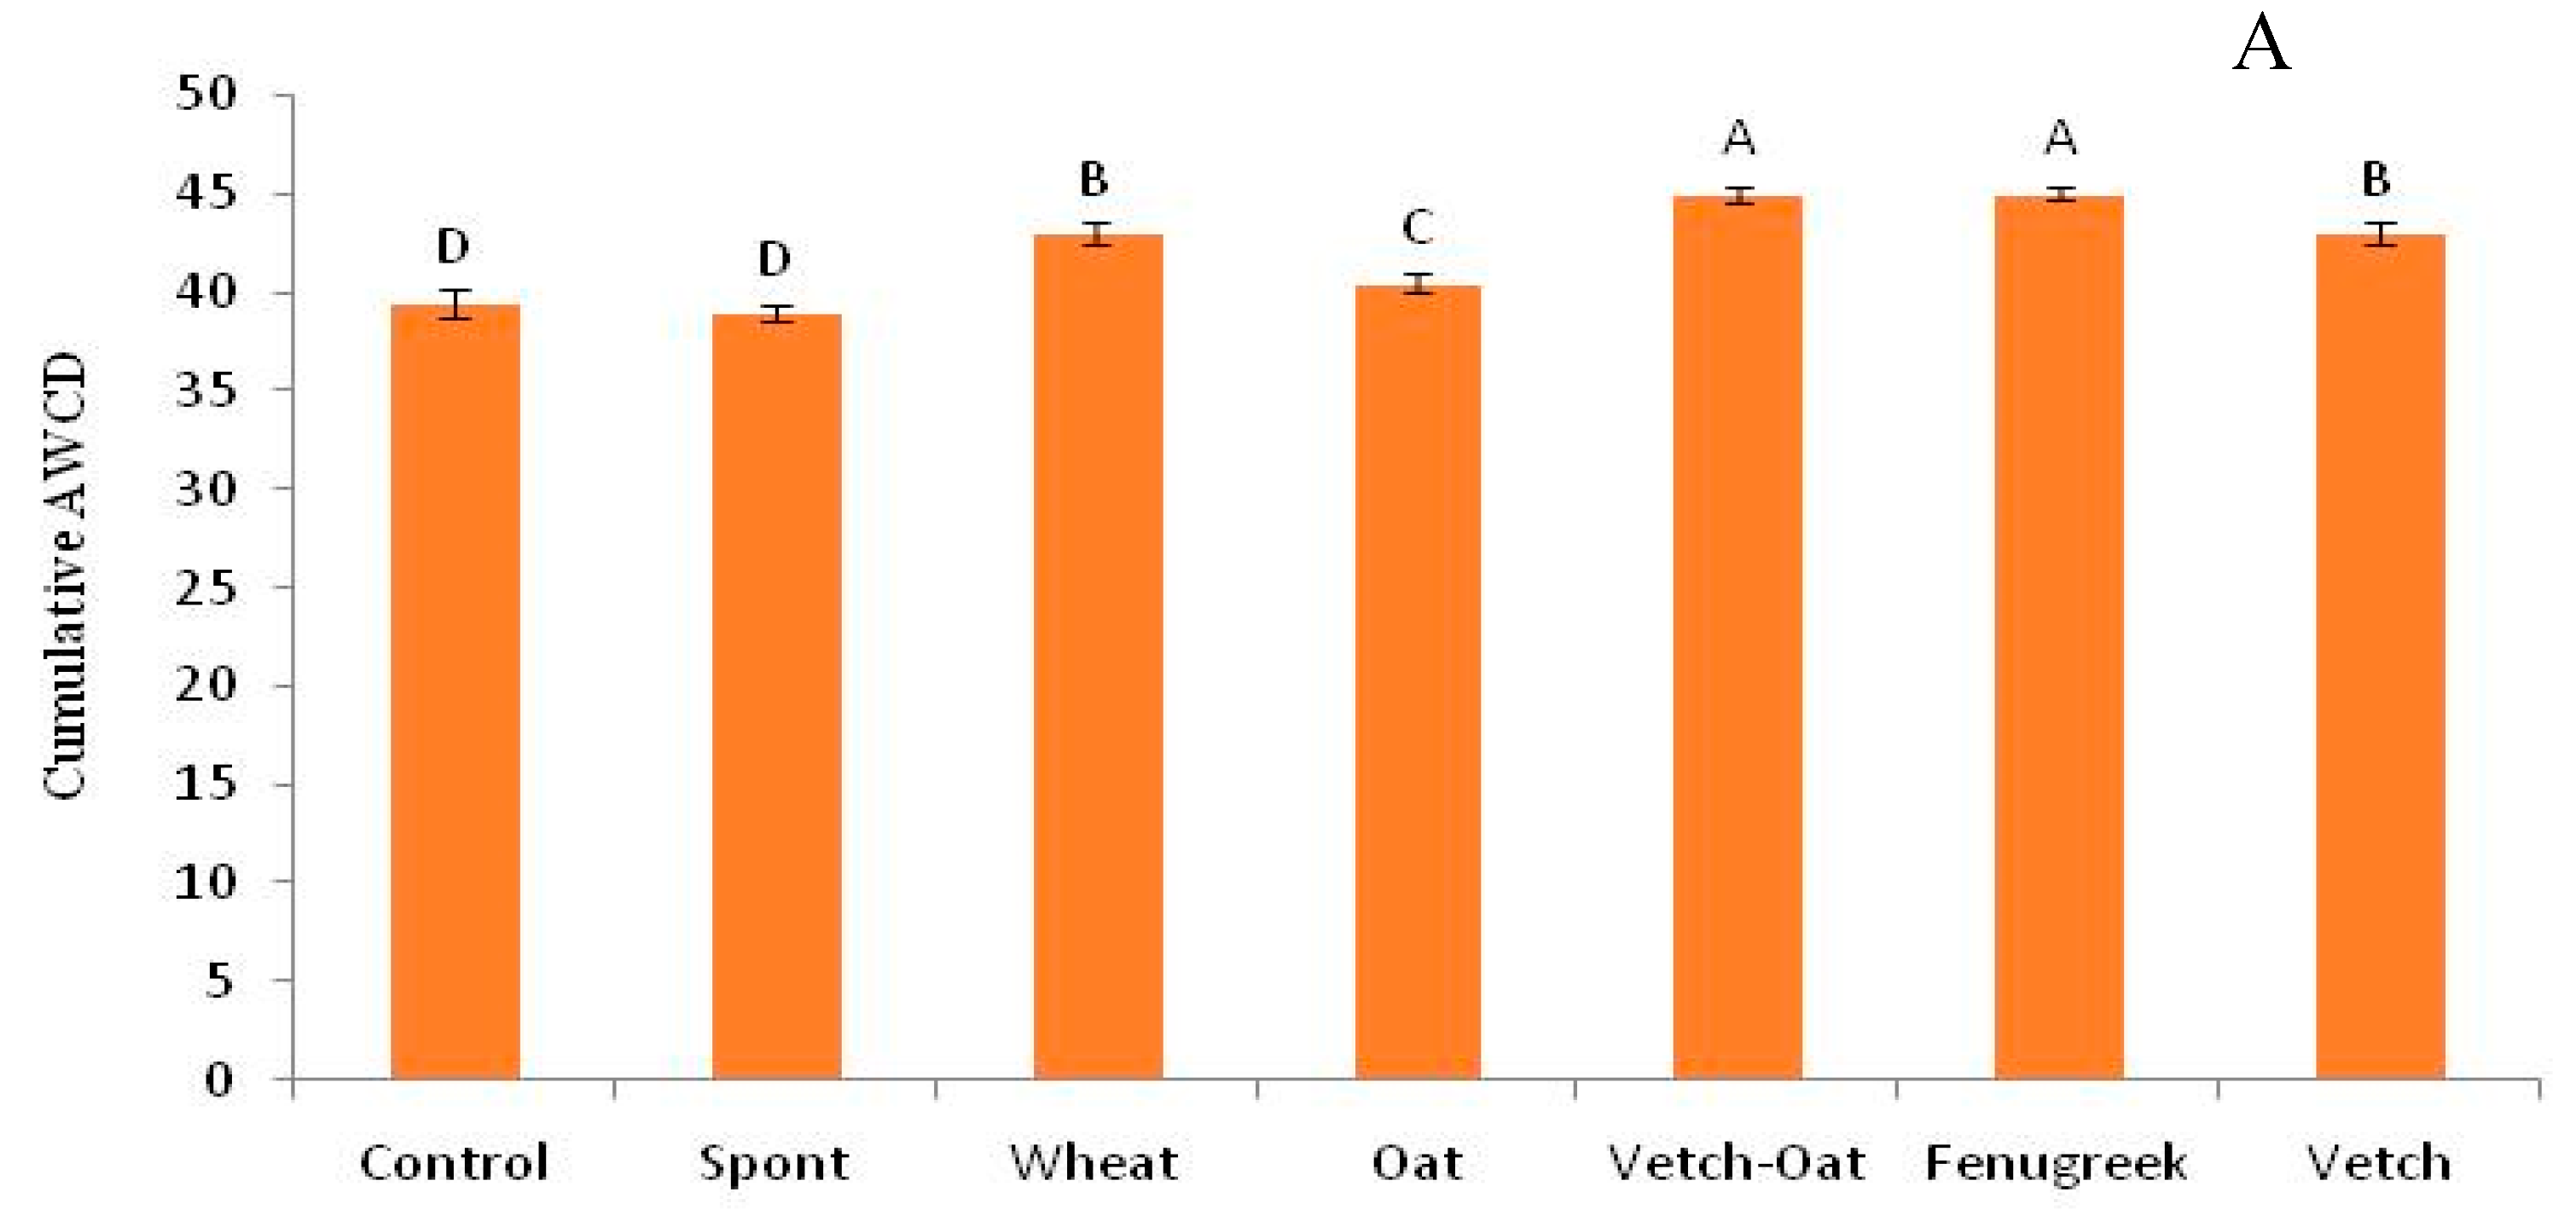
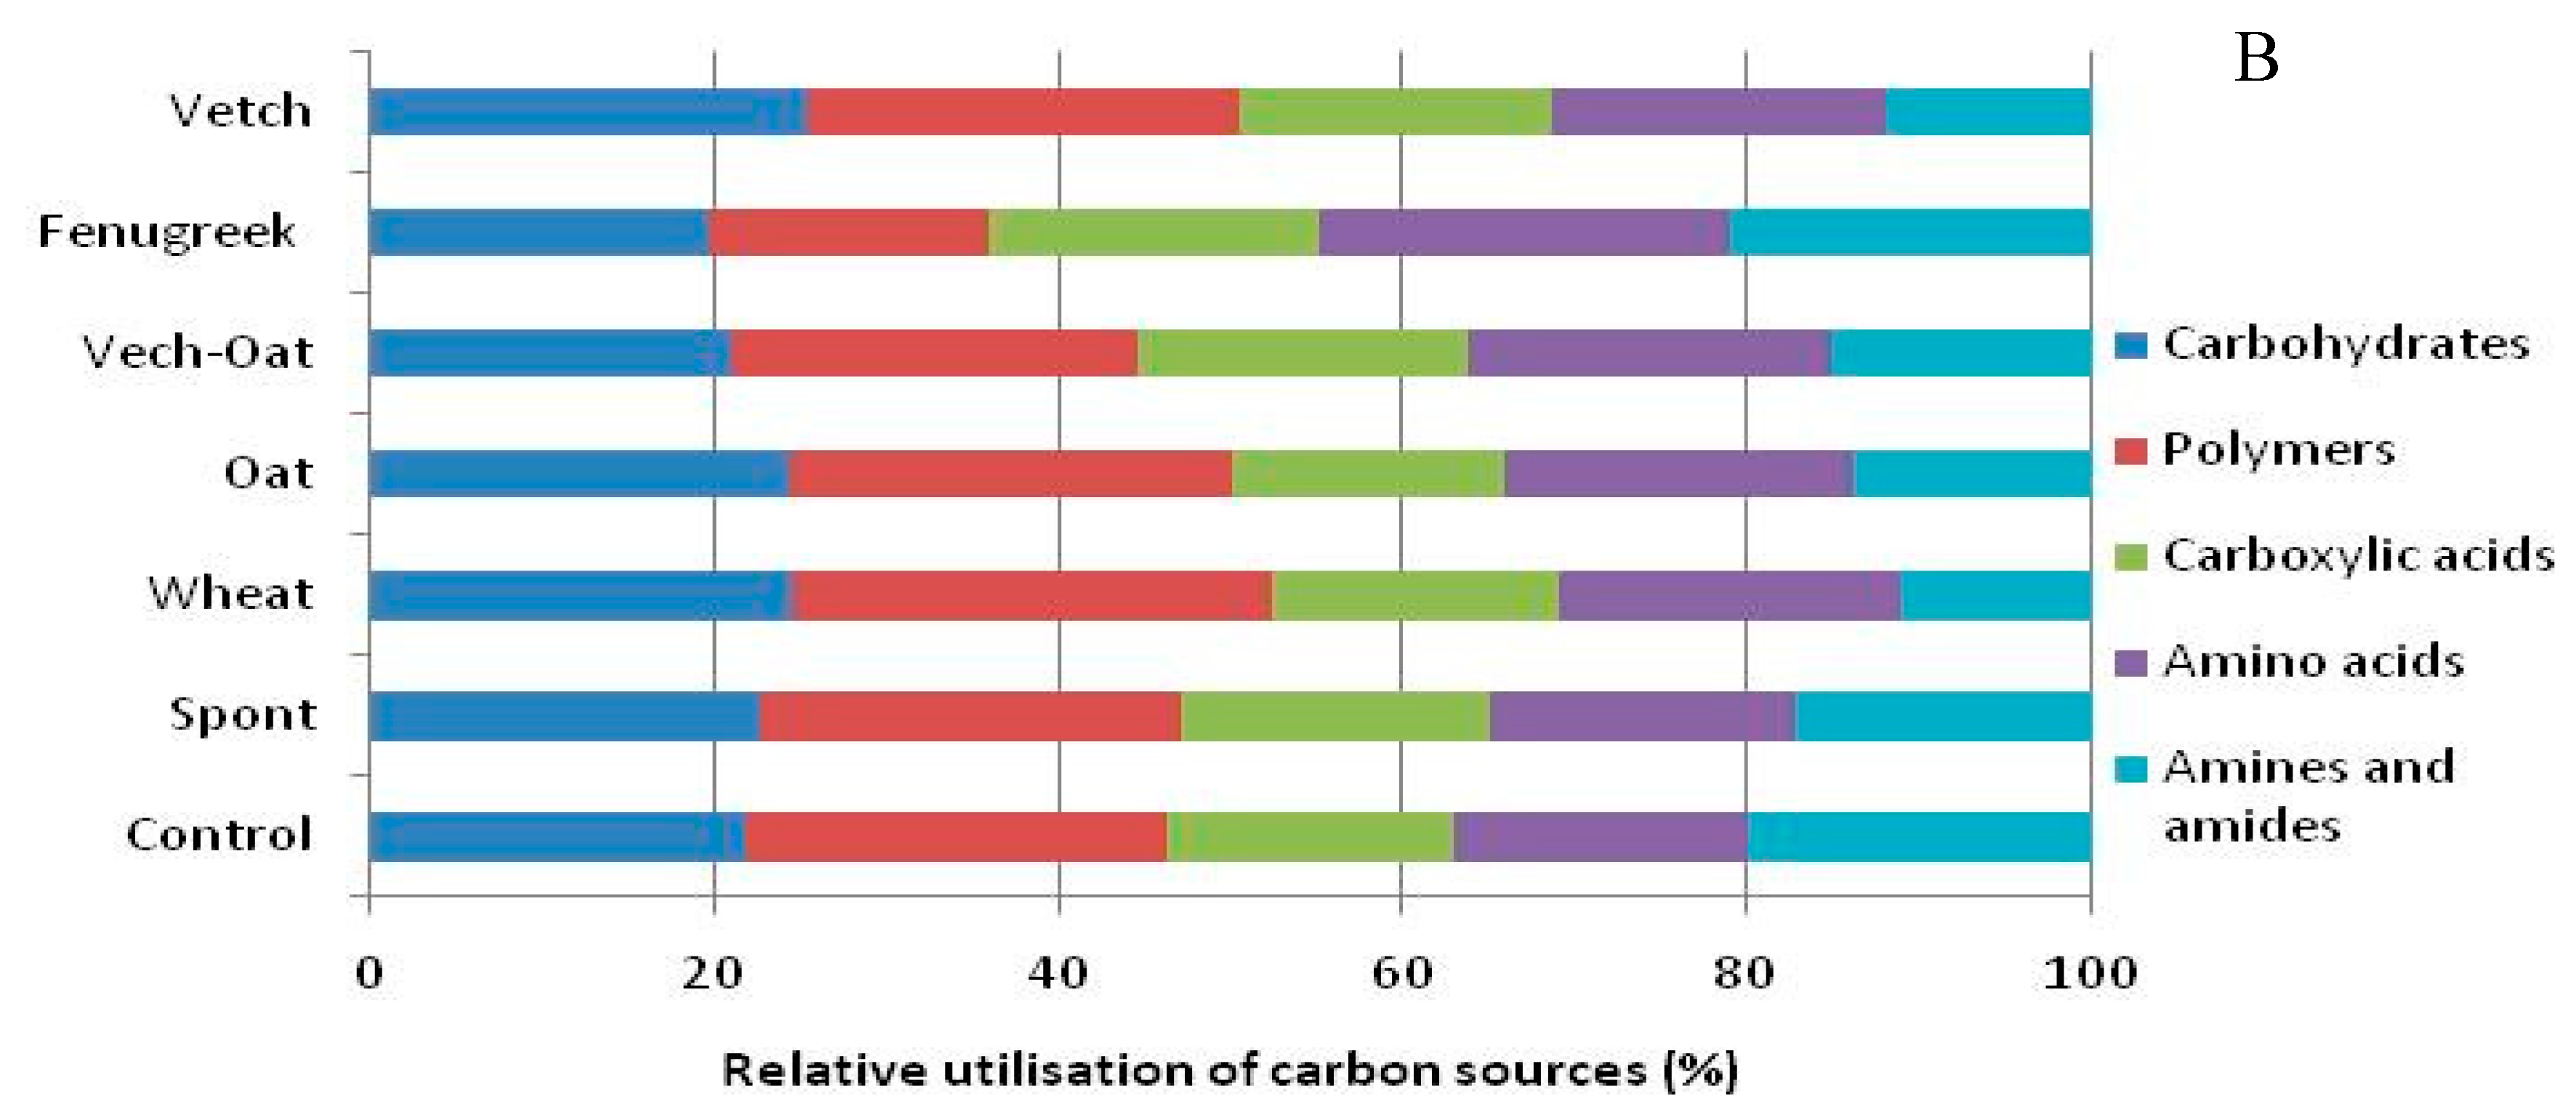

Table 1.
Effect of cover crops on soil quality : organic matter (OM), Nitrogen (N), Phosphorus (P) and Potassium (K) during 2021 and 2022 cropping seasons . Values with different letters (a, b) indicate significant differences between treatments (p ≤ 0.05, Tukey tests).
Table 1.
Effect of cover crops on soil quality : organic matter (OM), Nitrogen (N), Phosphorus (P) and Potassium (K) during 2021 and 2022 cropping seasons . Values with different letters (a, b) indicate significant differences between treatments (p ≤ 0.05, Tukey tests).
| Treatments | OM (%) | N (%) | P (µg.g-1) | K (mg.g-1) | ||||
|---|---|---|---|---|---|---|---|---|
| Season | 2021 | 2022 | 2021 | 2022 | 2021 | 2022 | 2021 | 2022 |
| Control | 1.85±0.034b | 2.07±0.043c | 0.88±0.007b | 1.00±0.016b | 2.68±0.03b | 2.62±0.04c | 2.85±0.03b | 2.48±0.07b |
| Spont | 3.03±0.029a | 3.50±0.084a | 1.57±0.039a | 1.54±0.023a | 3.82±0.02a | 4.08±0.09b | 3.41±0.034a | 3.01±0.03a |
| Wheat | 2.84±0.048a | 3.72±0.043a | 1.43±0.021a | 1.63±0.062a | 3.73±0.12a | 5.88±0.07a | 3.51±0.089a | 2.87±0.07a |
| Oat | 2.13±0.017b | 4.12±0.015a | 1.00±0.02b | 1.68±0.02a | 3.13±0.06b | 4.55±0.04b | 4.00±0.098a | 2.80±0.04a |
| Vetch-Oat | 3.24±0.054a | 3.31±0.04b | 1.57±0.031a | 1.68±0.031a | 3.71±0.09a | 4.56±0.06b | 4.30±0.075a | 3.22±0.03a |
| Fenugreek | 3.04±0.048a | 3.52±0.026a | 1.43±0.04a | 1.33±0.016a | 4.04±0.11a | 4.13±0.09b | 3.50±0.087a | 3.31±0.05a |
| Vetch | 3.07±0.017a | 3.38±0.036a | 1.50±0.017a | 1.43±0.04a | 3.81±0.05a | 4.60±0.07b | 2.91±0.073b | 3.56±0.05a |
Disclaimer/Publisher’s Note: The statements, opinions and data contained in all publications are solely those of the individual author(s) and contributor(s) and not of MDPI and/or the editor(s). MDPI and/or the editor(s) disclaim responsibility for any injury to people or property resulting from any ideas, methods, instructions or products referred to in the content. |
© 2024 by the authors. Licensee MDPI, Basel, Switzerland. This article is an open access article distributed under the terms and conditions of the Creative Commons Attribution (CC BY) license (http://creativecommons.org/licenses/by/4.0/).
Copyright: This open access article is published under a Creative Commons CC BY 4.0 license, which permit the free download, distribution, and reuse, provided that the author and preprint are cited in any reuse.


