Submitted:
14 March 2024
Posted:
14 March 2024
You are already at the latest version
Abstract
VE is a powerful technique for analyzing a design with a focus on functionality, reducing costs, and increasing value. However, in order to proceed with the design of VE, the theoretical basis for the VE target selection process, which must be preceded in the preparation stage, is lacking, and as a result, it is difficult to verify the most effective target selection. Thus, a theoretical basis is needed. In this study, we intend to quantify the WORTH value of the COST TO WORTH technique and present an objective model of the target selection method using the derived Value Index (VI). For this purpose, cost worth (WORTHC) was calculated based on the performance data of 1,008 cases of 15 building types provided by the Domestic Public Procurement Service and the share of 83 detailed processes in 7 fields. Then, a survey was conducted targeting the ordering companies, and the final worth (WORTHF) was calculated by multiplying the derived customer value (WORTHV ) weight for each detailed work type. We calculated the Value Index (VI) by comparing COST and WORTHF for each detailed construction type of the VE project and developed a model to select construction types that exceed the VI standard value derived using the standard error of the population. Both cost experts and non-cost experts can use the developed model to specify the VE target selection criteria in order to easily select the key target, objectively sort the values that serve as the basis for calculating the value index and make it possible to more easily select the VE target selection criteria based on theoretical evidence. Also, the model can be used to obtain effective detailed design VE results.
Keywords:
Public Buildings
; Construction VE
; Worth
; VI
; Key Targets selection
1. Introduction
1.1. Background and Purpose of Research
The major limitations of cost modeling techniques for selecting targets in VE are identified as evaluation centered on cost-centric criteria, deterioration of objectivity and reliability of worth, unrealistic worth estimation, and insufficient consideration of reflecting customer demands. Analyzing the application of cost modeling techniques revealed that among the techniques for selecting targets, those focusing on high-cost areas are most commonly used. Among these techniques, the “Cost to Worth” method defines "Worth" as the minimum cost required to perform the same function. To estimate this "Worth," a single primary function representing each cost item is necessary. However, since the experience of the VE team can influence the estimation of "Worth" in the “Cost to Worth” technique, the objectivity and reliability of "Worth" are diminished. Furthermore, in VE, the value is not determined by the producer or contractor but by the customer's judgment. However, in most cases, understanding customer demands relies largely on the experience of VE team members and presentations from clients and designers. Especially in the VE target selection process, there is a heavy focus on estimating costs and Worth. As a result, true VE target selection processes involving joint efforts and agreements among clients, designers, and the VE team for recognizing issues and reflecting customer demands may be disregarded [1](p.ⅰ~ⅲ).
Above all, there is no established theoretical basis for criteria and scope approaches in selecting VE targets, leading to arbitrary tendencies in VE target selection. Additionally, verifying the optimal and effective target selection is challenging. Therefore, to enhance the objectivity and reliability of VE target selection, there is a need for theoretical foundations regarding the scope, methods, and effective implementation of VE after selection [2](p.3).
The client establishes a project budget, and the designer proceeds with the design based on that budget. Then, at the completion stage of documents such as design drawings, specifications, and site manuals, the client must calculate the estimated cost for construction, known as the tender amount, to commission the construction work. In overseas quantity survey (QS) fields, various professional bodies and qualification systems for quantity surveyors are implemented by organizations such as the “Royal Institution of Chartered Surveyors”, founded in 1881 (RICS) in the UK, “Union National des Economistes de la Construction”, founded in 1973 (UNTEC) in France, Construction Management, founded in 1981 (CMr) in the USA, and the Quantity Surveying Association, founded in 1975 in Japan. However, in Korea, the quantity surveying field still lacks requirements or certification systems for quantity surveyors, and the work of quantity surveying and estimating is performed based on technicians employed by construction companies or design offices. In January 1996, around 120 estimating companies in Korea formed the “Cost Consultant Association of Korea”. However, unlike in other countries, organizational activities and government certification and support are still at a modest level. Therefore, more professional research and development are needed [3](p.9, 12~14).
This study aims to provide a model for efficiently conducting Value Engineering (VE) within a limited timeframe during the design VE process of public construction projects, encompassing various fields. It does so by proposing a method for prioritizing focal points using the Value Index (VI). To achieve this, data from 1,008 projects commissioned since 2016 were gathered from the Public Procurement Service Construction Cost Information Plaza website, and customer Worth was determined by integrating cost indices (occupancy rates by construction type) and customer value analysis through Value Engineering (VE) and cost examination. Then, the VI standard value is quantified by comparing it with the cost presented in the relevant VE Project, and construction types (functions) that exceed the standard value are selected as key targets. Ultimately, the goal is to provide a useful methodology for dealing with budget overrun situations that appear in recent architectural design projects and deriving customer value.
1.2. Scope and Method of Research
Construction projects are categorized into seven major fields: architecture, mechanical, electrical, communication, fire protection, civil engineering, and landscaping. Public construction projects select designers through architectural design competitions. Since there is currently no system in place for professionally overseeing the appropriateness of cost distribution among each field and sub-field of construction, occurrences of exceeding the construction budget are frequent. During the Value Engineering (VE) review phase, particularly in the VE preparation stage, a model for selecting targets that exceed necessary functions will be developed. This model aims to identify construction types exceeding necessary functions and validate their effectiveness. The following research scope and methods are established for this purpose.
To calculate appropriate construction budgets in the early stages of construction projects and support efficient cost management at each stage of construction, the Public Procurement Service (Construction Cost Information Plaza, g2b.go.kr) website was utilized based on big data on December 28, 2018. The website has been providing data for 15 building types and a total of 1,008 projects from January 2016 to the present. However, the website only provides a search function without offering the original data. Therefore, we organized data from 619 projects of the 13 most commonly used types into a database. Among these, we selected 237 public buildings with the highest number of records as the subjects for analysis. We designated public buildings for which construction cost estimation has been completed as the scope of research for design VE.
The research method, as depicted in Figure 1, involves selecting the floor area and number of floors derived through regression analysis as input variables from the surveyed data, which have a significant impact on construction costs. And then, (1) Detailed construction cost worth analysis based on the construction cost database, (2) Development of customer demand worth survey items, (3) Customer demand worth weight survey, (4) Final worth confirmed for each detailed work type, (5) Calculation of Value Index(VI), (6) Calculate VI standard value using standard error. We present a standardized model that focuses on selecting detailed construction types exceeding the Value Index (VI) standard values derived through the following procedure, allowing for concentrated idea generation.
1.3. Analysis of Prior Research
Reviewing domestic and international research trends related to the selection of VE targets, it is observed that in current VE activities, target selection entails narrowing down the scope of VE activities by selecting the portion of projects designated by the client with the greatest potential for value enhancement, due to the limited resources and time of the VE team. However, there are limitations to using traditional cost modeling techniques for VE target selection. To overcome this, many researchers have proposed methods for VE target selection through surveys, cost modeling methods, and Worth derivation methods.
Firstly, examining previous studies utilizing surveys, the main drawback is that they tend to prioritize cost-centric approaches. Therefore, rather than relying on biased methods that focus solely on high-cost areas, such studies have proposed improvements based on directions like "customer value orientation," "overcoming functional cost (F) limits," and "utilizing the experience and subjective judgment of VE team members while pursuing consensus." In light of this, they have suggested the use of "cost-performance evaluation techniques" and the "inconsistent method" as a cost modeling technique for functional evaluation. And studies such as“ Improved the target selection method by quantifying the items requested by owners, users, and experts in the apartment design VE stage”, “Develop a quantitative and objective form element program by conducting functional definitions for each room of a building for users and experts, collecting extracted data, verifying and finding redundant elements”, “Presenting a process model that improves the connection between functional analysis and idea creation by applying the Chimera Idea Creation Concept, a thinking technique created by comparing construction projects to the virtual animal Chimera.”, “Measures to improve the design VE process by setting quality models for each project type”, “Proposal of construction VE suitable for Chinese construction environment through VE system survey”, “Developing a design verification model based on Quality Function Deployment (QFD) by architectural project participants through management and collaboration of owner requirements”, “Propose an efficient VE process model by investigating and evaluating the impact of smart technology on the VE process”, and“ Development of a design VE decision-making model for the precon stage of a construction-responsible CM project” also been conducted [4](p.4), [5](p.2), [6](p.514~527), [7](p.45~48), [8](p.24~25), [9](p.39~40), [10](p.54~56), [11](p.2), [12](p.28~30), [13](p.66~68).
In previous studies related to cost modeling, based on domestic and international performance cases, issues were analyzed to highlight the problems with the summation method of cost modeling, where a fixed representative value is selected regardless of the type of facility or construction site conditions. It has been pointed out that when selecting targets based on a single criterion, there is a problem of not adequately reflecting complex factors such as customer demands, aesthetics, relevant regulations, technical feasibility, safety, etc., which the client, designer, and VE team subjectively judge. In the preparation stage, during the information gathering phase, it was noted that the client's intentions and the unique characteristics of the project were not clear, and due to a lack of experience and knowledge in target selection, they could not fulfill their role effectively in reality. Regarding this issue, it was proposed that there is a lack of data in target selection based on cost models, and due to insufficient coherence, it is omitted from the VE Job Plan or simplified, leading to the problem of idea generation being prioritized over functional analysis in subsequent stages. Additionally, research has been conducted on various topics such as "developing a network approach to improve the accuracy of predicting Construction Cost Index (CCI) by converting time series into visual graphs and relying on future value prediction", "deriving factors affecting cost index changes by unit area construction costs of buildings according to usage, scale, construction type, and non-monetary factors to establish objective criteria and analyze changes in factors during VE target selection", "consistently comparing construction costs regardless of size using indices for most building types and scales", "building databases to ensure that VE targets are selected for any architectural project", and "presenting specific processes for selecting VE target construction types through case analysis" [14](p.25~31), [15](p.872~876), [16](p.239~252), [2](p.4).
Moreover, previous research on Worth derivation methods improved ideas repeatedly derived from 11 highway construction cases and determined construction costs by trade as Worth. Furthermore, a method was proposed to select construction types with a Value Index (VI) of 1.2 or higher based on statistical experience as design VE targets [17](p.37~41).
Recognizing the importance of Value Engineering (VE) as a means of creating value for cost savings and performance enhancement, efforts were made to address the issues in VE target selection. To achieve this, the problems associated with the previous method, which only covered high-cost areas, were resolved by selecting secondary VE targets based on the primary VE targets selected by existing high-cost area selection techniques and by reapplying Fish-Bone diagrams and the Worth technique. Additionally, to validate the effectiveness of the proposed improvements, they were applied to real road construction VE project cases and evaluated through expert interviews, which found that the proposed improvements were considerably effective compared to traditional VE target selection methods [18](p.Ⅴ).
Previous studies have mainly been limited to surveys, cost analysis, and partial introduction of Worth in the road construction field, with a lack of objective data for analysis. As a result, it has been difficult to find proper research on specific methods for deriving Worth values and utilizing Cost to Worth for the Value Index (VI).
This study differs significantly from previous research as it addresses methods for deriving Worth values and target selection based on them, which have not been covered in existing studies.
2. Theoretical Considerations of a Selection of VE Targets
VE target selection is the stage where the VE team identifies targets for review to enhance the value of the project. Above all, there is a lack of theoretical basis for criteria and scope approaches in target selection during the VE preparation phase. Without sufficient theoretical basis, VE target selection becomes arbitrary, and validating the most effective VE target selection becomes challenging. When target selection is not adequately conducted and the analysis phase begins, it tends to focus mainly on abstract functional analysis. Consequently, this leads to a lack of coherence with future idea generation. Currently, most domestic construction VE projects are facing such situations.
The targets for review can vary depending on the progress and situation of the project, ranging from analyzing materials and construction methods to selecting specific parts of the project, certain trades, or the entire project. Analysis techniques may include selecting and applying high-cost field selection techniques, Cost-to-worth techniques, cost-performance evaluation techniques, complex evaluation techniques, weighted composite evaluation techniques, etc., depending on the nature of the project and the target, sometimes in parallel as needed. The types and characteristics of target selection methods can be found in Table 1 of the Basic Course Material for Construction VE Specialists provided by the Korea Institute of Value Engineering (KVEI).
3. Research Methods
The methodology of this study involves applying the widely utilized Cost to Worth technique for VE target selection. To determine the standard Worth value and Value Index (VI), the procedure follows the steps outlined in Figure 3.
Explaining the procedure of Figure 3, first, the leader selects the sample size based on the conditions of the VE process for the floor area and number of floors, which are important factors affecting the construction cost, derived through correlation analysis of the construction cost data in the Construction Cost Information Plaza website database. Since there are differences in the timing of construction for the target samples, the average value of the construction cost share by detailed construction type, which is not affected by the construction cost index, is calculated as the detailed construction type cost worth (WorthC). After conducting a customer value survey to identify special functional requirements from the client based on the building's use, weights are assigned to determine the customer value worth by detailed construction type WorthV. The final worth (WorthF)is calculated by multiplying the previously derived detailed construction type cost worth (WorthC)and customer value worth (WorthV).
The value index (VI) for each detailed construction type is calculated by dividing the detailed construction type cost share of the VE project by the derived detailed construction type WorthF, and the standard error of the target sample is selected as the VI baseline value. The procedure then identifies the detailed construction types of the project that exceed the VI baseline value as priority focus areas for idea generation.
3.1. Data Analysis of Construction Cost Information Plaza Website
The 'Construction Cost Information Plaza website' is a portal site for analyzing and predicting construction costs, designed to predict construction costs and estimate appropriate construction budgets in the early stages of construction projects and to support efficient construction cost management at each stage of construction projects. Table 2 shows the descriptive statistical analysis results of a total of 619 cases by 13 used cases collected for analysis.
The average construction cost per unit area by usage was highest for sports facilities (2,281,404 won/㎡), followed by exhibition facilities (3,956,687 won/㎡) and training facilities (3,908,667 won/㎡), with warehouse facilities (1,897,827 won/㎡) being the lowest. The difference between the maximum and minimum floor area values ranged from 83% (sports facilities) to 95% (large offices), showing a relatively large range. The difference between the maximum and minimum construction costs per unit area ranged from 36% (medical facilities) to 77% (large offices), indicating a significant disparity.
The study collected construction cost data for 237 public office buildings, which are the focus of this research, using construction cost indices as of January 2024 to establish a unified baseline. Correlation analysis was conducted using factors such as floor area, site area, building footprint, floor area ratio, building coverage ratio, number of floors, and regional factors to analyze the factors influencing construction costs. Figure 4 depicts the trend graphs and regression equations for each factor in construction costs.
In the field of statistical analysis, correlation is used to measure the strength of the relationship between variables measured on an interval or ratio scale. The strength of the correlation is indicated by the correlation coefficient, which ranges from -1.0 to +1.0. A value close to 0.0 indicates a weak relationship, while values close to -1.0 or +1.0 indicate a strong relationship. In regression or any statistical analysis, when discussing correlation, if the correlation coefficient is above 0.6, it is considered to have a high correlation. As shown in Table 3, the results of the regression analysis on the seven important factors influencing construction costs in public buildings in Korea indicate a very high correlation coefficient of 0.97 for the floor area factor, and a relatively high correlation coefficient of 0.65 for the total number of floors. Factors such as land area, floor area, building coverage ratio, floor area ratio, and regional factors show relatively low correlation coefficients. Therefore, in this study, only two factors, floor area and total number of floors, are used as factors related to the trend of construction costs.
3.2. Estimating Cost WorthC
The term "Worth" used in the Cost to Worth technique for VE target selection refers to the value expressed in terms of worth, defined as the least cost incurred for performing the same function. According to SAVE International, Worth is determined through methods such as record databases, data benchmarking, VE team member decisions, cost estimator experience, and the lowest cost available. However, if Worth is determined solely based on simple costs, it may overlook the requirements of the main functions of the client for building purposes. Therefore, in this study, Worth is applied in three distinct stages.
- WorthC : Cost by Detailed Construction Item Worth (Cost)
- WorthV : Customer Value by Detailed Construction Item Worth (Value)
- WorthF : Worth by Detailed Construction Item (Final) = WorthC × WorthV Weight
The calculation of Cost worth (WorthC) applies the occupancy rates of detailed sub-trades without price fluctuations due to the timing of construction for the 237 public buildings (163 regular buildings and 74 large buildings). Based on the similarity between the total floor area and the total number of floors according to the VE conditions of the respective project buildings, the VE leader selects the number of samples. Table 4 below provides an example of the calculation of WorthC applied to the average occupancy rates of 83 detailed sub-trades across seven major construction categories: architecture, machinery, electricity, communication, fire protection, civil engineering, and landscaping.
3.3. Calculating the Customer Value WorthV
Customer Value (WorthV) is crucial data that reflects the specific requirements of the client (customer) for each building. Relying solely on cost considerations to determine Worth can lead to overlooking the primary functional requirements of the client for each building type. Therefore, there is a need to identify the customer value requirements for each detailed item (function) of the project through surveys and apply them as weights.
Customer value surveys are conducted using a Likert 5-point scale. When the Likert scale was first proposed, it consisted of 5 response categories (Likert, 1932). However, since there were no clear principles on the number of categories, researchers have used various scales up to 9 levels depending on the amount of information desired. When collecting data using the Likert scale, various response categories can be used depending on the items, but typically, the 5-point scale proposed by Likert, such as 'Strongly Disagree', 'Disagree', 'Neutral', 'Agree', and 'Strongly Agree', is used. Previous studies have shown conflicting views on whether the Likert scale is continuous or categorical data. The perspective that considers the Likert scale as continuous data views it as an interval scale where the intervals between response categories are equal. [19](p.1,10,104).
In this study, when a sample survey was conducted in advance, proper answers were not given to the two questions ‘strongly disagree’ and ‘disagree’ due to concerns that the functions may fall short of the required functions. In order to supplement this, it was classified into “very important function,” “important function,” “normal function,” “basic function,” and “minimum function,” and the weight of each item for detailed work types presented by the Public Procurement Service was scored on an equal interval scale of 0.4 to 1.6. was assigned and calculated based on the customer value (WorthV) value for each work type.
The survey method aims to achieve optimal results within the allocated budget range. For this purpose, weights will be assigned to each detailed construction work item of the project, ranging relatively evenly from "Very Important Function" (1.6) to "Important Function" (1.3), "Average Function" (1.0), "Basic Function" (0.7), and "Minimum Function" (0.4). Table 5 below provides an example of survey questionnaire items in the construction field.
3.4. Derive the Final WorthF
The final worth (WorthF) can be obtained as equation (2)
Weight
In the “Cost to Worth” method, Worth is defined as the minimum cost required to perform the same function. To calculate this Worth, one primary function representing each cost item is needed. In Value Engineering (VE), each cost item is typically composed of one or multiple functions. Generally, value is determined not by the producers or constructors but by the demands of the customers. However, in most cases, understanding the customer's demands relies on the experiences of the VE team members and presentations from clients and designers. Especially in the VE target selection process, efforts to estimate high-cost areas may lead to the oversight of a genuine VE target selection process based on joint efforts and agreements among clients, designers, and VE teams to reflect customer demands alongside recognizing project-related issues (Yun, 2001). To address these issues, objective data included in the Construction Cost Information Plaza of the Public Procurement Service is utilized to select target samples, and the final worth (WorthF) is derived by multiplying the average cost WorthC of the samples by the weight of customer value (WorthV). The table below provides an example of the final derived (WorthF) in the construction sector.
3.5. Value Index (VI) Calculation
The Value Index (VI) is calculated to assess the current state of value assurance for the project. The method for calculating the value index is determined by dividing the functional cost occupancy ratio of each detailed component of the project by the derived fundamental functional value (WorthF) of the project components, as shown in Eqn 3.
The determination of the value index is calculated using the formula as described above. In this equation, "Cost" refers to the construction cost occupancy ratio of each detailed component of the project, and "Worth" refers to the final worth (WorthF) calculated by multiplying the average occupancy ratio of the target samples by the weighted customer value derived from the survey. Table 7 provides an example of the final value index (VI) derived in the architectural field.
3.6. Derivation of Value Index (VI) Standard Value
If VI exceeds 1, it means that more costs are allocated compared to the worth, indicating poor cost efficiency. In VE target selection using the “Cost to Worth” method, selecting targets with VI values exceeding 1 is crucial. However, setting the VI threshold value above 1 without consideration may result in too many targets being selected, which may not contribute to efficient VE implementation.
To address this, in this study, the VI threshold value was determined by adding the result of the standard error, which varies according to the sample size, to a VI value of 1.
The standard error of the mean (SEM) refers to the standard deviation of the sample mean distribution. The standard error is calculated by dividing the standard deviation by the square root of the number of observations. The standard deviation is one of the measures of variability used to determine the spread of data, and the standard error of the mean (SEM) is the value that occurs during the estimation process of the population through sampling. The calculation method is shown in Equation 4.
3.7. Selection of Key Target Construction Types (Functions)
The value of 1, which is the optimal value standard for VI, plus the standard error derived from 3.6 is adopted as the final VI standard value, and construction types exceeding this are selected as construction types (functions) targeted for key reduction and priority ideas are created. By utilizing this study, even those who are not cost analysis experts can easily select priority targets, which will help to perform more efficient VE within limited time. Table 8 below is an example summarizing the analysis of the standard error according to the number of samples in the population based on the similarity in floor area and number of floors when selecting a government office building with a basement floor and four above-ground floors and total floor area of 6,993 square meters as the project.
As shown in Figure 5, as the sample size of the target population increases, it approaches a normal distribution, and the standard error decreases, resulting in a decrease in the VI criterion value as well.
With the criterion value decreasing, the number of selected priority target construction work increases significantly, and even the construction work with very low deviation from the criterion value become VE targets. As a result, the time required for VE increases, and the cost-saving effect becomes minimal. Therefore, it is reasonable to use the standard error of samples with high similarity
4. Model Validation
Following the methodology presented in Figure 3, this study conducted a series of analytical procedures with the aim of validating the model for selecting priority target public construction projects. To ensure a systematic approach to the research, empirical analysis was conducted using past performance data of VE in public office buildings.
4.1. Selection of the Respective Project
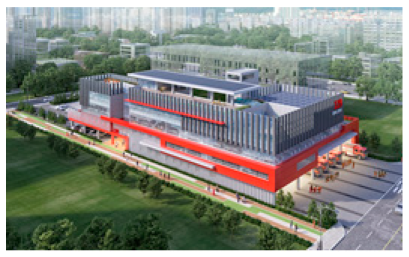
The project in question is a VE (Value Engineering) project conducted by the Design Economy Feasibility Review Committee of Daegu City in November 2020.
Nine experts from various fields participated, and a high-cost area selection technique utilizing the expertise of cost professionals was adopted as the selection method. As a result, a total of 99 ideas were generated, leading to savings of approximately 1.8 billion KRW (10.28%) out of the total construction cost of 17.5 billion KRW.
4.2. Calculate the Cost of the Target Sample WorthC
The selection factors for the population target sample were based only on the total floor area and the total floor number similarity rate with the highest correlation coefficient according to the results in Table 3. In other words, a project with a high similarity rate in total floor area and number of floors must be selected to reduce the cost disparity rate by detailed construction type. The number of sample populations is two Jeongseon Police Station and Changwon Marine Police Station, which have a similarity rate of 100% for the project and the total number of floors (1 basement level and 4th floor above ground), a total floor area similarity rate of 99%, and a population average construction cost similarity rate of 91%. The population was selected as a target sample.
4.3. Calculation of Customer Value WorthV and Final WorthF
The calculation of Customer Value (WorthV) for the target samples involved utilizing survey responses obtained from the client representatives as weighted data for Customer Value (WorthV). The calculated Customer Value (WorthV) values are summarized in Table 10.
The Final Worth (WorthF) was derived by multiplying the Cost Worth (WorthC) and the Customer Value (WorthV) weights. Table 10 presents the analyzed data for the Final Worth (WorthF) in the architectural field.
4.4. Derivation of Value Index (VI) and Standard Value
The standard error result of the average of the detailed construction work ratio in the target samples, consisting of Jeongseon Police Station and Changwon Maritime Police Station, is derived as 0.1540, as shown in Figure 8. Adding the basic value of 1 to this, the criterion value of the Value Index (VI) was finally calculated as 1.154. Additionally, the value index for this project was determined and depicted on the right side of Figure 6.
4.5. Selection and Analysis of Key Target Categories (Functions)
The selection of key target categories included 25 categories out of a total of 83, which exceeded the VI threshold value of 1.154, and were identified as cost-saving focus areas.
To validate the effectiveness of this study, we compared and analyzed the number of cost-saving ideas generated in previous iterations of the same project. As shown in Table 11, the results of idea generation for cost-saving focus areas by category revealed that in the previous scenario, a total of 68 ideas were generated across 42 specific categories, resulting in a cost reduction of KRW 1.82 billion.
In contrast, the results of this study yielded 51 ideas generated across 22 specific categories out of the 25 categories that exceeded the VI index of 1.154. This led to a cost reduction of KRW 1.58 billion.
In terms of selecting cost-saving priority focus categories, despite adopting high-cost area selection techniques as the target selection method due to the majority of VE team members having rich practical experience in cost-related matters when implementing the project when compared to the methodology proposed in this study. As shown in Table 12, the priority focus categories exhibit an 88% concordance rate.
While this study's model does not provide an absolute criterion for the selection of key targets, it is deemed that, in conducting design VE, even without the inclusion of cost experts, the model can offer information for selecting quantified priority categories based on consistent criteria through existing data analysis. Thus, it is expected that design VE can be conducted more efficiently within the given timeframe.
5. Conclusions
This study aims to propose a model for prioritizing (key) targets in Value Engineering (VE) in public construction projects encompassing various fields, utilizing the Value Index (VI). The goal is to provide a model that enables more efficient VE within a limited timeframe.
To achieve this, the study selected 83 detailed construction work items collected from the procurement agency's database as Worth values and classified them based on two factors: total floor area and total number of floors. Depending on the VE conditions, samples were selected that were similar to the target project in terms of total floor area and total number of floors. The average values of the detailed construction work items for the target samples were designated as Cost Worthc, and the survey results from the client were converted into Customer Value (Worthv) weights. These two values were multiplied to derive the final worth (WorthF). Using the Cost to Worth technique, the study calculated the VI (Cost ÷ WorthF) for each detailed construction work item based on its Cost and the final derived (WorthF). By utilizing the standard error of the sample target population, a VI standard value was established. Detailed construction work items exceeding this standard value were selected as focal points, enabling the generation of cost-saving ideas through a standardized model.
To analyze the empirical evidence of this study, past public buildings were used for validation. The validation results showed an 88% match rate for the number of focal target construction work items. By utilizing the Worth calculation and focal target selection methodology proposed in this study, the following benefits are expected: (1) Worth values can be calculated more reasonably than before, (2) Effective selection of priority targets among detailed construction work types is possible,(3) Even those who are not cost experts can achieve results equal to or better than those of cost experts, and (4) VE can be conducted more efficiently within limited time.
The VE Worth calculation and key target selection method proposed in this study for public architectural construction projects serve as the basis. In the future, expanding the scope to include more data inputs and the construction of big data, along with AI algorithms for the entire process, such as customer value perception surveys, trend-based automatic generation, automation of target selection for focal areas, and proposing VE solutions, will ultimately require research on the automation of VE target selection methods using Value Index (VI).
Acknowledgments
This work was supported by the National Research Foundation of Korea (NRF) grant funded by the Korea Government (MSIT) (NRF-2021R1A2C1014267).
References
- Author 1, Yoon, So-Hyun. “A Study on the Improvement for Cost Modelling Techniques in the Construction VE”. MSc Thesis, University of Seoul, Seoul, South Korea 2001; pp. i–iii.
- Author 1, Heo, Won-Young. “The Methodology of Decision Making for VE Components by Cost Index of Building Work”. Doctoral Thesis, Hoseo University, Asan-si, Chungcheongnam-do, South Korea 2022; pp. 3–11.
- Author 1, Lee, Hwa-Seok. “An Improvement of the Quantity Take-off Process for Reducing Errors During Detailed Design Development of Building Projects”. MSc Thesis, Chung-Ang University, Seoul, South Korea 2014, P9; pp. 12–14.
- Author 1, Lee, Do-Hyung. “An Efficient Owner’s Requirements Reflecting Process at the Planning Stage of the Building Project”. Doctoral Thesis, Chung-Ang University, Seoul, South Korea 2006; p. 4.
- Author 1, Jeong, Ho-Geun. “Improvement of the Design Phase VE Selection by the Analysis of the Required Items of Owners, Users and Experts in the Apartment”. MSc Thesis, Dong Eui University, Busan, South Korea 2008; p. 2.
- Author 1, Wei Tong Chen; Author 2, Po-Yi Chang. ; Author 3, Ying-Hua Huang. “Assessing the overall performance of value engineering workshops for construction projects”. International Journal of Project Management 2010, 28, 514–527. [Google Scholar]
- Author 1, Jae, Hyung-Su. “A Study on Method for Effective Function Definition of Construction Project Design Value Engineering”. MSc Thesis, Namseoul University, Cheonan-si, Chuncheongnam-do, South Korea 2010; pp. 45–48.
- Author 1, Jeong, Seong-Eun. “A Process Model for Design Value Engineering(VE) Using the Chimera Idea Creation Concept(CICC)”. MSc Thesis, Namseoul University, Cheonan-si, Chuncheongnam-do, South Korea 2012; pp. 24–25.
- Author 1, Kim, Min-Seung. “Improvement of Design VE Process Using the Quality Model by Construction Project Type”. MSc Thesis, Namseoul University, Cheonan-si, Chuncheongnam-do, South Korea 2010; pp. 39–40.
- Author 1, Qiao,Le. “A Comparative Study on Construction VE System in Korea and China”. MSc Thesis, Kyungpook National University, Daegu, South Korea 2016; pp. 54–56.
- Author 1, Bae,Yu-Jung. “Design Verification Model using Quality Function Deployment(QFD) by Participants in Architectural Projects”. MSc Thesis, Dankook University, Yongin-si, Gyeonggi-do, South Korea 2017; p. 2.
- Author 1,Park,Se-Mee. “A Proposal of Efficiency VE Process Model using Smart Technology”. MSc Thesis, Namseoul University, Cheonan-si, Chuncheongnam-do, South Korea 2021; pp. 28–30.
- Author 1, Park, Bo-Sung. “Design VE Decision Making Model at the Pre-construction Stage of the CM at Risk Project”. Doctoral Thesis, Chungbuk National University, Cheongju, South Korea 2023; pp. 66–68.
- Author 1, Kwon,Byung-Suk. “A Study on Improvement of Subjection Method for Value Engineering in Early Design Stage”. MSc Thesis, Dankook University, Yongin-si, Gyeonggi-do, South Korea 2001; pp. 25–31.
- Author 1, Yun Su-Won; Author 2, Kim Hong-Hyun; Author 3, Min Kyung-Seok. “Improvement for Subject Selection using SWOT Analysis in the Design Value Engineering”. Korean Society of Construction Management Annual Conference, 7 November 2008; pp. 872–876. [Google Scholar]
- Author 1, Rong Zhang; Author 2, Baabak Ashuri; Author 3, Yu Shyr; Author43, Yong Deng. “Forecasting Construction Cost Index based on visibility graph: A network approach". Physica A, 2018, 493, 239–252. [Google Scholar] [CrossRef]
- Author 1, Jung,Ji-Ahn. “VE Object Selection Method of Express Way by Value Index”. MSc Thesis, Pukyong National University, Busan, South Korea 2010; pp. 37–41.
- Author 1, Kim Jae-Hyun. “Advance of Method for An Object Selection in Construction Value Engineering”. MSc Thesis, Pukyong National University, Busan, South Korea 2011; p. V.
- Author 1, Kim Seon-Mi. “A Comparison of Structural Equation Model Estimation Methods According to the Attributes of Likert Scale Data”. MSc Thesis, Keimyung University, Daegu, South Korea 2011, 10; p. 104.
Figure 1.
Framework of Selection of VE targets.
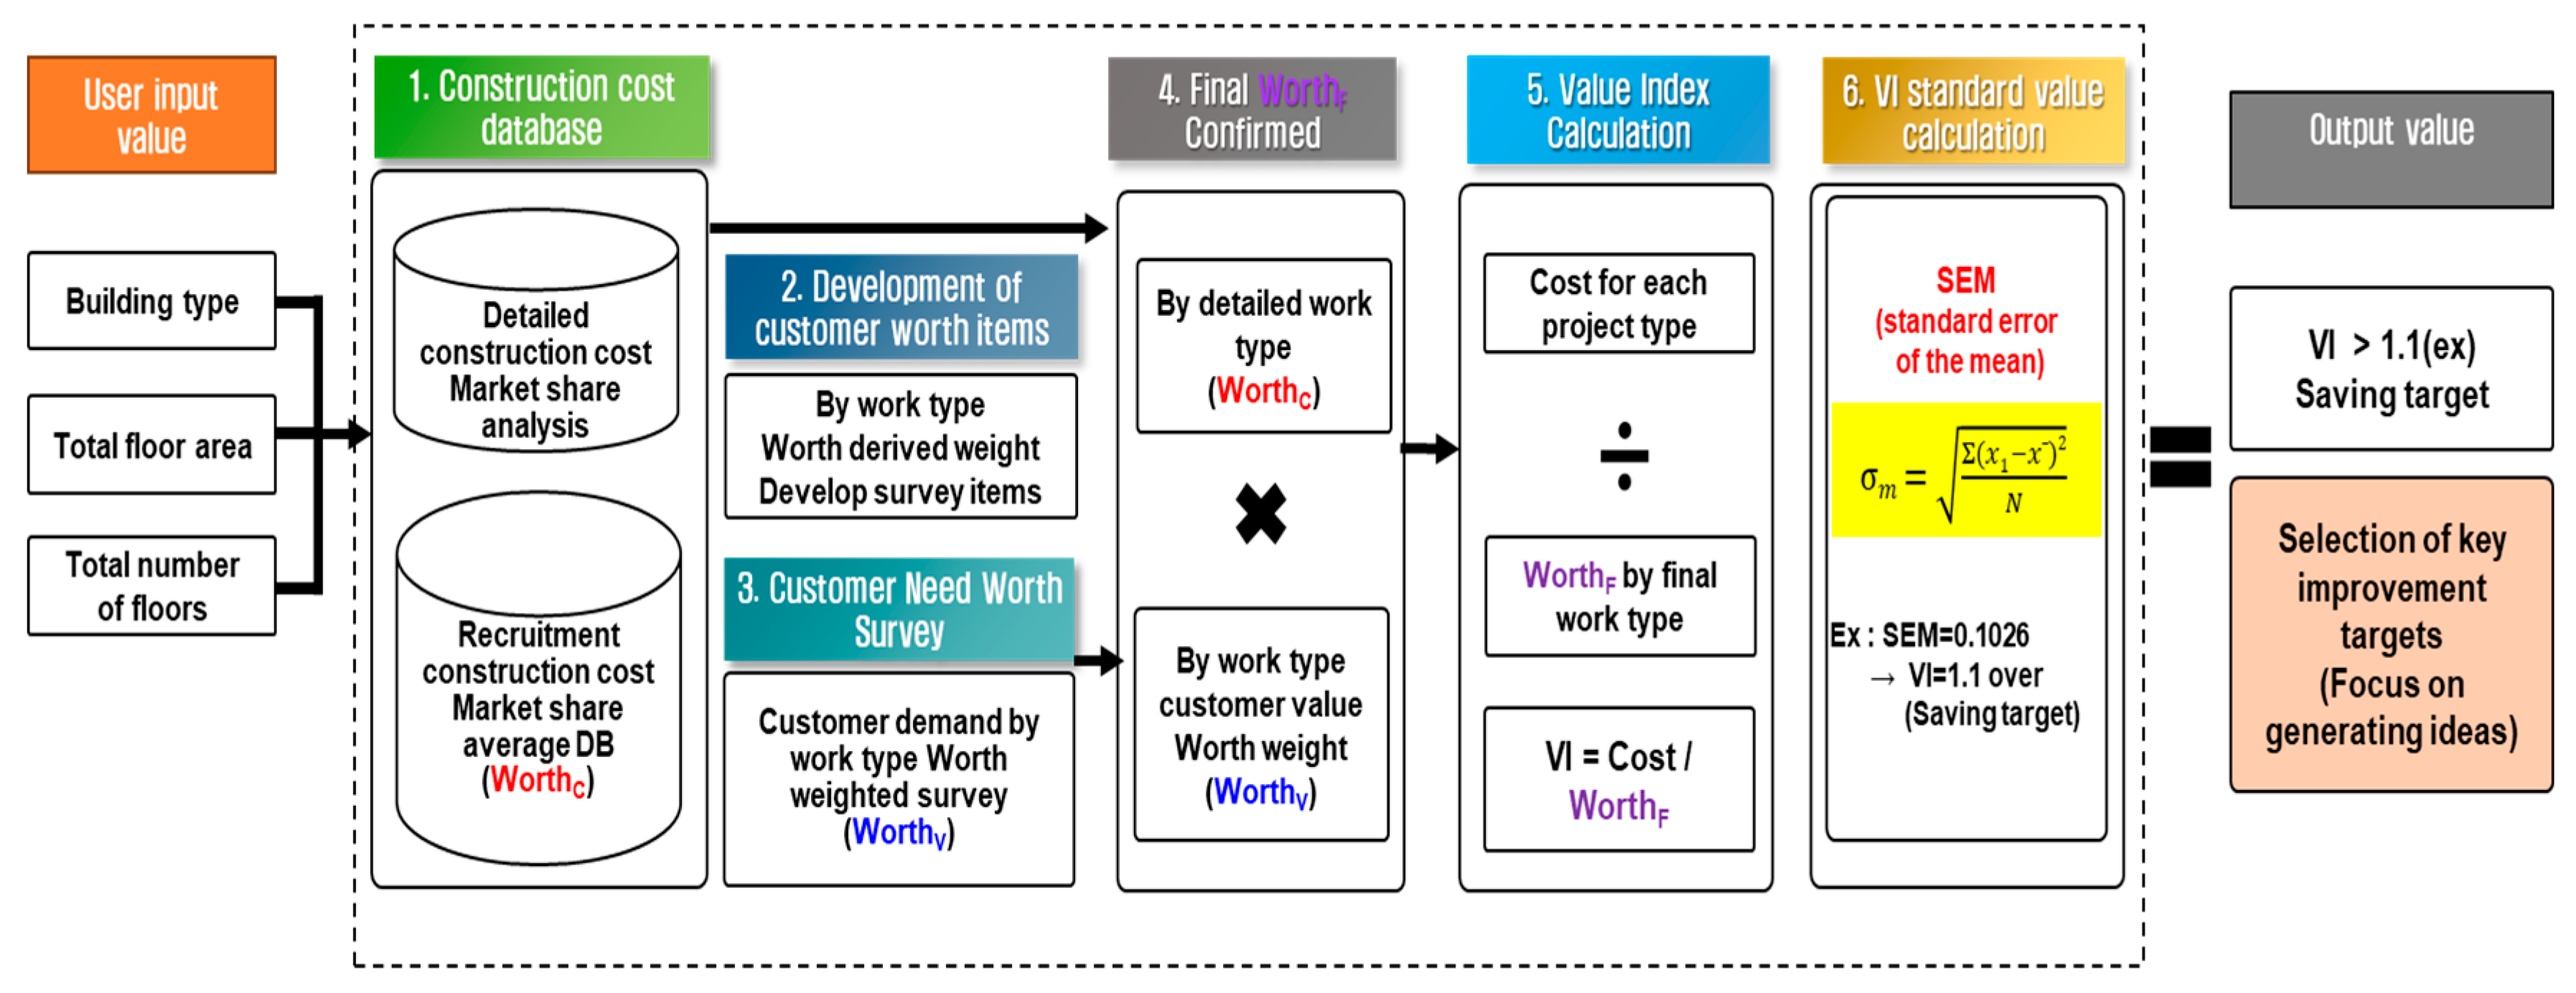
Figure 2.
Design VE Process.
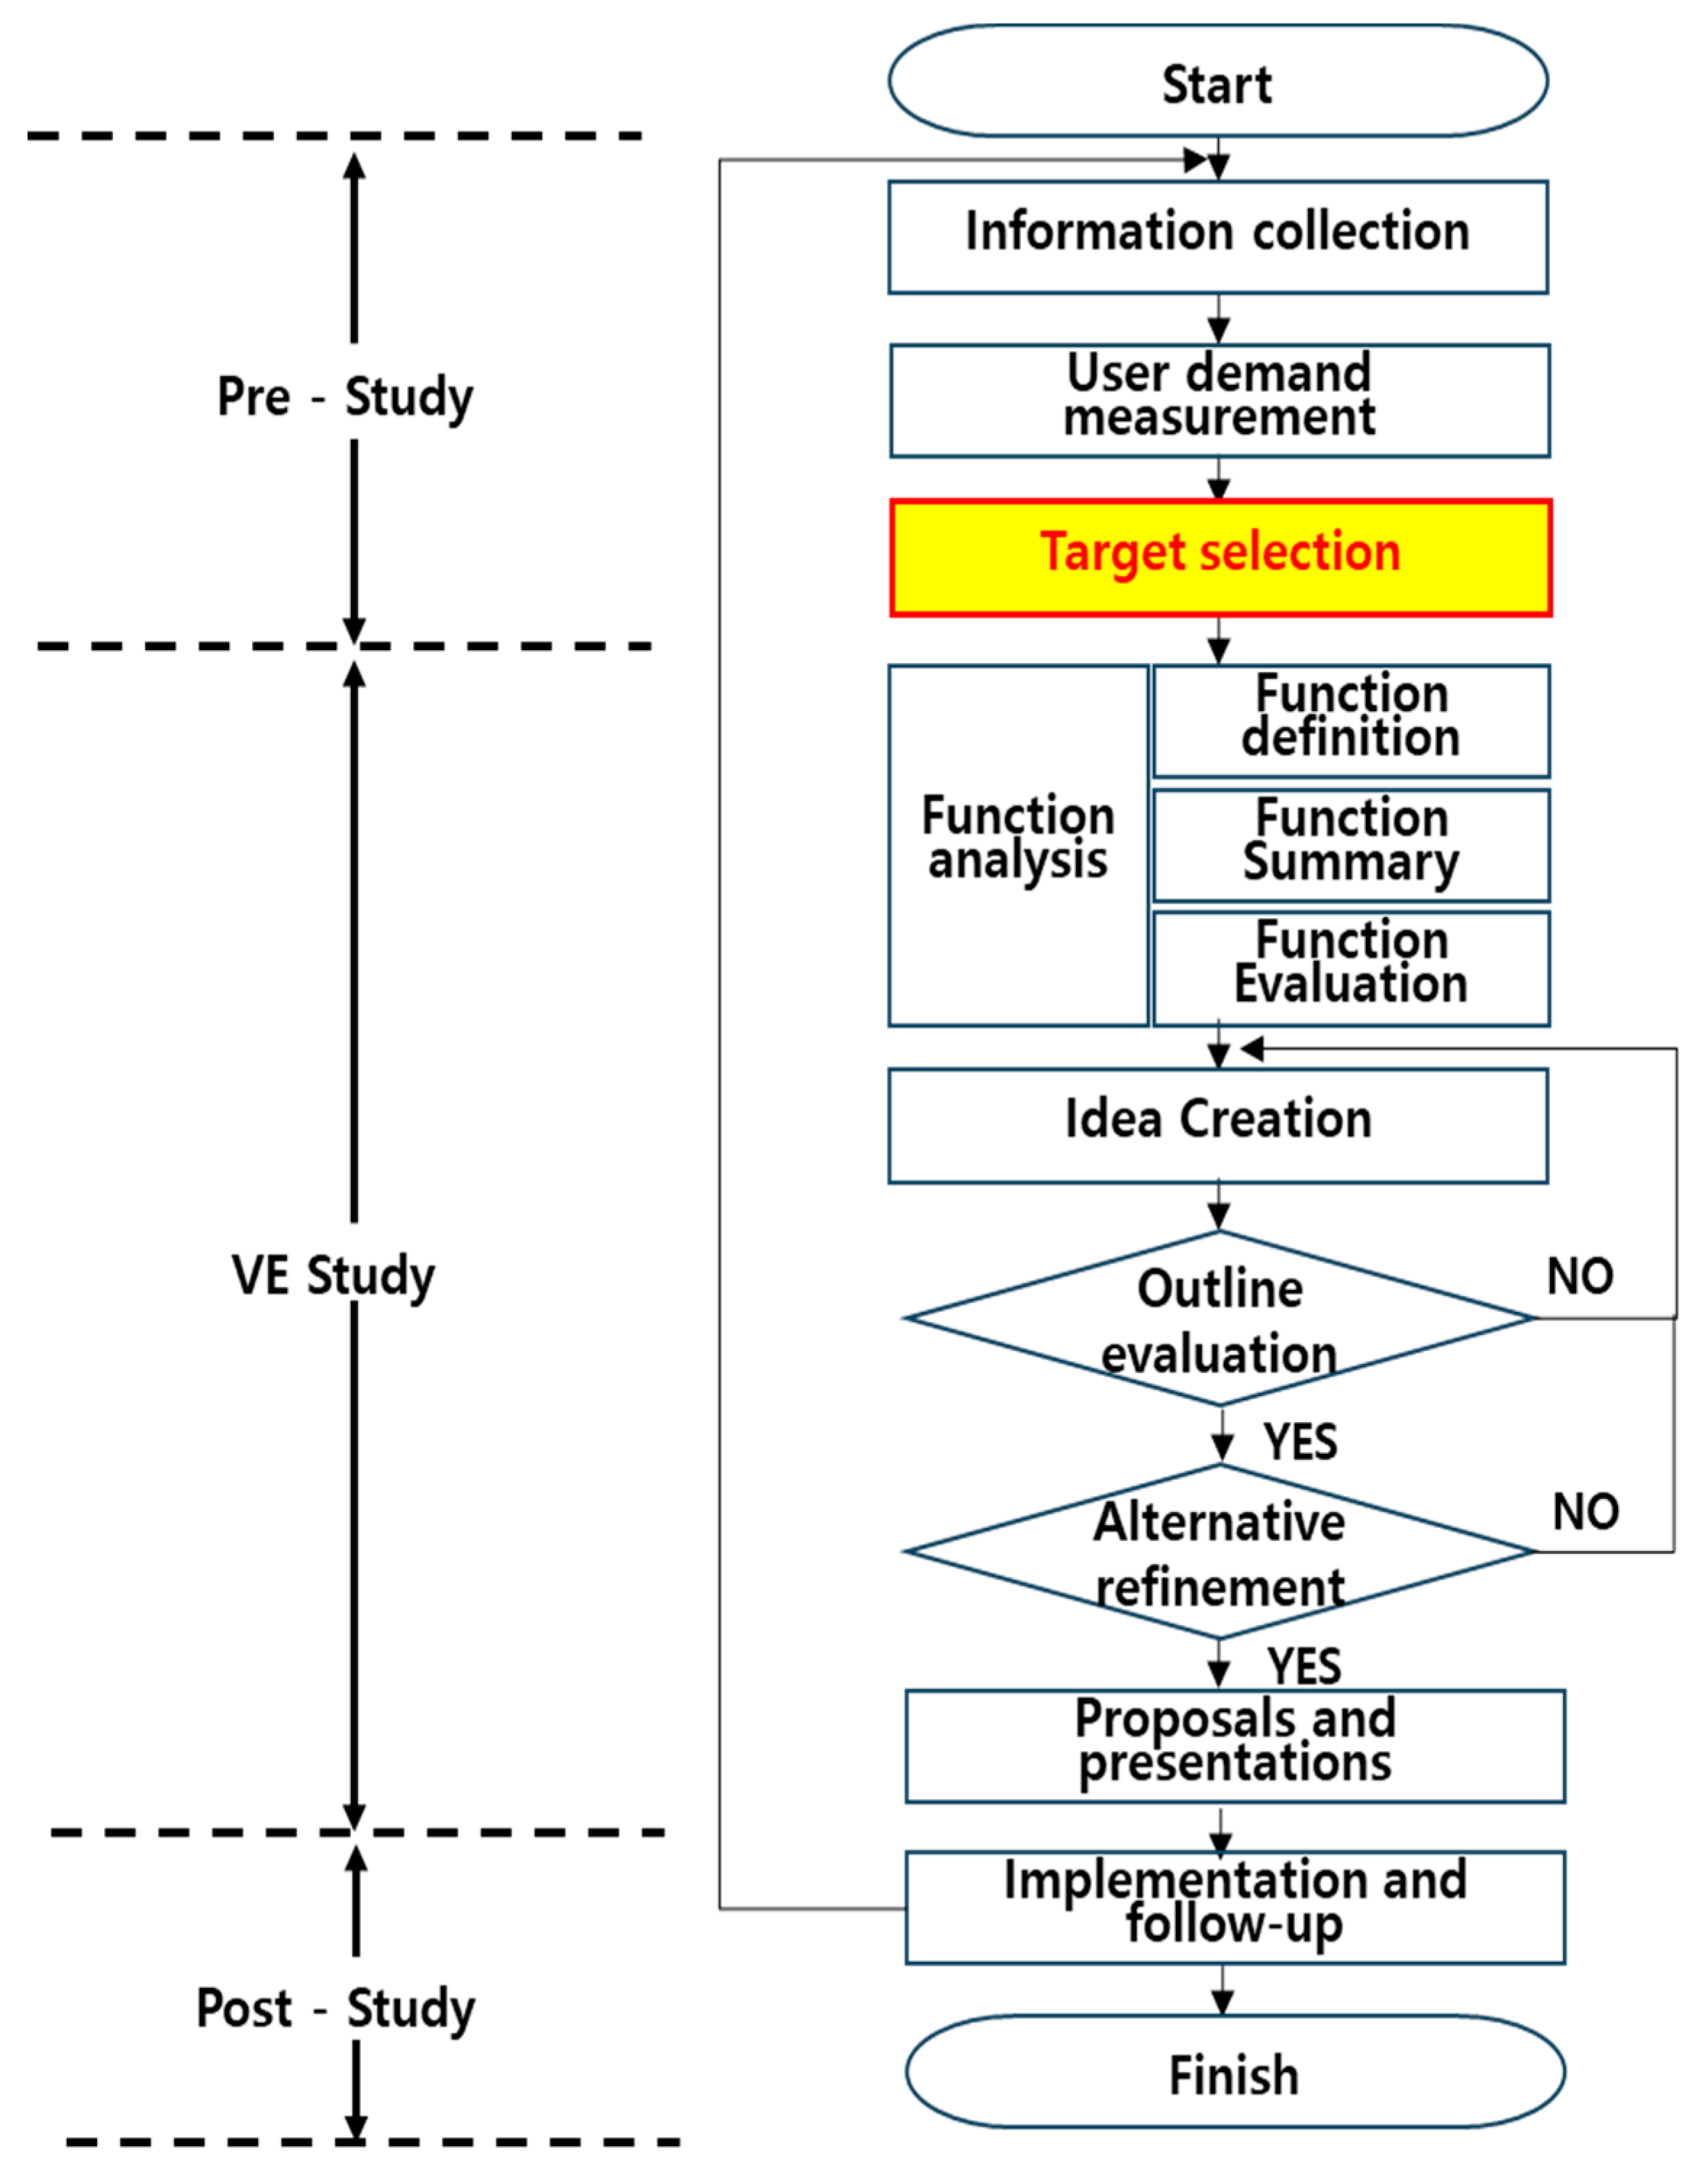
Figure 3.
Flow Chart.
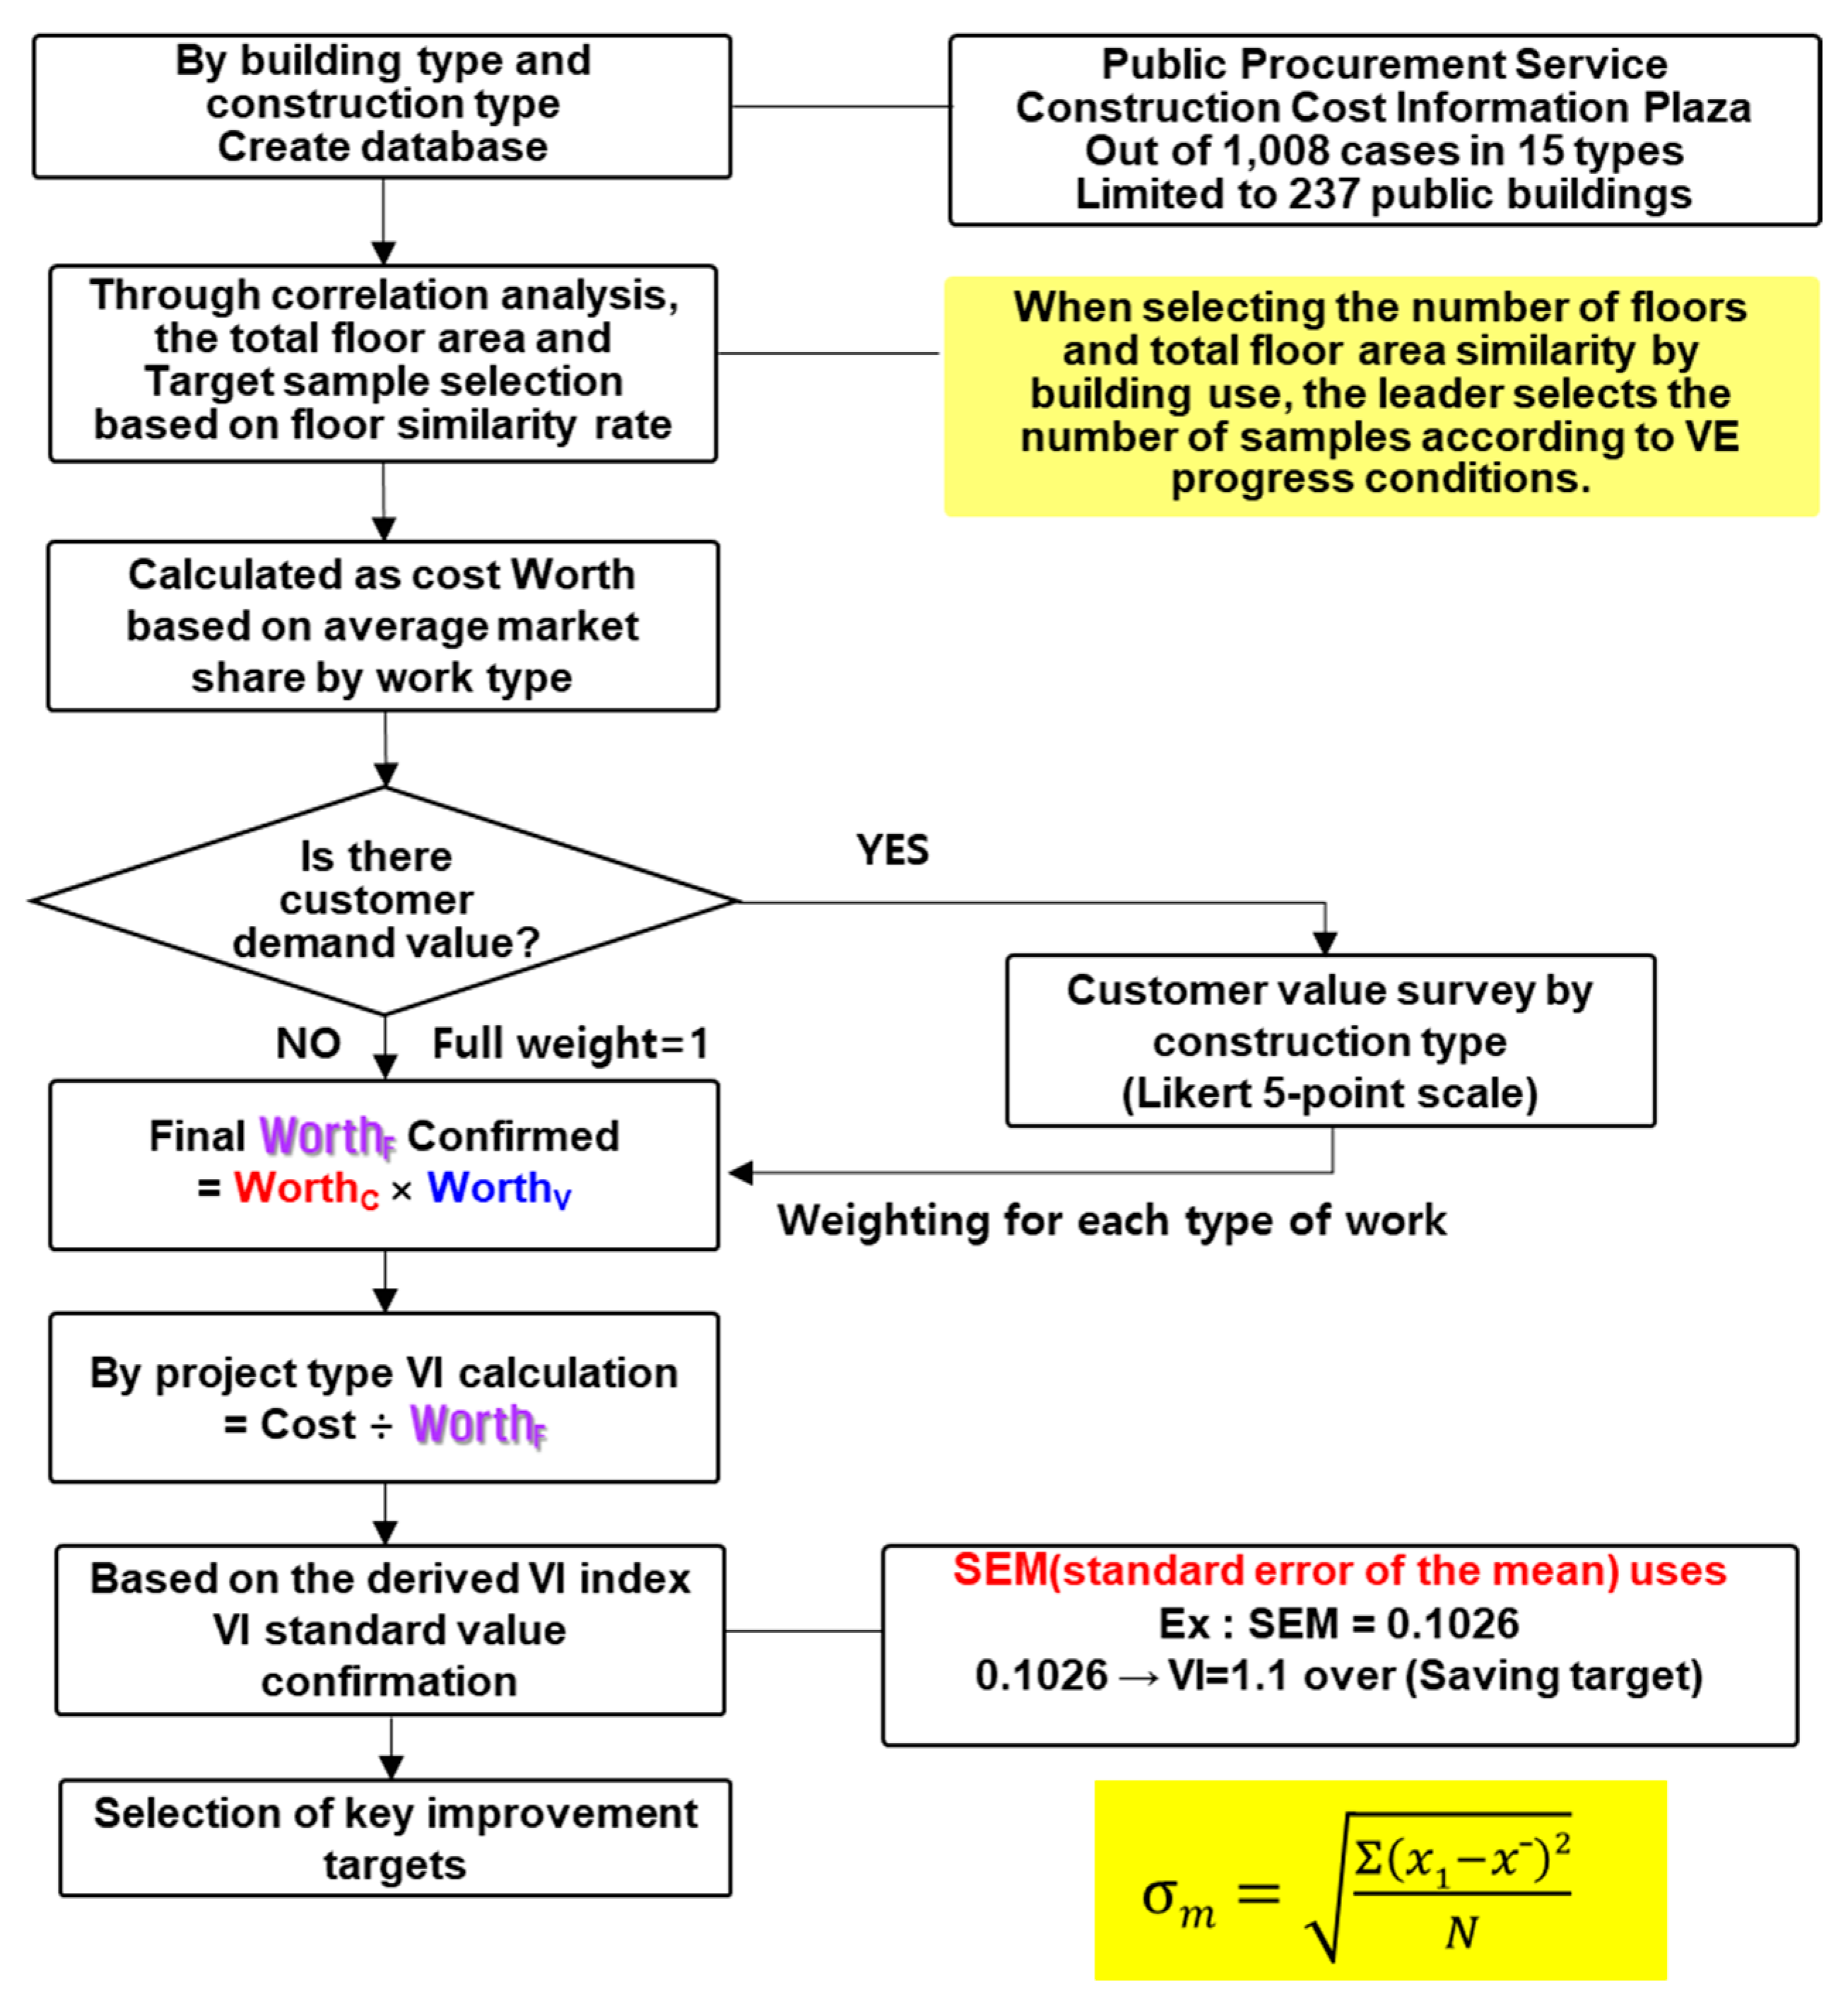
Figure 4.
Trend graphs of construction costs by factor
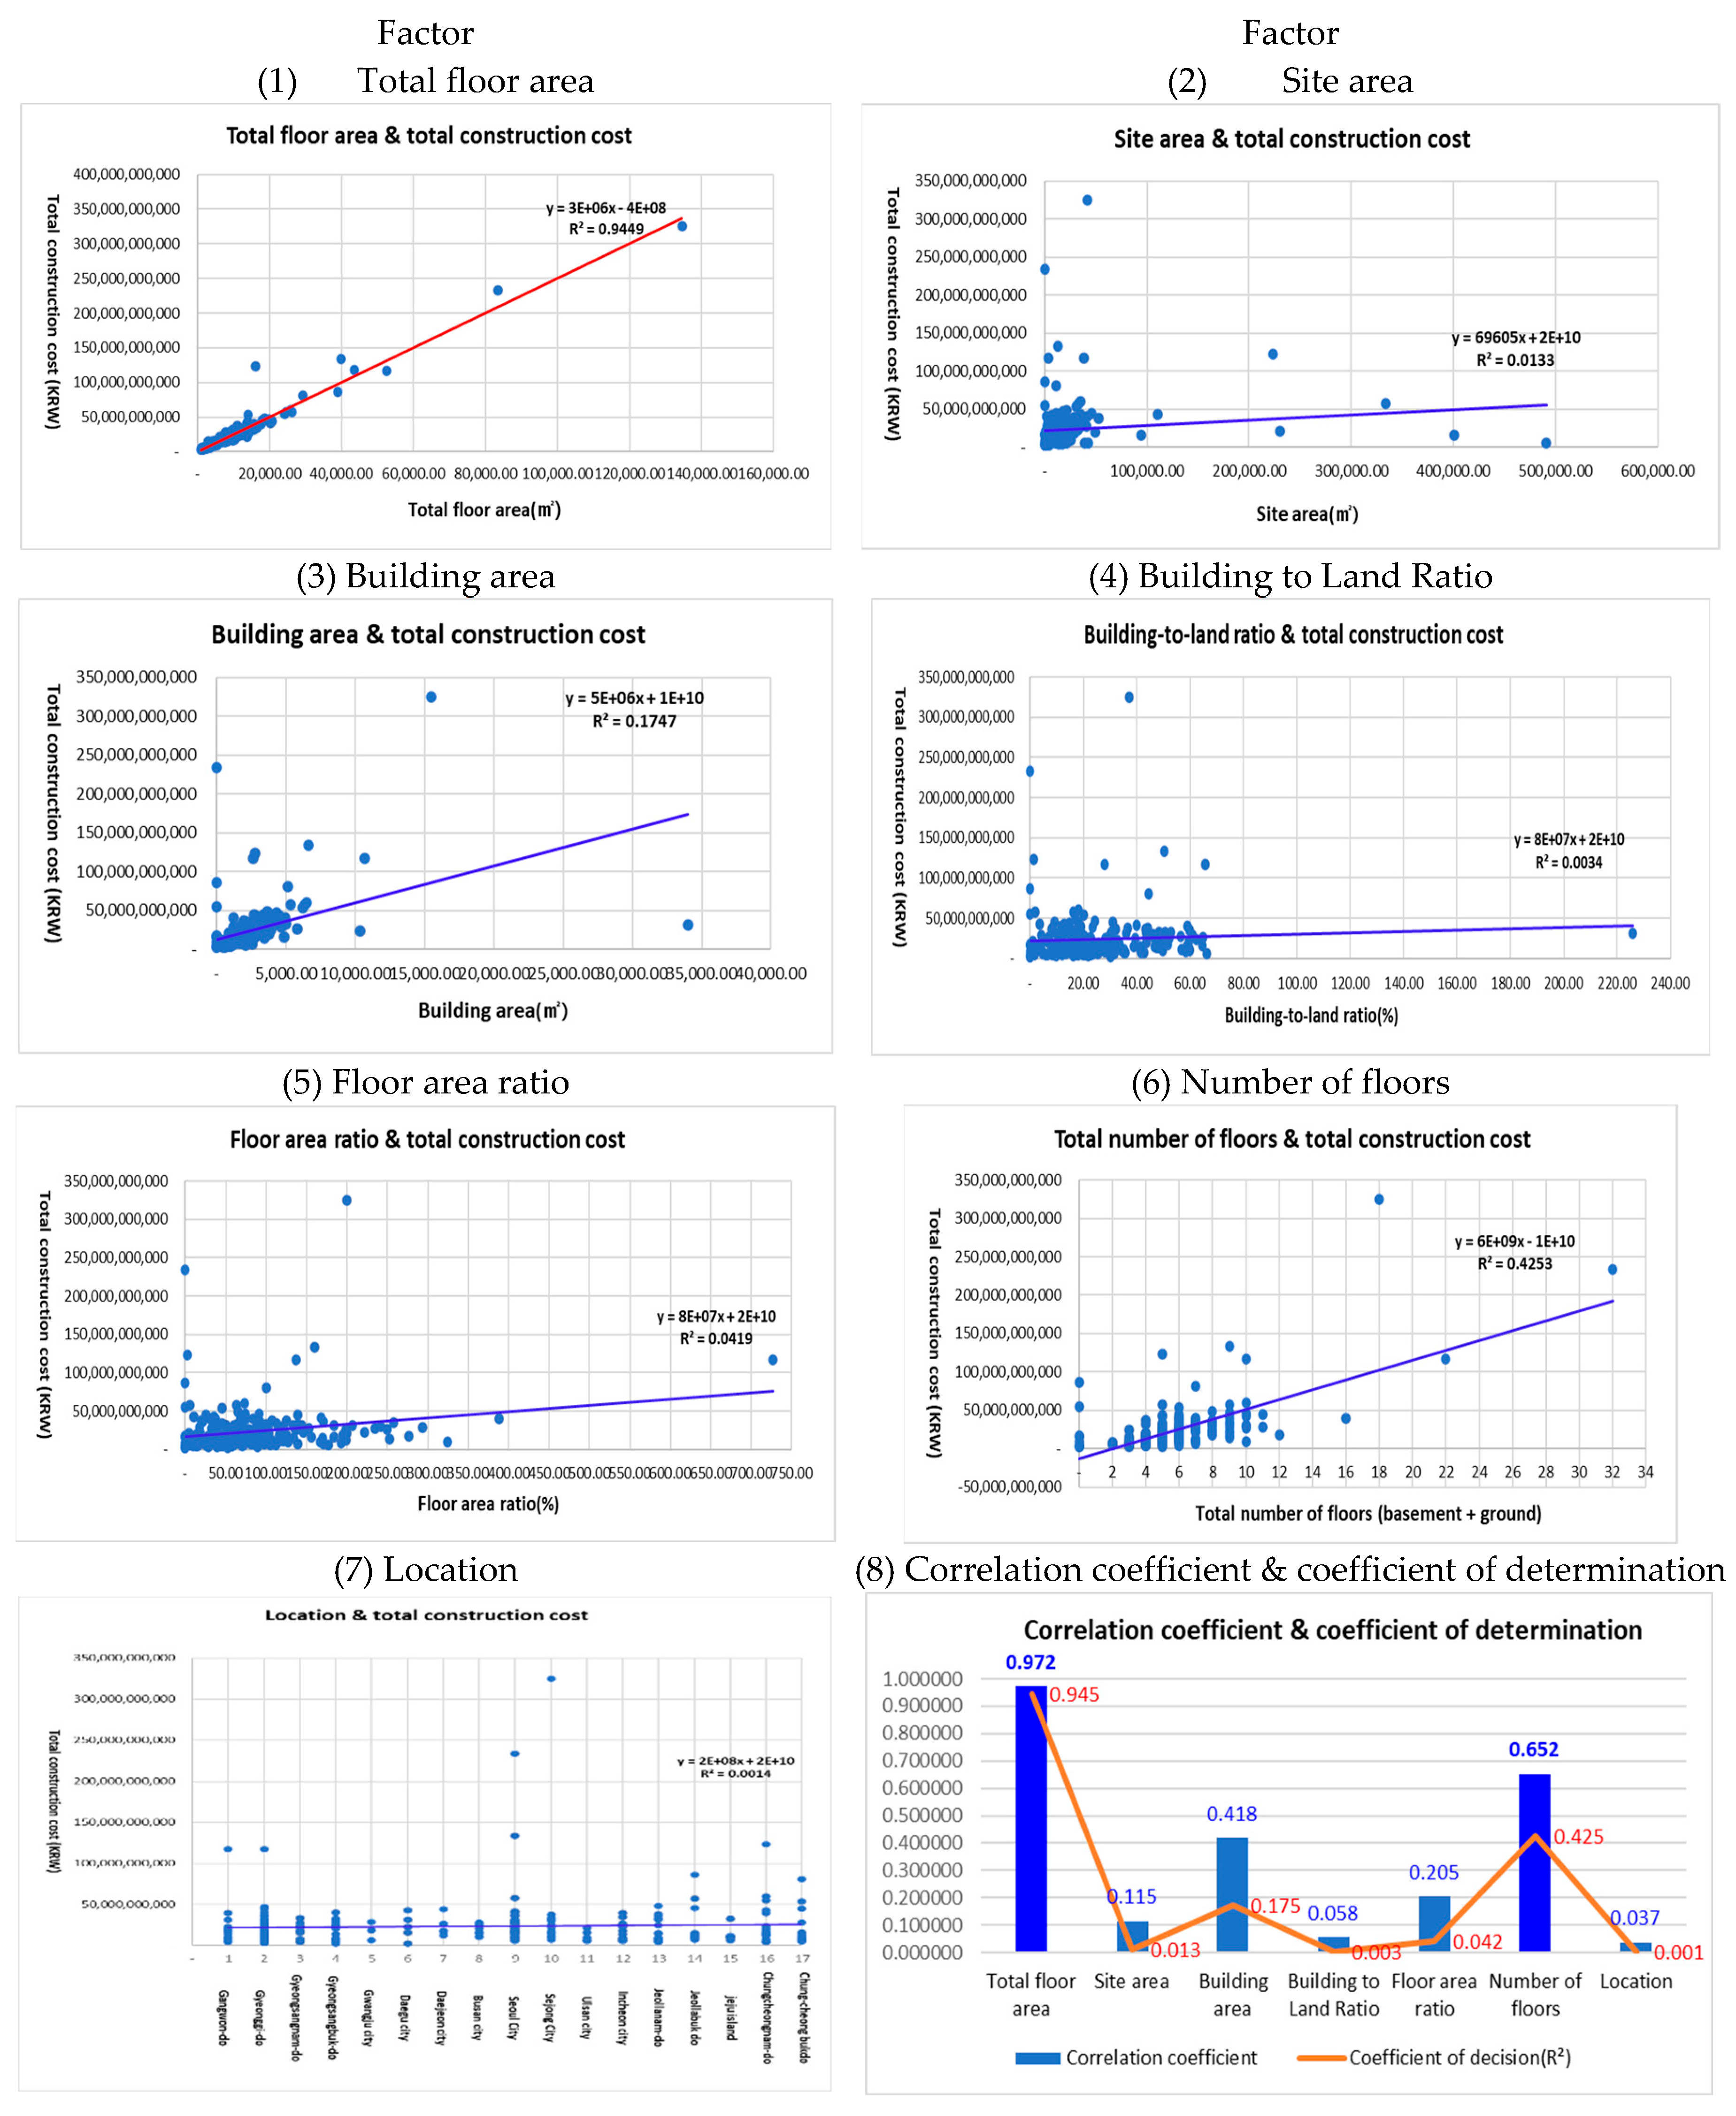
Figure 5.
Graph of Standard Error and VI Criterion Value Changes.
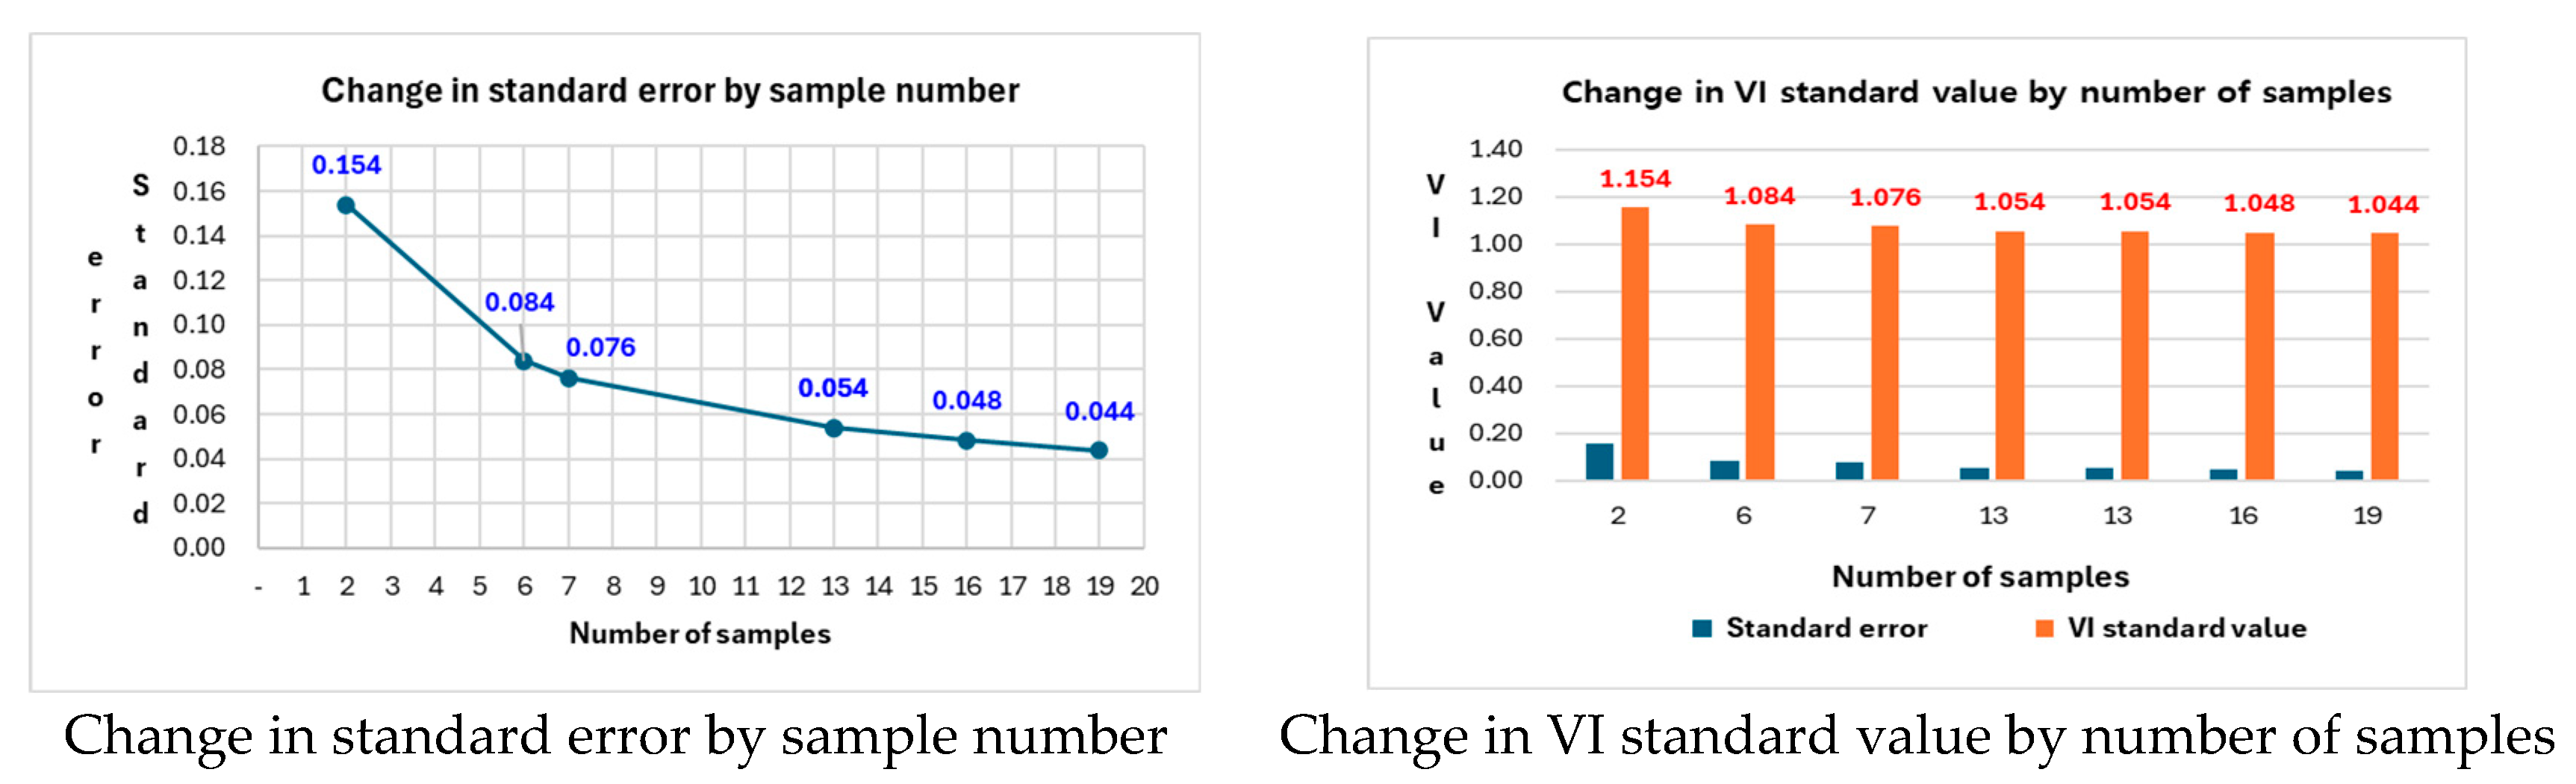
Figure 6.
Value Index (VI) Criterion Table.
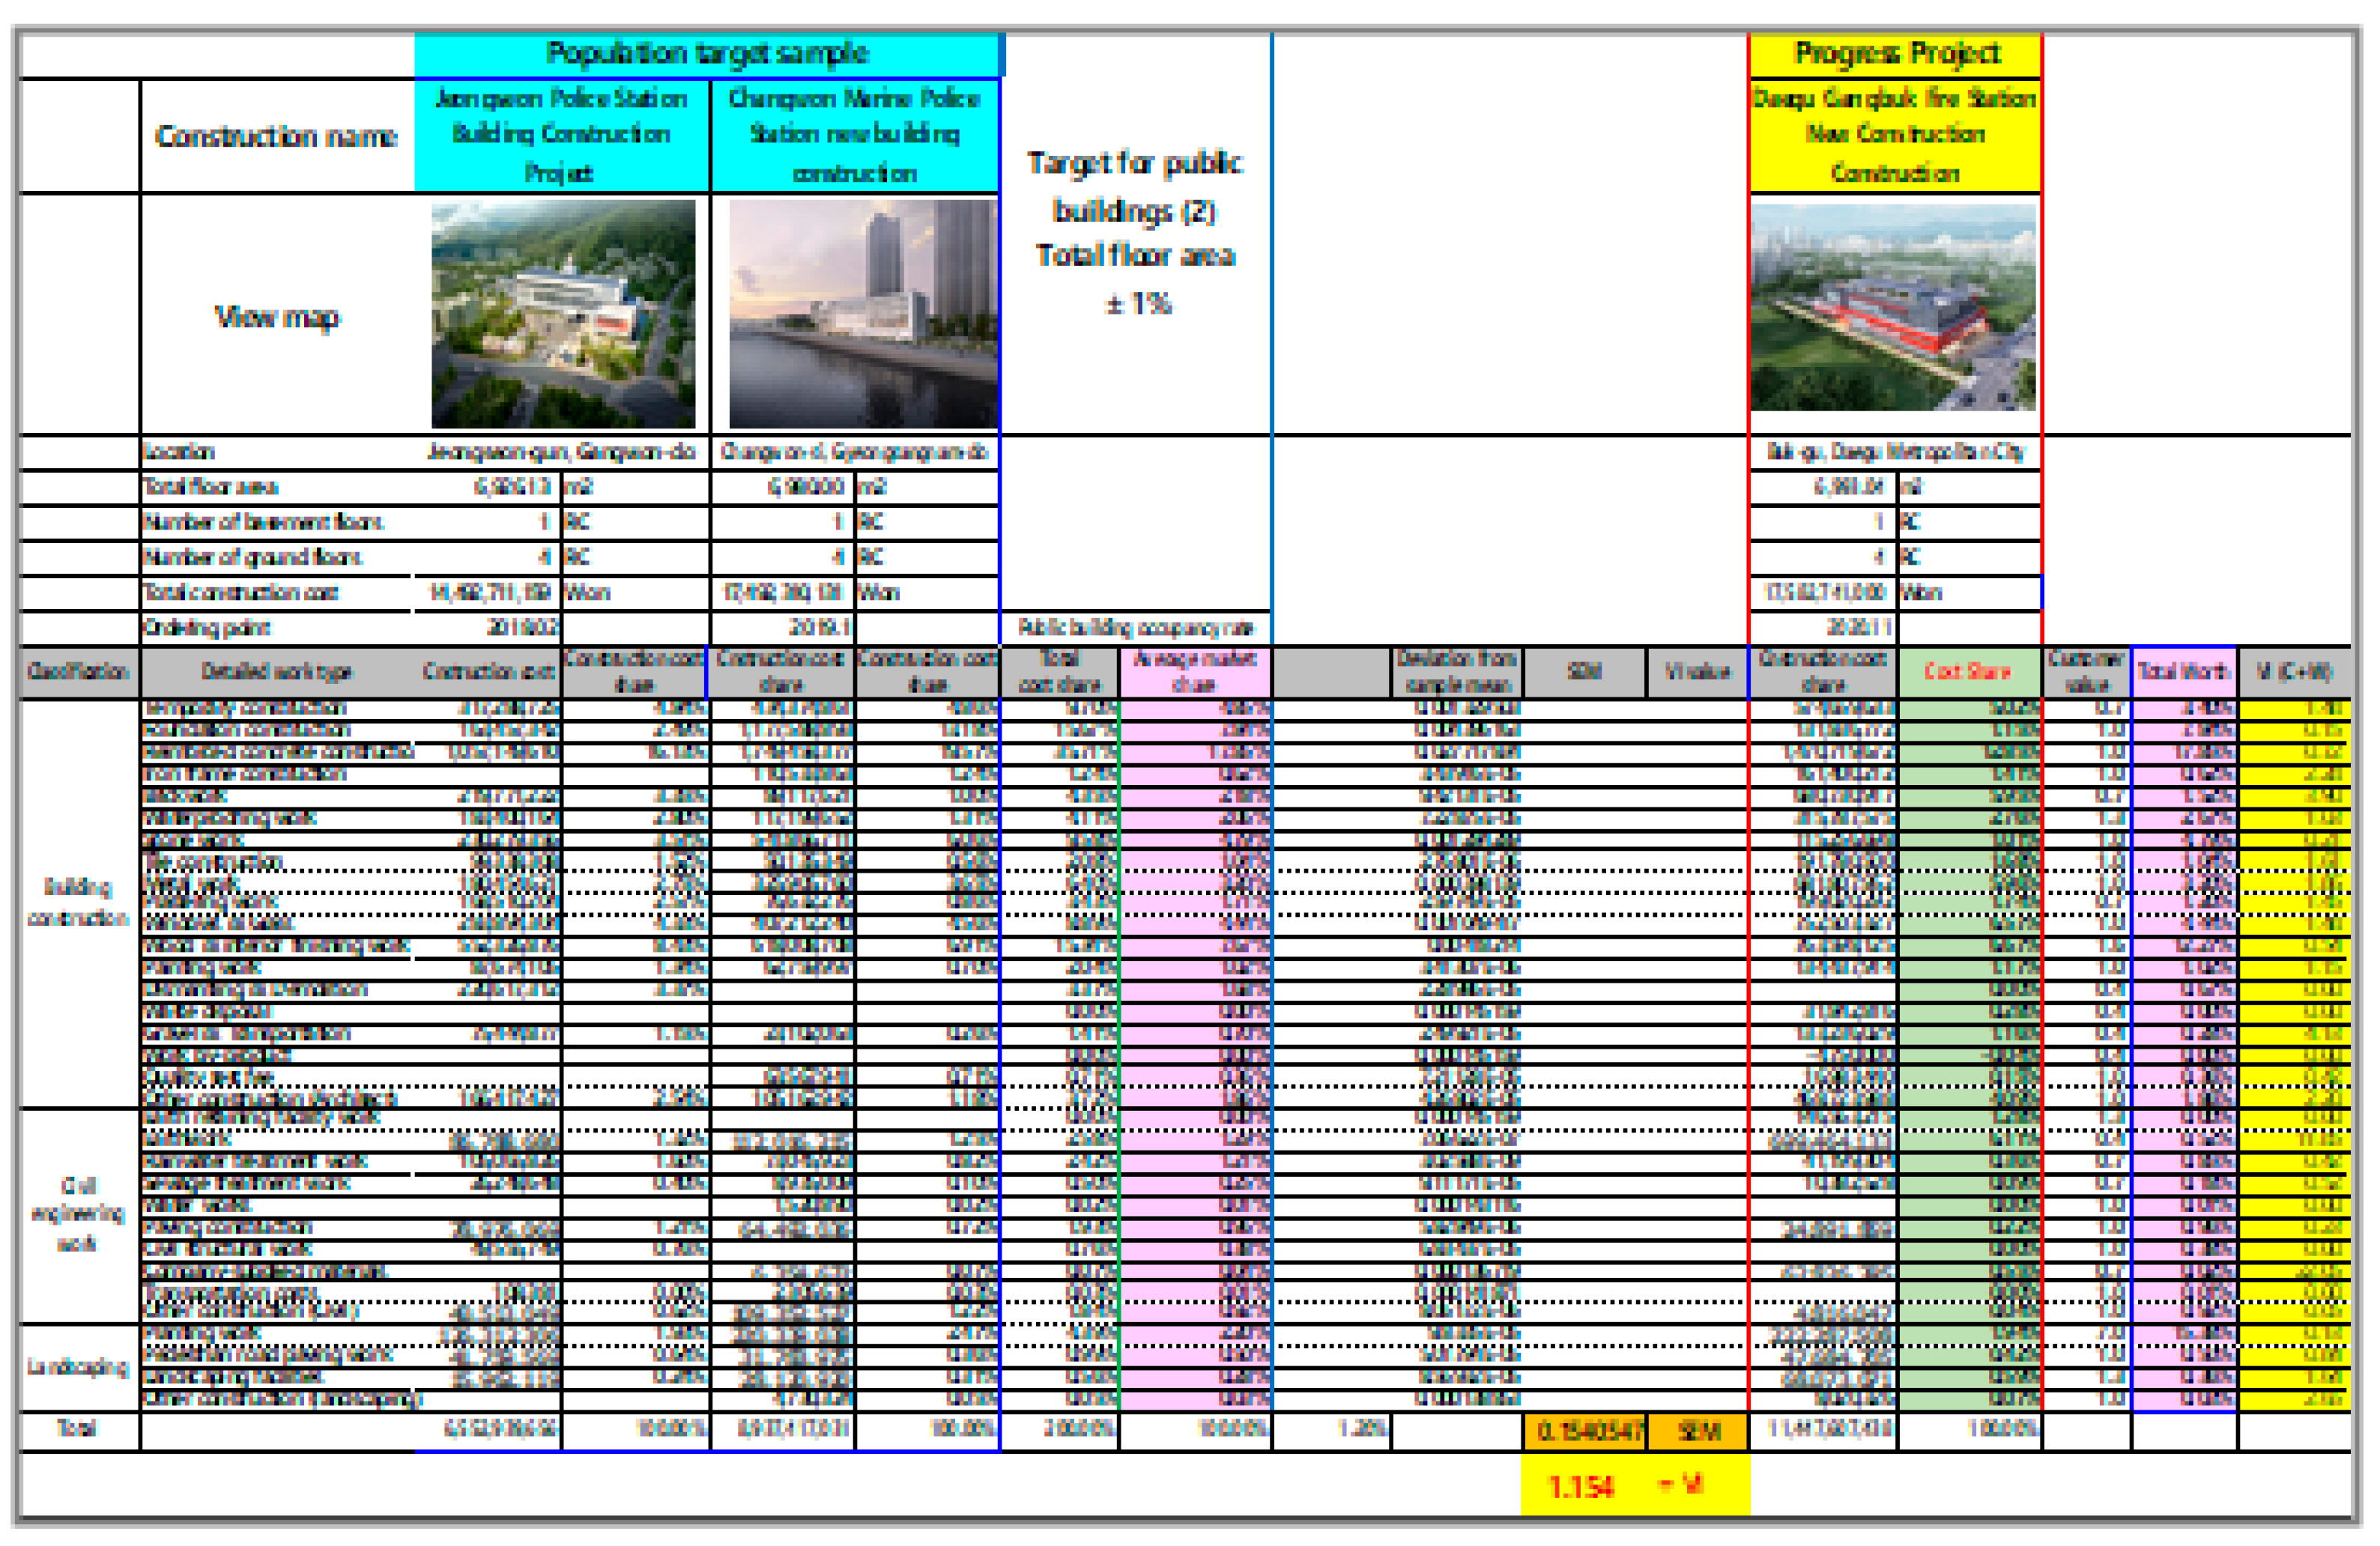
Figure 7.
Selection of the Key Target Categories Graph.
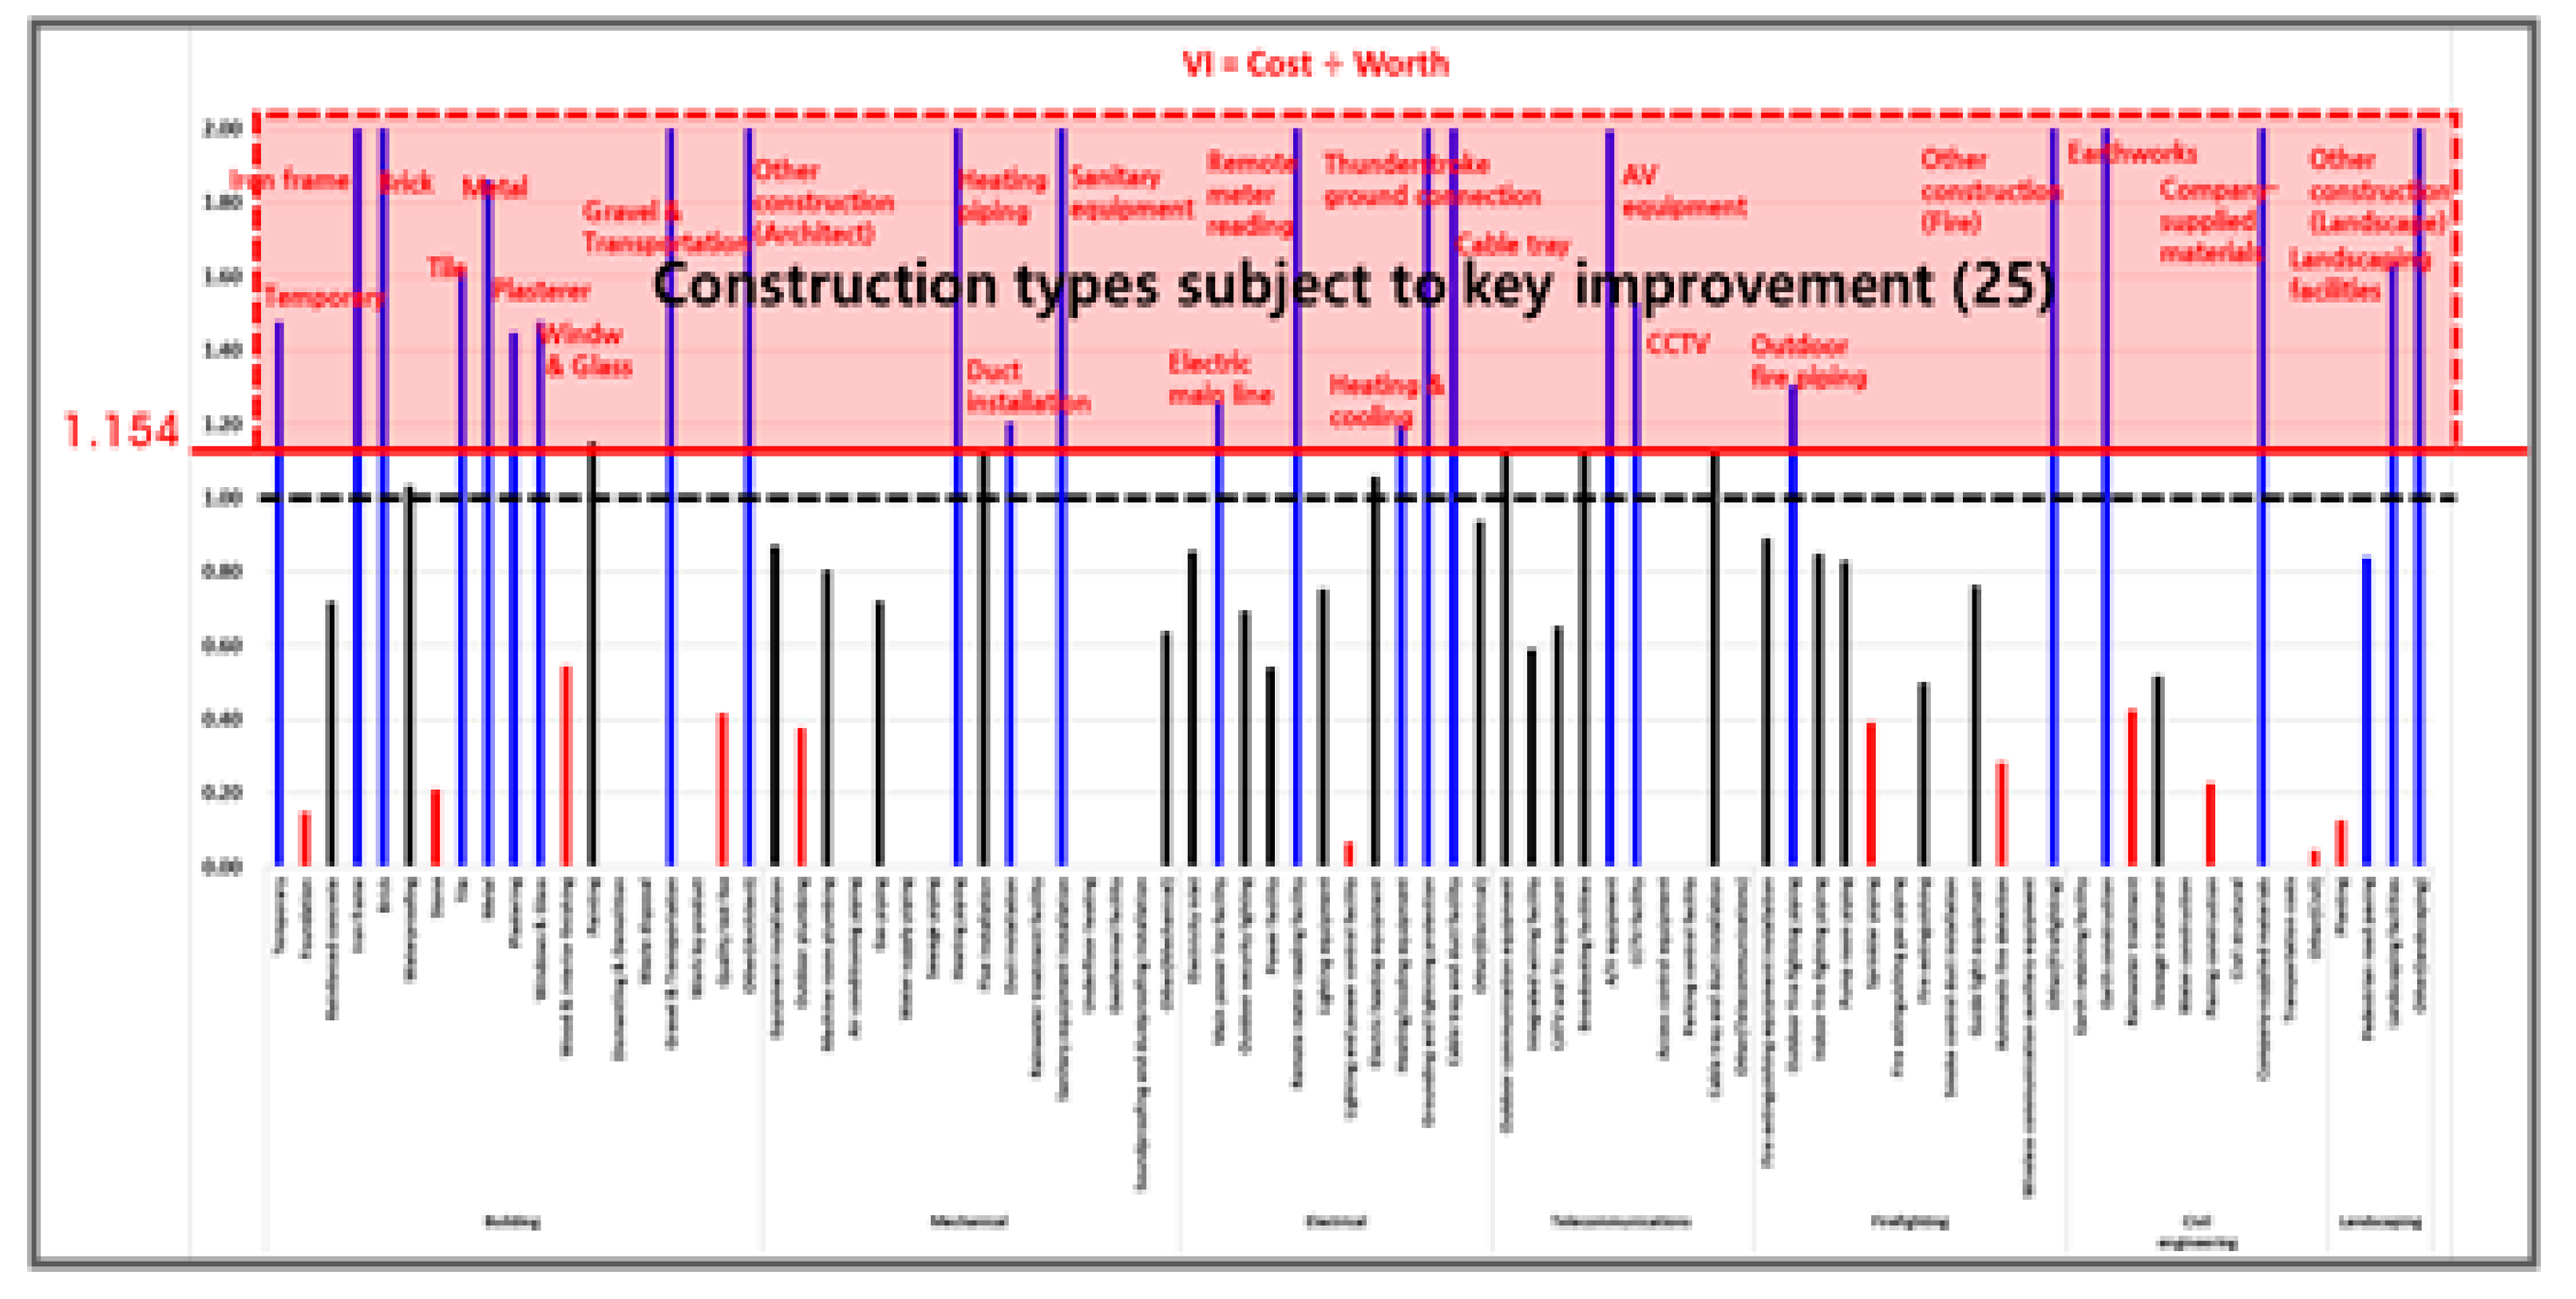

Table 1.
Evaluation criteria and characteristics between design VE target selection techniques.
| VE target selection method | Evaluation standard | Evaluation items | Characteristic |
|---|---|---|---|
| High-cost field selection technique |
Cost | Select high-cost items | Construction that is easy to calculate costs |
| Cost to Worth Technique | Comprehensively judge cost and value | VI = Cost÷Worth Select the item with the highest VI value | Construction that is easy to calculate costs or has past performance data When using Worth, use the concept of functional analysis |
| Cost performance evaluation technique | Comprehensively judge cost and performance | Item with the lowest performance ratio/cost ratio value | Construction with insufficient past performance data Performance evaluation criteria include orderer/user requirements, construction period, etc. |
| Complex evaluation technique | Expected improvement effects, available effort, team capabilities, etc. | Evaluation by evaluation item [Scale: Symbol] |
Large scale project Construction VE |
Table 2.
Descriptive Statistcal analysis of Construction costs per unit area.
| Building use | Number of samples | Unit construction cost average (KRW/㎡) |
SEM (standard error of the mean) |
Standard Deviation |
Minimum construction cost per unit area (KRW/㎡) |
Maximum construction cost per unit area (KRW/㎡) |
|
|---|---|---|---|---|---|---|---|
| Public building | General | 163 | 3,369,047.5 | 45,369.2 | 579,234.6 | 2,072,265 | 5,158,590 |
| Large | 74 | 3,328,716.6 | 111,514.5 | 959,284.3 | 2,465,224 | 10,584,173 | |
| Library | 21 | 3449470.3 | 115,376.0 | 528,719.1 | 2,267,530 | 4,195,593 | |
| Warehouse | 8 | 1,897,827.3 | 166,336.4 | 470,470.5 | 1,164,246 | 2,836,082 | |
| Dormitory | 14 | 3,400,605.6 | 133,406.2 | 499,160.4 | 2,714,915 | 4,474,552 | |
| Factory | 23 | 2,867,950.1 | 203,884.8 | 977,797.3 | 1,385,877 | 4,839,010 | |
| Welfare facilities | 22 | 3,640,164.6 | 220,683.2 | 1,035,096.0 | 2,735,033 | 7,716,943 | |
| medical facilities | 16 | 3,559,654.4 | 99,429.1 | 397,716.3 | 2,702,300 | 4,251,077 | |
| Training facilities | 29 | 3,908,666.6 | 176,132.3 | 948,501.6 | 2,628,219 | 6,307,060 | |
| Sports facilities | 41 | 4,481,404.3 | 201,608.4 | 1,290,923.3 | 3,029,790 | 10,324,043 | |
| Exhibition facilities | 49 | 3,956,687.2 | 111,544.7 | 780,813.0 | 2,874,435 | 6,653,951 | |
| Facilities for the elderly |
50 | 3,380,304.9 | 93,702.0 | 662,573.3 | 2,499,938 | 5,718,689 | |
| University | 56 | 3,011,569.6 | 51,564.2 | 385,871.3 | 2,449,153 | 4,354,924 | |
| Laboratory | 53 | 3,739,241.5 | 111,069.6 | 808,598.8 | 2,578,894 | 6,471,361 | |
| Subtotal | 619 | 3,427,950.7 | 131,544.3 | 737,482.8 | 2,397,701.3 | 5,991,860 | |
Table 3.
Regression equation for construction cost trends by factor.
| Factor | Regression equation |
Correlation coefficient |
Adjusted Coefficient of Determination |
Significance level |
|
|---|---|---|---|---|---|
| Total floor area | Y=3E+0.6X-4E+0.8 | 0.972063 | =0.9449 | 0.9447 | 6.4E-150 |
| Site area | Y=69605X+2E+10 | 0.115279 | =0.0133 | 0.0091 | 7.7E-02 |
| Building area | Y=5E+0.6X+1E+10 | 0.418012 | =0.1747 | 0.1712 | 1.9E-11 |
| Building to Land Ratio | Y=8E+0.7X+2E+10 | 0.057906 | =0.0034 | -0.0009 | 3.7E-01 |
| Floor area ratio | Y=8E+0.7X+2E+10 | 0.204732 | =0.0419 | 0.0378 | 1.5E-03 |
| Number of floors | Y=8E+0.9X-1E+10 | 0.652180 | =0.4253 | 0.4229 | 4.3E-30 |
| Location | Y=2E+0.8X+2E+10 | 0.037360 | =0.0014 | -0.0029 | 5.7E-01 |
Table 4.
An Example of calculating the Cost WorthC for detailed sub-trades in public buildings.
| Division | Detailed work type | Average market share | ||
|---|---|---|---|---|
| General government building (163) |
Large government building (74) |
All government building (237) |
||
| Building | Temporary | 5.73% | 5.36% | 5.62% |
| Foundation | 1.79% | 1.30% | 1.64% | |
| Reinforced concrete | 15.36% | 12.96% | 14.61% | |
| Iron frame | 1.47% | 2.32% | 1.73% | |
| Brick | 1.80% | 1.56% | 1.72% | |
| Waterproofing | 2.62% | 2.24% | 2.50% | |
| Stone | 3.95% | 3.03% | 3.66% | |
| Tile | 1.24% | 0.74% | 1.09% | |
| Metal | 4.74% | 4.75% | 4.74% | |
| Platering | 1.68% | 1.32% | 1.57% | |
| Windows & Glass | 4.80% | 4.79% | 4.80% | |
| Wood & Interior finishing | 13.30% | 9.44% | 12.09% | |
| Painting | 1.35% | 1.26% | 1.32% | |
| Dismantling and demolition | 0.56% | 0.71% | 0.61% | |
| Waste disposal | 0.02% | 0.00% | 0.02% | |
| Gravel & Transportation | 0.57% | 0.46% | 0.54% | |
| Work by-product | -0.05% | -0.07% | -0.06% | |
| Quality test fee | 0.08% | 0.09% | 0.08% | |
| Other | 2.16% | 2.30% | 2.21% | |
| Subtotal | 63.16% | 54.57% | 60.48% | |
| Mechanical | Equipment installation | 1.21% | 1.14% | 1.19% |
| Outdoor plumbing | 0.11% | 0.09% | 0.10% | |
| Machine room plumbing | 0.82% | 1.07% | 0.89% | |
| Air conditioning piping | 0.65% | 1.35% | 0.87% | |
| Gas piping | 0.37% | 0.22% | 0.32% | |
| Water supply piping | 1.10% | 0.94% | 1.05% | |
| Sewage piping | 0.98% | 0.97% | 0.98% | |
| Heating piping | 0.17% | 0.12% | 0.15% | |
| Flue installation | 0.09% | 0.15% | 0.11% | |
| Duct installation | 1.24% | 2.47% | 1.62% | |
| Rainwater treatment facility | 0.26% | 0.37% | 0.30% | |
| Sanitary equipment installation | 0.71% | 0.53% | 0.65% | |
| Underfloor heating | 0.04% | 0.06% | 0.05% | |
| Geothermal facility | 0.39% | 0.88% | 0.55% | |
| Soundproofing and dustproofing installation | 0.11% | 0.24% | 0.15% | |
| Other | 0.76% | 1.58% | 1.02% | |
| Subtotal | 9.00% | 12.19% | 10.00% | |
| Electrical | Electricity inlet | 0.63% | 0.51% | 0.60% |
| Main power line facility | 1.63% | 1.42% | 1.56% | |
| Outdoor security lighting | 0.49% | 0.26% | 0.41% | |
| Power facility | 0.79% | 0.81% | 0.79% | |
| Remote meter reading facility | 0.05% | 0.06% | 0.05% | |
| Lighting equipment | 3.01% | 2.99% | 3.01% | |
| Lighting and power control facility | 0.17% | 0.22% | 0.19% | |
| Electric heating equipment | 1.61% | 1.40% | 4.54% | |
| Heating/cooling equipment | 0.42% | 0.38% | 0.41% | |
| Grounding and lightning protection | 0.57% | 0.33% | 0.49% | |
| Cable tray and duct facility | 0.44% | 0.51% | 0.46% | |
| Other | 0.40% | 0.46% | 0.42% | |
| Subtotal | 10.21% | 9.35% | 9.94% | |
| Telecommunications | Outdoor communication equipment | 0.35% | 0.27% | 0.33% |
| Integrated wiring facility | 2.61% | 2.77% | 2.66% | |
| CATV and TV equipment | 0.48% | 0.47% | 0.47% | |
| Broadcasting facilities | 0.69% | 0.66% | 0.68% | |
| A/V equipment | 0.22% | 0.19% | 0.21% | |
| CCTV facility | 0.26% | 0.33% | 0.28% | |
| Access control equipment | 0.25% | 0.49% | 0.32% | |
| Parking control facility | 0.06% | 0.10% | 0.07% | |
| Cable tray and duct installation | 0.47% | 0.50% | 0.48% | |
| Other | 0.17% | 0.30% | 0.21% | |
| Subtotal | 5.57% | 6.08% | 5.73% | |
| Firefighting | Fire extinguishing equipment installation | 0.28% | 0.20% | 0.26% |
| Outdoor fire-fighting piping | 0.04% | 0.03% | 0.04% | |
| Indoor fire-fighting piping | 0.62% | 0.67% | 0.64% | |
| Pump room piping | 0.26% | 0.15% | 0.22% | |
| Sprinkler piping | 0.89% | 2.00% | 1.24% | |
| Fire extinguishing gas piping | 0.12% | 0.22% | 0.15% | |
| Fire extinguishing | 0.17% | 0.21% | 0.18% | |
| Smoke control duct installation | 0.01% | 0.14% | 0.05% | |
| Guide light equipment | 0.54% | 0.51% | 0.53% | |
| Automatic fire detection | 1.57% | 1.52% | 1.56% | |
| Wireless communication auxiliary equipment | 0.03% | 0.16% | 0.07% | |
| Other | 0.38% | 0.20% | 0.33% | |
| Subtotal | 4.91% | 6.02% | 5.26% | |
| Civil | Earth retaining facility | 3.46% | 3.88% | 3.60% |
| Earth construction | 2.27% | 2.72% | 2.41% | |
| Rainwater treatment | 0.90% | 0.43% | 0.75% | |
| Sewage treatment | 0.24% | 0.15% | 0.21% | |
| Water construction | 0.04% | 0.02% | 0.03% | |
| Paving construction | 0.73% | 0.44% | 0.64% | |
| Civil structural | 0.65% | 0.30% | 0.54% | |
| Company-supplied materials | 0.72% | 0.48% | 0.65% | |
| Transportation costs | 0.03% | 0.02% | 0.03% | |
| Other | 0.56% | 0.40% | 0.51% | |
| Subtotal | 9.61% | 8.83% | 9.37% | |
| Landscaping | Planting | 1.65% | 1.68% | 1.66% |
| Pedestrian road paving | 0.76% | 0.44% | 0.66% | |
| Landscaping facilities | 0.53% | 0.70% | 0.58% | |
| Other | 0.09% | 0.14% | 0.11% | |
| Subtotal | 3.03% | 2.95% | 3.00% | |
| Total | 100.00% | 100.00% | 100.00% | |
Table 5.
Survey Example for Customer Value Requirements (Architectural Sector).
| Division | Detailed work type | Importance of required functions for each detailed construction type | ||||
|---|---|---|---|---|---|---|
| Very Important function | Important function | Normal function | Basic function | Minimum function | ||
| 1.6 | 1.3 | 1.0 | 0.7 | 0.4 | ||
| Building | Temporary | |||||
| Foundation | ||||||
| Reinforced concrete | ||||||
| Iron frame | ||||||
| Brick | ||||||
| Waterproofing | ||||||
| Stone | ||||||
| Tile | ||||||
| Metal | ||||||
| Plastering | ||||||
| Windows & Glass | ||||||
| Wood & Interior finishing | ||||||
| Painting | ||||||
| Dismantling and demolition | ||||||
| Waste disposal | ||||||
| Gravel & Transportation | ||||||
| Work by-product | ||||||
| Quality test fee | ||||||
Table 6.
Example of final WorthF derivation (Architectural field).
| Detailed construction work in the field of public building construction | Cost share WorthC (A) | Customer value WorthV weighting (B) | Final WorthF (A×B) |
|---|---|---|---|
| Temporary | 4.85% | 0.4 | 1.94% |
| Foundation | 7.84% | 1.0 | 7.84% |
| Reinforced concrete | 17.85% | 0.7 | 12.50% |
| Iron frame | 0.62% | 1.0 | 0.62% |
| Brick | 2.18% | 0.7 | 1.53% |
| Waterproofing | 2.06% | 1.6 | 3.30% |
| Stone | 4.79% | 1.3 | 6.23% |
| Tile | 1.04% | 1.3 | 1.35% |
| Metal | 3.20% | 1.3 | 4.16% |
| Plastering | 1.71% | 0.7 | 1.20% |
| Windows & Glass | 4.44% | 1.3 | 5.77% |
| Wood & Interior | 7.67% | 1.6 | 12.27% |
| Painting | 1.02% | 1.3 | 1.33% |
| Waste disposal | 0.04% | 0.7 | 0.03% |
| Gravel & Transportation | 0.70% | 0.7 | 0.49% |
| Other (Architect) | 1.36% | 0.7 | 0.95% |
| Subtotal | 61.37% | 1.0 | 61.51% |
Table 7.
Value Index (VI) Calculation Example (Architectural field).
| Detailed construction work in the field of public building construction | Of the project Cost (C) | Final WorthF (D) |
VI (value index) (C÷D) |
|---|---|---|---|
| Temporary | 5.02% | 1.94% | 2.59 |
| Foundation | 5.15% | 7.84% | 0.66 |
| Reinforced concrete | 12.85% | 12.49% | 1.03 |
| Iron frame | 1.41% | 0.62% | 2.27 |
| Brick | 4.95% | 1.53% | 3.24 |
| Waterproofing | 2.76% | 3.30% | 0.84 |
| Stone | 1.01% | 6.23% | 0.16 |
| Tile | 1.68% | 1.35% | 1.24 |
| Metal | 4.96% | 4.16% | 1.19 |
| Plastering | 1.74% | 1.20% | 1.45 |
| Windows & Glass | 6.57% | 5.77% | 1.14 |
| Wood & Interior | 6.67% | 12.27% | 0.54 |
| Painting | 1.17% | 1.33% | 0.88 |
| Waste disposal | 0.08% | 0.03% | 2.67 |
| Gravel & Transportation | 1.16% | 0.49% | 2.37 |
| Other (Architect) | 4.09% | 0.95% | 4.31 |
| Subtotal | 61.27% | 61.50% | 0.996 |
Table 8.
Standard error analysis results (example) according to the similarity of floor area among samples with the same total number of floors.
Table 8.
Standard error analysis results (example) according to the similarity of floor area among samples with the same total number of floors.
| Progress Project | Total floor area similarity (㎡) | Cumulative number of samples |
Number of floors | SEM (standard error of the mean) |
|---|---|---|---|---|
| Building use : Public building Number of floors: Basement floors(1) Ground floors(4) Total floor area : 6,993㎡ |
99%(6,923~7,063) | 2 | Basement floors(1) Ground floors(4) |
0.15405467 |
| 95%(6,643~7,342) | 6 | 0.08385151 | ||
| 90%(6,293~7,692) | 7 | 0.07630537 | ||
| 85%(5,944~8,042) | 13 | 0.05403102 | ||
| 80%(5,594~8,391) | 13 | 0.05403102 | ||
| 75%(5,244~8,741) | 16 | 0.04819095 | ||
| 70%(4,895~9,090) | 19 | 0.04374134 |
Table 9.
Construction Information for the New Building of the Gangbuk Fire Station in Daegu.
| Progress Project | Daegu Gangbuk Fire Station New Construction |
 |
| Location | Guam-dong, Buk-gu, Daegu | |
| Local district | Central commercial area | |
| Building use | Public building | |
| Number of floors | Basement floors(1) Ground floors(4) |
|
| Site area | 8,009.90㎡ | |
| Total floor area | 6.993.04㎡ | |
| Building to Land Ratio | 30.79% | |
| Floor area ratio | 71.52% | |
| Total construction cost | 17,582,741,000KRW |
Table 10.
The final derivation of WorthF for the target samples (across all sectors, with a focus on the Architectural field).
Table 10.
The final derivation of WorthF for the target samples (across all sectors, with a focus on the Architectural field).
| Architectural field Detailed work | Cost share WorthC (A) | Customer value WorthV (B) | Total WorthF (A×B) |
|---|---|---|---|
| Temporary | 4.85% | 0.7 | 3.395% |
| Foundation | 7.84% | 1.0 | 7.84% |
| Reinforced concrete | 17.85% | 1.0 | 17.85% |
| Iron frame | 0.62% | 1.0 | 0.62% |
| Brick | 2.18% | 0.7 | 1.526% |
| Waterproofing | 2.06% | 1.3 | 2.678% |
| Stone | 4.79% | 1.0 | 4.79% |
| Tile | 1.04% | 1.0 | 1.04% |
| Metal | 3.20% | 1.0 | 3.2% |
| Plastering | 1.71% | 0.7 | 1.197% |
| Windows & Glass | 4.44% | 1.0 | 4.44% |
| Wood & Interior | 7.67% | 1.6 | 12.272% |
| Painting | 1.02% | 1.0 | 1.02% |
| Waste disposal | 0.04% | 0.4 | 0.016% |
| Gravel & Transportation | 0.70% | 0.4 | 0.28% |
| Other (Architect) | 1.36% | 1.0 | 1.36% |
| Subtotal | 61.37% | 0.93 | 63.524% |
Table 11.
Results of Idea Generation for Cost-saving Priority Focus Categories.
| Division | Detailed | VI value | Number of ideas | Increase/decrease amount(KRW) |
|---|---|---|---|---|
| Building | Temporary | 1.48 | 3 | -33,600,000 |
| Iron frame | 2.28 | 3 | -50,800,000 | |
| Brick | 3.90 | |||
| Tile | 1.61 | |||
| Metal | 1.86 | 3 | -354,200,000 | |
| Plastering | 1.45 | 2 | -52,000,000 | |
| Windows & Glass | 1.48 | 5 | ||
| Gravel & Transportation | 4.13 | 1 | ||
| Other construction | 2.20 | 3 | -217,700,000 | |
| Mechanical | Heating piping | 3.98 | 2 | -42,700,000 |
| Duct installation | 1.21 | 2 | -1,650,000 | |
| Sanitary equipment | 4.23 | 1 | ||
| Electrical | Electric main line | 1.26 | 5 | -93,000,000 |
| Remote meter reading | 3.02 | 2 | -74,700,000 | |
| Heating & cooling | 1.20 | 1 | -1,500,000 | |
| Thunderstroke ground connection | 5.90 | 1 | -1,000,000 | |
| Cable tray | 2.58 | 1 | -12,000,000 | |
| Telecommunications | AV equipment | 2.00 | 4 | -39,000,000 |
| CCTV | 1.53 | |||
| Firefighting | Outdoor fire piping | 1.31 | 2 | -12,600,000 |
| Other construction | 145.62 | 3 | -58,500,000 | |
| Civil | Earthwork | 11.85 | 2 | -233,100,000 |
| Company-supplied materials | 22.05 | 2 | -268,000,000 | |
| Landscaping | Landscaping facilities | 1.64 | 1 | -34,400,000 |
| Other construction | 2.65 | 2 | -600,000 | |
| Subtotal | 11.85 | 51 | -1,581,050,000 | |
Table 12.
Comparison between Identified Key targets and Idea Generation Categories.
| VE implementation steps | Target Project | Sample target | Number of target selected construction types derived from this study | Number of construction types for deriving target project ideas | Match rate |
|---|---|---|---|---|---|
| Design stage | Gangbuk Fire Station |
Jeongseon Police Station | 25 | 22 | 88% |
| Changwon Marine Police Station |
Disclaimer/Publisher’s Note: The statements, opinions and data contained in all publications are solely those of the individual author(s) and contributor(s) and not of MDPI and/or the editor(s). MDPI and/or the editor(s) disclaim responsibility for any injury to people or property resulting from any ideas, methods, instructions or products referred to in the content. |
© 2024 by the authors. Licensee MDPI, Basel, Switzerland. This article is an open access article distributed under the terms and conditions of the Creative Commons Attribution (CC BY) license (http://creativecommons.org/licenses/by/4.0/).
Copyright: This open access article is published under a Creative Commons CC BY 4.0 license, which permit the free download, distribution, and reuse, provided that the author and preprint are cited in any reuse.


