Preprint
Article

Effective Removal of Microplastics Particles from Wastewater using Bio-Substrates

Altmetrics

Downloads

146

Views

75

Comments

0

A peer-reviewed article of this preprint also exists.

Submitted:

29 February 2024

Posted:

13 March 2024

You are already at the latest version

Alerts
Abstract
The rapid increasing rate of soil and water bodies pollution is the main anthropogenic effect caused by the mismanagement of post-consumer plastics. This research evaluated the effectiveness of cattail (Typha Latifolia) fibers (CFs) as bio-adsorbents of microplastic particles (MPPs) from wastewater. The effect of the adsorption environment composition on the adsorption rate was investigated. Batch tests were conducted to evaluate the “spontaneous” adsorption of MPs onto CFs. Five MPPs materials (PVC, PP, LDPE, HDPE, and Nylon 6) were evaluated. An industrial wastewater (PW) and Type II Distilled Water (DW) were employed as adsorption environments. The batch tests results show that CFs are effective in removing MPPs from DW and PW. However, higher removal percentage of MPPs were obtained in PW, ranging from 89% to 100% for PVC, PP, LDPE, and HDPE; while the adsorption of Nylon 6 increased to 29.9%, a removal increased of 50%. These observations indicate that hydrophobic interactions drive the “spontaneous and instantaneous” adsorption process and that adjusting the adsorption environment effectively enhances the MPPs removal rate. This research demonstrates the important role that bio-substrates can play in reducing the environmental pollution as efficient, sustainable, low cost, and reliable adsorbents for the removal of MPPs from wastewaters.
Keywords: 
Subject: Engineering  -   Chemical Engineering

1. Introduction

The anthropogenic effects derived from the mismanagement of post-consumer plastics includes the rapid increasing rate of soil and water bodies pollution. For instance, the UN Environment Program has “…estimated that 75 to 199 million tonnes of plastic is currently found in our oceans” [1] (p. 3) [2,3,4,5]. Plastic debris is inherently chemically stable; therefore, its chemical degradation would take hundreds of years in the natural environment [1,2,3,6]. However, under natural environmental conditions, plastic debris is finely fragmented into micro- and nanoparticles “…by several factors including UV-radiation, thermal degradation, mechanical stress, animals, roots, soil organisms. [This particulate matter] may be transported by wind and surface or groundwater routes … to remote regions in land and water bodies” [7] (p. 164533(2)) [1,5]. Micro- and nanoplastic particles are considered “… one of the most important environmental threats to marine ecosystems” [8] (p.1). This is alarming because the transformation of plastic debris in the environment is not well understood yet. Hence, their lasting presence in natural ecosystems disrupts our environment’s ecological balance and impacts human health. Micro- and nanoplastic particles enter the human body through inhalation and absorption [1] permeating thru biological membranes [7] and bioaccumulating in organs. Nanoplastic particles have been found in human’s lungs, livers, spleens, kidneys, and in the placentas of newborn babies [1,25]. Consequently, micro- nanoplastic particles pollution is “…a potential threat to food security, health, and environment” [7] (p.164533(1)) [26]. Moreover, plastic debris is hydrophobic, with large surface areas that adsorb pollutants on their surface at concentrations that are several orders of magnitude higher than in the surrounding water. Thus, micro- and nanoplastic particles are carriers of hazardous chemicals, increasing the pollutants’ bioavailability to aquatic organisms [4,10,11,13,16].
Previous studies have demonstrated that conventional Wastewater Treatment Plants (WWTPs) are pathways for the release of micro- and nanoplastic particles. Current WWTPs normally remove a maximum of 90% of the micro- and nanoplastic particles contained in municipal and industrial wastewaters [4,5,7,8,17,22,23,24,27]. Furthermore, as stated by [4] (p. 2), “…around 50-85% of MPs [microplastics] could be retained in the sewage sludge, which is widely utilized as biofertilizer…” [4]. Hence, significant amounts of micro- and nanoplastic particles are discharged into the environment daily, worldwide. Additionally, it has been identified that the shear forces [8] applied to plastic debris particles during water treatment processes currently employed in WWTPs cause the further fragmentation of larger plastic debris and microplastic particles into nano size particulates, which aggravates the pollution problem [5].
According to [4] (p.2) “…no specific treatment technology has been employed yet in WWTPs for the elimination of MPs and NPs [nanoplastics] from sewage excluding the treatment techniques … [that are] already available in WWTPs such as skimming, mesh screening, grit chamber, sedimentation, membrane bioreactor, and tertiary filtration” [4,24]. The most applied technology in WWTPs for the removal of pollutants is adsorption for its simplicity, high efficiency, and wide range of applicability. Thus, advanced adsorbents are continuously under research and development for the efficient removal of micro- and nanoplastic particles from water environments [4] including activated carbon, carbon nanotubes, molecular sieves, metal-organic frameworks, membrane technology (e.g., microfiltration and ultrafiltration) [8], and nano technology, which display different levels of performance and manufacturing costs [4,24,25,28]. Though, it has been demonstrated that these advanced adsorbents display removal efficiencies of micro- and nanoplastics particles up to a maximum of 90% [4,8,24,25,28]. Additionally, these technologies are expensive and are affected by operational limitations, such as rapid fouling and membrane blockage [8,17,29,30,31,32]. Other technologies targeted to the removal of micro- and nanoplastic particles from wastewater “…are still at the laboratory-scale or preliminary research phase” [4] (p. 29) including air flotation [8], bioremediation, bio-nano filtration membranes, photodegradation, coagulation/flocculation, electrooxidation, electrocoagulation, advanced oxidation processes, ultrasound, centrifugation [25], and magnetic separation [4,5,9,24,33].
The use of biodegradable materials [5] and/or bio substrates as adsorbents for the removal of pollutants including micro- and nanoparticles from drinking water and/or wastewaters is well established. Bio-substrates (e.g., biofibers) are sustainable, renewable, economically viable, and safe [34,35,36]. Bio-fibers are readily available, scalable, and currently used in the production of many industrial goods including textile fabric, medical supplies, composites, twine, and ropes [37]. Yet, there is a knowledge gap in the understanding of the intermolecular and interfacial forces and/or mechanisms acting on solid biomass/liquid interfaces during adsorption as detailed in [38] and references therein.
This exploratory research evaluates the use of cattail (Typha Latifolia) fibers as a bio-adsorbent to remove MPPs from wastewater. More specifically, this research aimed to answer the following research questions. First, how effective are native CFs as bio-adsorbents of MPPs from wastewaters? and secondly, to what extend the composition of the adsorption environment affects the adsorption rate of MPPs on the CFs hydrophobic surface? To answer these research questions batch adsorption tests were conducted using MPPs from the following polyolefins: polyvinyl chloride (PVC), polypropylene (PP), low-density polyethylene (LDPE), and high-density polyethylene (HDPE). According to [26], these polyolefins account for more than 60% of plastic waste. Furthermore, as stated by [5] (p. 6). “The most abundant NPs [nanoplastic particles] in sewage sludge are polyethylene (53%) and polypropylene (30%)”. The polyamide, Nylon 6, was also used in this study. The effect of the composition of the adsorption environment on the adsorption process was evaluated using an industrial wastewater and Type II Distilled Water.
The specific objectives of this exploratory research were as follows:
1. 
Characterization of the physicochemical properties of CFs.
2. 
Establishment of the adsorption efficiency of five MPPs of different plastic materials (e.g., PVC, PP, LDPE, HDPE, and Nylon 6) on the hydrophobic surface of CFs via batch adsorption tests at ambient temperature.
3. 
Determination of the effect of the adsorption environment on the adsorption rate of MPPs onto the surface of CFs.
4. 
Establishment of the dominant mechanism driving the adsorption of microplastic MPPs onto CFs.

2. Experimental Methodology

2.1. Materials

2.1.1. Adsorbents: Cattail Fibers (CFs) and Activated Carbon

The CFs used in this work were locally sourced from several wild wetlands around the city of Fredericton, New Brunswick, Canada. The cattail fibers were sieved using a vibratory sieve shaker, model AS 200 manufactured by Retsch (Germany) at 60 rpm for an hour using a sieve No. 12 (opening 1.7 mm U.S.A. Standard Testing Sieve, ASTM-11 specification) to separate the seeds from the fibers.
The activated carbon used as a reference adsorbent was DARCO®, Hydrodarco B, HDB, Batch 4-87, manufactured by American Norit Company, Inc. (Florida, USA).

2.1.2. Microplastic Particles (MPPs)

The MPPs particles (randomly selected commercial polymers available in the laboratory) were subjected to particle size analysis to determine the weight average diameter. The procedure was carried out using a vibratory sieve shaker, model AS 200 manufactured by Retsch (Germany). Seven sieves, Canadian Standards Sieve Series, (Ontario, Canada) in the following mesh No. order: 50, 60, 70, 100, 140, 200, and 325 were used. Each of the MPPs particles were poured into the top sieve (i.e., mesh No. 50) and the sieve column was fixed using a lid equipped with adjusting screws and nuts at the top and a pan at the bottom. Then, the vibratory sieve shaker was run at 60 rpm for a period of 30 minutes. Afterwards, the MPPs retained on each sieve were weighed and subsequently the weight average diameter was calculated for each microplastic particle material.

2.1.3. Adsorption Environment

Two adsorption environments were used: distilled water Type II and Produced Water (PW) from an Oil and Gas production operation. The produced water was provided by Cenovus Energy Inc. from the Pelican Lake heavy oil operations, northern Alberta, Canada. The concentration of crude oil in the PW was 105 ppm and the salinity concentration was 2.1 wt%.

2.2. Methodology

2.2.1. Cattail Fiber Characterization

CFs were characterized employing several analytical techniques as follows. Fourier Transform Infrared Spectroscopy (FTIR) Analysis was carried out using a 6700 FTIR manufactured by Thermo Fisher Scientific (Waltham, Massachusetts, US). The signals acquired were an average of 32 scans performed in the range of 400 cm-1 to 4000 cm-1 with a resolution of 4 and data spacing of 1.928 cm-1. Background spectra were first collected with a KBr (~100 mg) pellet. 1mg of cattail fiber was mixed with 99 mg of crushed KBr and then pressed into a pellet of 1 cm diameter. The spectra presented were background corrected. The Thermogravimetric Analysis (TGA) of the CFs was conducted using a TGA Q500 equipped with an EGA furnace (TA Instruments, New Castle, DE, USA). The Contac Angles of CFs and MPPS were obtained using a Goniometer, model G16-2, manufactured by Wet Scientific (Texas, USA). The optical micrographs were obtained using an Olympus Compact Inverted Metallurgical Microscope, model GX41, manufactured by Olympus America Inc. (PA, USA). The microscope was equipped with an Infinity2 Microscopy camera and the Infinity Analyze and Capture software, manufactured by Lumenera Corporation (Ontario, Canada) that were used to measure the diameter of the CFs. A scanning electron Model SU-70 (Hitachi, Tokyo, Japan) at an accelerating voltage of 5 kV was used to obtain high-resolution images of the CFs and detail morphological information of the cattail fibers surface. The surface area of the CFs and activated carbon was measured using a Quantachrome Autosorb 1-C, manufactured by Quantachrome Instruments (Florida, USA). The Brunauer–Emmett–Teller (BET) procedure was applied using nitrogen as the adsorbate gas.

2.2.2. Batch Adsorption Tests

Batch adsorption tests were conducted in such a way that the “spontaneous and instantaneous” adsorption of MPPs could take place on the surface of the hydrophobic cattail fibers without inducing the mechanical trapping of MPPs within the fibers network. The batch adsorption tests were carried out at ambient temperature (e.g., 24oC) by placing on a container having a flat bottom the corresponding mass of microplastic particles. Then, 200 ml of distilled water (DW) or produced water (PW) was transferred onto the surface of the MPPs, which immediately floated to the surface of the liquid because of the hydrophobicity of the plastic materials limit their dispersion in aqueous solutions [39,40]. Afterwards, a fixed mass of cattail fibers (0.3 g) was placed on the surface of the liquid and the mixture was slightly stirred using a spatula for 30 seconds to aid further contact among the MPPs and the CFs. This stirring stage was carried carefully to avoid the mechanical retention of the particles within the CFs network. Then, the mixture was left still for 10 minutes. After that, the cattail fibers and adsorbed MPPs were carefully extracted from the liquid surface with the help of tweezers onto a petri-dish. The petri-dish was placed in an oven at 45°C for drying until the mass of the CFs-MPPs solid blend remained constant, which was indicative of total evaporation of the water initially contained in the CFs-MPPs system. Next, the weight of the CFs-MPPs solid mixture was determined to calculate the amount of microplastics particles adsorbed onto the surface of the CFs. Batch adsorption tests were repeated six times for each plastic material. Figure 1 displays the experimental set-up and the procedure of the batch adsorption tests.

2.2.3. Experimental Design

Table 1 summarizes the experimental matrix indicating the type of plastic materials, the MPPs solution concentrations, and the adsorption environments evaluated in this study. Fixed parameters, such as the mass of CFs and the temperature of the adsorption process, are also indicated. Activated carbon was used as a baseline adsorbent material.

2.2.4. Statistical Analysis

The experimental results were processed using Microsoft Excel software and expressed as the arithmetic mean ± standard error of the mean. All graphs were plotted using Microsoft Excel.

3. Results and Discussion

3.1. Infrared Spectroscopy (FTIR) Analysis of Cattail Fibres

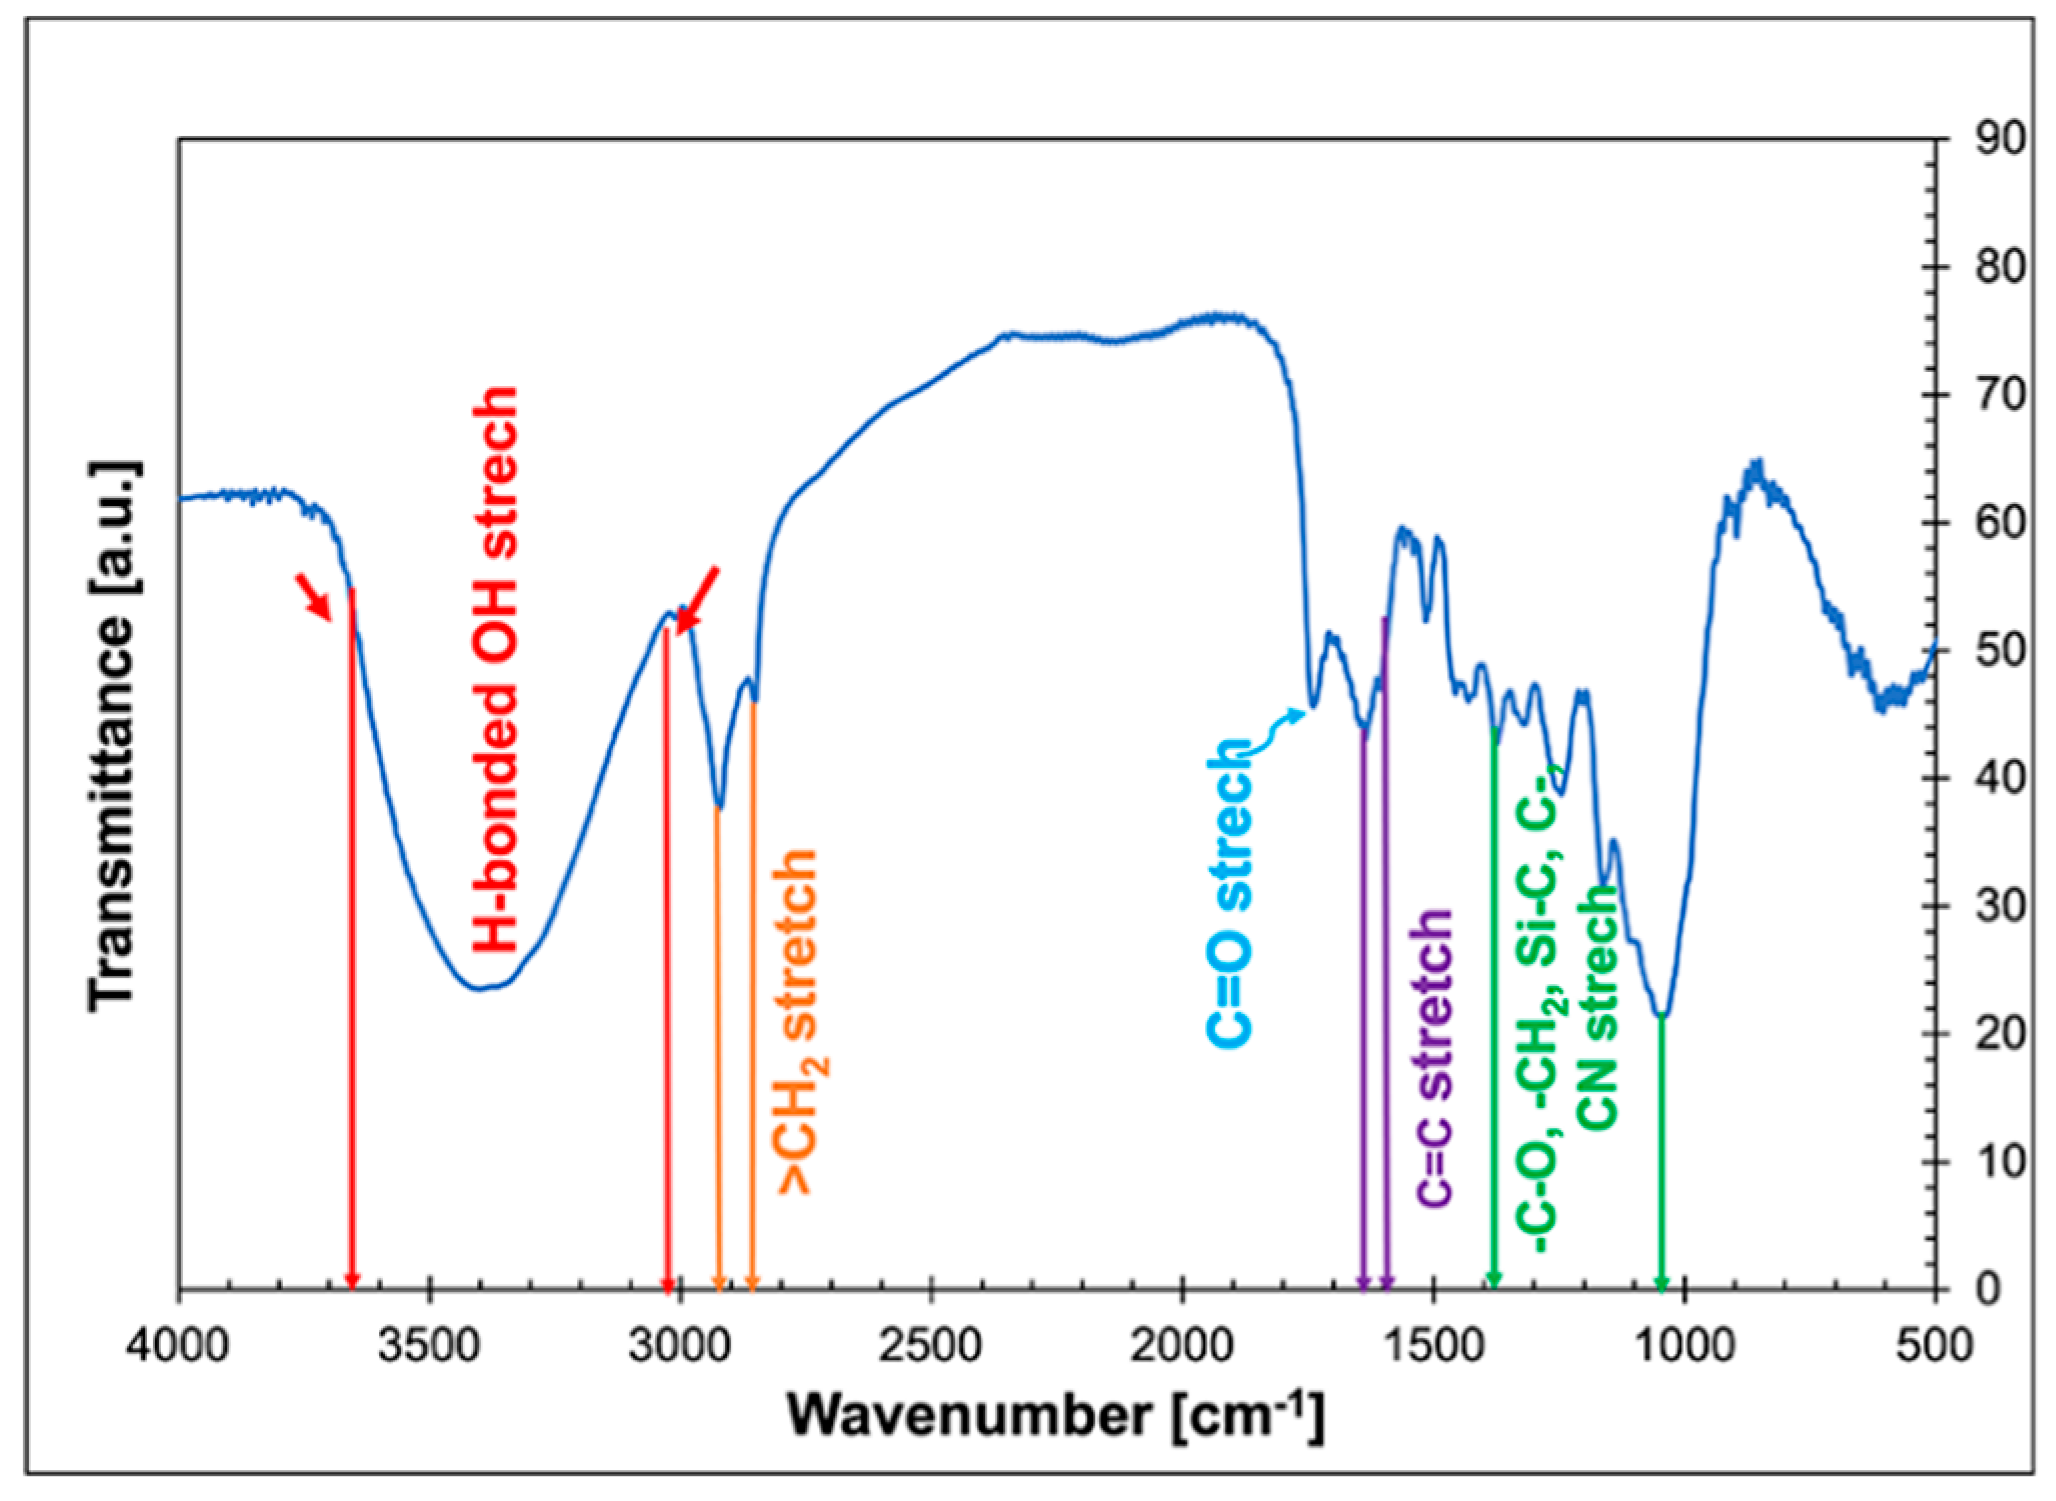
CFs are mainly composed of cellulose, hemicelluloses, and lignin [41]. Figure 2 displays the FTIR spectrum of CFs, which confirms the presence of typical functional groups associated to biomass materials. In Figure 2, the broad band between the wavelengths of 3600 cm-1 to 3020 cm-1 is attributed to hydroxy group, H-bonded OH stretch indicative of the presence of cellulose and hemicellulose [42,43,44]. The narrow peaks from 1650 cm-1 to 1550 cm-1 match alkenyl C=C and C-O stretching ascribed to lignin content [43,44,45]. Previous studies have demonstrated the presence of a waxy film on the CFs surface, which makes these fibers hydrophobic [41,43,45,46,47,48,49,50]. The presence of a wax layer covering the fibers is confirmed by the narrow and weak peaks observed from 2920 cm-1 to 2850 cm-1 that correspond to the asymmetric and symmetric CH2 and CH3 stretching vibrations associated to aliphatic wax components [42,44,47]. The peak at 1740 cm-1 wavelength correspond to carbonyl group (C=O) stretching vibration (e.g., carboxylic acid, aldehydes, ester, acetyl, etc.) in lignin and hemicellulose [42, 44), 45, 51]. Other several narrow peaks from 1360 cm-1 to 1020 cm-1 represent several stretching vibrations related to -C-O, -CH2 deformation, Si-C, C-O of cellulose, hemicelluloses, and lignin and C-N stretching [52].

3.2. Thermogravimetric Analysis (TGA) of Cattail Fibres

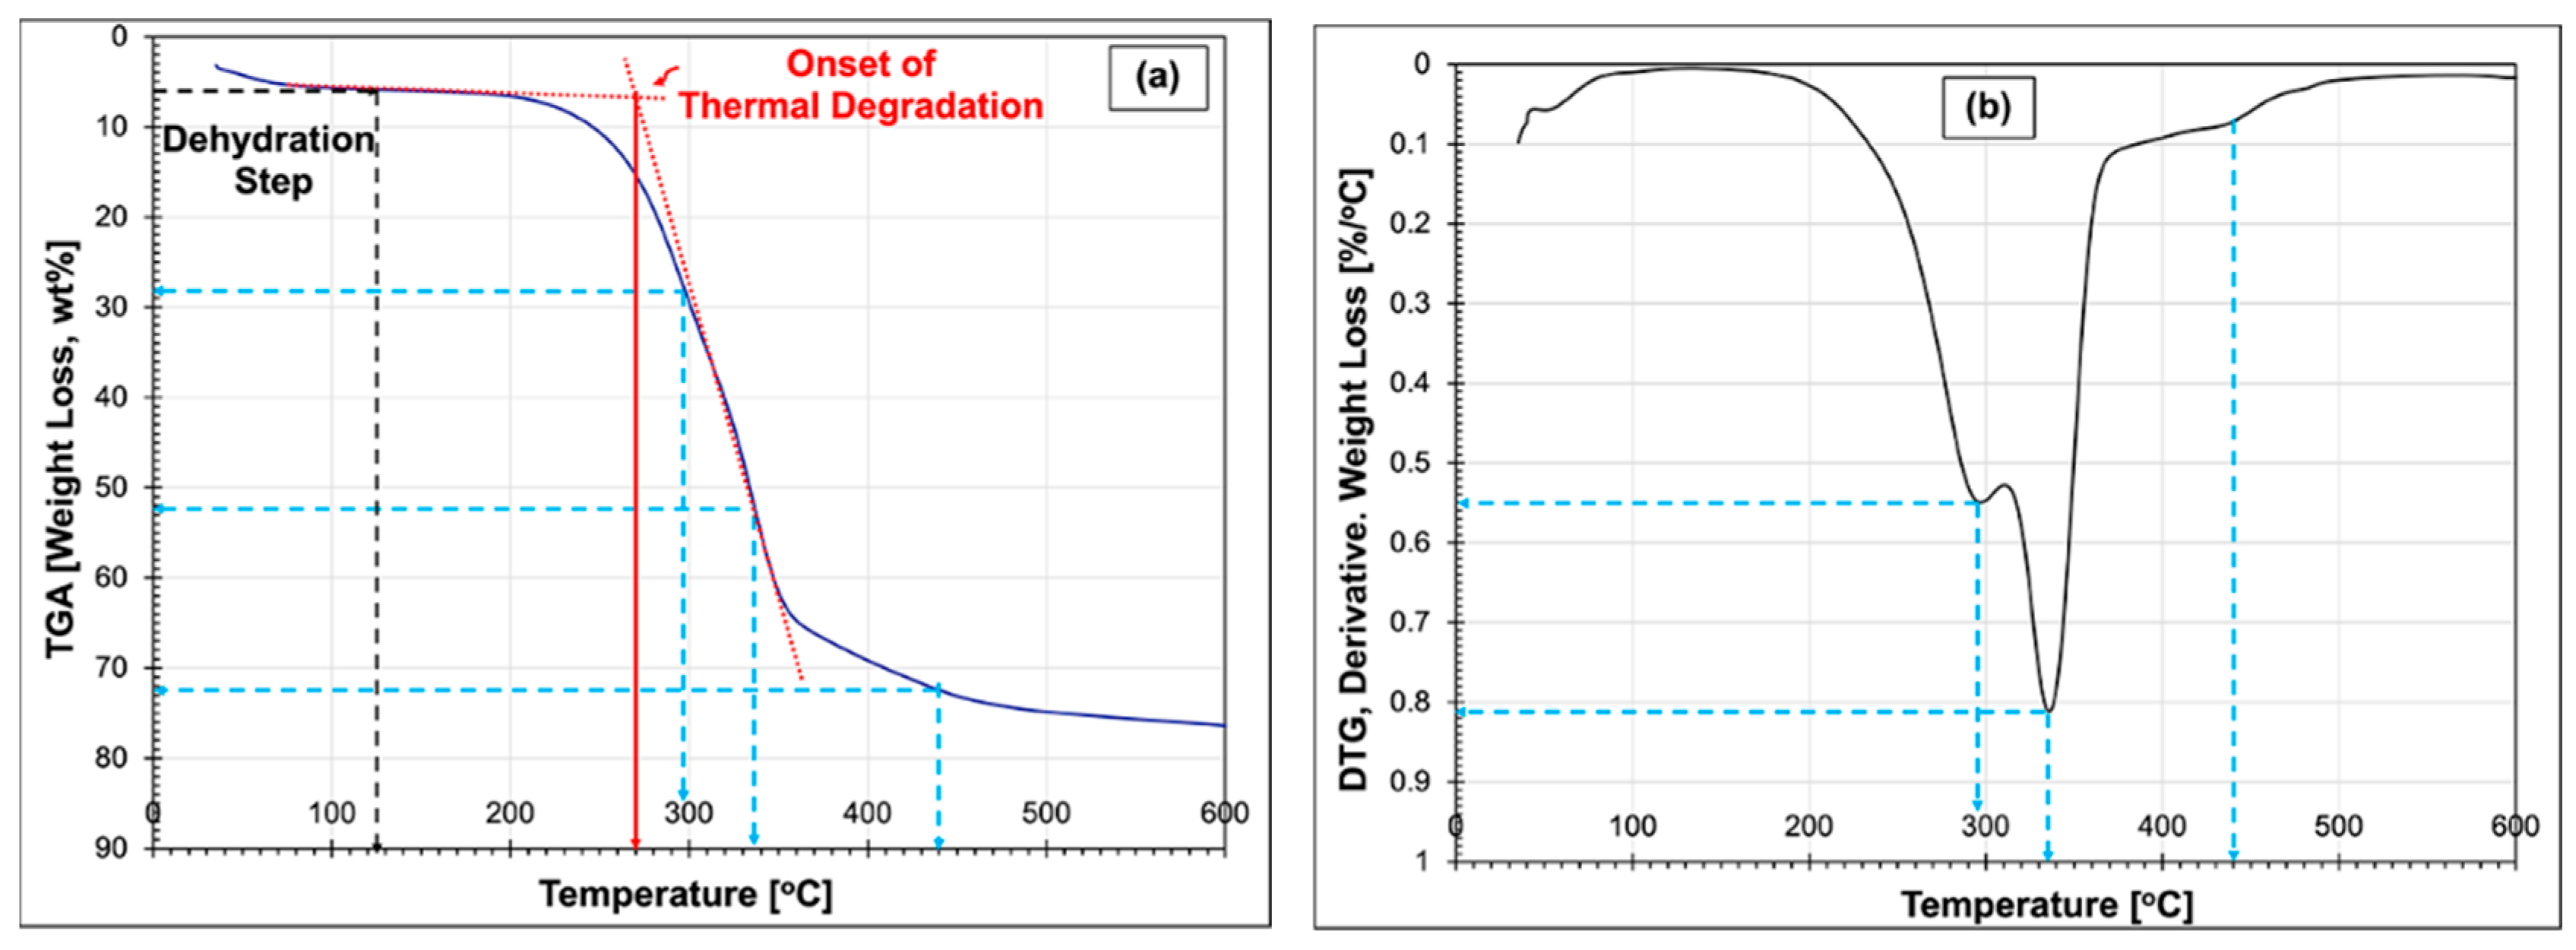
Figure 3a,b show the TGA and DGT thermograms of CFs, respectively. These thermograms show the initial dehydration of the CFs that started from 35°C to 124°C. In this temperature range, approximately 6.2wt% unbound and bound water was evaporated. The onset of thermal degradation reactions, which is determined from “the intersection of the initial baseline with the tangent of the plot at the steepest point” [53] (p.114), started at 270°C with major degradation rates at 296°C and 336°C causing a weight loss of 46.1wt%. These first thermal degradation reactions that finished at approximately 336°C are linked to the overlapping thermal decomposition of holocellulose, cellulose, hemicellulose, and lignin [54,55,56]. Earlier research has demonstrated that the thermal decomposition of lignin starts at approximately 290°C and continuous slowly until about 440°C [55], behavior that is also observed in this study. This TGA analysis indicates that CFs are thermally stable up to 200°C, which makes these fibers suitable for high temperature applications.

3.3. Contac Angle of Cattail Fibres and MPPs

The measured contact angle, q, of the CFs is 117° ± 2.83 in distilled water. Therefore, the surface of native CFs is hydrophobic, as reported by several studies [41,45,47]. Previous research has demonstrated that the hydrophobicity of the CFs is explained by the high content of wax that forms a film on the fibre surface [57].The wax content in CFs has been reported ranging from 6.13wt% [48] to 11.5wt% [49,57].
The measured contact angles (q) in distilled water of the different MPPs materials evaluated in this work are as follows: q of Nylon 6 = 68.5° ± 5.5, q of PP = 111.1° ± 4.2, q of HDPE = 104.1° ± 1.9, q of LDPE =102.5° ± 2.4, and q of PVC = 121° ± 0.9. All the measured values of contact angle obtained in this work are within the same order of magnitude of the contact angle values reported in the literature [58,64] for these plastic materials. However, it is important to clarify that the contact angles were measured on the microplastic particles that were carefully compacted on the Goniometer sample holder. The compacted MPPs layers displayed rough surfaces. Therefore, the contact angle values reported in this work are toward the higher end of the range of the contact angle values reported in the literature. This observation is explained through the effect of surface roughness on contact angle measurements, which is explained “…by Wenzel who stated that adding surface roughness will enhance the wettability caused by the chemistry of the surface. For example, if the surface is chemically hydrophobic, it will become even more hydrophobic when surface roughness is added” [65] (p. 1).
The measured contact angles of the MPPs materials evaluated in this study further demonstrates the strong hydrophobic nature of PVC, PP, LDPE, and HDPE; while the contact angle of the MPPs of Nylon 6 at q = 68.5° ± 5.5 demonstrates its weak hydrophobicity compared with the other MPPs materials tested here.

3.4. Optical and Scanning Electron Microscopy

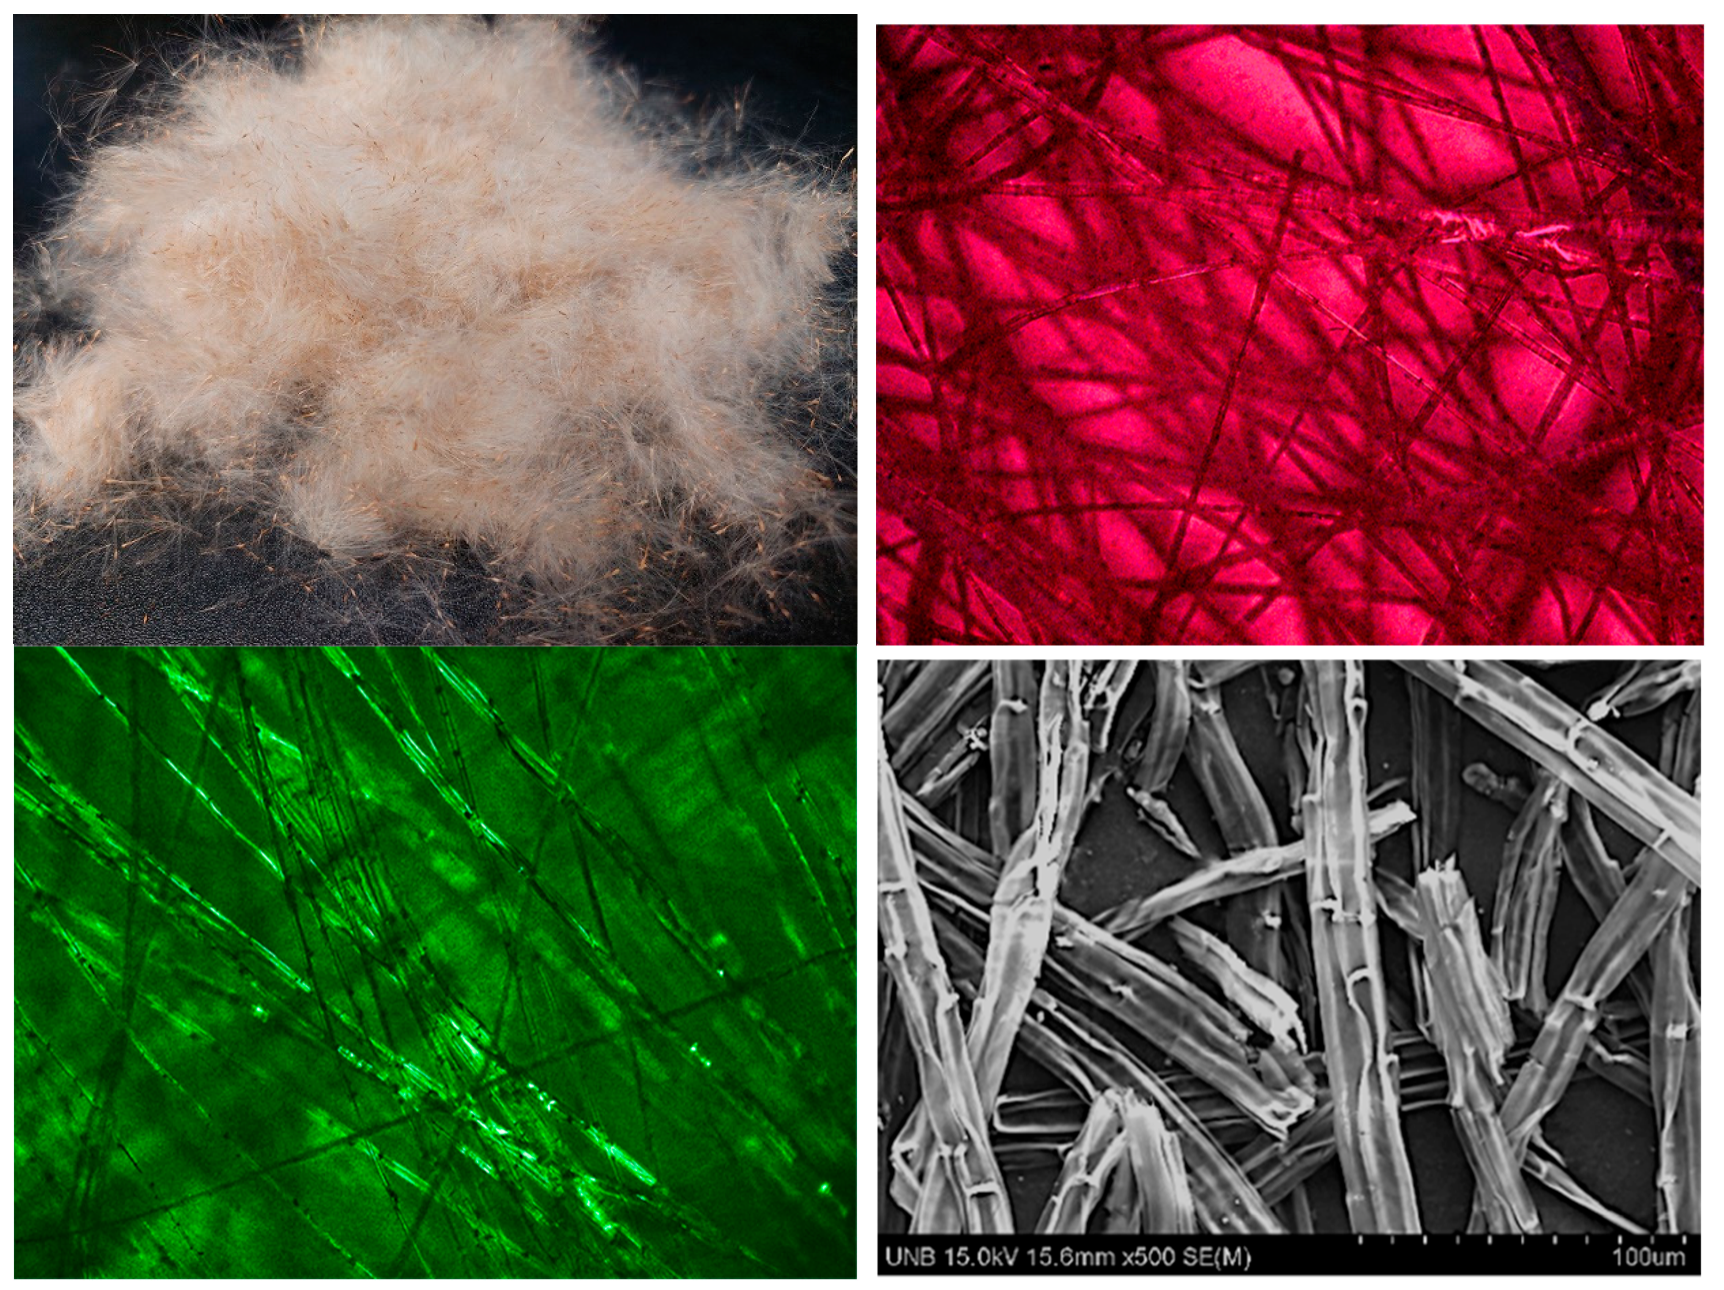
Figure 4a displays a picture of CFs fluff obtained after breaking the cattail flower. Figure 4b,c show an optical micrograph under visible light and under cross-polarized light, respectively. The optical microscope image under visible light displays a cluster of CFs with an average diameter of 22.8 mm (± 1.31) and a length of 9.55 mm (± 0.302). The CFs dimensions obtained in this study, agree with the dimensions of CFs reported in the literature [47,56,66,67,68]. The micrograph (Figure 3c) obtained under cross-polarized light allows to observe continuous films of bright white layers of waxy crystals on the surface of the fibers [69], which confirms the hydrophobic nature of CFs. The SEM micrograph (Figure 4d shows that CFs have a hollow structure with a rough surface. Morphology that in prior studies have been referred as a “bamboo-shape structure” [47] (p.28). The hollow structure of these fibers explains the high adsorption and retention capacity of CFs as previously reported [45,47]. The SEM micrograph also displays the waxy film (e.g., bright white layer) covering the surface of the fibers [70].

3.5. Surface Area of CFs and Activated Carbon

The surface area of the CFs and the baseline commercial activated carbon was determined via BET analysis. The BET surface area of the CFs was 0.097 m2/g (±0.037), this average value is within the detection limits of the equipment. Therefore, CFS could be considered as macroporous material with pore diameters greater than 50 nm [71]. The low surface area observed for CFs in this work agrees with the surface area reported for other bio-derived adsorbents, as is the case of Isabel grape bagasse [72]. The reference commercial activated carbon shows a surface area of 488 m2/g, with a pore volume of 0.6921 cm3/g and an average pore diameter of 5.673 nm, thus the baseline activated carbon falls within the “mesoporous” materials with pore widths ranging from 2 to 50 nm [71].

3.6. Sieve Analysis of Microplastic Particles

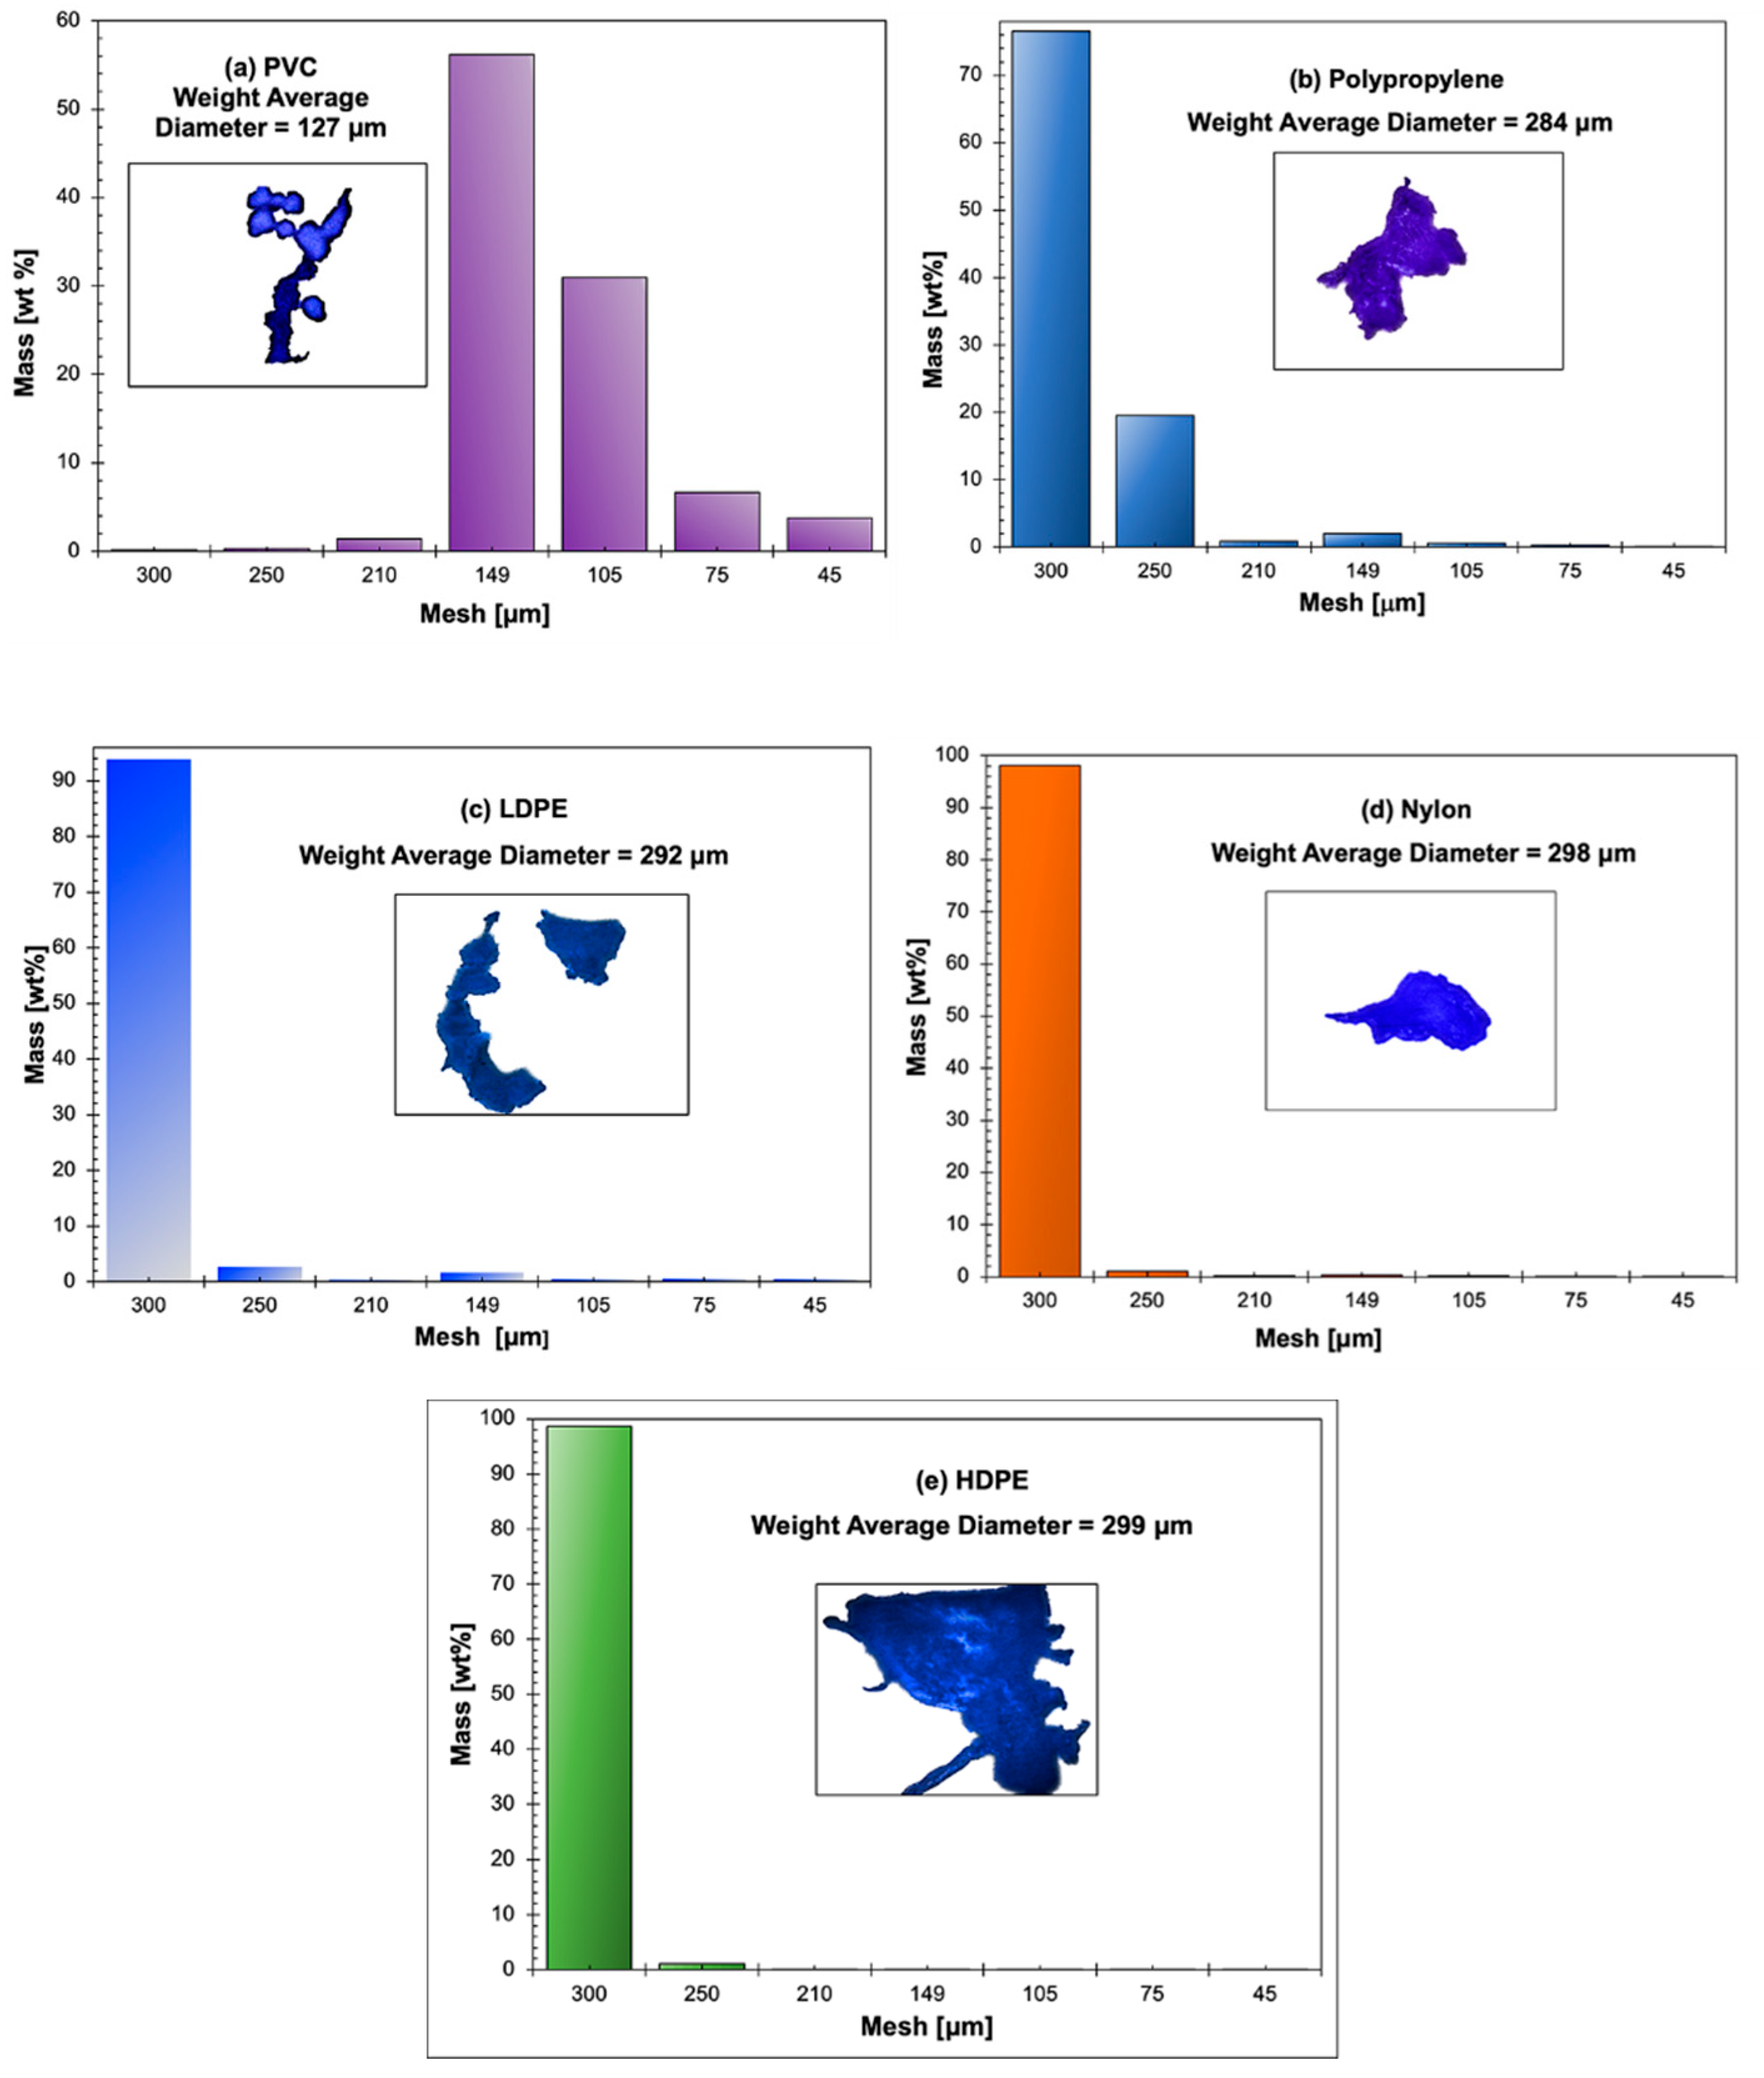
Figure 5a–e display the histograms of the particle size distributions and the weight average diameters of each of the MPPs evaluated in this study. The inserted pictures within the histograms are optical micrographs displaying the morphology of the corresponding MPPs.
Figure 5a–e show that the PVC material is the MPPs displaying the lowest weight average diameter at 127μm, while the other MPPs materials have weight average diameters ranging from 284 μm to 299 μm.

3.7. Batch Adsorption Tests of MMPs onto CFs

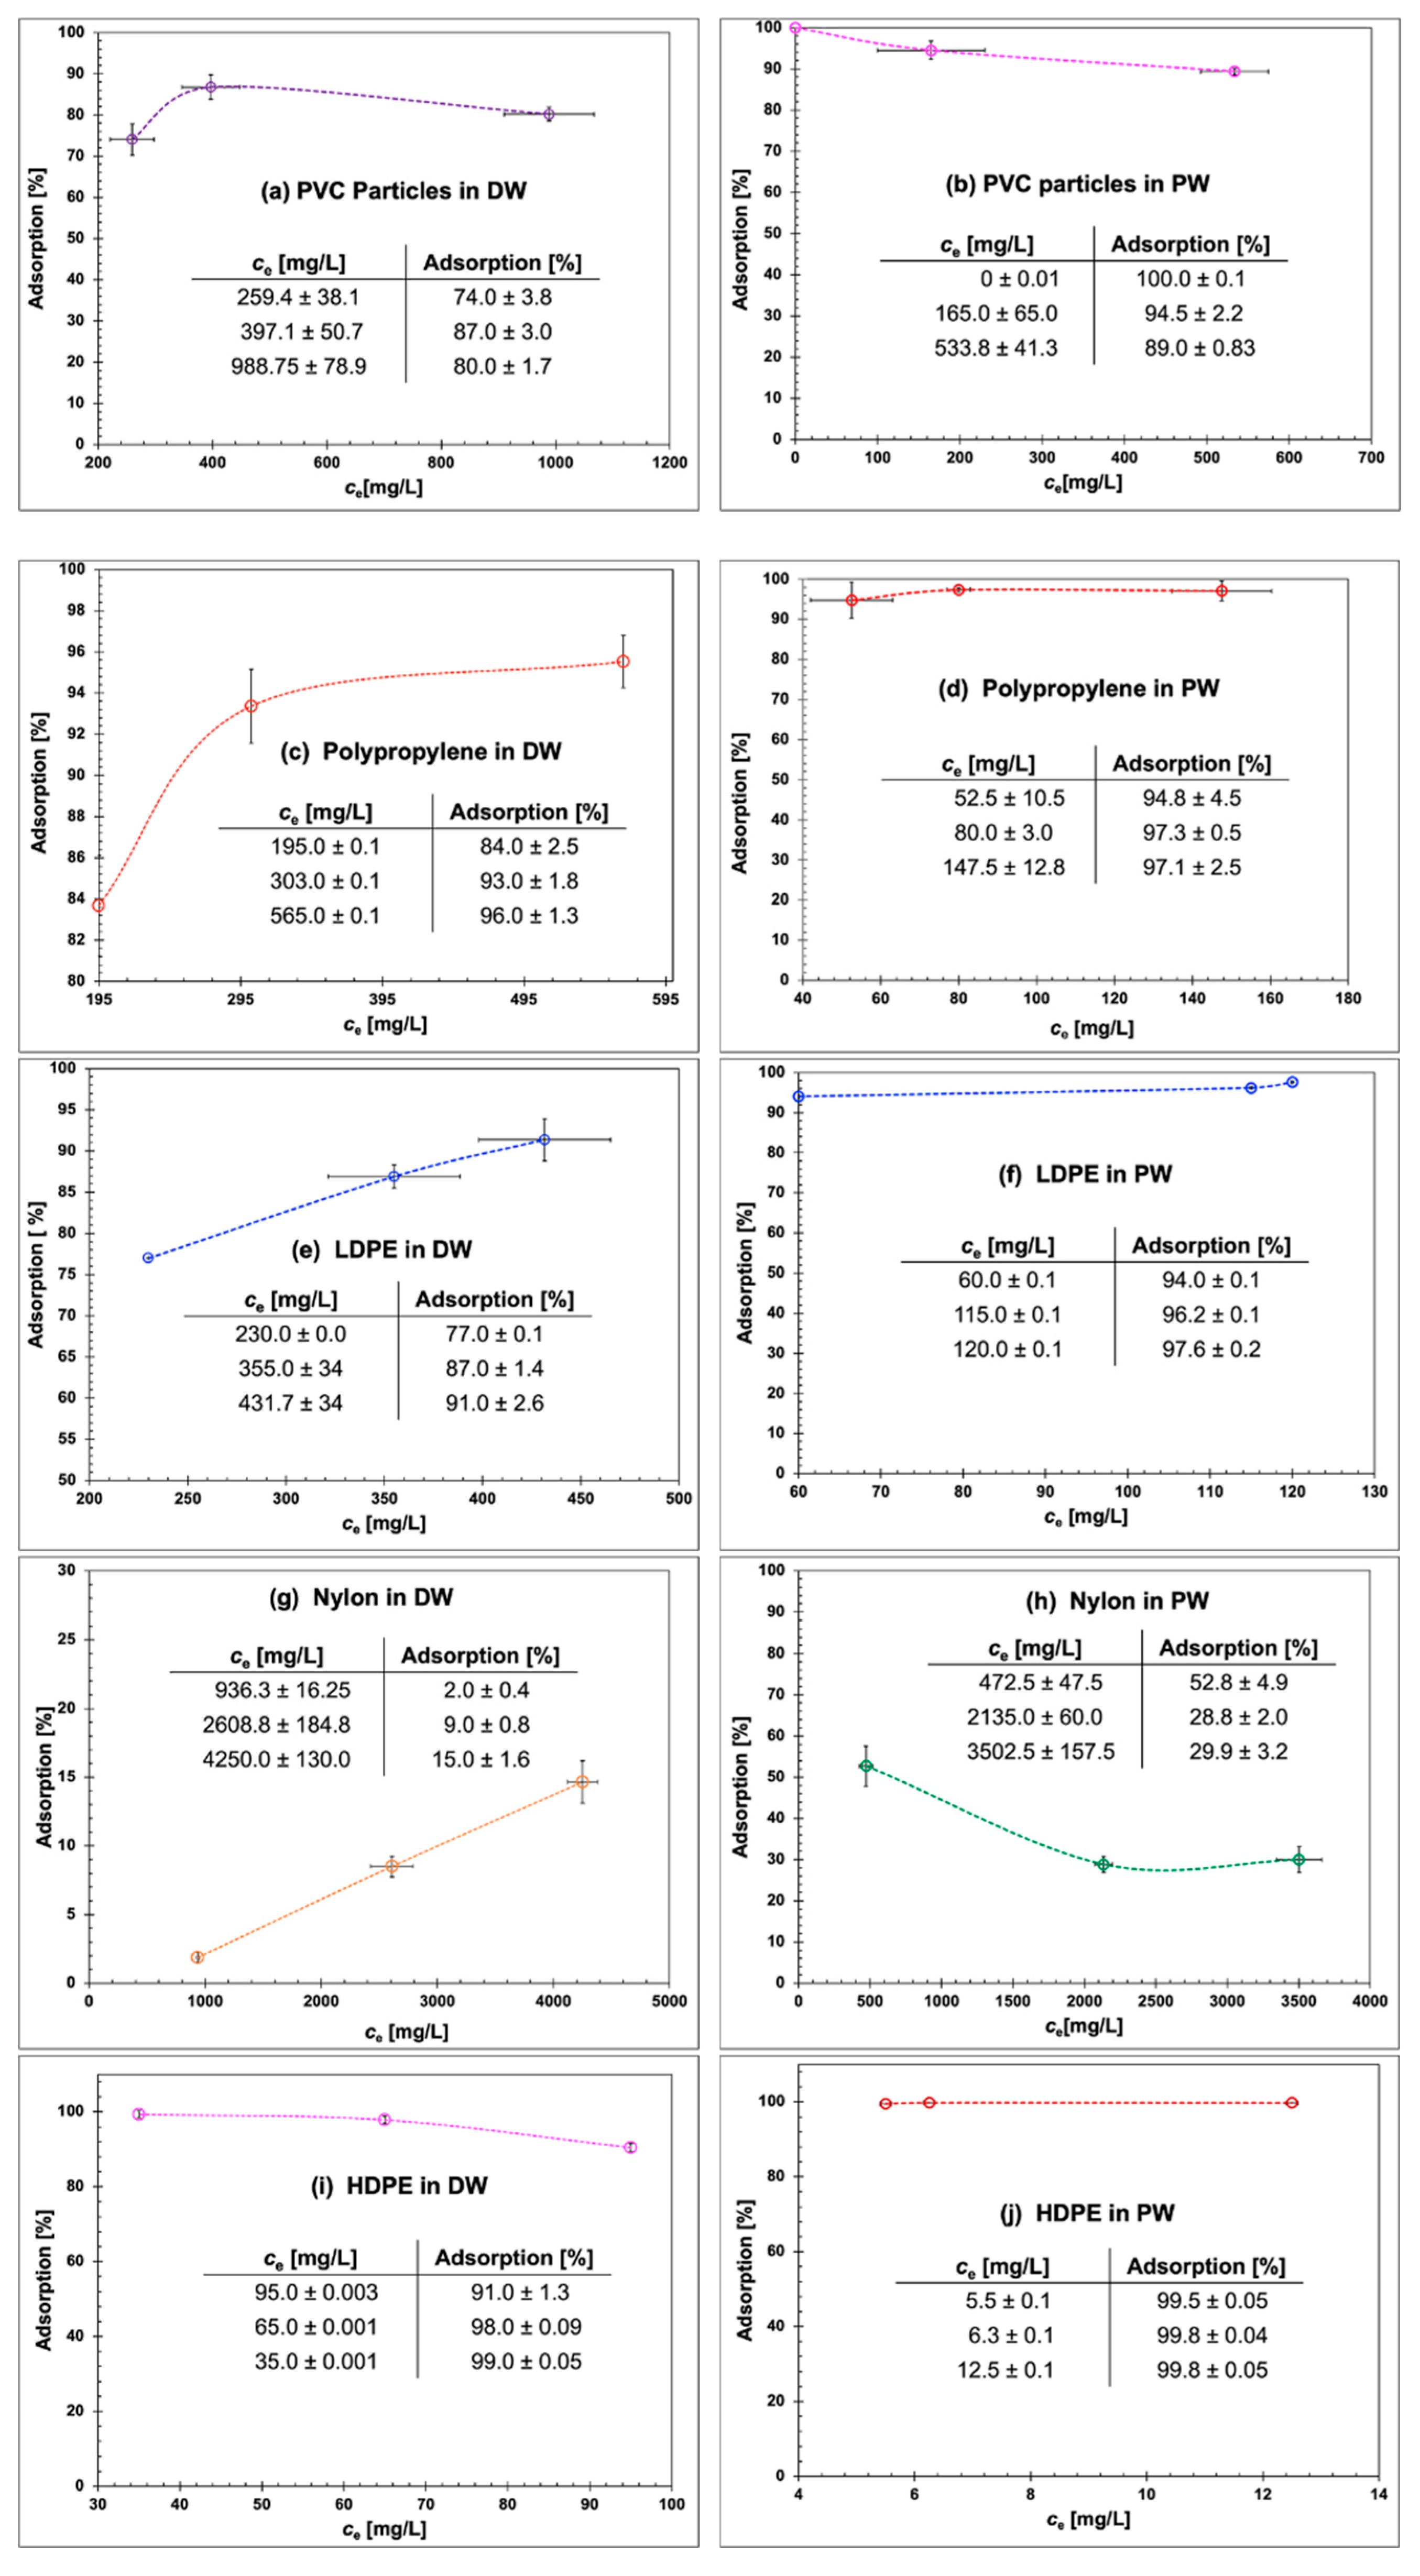
In this study, all the polyolefin MPPs show “spontaneous and instantaneous” adsorption onto the surface of the CFs, except for the polyamide Nylon 6. Figure 6a–j display the adsorption percentage of each of the MPPs onto CFs as a function of the equilibrium concentration (e.g., ce [mg/L]). The mass of CFs during the batch adsorption tests was fixed at 0.3 gr and three concentrations of MPPs in aqueous solutions: 0.1wt%, 0.2wt%, and 0.3wt% were evaluated.
In DW as the adsorption environment, the adsorption of the MPPs tends to increase with the increase in MPPs concentration. The adsorption of MPPs is also a function of the type of plastic material. The percentage of maximum adsorption of MPPs on the surface of CFs decreases in the following order HDPE (99% ± 0.05) > PP (96% ± 1.3) > LDPE (91%±2.6) > PVC (80% ± 1.7) > Nylon 6 (15% ± 1.6). Overall, native CFs are highly efficient in adsorbing these MPPs materials except for the Nylon 6 MPPs, which show the lowest adsorption percentage of 15% ± 1.6.
Figure 7 displays the chemical structures of the plastic materials evaluated in this work. The non-polar nature of PVC, PP, LDPE, and HDPE is well-defined by the chemical structures of these plastics [73,74]. While the chemical structure of Nylon 6 reveals its polarity through the amide group, which interacts with surfaces through hydrogen bonding [75]. Consequently, the low adsorption of Nylon 6 on CFs is explained by the polarity of the Nylon 6 chemical structure (Figure 7(d)). Nylon contains numerous amine and acid functional groups [76,77], which decrease its affinity toward the hydrophobic surface of CFs. The adsorption behavior of Nylon 6 is in agreement with its measured contact angle at θ = 68.5° ± 5.5 (Section 3.3), indicating that Nylon 6 is less hydrophobic than the other plastic materials evaluated in this work.
In PW as the adsorption environment, the presence of crude oil in the aqueous solution at a concentration of 105 ppm, aids the adsorption of MPPs onto the CFs. Control tests were performed to evaluate the adsorption of the crude oil contained in the PW on the surface of the CFs. These control tests demonstrated that the crude oil is completely adsorbed onto the CFs. Therefore, prior to the quantification of the percentage of the MPPs adsorbed onto the CFs in PW, the amount of oil adsorbed onto the fibers was first subtracted. This allowed the independent quantification of the percentage of MPPs adsorbed onto the CFs. As previously indicated, the percentage of adsorption of all the MPPs significantly increased (e.g., > 10% adsorption increase) in the presence of crude oil, which indicates that the crude oil accelerates the adsorption of MPPs onto the surface of CFs (Figure 6(b),(d),(f),(h), and (j). For instance, the maximum % adsorption of Nylon 6 increased from 15% ± 1.6 to 29.9 ± 3.2 (Figure 6g,h), which is almost a 50% of adsorption increase.

3.8. Adsorption Mechanism of MPPs onto the CFs Surface

The batch adsorption experiments show that the adsorption process of non-polar MPPs onto CFs is spontaneous and instantaneous, thus the active adsorption sites on the natural fiber are rapidly occupied by the non-polar MPPs. The increase of MPPs concentration also increases the adsorption percentage to a limiting value that might be caused by steric hindrance among the absorbed MPPs. This experimental observation suggests the existence of strong hydrophobic interactions between the non-polar (e.g., HDPE, PP, LDPE, and PVC) plastic surfaces [26,40,74] and the hydrophobic “waxy” film on the CFs surface as verified via FTIR (Section 3.1). As explained by [78] (p. 2711) “…the attractive force results from the increased dynamic structuring of water in the vicinity of nonpolar species incapable of hydrogen bonding with water... [that] … leads to a large interfacial energy and a consequent thermodynamic driving force to reduce the total amount of structured water. This is accomplished by bringing the nonpolar surfaces into contact, thereby eliminating water-nonpolar interfaces” [78]. Consequently, the strong interaction among the non-polar MPPs and the CFs is driven by nonelectrostatic interactions [79]. This hydrophobic effect is the result of “… strong attractive force between nonpolar species interacting across an aqueous medium… [that] is related to the low solubility of nonpolar species in water…” [78] (P. 2722-2712). This hydrophobic effect was experimentally demonstrated by the fact that the adsorption of Nylon 6, which is intrinsically polar [80], onto the waxy surface of CFs was substantially negligible compared to the adsorption behaviour of the other non-polar MPPs. As Figure 6(g) shows, the maximum % adsorption of Nylon 6 onto the CFs surface was 15% ± 1.6 (Figure 6(g)) in distilled water as the adsorption environment. The driving force for the interaction of this polyamide with the CFs might be through hydrogen bonding among the polymer amide groups and the oxygen-containing functional groups (e.g., hydroxy and/or carboxylic acid) on the CFs surface [81] as indicated the FTIR analysis (Section 3.1). However, the occurrence of these interactions seems minimum as demonstrated by the insignificant adsorption behavior of Nylon 6 MPPs onto CFs.
The adsorption behavior of the MPPs was evidently affected by the composition of the aqueous media. Industrial produced water (PW) from oil and gas recovery operations contains free and disperse crude oil, dissolved organic compounds, salts, sulfates, nitrates, and suspended sand particles [82], among others. It is well established that “…the surrounding chemical environment affects hydrophobic interactions. [Therefore,] the presence of various additives in solution [for example] dissolved salt ions affect the solubility and interactions of hydrophobic species in water” [83] (p. 278). Consequently, it is possible to regulate the adsorption process by changing the composition of the aqueous media and/or “binding environment” [79]. Furthermore, the addition of lyophobic components to the “binding environment enhances the adsorption rates onto hydrophobic surfaces “…at the level of both fluid-phase [adsorbate] transport and [adsorbate] binding to the surface” [78[ (p. 2718).
In this work, the crude oil contained in the PW acts as a lyophobic component that markedly enhances the adsorption rates of the MPPs onto the waxy surface of the CFs (Figure 6 (a) to (j)). In this case, the crude oil in the PW “…changes the state of hydration of the surface and the [MPPs]. The dehydration of hydrophobic areas resulting from binding and the entropy gain associated with it, lower the Gibbs energy of the system, driving the adsorption process” [79] (p. 6356-6359).
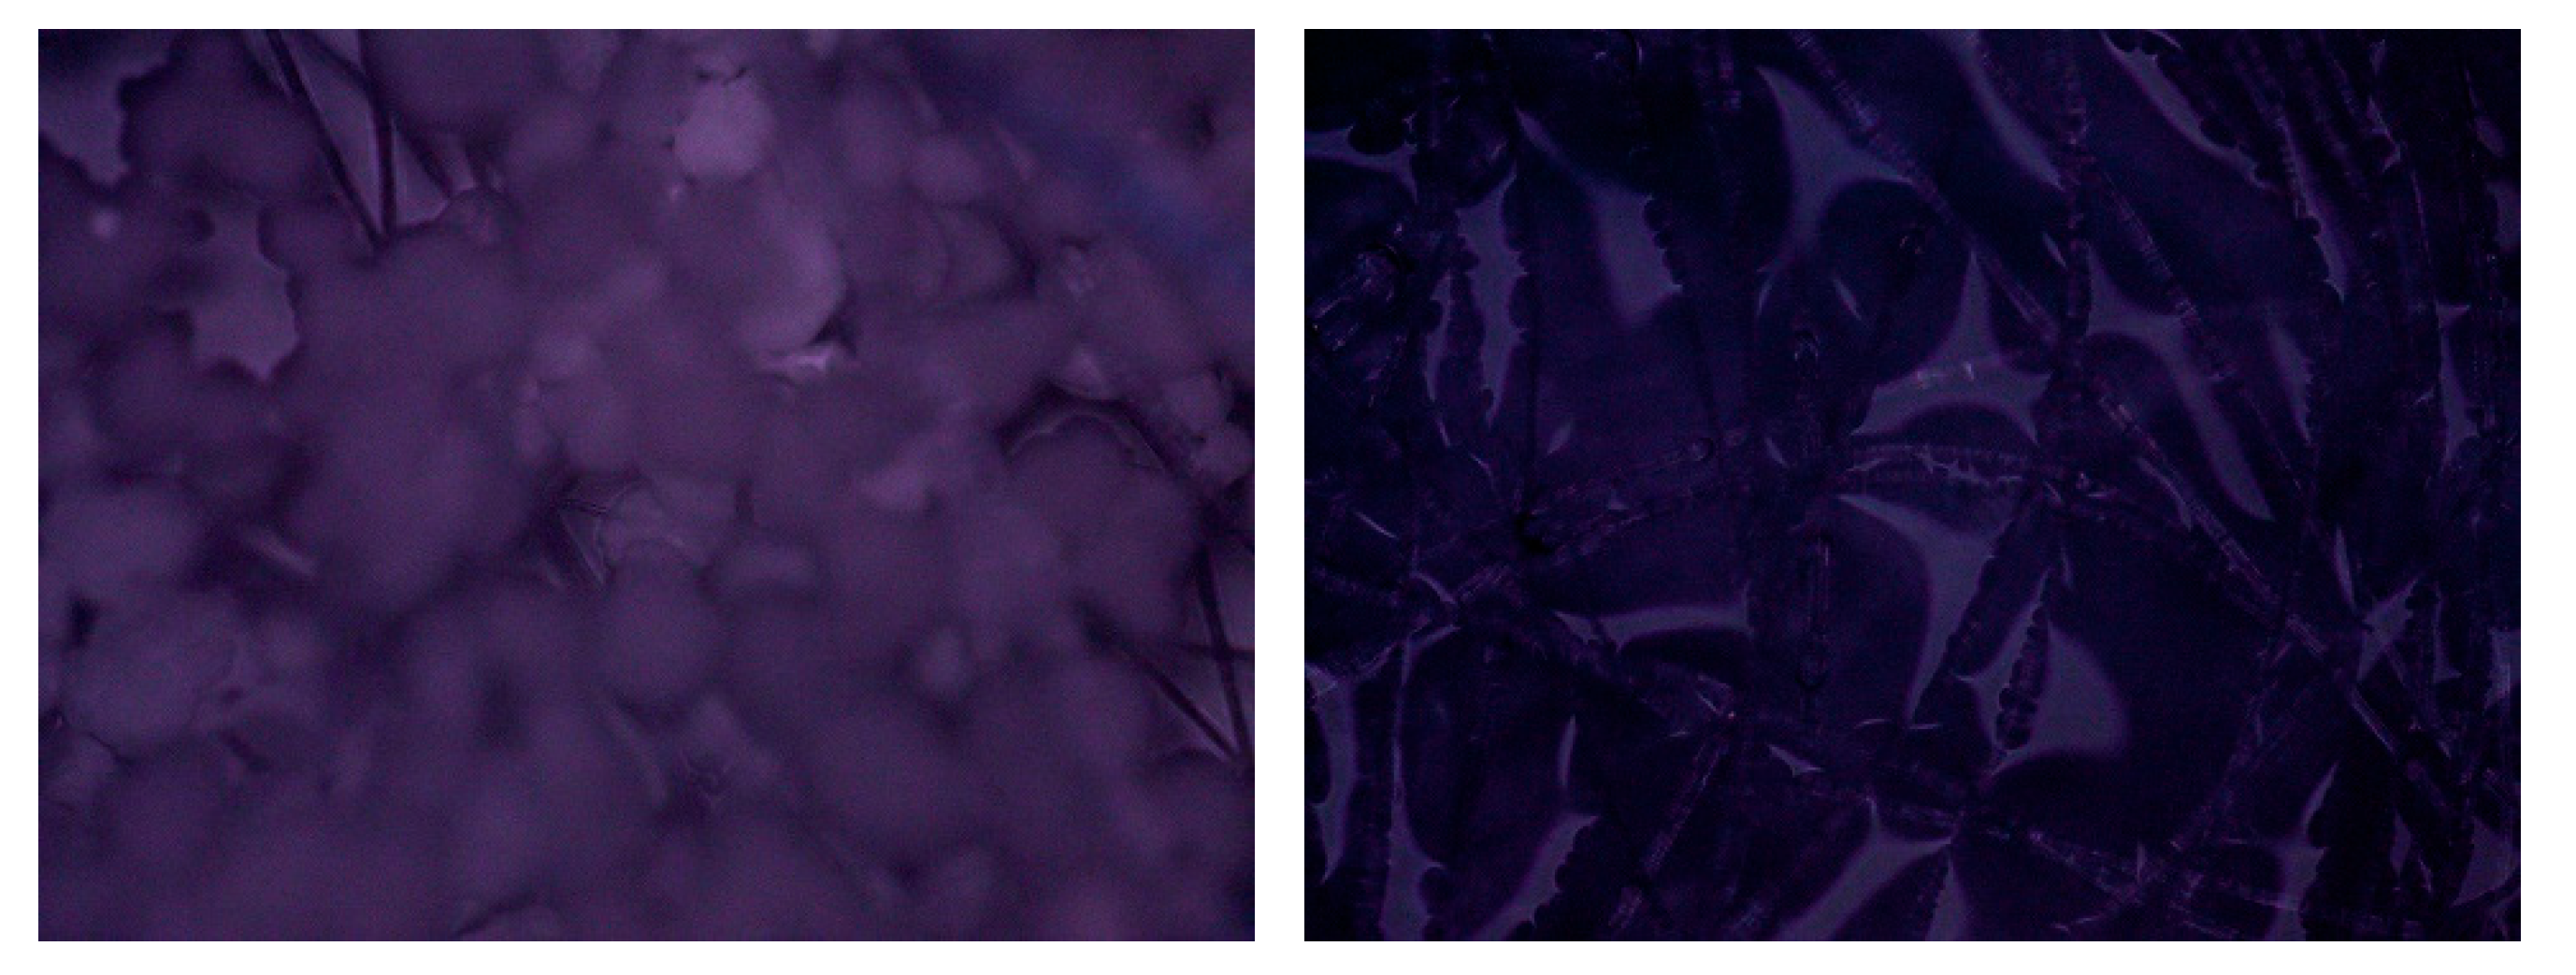
Figure 8 displays micrographs of PVC (Adsorption environment: distilled water) and HDPE (Adsorption environment: PW) MPPs adsorbed onto the surface of CFs. These images clearly show the firm “attachment” of the MPPs onto the CFs. In the case of PVC, in which the adsorption media was distilled water, the PVC microparticles appear as cotton balls adsorbed onto CFs. In contrast, the adsorption media for HDPE in this picture was PW, thus the originally white HDPE microparticles appear darker on this image, which indicates that the microplastic particles were covered by a very thin layer of crude oil.
The adsorption of microplastic particles onto the reference adsorbent activated carbon was also evaluated in this work. The experimental observations indicated that the MPPs did not adsorbed onto activated carbon, as has been demonstrated by previous research, in which activated carbon filtration systems have shown to be ineffective in adsorbing MPPs [24]. On the contrary, some particles of activated carbon were adsorbed onto the microplastic particles surface. These observations demonstrate the capacity of MPPs to function as carriers and/or vectors for the transport of hydrophobic compounds in water bodies (e.g., toxic organic compounds) as has been reported in the literature [84,85]. Figure 9 displays a micrograph that shows activated carbon adsorbed onto the surface of polypropylene (PP) MPPs.

4. Conclusions

This exploratory research demonstrates the effective adsorption of several MPPs materials onto the CFs surface. In distilled water, as the adsorption environment, the adsorption of MPPs ranged from 74 % to 99% for PVC, PP, LDPE, and HDPE. In Distilled water, the maximum adsorption of Nylon 6 was 15%. The low adsorption of Nylon 6 on the CFs surface is attributed to its polarity, which prevents its adsorption onto the hydrophobic surface of the CFs. However, it was established that modifying the adsorption environment through the addition of a lyophobic components (e.g., crude oil contained in the produced water, PW) to the adsorption media, the rate of adsorption of MPPs on the hydrophobic surface of the CFs was significantly enhanced. In PW, the adsorption percentage ranged from 89% to 100% for PVC, PP, LDPE, and HDPE. The adsorption of Nylon 6 increased to 29.9%, which corresponds to an adsorption enhancement of 50%. These experimental observations indicate that hydrophobic interactions drive the “spontaneous and instantaneous” adsorption process. It was also confirmed that it is possible to modify the adsorption environment by adding lyophobic components to effectively increase the adsorption rate of MPPs onto the CFs without increasing the mass of bio-adsorbent. Indirectly, this exploratory study also demonstrated the capacity of MPPs to function as carriers and/or vectors of hydrophobic compounds in water bodies. The inefficiency of activated carbon in removing MPPs from wastewater was also verified.
The outcome of this research demonstrates the important role that bio-substrates could play in the reduction and control of the environmental pollution caused by micro- and nanoplastic particles. Native cattail fibers show to be efficient, sustainable, low cost, and reliable hydrophobic bio-adsorbents.

Acknowledgement

The authors wish to acknowledge Dr. Kyle Rogers, Chemical Engineering Department, University of New Brunswick for his contributions in obtained the FTIR spectrum and the TGA analysis of the Cattail Fibers. The financial support of the University of New Brunswick through the University Research Fund is also recognized.

References

  1. Our Planet is choking on plastic. UN Environment Programme. Available online: https://www.unep.org/interactives/beat-plastic-pollution/?gad_source=1&gclid=EAIaIQobChMI-Yf4r5ehhAMVf2lHAR0ldQeREAAYASAAEgIN3_D_BwE. (accessed on February 10 2024).
  2. Kang, H.; Washington, A.; Capobianco, MD.; Yan, X.; Cruz, VV.; Weed, M.; Johnson, J.; Johns III, G.; Brudvig, GW.; Pan, X.; Gu, J. Concentration-Dependent Photocatalytic Upcycling of Poly (ethylene terephthalate) Plastic Waste. ACS Mater. Lett. 2023, 5, 3032–41. [Google Scholar] [CrossRef] [PubMed]
  3. Li, C.; Kong, XY.; Lyu, M.; Tay, XT.; Đokić, M.; Chin, KF.; Yang, CT.; Lee, EK.; Zhang, J.; Tham, CY.; Chan, WX. Upcycling of non-biodegradable plastics by base metal photocatalysis. Chem. 2023, 9, 2683–700. [Google Scholar] [CrossRef]
  4. Ali, I.; Ding, T.; Peng, C.; Naz, I.; Sun, H.; Li, J.; Liu, J. Micro-and nanoplastics in wastewater treatment plants: occurrence, removal, fate, impacts and remediation technologies–a critical review. Chem. Eng. J. 2021, 130205. [Google Scholar] [CrossRef]
  5. Mohana, AA.; Farhad, SM.; Haque, N.; Pramanik, BK. Understanding the fate of nano-plastics in wastewater treatment plants and their removal using membrane processes. Chemosphere. 2021, 284, 31430. [Google Scholar] [CrossRef]
  6. Cao, R.; Xiao, D.; Wang, M.; Gao, Y.; Ma, D. Solar-driven photocatalysis for recycling and upcycling plastics. Appl. Catal. B. 2024, 341, 123357. [Google Scholar] [CrossRef]
  7. Briassoulis, D. Agricultural plastics as a potential threat to food security, health, and environment through soil pollution by microplastics: Problem definition. Sci. Total Environ. 2023, 892, 164533, (1-31). [Google Scholar] [CrossRef]
  8. Pramanik, BK.; Pramanik, SK.; Monira, S. Understanding the fragmentation of microplastics into nano-plastics and removal of nano/microplastics from wastewater using membrane, air flotation and nano-ferrofluid processes. Chemosphere. 2021, 282, 131053. [Google Scholar] [CrossRef]
  9. Chen, Z.; Liu, X.; Wei, W.; Chen, H; Ni, BJ. Removal of microplastics and nanoplastics from urban waters: separation and degradation. Water Research 2022, 221, 118820. [Google Scholar] [CrossRef]
  10. Anderson, JC.; et., al. Microplastics. Environ. Pollut. 2016, 218, 269–280. [Google Scholar] [CrossRef]
  11. Zhou, Y.; et. al., Ecotoxicological effects of microplastics. J. Hazard. Mater. 2020, 15, 122273. [Google Scholar] [CrossRef]
  12. Chen, Y.; et., al. Defense responses in earthworms (Eisenia fetida) exposed to low-density polyethylene microplastics in soils. Ecotoxicol. Environ. Saf 2020, 187, 109–788. [Google Scholar] [CrossRef] [PubMed]
  13. Jiang, X.; et. al. Toxicological effects of polystyrene microplastics on earthworm (Eisenia fetida). Environ. Pollut. 2020, 259, 113896. [Google Scholar] [CrossRef] [PubMed]
  14. Woods, MN.; et., al. al. Effects of microplasti. Mar. Pollut. Bull. 2020, 157, 111280. [Google Scholar] [CrossRef] [PubMed]
  15. Sierra, I.; et. al. Identification of microplastics in wastewater. Environ. Sci. Pollut. Res. 2020, 27, 7409–19. [Google Scholar] [CrossRef]
  16. Rodríguez-Seijo, A.; et., al. Low-density polyethylene microplastics. Environ. Chem. 2019, 2019. 16, 8–17. [Google Scholar] [CrossRef]
  17. De Falco, F.; et., al. The contribution of washing processes of synthetic clothes to microplastic pollution. Sci. Rep., 2019, 9, 1–6633. [Google Scholar] [CrossRef]
  18. Wang, J.; et., al. Negligible effects of microplastics. Environ. Pollut. 2019, 249, 776–84. [Google Scholar] [CrossRef] [PubMed]
  19. Maes, T.; et., al. A rapid-screening approach to detect and quantify microplastics. Sci. Rep. 2017, 7, 44501. [Google Scholar] [CrossRef]
  20. Huntington, A.; et., al. A first assessment of microplastics and other anthropogenic. FACETS. 2020, 5, 615–6. [Google Scholar] [CrossRef]
  21. Mintenig, SM. ; Low numbers of microplastics detected in drinking water from ground water sources. Sci. Total Environ. 2019, 631–5. [Google Scholar] [CrossRef]
  22. Sutton, R.; et., al. Microplastic contamination. Mar. Pollut. Bull. 2016, 109, 230–5. [Google Scholar]
  23. Magnusson, K.; Norén, F. Screening of microplastic particles; Swedish Environmental Research Institute: Stockholm, Sweden, 2014. [Google Scholar]
  24. Rout, PR.; Mohanty, A.; Sharma, A.; Miglani, M.; Liu, D.; Varjani, S. Micro-and nanoplastics removal mechanisms in wastewater treatment plants: A review. J. Hazard. Mater. Adv. 2022, 6, p100070. [Google Scholar] [CrossRef]
  25. Murray, A.; Örmeci, B. Removal effectiveness of nanoplastics (< 400 nm) with separation processes used for water and wastewater treatment. Water. 2020, 12, 635. [Google Scholar]
  26. Jiang, Y.; Zhang, H.; Hong, L.; Shao, J.; Zhang, B.; Yu, J.; Chu, S. An integrated plasma-photocatalytic system for upcycling of polyolefin plastic. ChemSusChem. 2023, 28, e202300106. [Google Scholar] [CrossRef] [PubMed]
  27. Ziajahromi, S.; et., al. Wastewater treatment plants as a pathway for microplastics. Water Res. 2017, 112, 93–9. [Google Scholar] [CrossRef] [PubMed]
  28. Liu, Y. et. al. A type of thiophene-bridged silica aerogel with a high adsorption capacity. Inorg. Chem. Front. 2018, 5, 1894–1901. [Google Scholar] [CrossRef]
  29. Snyder, SA.; et., al. Pharmaceuticals, personal care products, and endocrine disruptors in water. Environ. Eng. Sci. 2003, 20, 449–69. [Google Scholar] [CrossRef]
  30. Kasprzyk-Hordern, B.; et., al. The occurrence of pharmaceuticals in South Wales. UK. Water Res 2008, 42, 3498–518. [Google Scholar] [CrossRef]
  31. NilsNilsen, E.; et., al. Grand challenges in assessing the adverse effects of contaminants. Environ. Toxicol. Chem. 2019, 38, 46–60. [Google Scholar] [CrossRef]
  32. Kim., SD.; et., al. Occurrence and removal of pharmaceuticals and endocrine disruptors. Water Res. 2007, 41, 1013–21. [Google Scholar] [CrossRef]
  33. Chowdhury, SR.; Razzak, SA.; Hassan, I.; Hossain, MM. Microplastics in Freshwater and Drinking Water: Sources, Impacts, Detection, and Removal Strategies. Water, Air, Soil Pollut. 2023, 234, 673. [Google Scholar] [CrossRef]
  34. Ansari, SA.; et., al. Cauliflower leave, an agricultural waste biomass adsorbent, and its application for the removal of MB dye. Int. J. Anal. Chem 2016, 1–10. [Google Scholar] [CrossRef]
  35. Bedia, J.; et., al. A review on the synthesis and characterization of biomass-derived carbons. C 2018, 4, 1–53. [Google Scholar]
  36. Reddy, N.; Yang, Y. Properties and potential applications of natural cellulose fibers from cornhusks. Green Chem. 2005, 7, 190–5. [Google Scholar] [CrossRef]
  37. van Dam, JE. Natural fibres and the environment: environmental benefits of natural fibre production and use. In Proceedings of the Symposium on Natural Fibres, Rome, Italy; 2008; pp. 3–17. [Google Scholar]
  38. Fernández, V.; Khayet, M. Evaluation of the surface free energy of plant surfaces: toward standardizing the procedure. Front. Plant Sci. 2015, 6, 510. [Google Scholar] [CrossRef] [PubMed]
  39. Ran, J.; Talebian-Kiakalaieh, A.; Zhang, S.; Hashem, E.; Guo, M.; Qiao, S. Recent advancement on photocatalytic plastic upcycling. Chem. Sci. 2024, 15, 1611–1637. [Google Scholar] [CrossRef] [PubMed]
  40. Wang, L.; Jiang, S.; Gui, W.; Li, H.; Wu, J.; Wang, H.; Yang, J. Photocatalytic Upcycling of Plastic Waste: Mechanism, Integrating Modus, and Selectivity. vSmall Struct. 2023, 4, 2300142, (1 of 12). [Google Scholar] [CrossRef]
  41. Banik, H. Selected properties of cattail fibre for biomedical applications. MScE Thesis, . Department of Biosystems Engineering University of Manitoba. Winnipeg, Manitoba, Canada, 2022. [Google Scholar]
  42. Chakma, K.; Cicek, N.; Rahman, M. Characterization of cattail fibre chemical groups by Fourier-Transform infrared Spectroscopy (FTIR). Manitoba Institute of Materials (MIM) Annual Conference. University of Manitoba Winnipeg, Canada, 2018.
  43. Barragán, EU.; Guerrero, CF.; Zamudio, AM.; Cepeda, AB.; Heinze, T.; Koschella, A. Isolation of cellulose nanocrystals from Typha domingensis named southern cattail using a batch reactor. Fibers Polym. 2019, 20, 1136–44. [Google Scholar] [CrossRef]
  44. Nandiyanto, AB.; Oktiani, R; Ragadhita, R. How to read and interpret FTIR spectroscope of organic material. Indonesian Journal of Science and Technology. 2019, 7, 97–118. [Google Scholar] [CrossRef]
  45. Cao, S.; Dong, T.; Xu, G.; Wang, F. Study on structure and wetting characteristic of cattail fibers as natural materials for oil sorption. Environ. Technol. 2016, 16, 37, Paper No. UM-BIOE 4240-18/19-163193-9. [Google Scholar] [CrossRef]
  46. Bhuiyan, Z. The effect of scouring on cattail fibre properties for biomedical applications; Biosystems Engineering, University of Manitoba.: Winnipeg, Manitoba, Canada, 2019. [Google Scholar]
  47. Dong, T.; X, G.; Wang, F. Oil spill cleanup by structured natural sorbents made from cattail fibers. Ind. Crops Prod. 2015, 76, 25–33. [Google Scholar] [CrossRef]
  48. Cui, F.; Li, H.; Chen, C.; Wang, Z.; Liu, X.; Jiang, G.; Cheng, T.; Bai, R.; Song, L. Cattail fibers as source of cellulose to prepare a novel type of composite aerogel adsorbent for the removal of enrofloxacin in wastewater. Int. J. Biol. Macromol. 2021, 191, 171–81. [Google Scholar] [CrossRef] [PubMed]
  49. Wu, S.; Zhang. J.; Li, C.; Wang, F.; Shi, L.; Tao, M.; Weng, B.; Yan, B.; Guo, Y.; Chen, Y. Characterization of potential cellulose fiber from cattail fiber: A study on micro/nano structure and other properties. Int. J. Biol. Macromol. 2021, 193, 27–37. [Google Scholar] [CrossRef] [PubMed]
  50. Kamali Moghaddam, M. Typha leaves fiber and its composites: A review. J. Nat. Fibers. 2022, 19, 4993–5007. [Google Scholar] [CrossRef]
  51. —. Structural and thermal properties of cellulose microfiber isolated from Typha australis by sequential alkali-oxidative treatment. J. Nat. Fibers. 2022, 19, 10526–38. [Google Scholar] [CrossRef]
  52. Guechi, E.; Benabdesselam, S. Removal of cadmium and copper from aqueous media by biosorption on cattail (Typha angustifolia) leaves: Kinetic and isotherm studies. Water Treat. Desalin. 2020, 173, 367–82. [Google Scholar] [CrossRef]
  53. MacFarlane, DR.; Kar, M.; Pringle, JM. Fundamentals of ionic liquids: from chemistry to applications; John Wiley & Sons, 2017. [Google Scholar]
  54. Al-Hakkak, JS.; Barbooti, MM. Thermogravimetric study on typha (Typha angustifolia L.). J. Therm. Anal. 1989, 35, 815–21. [Google Scholar] [CrossRef]
  55. Sebio-Punal, T.; Naya, S.; López-Beceiro, J.; Tarrío-Saavedra, J.; Artiaga, R. Thermogravimetric analysis of wood, holocellulose, and lignin from five wood species. J. Therm. Anal. Calorim. 2012, 109, 1163–7. [Google Scholar] [CrossRef]
  56. Chakma, K.; Cicek, N.; Rahman, M. Fiber extraction efficiency, quality and characterization of cattail fibres for textile applications; Canadian Society for Bioengineering Conference (CSBE): Winnipeg, Canada, 2017. [Google Scholar]
  57. Ifelebuegu, AO.; Johnson, A. Nonconventional low-cost cellulose-and keratin-based biopolymeric sorbents for oil/water separation and spill cleanup: A review. Crit. Rev. Environ. Sci. Technol. 2017, 47, 964–1001. [Google Scholar] [CrossRef]
  58. Schellbach, SL.; Monteiro, SN.; Drelich, JW. A novel method for contact angle measurements on natural fibers. Mater. Lett. 2016, 164, 599–604. [Google Scholar] [CrossRef]
  59. Accu Dyne Test ™. Critical Surface Tension and Contact Angle with Water for Various Polymers. Available online: https://www.accudynetest.com/polytable_03.html?sortby=contact_angle (accessed on 27 February 2024).
  60. De Luna, MS.; Galizia, M.; Wojnarowicz, J.; Rosa, R.; Lojkowski, W.; Leonelli, C.; Ancierno, D.; Filippone, G. Dispersing hydrophilic nanoparticles in hydrophobic polymers: HDPE/ZnO nanocomposites by a novel template-based apprach. eXPRESS Polym. Lett. 2014, 8, 362–72. [Google Scholar] [CrossRef]
  61. Siddiqa, AJ.; Chaudhury, K.; Adhikari, B. Hydrophilic low density polyethylene (LDPE) films for cell adhesion and proliferation. Res. Rev. J. Med. Chem. 2005, 1, 43–54. [Google Scholar]
  62. Nieto, DR.; Santese, F.; Toth, R.; Posocco, P.; Pricl, S.; Fermeglia, M. Simple, fast, and accurate in silico estimations of contact angle, surface tension, and work of adhesion of water and oil nanodroplets on amorphous polypropylene surfaces. ACS Appl. Mater. Interfaces. 2012, 6, 2855–9. [Google Scholar] [CrossRef] [PubMed]
  63. Sant’Ana, PL.; Bortoleto, JR.; Drrant, SF. Contact Angle and Wettability of Commercial Polymers after Plasma Treatment. LJP. 2022, 22, 13–33. [Google Scholar]
  64. Pesonen-Leinonen, E. ; Determination of Cleanability of Plastic Surfaces. Academic Dissertation, . Faculty of Agriculture and Forestry, University of Helsinki, 2005; pp. 1–67.
  65. Biolin Scientific. Attension. Technology Note 7. Influence of surface roughness on contact angle and wettability. Available online: https://www.biolinscientific.com (accessed on 27 February 2024).
  66. Rahman, M.; Cicek, N.; Chakma, K. The optimum parameters for fibre yield (%) and characterization of Typha latifolia L. fibres for textile applications. Fibers Polym. 2021, 22, 1543–55. [Google Scholar] [CrossRef]
  67. Seo, YB.; Lee, MW. Use of non-wood fibres (from cattails and red algae) and their effects on paper opacity. Appita. 2011, 64, 5–445. [Google Scholar]
  68. Wong, C.; McGowan, T.; Bajwa, SG.; Bajwa, DS. Impact of fiber treatment on the oil absorption characteristics of plant fibers. BioResources. 2016, 11, 6452–63. [Google Scholar] [CrossRef]
  69. Wang, H.; Liu, C.; Shen, R.; Gao, J.; Li, J. An efficient approach to prepare water-redispersible starch nanocrystals from waxy potato starch. Polymers. 2021, 13, 1–15. [Google Scholar] [CrossRef]
  70. Senthamaraikannan, P.; Kathiresan, M. Characterization of raw and alkali treated new natural cellulosic fiber from Coccinia grandis. Carbohydr. Polym. 2018, 186, 332–43. [Google Scholar] [CrossRef]
  71. Mays, TJ. A new classification of pore sizes. Stud. Surf. Sci. Catal. 2007, 160, (Characterization of Porous Solids VII), 57–62. [Google Scholar]
  72. Vinayagam, V.; Murugan, S.; Kumaresan, R.; Narayanan, M.; Sillanpää, M.; Dai Viet, NV.; Kushwaha, OS.; Jenis, P.; Potdar, P.; Gadiya, S. Sustainable adsorbents for the removal of pharmaceuticals from wastewater: A review. Chemosphere. 2022, 134597. [Google Scholar] [CrossRef] [PubMed]
  73. Lampman, S.; Bonnie Sanders, B.; Hrivnak, N.; Kinson, J.; Polakowski, C. Characterization and failure analysis of plastics: ASM International; ASM International,: 2003.
  74. Kent, R. Energy management in plastics processing: strategies, targets, techniques, and tools; Elsevier: 2018.
  75. Chackalamannil, S.; Rotella, D.; Ward, S. Comprehensive medicinal chemistry III; Elsevier, 2017. [Google Scholar]
  76. Letcher, TM. Storing energy: with special reference to renewable energy sources; Elsevier, 2022. [Google Scholar]
  77. Godwin, AD.; Kutz, M. Applied plastics engineering handbook; William Andrew Applied Science Publishers, 2017. [Google Scholar]
  78. Tilton, RD.; Robertson, CR.; Gast, AP. Manipulation of hydrophobic interactions in protein adsorption. Langmuir. 1991, 7, 2710–8. [Google Scholar] [CrossRef]
  79. Puddu, V.; Perry, CC. Peptide adsorption on silica nanoparticles: evidence of hydrophobic interactions. ACS nano, 2012, 6, 6356–63. [Google Scholar] [CrossRef]
  80. Baldi, LD.; Lamazaki, ET.; Atvars, TD. Evaluation of the polarity of polyamide surfaces using the fluorescence emission of pyrene. Dyes Pigm. 2008, 76, 669–79. [Google Scholar] [CrossRef]
  81. Guo, S.; Zou, Z.; Chen, Y.; Long, X.; Liu, M.; Li, X.; Tan, J.; Chen, R. Synergistic effect of hydrogen bonding and π-π interaction for enhanced adsorption of rhodamine B from water using corn straw biochar. Environ. Pollut. 2023, 320, 121060. [Google Scholar] [CrossRef] [PubMed]
  82. Arthur, JD.; Langhus, BG.; Patel, C. Technical summary of oil & gas produced water treatment technologies. All Consulting, LLC: Tulsa, OK, 2005. [Google Scholar]
  83. Garde, S. Hydrophobic interactions in context. Nature. 2015, 517, 277–9. [Google Scholar] [CrossRef] [PubMed]
  84. Anastopoulos, I.; Pashalidis, I.; Kayan, B.; Kalderis, D. Microplastics as carriers of hydrophilic pollutants in an aqueous environment. J. Mol. Liq. 2022, 350, 118182. [Google Scholar] [CrossRef]
  85. Rafa, N.; Ahmed, B.; Zohora, F.; Bakya, J.; Ahmed, S.; Ahmed, SF.; Mofijur, M.; Chowdhury, AA.; Almomani, F. Microplastics as carriers of toxic pollutants: Source, transport, and toxicological effects. Environ. Pollut. 2023, 123190. [Google Scholar] [CrossRef]
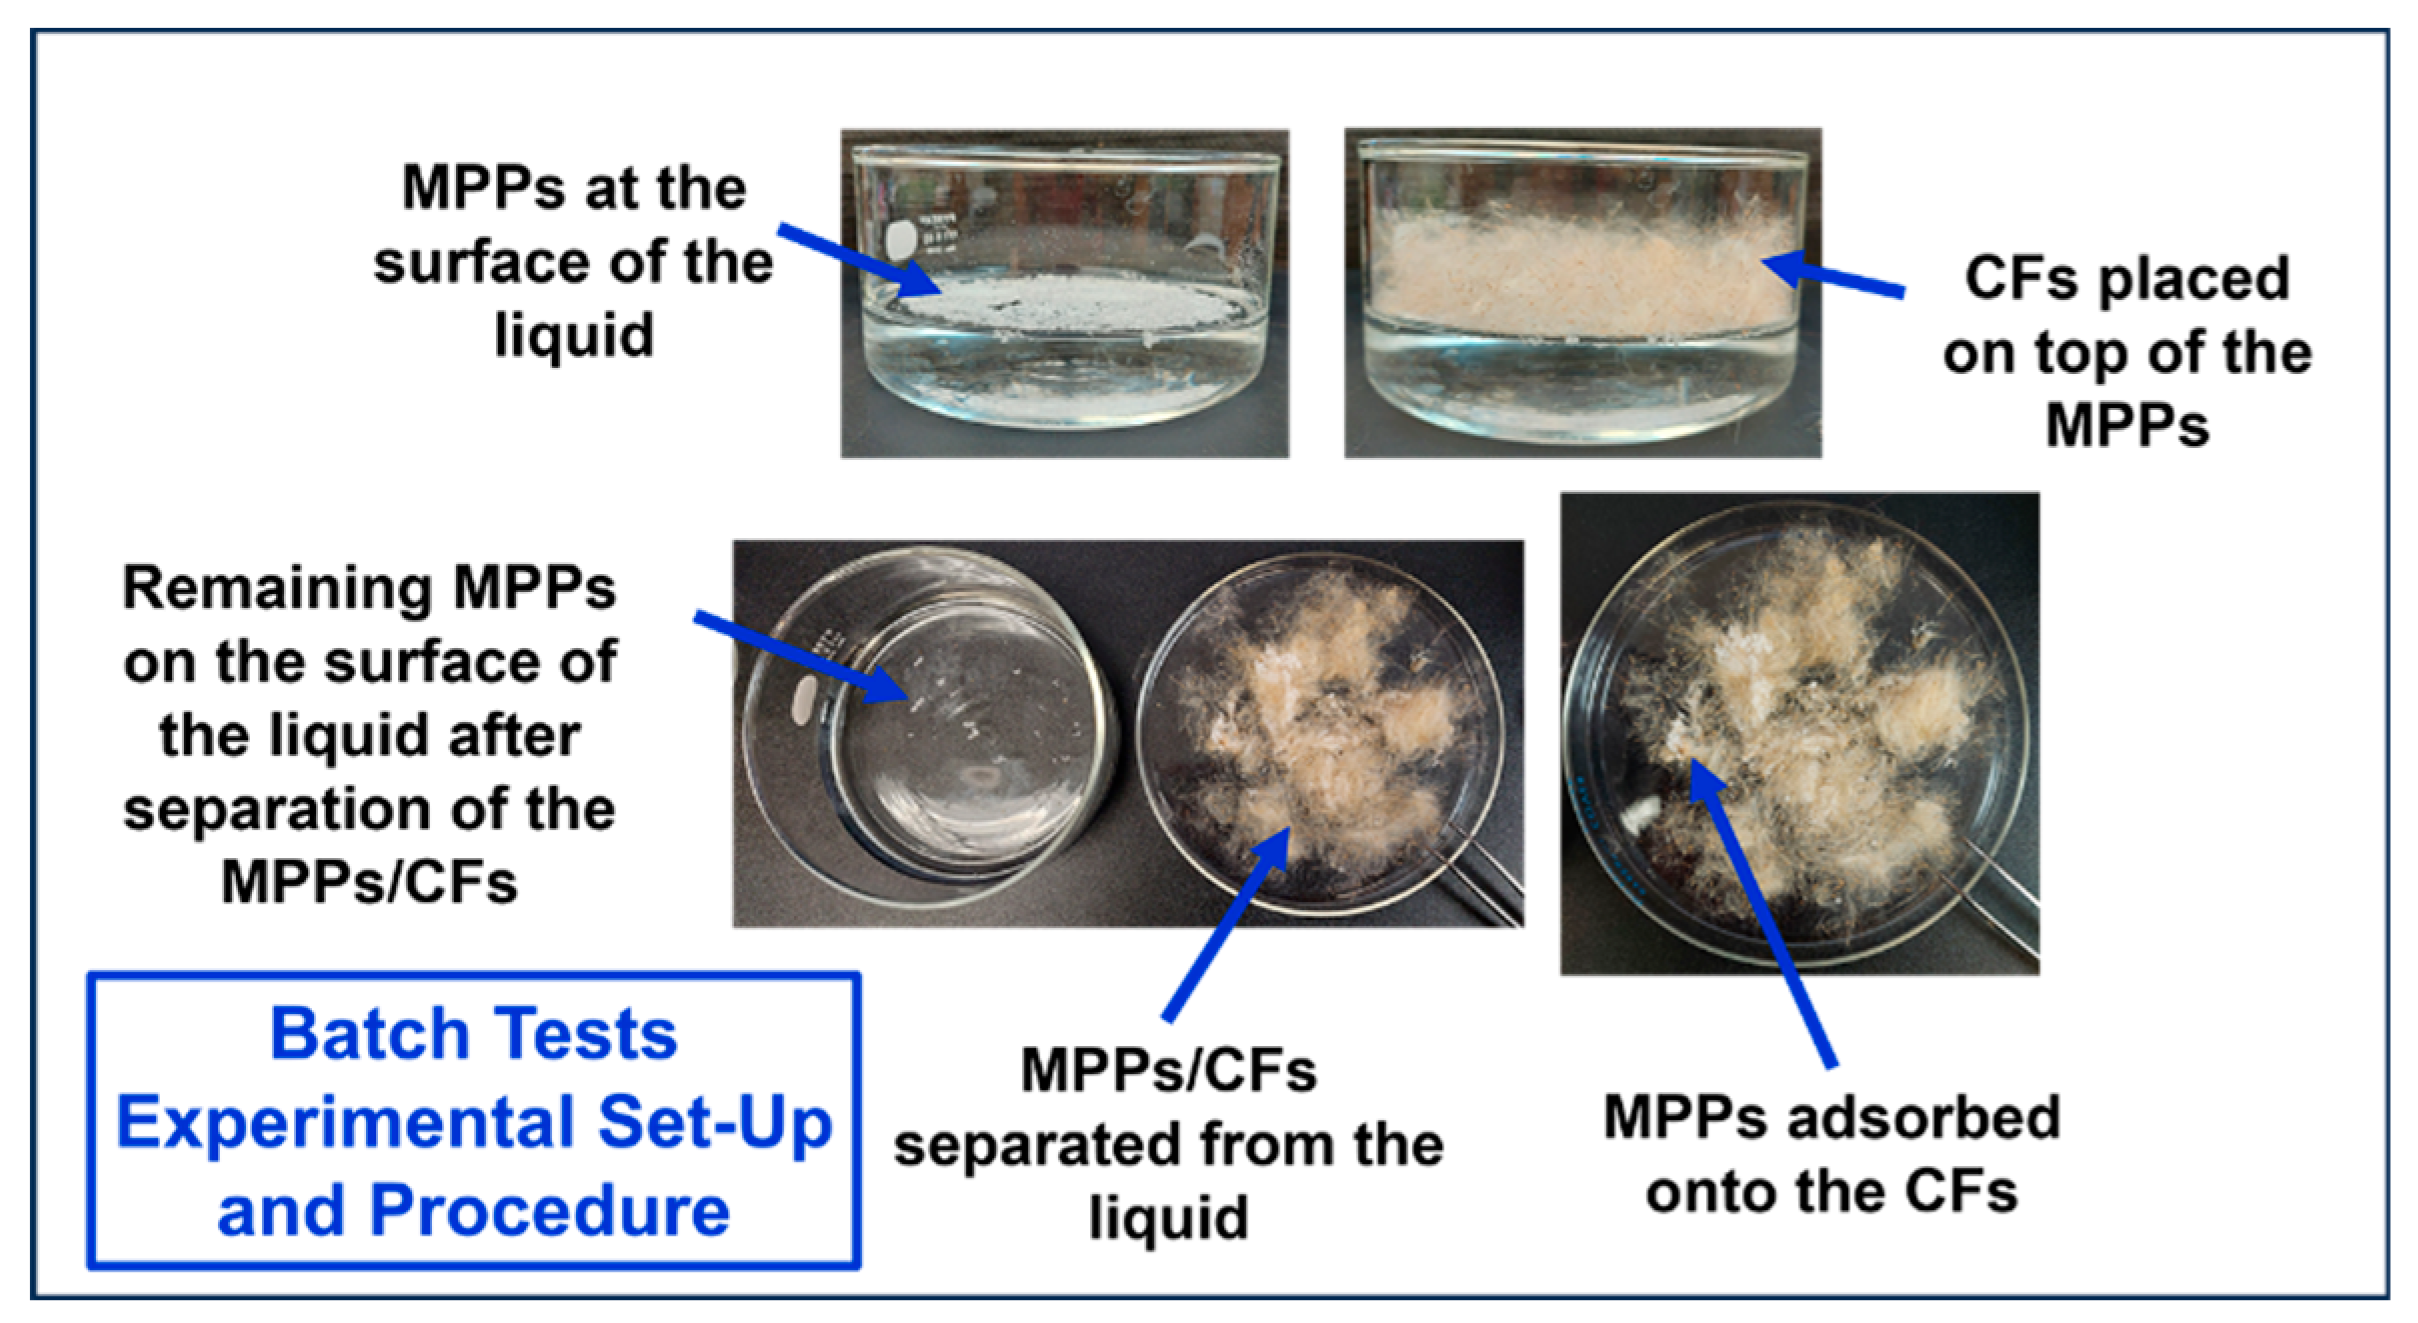
Figure 1. caption.
Figure 1. caption.
Preprints 100277 g001
Figure 2. caption.
Figure 2. caption.
Preprints 100277 g002
Figure 3. caption.
Figure 3. caption.
Preprints 100277 g003
Figure 4. caption.
Figure 4. caption.
Preprints 100277 g004
Figure 5. caption.
Figure 5. caption.
Preprints 100277 g005
Figure 6. caption.
Figure 6. caption.
Preprints 100277 g006
Figure 7. caption.
Figure 7. caption.
Preprints 100277 g007
Figure 8. caption.
Figure 8. caption.
Preprints 100277 g008
Figure 9. caption.
Figure 9. caption.
Preprints 100277 g009
Table 1. Experimental Matrix.
Adsorbent Material Microplastic Particles Distilled Water, DW
Solution Concentration [wt%]
Volume: 200 ml
Produced Water, PW
Solution Concentration [wt%]
Volume: 200 ml
0.1 0.1
PVC 0.3 0.3
0.5 0.5
0.1 0.1
PP 0.3 0.3
0.5 0.5
0.1 0.1
Cattail Fibers LDPE 0.3 0.3
0.3 grams 0.5 0.5
T = 24°C 0.1 0.1
Nylon 6 0.3 0.3
0.5 0.5
0.1 0.1
HDPE 0.3 0.3
0.5 0.5
Disclaimer/Publisher’s Note: The statements, opinions and data contained in all publications are solely those of the individual author(s) and contributor(s) and not of MDPI and/or the editor(s). MDPI and/or the editor(s) disclaim responsibility for any injury to people or property resulting from any ideas, methods, instructions or products referred to in the content.
Copyright: This open access article is published under a Creative Commons CC BY 4.0 license, which permit the free download, distribution, and reuse, provided that the author and preprint are cited in any reuse.
Prerpints.org logo

Preprints.org is a free preprint server supported by MDPI in Basel, Switzerland.

Subscribe

© 2024 MDPI (Basel, Switzerland) unless otherwise stated