Submitted:
11 March 2024
Posted:
13 March 2024
You are already at the latest version
Abstract
Despite achieving over 90% household service coverage, the Latin American and Caribbean region faces energy poverty (EP) challenges, particularly in rural areas. With growing GDP and foreign investments, Panama grapples with significant energy inequality, ranking poorly in clean energy access. Almost 177,000 Panamanians experience energy poverty, impacting their quality of life. This study proposes a Multidimensional Energy Poverty Index for Panama (MEPIP), considering dimensions like lighting, cooking, food refrigeration, thermal comfort, and knowledge/communication. MEPIP, inspired by indicators from Chile, Mexico, and the UK, aims to provide a nuanced understanding of EP. Results from surveyed rural communities, Guásimo, Llano Grande Abajo, Los Aguilares, and La Tranquilla, reveal pervasive energy poverty, emphasizing the urgency of targeted interventions. MEPIP's application identifies critical areas, such as Llano Grande Abajo, highlighting stark inequalities and the need for comprehensive energy policies to address EP in Panama.
Keywords:
energy poverty
; rural communities
; multidimensional indicator
1. Introduction
The demand for energy in a society is related to its level of well-being and degree of economic development, for example, in a purely rural society, energy consumption is mainly low, as is its GDP.
EP has a relevant impact on human development and deepens the existing inequalities in our modern society [1]. The satisfaction of energy needs is part of the satisfaction of human needs, which are important for the development of individuals and their behavior in society; therefore, using energy is undoubtedly a synergistic factor of human development.
Billions of people worldwide are continuously searching for affordable energy sources and services to enable them to carry out their daily activities [2]. Energy poverty is one of the challenges facing humanity in the 21st century [3], data from the International Energy Agency (IEA) show that seven hundred and seventy million people do not have access to electricity, and 2.8 billion people (one third of the world's population) do not have access to clean fuels for cooking [4]. In developed countries it represents an economic, ecological and socio-political challenge [5]. However, in developing countries, other socio-economic problems such as lack of housing, unemployment, shortage of food, water and clean energy sources increase the obvious energy poverty [[6]].
Mohsin et al. [6] refer to EP as a situation where individuals or households cannot needs at an affordable cost and where energy services are neither safe, affordable, nor adequate, resulting in social injustice.
According to Castaño-Rosa et al. [7] energy poverty is considered the inability of a household to satisfy a minimum amount of energy services for its basic needs.
Day et al. [8] and Moniruzzaman [9] define energy poverty as the absence of good options for obtaining sufficient, affordable, consistent, high quality, safe and environmentally friendly energy services to support economic and human development. In developed countries, energy poverty is characterized by high energy costs while in developing countries it is characterized by lack of access to modern and clean energy [10].
In Latin America, studies on energy poverty have been carried out in Mexico and Chile. In Mexico they have established that a household is in energy poverty when the people living in it do not meet the absolute needs, which are related to a series of economic goods and satisfiers that are considered essential, in a given place and time, according to social and cultural conventions [11]. Chile ventured into energy poverty in 2020 with the publication Equitable Access to Sustainable Energy. In this context, the Inter-American Development Bank (IDB), in collaboration with the Chilean Ministry of Energy, EBP Chile, the Energy Poverty Network (RedPE) and the Territorial Intelligence Center (CIT) of Adolfo Ibáñez University undertook the task of defining and developing EP indicators for the residential sector based on available information. This way, metrics incorporating four dimensions to measure PE were established physical access, quality, habitability, and affordability [12]. Chile now has an energy poverty network where researchers point out that a household is in a situation of energy poverty when it does not have enough energy to cover the fundamental and basic needs, considered by society and its members.
According to the results of the Household Survey Database (BADEHOG, in Spanish) and the recent population censuses, Latin American and Caribbean countries have an average service coverage of more than 90% of households, as Figure 1. Despite this, in certain countries, especially in rural settlements, this coverage decreases to levels that justify the need to develop a public policy focused on achieving universal coverage. Both BADEHOG statistics and those from population censuses in recent years indicate that in certain Central American countries the proportion of households without access to this energy service is higher than in the rest of the region, for example, the cases of Guatemala (16.5%), Nicaragua (14.3%), El Salvador (11.8%) and Honduras (9.6%), which have limited access to various socioeconomic benefits related to electricity.
Energy is currently an essential service that, in developing countries such as Panama, does not reach rural areas and is even unattainable for some residents of urban areas depending on their socioeconomic status [13]. The Secretaría Nacional de Energía (SNE) [14] considers that guaranteeing universal access to energy is an effective instrument for combating climate change.
Over the years, the national economy has been improving, as have foreign investments and the increase in gross domestic product, which has led to the search for a solution to the problem of energy inequality, with Panama being the fourth most unequal country in Latin America and the tenth most unequal in the world [15,16].
From the ranking of available, clean energy and energy poverty, Panama obtained the following positions in 2016: 84th in available energy, 55th in affordable energy, 38th in clean energy, 56th in energy poverty; the positions mentioned are based on 125 countries that were the object of evaluation in the publication "Assessing global energy poverty: an integrated approach" [17].
Almost 177,000 Panamanians are trapped in energy poverty [18]. These citizens need access to quality energy services that allow them to meet their energy needs, as shown in Figure 2. While it is true that on the road to universal access to electricity service, the gap between 2000 and 2018 has been reduced by 10.96% and 2.85%, respectively, these amounts represent 56.4 million people without electricity in 2000 and 18.1 million people without electricity in 2018 [13]. Despite its year-over-year increase in GDP, Panama loses 20 points in the UN Human Development Index when inequality is included in the measurement [16]. The Gini Coefficient for Panama in 2022 is 50.9, the most unequal in Central America, Figure 3 [19].
In Panama, the area with the highest electrification rate is the province of Panama, where it reaches 97%, while Colon and Los Santos with 92% are above average. In the rest of the provinces, the coverage rate ranges from a minimum of 61% for Darién to 88% for Chiriquí. In the comarca territory, coverage rates are well below the rest of the country. In the Emberá Comarca, 35% have electricity service, while in Kuna Yala it reaches only 19% of homes. In the Ngäbe Buglé Comarca, only 4% of homes have access to electricity. In general, 92% of homes in the comarca territories do not have electricity service, equivalent to some 30,000 homes. Despite the evident lack of electricity in the comarcas, the rural areas of the provinces of Veraguas and Coclé also have significant areas without this service [20].
EP is not only limited to the lack of access to energy networks, but also includes the low or under-consuming population, which translates into a poor quality of life in the home. The low-income population reduces its consumption to the essentials, i.e., lighting and a few low-consumption appliances such as a radio or television and, in some cases, a small refrigerator. These users are very sensitive to electricity rate increases, since they consume the minimum for essential activities for home life.
Inaccessibility to energy is an issue that is beginning to be developed in Panama in order to comply with the Sustainable Development Goals (SDG 1 and SDG 7), the 2030 Energy Transition Agenda and the National Energy Plan 2015-2050, and indicators are required to diagnose and quantify the problem in the national context. Globally, it threatens to sustainable development, health and education [17].
The paper begins by describing the energy needs of human beings in rural areas; the factors causing EP are established and its definition for Panama is proposed. Measurement indicators are defined, and a methodology is proposed to obtain a multidimensional energy poverty index. The results of this study will be used to generate improvements that will contribute to the reduction of energy shortages in the country's rural communities.
2. Materials and Methods
For the development of this research, an intensive literature review search was conducted using primary sources of information from Panama and Latin America, i.e., scientific articles, data from the Instituto Nacional de Estadística y Censo (INEC), data from the Oficina de Electrificación Rural (OER) and data from the SNE. On the other hand, OER engineers are key actors in reducing EP and in Panama´s universal energy access strategy, were interviewed.
2.1. Energy Needs
The human condition depends on goods and services, so energy is a service that is needed for an adequate quality of life. When studying EP, energy needs must be considered [21], so authors such as García Ochoa [22] and Sovacool et al. [2], expanded the energy needs of what was usually analyzed (lighting, cooking and thermal comfort).
2.1.1. Lighting
2.1.2. Cooking
The 2010 national population and housing census shows that households in Panama mainly use liquefied petroleum gas (LPG) for cooking, followed by firewood and charcoal, with the latter showing a tendency to decrease progressively. In households, LPG consumption is 67.8% of what is produced, where 100% is used for cooking. Firewood is used in 13% of homes in the country and coal in 0.02% of these.
Panama, as a member of the UN and in accordance with the SDGs, made a commitment to universal access to clean cooking by 2030. From 2010 to 2016, the increase in access to clean cooking has been 0.5 percentage points, to achieve the 2030 goal it is necessary to reach an annual rate of 3 percentage points between 2016 and 2030 [24].
2.1.3. Food Refrigeration
Not having a refrigerator forces people to spend more money on food for the moment or to use canned foods that in the long run are harmful to health due to their high content of preservative chemicals and sodium [25]. According to V. Modi [26], women are the most affected gender, since in Latin America the role of cooking and food preparation is mainly attributed to them.
2.1.4. Knowledge, Entertainment and Communication
The role of energy in communication and entertainment is to keep society informed in the economic, social, cultural and technological fields through the use of electricity for technological purposes such as the Internet, computers, cell phones and tv. In rural areas, radio is the predominant means of communication, as indicated by the 2010 census, in which 70.1% of households in Panama had a radio or sound equipment [25].
2.1.5. Thermal Comfort (Forced Ventilation)
When people inside a dwelling do not experience sensations of cold or heat and when the climatic conditions of humidity, temperature and air movement are pleasant, it is said that the dwelling meets the need for thermal comfort [27]. The comfort and well-being inside homes is conditioned to the air conditioning inside them [25].
The predominant climate in Panama is humid tropical, characterized by abundant heat and humidity most of the time, so it is necessary to have fans in homes to ensure a pleasant thermal sensation.
2.2. Causal Factors of EP in Panama and Indicators
According to Vega. Y [28], the main factors that lead to energy poverty are:
2.2.1. Inaccess to Energy Infrastructure
There are geographic barriers such as geomorphological, vegetation and climatic conditions, which are linked to human settlement patterns and access to infrastructure. These conditions have an impact on energy access in remote mountain, island and rural areas.
2.2.2. Low Household Income
Affordability describes the creditworthiness of consumers to pay for a limited level of a particular service. The basic way of measuring it is by the proportion of a household's monthly income that goes to pay for a basic public service [29].
In Panama, the low-income population reduces its consumption to the essentials, which are lighting, radio or television, and a small refrigerator, and when there is an increase in the tariff, they are strongly affected [20].
2.2.3. High Energy Costs
This refers to the increase in electricity tariffs and LPG. The price of electricity is linked to its generation costs, while the price of LPG increases according to the cost of transportation.
LPG is indispensable for Panamanian families in applications such as cooking food, heating water and as fuel for washing machine dryers [20].
2.2.4. Housing Quality and Energy Efficiency
There are families in rural communities that do not own any appliances, where it is not possible to suggest them to buy more efficient appliances or to talk to them about energy saving or reasonable electricity consumption. Energy efficiency consists of reducing energy consumption without affecting daily activities or comfort [30]. In addition to energy efficiency, energy saving measures can be taken in residences to reduce energy consumption.
2.2.5. Quality of Electric Power Service
Authors such as Billi, et al [1], Amigo et al [31], García Ochoa [11]; indicate that not having access to a quality power supply results in EP. Disturbances in the quality of power supply are defined as any type of sudden change in voltage, current or frequency that impairs the normal operation of electrical equipment. Seymour & Horsley [32] define electrical interruption as a total loss of voltage and current, which can be instantaneous, momentary, temporary or sustained.
2.3. Proposed Parameter for Measuring PE in Panama
The most common ways of measuring EP are to focus the study on energy expenditure or access to energy sources and technologies. In developed countries, the measurement of energy expenditures stands out due to their greater accessibility to the service; in contrast to the situation in Latin America and the Caribbean, where the focus on access to energy is more commonly used, since energy inequality prevails.
2.3.1. One-Dimensional Indicators
A one-dimensional indicator is a measure that captures a single aspect of a phenomenon. It is a single variable that can be used to track changes over time. Many developed countries already have established indicators to measure EP [33].
2.3.2. Multidimensional Energy Poverty Index for Panama (MEPIP)
Real-world systems are often multidimensional and complex, and relying solely on one-dimensional indicators may not capture the full complexity and nuances of the systems being measured. The aim is to compile individual indicators into a single multidimensional index to classify areas according to their EP status [21,35].
The proposed indicator is based on previous studies of countries such as Chile, Mexico and the United Kingdom, specifically the following indicators:
- Multidimensional Energy Poverty Indicator, United Kingdom.
- Household Energy Poverty Indicator, Mexico
- Multi Tier Framework Indicator, United Kingdom
- Three-Dimensional Energy Poverty Indicator, Chile
Figure 4 presents a flow chart with the procedures for MEPIP creation.
MEPIP uses the dimensions or energy needs established in section 2.1 and presented in Table 1.
Table 2 works as a check sheet to count the number of economic goods or household appliances related to energy needs, as well as the weighting obtained with respect to the satisfaction threshold. In the economic good verification column, 1 is placed if it meets the satisfaction threshold, otherwise it is placed 0. In the economic good level column, it is weighted from 0 to 3, where:
- 0: does not possess the economic good.
- 1: Possesses the economic good, but not the minimum acceptable quantity.
- 2: Possesses the economic good, but it is not in good condition or is polluting.
- 3: Possesses the economic good in reasonable quantities and good conditions.
The weighting obtained is closely related to the number of economic goods established in Table 2, e.g., if the household has only one light bulb and the satisfaction threshold is greater than or equal to three, the weighting of 20% should be multiplied by 1/3.
The resulting mathematical expression for MEPIP is:
r is the number of energy dimensions (5), n is the number of indicators, and P is the weighting obtained when evaluating each indicator.
The interpretation of the MEPIP results is shown in Table 3.
MEPIP has to be used in communities to know their energy situation. OER has identified communities without access to electricity. However, to locate areas likely to be EP situations, five other communities were chosen to be visited and survey most of the population. These communities were Guásimo, Llano Grande Abajo, Los Aguilares and La Tranquilla.
3. Results
3.1. Definition of EP for Panama
So far, there is no exclusive definition of EP for Panama, since few studies have addressed this issue. The proposed definition is as follows:
Condition of households in lack of a basic, affordable, and clean energy source or service that contributes to the satisfaction of energy and human needs where household members develop economically, socially and personally to achieve an integral life.
3.2. Application of MEPIP to Rural Communities
A total of 69 houses were surveyed. The calculation of the MEPIP in a household in the community of Los Aguilares is presented in Table 4.
Applying (1), the MEPIP for this house was obtained as follows:
According to Table 3, the people in this household live in EP and measures should be taken.
Figure 5, Figure 6, Figure 7 and Figure 8 show the multidimensional indicator applied to each surveyed house in the communities of Guásimo, Llano Grande Abajo, Los Aguilares and La Tranquilla, respectively.
Table 5 shows the descriptive statistics of the results of MEPIP for each community.
4. Discussion
All the communities visited are submerged in EP, with Llano Grande Abajo being the most critical, with an average MEPIP approximately 50% lower than the rest (0.0492 versus 0.1042 for Guásimo, 0.09505 for Los Aguilares and 0.1004 for La Tranquilla). Llano Grande Abajo is also the area with the greatest inequality in terms of energy access conditions. House N°2 lacked all the economic goods considered for this study.
The values for Guásimo and LLano Grande Abajo show a negative kurtosis, which means that most of the values are concentrated away from the mean in a normal distribution. On the other hand, the positive kurtosis for Tranquilla indicates that most of the houses in that community have an MEPIP close to the mean.
Among all those surveyed, only three houses showed an MEPIP value close to 0.20, which would have classified them as not energetically poor. These houses are located in Guásimo, Los Aguilares, and La Tranquilla.
5. Conclusions
Energy inequality is a condition that must be taken into consideration if Panama is to meet the SDGs of the 2030 Agenda. Having a definition of EP for Panama is an important step forward in putting the relevant national organizations in the context of this issue.
Although OER has identified areas where EP can be observed, having an indicator that quantifies this condition is beneficial, as it allows for a higher priority to be given to certain families. In this regard, this research has located three new areas that were not contemplated under the EP category for OER, in which the MEPIP proved to be an effective tool for knowing the situation of households in a statistical context.
Inhabitants of La Tranquilla live in conditions of extreme energy poverty, and therefore urgently require that their condition be improved.
Author Contributions
Conceptualization, A.V., F.H., C.G., N.V., D.M. and J.C.H.; methodology, A.V., F.H., C.G., N.V., D.M. and J.C.H.; formal analysis, A.V., F.H., C.G., N.V., D.M. and J.C.H.; investigation, A.V., F.H., C.G., N.V., D.M. and J.C.H.; resources, A.V., F.H., C.G., N.V., D.M. and J.C.H.; writing—original draft preparation, A.V., F.H., C.G., N.V., D.M. and J.C.H. All authors have read and agreed to the published version of the manuscript.
Acknowledgments
This work was supported in part by the Thematic Network 723RT0150 “Red para la integración a gran escala de energías renovables en sistemas eléctricos (RIBIERSE-CYTED)” financed by the call for Thematic Networks of the CYTED (Ibero-American Program of Science and Technology for Development) for 2022.
References
- R. Calvo, N. Álamos, M. Billi, A. Urquiza, and R. Contreras Lisperguer, “Desarrollo de indicadores de pobreza energética en América Latina y el Caribe 207 RECURSOS NATURALES Y DESARROLLO,” Santiago de Chile, 2021. [Online]. Available: www.cepal.org/apps.
- B. K. Sovacool et al., “What moves and works: Broadening the consideration of energy poverty,” Energy Policy, vol. 42, pp. 715–719, 2012. [CrossRef]
- Z. Tao and J. Chao, “A bibliometric and visualized analysis of research on green finance and energy in a global perspective,” Research in Globalization, vol. 7, p. 100156, 2023. [CrossRef]
- IEA, “SDG7: Data and Projections.” Accessed: Jan. 01, 2024. [Online]. Available: https://www.iea.org/reports/sdg7-data-and-projections.
- D. Alemzero, T. Acheampong, and S. Huaping, “Prospects of wind energy deployment in Africa: Technical and economic analysis,” Renew Energy, vol. 179, pp. 652–666, 2021. [CrossRef]
- M. Mohsin, F. Taghizadeh-Hesary, and M. Shahbaz, “Nexus between financial development and energy poverty in Latin America,” Energy Policy, vol. 165, p. 112925, 2022. [CrossRef]
- R. Castaño Rosa, J. Solís Guzmán, and M. Marrero, “Midiendo la pobreza energética. Una revisión de indicadores,” Revista hábitat sustentable, vol. 10, no. 1, pp. 9–21, Jun. 2020. [CrossRef]
- R. Day, G. Walker, and N. Simcock, “Conceptualising energy use and energy poverty using a capabilities framework,” Energy Policy, vol. 93, pp. 255–264, 2016. [CrossRef]
- M. Moniruzzaman and R. Day, “Gendered energy poverty and energy justice in rural Bangladesh,” Energy Policy, vol. 144, p. 111554, 2020. [CrossRef]
- B. Lin and Y. Wang, “Does energy poverty really exist in China? From the perspective of residential electricity consumption,” Energy Policy, vol. 143, p. 111557, 2020. [CrossRef]
- R. García-Ochoa, “Pobreza energética en América Latina,” Santiago de Chile, Mar. 2014. Accessed: Jan. 01, 2024. [Online]. Available: https://repositorio.cepal.org/server/api/core/bitstreams/79cc961b-7908-4fce-a7dd-133d484c1be7/content.
- N. Marzolf and M. Ramírez, “Avanzando en la erradicación de la Pobreza Energética: Plataforma de indicadores a nivel residencial en Chile - Energía para el Futuro.” Accessed: Jan. 01, 2024. [Online]. Available: https://blogs.iadb.org/energia/es/avanzando-en-la-erradicacion-de-la-pobreza-energetica-plataforma-de-indicadores-a-nivel-residencial-en-chile/.
- L. Contreras and R. Rubén - Salgado, “Informe regional sobre el ODS 7 de sostenibilidad energética en América Latina y el Caribe | CEPAL,” Dec. 2021. Accessed: Jan. 01, 2024. [Online]. Available: https://www.cepal.org/es/publicaciones/47674-informe-regional-ods-7-sostenibilidad-energetica-america-latina-caribe.
- SNE, Estrategia Nacional de Acceso Universal a la Energía. Panamá, 2022.
- J. Astudillo, M. T. Fernández, and C. Garcimartín, “La desigualdad de Panamá: Su carácter territorial y el papel de las inversiones públicas,” 2019. [Online]. Available: https://api.semanticscholar.org/CorpusID:199284128.
- M. Justo, “¿Cuáles son los 6 países más desiguales de América Latina?,” BBC News, Mar. 09, 2016. Accessed: Jan. 01, 2024. [Online]. Available: https://www.bbc.com/mundo/noticias/2016/03/160308_america_latina_economia_desigualdad_ab.
- X. Che, B. Zhu, and P. Wang, “Assessing global energy poverty: An integrated approach,” Energy Policy, vol. 149, p. 112099, 2021. [CrossRef]
- H. Ritchie, P. Rosado, and M. Roser, “Access to Energy,” Our World in Data. Accessed: Jan. 01, 2024. [Online]. Available: https://ourworldindata.org/energy-access.
- “Índice de Gini 2022 | Datosmacro.com,” Expansión. Accessed: Jan. 01, 2024. [Online]. Available: https://datosmacro.expansion.com/demografia/indice-gini.
- Secretaría Nacional de Energía, Plan Energético Nacional 2015-2050, no. 6–348. Panamá: Gaceta Oficial Digital, 2016, p. 348. [Online]. Available: http://www.energia.gob.pa/plan-energetico-nacional/.
- K. Wang, Y.-X. Wang, K. Li, and Y.-M. Wei, “Energy poverty in China: An index based comprehensive evaluation,” Renewable and Sustainable Energy Reviews, vol. 47, pp. 308–323, 2015. [CrossRef]
- R. García-Ochoa and B. Graizbord, “Caracterización espacial de la pobreza energética en México. Un análisis a escala subnacional,” Economía, Sociedad y Desarrollo, vol. 16, no. 51, pp. 289–337, 2016, Accessed: Jan. 01, 2024. [Online]. Available: https://www.scielo.org.mx/scielo.php?script=sci_arttext&pid=S1405-84212016000200289.
- K. Kaygusuz, “Energy services and energy poverty for sustainable rural development,” Renewable and Sustainable Energy Reviews, vol. 15, no. 2, pp. 936–947, 2011. [CrossRef]
- R. Aiello and F. Lucantonio, “Energía para cocinar en América Latina y el Caribe: los desafíos de Paraguay - Energía para el Futuro,” Energía para el futuro - Banco Interamericano de Desarrollo. Accessed: Jan. 01, 2024. [Online]. Available: https://blogs.iadb.org/energia/es/energia-para-cocinar-en-america-latina-y-el-caribe-desafios-de-paraguay/.
- F. Carvajal et al., “Más allá de la electricidad: Cómo la energía provee servicios en el hogar,” Jul. 2020. [Online]. Available: www.iadb.org/.
- V. Modi, M. Bazilian, and P. Nussbaumer, “Measuring energy poverty: Focusing on what matters,” Renewable and Sustainable Energy Reviews, vol. 16, no. 1, pp. 231–243, 2012. [CrossRef]
- S. Gargallo, “What is thermal comfort?” Accessed: Jan. 01, 2024. [Online]. Available: https://sgarq.com/en/what-is-thermal-comfort/.
- Y. Vega, “Pobreza energética: Causas medición y posibles soluciones. Un estudio para Gipuzkoa,” Universidad del País Vasco, 2016.
- Secretaría Nacional de Energía, “‘Panamá el futuro que queremos.’” Panamá, p. 84, 2017. [Online]. Available: https://www.latinamerica.undp.org/content/rblac/es/home/library/poverty/-panama--el-futuro-que-queremos--plan-energetico-panama-2015-205.html.
- J. C. Schallenberg Rodríguez, Energías renovables y eficiencia energética. Instituto Tecnológico de Canarias, 2008.
- C. Amigo, R. Calvo, A. Cortés, and A. Urquiza, “Pobreza energética. El acceso desigual a energía de calidad como barrera para el desarrollo en Chile,” Nov. 2019.
- T. Horsley and J. Seymour, “Los siete tipos de problemas en el suministro eléctrico,” 2010. [Online]. Available: www.apc.com.
- S. A. Sy and L. Mokaddem, “Energy poverty in developing countries: A review of the concept and its measurements,” Energy Res Soc Sci, vol. 89, p. 102562, 2022. [CrossRef]
- Consejo Nacional de Evaluación de la Política de Desarrollo Social, “Manual para el diseño y la construcción de indicadores. Instrumentos principales para el monitoreo de programas sociales de México,” Mexico DF, 2013.
- M. Nardo, M. Saisana, S. Tarantola, A. Hoffmann, and E. Giovannini, “Handbook on Constructing Composite Indicators: Methodology and User Guide,” Paris, 2008.
Figure 1.
Proportion and number of population without access to electricity in their homes (in percentages) [1].
Figure 1.
Proportion and number of population without access to electricity in their homes (in percentages) [1].
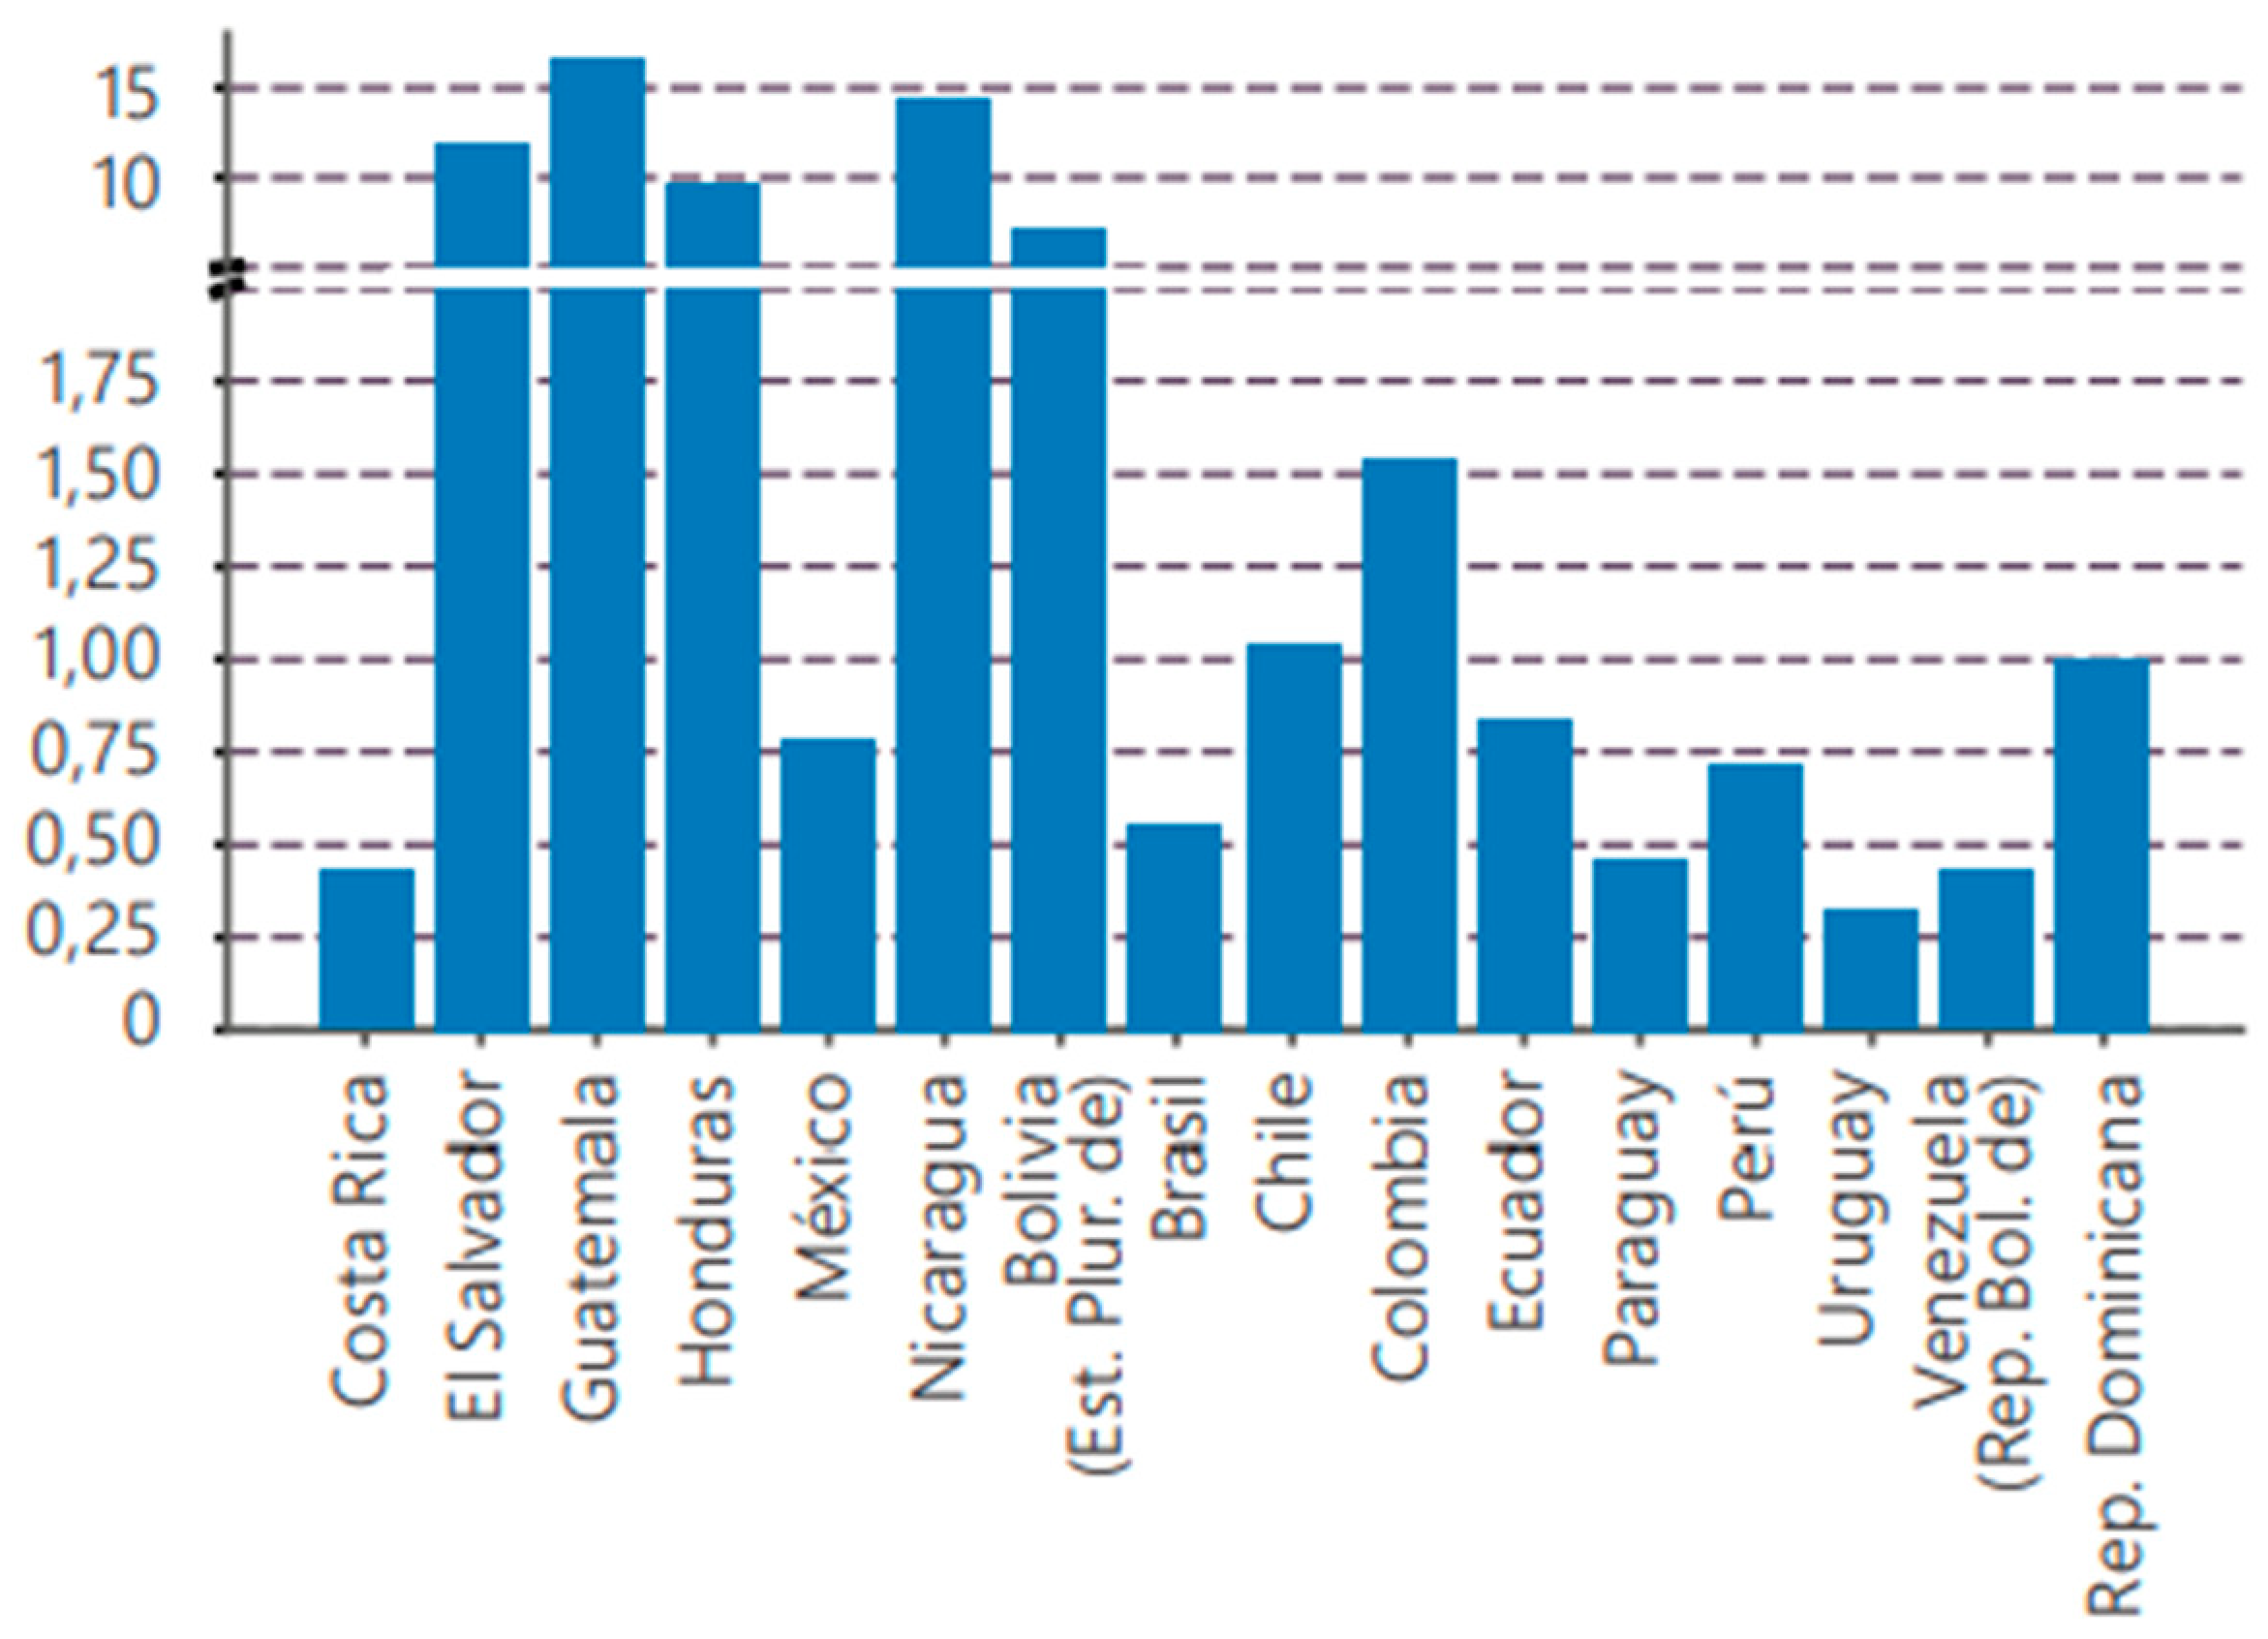
Figure 2.
Number of Panamanian people without access to electricity [18].
Figure 2.
Number of Panamanian people without access to electricity [18].
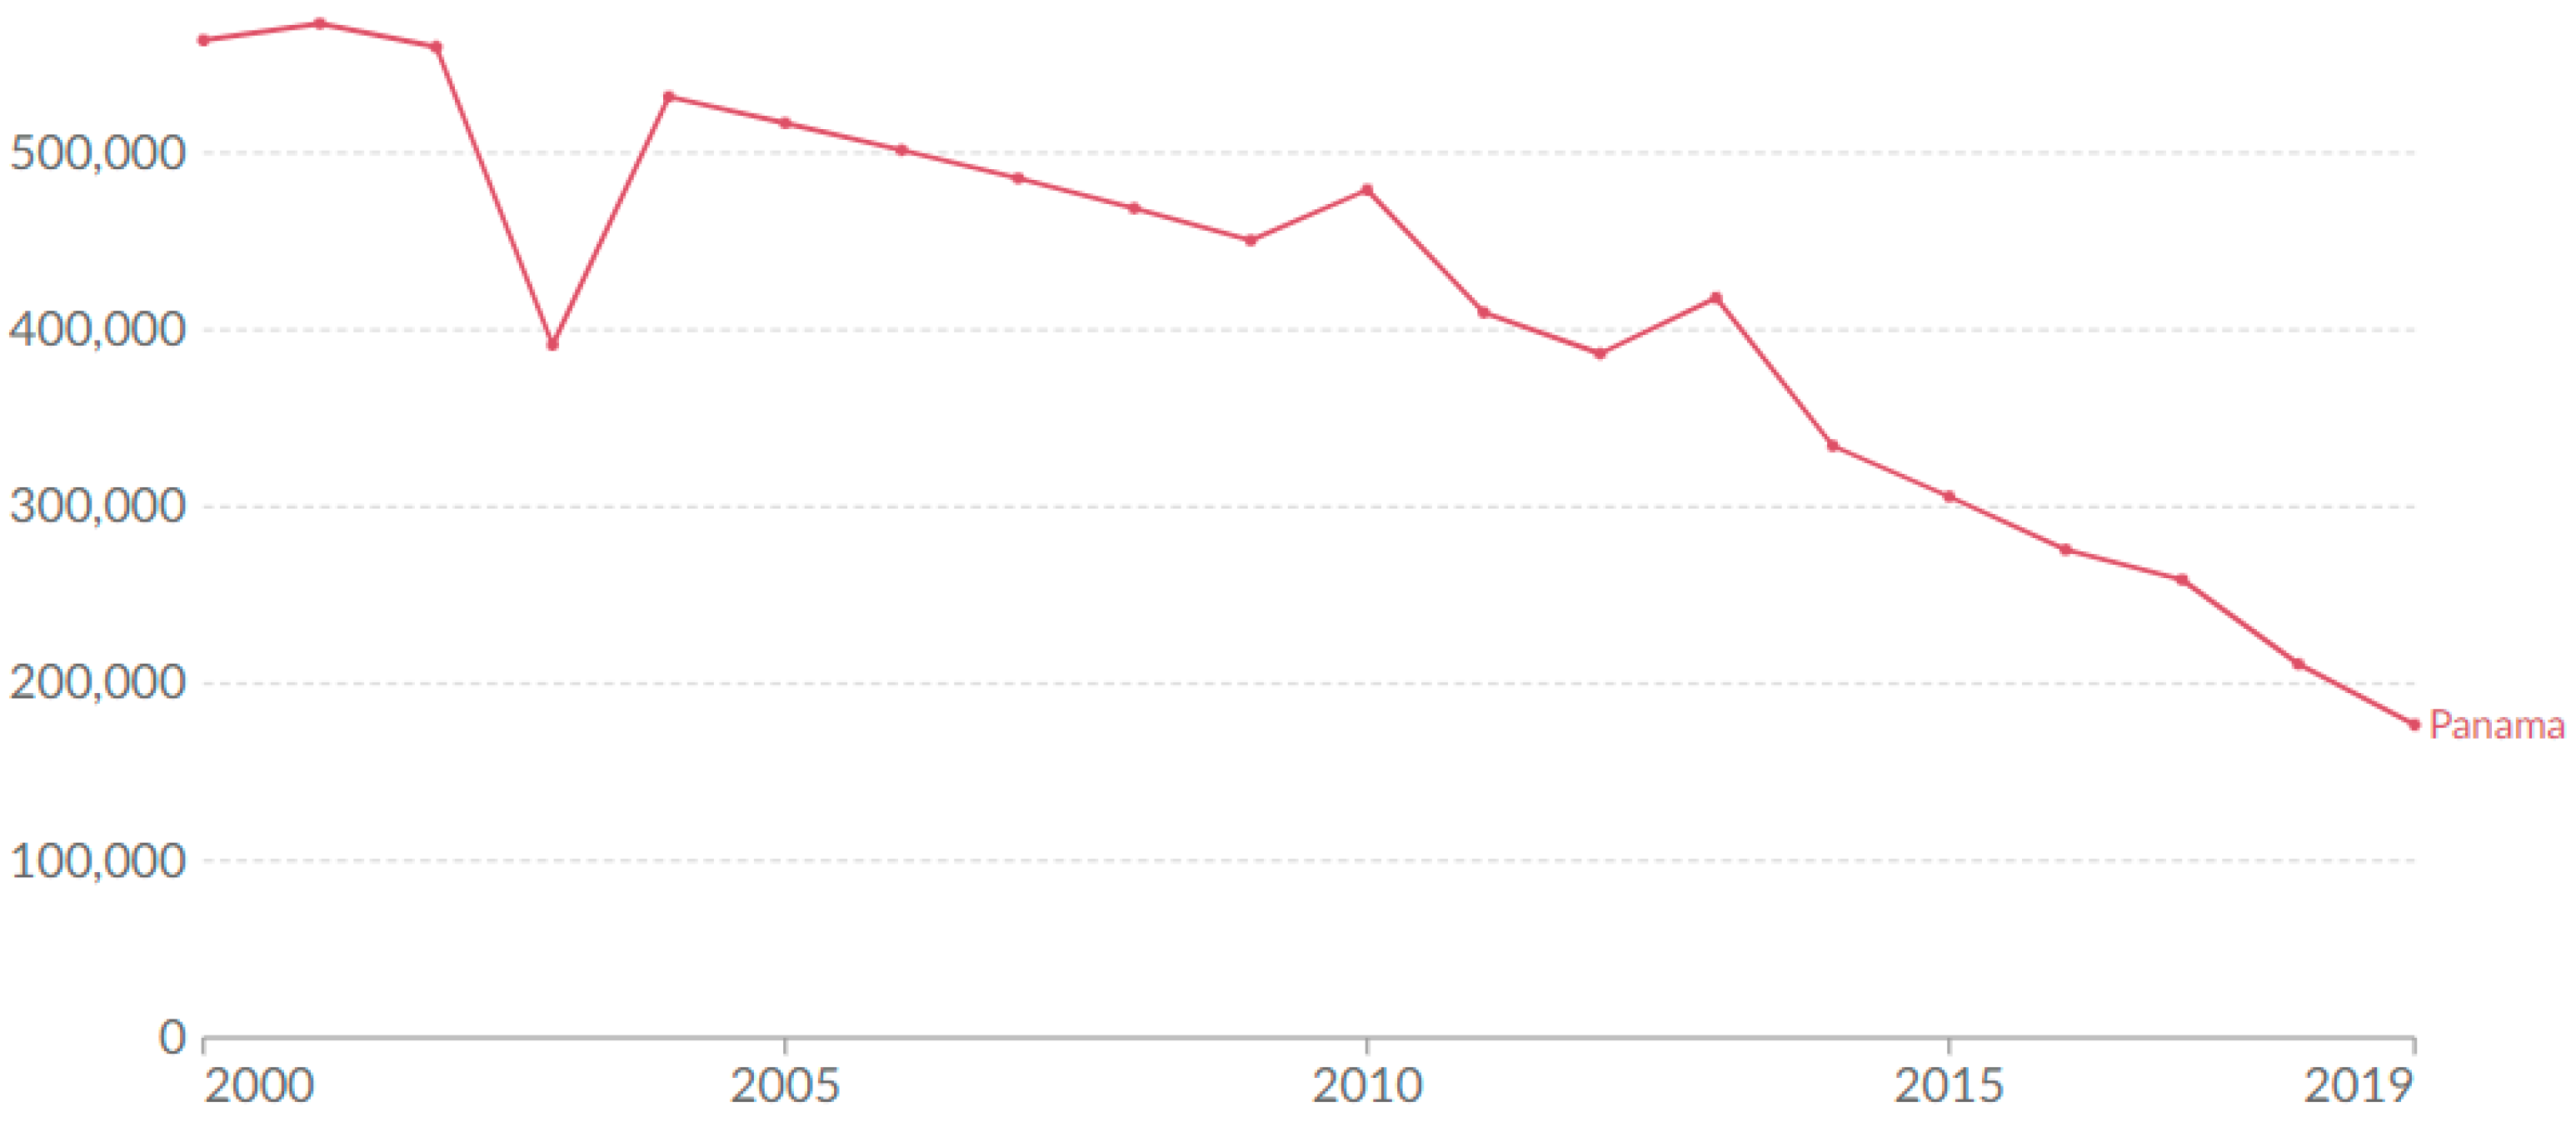
Figure 3.
Gini Coefficient for Central America and Mexico [19].
Figure 3.
Gini Coefficient for Central America and Mexico [19].
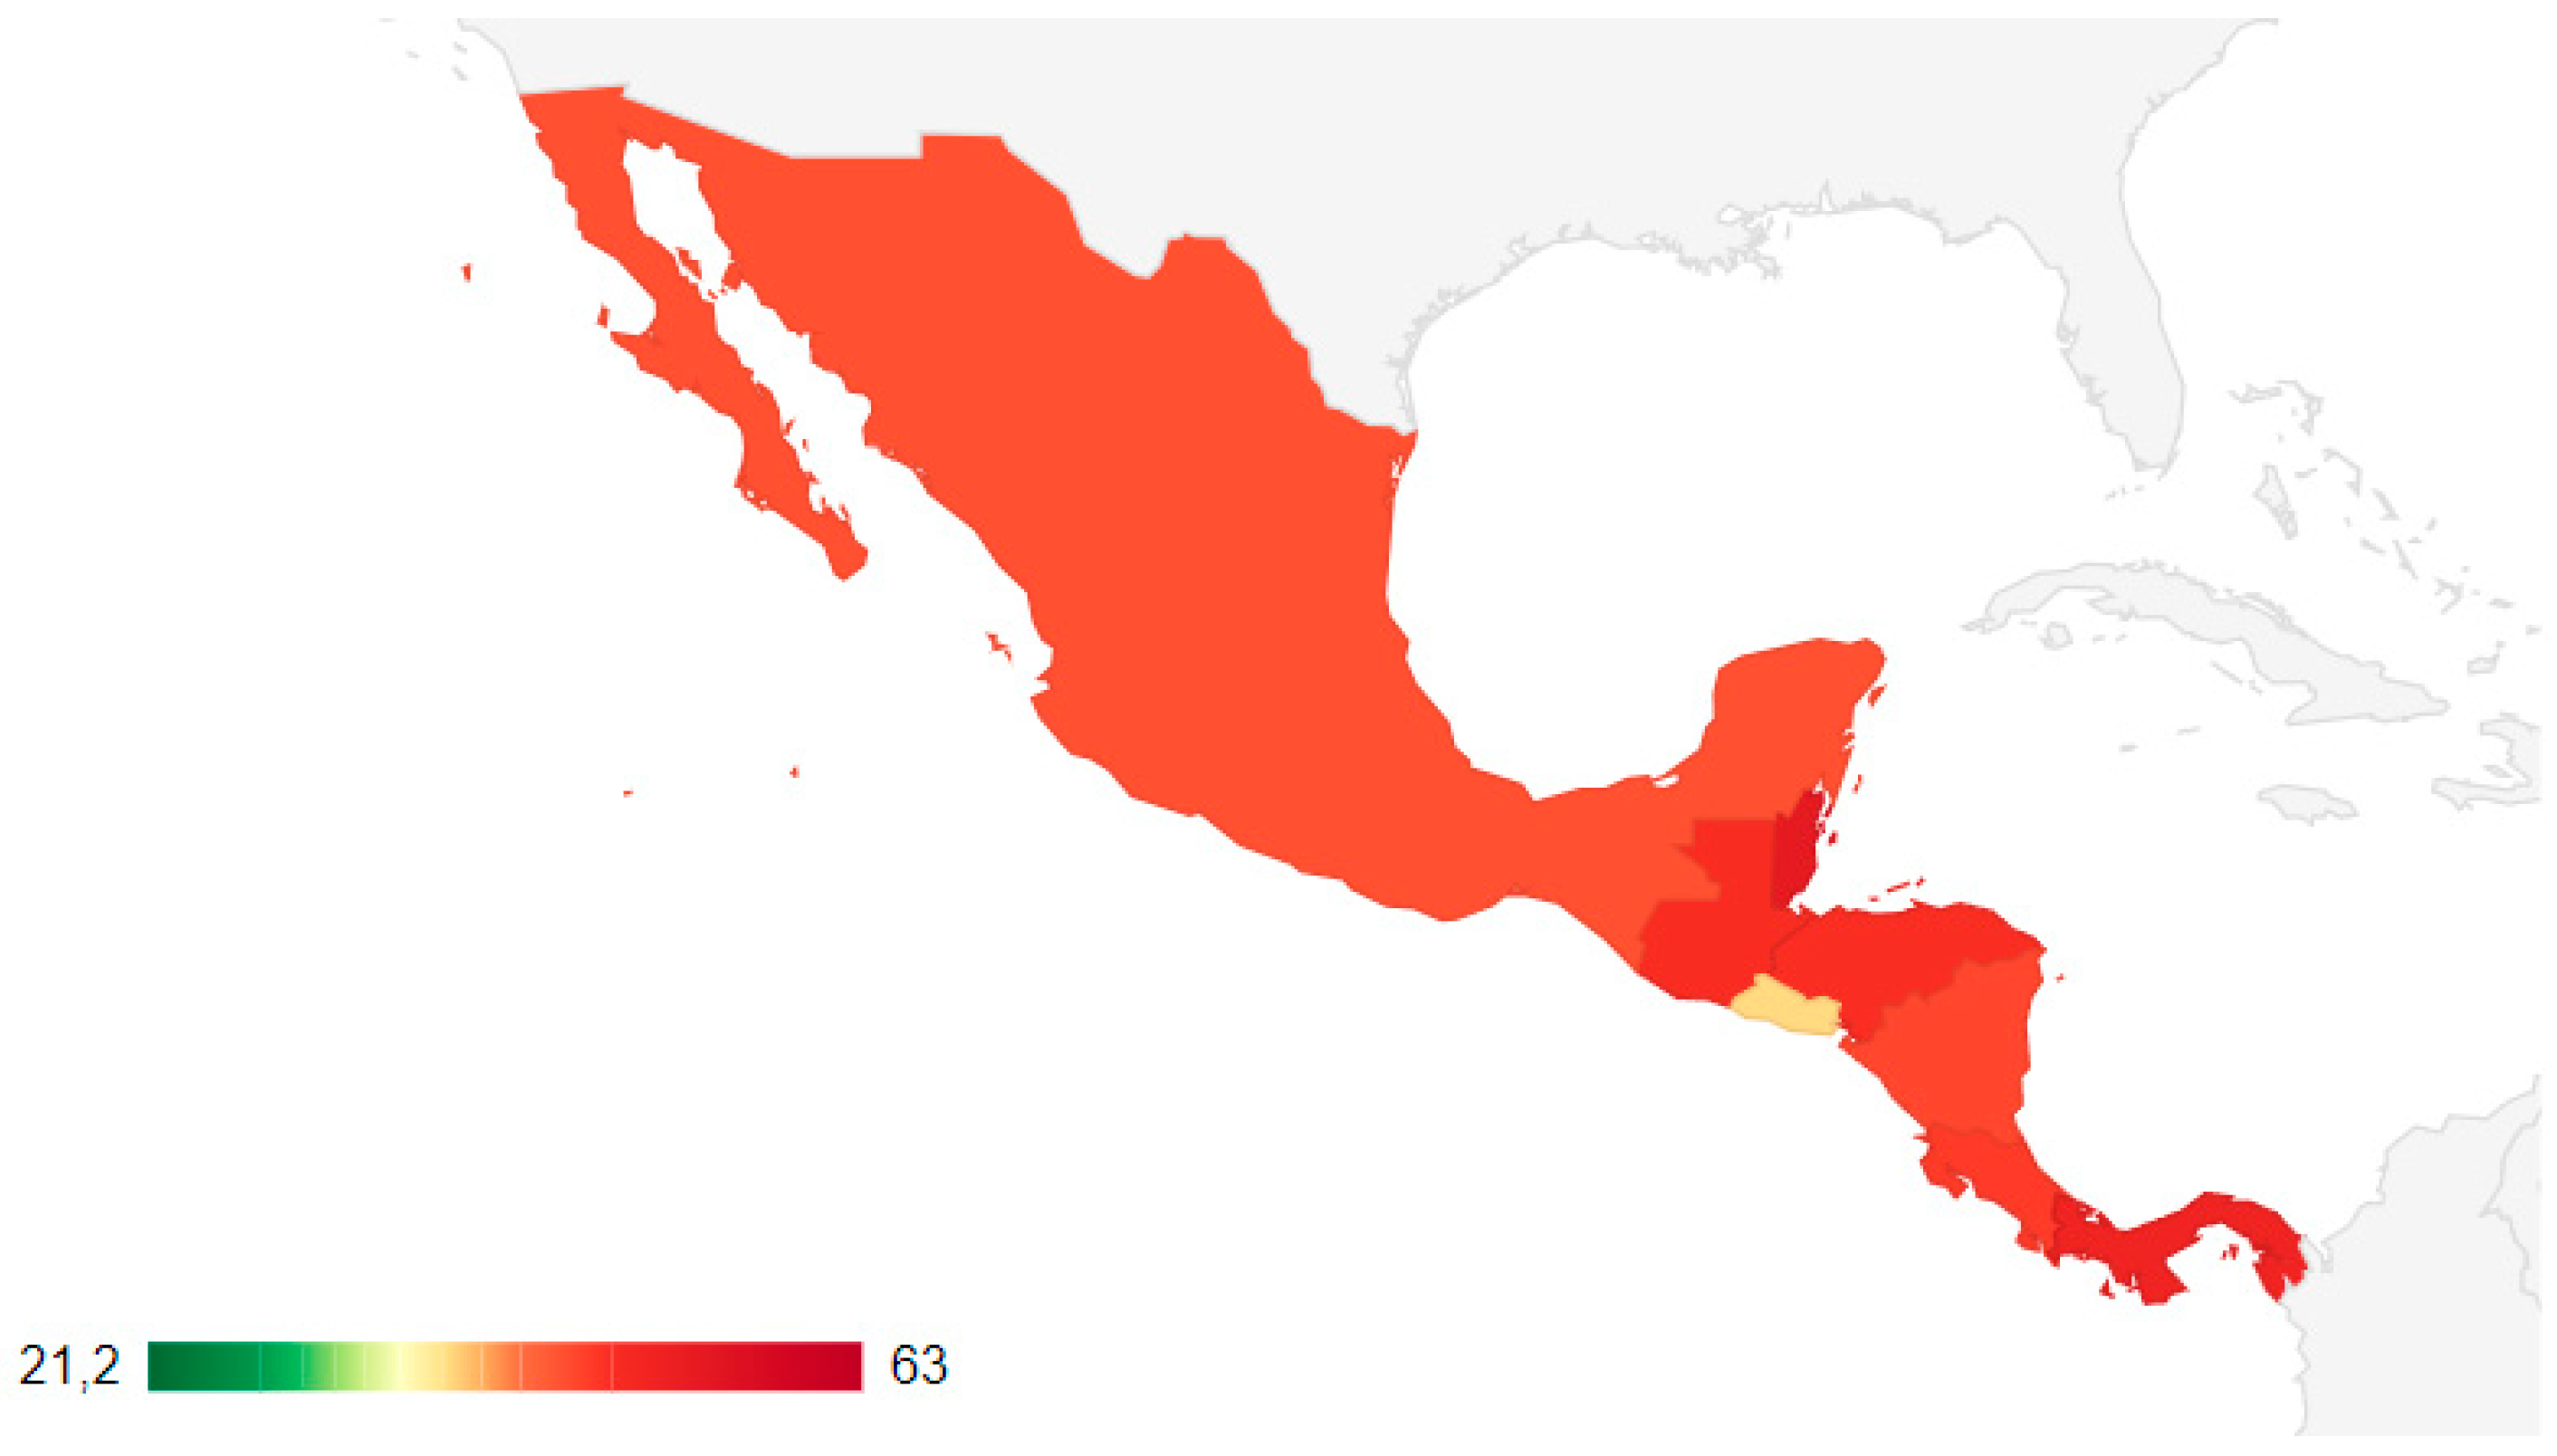
Figure 4.
Procedures for MEPIP creation.
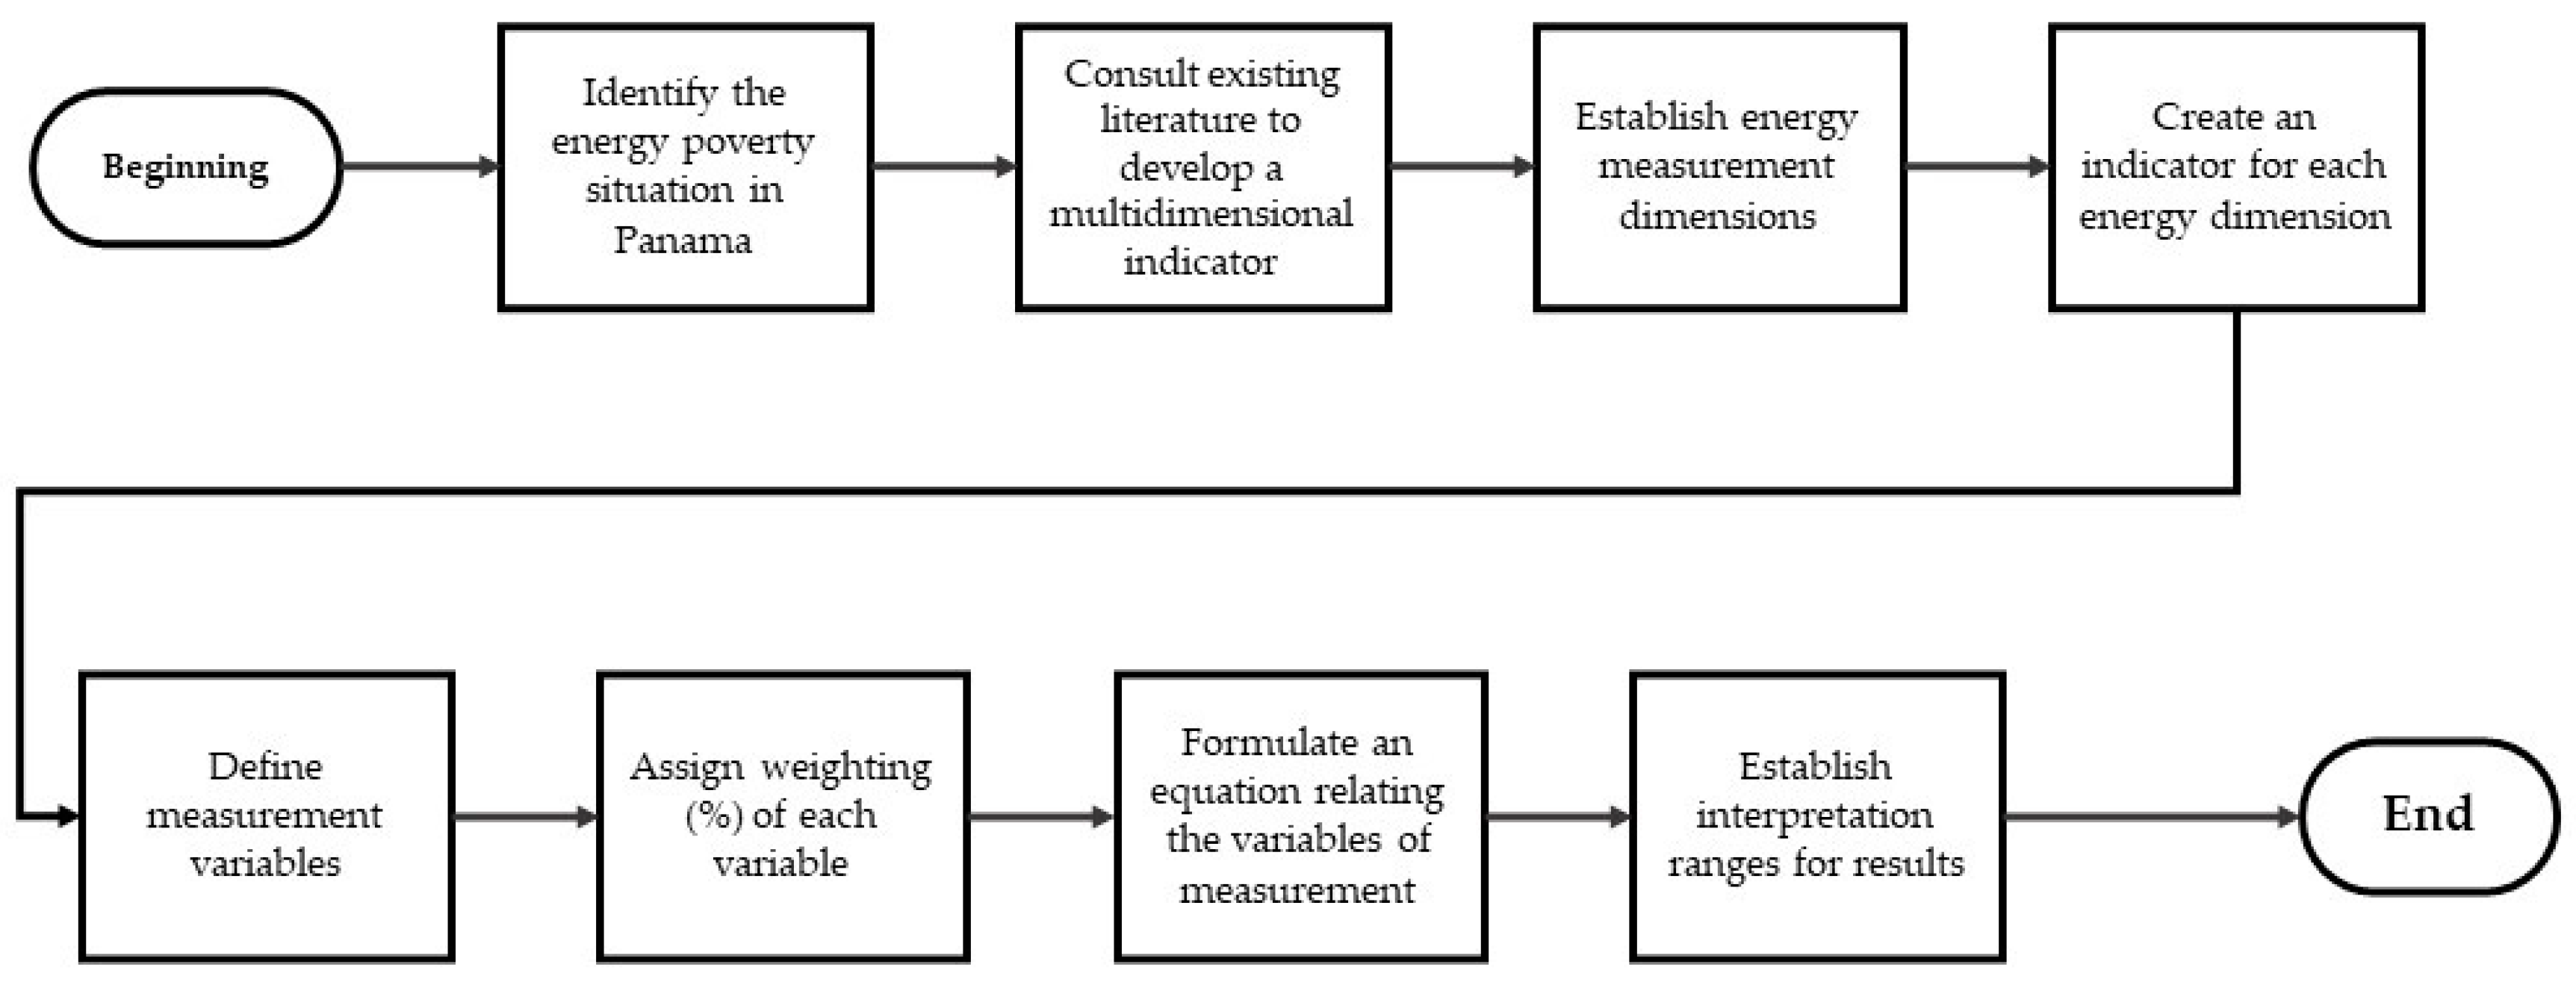
Figure 5.
EP conditions in Guásimo.

Figure 6.
EP conditions in Llano Grande Abajo.
Figure 7.
EP conditions in Los Aguilares.
Figure 8.
EP conditions in La Tranquilla.

Table 1.
Indicators for energy dimensions in Panama.
| Energy requirement dimension | Indicator | Measurement variable | Weighting (%) |
|---|---|---|---|
| Lighting | Access to electricity | People have access to electricity. They have light bulbs in their homes | 20 |
| Cooking | Possession of cooking appliances | People have stoves in their homes | 12 |
| Access to modern fuels | Type of fuel used for cooking | 12 | |
| Food refrigeration | Possession of refrigerator | People have refrigerators at home | 12 |
| Thermal comfort | Possession of fan | People have fan at home | 7 |
| Knowledge, entertainment and communication | Entertainment media and knowledge | People have TV at home | 9.25 |
| People have PC or tablet with internet access | 9.25 | ||
| People have a radio at home | 9.25 | ||
| People have cellphones or they have telephone at home | 9.25 |
Table 2.
Evaluation scheme for proposed indicator MEPIP.
| Energy requirement dimension | Economic good | Satisfaction threshold (number of goods) | Economic good verification | Economic good level | Weighting obtained (%) |
|---|---|---|---|---|---|
| Lighting | Incandescent or fluorescent light bulb | Light bulbs ≥ 3 | |||
| Cooking | Gas or electric stove | Stove ≥ 1 | |||
| LPG tank | LPG ≥ 1 | ||||
| Food refrigeration | Refrigerador | Refrigerator ≥ 1 | |||
| Thermal comfort | Fan | Fan ≥ 1 | |||
| Knowledge, entertainment and communication | TV | TV ≥ 1 | |||
| PC or tablet with internet access | PC ≥ 1 | ||||
| Radio | Radio >=1 | ||||
| Cellphone or telephone | Cellphone or telephone ≥ 1 |
Table 3.
Interpretation of results obtained for MEPIP.
| Rango de Resultado | Interpretación |
|---|---|
| MEPIP = 0.20 | There is no EP in that household |
| 0.15 < MEPIP < 0.20 | Minimum EP, conditions must improve |
| 0.10 < MEPIP < 0.15 | Household is energy poor, conditions must improve |
| MEPIP < 0.10 | Extreme EP, urgent solution needed |
Table 4.
Evaluation of energy conditions of house N°8 in Los Aguilares community.
| Energy requirement dimension | Economic good | Satisfaction threshold (number of goods) | Economic good verification | Economic good level | Weighting obtained (%) |
|---|---|---|---|---|---|
| Lighting | Incandescent or fluorescent light bulb | Light bulbs ≥ 3 | 1 | 1 | 6.67 |
| Cooking | Gas or electric stove | Stove ≥ 1 | 1 | 2 | 8 |
| LPG tank | LPG ≥ 1 | 1 | 3 | 12 | |
| Food refrigeration | Refrigerador | Refrigerator ≥ 1 | 0 | 0 | 0 |
| Thermal comfort | Fan | Fan ≥ 1 | 0 | 0 | 0 |
| Knowledge, entertainment and communication | TV | TV ≥ 1 | 1 | 3 | 9.25 |
| PC or tablet with internet access | PC ≥ 1 | 0 | 0 | 0 | |
| Radio | Radio >=1 | 1 | 3 | 9.25 | |
| Cellphone or telephone | Cellphone or telephone ≥ 1 | 1 | 3 | 9.25 |
Table 5.
Results of the implementation of the indicator for each community.
| Communities | Max. value | Min. value | S | Kurtosis | |
|---|---|---|---|---|---|
| Guásimo | 0.1042 | 0.1737 | 0.0185 | 0.0360 | -0.1323 |
| Llano Grande Abajo | 0.0492 | 0.1243 | 0 | 0.0444 | -0.2221 |
| Los Aguilares | 0.09505 | 0.1768 | 0.0308 | 0.0387 | 0.0992 |
| La Tranquilla | 0.1004 | 0.17984 | 0.03084 | 0.0385 | 0.6942 |
Disclaimer/Publisher’s Note: The statements, opinions and data contained in all publications are solely those of the individual author(s) and contributor(s) and not of MDPI and/or the editor(s). MDPI and/or the editor(s) disclaim responsibility for any injury to people or property resulting from any ideas, methods, instructions or products referred to in the content. |
© 2024 by the authors. Licensee MDPI, Basel, Switzerland. This article is an open access article distributed under the terms and conditions of the Creative Commons Attribution (CC BY) license (http://creativecommons.org/licenses/by/4.0/).
Copyright: This open access article is published under a Creative Commons CC BY 4.0 license, which permit the free download, distribution, and reuse, provided that the author and preprint are cited in any reuse.


