
Submitted:
12 March 2024
Posted:
12 March 2024
You are already at the latest version
Abstract
Significant changes to the new National College Entrance Examination (NCEE) and the implementation of the “Double First-Class” (DFC) initiative in China are coincidentally in the national spotlight and fall within the same policy window. However, few studies have investigated the effects of the new NCEE on the quality of students in DFC universities. By leveraging the 2018-2022 college admission data from Shandong Province, these effects are examined via the interrupted time-series technique. Weighted rankings for liberal arts and science disciplines and the admission ranking coefficient are adopted to ensure comparability before and after the reform. The findings reveal that after the reform, the quality of students in both world-class universities and first-class discipline universities improved, with greater improvements seen in world-class universities. Focusing on urban differences, the quality of students in DFC universities located in second-tier cities is found to have experienced a higher increase as compared with students in the first-tier and new first-tier cities. In addition, the reform has had different impacts on the quality of students in different majors. Furthermore, when selecting postsecondary institutions, high-scoring students prioritize the quality of universities and majors over urban factors. Finally, the implications of the new NCEE in relation to a sustainable development of DFC universities for research, policy, and practice are further discussed.
Keywords:
new NCEE
; “Double First-Class” universities
; quality of students
; urban differences
; interrupted time-series analysis
1. Introduction
The new National College Entrance Examination (NCEE) in China is an important reform within the education sector, the primary goal of which is to promote educational equity and scientifically select high-quality talents [1]. The reform was initiated in 2014 as a pilot program for incoming high school students in Shanghai and Zhejiang Provinces, and it was fully implemented upon their completion of their third year of high school in 2017. In the same year, Shandong, Beijing, Tianjin, and Hainan launched the second wave of the new NCEE, and fully implemented the examination in 2020. The new NCEE is characterized by two major changes, the first of which is the elimination of the distinction between liberal arts and science. Chinese, mathematics, and a foreign language (i.e., English) are compulsory, and students are allowed to choose three subjects among physics, chemistry, biology, politics, history, and geography. In the case of Zhejiang Province, one more subject, information technology, was included, thus offering students a choice from a pool of seven subjects [2]. This not only broadens students’ options but also blurs the boundaries between traditional academic majors [3,4]. Second, the reform shifts the traditional “college then major” model, in which students must choose a college before choosing their major, to the new “major + college” model, in which students can choose different majors in different colleges. This change empowers students to choose a major that is more aligned with their interests and abilities, thereby increasing their chances of admission to their preferred institution [5].
The “Double First-Class” (DFC) initiative is a higher education sustainable development strategy launched by the Chinese government in 2015. This strategy aims to establish world-class universities and first-class disciplines by 2050, with the objective of enhancing China’s international competitiveness in higher education [6]. It is regarded as another significant strategy, in addition to “Project 985” and “Project 211,” to develop world-class institutions in China [7]. DFC encompasses two components, namely world-class universities, which refer to world-famous universities, and first-class discipline universities, which aim to develop world-leading disciplines [8]. Presently, 147 universities have been selected as DFC universities, comprising 42 world-class universities and 105 first-class discipline universities. Notably, among these 147 DFC universities, 112 are “Project 211” universities (including 39 “Project 985” universities), while 35 are non-211 universities. These universities are at the forefront of Chinese higher education, bearing the important responsibility of cultivating high-level innovative talents, advancing scientific and technological innovation, contributing to national strategies, and leading societal progress [9]. From the perspective of elite education, it is important for these DFC universities to recruit high-quality students to more effectively cultivate the nation’s needed talents and achieve the goals of the DFC initiative. Given that the two major higher education policies (i.e., the new NCEE and the DFC initiative) are in the same policy window, it is crucial to understand whether the new NCEE impacts the recruits of high-quality students into DFC universities.
Research has found that the quality of students is an important factor that impacts the development of higher education institutions across the world [10,11,12]. Students’ NCEE scores are the only criterion for the processing of regular admissions by Chinese higher education institutions. Therefore, the lowest admission score/rank of a university is one of the widely used dimensions by which to assess the quality of students in this university [13,14,15]. Focusing on the effects of the new NCEE on the quality of students in DFC universities, the extant literature has revealed different results. For example, Ma et al. [16] utilized data from Zhejiang Province and found an upward trajectory in the quality of students in DFC universities after the enactment of the new NCEE. Targeting the same province, Jin and Zhang [17] observed no substantial disciplinary variations in the quality of students in DFC universities following the implementation of the new NCEE; however, such differences were identified in non-DFC universities. Based on interviews with 93 faculty members in six DFC universities, Wang [18] contended that the new NCEE mainly affects the quality of students in vocational colleges rather than in DFC universities. However, these prior studies either focused on the first wave of the NCEE in the pilot province (i.e., Zhejiang) or used subjective qualitative data with a relatively small sample size. It remains unknown how the new reform in the second-wave provinces affects the quality of students in DFC universities.
Importantly, studies have also suggested that the geographical location of universities is one of the most influential factors of the choice of college by students [19,20,21]. This is mainly because students generally believe that attending a university in a city with a strong economy will lead to better prospects for post-graduation development, such as job-seeking [6]. Consequently, whether urban disparities exist in the effects of the new NCEE on the quality of students in DFC universities is worthy of exploration. The findings can provide valuable insights for these institutions to formulate more effective enrollment strategies tailored to local conditions. Nevertheless, research in this domain remains largely uncharted.
The purpose of this study is to investigate the effects of the new NCEE on the quality of students in DFC universities. Utilizing the enrollment data of DFC universities from 2018 to 2022 in Shandong Province, the interrupted time-series technique is applied to fulfill the research purpose. This study contributes to both NCEE and DFC literature on whether and how the new NCEE impacts DCF universities. Moreover, it also offers practical contributions that can better inform higher education stakeholders about the effectiveness of the new NCEE, and make informed decision on the sustainable development of DFC universities to maintain high-level competitiveness in the global higher education.
2. Materials and Methods
2.1. Data Sources and Samples
The enrollment data of DFC universities in Shandong Province from 2018 to 2022 served as the foundational dataset for this study, and were primarily sourced from the official website of the Shandong Education Examination Institute. The data were supplemented by data from the Sunshine NCEE Network of the Ministry of Education, as well as China Education Online. The selection of Shandong was motivated by its status as a significant gaokao province with a large student population affected by the new NCEE. In addition, the new NCEE and DFC initiative fall within the same policy window. Another important reason for the selection of DFC universities as the research target was to reduce variations in the NCEE scores. In general, substantial variations in admission scores exist among different types and levels of universities, making meaningful comparisons and analysis challenging. Hence, this study was focused on 147 DFC universities to maintain the consistency of institutional selectivity at the same level. It should be noted that 14 specialized institutions, such as art- and military-based higher education institutions, have marked differences in admission mechanisms as compared with regular institutions; thus, such institutions were excluded.
In addition, to reduce potential influences stemming from the DFC initiative itself, 22 of the 35 non-211 first-class discipline universities were excluded. Moreover, five universities located in the western regions of the province were excluded due to high volatility in their annual enrollment patterns. One university was also omitted from the analysis due to its incomplete data. Thus, the final analytic sample comprised 105 universities, including 39 world-class universities (37.14%), and 66 first-class discipline universities (62.86%).
Table 1 reports the distribution of universities across various levels and majors, both before and after the reform. Given the wide array of majors in the experimental class, these have been designated as a separate category for comparison. In total, these 105 universities offered 3133, 3031, 2669, 2630, and 2707 enrollment majors in the years 2018-2022, respectively. Among the DFC universities, world-class universities accounted for 34.46% of enrollment majors, whereas first-class discipline universities constituted 65.54%. In terms of majors, engineering claimed the largest share at 40.08%, followed by science at 12.14% and management at 11.14%. History (0.95%), education (0.60%), and philosophy (0.56%) represented smaller proportions. Overall, between 2018 and 2022, the majority of enrollment in DFC universities in Shandong pertained to science, engineering, and management, accounting for more than 63%. Although the distribution of enrollment across various majors exhibited fluctuations before and after the new NCEE reform, the overall proportions remained relatively stable.
2.2. Variable Settings
2.2.1. Comprehensive Admission Rank
When comparing admission scores before and after the new NCEE, ensuring comparability before and after the reform is crucial. Although previous studies employed various strategies to ensure the comparability of liberal arts and science rankings before and after the reform, they often failed to consider the impact of the examinee base on admission rankings [16]. To accurately gauge the quality of college students, the lowest admission rank for each major was employed as the benchmark for evaluation. In essence, the lowest admission rank indicates the ranking of the student with the lowest scores within a specific major in the province. Following the implementation of the new NCEE, an increase of the lowest admission rank for a major signifies an enhancement in the quality of students within that major. Conversely, a decrease in this rank indicates a decline in quality. There are three reasons for using the lowest admission rank. First, compared with the average and highest admission ranks, the lowest admission rank more sensitively reflects the impact of the NCEE reform on the quality of students. In general, because the number of students applying for a certain major in a DFC university is usually higher than the admission quota, the university must screen according to the test scores from highest to lowest, so the lowest admission rank is affected by the number of students who choose the university and major. If the competition is fierce, i.e., if many students choose the university and major, then the lowest admission rank is usually low, which reflects the improvement of the quality of students. Therefore, the lowest admission rank can intuitively reflect the overall quality of students. Second, the highest admission rank only represents the rank of the student with the highest score, and its fluctuation may be affected by various accidental factors, such as the student’s self-application misconduct resulting in not being admitted by the first choice, which reflects the problem of using the highest admission rank to evaluate the quality of students. Finally, the average admission rank is also easily affected by the extreme values of the highest rank and deviates from the highest and lowest admission ranks [17].
However, in consideration of the distinct differences between the admission procedures for liberal arts and science majors before the reform of the NCEE in Shandong Province and the comprehensive admission procedures after the reform, direct comparisons of the rankings before and after the reform are not straightforward. To ensure the comparability of the data before and after the reform and to explore shifts in the quality of students, the approach outlined by Ma et al. [16], namely the weighted comprehensive ranking method, was adopted for liberal arts and science. The determination of these weights is grounded in the equivalence of abilities between liberal arts and science students occupying the same rank. In other words, it is assumed that, on the college admission line, the abilities or ranks of liberal arts and science students are equal, and thus they have an equivalent rank. The specific calculation for the comprehensive ranking of liberal arts and science is expressed as
where CARAS represents the comprehensive rank formed by converting the admission ranks of liberal arts and sciences students in the old college entrance examination. MARAS refers to the specific admission rank in the old college entrance examination for a particular liberal arts or sciences subject without conversion. ERS is the rank corresponding to the undergraduate cutoff set for the science program for that year, and, similarly, ERA corresponds to the rank corresponding to the undergraduate cutoff set for the liberal arts program for that year. Finally, ERAS corresponds to the ranks associated with the undergraduate cutoffs set for the science and liberal arts programs for that year.
2.2.2. Admission Rank Coefficient
Although the construction of the comprehensive rank for liberal arts and science students provides a basis for comparing the ranks before and after the reform, due to inconsistencies in student bases, it fails to provide a true reflection of the difference in the quality of students across different years. The variance in the total number of students in different years results in variations in the quality of students represented by the same rank in different years. To illustrate, in Shandong Province, the number of students in 2022 was 594,771, whereas in 2021, the count stood at 544,424, representing a difference of 50,347 individuals. In this context, a simple examination of comprehensive admission ranks cannot accurately gauge the quality of the 1000th student in 2022 versus the 1000th student in 2021. To address this challenge and enable equitable comparisons between years, the concept of the admission rank coefficient (ARC) is introduced to precisely reflect the quality of students represented by their rank.
The formula for calculating this coefficient is as follows:
where ARC is the ratio of the CARAS calculated using Eq. (1) to the total number of candidates taking the examination in that year. CARAS represents the comprehensive rank formed by converting the admission ranks of liberal arts and sciences students in the old college entrance examination. Finally, TC refers to the total number of candidates who participated in the high school entrance examination in the province that year.
A smaller ARC signifies a higher quality of students. Via the use of the ARC, admission data from different years can be standardized, thus mitigating any rank evaluation discrepancies arising from fluctuations in the examinee base. This coefficient offers a more robust and rational criterion for the evaluation of the quality of students, and was employed as a research variable in subsequent analyses.
2.3. Econometric Model
To investigate the alterations in the quality of students at DFC universities in Shandong Province before and after the implementation of the new NCEE reform, the interrupted time-series analysis (ITSA) model was employed [22,23]. ITSA is a widely used method for the assessment of the efficacy of substantial interventions or policy changes, particularly in situations in which finding an appropriate control group proves challenging. It offers both quantitative and qualitative insights into the impact of a policy or intervention by scrutinizing trends before and after an event. The specific model is represented as follows:
here the marker i represents a particular major at a university, t refers to the year, and s and m represent the school and major, respectively. The target variable Yitsm represents the ARC converted by the previous method. The year range corresponding to the time variable Tt is from 2018 to 2022, with corresponding values from 1 to 5. Dt is a dummy variable used to distinguish the situation before and after the implementation of the reform; its value is 1 after the reform and 0 before the reform. In addition, Pt describes the number of years since the implementation of the reform, with a value of 0 for 2019 and before, and values from 1 to 3 for the years 2020 to 2022, respectively. quotaitsm is the admission quota of school s in major m, and collegess and majorm respectively represent the fixed effects of schools and majors. Moreover, b0 is the starting level of the observation, b1 is the development trend before the reform, b2 is the immediate effect in the year of the reform, and b3 represents the change trend after the reform. Finally, b4 represents the change in the number of students enrolled.
Given the likelihood of distinct impacts of the new NCEE reform on the quality of students across various university types, disciplines, majors, and cities, the model was expanded and sub-sample regression was utilized to explore potential heterogeneous effects. To accurately distinguish disciplines, reference was made to the ‘‘Catalogue of Undergraduate Majors in General Universities’’ issued by the Ministry of Education in 2022.
Regarding the differentiation between popular and unpopular majors, inspiration was drawn from MyCOS China’s tracking and evaluation data of 2018–2022 university graduates [24]. “Green card” majors signify popular fields, whereas “red card” majors designate less popular ones. Over the past five years, there have been 14 popular majors, including Information Engineering, Electrical Engineering and Automation, Energy and Power Engineering, Microelectronics Science and Engineering, Road, Bridge, and River-Crossing Engineering, Mechanical and Electronic Engineering, Network Engineering, Information Security, Digital Media Technology, Software Engineering, Digital Media Art, Communication Engineering, Internet of Things Engineering, and Computer Science and Technology. By contrast, there were eight unpopular majors, namely Law, Painting, Applied Psychology, Chinese International Education, Educational Technology, Music Performance, Chemistry, and History.
Regarding the examination of urban disparities, cities were primarily classified into six tiers based on their comprehensive strength, with reference made to the ‘‘City Business Charm List’’ in 2023. According to this list, the 105 cities in the sample were matched with their corresponding rankings. Among these cities, 37, 43, 21, 3, 0, and 1 DFC universities are located in first-tier, new first-tier, second-tier, third-tier, fourth-tier, and fifth-tier cities, respectively. Notably, the majority of DFC universities are situated in second-tier cities and above.
3. Results
3.1. Overall Impact of the New NCEE Reform on the Quality of Students in DFC Universities
To analyze the evolving trend of the quality of students at DFC universities from 2018 to 2022, a comprehensive statistical analysis of the average ARC was conducted, as shown in Figure 1. The statistical findings reveal that the average ARC for DFC universities over the past five years was 3.08. Within this range, the lowest coefficient recorded was 2.93, and the highest was 3.16. Upon closer examination, it becomes evident that the average ARC experienced an increase preceding the reform and a decline in the year of the reform, followed by a continued decrease. This pattern suggests that after the implementation of the new NCEE reform, the overall quality of students in DFC universities exhibited a consistent upward trajectory. The descriptive statistics offer a straightforward comparison of the quality of students. To delve deeper into the overall impact of the new NCEE reform policy on the quality of students in DFC universities, as well as to discern changes in different types of schools, regression analyses were conducted for three scenarios. Given that the ARC for world-class universities is higher and exhibits a smaller range of change than that of first-class discipline universities, direct comparisons between the two may be misleading. To address this, the logarithm of the ARC was employed as the dependent variable, with fixed effects for schools and majors. Table 2 reveals that prior to the reform, the quality of students in DFC universities exhibited a declining trend that was more pronounced in world-class universities. In the year of the reform, the quality of students experienced a significant increase in both types of DFC universities, with the increases being closely aligned. As the reform progressed, the quality of students in world-class universities and first-class discipline universities further improved, with respective coefficients of -0.069 (p < 0.01) and -0.046 (p < 0.001). Notably, the improvement in the quality of students in world-class universities surpassed that of first-class discipline universities. This pattern underscores that the new NCEE reform has facilitated the enhancement of the quality of students in DFC universities, highlighting a trend of “the stronger, the better”.
3.2. Influence of the New NCEE Reform on the Quality of Students from DFC Universities in Different Cities
To gain deeper insights into the impact of the new NCEE reform on the quality of students in DFC universities situated in cities of various levels, an analysis of the diversity of the quality of students among the 105 DFC universities located in first-tier, new first-tier, and second-tier cities was conducted. DFC universities in third-tier to fifth-tier cities are underrepresented, with only four institutions, making them unsuitable for analysis (the same applies for the subsequent investigations). Table 3 reveals that prior to the reform, the quality of students in DFC universities located in first-tier cities experienced a decline (β = 0.062, p < 0.05). In contrast, the quality of students in new first-tier cities and second-tier cities remained relatively stable. In the year of the reform, the quality of students in second-tier cities experienced a decline (β = 0.157, p < 0.1), whereas there was minimal change in the quality of students in first-tier cities and new first-tier cities. This suggests that universities in second-tier cities were more sensitive to policy-induced uncertainties in the year of the reform as compared to their counterparts in first-tier cities and new first-tier cities. After the reform, the quality of students in DFC universities in these three types of cities demonstrated a significant improvement. Notably, the quality of students in second-tier cities exhibited the most substantial improvement, followed by new first-tier cities, whereas the least improvement was observed in first-tier cities. This variance may be attributed to the fierce competition in first-tier cities. The new NCEE reform, on the one hand, incentivizes students to explore non-popular cities, and, on the other hand, suggests that urban factors are not the primary consideration for high-achieving students.
3.3. Influence of the New NCEE Reform on the Quality of Students in Different Majors
To examine potential differences in the impact of the new NCEE reform on the quality of students among various majors and between popular and unpopular majors, analyses of samples from different disciplines and majors were conducted. To facilitate comparisons, economics and management, law, philosophy, history, and education were merged into the social science discipline. The other disciplines remained unchanged.
Table 4 indicates that prior to the reform, the quality of students in the economics and management discipline experienced a gradual decline. In contrast, the quality of students in the social science discipline saw a gradual improvement, whereas the quality of students in other disciplines generally remained stable. In the year of the reform, the quality of students in humanities and social sciences significantly declined, whereas the quality of students in the sciences markedly improved. The quality of students in other disciplines generally remained stable. Notably, the ARC of students in the humanities discipline increased by 0.615 (p < 0.001), representing the most substantial change among all disciplines and indicating a sharp decline in the quality of students in humanities and social sciences during the reform year. After the reform, the quality of students in five disciplines – economics and management, humanities, social sciences, engineering, and medical science – exhibited a notable upward trend. Among these, medical science exhibited the most significant improvement. This suggests that, following the reform, the quality of students in humanities and social sciences gradually improved. Furthermore, there was a reversal in the economics and management discipline, for which the trend shifted from a decline prior to the reform to a significant improvement. This transformation could be attributed to the new NCEE reform, which imposed fewer restrictions on subject selection for these two fields. The quality of students in the relatively unpopular agronomy discipline and the relatively popular experimental programs remained stable during this period.
In addition, before the reform of the new NCEE, the quality of students in both unpopular and popular majors remained stable. In the reform year, the quality of students in unpopular majors experienced a significant decline (β = 0.062, p < 0.05), whereas that for popular majors remained stable. With the continued implementation of the reform, the quality of students in popular majors exhibited a significant improvement, with a coefficient of -0.191 (p < 0.01), and the quality of students in unpopular majors also transitioned from a decline in the reform year to an improvement, with a coefficient of -0.146 (p < 0.1). Overall, the magnitude and significance of the improvement of the quality of students in unpopular majors were lower than those for popular majors.
3.4. Majors, Universities, or City: Choice Preference Based on the Quality of Students
3.4.1. Majors or Universities
The new NCEE voluntary application mode is the “major + college” approach, which emphasizes professional orientation while expanding the autonomy of students in selecting their field of study. Since the reform of the new NCEE, it is important to investigate whether high-scoring candidates prioritize colleges or majors when filling out their preferences. Table 5 reports a comparative analysis of the quality of students who opted for popular majors in first-class discipline universities as compared to unpopular majors in world-class universities. World-class universities are generally considered to be of higher caliber than first-class discipline universities due to their superior comprehensive strength. The regression results reveal that, although the improvements in the quality of students in these two types of universities were similar in the year of the reform, after the new NCEE reform, the increase in the quality of students in unpopular majors at world-class universities became significantly greater than that for popular majors at world-class universities. This result indicates that, post-reform, high-scoring students tended to prioritize choosing non-popular majors at prestigious universities, thus emphasizing the preference for the institution over the major.
3.4.2. Cities or Majors
Studies have shown that the city is one of the important factors that students consider when applying colleges [25,26,27]. Post-reform, high-scoring candidates must decide between good majors and desirable cities. Table 6 compares and analyzes the quality of students in green card majors in second-tier cities and red card majors in first-tier cities. The regression results indicate that after the new NCEE reform, the change in the ARC for students with green card majors in second-tier cities was -0.179 (p < 0.001), and that for students with red card majors in first-tier cities was -0.090 (p < 0.01). The improvement in the quality of students with green card majors in second-tier cities was found to be significantly greater than that for students with red card majors in first-tier cities. This demonstrates that, post-reform, high-scoring students are more inclined to select excellent majors in less popular cities, emphasizing the importance of the major over the city.
3.4.3. Cities or Universities
Our previous analysis revealed that high-scoring candidates tend to prioritize majors when confronted with the choice between popular cities and popular majors. What if the choice was between a popular city and a prestigious institution? To address this question, Table 7 compares the quality of students at world-class universities in second-tier cities with the quality of students at first-class discipline universities in first-tier cities. Second-tier cities are less popular, whereas first-tier cities are more popular. The regression results reveal that after the new NCEE reform, the change in the ARC for students at world-class universities in second-tier cities was -0.059 (p < 0.001), whereas that for students at first-class discipline universities in first-tier cities was -0.056 (p < 0.001). The improvement in the quality of students at world-class universities in second-tier cities was slightly greater than that for first-class discipline universities in first-tier cities. This suggests that high-scoring candidates do not prioritize popular cities; rather, they tend to choose prestigious universities over well-known cities.
4. Discussion
This study explored the impact of the new NCEE reform on student quality at DFC universities in Shandong Province, China. The interrupted time-series model was employed to scrutinize variations in student quality across disciplines, institutional levels, and urban tiers. The ARC, which is derived from a weighted comprehensive admission score, was introduced to facilitate valid and comparable assessments of student rankings in liberal arts and science disciplines pre- and post-reform. The findings indicate significant enhancements in student quality post-reform, particularly in world-class universities as compared to first-class discipline universities. Moreover, a marked preference was found among high-achieving students for DFC universities in less popular cities post-reform, with the most substantial quality improvements observed in second-tier cities. The reform has notably elevated student quality in five key disciplines: economics and management, humanities, social sciences, engineering, and medical sciences, with the latter witnessing the most significant improvements. Furthermore, post-reform, high-achieving students are increasingly prioritizing institutional and major quality over urban allure in their university selections, signalling a shift toward prestigious institutions and sought-after fields of study. This comprehensive analysis underscores the transformative effects of the NCEE reform on the educational landscape and student distribution among China’s elite universities.
Prior research has demonstrated the positive impacts of the new NCEE reform on the quality of students in both world-class universities and first-class discipline universities [16]. Notably, the present study aligns with previous findings by affirming that the quality of students has improved across these university types, with a more pronounced effect observed in world-class universities. This improvement is primarily concentrated in disciplines such as humanities, social sciences, economics, and management, along with experimental programs. Popular majors were found to have experienced a more significant increase in the quality of students, which is consistent with the findings of earlier research [16]. Given that college majors such as science, technology, engineering, and mathematics (STEM) have received widespread attention from both governments and academic communities [28,29], this study introduced a novel dimension to the discussion by suggesting that the influence of the reform extends beyond the traditional liberal arts disciplines, and specifically encompasses fields such as medical science and engineering.
The surge in the quality of medical students may be linked to the COVID-19 pandemic that commenced at the end of 2019, which coincided with the initiation of the new NCEE reform. Studies have indicated a heightened interest among candidates in pursuing medical majors in response to the pandemic [30,31,32,33]. In the case of engineering, the improvement may be attributed to two policy guidelines in relation to high school subject selection and basic discipline enhancement. These guidelines not only mandated high school students to select physics for admission to 19 major categories, with engineering accounting for 13 of these categories [34], but also encouraged students to major in basic disciplines such as engineering [35]. These policies aimed to encourage more students to choose physics [35,36], a move supported by studies showing that students who actively select physics as an elective subject often exhibit strong academic performance [37]. The subsequent improvement in the quality of students in engineering can be indirectly linked to the implementation of these 2020 guidelines.
A notable trend in education is the attraction of talent and resources to metropolises and first-tier cities, whereas smaller cities and regions grapple with the challenge of brain drain [13,38,39]. This tendency is particularly evident in the education sector, where students and parents often perceive big cities as offering greater educational resources and opportunities [40]. Despite this, the findings of the present study reveal a noteworthy departure from this trend. Under the new NCEE system, the choices of students appear to be increasingly influenced by the reputation of institutions and the appeal of specific majors, rather than by their geographical location or historical standing. This suggests that the new NCEE reform has generated heightened demand among students, particularly those with high scores, for prestigious institutions and sought-after majors. These trends reflect the broader impact of the reform, characterized by its emphasis on professional orientation, parallel volunteer applications, increased student autonomy, and the introduction of career planning education for high school students [3].
Although this study offers valuable insights into the multifaceted impact of the new NCEE reform on the quality of students in DFC universities, it is important to acknowledge its limitations. First, the dataset adopted in this research covers the years from 2018 to 2022, reflecting a relatively short time span. While this may have captured the initial effects of the reform, it may not fully represent its long-term impact. Second, because the majority of DFC universities are naturally located in first-tier to second-tier cities, the analysis of urban disparities was mainly focused on these cities, thus potentially limiting the representativeness of urban disparities across all levels of cities. This study also utilized broad major categories, which may have obscured variations within specific disciplines. In future research, the dataset should be expanded to encompass more years and a wider array of selective universities while more deeply examining the differences among disciplines. Furthermore, given that students with low socioeconomic status are an important component of Chinese higher education (Liu et al., 2019), scholarly attention could be further focused on whether the reform has had significant effects on the entrance of such students to DFC universities.
Author Contributions
Y.Z. built the overall methodology, and wrote the manuscript. T.Z. processed and calculated data. Y.Y. built the model. L.W. and C.L. collected and collated data. J.Q. checked the title and supervised. All authors have read and agreed to the published version of the manuscript.
Funding
This research was supported by the Humanities and Social Sciences Programme of the Ministry of Education of China (19YJC880138) and the General Programme of the Social Sciences Federation of Zhejiang Province (2018N53).
Institutional Review Board Statement
Not applicable – no human subjects are involved.
Informed Consent Statement
Not applicable – no human subjects are involved.
Data Availability Statement
The datasets used and analyzed during the present study are not publicly available due to the protection of participants privacy, but statistical code generated to analyze supporting the findings of this study are available upon request from Teng Zhao, email: zhaoteng@hdu.edu.cn.
Conflicts of Interest
The authors declare no conflict of interest.
References
- Zhang, Y. , History and future of the national college entrance exam (ncee) in china, in National college entrance exam in china: Perspectives on education quality and equity. 2016, Springer Singapore: Singapore. p. 1-15.
- Li, J.; Xue, E. Pursuing Sustainable Higher Education Admission Policy Reform: Evidence from Stakeholders’ Perceptions in China’s Pilot Provinces. Sustainability 2022, 14, 11936. [Google Scholar] [CrossRef]
- Zhu, P.; Li, M.; Zhu, Z. Diversification of subject combinations in the National College Entrance Examination and educational reforms in senior secondary schools: findings from China’s policies on college admissions. Asia Pac. Educ. Rev. 2024, 1–12. [Google Scholar] [CrossRef]
- Jian, L. Exploring new college entrance examination (“xin gao kao”) policy in china: National values and regional practices. Beijing International Review of Education. 2020, 2, 466–471. [Google Scholar] [CrossRef]
- Bodenhorn, T.; Burns, J.P.; Palmer, M. Change, Contradiction and the State: Higher Education in Greater China. China Q. 2020, 244, 903–919. [Google Scholar] [CrossRef]
- Shields, R. , Measurement and isomorphism in international education, in The SAGE Handbook of Research in International Education, M. Hayden, J. Levy, and J.J. Thompson, Editors. 2015, SAGE: London.
- Lin, L.; Wang, S. China’s Higher Education Policy Change from 211 Project and 985 Project to the Double-first-class Plan: Applying Kingdon's Multiple Streams Framework. High. Educ. Policy 2021, 35, 808–832. [Google Scholar] [CrossRef]
- Liu, D.; Ku, H.-Y.; Morgan, T.L. The condition of poverty: a case study of low socioeconomic status on Chinese students’ National College Entrance Exam and college enrolment. Asia Pac. J. Educ. 2019, 39, 113–132. [Google Scholar] [CrossRef]
- Lu, G.; Wen, S. Are Students’ Abilities Better Developed at Double First-class Universities? Evidence from Chinese University Graduates. Res. High. Educ. 2023, 65, 303–321. [Google Scholar] [CrossRef]
- Hurtado, S. The institutional climate for talented Latino students. Res. High. Educ. 1994, 35, 21–41. [Google Scholar] [CrossRef]
- Lepori, B.; Seeber, M.; Bonaccorsi, A. Competition for talent. Country and organizational-level effects in the internationalization of European higher education institutions. Res. Policy 2015, 44, 789–802. [Google Scholar] [CrossRef]
- Ng, P.T. The global war for talent: responses and challenges in the Singapore higher education system. J. High. Educ. Policy Manag. 2013, 35, 280–292. [Google Scholar] [CrossRef]
- Lamprianou, I. Comparability of examination standards between subjects: an international perspective. Oxf. Rev. Educ. 2009, 35, 205–226. [Google Scholar] [CrossRef]
- Zhang, Y. Does private tutoring improve students’ National College Entrance Exam performance?—A case study from Jinan, China. Econ. Educ. Rev. 2013, 32, 1–28. [Google Scholar] [CrossRef]
- Zhou, Y.-X.; Zhao, Z.-T.; Li, L.; Wan, C.-S.; Peng, C.-H.; Yang, J.; Ou, C.-Q. Predictors of first-year GPA of medical students: a longitudinal study of 1285 matriculates in China. BMC Med Educ. 2014, 14, 87–87. [Google Scholar] [CrossRef] [PubMed]
- Ma, L. , Bu, S., and Ye, X. The impact of college entrance examination reform on admissions quality of the “double first-class” construction universities: Evidence from admissions data from zhejiang (2014-2020). China Higher Education Research. 2021, 32-39. [CrossRef]
- Jin, H. and Zhang, W. Analysis of the impact of the new college entrance examination reform on the student quality of various majors: An empirical study based on the enrollment data of universities in zhejiang province. China Higher Education Research. 2021, 74-80. [CrossRef]
- Wang, X. The evaluation of the comprehensive reform of college entrance examination: From the perspective of students’ academic performance. China Higher Education Research. 2020, 73–78. [Google Scholar] [CrossRef]
- Briggs, S. An exploratory study of the factors influencing undergraduate student choice: the case of higher education in Scotland. Stud. High. Educ. 2006, 31, 705–722. [Google Scholar] [CrossRef]
- Simões, C.; Soares, A.M. Applying to higher education: information sources and choice factors. Stud. High. Educ. 2010, 35, 371–389. [Google Scholar] [CrossRef]
- Fosu, F.F. and Poku, K. Exploring the factors that influence students’ choice of higher education in ghana. European Journal of Business and Management. 2014, 6, 209–220. [Google Scholar]
- Linden, A. Conducting Interrupted Time-series Analysis for Single- and Multiple-group Comparisons. Stata Journal: Promot. Commun. Stat. Stata 2015, 15, 480–500. [Google Scholar] [CrossRef]
- Bernal, J.L.; Cummins, S.; Gasparrini, A. Interrupted time series regression for the evaluation of public health interventions: A tutorial. Int. J. Epidemiol. 2017, 46, 348–355. [Google Scholar] [CrossRef]
- MyCOS Research Institute. Employment report of chinese undergraduates in 2022. 2023, Beijing: Social Sciences Academic Press.
- Agrey, L. and Lampadan, N. Determinant factors contributing to student choice in selecting a university. Journal of Education and Human Development. 2014, 3, 391–404. [Google Scholar]
- Urmi, U.F.; Rahman, K.; Uddin, J.; Hasan, M.N. The Prevalence of Active Commuting to School and the Factors Influencing Mode Choice: A Study of University Students in a Secondary City of Bangladesh. Sustainability 2022, 14, 16949. [Google Scholar] [CrossRef]
- Le, T.D.; Le, N.V.; Nguyen, T.T.; Tran, K.T.; Hoang, H.Q. Choice Factors When Vietnamese High School Students Consider Universities: A Mixed Method Approach. Educ. Sci. 2022, 12, 779. [Google Scholar] [CrossRef]
- Zhao, T.; Perez-Felkner, L. Perceived abilities or academic interests? Longitudinal high school science and mathematics effects on postsecondary STEM outcomes by gender and race. Int. J. STEM Educ. 2022, 9, 1–26. [Google Scholar] [CrossRef]
- Wang, X. Why students choose stem majors: Motivation, high school learning, and postsecondary context of support. American Educational Research Journal. 2013, 50, 1081–1121. [Google Scholar] [CrossRef]
- Deng, J.; Que, J.; Wu, S.; Zhang, Y.; Liu, J.; Chen, S.; Wu, Y.; Gong, Y.; Sun, S.; Yuan, K.; et al. Effects of COVID-19 on career and specialty choices among Chinese medical students. Med Educ. Online 2021, 26, 1913785. [Google Scholar] [CrossRef]
- Zhang, R.; Pei, J.; Wang, Y.; Wang, L.; Yeerjiang, Y.; Gao, H.; Xu, W. COVID-19 outbreak improves attractiveness of medical careers in Chinese senior high school students. BMC Med Educ. 2022, 22, 1–12. [Google Scholar] [CrossRef]
- Gong, Z.; Li, W.; Bu, H.; He, M.; Hou, H.; Ma, T.; Hu, X.; Fu, L.; Adu-Amankwaah, J.; Sun, H. Impact of COVID-19 pandemic on the professional intention of medical and related students. BMC Med Educ. 2021, 21, 1–7. [Google Scholar] [CrossRef]
- Cai, C.Z.; Lin, Y.; Alias, H.; Hu, Z.; Wong, L.P. Effect of the COVID-19 Pandemic on Medical Student Career Perceptions: Perspectives from Medical Students in China. Int. J. Environ. Res. Public Heal. 2021, 18, 5071. [Google Scholar] [CrossRef]
- Tong, D., Zhou, S., and Xing, H. The “cold” thinking of elective physics——analysis based on the “subject requirements for undergraduate majors of general colleges and universities to be enrolled in beijing in 2020”. Journal of Curriculum and Instruction. 2018, 60–64.
- Zhao, T. China’s Sustainable Talent Cultivations for Basic Disciplines: Evaluating the Reformed National College Enrollment Policy. Sustainability 2023, 15, 3545. [Google Scholar] [CrossRef]
- Liu, X. The utilitarian nature and correction of the selection of subjects for science and engineering enrollment majors in colleges. Journal of Fujian Normal University (Philosophy and Social Sciences Edition). 2022, 159-168. [CrossRef]
- Jian-Xin, Y.; Yu-Xuan, X.; Tian, L.; Chu-Fan, D.; Yu-Ying, G.; Fortus, D. Disciplinary Learning Motivation and Its External Influencing Factors: Taking Physics in a “Selection Crisis” as an example. Res. Sci. Educ. 2023, 53, 823–839. [Google Scholar] [CrossRef]
- Fan, S. , Kanbur, R., Wei, S.-J., and Zhang, X. The economics of china: Successes and challenges. National Bureau of Economic Research Working Paper Series. 2013, No. 19648. [CrossRef]
- Cui, C.; Wang, Y.; Wang, Q. The Interregional Migration of Human Capital: The Case of “First-Class” University Graduates in China. Appl. Spat. Anal. Policy 2021, 15, 397–419. [Google Scholar] [CrossRef]
- van Maarseveen, R. The urban–rural education gap: do cities indeed make us smarter? J. Econ. Geogr. 2020, 21, 683–714. [Google Scholar] [CrossRef]
Figure 1.
Variation of average ARC with time.
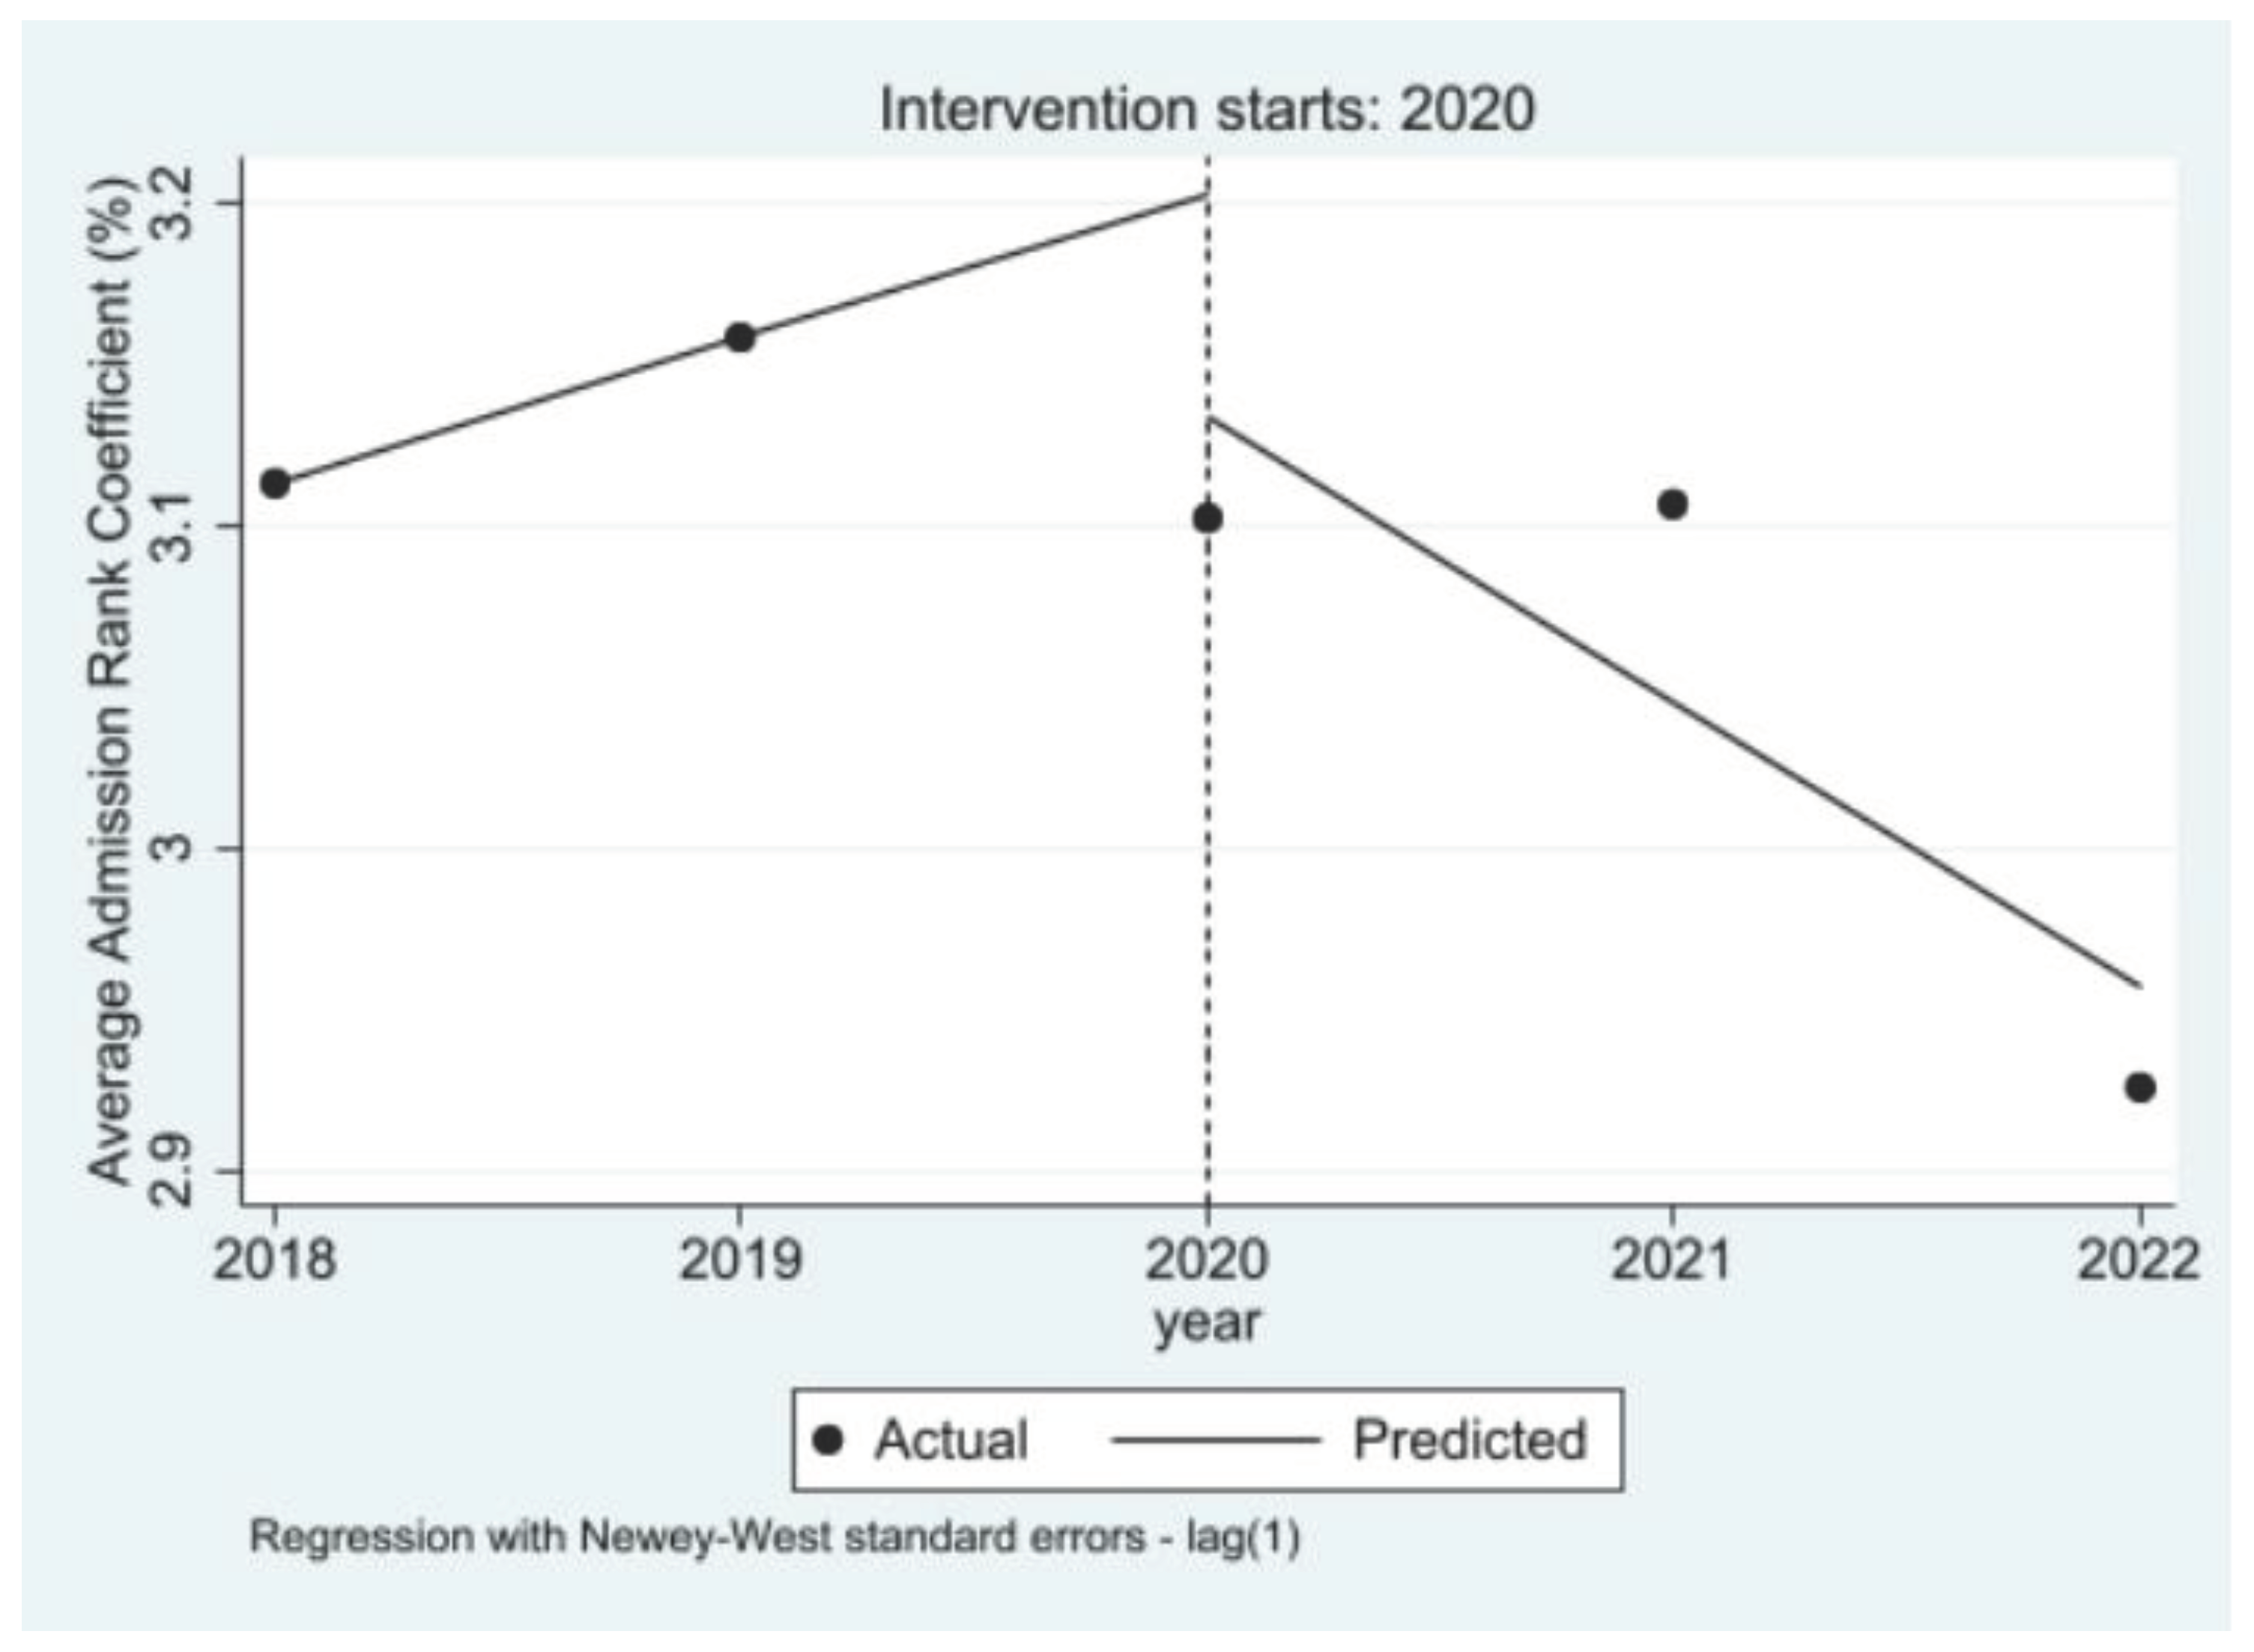

Table 1.
Number of enrollment majors in different university types and disciplines from 2018 to 2022.
Table 1.
Number of enrollment majors in different university types and disciplines from 2018 to 2022.
| Category | Full Sample | Proportion | Before the Reform | After the Reform | ||||
|---|---|---|---|---|---|---|---|---|
| 2018 | 2019 | 2020 | 2021 | 2022 | ||||
| DFC universities | World-class universities | 4,883 | 34.46% | 1,168 | 1,068 | 874 | 872 | 901 |
| First-class discipline universities | 9,287 | 65.54% | 1,965 | 1,963 | 1,795 | 1,758 | 1,806 | |
| Major category | Management | 1,579 | 11.14% | 387 | 341 | 300 | 275 | 276 |
| Neo-Confucianism | 1,720 | 12.14% | 374 | 379 | 332 | 315 | 320 | |
| Experimental class | 650 | 4.59% | 125 | 144 | 100 | 139 | 142 | |
| Jurisprudence | 710 | 5.01% | 153 | 157 | 129 | 132 | 139 | |
| Engineering | 5,679 | 40.08% | 1,273 | 1,197 | 1,082 | 1,048 | 1,079 | |
| Economics | 793 | 5.60% | 176 | 169 | 154 | 142 | 152 | |
| History | 135 | 0.95% | 27 | 32 | 28 | 23 | 25 | |
| Literature | 1,490 | 10.52% | 324 | 316 | 286 | 278 | 286 | |
| Philosophy | 80 | 0.56% | 20 | 20 | 13 | 12 | 15 | |
| Medical science | 772 | 5.45% | 153 | 157 | 146 | 155 | 161 | |
| Agriculture | 477 | 3.37% | 103 | 104 | 84 | 92 | 94 | |
| Pedagogy | 85 | 0.60% | 18 | 15 | 15 | 19 | 18 | |
| Total number of majors enrolled | 14,170 | 100.00% | 3,133 | 3,031 | 2,669 | 2,630 | 2,707 | |
Table 2.
Impact of the new NCEE reform on the quality of students in DFC universities.
| Variables | Full Sample | World-Class Universities | First-Class Discipline Universities |
|---|---|---|---|
| Pre-reform time trend | 0.023*** | 0.034† | 0.016 |
| (0.008) | (0.019) | (0.007) | |
| Time trend in the year of reform | -0.235*** | -0.237*** | -0.232*** |
| (0.011) | (0.028) | (0.009) | |
| Post-reform time trend | -0.054*** | -0.069** | -0.046*** |
| (0.009) | (0.022) | (0.008) | |
| Enrollment quota | 0.001*** | 0.003*** | -0.001* |
| (0.000) | (0.001) | (0.000) | |
| Constant | -2.569*** | -0.735*** | -0.368*** |
| (0.071) | (0.218) | (0.046) | |
| N | 14,170 | 4,883 | 9,287 |
| R2 | 0.913 | 0.882 | 0.897 |
Note. †p < 0.1, *p < 0.05, **p < 0.01, ***p < 0.001. The dependent variable is the logarithm of the rank coefficient. Errors are in the parentheses.
Table 3.
Results of urban samples at different levels.
| Variables | First-Tier Cities | New First-Tier Cities | Second-Tier Cities |
|---|---|---|---|
| Pre-reform time trend | 0.062* | 0.029 | -0.003 |
| (0.029) | (0.021) | (0.048) | |
| Time trend in the year of reform | 0.007 | 0.033 | 0.157* |
| (0.038) | (0.029) | (0.066) | |
| Post-reform time trend | -0.086** | -0.100*** | -0.174** |
| (0.033) | (0.024) | (0.055) | |
| Enrollment quota | 0.022*** | 0.001 | -0.002 |
| (0.002) | (0.001) | (0.002) | |
| Constant | -1.778*** | 0.242** | 10.618*** |
| (0.151) | (0.086) | (0.435) | |
| N | 3,625 | 6,152 | 3,426 |
| R2 | 0.869 | 0.891 | 0.770 |
Note. †p < 0.1, * p < 0.05, **p < 0.01, ***p < 0.001. The dependent variable is the coefficient of admission rank. Errors are in the parentheses.
Table 4.
Impact of the new NCEE reform on the quality of students in different disciplines.
| Variable Name | Humanities | Social Sciences | Economics and Management | Neo-Confucianism | Engineering | Agriculture | Medical Science | Experimental Class | Popular Majors | Unpopular Major |
|---|---|---|---|---|---|---|---|---|---|---|
| Pre-reform time trend | -0.022 | -0.099* | 0.094* | -0.044 | -0.01 | -0.105 | 0.162† | -0.01 | -0.05 | -0.061 |
| (0.057) | (0.045) | (0.044) | (0.048) | (0.025) | (0.234) | (0.088) | (0.025) | (0.060) | (0.077) | |
| Time trend in the year of reform | 0.615*** | 0.510*** | 0.044 | -0.134* | 0.016 | -0.493 | -0.155 | -0.031 | 0.05 | 0.316** |
| (0.077) | (0.061) | (0.061) | (0.065) | (0.033) | (0.324) | (0.115) | (0.035) | (0.083) | (0.102) | |
| Post-reform time trend | -0.124† | -0.091† | -0.190*** | -0.084 | -0.102*** | 0.022 | -0.244* | 0.028 | -0.191** | -0.146† |
| (0.065) | (0.051) | (0.050) | (0.055) | (0.028) | (0.266) | (0.099) | (0.029) | (0.069) | (0.086) | |
| Enrollment quota | 0.003 | -0.007 | 0.019*** | 0.006 | 0.003*** | 0.070*** | -.008** | -0.001 | 0.004 | -0.01 |
| (0.006) | (0.005) | (0.002) | (0.005) | (0.001) | (0.010) | (0.003) | (0.001) | (0.004) | (0.010) | |
| Constant | -0.081 | 1.228* | 1.091*** | 0.966*** | 0.367* | -2.325† | 0.599* | 0.122† | 4.478*** | 0.537 |
| (0.418) | (0.498) | (0.172) | (0.240) | (0.153) | (1.344) | (0.303) | (0.066) | (0.553) | (0.514) | |
| N | 1,490 | 1,010 | 2,372 | 1,720 | 5,679 | 477 | 772 | 650 | 696 | 422 |
| R2 | 0.84 | 0.919 | 0.875 | 0.891 | 0.894 | 0.552 | 0.844 | 0.939 | 0.918 | 0.915 |
Note. †p < 0.1, *p < 0.05, **p < 0.01, ***p < 0.001. The dependent variable is the coefficient of admission rank. Errors are in the parentheses.
Table 5.
Impact of the new NCEE on the quality of students of unpopular and popular majors in different levels of institutions.
Table 5.
Impact of the new NCEE on the quality of students of unpopular and popular majors in different levels of institutions.
| Variables | First-Class Discipline Universities | World-Class Universities |
|---|---|---|
| Popular Majors | Unpopular Majors | |
| Pre-reform time trend | 0.015* | 0.031† |
| (0.007) | (0.019) | |
| Time trend in the year of reform | -0.232*** | -0.231*** |
| (0.009) | (0.026) | |
| Post-reform time trend | -0.046*** | -0.067** |
| (0.007) | (0.021) | |
| Enrollment quota | -0.001** | 0.003*** |
| (0.000) | (0.001) | |
| Constant | -0.365*** | -0.731*** |
| (0.046) | (0.213) | |
| Observation value | 9,473 | 5,197 |
| R2 | 0.904 | 0.887 |
Note. †p < 0.1, *p < 0.05, **p < 0.01, ***p < 0.001. The dependent variable is the logarithm of the rank coefficient. Errors are in the parentheses.
Table 6.
Impact of the new NCEE on the quality of students from different levels of cities.
| Variables | Second-Tier Cities | First-Tier Cities |
|---|---|---|
| Green Card Major | Red Card Major | |
| Pre-reform time trend | -0.006 | 0.049† |
| (0.043) | (0.028) | |
| Time trend in the year of reform | 0.148* | 0.032 |
| (0.060) | (0.037) | |
| Post-reform time trend | -0.179*** | -0.090** |
| (0.049) | (0.031) | |
| Enrollment quota | -0.002 | 0.022*** |
| (0.002) | (0.002) | |
| Constant | 7.702*** | -1.753*** |
| (0.988) | (0.152) | |
| N | 3,953 | 3,915 |
| R2 | 0.794 | 0.874 |
Note. †p < 0.1, *p < 0.05, **p < 0.01, ***p < 0.001. The dependent variable is the coefficient of admission rank. Errors are in the parentheses.
Table 7.
Impact of the new NCEE on the quality of students at different schools’ levels in unpopular and popular cities.
Table 7.
Impact of the new NCEE on the quality of students at different schools’ levels in unpopular and popular cities.
| Variables | Second-Tier Cities | First-Tier Cities |
|---|---|---|
| World-Class Universities | First-Class Discipline Universities | |
| Pre-reform time trend | 0.022 | 0.025** |
| (0.014) | (0.009) | |
| Time trend in the year of reform | -0.237*** | -0.218*** |
| (0.020) | (0.012) | |
| Post-reform time trend | -0.059*** | -0.056*** |
| (0.016) | (0.010) | |
| Enrollment quota | 0.003*** | 0.002*** |
| (0.001) | (0.000) | |
| Constant | -0.710*** | -2.921*** |
| (0.186) | (0.069) | |
| N | 6,965 | 10,515 |
| R2 | 0.914 | 0.925 |
Note. †p < 0.1, *p < 0.05, **p < 0.01, ***p < 0.001. The dependent variable is the logarithm of the rank coefficient. Errors are in the parentheses.
Disclaimer/Publisher’s Note: The statements, opinions and data contained in all publications are solely those of the individual author(s) and contributor(s) and not of MDPI and/or the editor(s). MDPI and/or the editor(s) disclaim responsibility for any injury to people or property resulting from any ideas, methods, instructions or products referred to in the content. |
© 2024 by the authors. Licensee MDPI, Basel, Switzerland. This article is an open access article distributed under the terms and conditions of the Creative Commons Attribution (CC BY) license (http://creativecommons.org/licenses/by/4.0/).
Copyright: This open access article is published under a Creative Commons CC BY 4.0 license, which permit the free download, distribution, and reuse, provided that the author and preprint are cited in any reuse.


