Submitted:
09 March 2024
Posted:
14 March 2024
You are already at the latest version
Abstract
The agricultural sector is amidst an industrial revolution driven by the integration of sensing, communication, and artificial intelligence (AI). Within this context, the internet of things (IoT) takes center stage, particularly in facilitating remote livestock monitoring. Challenges persist, particularly in effective field communication, adequate coverage, and long-range data transmission. This study focuses on employing LoRa communication for livestock monitoring in mountainous pastures in the north-western Alps in Italy. The empirical assessment tackles the complexity of predicting LoRa path loss attributed to diverse land-cover types, highlighting the subtle difficulty of gateway deployment to ensure reliable coverage in real-world scenarios. Moreover, the high expense of densely deploying end devices makes it difficult to fully analyze LoRa link behavior, hindering a complete understanding of networking coverage in mountainous environments. This study aims to elucidate the stability of Lora link performance in spatial dimensions and ascertain theextent of reliable communication coverage achievable by gateways in mountainous environments. Additionally an innovative deep learning approach was proposed to accurately estimate path loss across challenging terrains. Remote sensing contributes to land-cover recognition, while Bidirectional Long Short-Term Memory (Bi-LSTM) enhances the path loss model’s precision. Through rigorous implementation and comprehensive evaluation using collected experimental data, this deep learning approach significantly curtails estimation errors, outperforming established models. Our results demonstrate that our prediction model outperforms established models with a reduction in estimation error to less than 5dB, marking a 2X improvement over state-of-the-art models. Overall, this study signifies a substantial advancement in IoT-driven livestock monitoring, presenting robust communication and precise path loss prediction in rugged landscapes.
Keywords:
Internet of Things
; propagation loss
; smart agriculture
; LPWAN
; LoRa
; remote sensing
; link quality.
1a. Introduction
The pervasive integration of the Internet of Things (IoT) across various domains has facilitated the proliferation of interconnected devices, revolutionizing numerous industries, notably Agriculture [1,2]. Amidst the sphere of smart agriculture, characterized by the dominance of IoT technology, a particularly notable segment pertains to livestock farming [3,4]. In this domain, managing animal positioning for their welfare becomes challenging due to inadequate supervision, necessitating the monitoring of livestock positioning andbehavior in rugged terrains through IoT devices.
In the realm of livestock farming applications, pivotal technological requirements encompass low power consumption, cost-effectiveness, extended coverage, and positioning accuracy. Addressing these needs, Low-PowerWide Area Networks (LPWANs) have gained traction, boasting attributes like prolonged lifespan, cost-efficient chip integration, and expansive coverage. Prominent LPWAN technologies like Sigfox [5], Long-Range (LoRa) [6], and Narrowband-IoT (NB-IoT) [7] offer diverse capabilities, augmenting connectivity while maintaining energy efficiency. Amidst various technological options, Lo-RaWAN emerges as a widely embraced LPWAN technology, garnering significant attention across both academic research and industrial sectors. Our particular focus is directedtowards LoRa and LoRaWAN technologies due to the prevalent absence of telecommunication coverage in rural and mountainous regions, compounded by challenges related to troubleshooting and maintenance. The cost-effective and energy-efficient nature of LoRa renders it highly suitable for connectivity purposes, especially in the realm of monitoring and control operations. LoRaWAN, distinguished by its low-power, long-range communication protocol, adeptly fulfills connectivity needs across expansive grazing territorieswhile upholding robustness through low energy consumption. This contrasts with cellular-based alternatives such as 3G, 4G, and 5G, which offer wider coverage but necessitate highpower consumption.
Optimizing the effective deployment of LoRaWAN entails radio planning activities, particularly crucial in challenging environments such as mountainous pastures. These activities are vital due to formidable radio propagation dynamics influenced by physical barriers shaping electromagnetic wave behavior. Although LoRaWAN enables long-distance connections, real-world implementations can exhibit significant variations in communication range. The power attenuation of the link, known as path loss (pl), varies when an end device is deployed in different positions from a gateway due to several factors, encompassing terrain features and the diverse array of land-cover types such as trees, grasslands, buildings along the transmission path.
Developing a precise path loss model is paramount for LoRaWAN applications as it directly impacts the likelihood of successful packet transmission [8]. Thus, accurate prediction of path loss associated with a LoRa gateway prior to deployment holds the potential to enhance LoRaWAN coverage by strategically choosing gateway locations that minimize such loss.
This study proposes a deep learning framework tailored to precisely estimate pathloss in long-range LoRa links. By harnessing publicly available remote sensing images, the framework adeptly identifies detailed land-cover distribution along the link, a critical factor significantly impacting path loss. Our study generates precise land cover maps by leveraging the distinct spectral responses of various land-cover categories and employing supervised classification techniques. In our approach, we utilize pixel-based support vector machines (SVM). The selection of land cover classes is influenced by factors such as thetarget area’s presence, its relevance in characterizing LoRa links, and the potential for separation in multispectral images. The initial stage of our path loss estimation involves land-cover classification, offering detailed insights into the land-cover characteristics encountered by the LoRa link, as illustrated in Section 4.2.1.
Given the complexity of land cover effects on path loss, the utilization of deep learning methodologies [9] becomes imperative for modeling the impact of a specific land-cover distribution on path loss accurately. Rather than treating a LoRa link environment as a whole, we propose viewing it as an ordered sequence of short, uniform links identifying detailed land cover specifics for each LoRa link via remote sensing images. Following land-cover classification, we extract the land cover sequence for the desired link region and utilize it as input for a deep neural network (DNN). Specifically, we employ Bidirectional Long-Short-Term-Memory (Bi-LSTM) units, enabling the network to analyze the sequence and build a path loss model from assessments in the area of interest. This deep learning model inherently captures the relationship between land cover types, their sequence, and resultant path loss. Post-training, the model can be seamlessly applied to regions exhibiting similar land cover compositions, requiring minimal data collection and model fine-tuning The deep learning framework utilized in this study originates from data acquired through experimental measurements conducted in mountainous environments. Our deployed LoRaWAN system comprises a single gateway and 8 mobile LoRa end devices affixed to sheep traversing an 4km × 4km area within the mountainous region. These nodes periodically transmit data packets containing location information as the sheep moves. Despite leveraging the mobility of these LoRa end devices, efficient recording of thousands of LoRa links across diverse locations poses challenges due to the non-uniform distribution of collected data within the areas of interest. The dataset encompasses over 35,876 packets logged by a gateway sent by 8 mobile LoRa end devices. We aimed to delve into the stability of Lora link performance in spatial dimensions, evaluating the extent of reliable communication coverage achievable by gateways in mountainous environments. Additionally, the experiment explores path loss estimation, revealing a mean error of 4.97dBm, which is twice as smaller than the state-of-the-art models.
Key contributions of this study encompass:
- Description of the hardware design utilized for experimental evaluation.
- Empirical analysis investigating the impact of land-cover sequences on path loss within a real LoRaWAN system. This includes introducing a deep learning approach employing adaptive Bi-LSTM to explore the correlation between path loss and various land-cover types and their ordered sequence.
- Measurement of spatial link dynamics and calculation of coverage areas using sparsely received LoRa packets.
- Implementation and performance assessment of a deep learning path loss prediction modwithin an actual LoRaWAN deployment, showcasing experimental results with a mean error twice as small as that of existing state-of-the-art models
2. Related Works
Within this section, we provide a concise overview of pertinent research of LoRaWAN field studies. Subsequently, we delve into the exploration of related studies concerning land cover and propagation models.
2.1. LoRaWAN Studies in the Field
In recent years, various studies [10,11,12,13,14,15] have delved into assessing the performance of LoRaWAN in real-world settings. The authors in [10] focused on understanding the scalability bounds of a typical LoRa cell. The researchers achieved this by creating a LoRa tracker module embedded in a bike, testing it extensively across a large area within Palermo city. Notably, they achieved a maximum coverage distance of 7.3km. Yang et al. [11] conducted a comprehensive analysis of LPWAN link dynamics, examining both macro and micro aspects. They performed extensive measurements in a deployment spanning a 2.2 × 1.5km2 area for one month. Their network consisted of 50 nodes with 3 gateways, and they proposed a method to tackle link degradation issues. Another study in [12] provided subtle details regarding the design, development, and evaluation of a wildlife monitoring application using LoRa for IoT animal repelling devices. Their assessment involved testing LoRa transmission technology in forested areas operating within the 433 MHz and 868 MHz bands, highlighting its performance. Chall et al. [13] investigated the LoRaWAN radio channel specifically in the 868MHz band. They conducted broadmeasurement studies in both indoor and outdoor environments, spanning urban and rural locations in Lebanon. Xu et al. [14] studied the behavior of LoRa links and energy profiles through the deployment of 10 stationary and 2 mobile LoRa end nodes. These empirical studies revealed diverse conclusions about LoRa coverage, indicating that path loss tends to increase with communication distance at varying rates across different environments. Consequently, modeling the environmental impact on path loss has become a central focus in the design of path loss models.
2.2. Land Cover and Propagation Models
Extensive field measurements have taken place in diverse indoor and outdoor environments, exploring cellular and wireless sensor networks’ path loss characteristics. Path loss is influenced by multiple variables including distance, frequency bands, average antenna elevations, and geographical features such as terrain, obstacles, buildings, hills, mountains, and human presence. The International Telecommunications Union (ITU) [16], Okumura-Hata [17], Cost-Hata [18], and other research institutions and standard bodies have produced a number of path loss models tailored for outdoor settings within the [800˘1800] MHz and [2.5˘5] GHz frequency bands. Empirical models like Okumura-Hata offer ready-to-use formulas adaptable to different settings. However, these models may yield inaccurate predictions when applied directly to new environments with distinct path loss patterns. A distinctive approach by Bor et al. [19] employs on-site measurements to calculate absolute path loss via path loss exponent, deviating from the free-space path loss concept.
While widely used, these path loss models are unsuited for LoRaWAN networks operating in the 868 MHz band. Limited studies have evaluated radio propagation models’ performance in diverse regions like Lebanon [13] and Finland [20], but these models often rely on regional environment information for predictions. Such approaches, assuming uniformity in deployment areas, fail to account for anisotropic land-cover compositions along LoRa links. The authors in [21] and SateLoc [22] utilize remote sensing to quantitatively analyze land-cover compositions along LoRa links. However, Demetri et al. [21] choose an Okumura-Hata formula based on dominant land-cover, without directly incorporating land-cover effects into predictions. SateLoc [22] divides links into segments characterized by distinct land-covers, applying the Bor model along with associated path loss exponents. However, reordering these segments within a link yields consistent results, limiting the model’s adaptability. These existing models fall short in harnessing fine-grained environmental data and struggle to transition effectively to new contexts due to their fixed environmental modeling.
In contrast, our approach adopts a model based on a Recurrent Neural Network (RNN) to capture the intricate interplay between path loss, land-cover types, and their sequence along the path. This choice promises enhanced path loss estimation accuracy, while the use of raw environment data and extremely general RNN models enhances model transferability, overcoming the limitations of the conventional physical path loss models.
Additionally, we conducted an analysis of the spatial attributes of LoRa links and offered a more comprehensive study of coverage areas compared to previous research endeavors.
3. Background and Motivation
To calculate path loss, the received signal strength (PRX) is estimated, considering both the signal-to-noise ratio (SNR) and the received signal strength indicator (RSSI). When SNR > 0, PRX equals RSSI; otherwise, PRX is derived by adding SNR to RSSI. The path loss calculation is as follows:
PL = PTX − PRX + GTX + GRX − LTX − LRX
Here, PTX represents the transmit power in dBm, while GTX and GRX denote the antennagains of the transmitter and receiver, respectively. LTX and LRX signify negligible losses attributable to cables, as postulated within this context. Shadowing is described by a zero-mean Gaussian variable characterized by a standard deviation, σ, quantifying thedivergence between observed and anticipated path losses.
Upon receiving a LoRa packet, the gateway provides essential metrics such as RSSI and SNR. While RSSI is a prevalent signal attenuation indicator in wireless sensor networks [23,24], its accuracy in LoRaWAN can be compromised due to the superimposition of LoRa signals and various noise sources, particularly below the noise floor. To address this, 1we employ Expected Signal Power (ESP), outlined in [21] as a more reliable metric. ESP delineates the actual received signal power over long-distance transmissions, calculated by the following equation.
ESP=RSSI+SNR−10 log10(1+100.1SNR)
Here, SNR is measured in dB, while the other terms are expressed in dBm. One prevalent model used to estimate signal path loss is Free-Space Path Loss (FSPL).
This model describes path loss in an ideal scenario without obstacles or multipath effects, as given by the formula:
FSPL = 20 log(d) + 20 log( f ) − 27.55
Here, d represents distance in meters and f stands for frequency in MHz.
The fundamental free-space model establishes a foundational reference point for path loss measurement, considering unobstructed line-of-sight (LOS) conditions between transmitting and receiving points. Meanwhile, the logarithmic-distance path loss model, extensively used in outdoor scenarios, proposes an exponential path loss variation linked to the distance between points. In contrast, the ITM Longley-Rice path loss model adopts a comprehensive approach, accounting for several factors such as terrain, obstacles, frequency, and weather conditions. An empirical approach, the Okumura-Hata model, draws insights from extensive measurements across the 200 MHz to 2 GHz frequency range, primarily suited for rural regions. It assumes minimal dominant obstacles between the base station and mobile unit, as well as gradual changes in terrain profile. It is essential to acknowledge that these models were originally formulated within the context of cellular and wireless sensor networks, incorporating specific limitations concerning antenna heights and terrain configurations. In practical scenarios, achieving true free space conditions is challenging, and the free space path loss serves as a basic estimate for path loss in real world LoRa deployments. However, it is important to note that the actual path loss of LoRa connections in real-world settings is greatly affected by environmental attenuation. Models that take environmental factors into account require access to environmental data. For example, the traditional physical models such as the Okumura-Hata and Bor models typically rely on two methods: (1) empirical estimations drawn from experience or (2) on-site measurements. These approaches are often resource-intensive, particularly for long-distance situations, and primarily offer generalized environmental insights to certain regions. Even if two LoRa connections exist within the same deployment area but traverse distinct types of terrain, they might still be treated as if they experience the same environment by utilizing identical formulas or path loss exponents. Specific terrain types are outlined in Table 1, and these distinct terrains lead to varying path loss effects, underscoring the heterogeneous nature of LoRa connections. Consequently, accurately estimating LoRa path loss necessitates comprehensive per-link environmental information.
To address this, we conducted an empirical study leveraging measurements from our LoRaWAN system deployed in mountainous pastures in northern Italy. The study aims to establish patterns governing how different land covers influence path loss. Remote sensing techniques can be used to identify different types of land cover from multispectral images of large geographical areas. This can be done by extracting distinctive features from the images and using machine learning models, such as SVM and random forests (RF). The integration of remote sensing into physical models can help to enhance the accuracy of path loss estimation by shifting from a regional environmental approximation to individual link-based models. This is because remote sensing can be used to obtain detailed information about the environment along the path of the signal, such as the types of land cover and the presence of obstacles. However, some studies have neglected the impact of specific land cover types or the sequence in which they appear along the path. For example, the authors in [21] used the Table 1.
Okumura-Hata model to estimate path loss, but they only considered the dominant land cover type. This approach can lead to inaccurate results, as the path loss can be significantly affected by the presence of obstacles, even if they are not the dominant land cover type, with the Okumura-Hata model acting as a bottleneck. Similarly, SateLoc [22] divided the path into segments and aggregated the path loss for each segment independently. This approach does not take into account the order dependence of the segments, which can also lead to inaccurate results. Even when the segment order is altered, the outcome remains unchanged. It has been shown in the literature that the order of land covers along a connection can have a significant impact on path loss, even if the types of land covers themselves do not change. This is because obstacles closer to the end device are more likely to obstruct the signal. For example, a tree that is located directly between the end device and the gateway will have a much greater impact on the path loss than a tree that is located further away.
The path loss of a LoRa connection can be conceptualized as a result of traversing a sequence of short links, the order of the short links sequence implicitly influence the path loss. This inherent influence cannot be captured by conventional physical path loss models. To address this challenge, we resort to RNN, a prevalent architecture within deep neural networks (DNNs), which are well-suited for this task as they can handle sequence data and capture the order dependence.
4. System Overview
In this section, we describe the hardware for the LoRaWAN measurements. We also detail the system design of the path loss prediction model.
4.1. Considered Hardware
The End Device (ED) is built around an STM32L designed by STMicroelectronics [25], featuring a 32 − bit ARM Cortex M3-based architecture optimized for applications requiring low power consumption. The ED comprises of several key components including a microcontroller, a global positioning system (GPS) modem, a UART to USB interface, and a LiPo battery among others as demonstrated in Figure 1. Specifically, the microcontroller employed is the microcontroller’s capacity for low-power run mode, specified with μA consumption, renders it an ideal choice for battery-powered scenarios. Additionally, it features multiple UART channels, two distinct serial peripheral interface (SPI) ports, and two inter-integrated circuit (I2C) interfaces. For debugging and programming purposes, the microcontroller supports a USB 2.0 compliant interface via a CP2102 UART to USB circuit provided by Silicon Labs [26]. This interface functions as a communication port “COM” for computer applications and draws power from the USB bus at 5V, which is available through the micro-USB connector. Power is supplied by a 3700 mAh lithium polymer (LiPo) battery, with its voltage readings attainable through the microcontroller’s analog-to-digital converter (ADC). The ED additionally integrates an SX1276 module [27] from Semtech, designed as a long-range transceiver leveraging Semtech’s proprietary spread spectrum communication technology, facilitated through LoRaWAN. The connection between the LoRa module and the microcontroller is established via SPI, operating at a 3.3V. Remarkably, the SX1276 exhibits exceptional sensitivity level exceeding −148 dBm, facilitated by an inexpensive crystal, thereby making it cost-effective and readily accessible in the market. The ED is also equipped with a 9-axis accelerometer, encompassing a 3-axis gyroscope, 3-axis accelerometer, and 3-axis magnetometer. These components collectively offer comprehensive data on accelerations across all three axes as well as rotations around each axis. Additionally, the embedded GPS component from Ublox, operating at 3.3V, is integrated into the ED architecture for the purpose of ascertaining the ED’s geographical coordinates. This GPS is powered through a TI TPS27082 [28] load switch from Texas Instruments, which manages the power supply. Communication between the GPS and the microcontroller occurs via UART. For communication purposes, we employed a Laird outdoor gateway due to its low cost and reliability. It is an 8-channel gateway built on the Semtech industry standard and can offer a secure, scalable LoRaWAN solution for complete management over a private LoRaWAN network. The LoRaWAN gateway is interconnected with an ADSL router, facilitating internet connectivity, and subsequently connecting to the amazon web services (AWS). This gateway, capable of receiving LoRa frames across a range of signal strengths was linked to the AWS-provided network server “AWS IoT Core for LoRaWAN”. Both the gateway and the EDs utilized an omni-directional dipole antenna, boasting a 2 dBi gain. Upon receiving each data frame, the gateway yielded crucial parameters such as RSSI, SNR, and the payload message. These parameters were logged on to the AWS server for subsequent analysis and processing, utilizing InfluxDB to store the data. Given the considerable variation in LoRa performance depending on selected transmission parameters, as established in [29], the following parameter configuration was chosen:
- Bandwidth (BW): The transmission frequency range is defined by the BW parameter, which, ranges from 7.8 kHz to 500 kHz. Widening the bandwidth decreases receiver sensitivity but enhances data rate due to reduced Time-on-Air (ToA). Our experiment employed a BW setting of 125 kHz.
- Transmitted Power (PTX): For LoRa end devices operating in the 433 MHz and 868 309 MHz bands, the maximum effective isotropic radiated power (EIRP) in the default setting is 12.15 dBm and 16 dBm, respectively. Our experiment adhered to the highest permissible PTX within the EU 868 MHz band, aligned with the LoRa device’s approved duty cycle of 1%. This led to a selection of PTX = 14 dBm.
- Carrier Frequency (CF): A number of factors led to the adoption of the 868 MHz frequency. While path loss is lower in the 433 MHz band compared to 868 MHz, the 433 MHz band enforces a maximum transmitting power of 10 dBm. Furthermore, at 433 MHz, antenna dimensions are larger for a given radiation efficiency. Lastly, due to its narrower bandwidth, the 433 MHz band accommodates fewer communication channels [30]. 319
- Spreading Factor (SF): This factor indicates the number of bits sent in each LoRa symbol. SF varies from 7 to 12, resulting in distinct ToA and receiver sensitivity values. Higher SF, such as SF = 12, corresponds to reduced receiver sensitivity [31], enhancing the link budget. The tranmission rate is halved when SF is increased by one-unit, which doubles the channel usage, energy consumption and transmission time (sleep time). The relationship between LoRa transmission ToA and the employed LoRa parameters is expressed as ToA = 2SF/BW.
- Coding Rate (CR): CR equals 4/(4 + n), with n ∈ {1, 2, 3, 4}. To minimize ToA, CR = 4/5 was selected.
4.2. Path Loss Prediction Model
In this subsection, we outline the proposed design of our deep learning-based system, devised to yield precise path loss estimates by leveraging land-cover classification and their sequence along propagation paths. Our methodology entails fusing land-cover recognition with path loss modeling. A comprehensive depiction of our path loss prediction model, hinging on deep learning, is presented in Figure 2. Our system architecture is compartmentalized into three distinct blocks: Land Cover Map Classification, Link Segment and Embedding, and the DNN based path loss Model.
4.2.1. Extracting Land Cover Maps from Multispectral Images
Our methodology involves the automatic extraction of land-cover classes from multispectral images acquired from the US Geological Survey (USGS) Landsat series of Earth Observation satellites, which are accessible through the Google Earth Engine (GEE) platform. To derive precise land-cover maps, we leverage the distinctive spectral responses exhibited by various land-cover classes, employing supervised classification techniques rooted in machine learning. Specifically, we focus on kernel-based methodologies, particularly pixel-based SVM [32,33] chosen for their advantageous attributes, including robust generalization capabilities, excellent classification accuracy, and a comparatively streamlined design with minimal control parameters. We delineate the land-cover classes as seen in Table 1 through the following criteria, considering their presence in the target area, their relevance in characterizing LoRa links and the potential to discriminate them in the multispectral images. Our initial step involves generating a land-cover map classification, a crucial process for comprehensively interpreting the land-cover information embedded within the LoRa link. Employing an automated system, we assign each 10 °ø 10m2 pixel in the images to the most suitable land-cover class according to predefined standards relying on spectral features, including raw pixel spectral values, the Normalized Difference Vegetation Index (NDVI), and the Normalized Difference Water Index (NDWI) for individual pixels. We use non-linear approaches to solve this problem, which is complicated by several non-linearly separable classes. In particular, we use the SVM’s Radial Basis Function (RBF) kernel [34], which takes the feature vector to predict whether an area pertains to a specific land cover type. Similar to the approach described by Demetri et al. [21], the workflow necessitates a training set of manually labeled reference pixels linked to land-cover classes via image interpretation. During the classifier’s learning phase, this dataset plays a dual role in the model selection and SVM training. The SVM is used to automatically create the land-cover map after it has been trained across all images that are taken into consideration.
To ensure accuracy, each image undergoes independent classification. This involves collecting image-specific datasets containing 200 samples for training and 100 samples for testing. for each land cover class. The test samples are used to assess the classification accuracy for each image. By using a grid-search model selection based on 5-fold cross-validation, the critical model selection phase finds application-specific optimal SVM tuning parameters, such as the regularization parameter and the RBF kernel width. The goal is to accurately discriminate classes and minimize expected generalization errors within predetermined ranges for the values of the regularization parameter and the RBF kernel width. Using conventional tools and methodologies, the optimal regularization parameter and RBF kernel width values are found through cross-validated classification accuracy and used in future SVM training and classification processes.
4.2.2. Link Segment and Embedding
The subsequent phase, Link Segment and Embedding, revolves around capitalizing on the comprehensive environmental insights garnered from the land cover classification. We formalize a deep learning path loss model that is built upon this detailed environmental information. Instead of considering a mere “line,” we opt for a more encompassing approach. Specifically, we choose a rectangular region from the land-cover classification map that links the gateway and the end device. In this study, making a line is hard to determine due to the path from the gateway to the end device is usually a non-LOS path. The choice of choosing a rectangular mitigates the impact of potential misclassifications on the accuracy of the sequence. In addition, the rectangular area indicating the land cover map shown in Figure 3 offers fault tolerance by capturing a broader land-cover representation. The width of this rectangular is carefully chosen based on empirical data and experimental findings. The link segment of length d and width w is divided into smaller shortlinks of length d0 from the end device to the gateway as shown in Figure 4. The granularity and length of the resulting sequence, determined by d0 directly influence the estimation accuracy. For each short-link region, we count the proportion of pixels belonging to each of the land-cover types.
For instance, in a short-link region, ski, 0 ≤ i < n which contains ck, 0 ≤ k ≤ 5 pixels for each land cover type lk, Then, each short-link region is embedded into a 1 × 6 vector vi by counting the proportion of 6 land-cover types as follows:
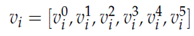
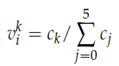
By concatenating these vectors for all short-links, we obtain an ordered sequence s =[v0, v1, · · · vn−1] representing the land cover composition along the link. This sequence is subsequently served as input for the DNN specifically a Bi-LSTM unit for further analysis.
Thus, we obtain a structured representation by splitting LoRa links into several equidistant short-links and embedding each short-link into the sequence according to the land-cover map.
4.2.3. DNN Based Path Loss Model 401
In accordance with the schematic overview presented in Figure 2 of the system design, the sequence comprised of feature vectors is fed into the Bi-LSTM unit to disentangle order dependencies. The architectural layout of the path loss model based on DNNs is depicted in Figure 3. Capitalizing on the temporal dimension, which aligns with the distance parameter in our case, allows for the flow of information from the sequence’s start to its end. This characteristic is particularly advantageous in estimating the path loss at the gateway, situated at the sequence’s last frame, accounting for attenuation throughout the sequence. To tackle the limitation of RNNs in learning long-term dependencies, we embrace the Bi-LSTM units [35,36]. Figure 5 depicts the construction of a Bi-LSTM. This bidirectional approach ensures that land-cover information from both the sequence’s commencement and conclusion is effectively captured. The output from the Bi-LSTM unit is then channeled through convolution layers, enabling the extraction of local features and context dependencies. Introducing non- linearity via Rectified Linear Unit (ReLU) layers enhances the model’s expressive power. Subsequent max pooling down samples output features, effectively reducing dimensionality. These features are then linearly mapped to path loss within the fully connected layer. This extensibility equips our network to accommodate various LoRa link attributes, such as weather conditions, temperature, and more, facilitating quantitative analysis of additional influencing factors. It is vital to consider that path loss possesses constraints; it cannot fall below zero and must adhere to the maximum link budget imposed by the highest transmitting power and end device sensitivity. Therefore, we apply a sigmoid function to curve our final estimation, ensuring path loss values are confined within a range of 0 to 1, enhancing training convenience. This approach facilitates scaling of the estimation with the upper boundary limit to yield expected path loss, with values exceeding the boundary indicating packet delivery failure.
Given the upper boundary of 160 dBm, our system can be tailored to the specific constraints of different countries/regions. Our system design facilitates effective adaptation to new environments by employing the following strategies:
- We refrain from manual feature selection and instead utilize a sequence restructured from genuine land-cover maps along with additional variables as inputs. As a result, our model is able to obtain a mapping that is quite similar to the principles of signal propagation.
- During the training process, we make a deliberate effort to incorporate training data encompassing diverse link distances and variations in land-cover compositions. This approach ensures that our training dataset effectively covers a wide spectrum of the feature space.
- Our path loss model adopts a Bi-LSTM based DNN architecture. Neural networks trained on comprehensive historical datasets can be fine-tuned using a smaller dataset containing new data, enabling the model’s weights to be adjusted to new observations. As a result, fine-tuning the model with a limited amount of data from a new environment can yield superior accuracy compared to the original model. This stands as an advantage over a lot of other machine learning-based models that necessitate retraining from scratch using fixed data and do not guarantee improved outcomes.
5. Results and Discussion
5.1. Experimental Environment and Collected Dataset Overview
5.1.1. Experimental Environment
Our study took place within the mountainous pastures in the north-western Alps (Ormea, CN, Italy), situated at an elevation of 1340 meters above sea level. This locale serves as a crucial source of seasonal forage for livestock. Characterized by modest hills with an elevation difference ranging from 80 to 100 meters, the area is encompassed by forest, grassland, and farmland, and diminutive hills with a lack of buildings and other barriers.
In this dynamic landscape, the EDs traverse varying locations within the designated area. In other words, throughout the measurements, the gateway’s position remained stationary, while the EDs were relocated following the sheep movement within the mountainous pasture. The dataset gathered from this experimental deployment and evaluation in the northern pastures is crucial for training the path loss deep learning model and assessing its performance.
5.1.2. Collected Dataset
We present here an overview of our collected dataset, covering a period from July 15 to October 17. The transmission of packets is obtained in a periodic manner, and the payload from the Lora EDs includes crucial information such as GPS coordinates, timestamps, sequence numbers. In addition, the gateway records the associated SNR and RSSI values. These logged data records, which make up a final dataset of over 35,876 records, can be extracted from the network server after packet reception. Moreover, we can compute essential metrics like the link distance d and the height difference h between the end device and gateway pair by decoding the GPS data embedded within the payloads. This process enables us to derive additional contextual information regarding the spatial relationship and positioning between the EDs and its respective gateway.
5.2. Link Behavior Study
Two key metrics, namely the Packet Delivery Ratio (PDR) and ESP, serve as indicators for signal path loss across a physical channel to ensure reliable coverage within an area. Through a detailed examination of their distribution, we have devised a predictive model for PDR. This model correlates the computed ESP value of a position with the estimated PDR, enabling the determination of our LoRa system’s coverage for end devices at each position. Considering the mobility of the end devices, particularly in scenarios such as the movement of sheep, data packets are dispersed along diverse trajectories. Our main approach is to compute the PDR of a specific position by using all trajectories that pass the position according to their coordinates. This methodology allows us to comprehensively calculate the PDR concerning the various paths traversed by the data packets due to the movement of the end devices.
5.2.1. Overall PDR and ESP Distribution
We present the estimated PDR and ESP for various positions in relation to the gateway. Figure 6 portrays the Cumulative Distribution Function (CDF) of PDR, indicating that 60% of the links exhibit high reliability with a PDR exceeding 90% for the gateway. The remaining 40% of LoRa links exhibit variable behaviors, denoting intermediate link performance. Figure 6b displays the CDF of ESP derived from all recorded data packets. Notably, the minimum ESP registers at −140 dBm across all packets, aligning consistently with the reported sensitivity of SX1276 at −148 dBm [27]. Furthermore, approximately 80% of the gateway’s ESP values are from −140 dBm to −120dBm, while the maximum ESP reaches −55dBm. This observation underscores the deployment environment’s characteristics, indicating an unobstructed antenna path for the gateway. Figure 6 illustrates a notable disparity in distribution between PDR and ESP. This discrepancy highlights the distinct behavior wherein the robust noise tolerance characteristic of LoRa technology allows for a convergence in PDR distribution despite varying ESP levels. For instance, even with a low ESP, such as a median value of −125dBm, there is an observable similarity in PDR distribution comparable to instances with higher ESP, like the median value of −89dBm.
5.2.2. Spatial PDR Distribution
Our study involves analyzing the spatial distribution of PDR as it relates to the link distance. We divide the area into “positions” (i.e., 100m × 100m block). For each position, we calculate the distance between its center and a gateway location. Then, we leverage the GPS coordinates of each transmitted packet to compute the distance it traveled to reach the gateway. Figure 7 illustrates the spatial distribution of PDR. Upon analysis of Figure 7, we note that lower PDR values are dispersed across intermediate links at various distance levels.
5.2.3. ESP based PDR Prediction
We developed a PDR prediction model with ESP as the input variable, based on the data we had previously made on the PDR and ESP distributions. First, we calculated the average ESP for every data record that corresponds to a specific sheep position in the mountainous pasture region. This facilitated the creation of diverse PDR-ESP pairs based on measured PDR values for the covered areas. Next, we employed Gaussian process regression (GPR) [37] to predict PDR for uncovered areas solely based on their ESP values. To achieve optimal regression accuracy, we opted for an exponential kernel function and conducted a rigorous fitting process, depicted in Figure 8. The statistical evaluation of our model achieved impressive performance, boasting a coefficient of determination (R2) of 0.78 and a root mean-square error (RMSE) of 0.129. Analyzing raw data pairs (represented by blue dots), we observed that for gateway ESP values below −131 dBm, the measured PDR plummeted to near 0. Conversely, when ESP exceeded −120 dBm, PDR reached high levels but rarely attained 100%. This can be attributed to the large temporal variance inherent in PDR and ESP measurements. Importantly, the predicted data points (illustrated by red diamonds) for uncovered areas aligned well with ground truth values. However, the model’s inability to accurately capture the dynamic nature of PDR in our LoRaWAN mobility system highlights limitations. Nevertheless, our findings demonstrate the potential of ESP as a reliable indicator for PDR prediction in such challenging environments.
5.3. Land Cover Classification
The land-cover classification analysis yielded an exceptional overall accuracy rate of 98% across diverse land-cover types. This high accuracy lends credibility to the resulting land-cover map as a reliable representation of the actual environmental conditions. Figure 9 provides a visual representation of the categorized land-cover. Distinct color coding differentiates various cover types. Predominantly, the area comprises trees, grassland, farmland and shrubland encompassing a significant portion. Conversely, buildings and roads feature sporadically in select areas within the region. Water is not taken into the account as indicated in Table 1, because it is not present within the area of interest.
5.4. Path Loss Estimation
With the use of PyTorch framework [38], our approach for the path loss model utilizes a DNN. This model is trained on data collected during our LoRa experiment. To ensure the model’s effectiveness, we enforced the condition that identical inputs must yield identical outputs during the training phase, mitigating potential confusion within the model. This required careful data cleaning before training commenced. Since sheep movement generates continuous data, device locations obtained by the u-blox chip are plotted continuously on the map. Given the 10-meter resolution of the multispectral images employed, each 10m × 10m area on the ground is represented by a single pixel. This common practice in remote sensing and cartography facilitates managing large areas and maintaining consistent map detail. However, transforming GPS coordinates to map pixels can lead to multiple locations within the same pixel having different ground truth path loss values. In order to eliminate this duplication and create a distinct ground truth for every input, we compute the average path loss for measurements made within of each pixel. We split the dataset into 80% training and 20% testing sets in order to train and analyze our path loss model. We train and evaluate our path loss model by dividing the dataset into 80% training and 20% testing sets. Considering that sequence length significantly impacts path loss due to the model’s sequence processing principle, we segmented the data into bins based on sequence lengths prior to the split. This methodology ensured diversity in sequence lengths within the training set, mirroring the distribution in the testing set for a more robust and generalizable model. Based on empirical performance in subsequent experiments, we select d = 3 and w = 7 for link segmentation and embedding, representing 30m and 70m respectively. The model is trained with a learning rate of 0.0001 and a batch size of 16, and its performance is evaluated every 5 epochs. We analyze our path loss prediction model’s performance across different environments and compare it to state-of-the-art methods. To gauge accuracy, we conducted an evaluation comparing our model with benchmarks including the free space model, Bor model, Demetri model, and SateLoc model, as detailed in the related work section. All models were evaluated on the same test set by computing the absolute difference between their path loss estimations and the ground truth values. Table 2 summarizes the results. Remarkably, our path loss prediction model demonstrated exceptional accuracy, achieving an error rate of 4.97dB. This performance surpassed existing models by at least 50%. Additionally, with a standard deviation of 4.13dB, our model demonstrates consistent and stable estimation performance. Notably, while the Bor model exhibited slightly superior performance compared to other models, this was attributed to its path loss model being derived from fitting equations using our training data. Conversely, SateLoc relied on provided path loss exponents, while on provided path loss exponents, while Demetri model employs Okumura-Hata formulations based on Tokyo data. The divergence among datasets from distinct environments contributed to increased estimation errors. Despite this, our prediction model consistently outperformed results reported in the original papers. Figure 10 presents a box plot visualizing the raw estimation errors of various models (excluding the free space model due to its disproportionately large error) across the full testing set. Our prediction model’s errors center around 0 dB, indicating no bias towards underestimating or overestimating of the path loss. In contrast, other models demonstrate significant offsets from 0. SateLoc exhibits the most significant deviation, further highlighting a considerable gap between the utilized path loss exponents and the actual rate of path loss increase with distance. Additionally, our model boasts a significantly narrower error distribution compared to others. The magnitude of its largest error remains below 10 dB, while 50% of errors fall below 5dB. These findings underscore the superior accuracy and reduced variance of our path loss prediction model compared to existing methodologies.
5.5. LoRa Coverage Measurements
This section delves into the coverage analysis of our deployed gateway within the challenging mountainous environment. We define the coverage area as the region where the PDR exceeds 70%. To assess this, we split the area into 100m × 100m grids (“positions”).
For each position in the covered areas, we directly calculate the corresponding PDR based on our collected data. For the uncovered areas, we applied our path loss prediction model to estimate the average ESP for each position. Subsequently, we utilize the derived PDR-ESP regression model to predict the associated PDR based on the estimated ESP values. The correlation between SNR and ESP, demonstrated in Equation (2), holds significance in augmenting SNR gain for gateway coverage, a factor underscored in numerous studies. To quantify the ESP gains’ impact on coverage within our system, we manually introduce ESP gains per position and recompute the corresponding PDR under this enhanced ESP. Randomly selecting ESP gains from 2dB to 10dB ensures fairness, generating the CDF of predicted PDR illustrated in Figure 11. As the additional ESP gains increase, a corresponding rise in PDR is observed, validating the efficacy of the SNR enhancement method.
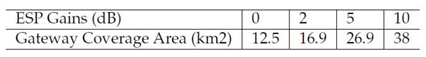
Furthermore, Table 3 illustrates the utilization of enhanced PDR for calculating the coverage area, revealing consistent enhancement trends in our gateway’s coverage area with escalating ESP gains. For instance, with a 2 dB ESP gain, a notable 32.6% increase in coverage area is achievable. These outcomes suggest that due to the dynamic nature of link behaviors, a gateway’s coverage area tends to be irregular. Consequently, beyond deploying new gateways, optimizing gateway coverage by harnessing additional SNR gains from LoRa signals proves more effective in expanding coverage areas.
6. Conclusions
We conducted an extensive examination deploying a LoRaWAN system within mountainous terrains, employing a gateway and multiple nodes, specifically focusing on 8 LoRa end devices attached to sheep. Over a three-month period, we diligently collected data packets within an 4km × 4km mountainous area, revealing key insights into the dynamic behavior of LoRa link performance influenced by diverse land cover types. Our findings unveiled the dynamic nature of LoRa link behavior in spatial dimensions, strongly influenced by diverse land cover types. In addition, efficiently acquiring SNR gains from LoRa signals significantly expands network coverage. Moreover, our study introduced a predictive path loss model tailored for LoRa links in mountainous pastures, deriving empirical insights into the relationship between link path loss and the specific land covers traversed. Leveraging freely accessible multispectral satellite images, we developed a remote sensing workflow facilitating quantitative analysis of land cover compositions along the path of a LoRa link between the end device and gateway. Employing a recurrent neural network, specifically the “Bi-LSTM”, we captured the intricate interplay between path loss, land cover types, and their sequence along the path. Comparative analysis against state-of-the-art models demonstrated the superior performance of our prediction path loss model, showcasing enhanced accuracy and granularity in path loss estimation while requiring minimal transferring training overheads. These results underscore the efficacy and advancement of our model in characterizing and predicting path loss in challenging terrains, offering notable advancements in LoRaWAN system performance analysis.
Author Contributions
The presented work was carried out in collaboration with all of the authors. Conceptualization, M.O.O., M.B., and S.G.; Data Curation, M.O.O., M.B.; I.V., S.M., and E.M.; Methodology, M.O.O. and S.G.; Investigation, M.O.O. and I.V.; Visualization, M.O.O.; Resources, M.B.; Software, M.O.O.; Formal Analysis, M.O.O.; Writing—Original Draft Preparation, M.O.O.; Writing—Review and Editing, M.O.O., M.B., and S.G.; Supervision, M.B. and S.G.; Project Administration, S.M. and M.B.; Funding Acquisition, M.B. All authors have read and agreed to the published version of the manuscript.
Funding
This work has benefited from the equipment and framework of the COMP-HUB and COMP-R Initiatives, funded by the ‘Departments of Excellence’ program of the Italian Ministry for University and Research (MIUR, 2018-2022 and MUR, 2023-2027) and SMARTSHEEP 4.0 funded by CRC Foundation.
Institutional Review Board Statement
Not applicable.
Informed Consent Statement
Not applicable.
Data Availability Statement
Not applicable.
Acknowledgments
The authors express gratitude for the invaluable assistance provided during the experimental trials by Dr. Massimo Amerio (EURIX), acknowledging his dedicated commitment to supporting the project.
Conflicts of Interest
The authors declare no conflicts of interest. The funders had no role in the design of the study; in the collection, analysis, or interpretation of data; in the writing of the manuscript; or in the decision to publish the results.
References
- M. S. Farooq, S. Riaz, A. Abid, K. Abid, and M. A. Naeem, “A Survey on the Role of IOT in Agriculture for the Implementation of Smart Farming,” Ieee Access, vol. 7, pp. 156 237–156 271, 2019. [CrossRef]
- Tzounis, N. Katsoulas, T. Bartzanas, and C. Kittas, “Internet of Things in Agriculture, Recent Advances and Future Challenges,” Biosystems engineering, vol. 164, pp. 31–48, 2017. [CrossRef]
- M. O. Ojo, I. Viola, M. Baratta, and S. Giordano, “Practical Experiences of a Smart Livestock Location Monitoring System Leveraging GNSS, LoRaWAN and Cloud Services,” Sensors, vol. 22, no. 1, p. 273, 2021. [CrossRef]
- R. S. Alonso, I. Sittón-Candanedo, Ó. García, J. Prieto, and S. Rodríguez-González, “An Intelligent Edge-IOT Platform for Monitoring Livestock and Crops in a Dairy Farming Scenario,” Ad Hoc Networks, vol. 98, p. 102047, 2020. [CrossRef]
- Lavric, A. I. Petrariu, and V. Popa, “Long Range Sigfox Communication Protocol Scalability Analysis Under Large-Scale, High-Density Conditions,” IEEE Access, vol. 7, pp. 35 816–35 825, 2019. 662. [CrossRef]
- F. Adelantado, X. Vilajosana, P. Tuset-Peiro, B. Martinez, J. Melia-Segui, and T. Watteyne, “Understanding the Limits of LORAWAN,” IEEE Communications magazine, vol. 55, no. 9, pp. 34–40, 2017. [CrossRef]
- R. S. Sinha, Y. Wei, and S.-H. Hwang, “A Survey on LPWA Technology: LoRa and NB-IOT,” Ict Express, vol. 3, no. 1, pp. 14–21, 2017. [CrossRef]
- D. Magrin, M. Capuzzo, A. Zanella, L. Vangelista, and M. Zorzi, “Performance Analysis of LoRaWAN in Industrial Scenarios,” IEEE Transactions on Industrial Informatics, vol. 17, no. 9, pp. 6241–6250, 2020. [CrossRef]
- J. Schmidhuber, “Deep Learning in Neural Networks: An Overview,” Neural networks, vol. 61, pp. 85–117, 2015. [CrossRef]
- D. Croce, D. Garlisi, F. Giuliano, A. L. Valvo, S. Mangione, and I. Tinnirello, “Performance of LoRa for Bike-Sharing Systems,” in 2019 AEIT International Conference of Electrical and Electronic Technologies for Automotive (AEIT AUTOMOTIVE). IEEE, 2019, pp. 1–6. [CrossRef]
- J. Yang, Z. Xu, and J.Wang, “Ferrylink: Combating Link Degradation for Practical LPWAN Deployments,” in 2021 IEEE 27th International Conference on Parallel and Distributed Systems (ICPADS). IEEE, 2021, pp. 575–582. [CrossRef]
- M. O. Ojo, D. Adami, and S. Giordano, “Experimental Evaluation of a LoRa Wildlife Monitoring Network in a Forest Vegetation Area,” Future Internet, vol. 13, no. 5, p. 115, 2021. [CrossRef]
- R. El Chall, S. Lahoud, and M. El Helou, “LoRaWAN Network: Radio Propagation Models and Performance Evaluation in Various Environments in Lebanon,” IEEE Internet of Things Journal, vol. 6, no. 2, pp. 2366–2378, 2019. [CrossRef]
- W. Xu, J. Y. Kim, W. Huang, S. S. Kanhere, S. K. Jha, and W. Hu, “Measurement, Characterization, and Modeling of LoRa Technology in Multifloor Buildings,” IEEE Internet of Things Journal, vol. 7, no. 1, pp. 298–310, 2019. [CrossRef]
- K. Mikhaylov, M. Stusek, P. Masek, R. Fujdiak, R. Mozny, S. Andreev, and J. Hosek, “On the Performance of Multi-Gateway LoRaWAN Deployments: An Experimental Study,” in 2020 IEEE Wireless Communications and Networking Conference (WCNC). IEEE, 2020, pp. 1–6. [CrossRef]
- M. Series, “Guidelines for Evaluation of Radio Interface Technologies for IMT-Advanced,” Report ITU, vol. 638, no. 31, 2009.
- Y. Okumura, “Field Strength and its Variability in VHF and UHF Land-Mobile Radio Service,” Review of the Electrical communication Laboratory, vol. 16, no. 9, 1968.
- P. E. Mogensen and J.Wigard, “COST Action 231: Digital Mobile Radio Towards Future Generation System, Final Report.” in Section 5.2: On antenna and frequency diversity in GSM. Section 5.3: Capacity study of frequency hopping GSM network, 1999.
- M. C. Bor, U. Roedig, T. Voigt, and J. M. Alonso, “Do LoRa Low-Power Wide-Area Networks Scale?” in Proceedings of the 19th ACM International Conference on Modeling, Analysis and Simulation of Wireless and Mobile Systems, 2016, pp. 59–67. [CrossRef]
- J. Petajajarvi, K. Mikhaylov, A. Roivainen, T. Hanninen, and M. Pettissalo, “On the Coverage of LPWANs: Range Evaluation and Channel Attenuation Model for LoRa Technology,” in 2015 14th international conference on its telecommunications (itst). IEEE, 2015, pp. 55–59. [CrossRef]
- S. Demetri, M. Zúñiga, G. P. Picco, F. Kuipers, L. Bruzzone, and T. Telkamp, “Automated Estimation of Link Quality for Lora: A Remote Sensing Approach,” in Proceedings of the 18th International Conference on Information Processing in Sensor Networks, 2019, pp. 145–156. [CrossRef]
- Y. Lin, W. Dong, Y. Gao, and T. Gu, “Sateloc: A Virtual Fingerprinting Approach to Outdoor Lora Localization Using Satellite Images,” ACM Transactions on Sensor Networks (TOSN), vol. 17, no. 4, pp. 1–28, 2021.
- W. Dong, Y. Liu, Y. He, T. Zhu, and C. Chen, “Measurement and Analysis on the Packet Delivery Performance in a Large-Scale Sensor Network,” IEEE/ACM Transactions on Networking, vol. 22, no. 6, pp. 1952–1963, 2013. [CrossRef]
- Y. Liu, Y. He, M. Li, J.Wang, K. Liu, and X. Li, “Does Wireless Sensor Network Scale? A Measurement Study on GreenOrbs,” IEEE Transactions on Parallel and Distributed Systems, vol. 24, no. 10, pp. 1983–1993, 2012. [CrossRef]
- STMICROELECTRONICS, “STM32L151X6/8/B-A STM32L152X6/8/B-A, Available Online: https://www.st.com/resource/en/errata_sheet/es0224-stm32l151x68b-and-stm32l152x68b-device-errata-stmicroelectronics.pdf,” Accessed on: March 1, 2024.
- SILICONLABS, “Cp2102/9 Single-Chip USB-to-UART Bridge, Datasheet; Rev 1.8, available Online: https://www.silabs.com/documents/public/data-sheets/cp2102-9.pdf,” Accessed on: March 1, 2024.
- Semtech, “Sx1276/77/78/79—137 mhz to 1020 mhz Low Power Long Range Transceiver,” 2020.
- T. Instruments, “TPS27082L Datasheet,” Texas Instruments: Dallas, TX, USA, 2015.
- M. Bor and U. Roedig, “LoRa Transmission Parameter Selection,” in 2017 13th International Conference on Distributed Computing in Sensor Systems (DCOSS). IEEE, 2017, pp. 27–34. [CrossRef]
- P. Jörke, S. Böcker, F. Liedmann, and C. Wietfeld, “Urban Channel Models for Smart City IOT-Networks Based on Empirical Measurements of LoRa-Links at 433 and 868 MHZ,” in 2017 IEEE 28th Annual International Symposium on Personal, Indoor, and Mobile Radio Communications (PIMRC). IEEE, pp. 1–6, 2017.
- Augustin, J. Yi, T. Clausen, andW. M. Townsley, “A Study of LoRa: Long Range & Low Power Networks for the Internet of Things,” Sensors, vol. 16, no. 9, p. 1466, 2016. [CrossRef]
- C.-W. Hsu and C.-J. Lin, “A Comparison of Methods for Multiclass Support Vector Machines,” IEEE transactions on Neural Networks, vol. 13, no. 2, pp. 415–425, 2002. [CrossRef]
- G. Mountrakis, J. Im, and C. Ogole, “Support Vector Machines in Remote Sensing: A Review,” ISPRS journal of photogrammetry and remote sensing, vol. 66, no. 3, pp. 247–259, 2011. [CrossRef]
- G. Camps-Valls and L. Bruzzone, Kernel Methods for Remote Sensing Data Analysis. John Wiley & Sons, 2009.
- L. S.-T. Memory, “Long Short-Term Memory,” Neural computation, vol. 9, no. 8, pp. 1735–1780, 2010.
- M. Schuster and K. K. Paliwal, “Bidirectional Recurrent Neural Networks,” IEEE transactions on Signal Processing, vol. 45, no. 11, pp. 2673–2681, 1997. [CrossRef]
- C. Williams and C. Rasmussen, “Gaussian Processes for Regression,” Advances in neural information processing systems, vol. 8, 1995.
- Paszke, S. Gross, F. Massa, A. Lerer, J. Bradbury, G. Chanan, T. Killeen, Z. Lin, N. Gimelshein, L. Antiga et al., “PyTorch: An Imperative Style, High-Performance Deep Learning Library,” Advances in neural information processing systems, vol. 32, 2019. [CrossRef]
Figure 1.
IoT device block scheme.
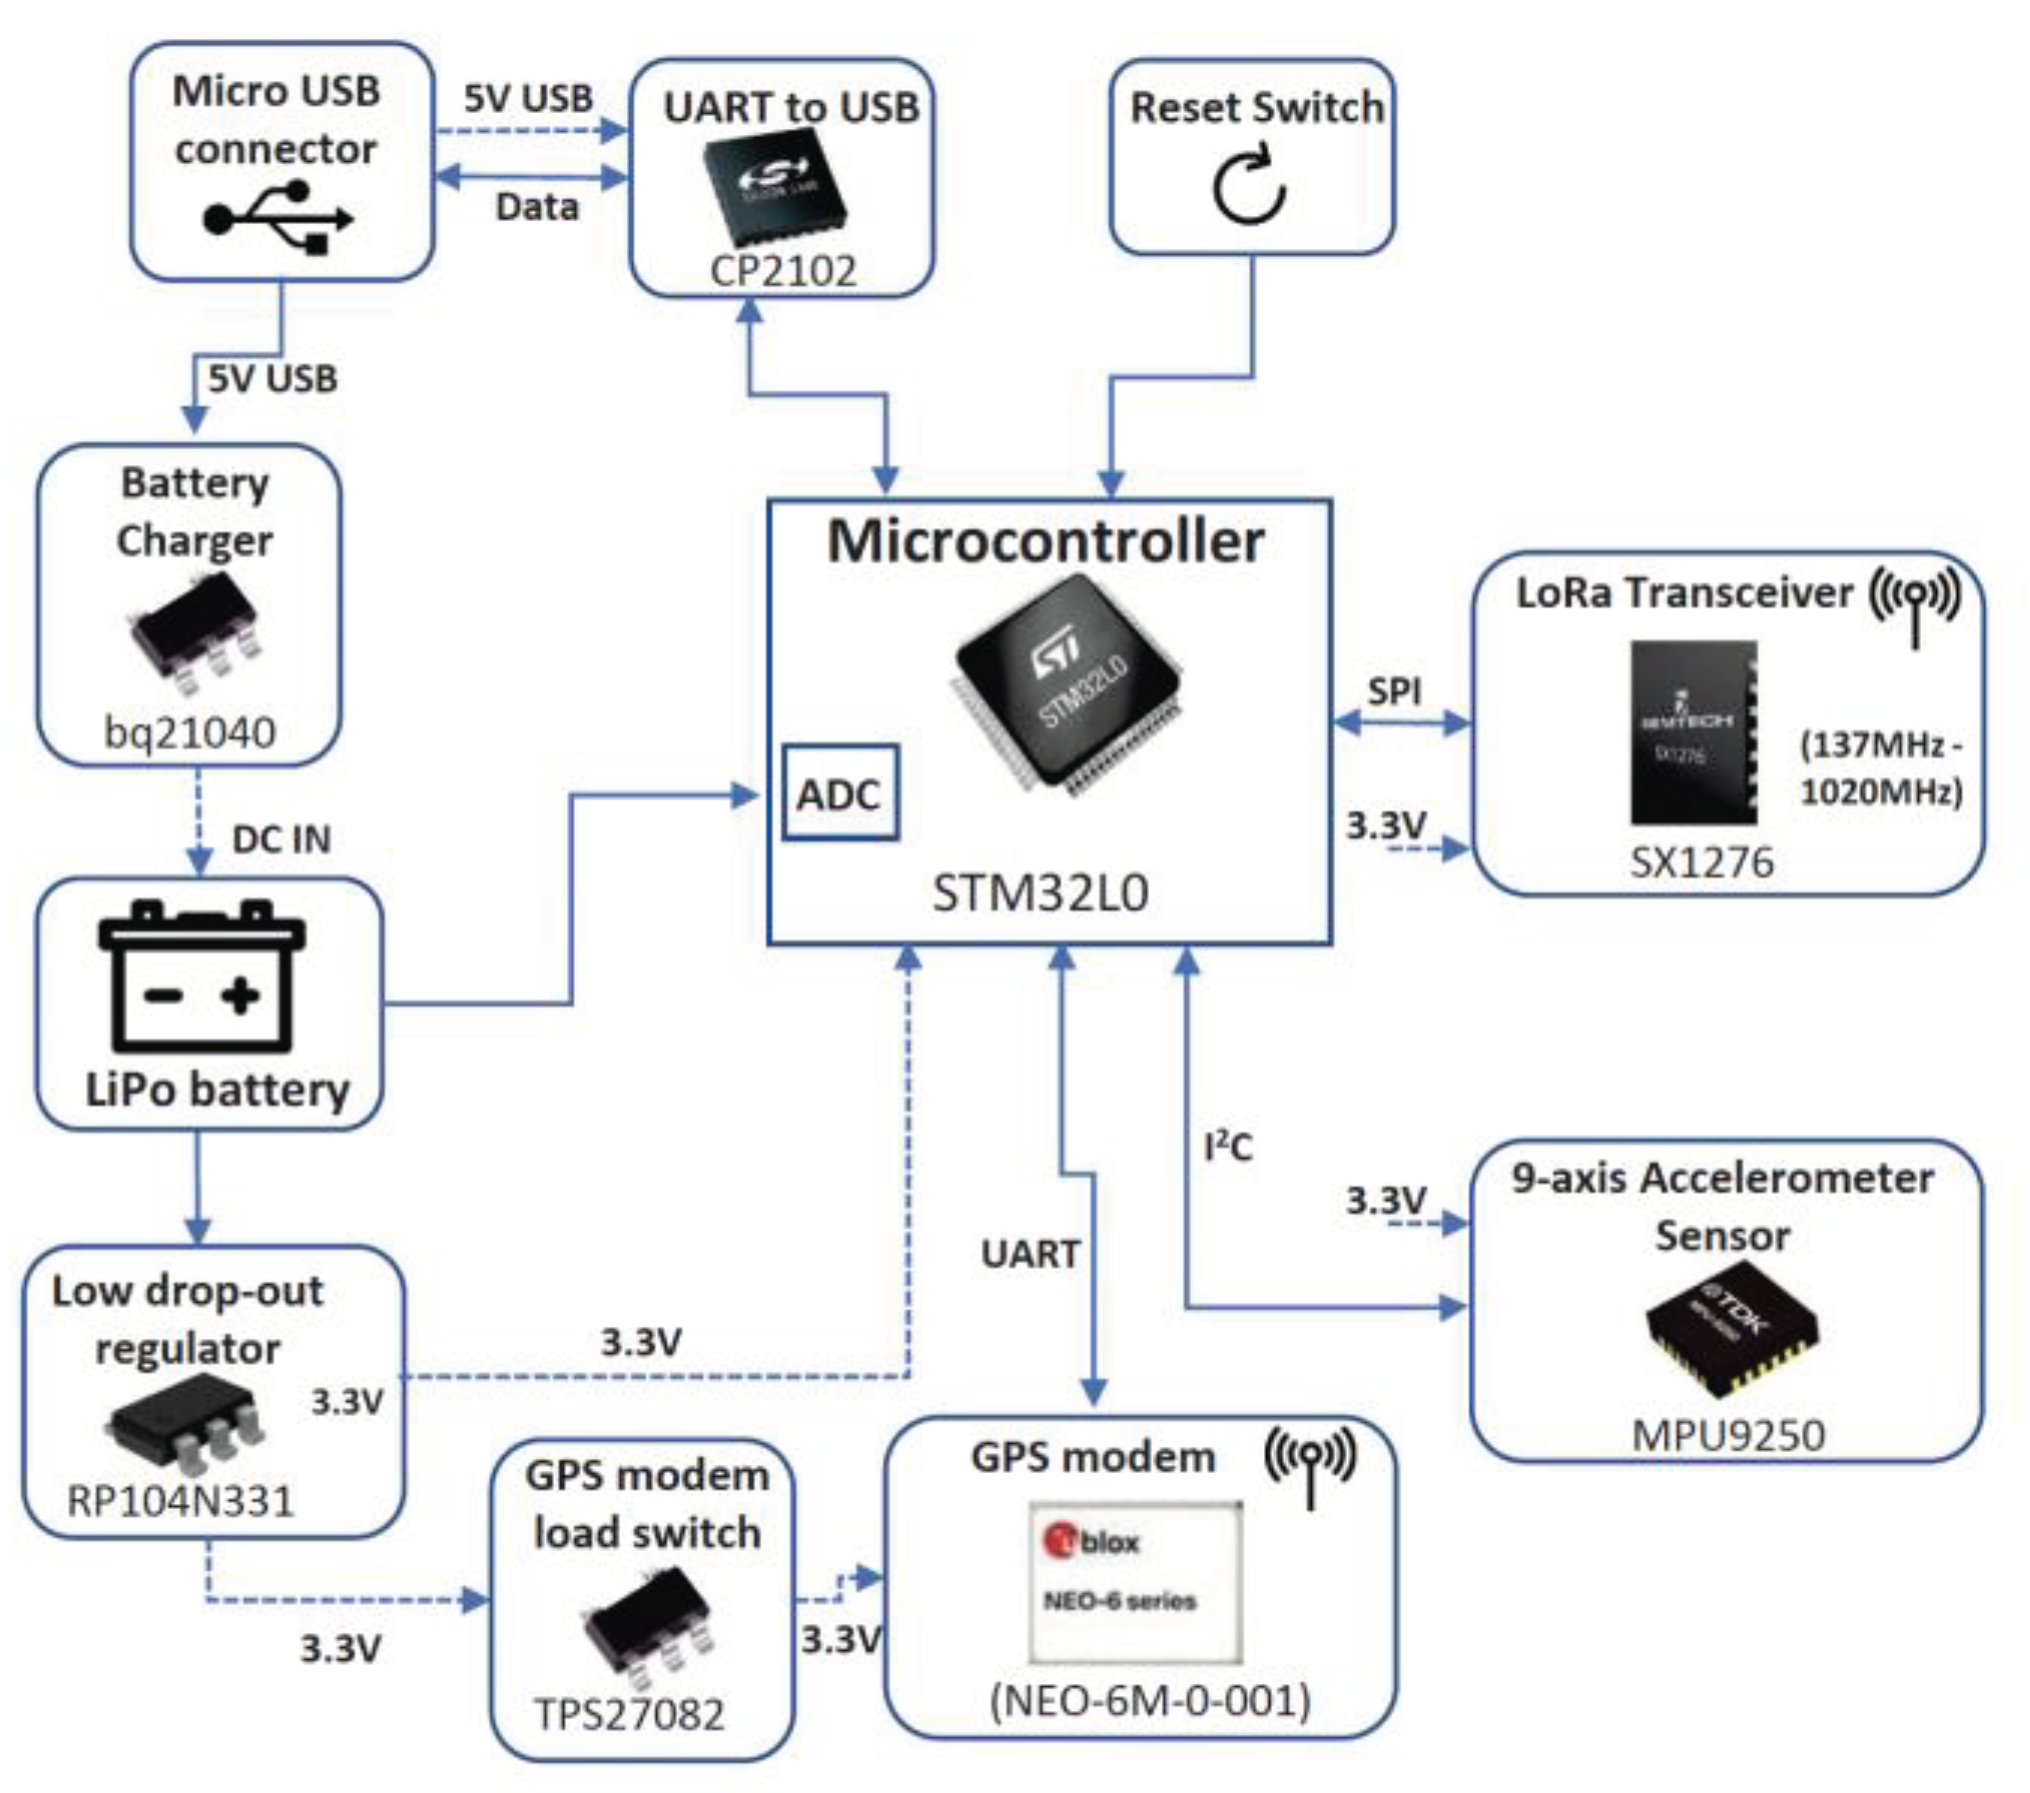
Figure 2.
System Design Overview.
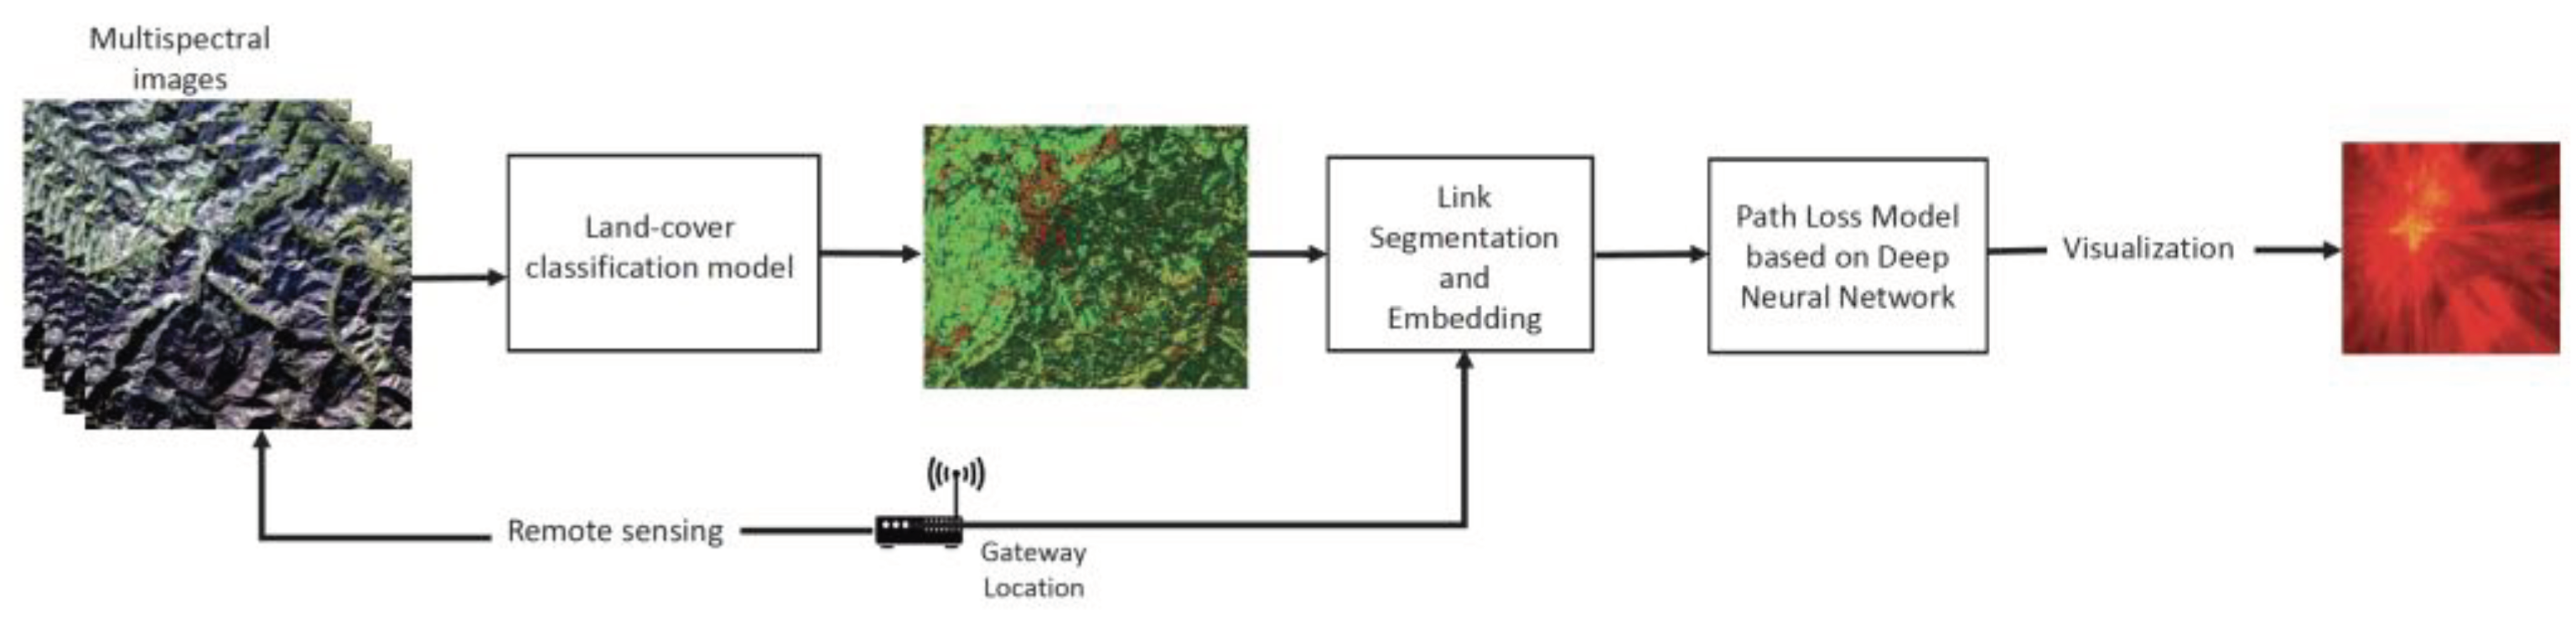
Figure 3.
Path loss prediction model using deep learning with Bi-LSTM architecture.
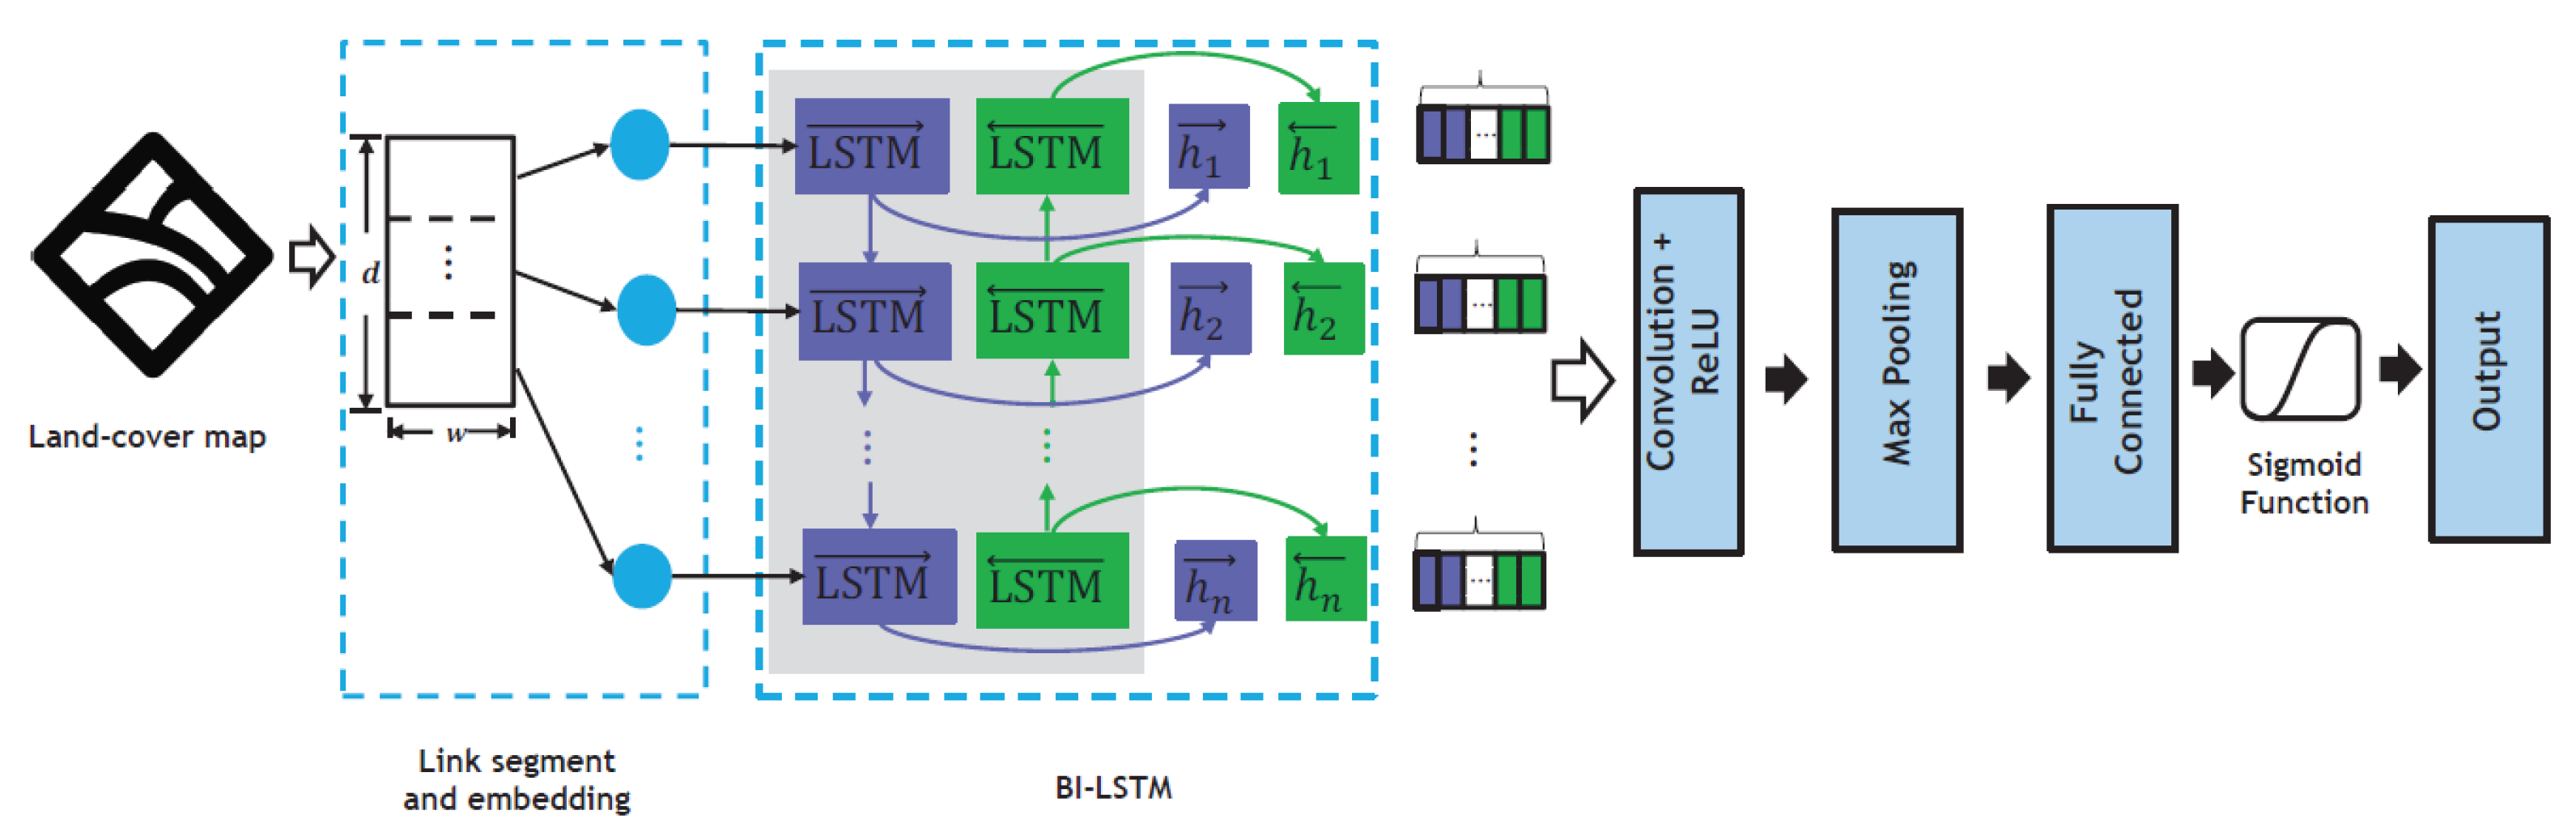
Figure 4.
Link segment and embedding.
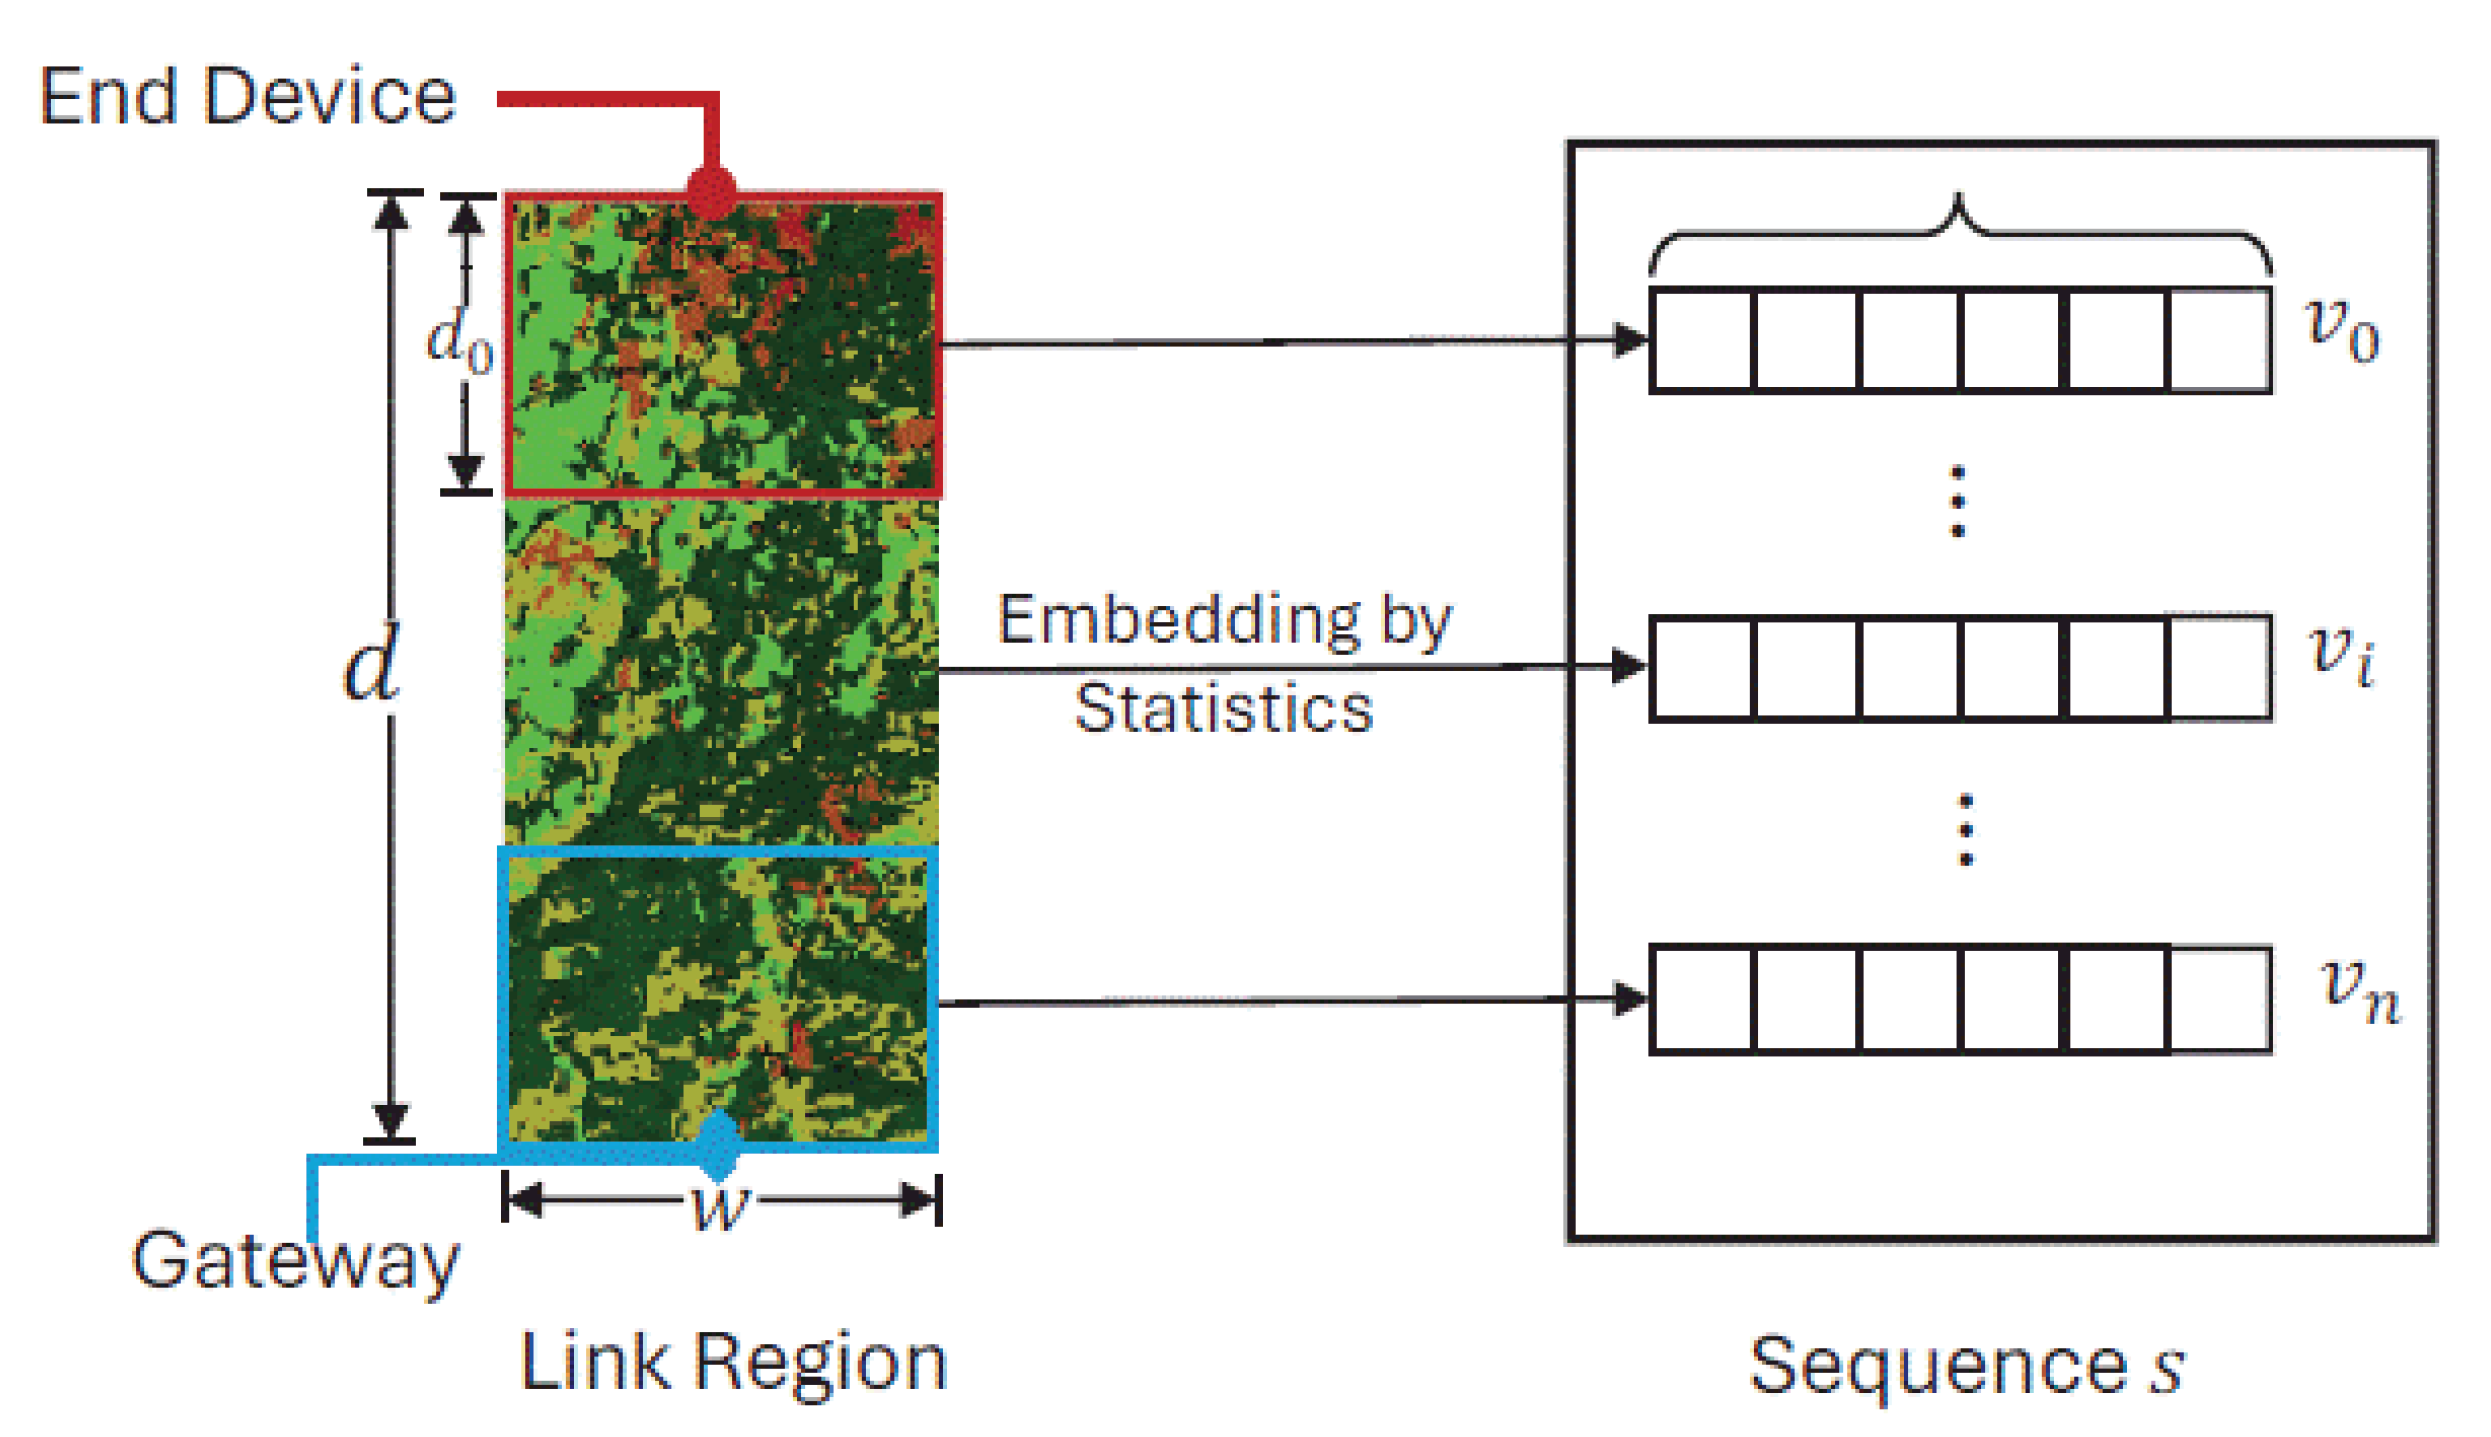
Figure 5.
Bi-LSTM Architecture.
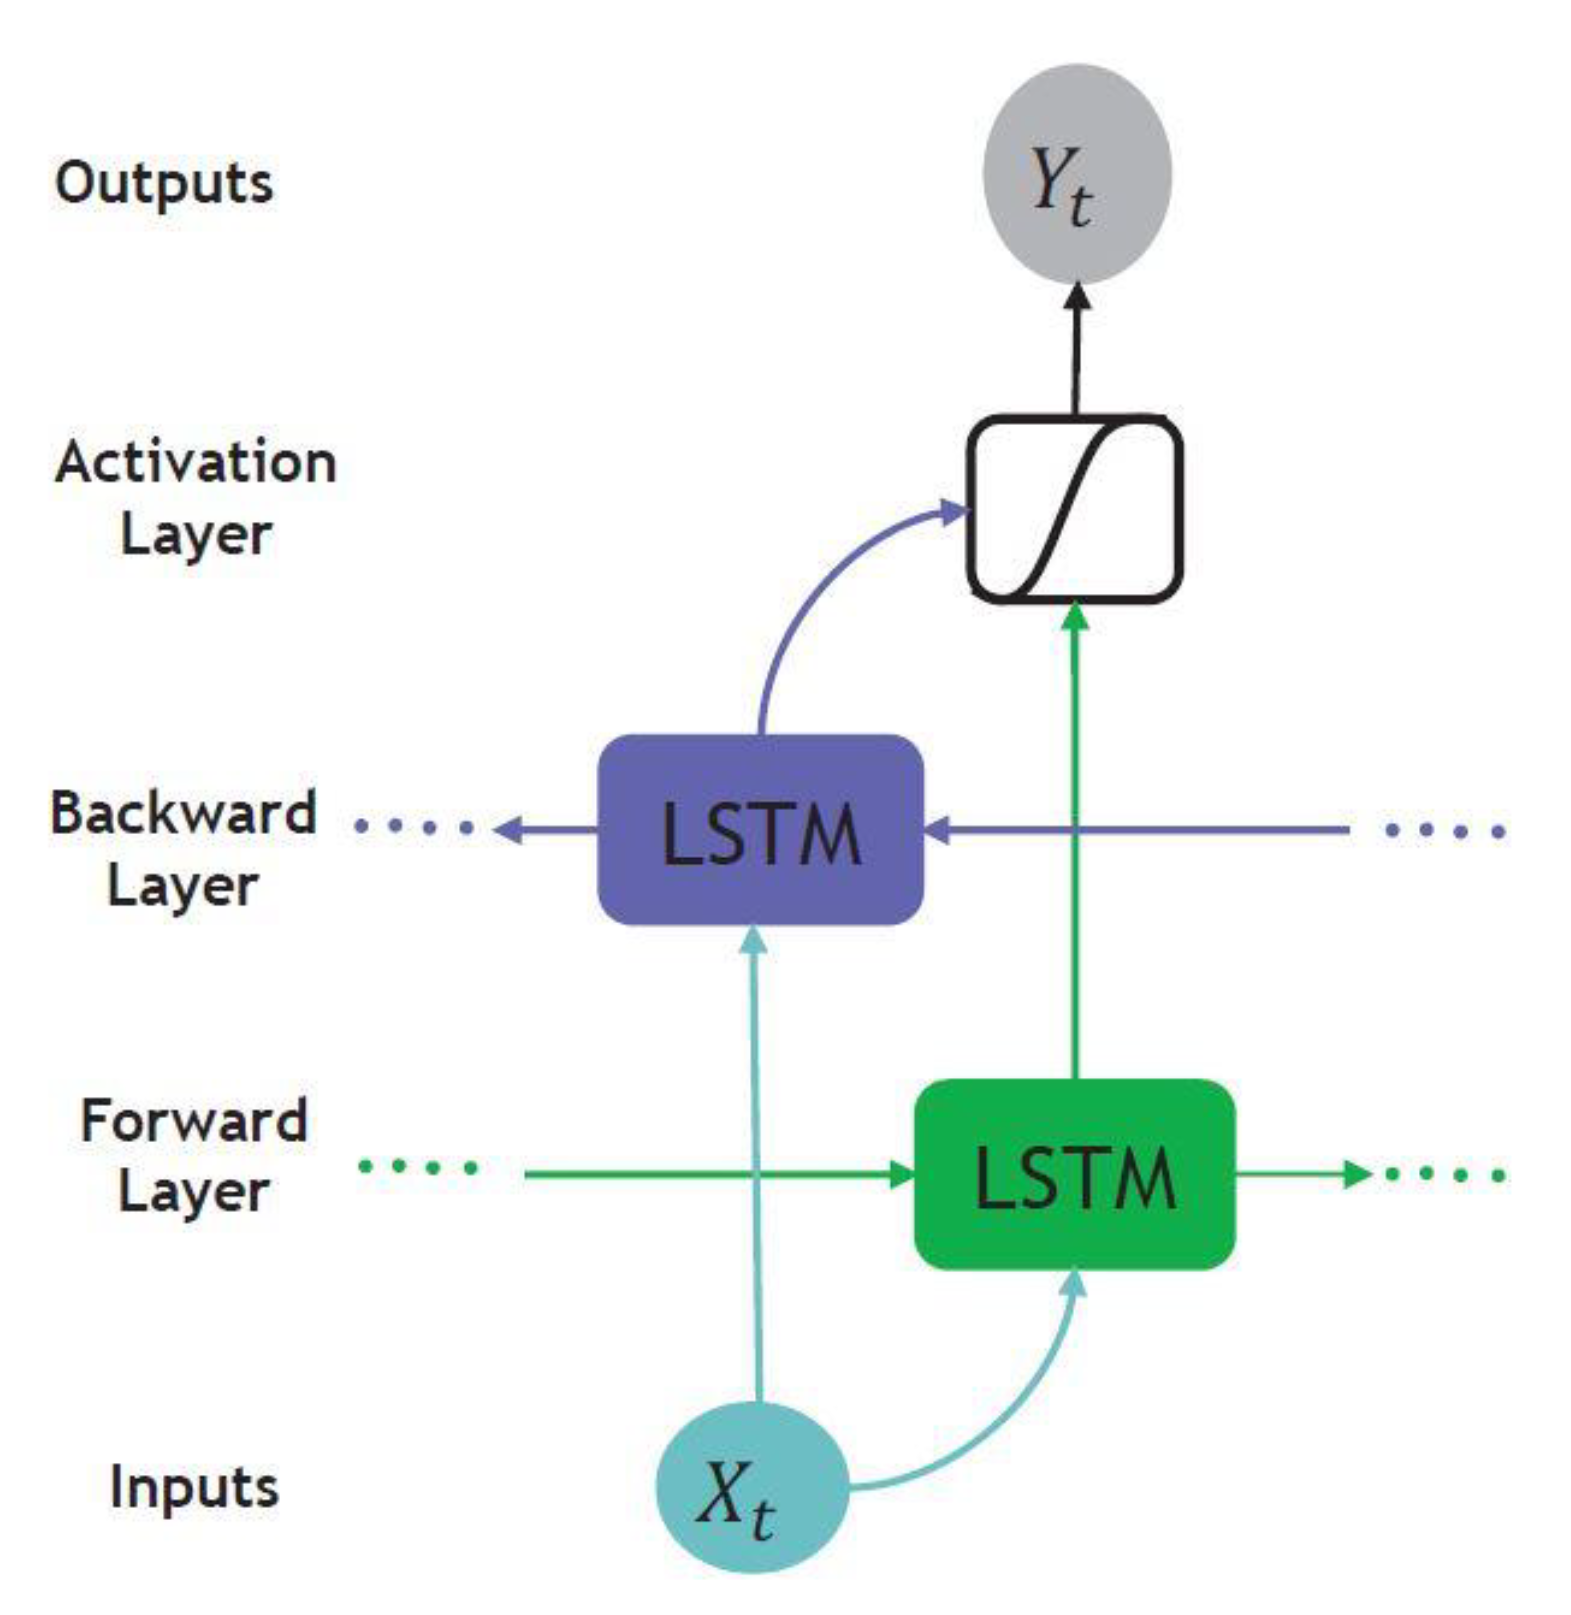
Figure 6.
CDF of PDR and ESP observed at the LoRa Gateway.
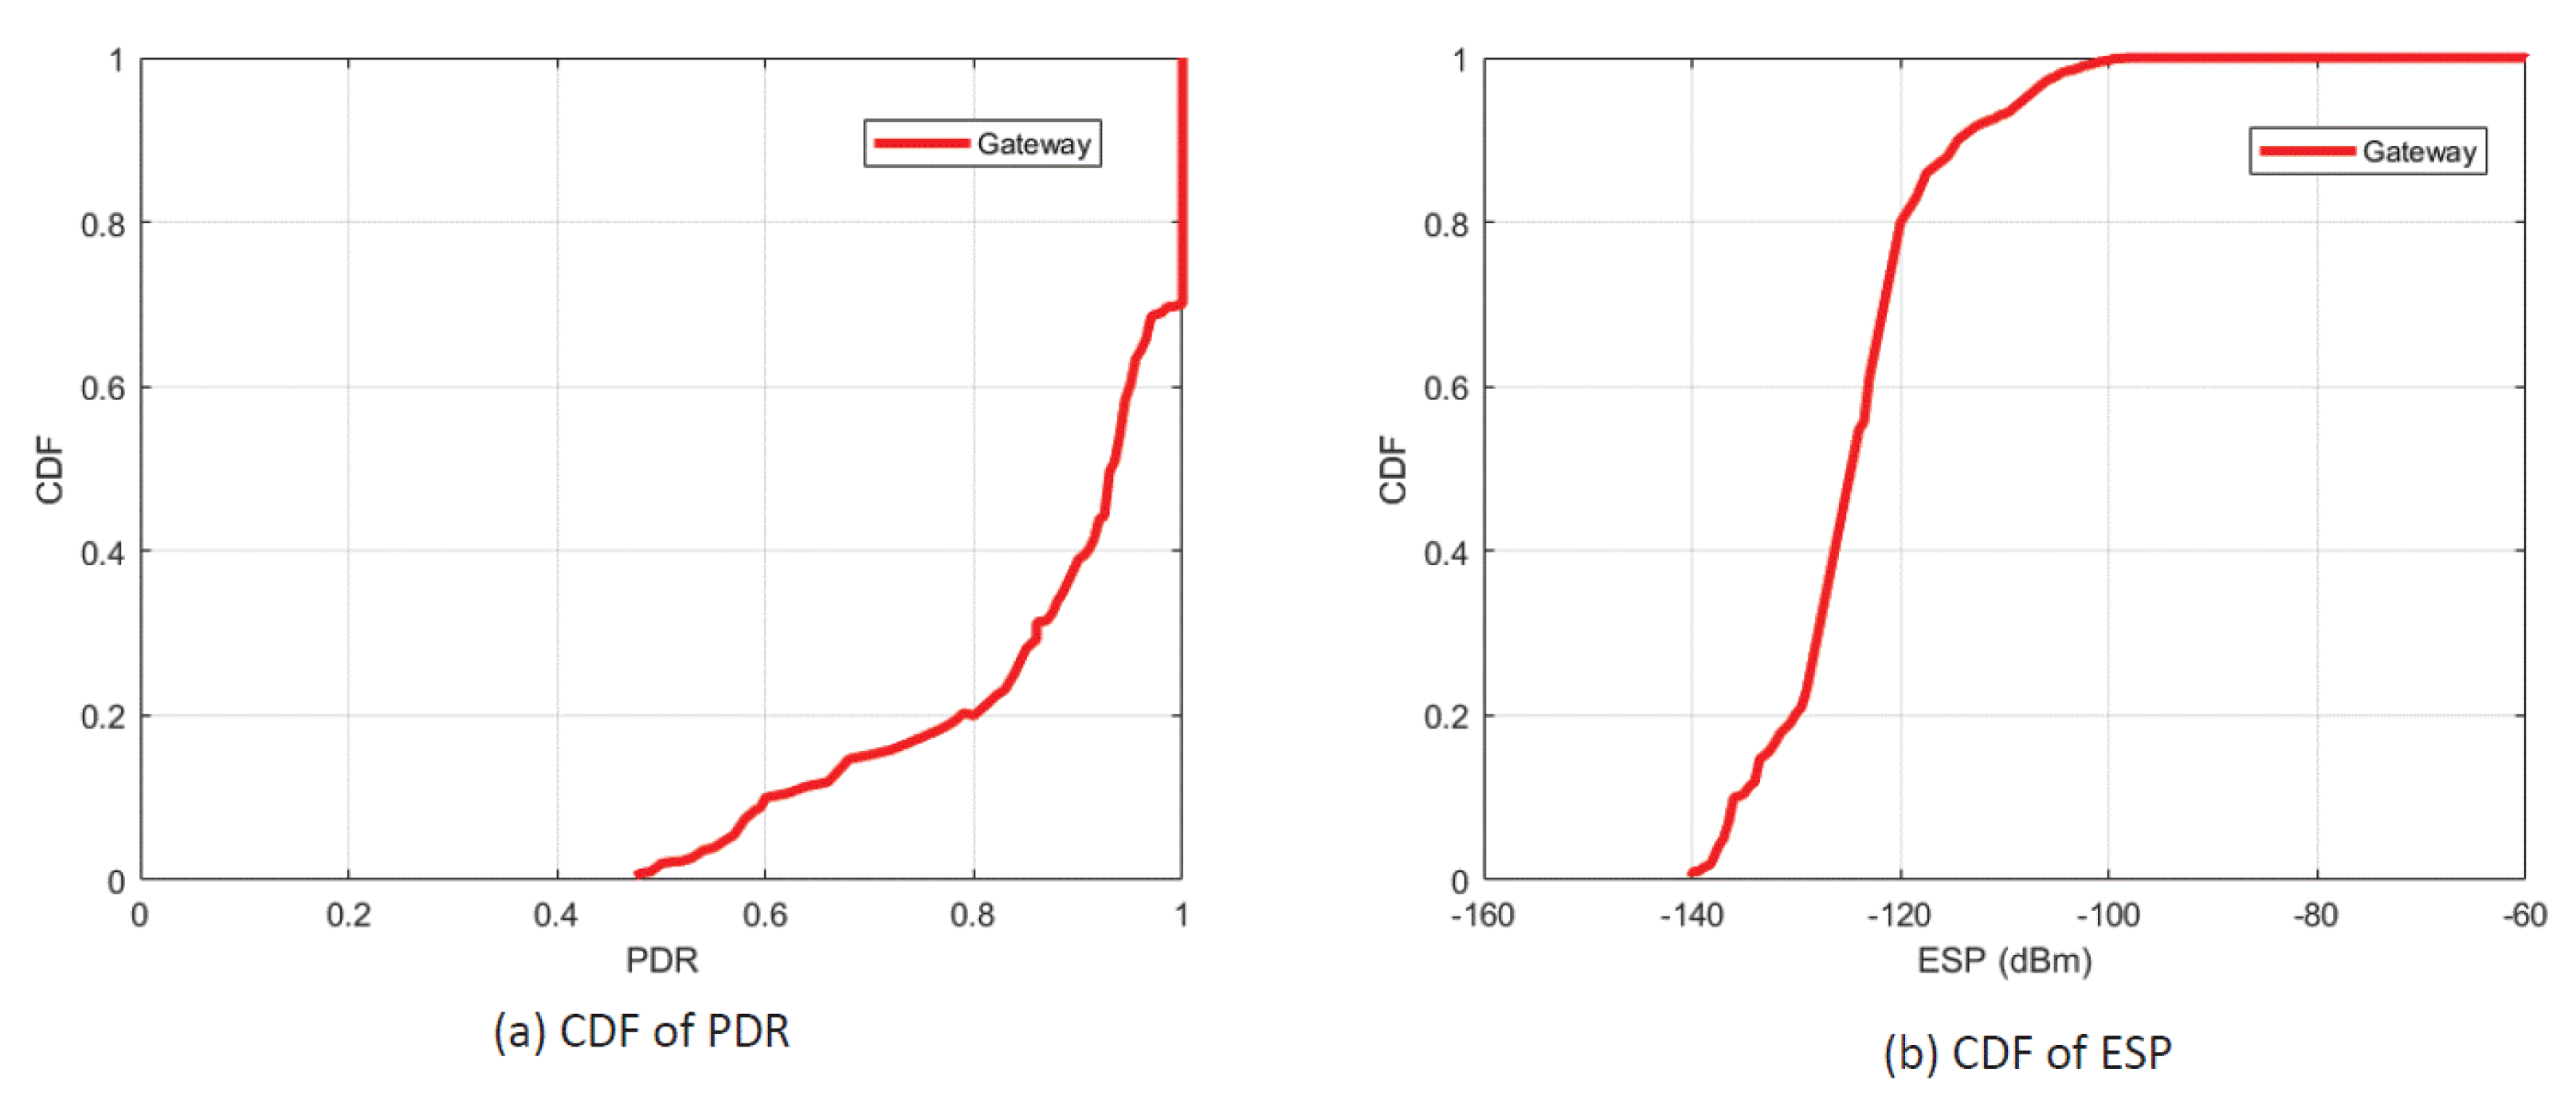
Figure 7.
The spatial distribution for PDR and distance.
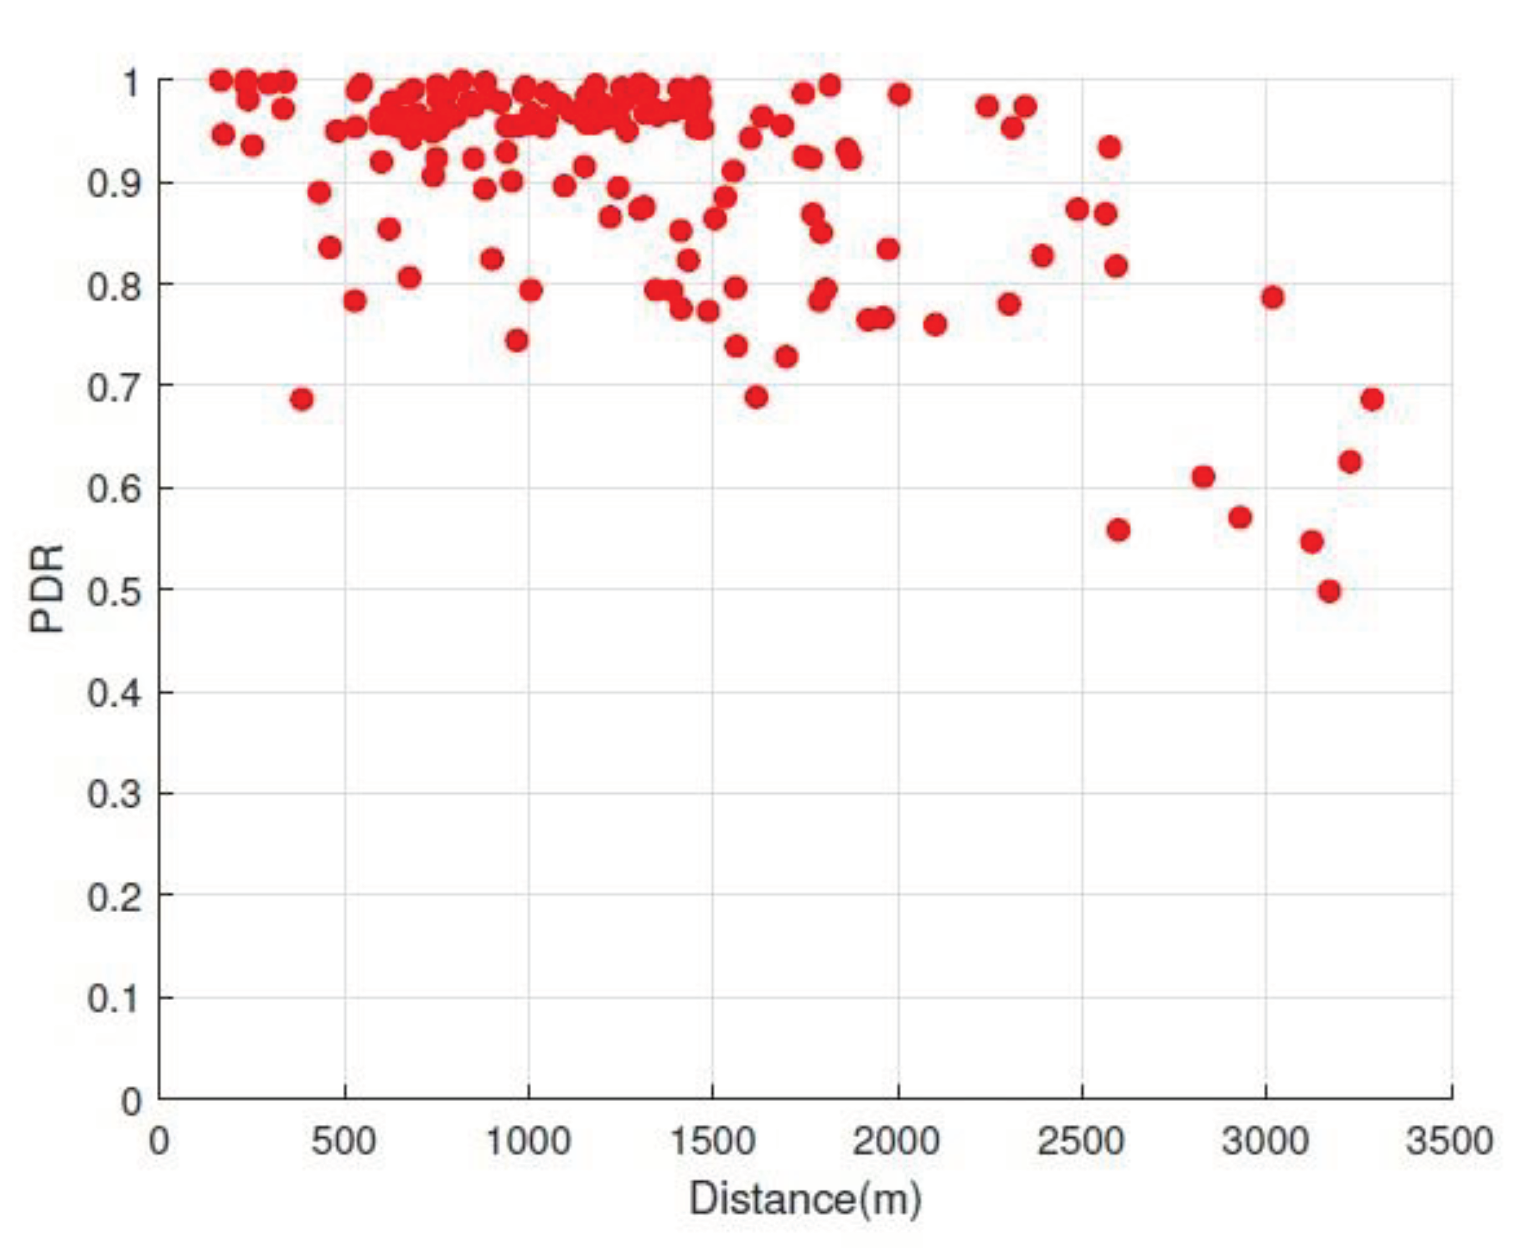
Figure 8.
PDR against ESP at our gateway.
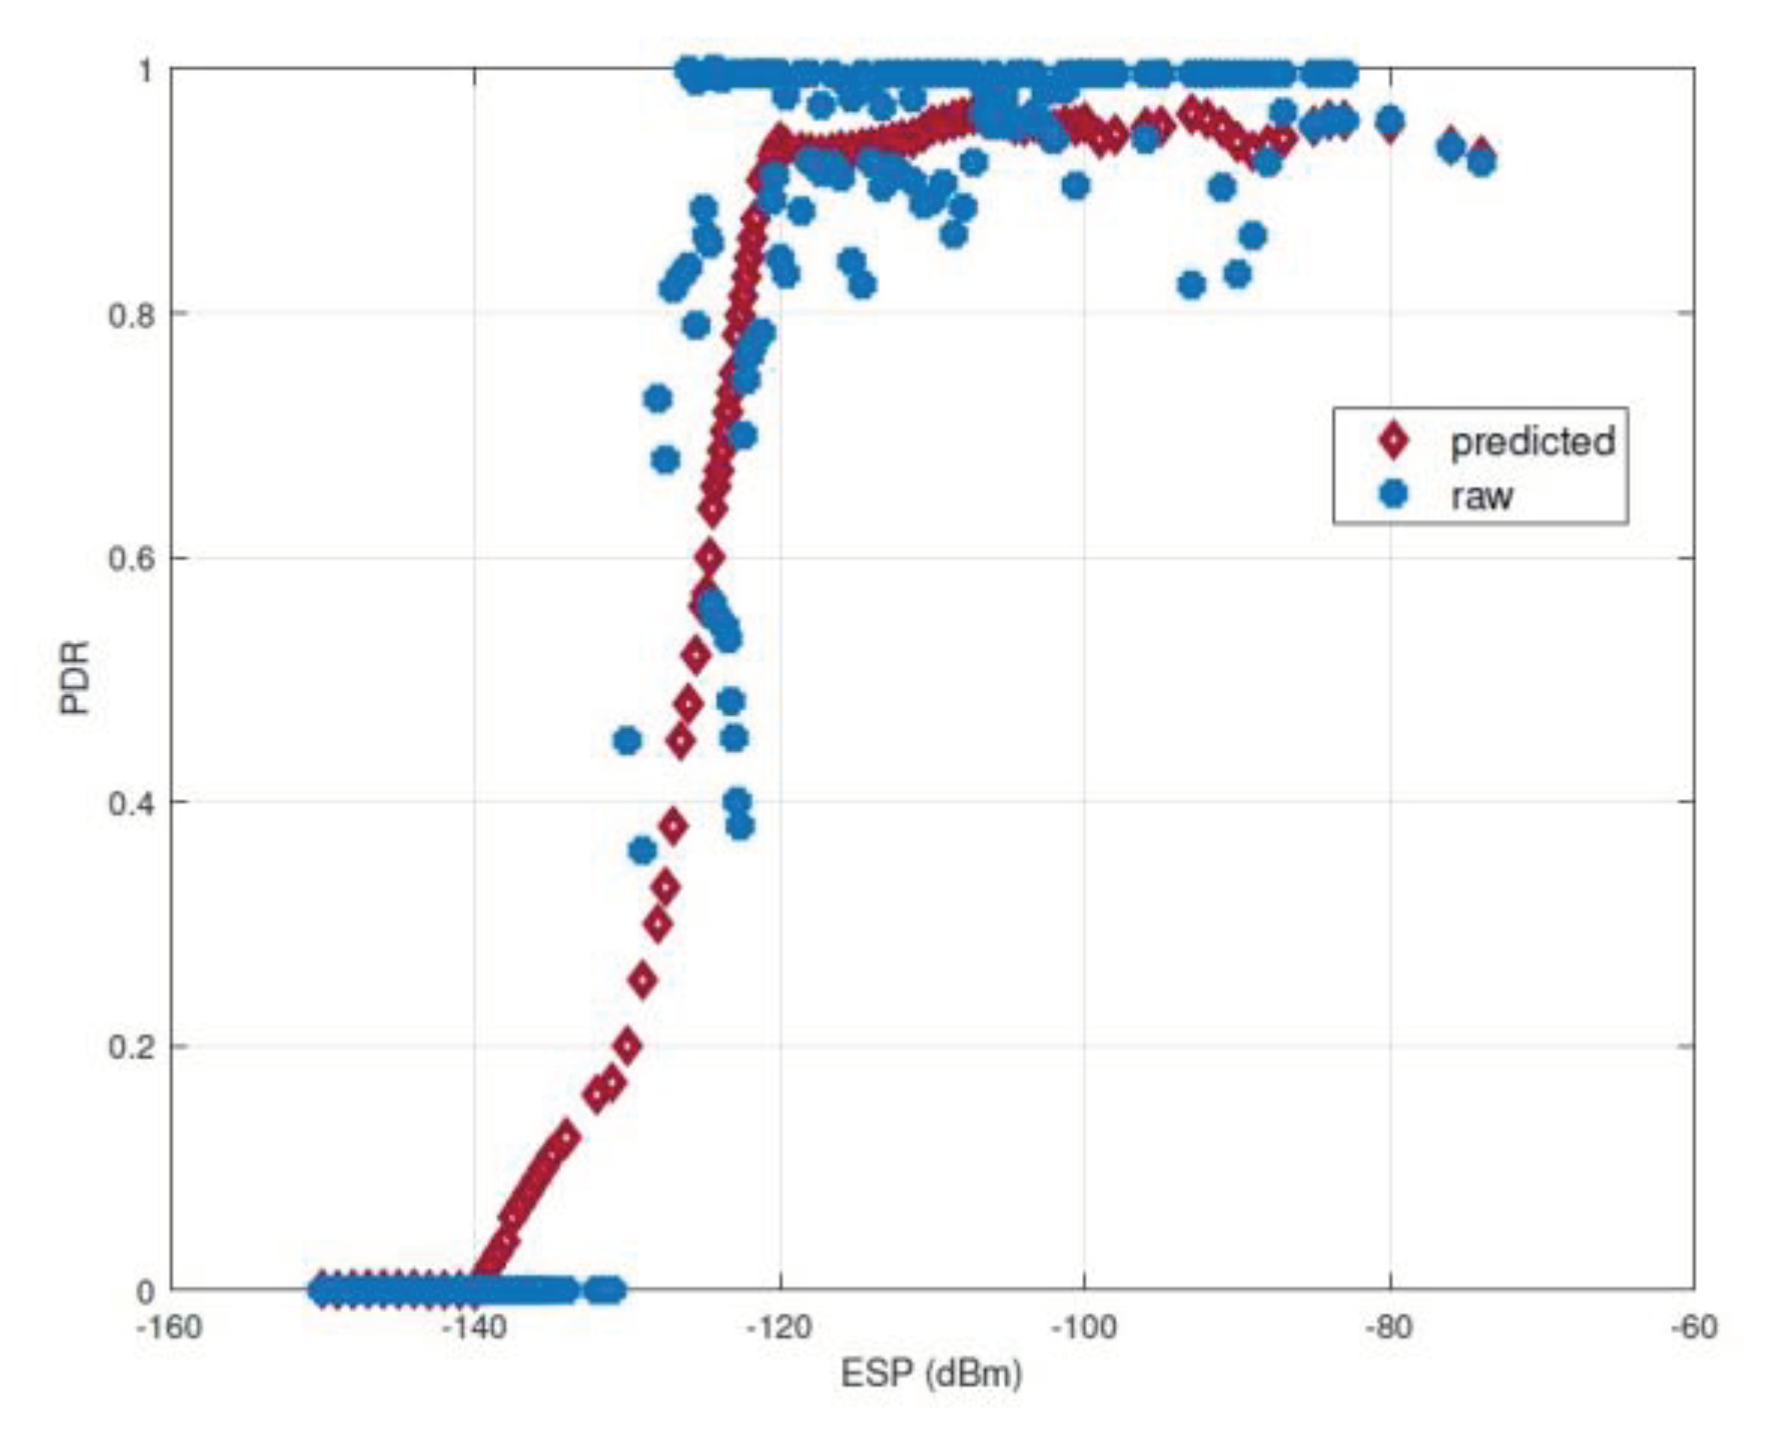
Figure 9.
Map depicting the land cover classification of a 4 × 4 km2 area of interest.
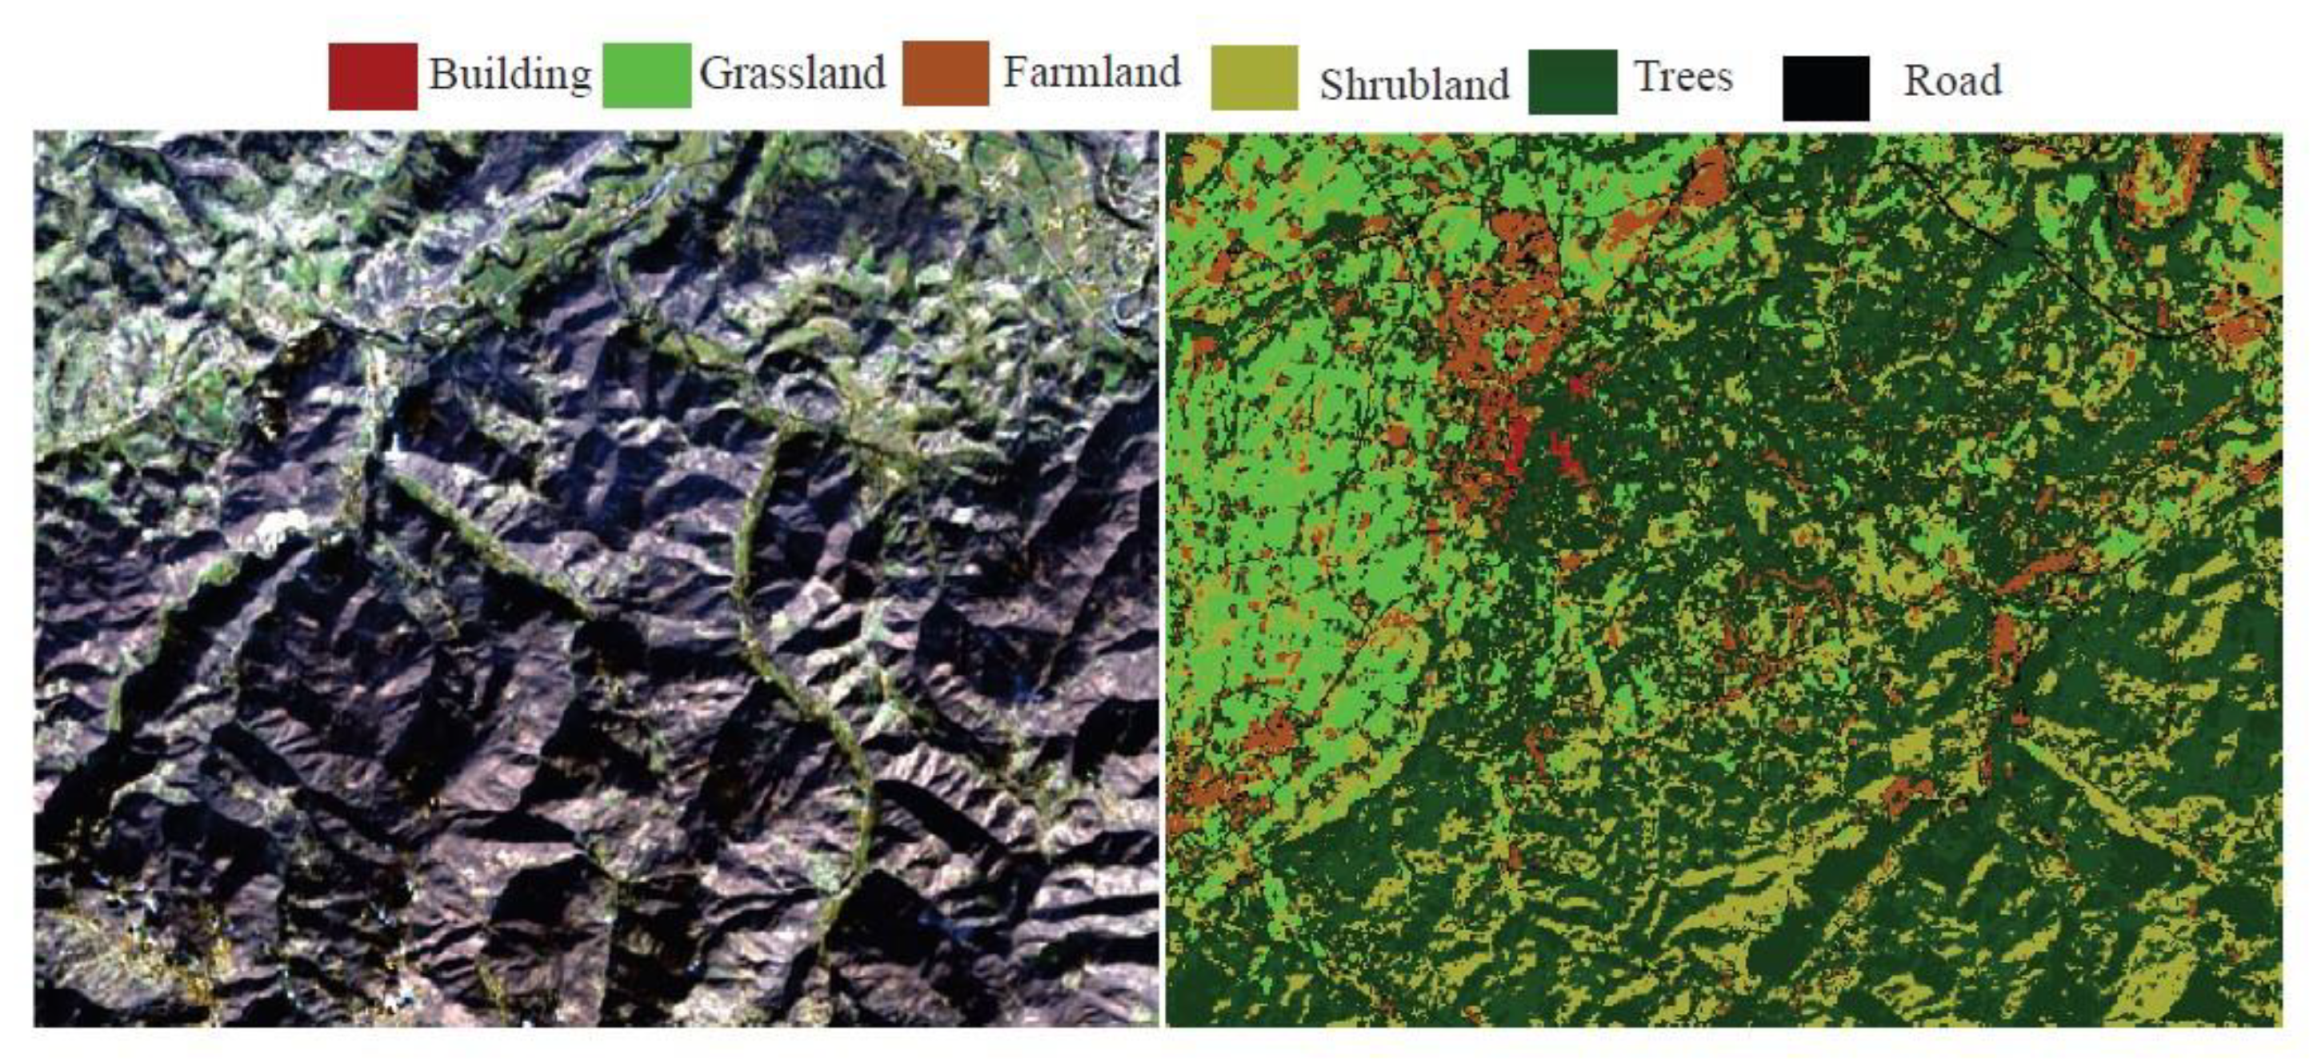
Figure 10.
Distribution of the estimation errors on the test se.
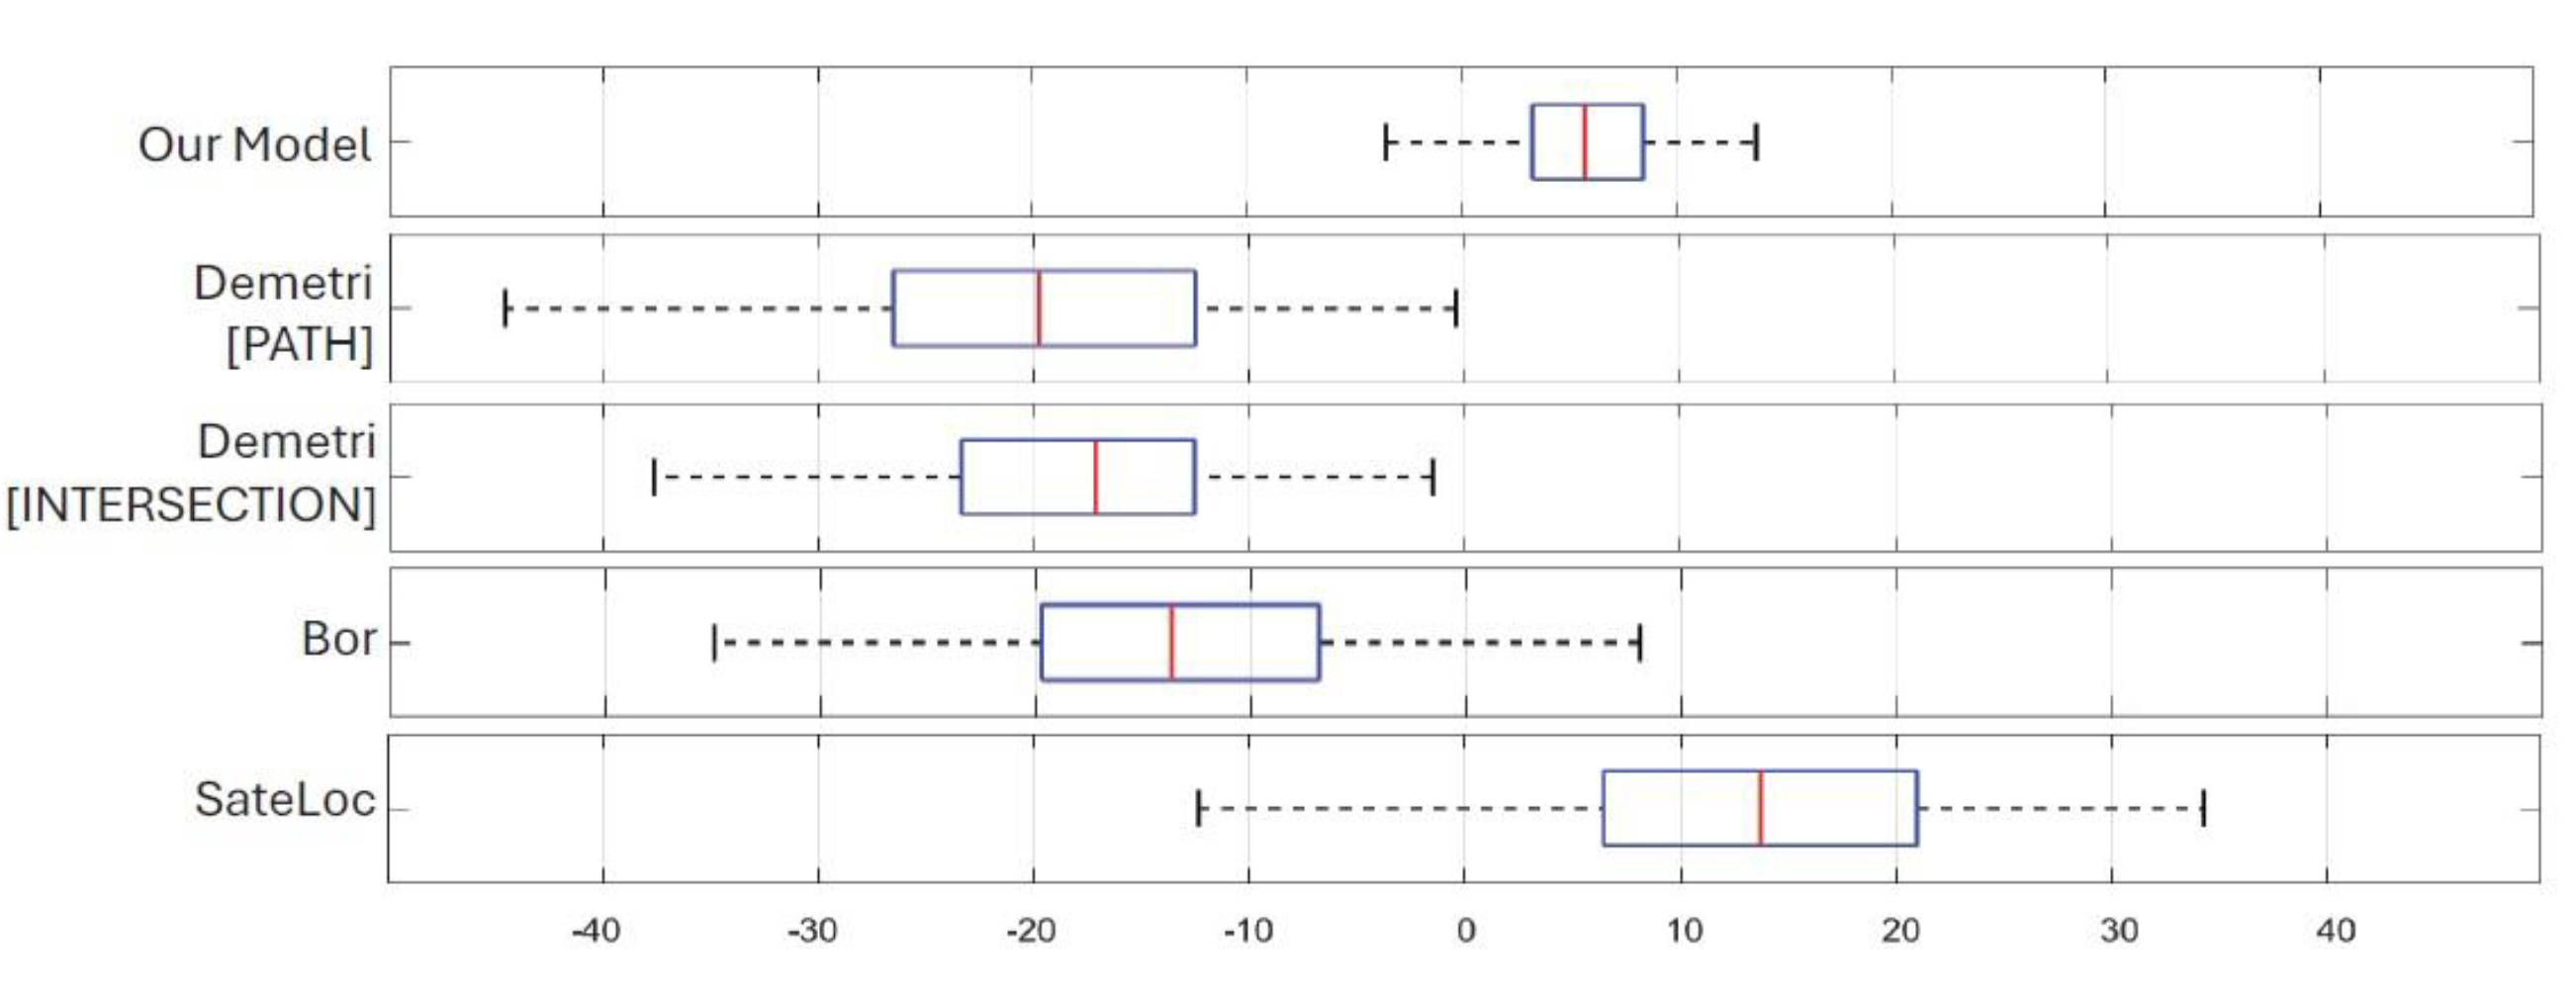
Figure 11.
CDF of predicted PDR with different ESP gains.
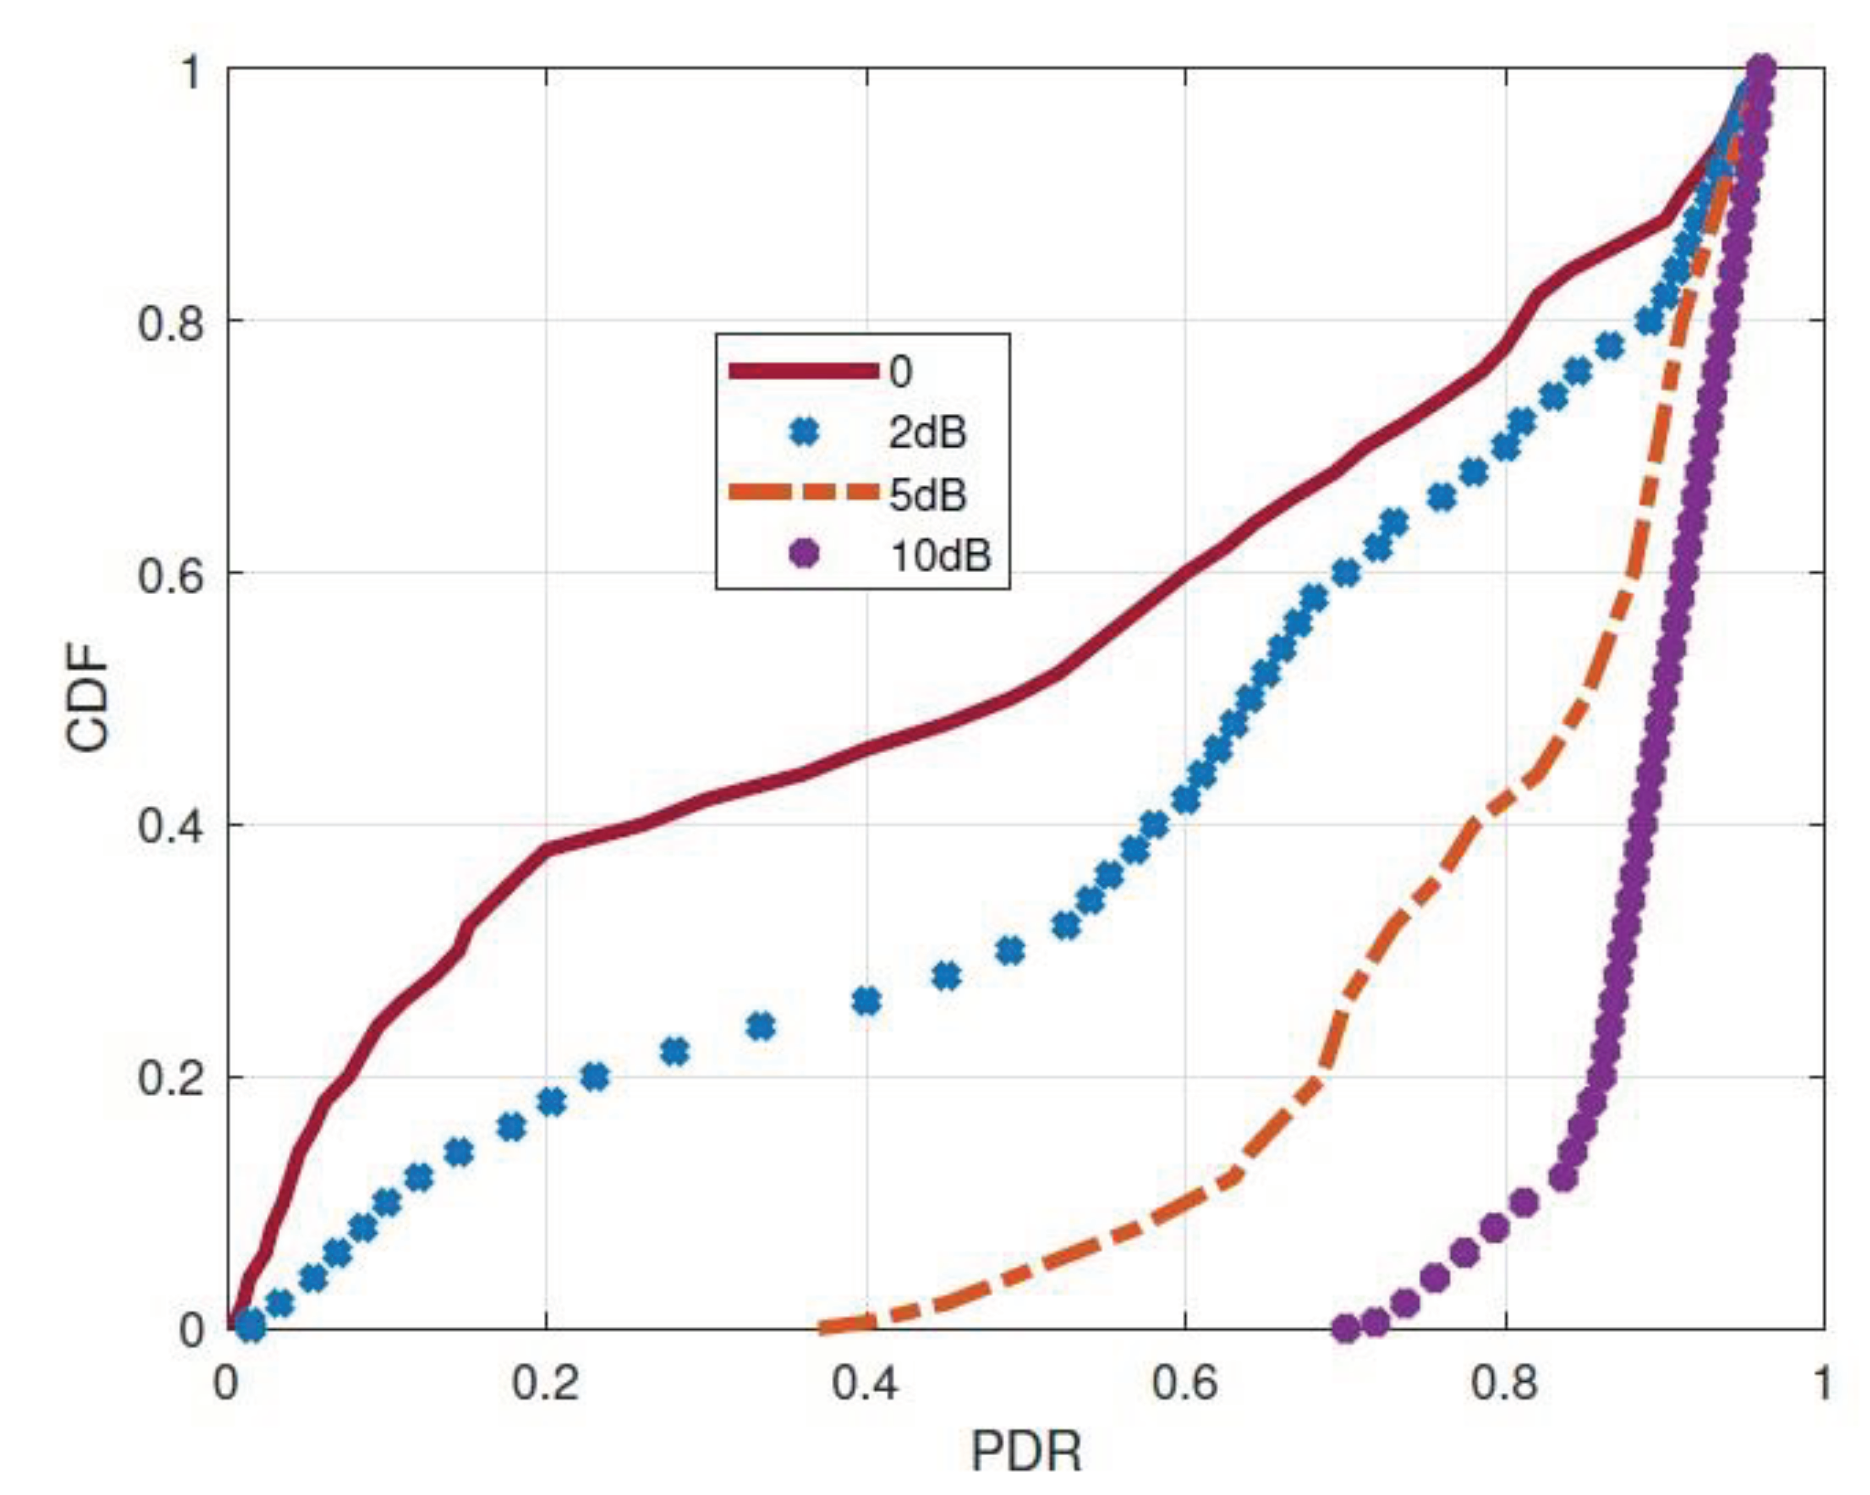

Table 1.
Types of Land-Covers.
| Trees | trees |
| Grassland | grazing lands |
| Farmland | crop fields |
| Water | rivers and lakes |
| Road | roads, paths |
| Building | buildings, huts |
| Shrubland | shrubland |
Table 2.
Estimation errors of absolute path loss across various models.
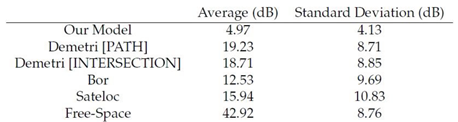 |
Table 3.
Coverage area under different ESP gains.
 |
Disclaimer/Publisher’s Note: The statements, opinions and data contained in all publications are solely those of the individual author(s) and contributor(s) and not of MDPI and/or the editor(s). MDPI and/or the editor(s) disclaim responsibility for any injury to people or property resulting from any ideas, methods, instructions or products referred to in the content. |
© 2024 by the authors. Licensee MDPI, Basel, Switzerland. This article is an open access article distributed under the terms and conditions of the Creative Commons Attribution (CC BY) license (http://creativecommons.org/licenses/by/4.0/).
Copyright: This open access article is published under a Creative Commons CC BY 4.0 license, which permit the free download, distribution, and reuse, provided that the author and preprint are cited in any reuse.


