
Submitted:
07 March 2024
Posted:
08 March 2024
You are already at the latest version
Abstract
The article proposes a mathematical model for creating playlists based on the emotional utility of the consumer, aiming to maintain high user interest in music streaming platforms (Lugos Abarca, 2024). The proposed method follows these steps: first, it calculates the MEEPE of Songs on the digital platform; subsequently, it quantitatively defines the Consumer's MEEPI before exposure to music; then, it operates the MEEPE of the Songs with the consumer's initial MEEPI using the known resolution process (Lugos Abarca, 2023); finally, it employs an emotional utility function to determine possible levels of emotional satisfaction and establish the playback order. This results in the creation of an efficient theoretical model. It is recommended to expand the computational study of the model in future research by using a broader set of songs and considering various initial MEEPI of the consumer. The article's originality lies in its ability to predict, quantitatively and theoretically, the level of satisfaction a music consumer could experience when listening to a playlist.
Keywords:
Single Equation Model
; Decision Theory
; Microeconomics
; Utility Function
; Neuroeconomics
1. Introduction
Musical playlists, by definition, are compilations of songs organized in a specific sequence, created with the purpose of offering a satisfying experience for the consumer using various parameters such as genres, artists, and moods. They represent a powerful tool for customization, recommendation, and promotion of musical products, allowing users to discover new music and enjoy their favorite songs according to their individual preferences (Aguiar & Waldfogel, 2018).
The importance of musical playlists lies in several aspects. Firstly, they are an effective way to maintain user interest within digital platforms (Hagen, 2015). Additionally, musical playlists serve as a valuable data source for digital platforms and the music industry, providing detailed information on user listening preferences and habits (Bonnin & Jannach, 2014; Liang & Willemsen, 2019). This, in turn, informs marketing strategies, business decision-making, and future music product creation (Maasø & Hagen, 2020; Li, Song, Duan & Wang, 2022; Kamehkhosh, Bonnin & Jannach, 2020; Prey, Esteve Del Valle & Zwerwer, 2022).
Given the premise of the importance of playlists in the music industry and the growing research interest in generating playlists to meet the preferences of music consumers (Bonnin & Jannach, 2014; Choi, Khlif & Epure, 2020; De Mooij & Verhaegh, 1997; Hagen, 2015; Kamehkhosh, Jannach & Bonnin, 2018; Pichl, Zangerle & Specht, 2016; Sanchez, 2018), we seek to contribute to this area with a mathematical model for playlist creation based on consumer emotional utility (Lugos Abarca, 2024). Specifically, the model determines the playback order of songs, progressively increasing emotional utility.
While there are models and algorithms in academic research that recommend and generate playlists based on the emotions of music consumers (Amini, Willemsen & Graus, 2019; Ee, 2022; Eriksson & Johansson, 2017; Siles, Segura-Castillo, Sancho & Solís-Quesada, 2019; Subramaniam et al., 2018; Svensson, 2023; van der Zande, 2018), the original and innovative attribute of this model is its ability to quantitatively determine the potential level of emotional utility that the consumer would experience when listening to the playlist in its entirety.
Thus, this article is relevant due to the need for quantitative methods for creating playlists based on consumer emotional satisfaction. These methods can be effectively applied in contexts such as music therapy, an area of research constantly seeking relevant approaches (Bautch, 2021; Filipcic, 2021; Garrido, 2019; Keerthana et al., 2022; Mélo, 2020). The importance lies in the practical utility of such methods, which can provide an objective framework for selecting and organizing music based on individuals' emotional needs. The cited studies reinforce this need and point to the growing attention this topic receives in contemporary research. This article contributes to the literature by highlighting the relevance and potential of quantitative methods in playlist creation, especially in therapeutic applications where music plays a fundamental role in emotional and mental well-being.
Another reason why the proposed model here is relevant is its direct applicability in the music industry, as mentioned earlier. Improving song selection to maintain consumer engagement in digital platforms can increase profits while satisfying users' musical and emotional needs. This solution presents a beneficial balance for both parties, a concept akin to a Nash equilibrium (Amster & Pinasco, 2014).
This perspective underscores the importance of the proposed model, not only as a theoretical and quantitative tool but also as a practical application with significant implications in the music industry. The ability to enhance user experience while optimizing financial benefits underscores its potential to transform business strategies in an increasingly competitive and consumer-oriented digital market, complementing other research seeking the same goal through similar or different parameters.
Therefore, the aim of this article is to design and propose a mathematical model for playlist creation based on consumer emotional utility. The objective of maintaining high user interest in music streaming platforms will serve as a reference. A brief resolution of the model will be provided to understand its process, and the results will be analyzed to evaluate their consistency with previous expectations.
This article focuses on creating a theoretical and practical framework to optimize user experience in online music environments. The application of a mathematical model provides a systematic and objective approach to selecting and organizing music, considering consumers' emotional needs. The analysis of results will contribute to validating the effectiveness and relevance of the proposed model in the context of the music industry and streaming platforms.
2. Methodology
Suppose we are responsible for a music streaming platform. Our goal is to maximize the time customers spend on the platform consuming the musical products available in our catalog. To achieve this, the strategy called "emotional recommendation" has been developed.
This strategy involves designing a playlist that generates a sufficiently high level of emotional utility to maintain the customer's interest in the platform's songs, thereby leading them to consume the musical products for as long as possible. Below are the steps of this strategy.
1st step: Calculate the EMEPU of the songs available on the digital platform.
Based on the resolution process described by Lugos Abarca (2023), the MEEPE of the songs in the digital platform's catalog is determined. To simplify the exercise, only four songs will be used as a sample.
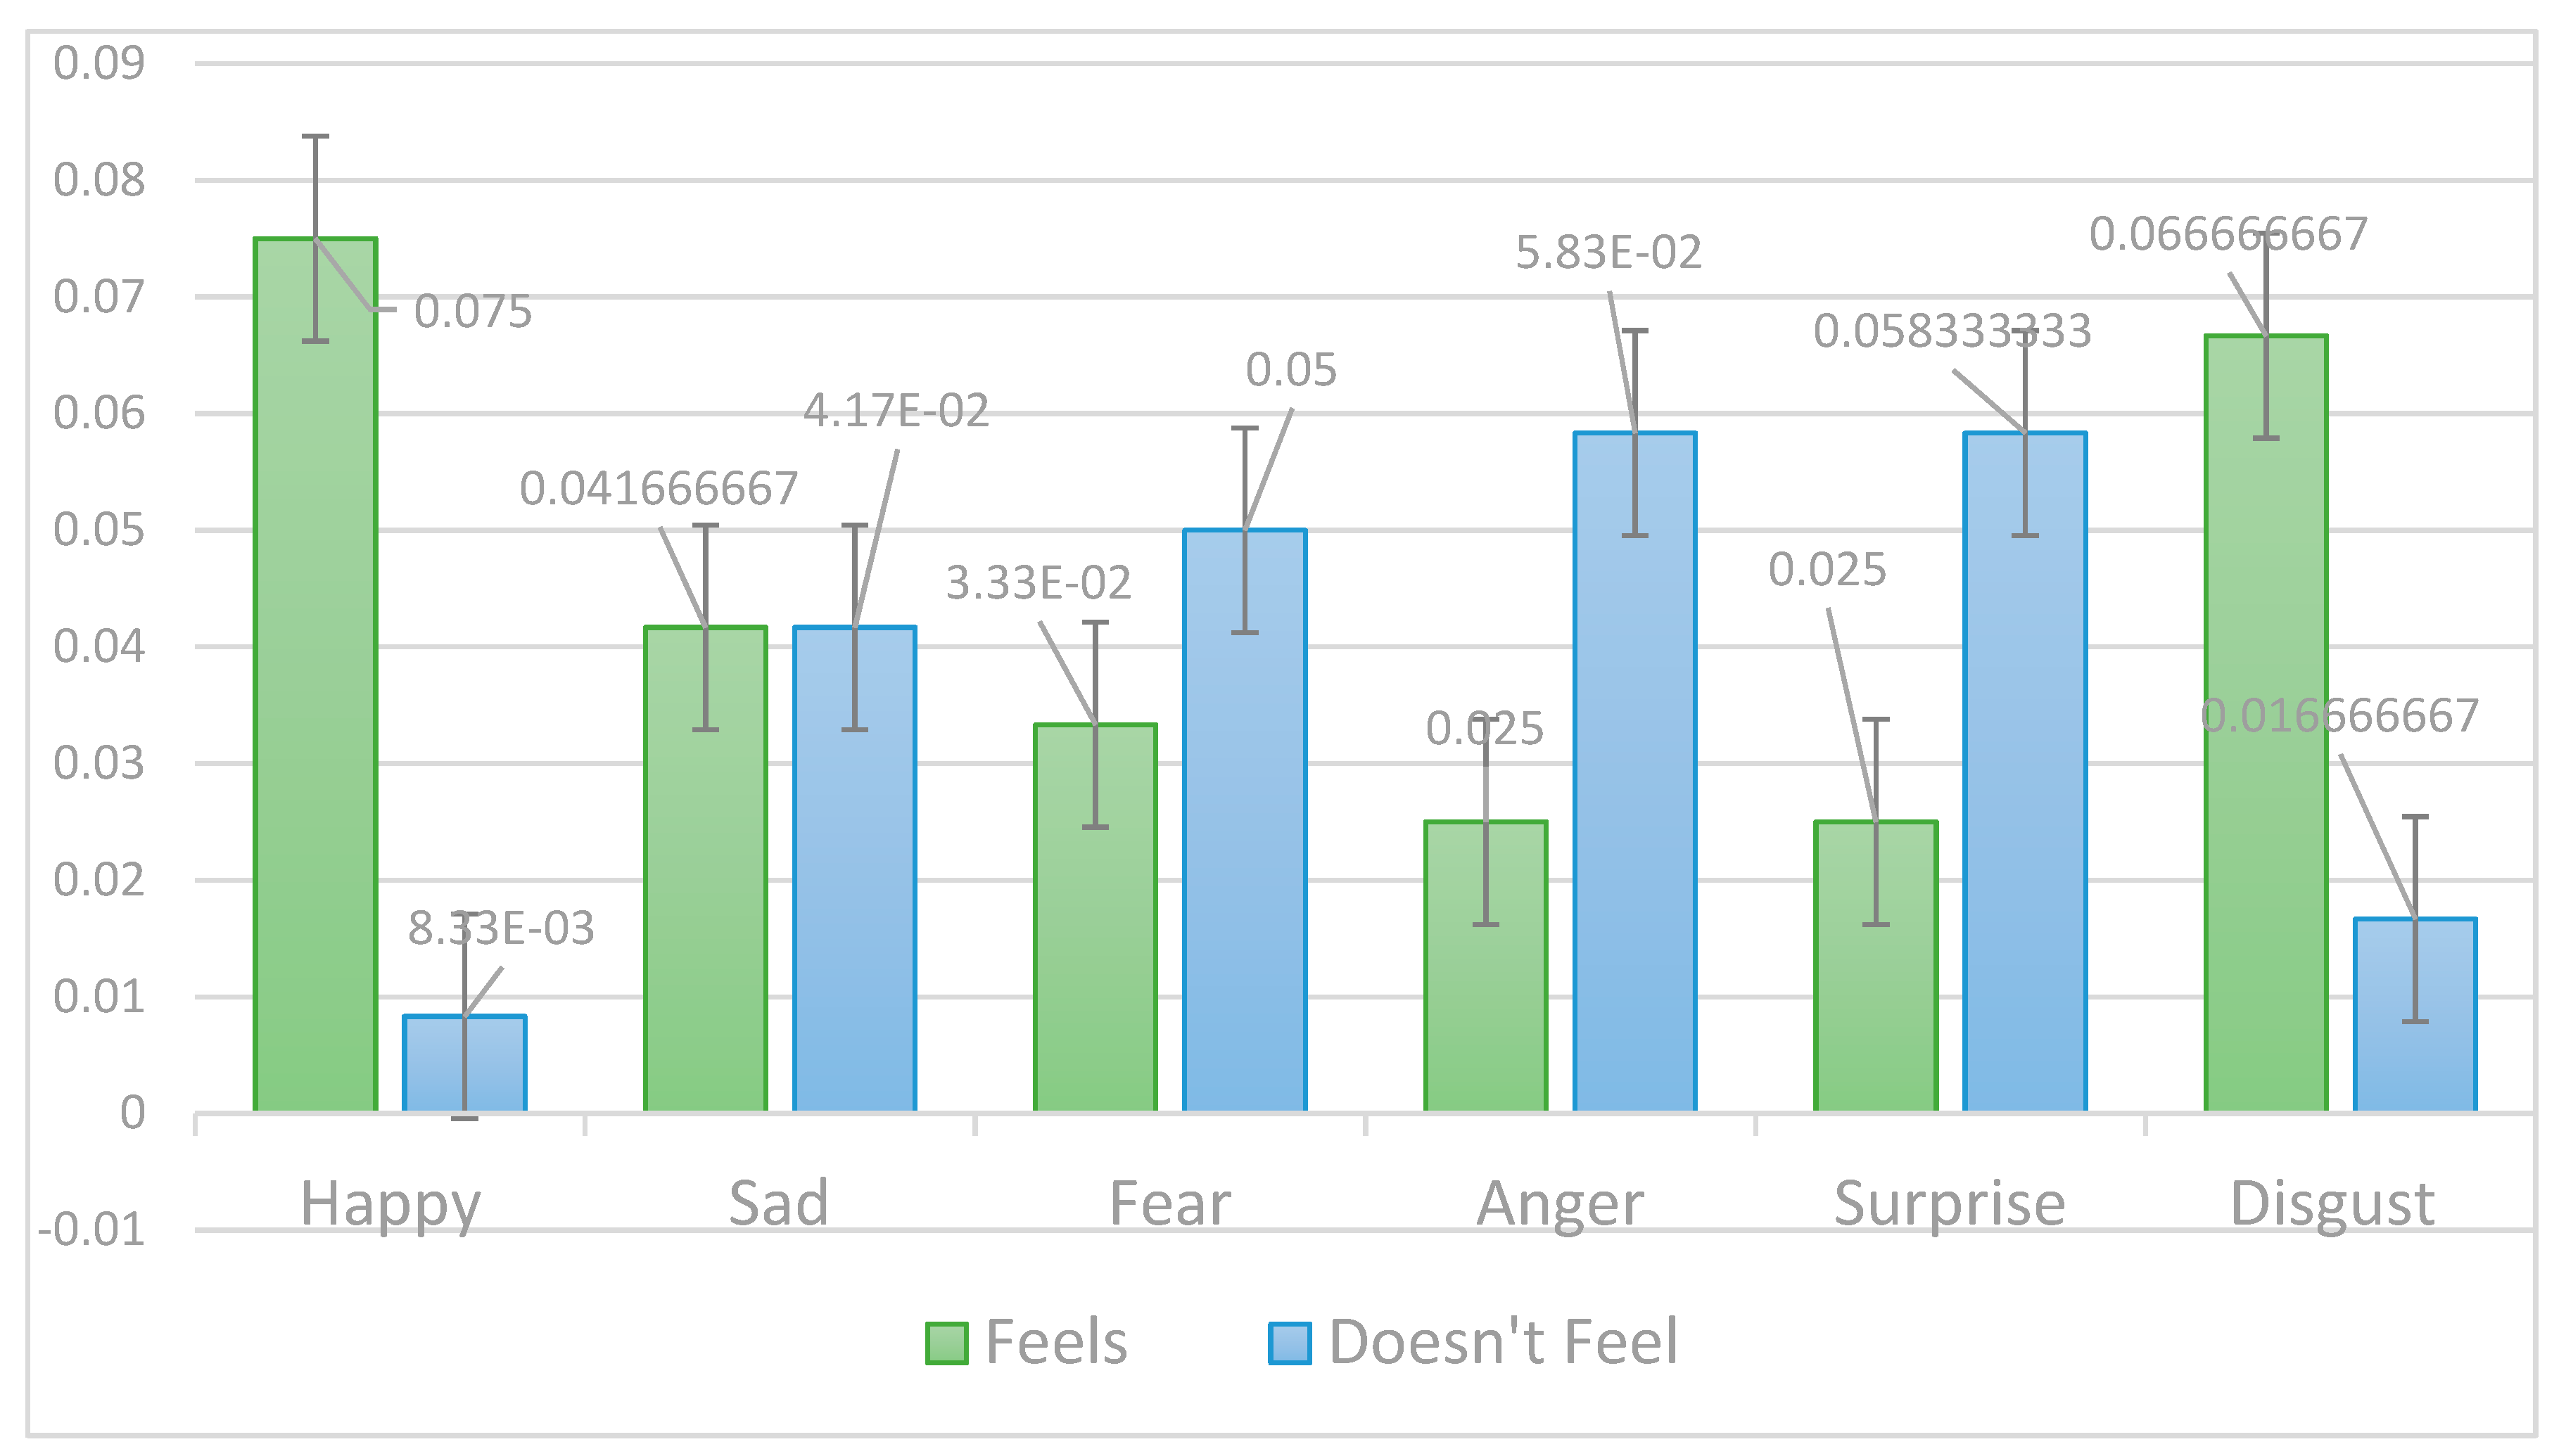
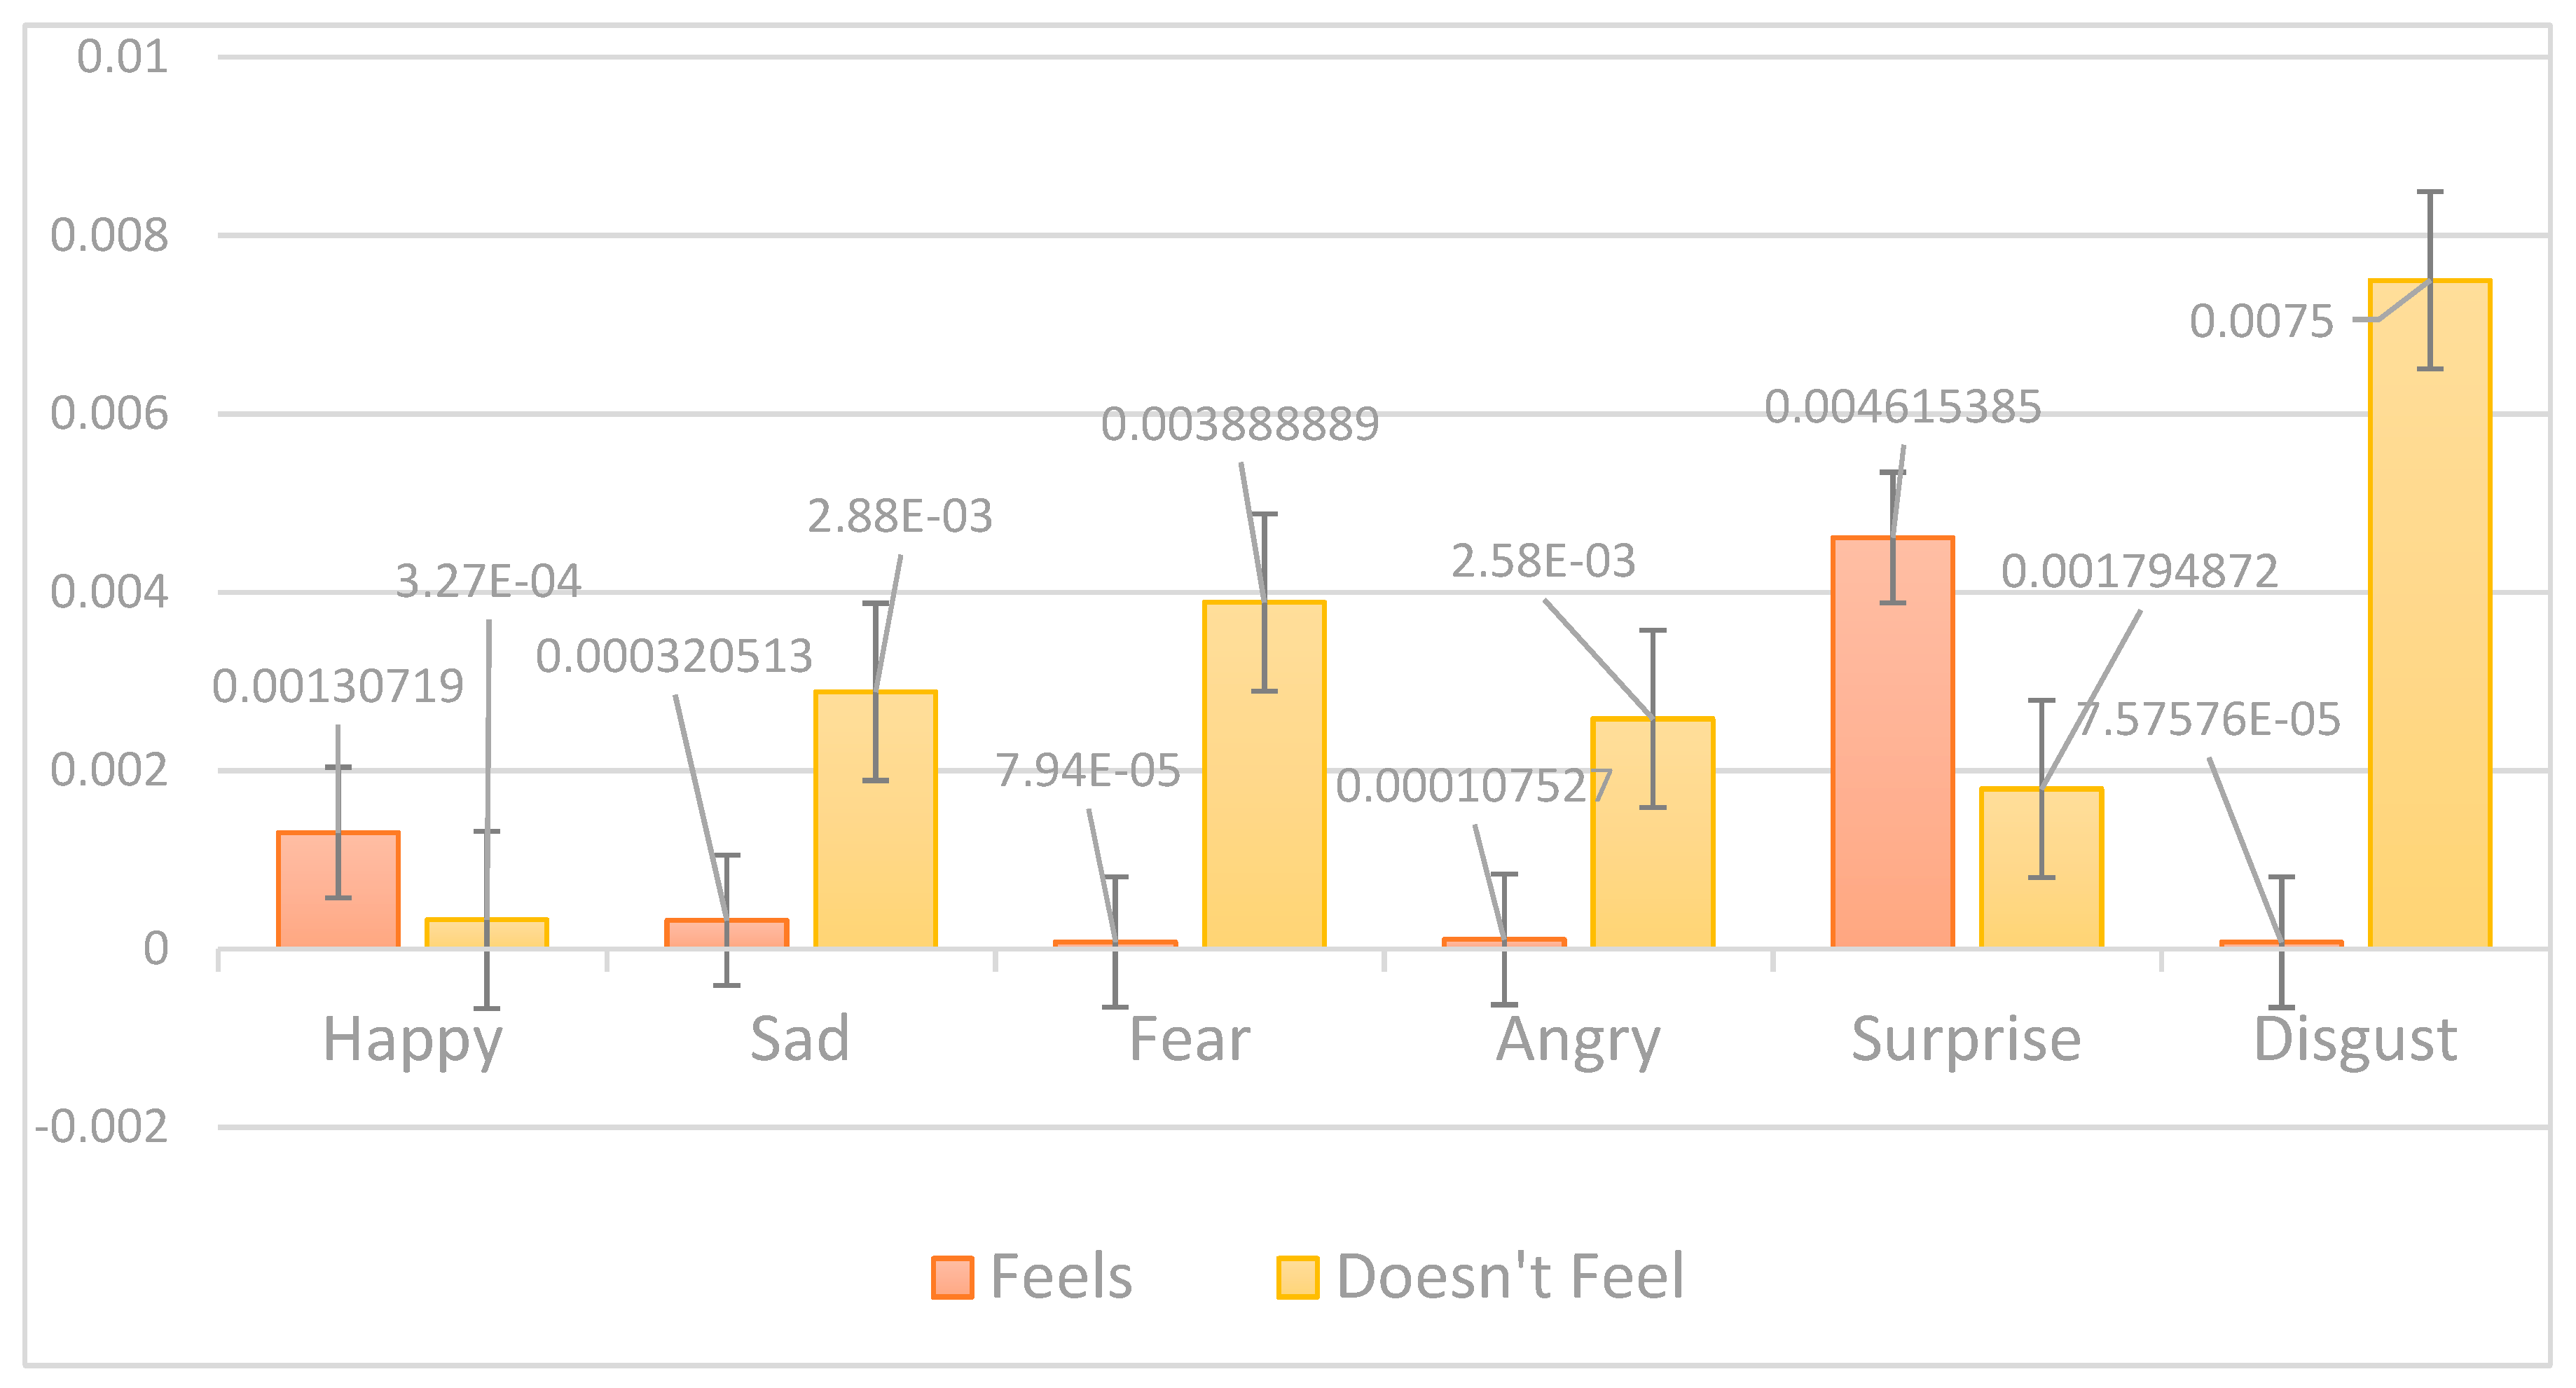
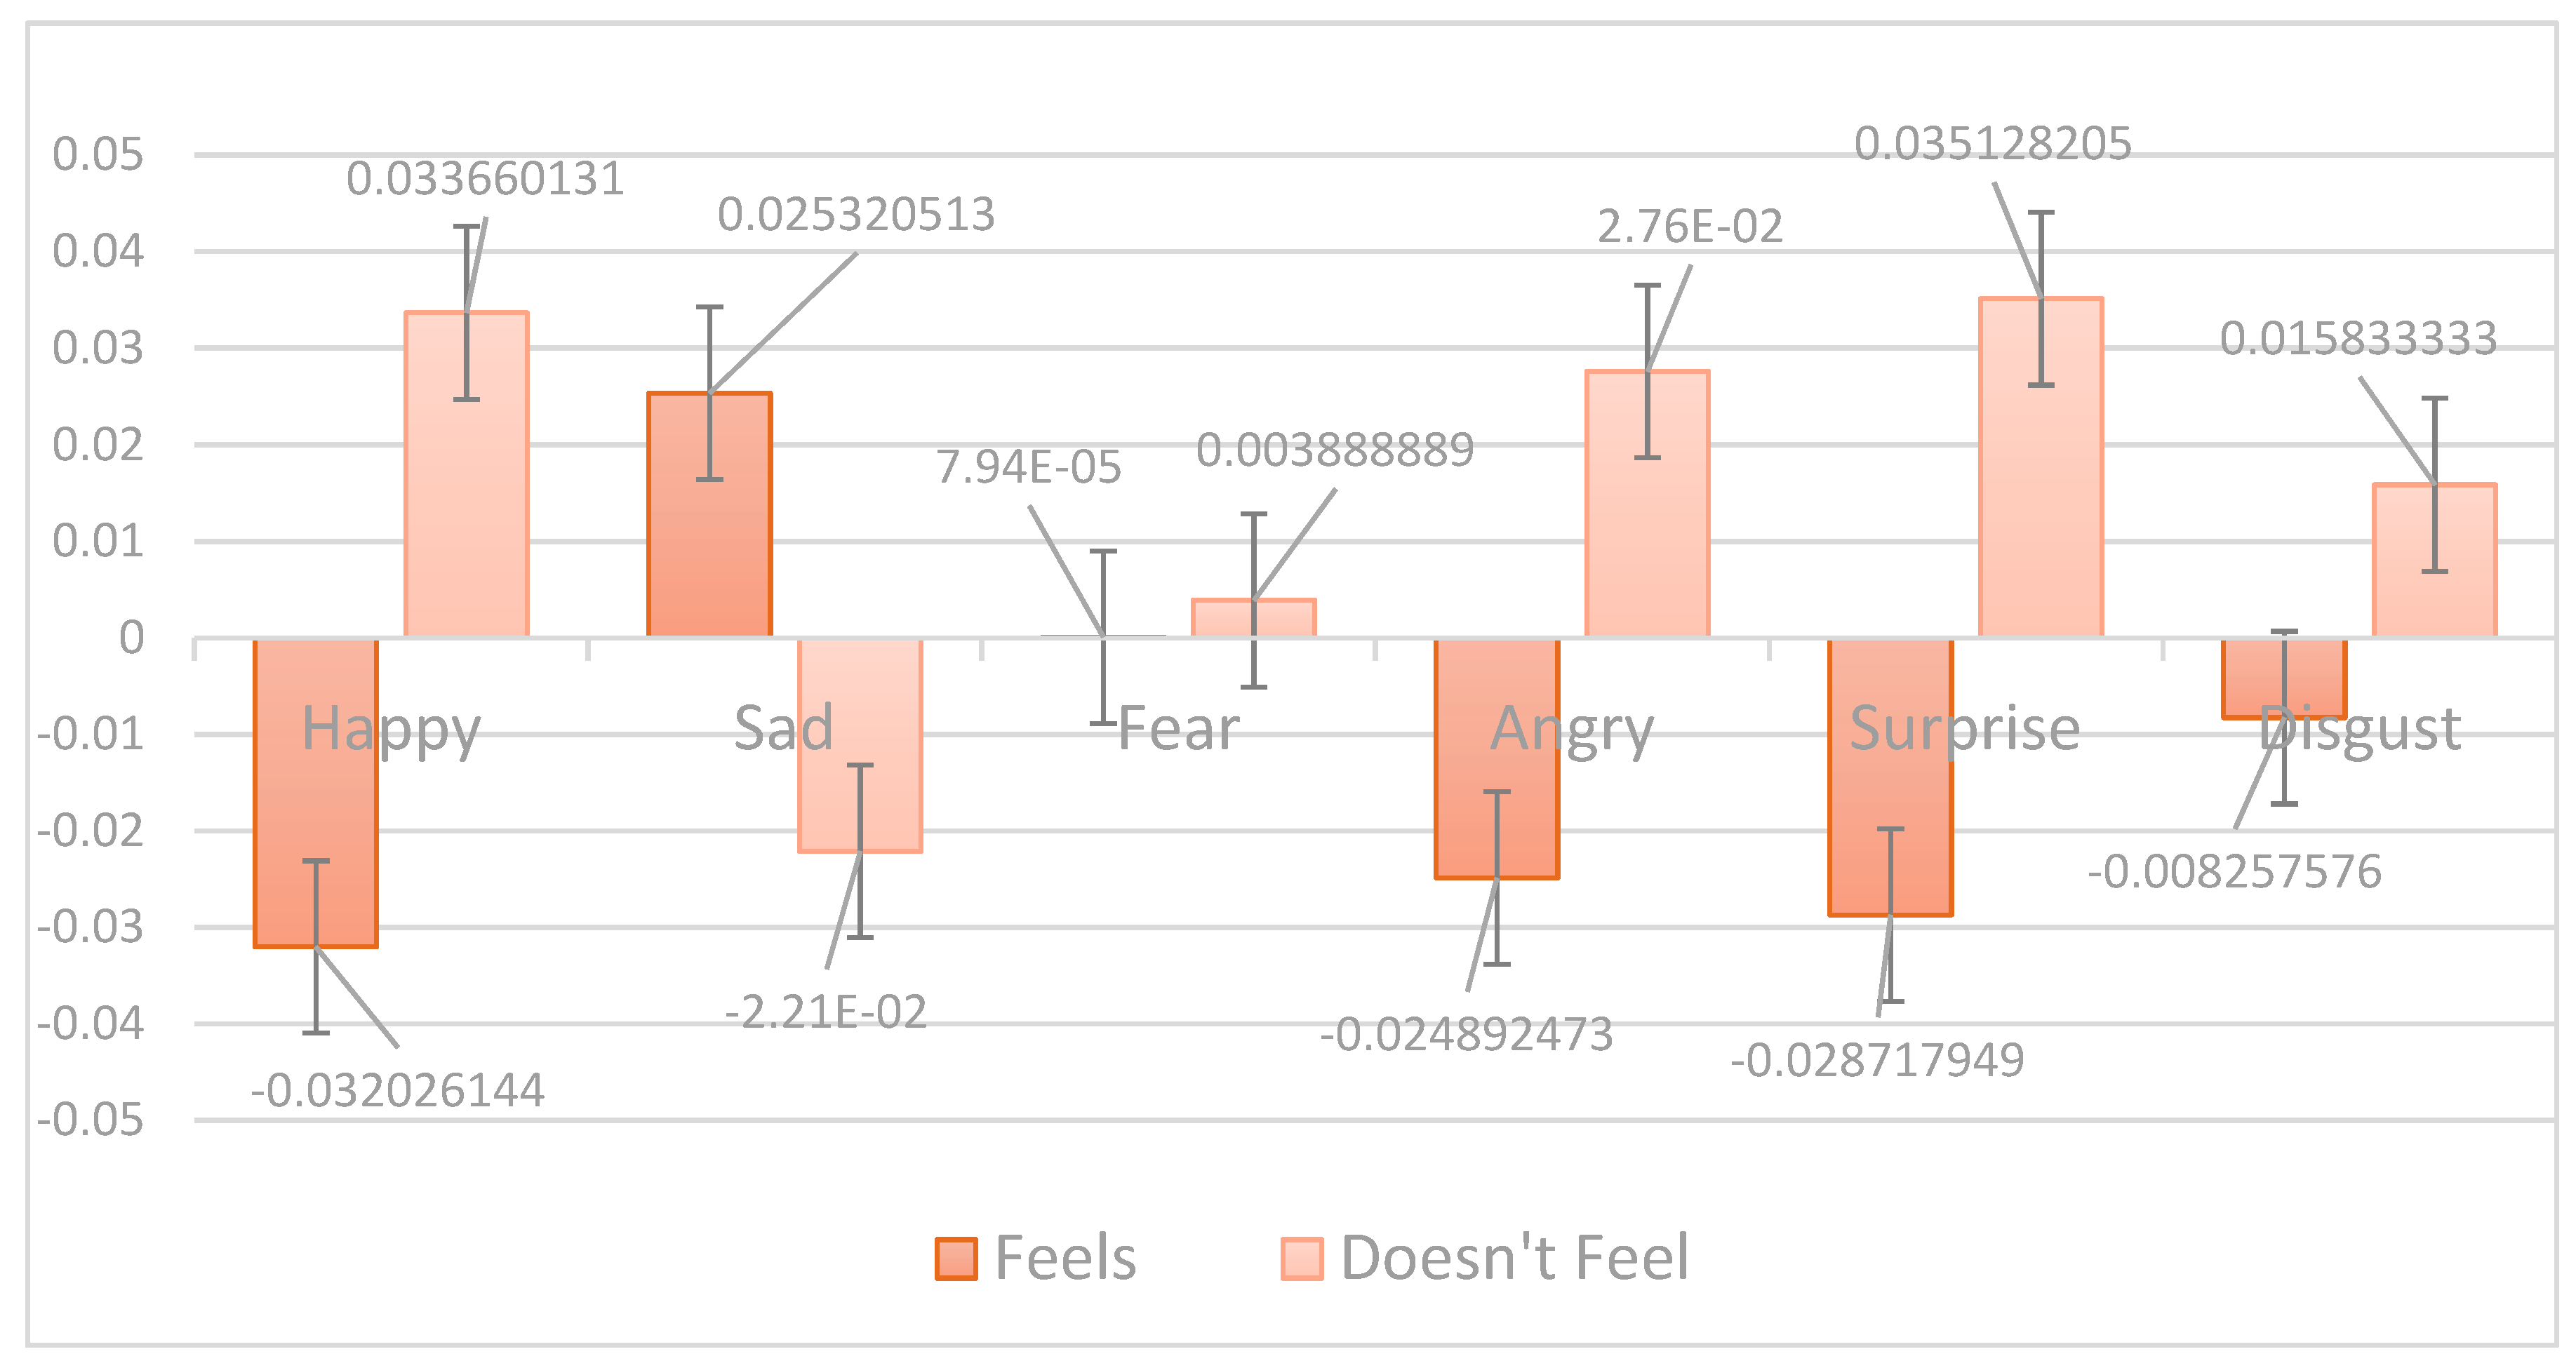
As observed in Graph 1, the predominant emotions in the "Feels" module of Song A are happiness and disgust, while the predominant emotions in the "Doesn't Feel" module are fear, anger, and surprise. On the other hand, there is a balance between both modules in the sadness module.
Graph 1.
Modules of the Probable External Emotional States of Song A.
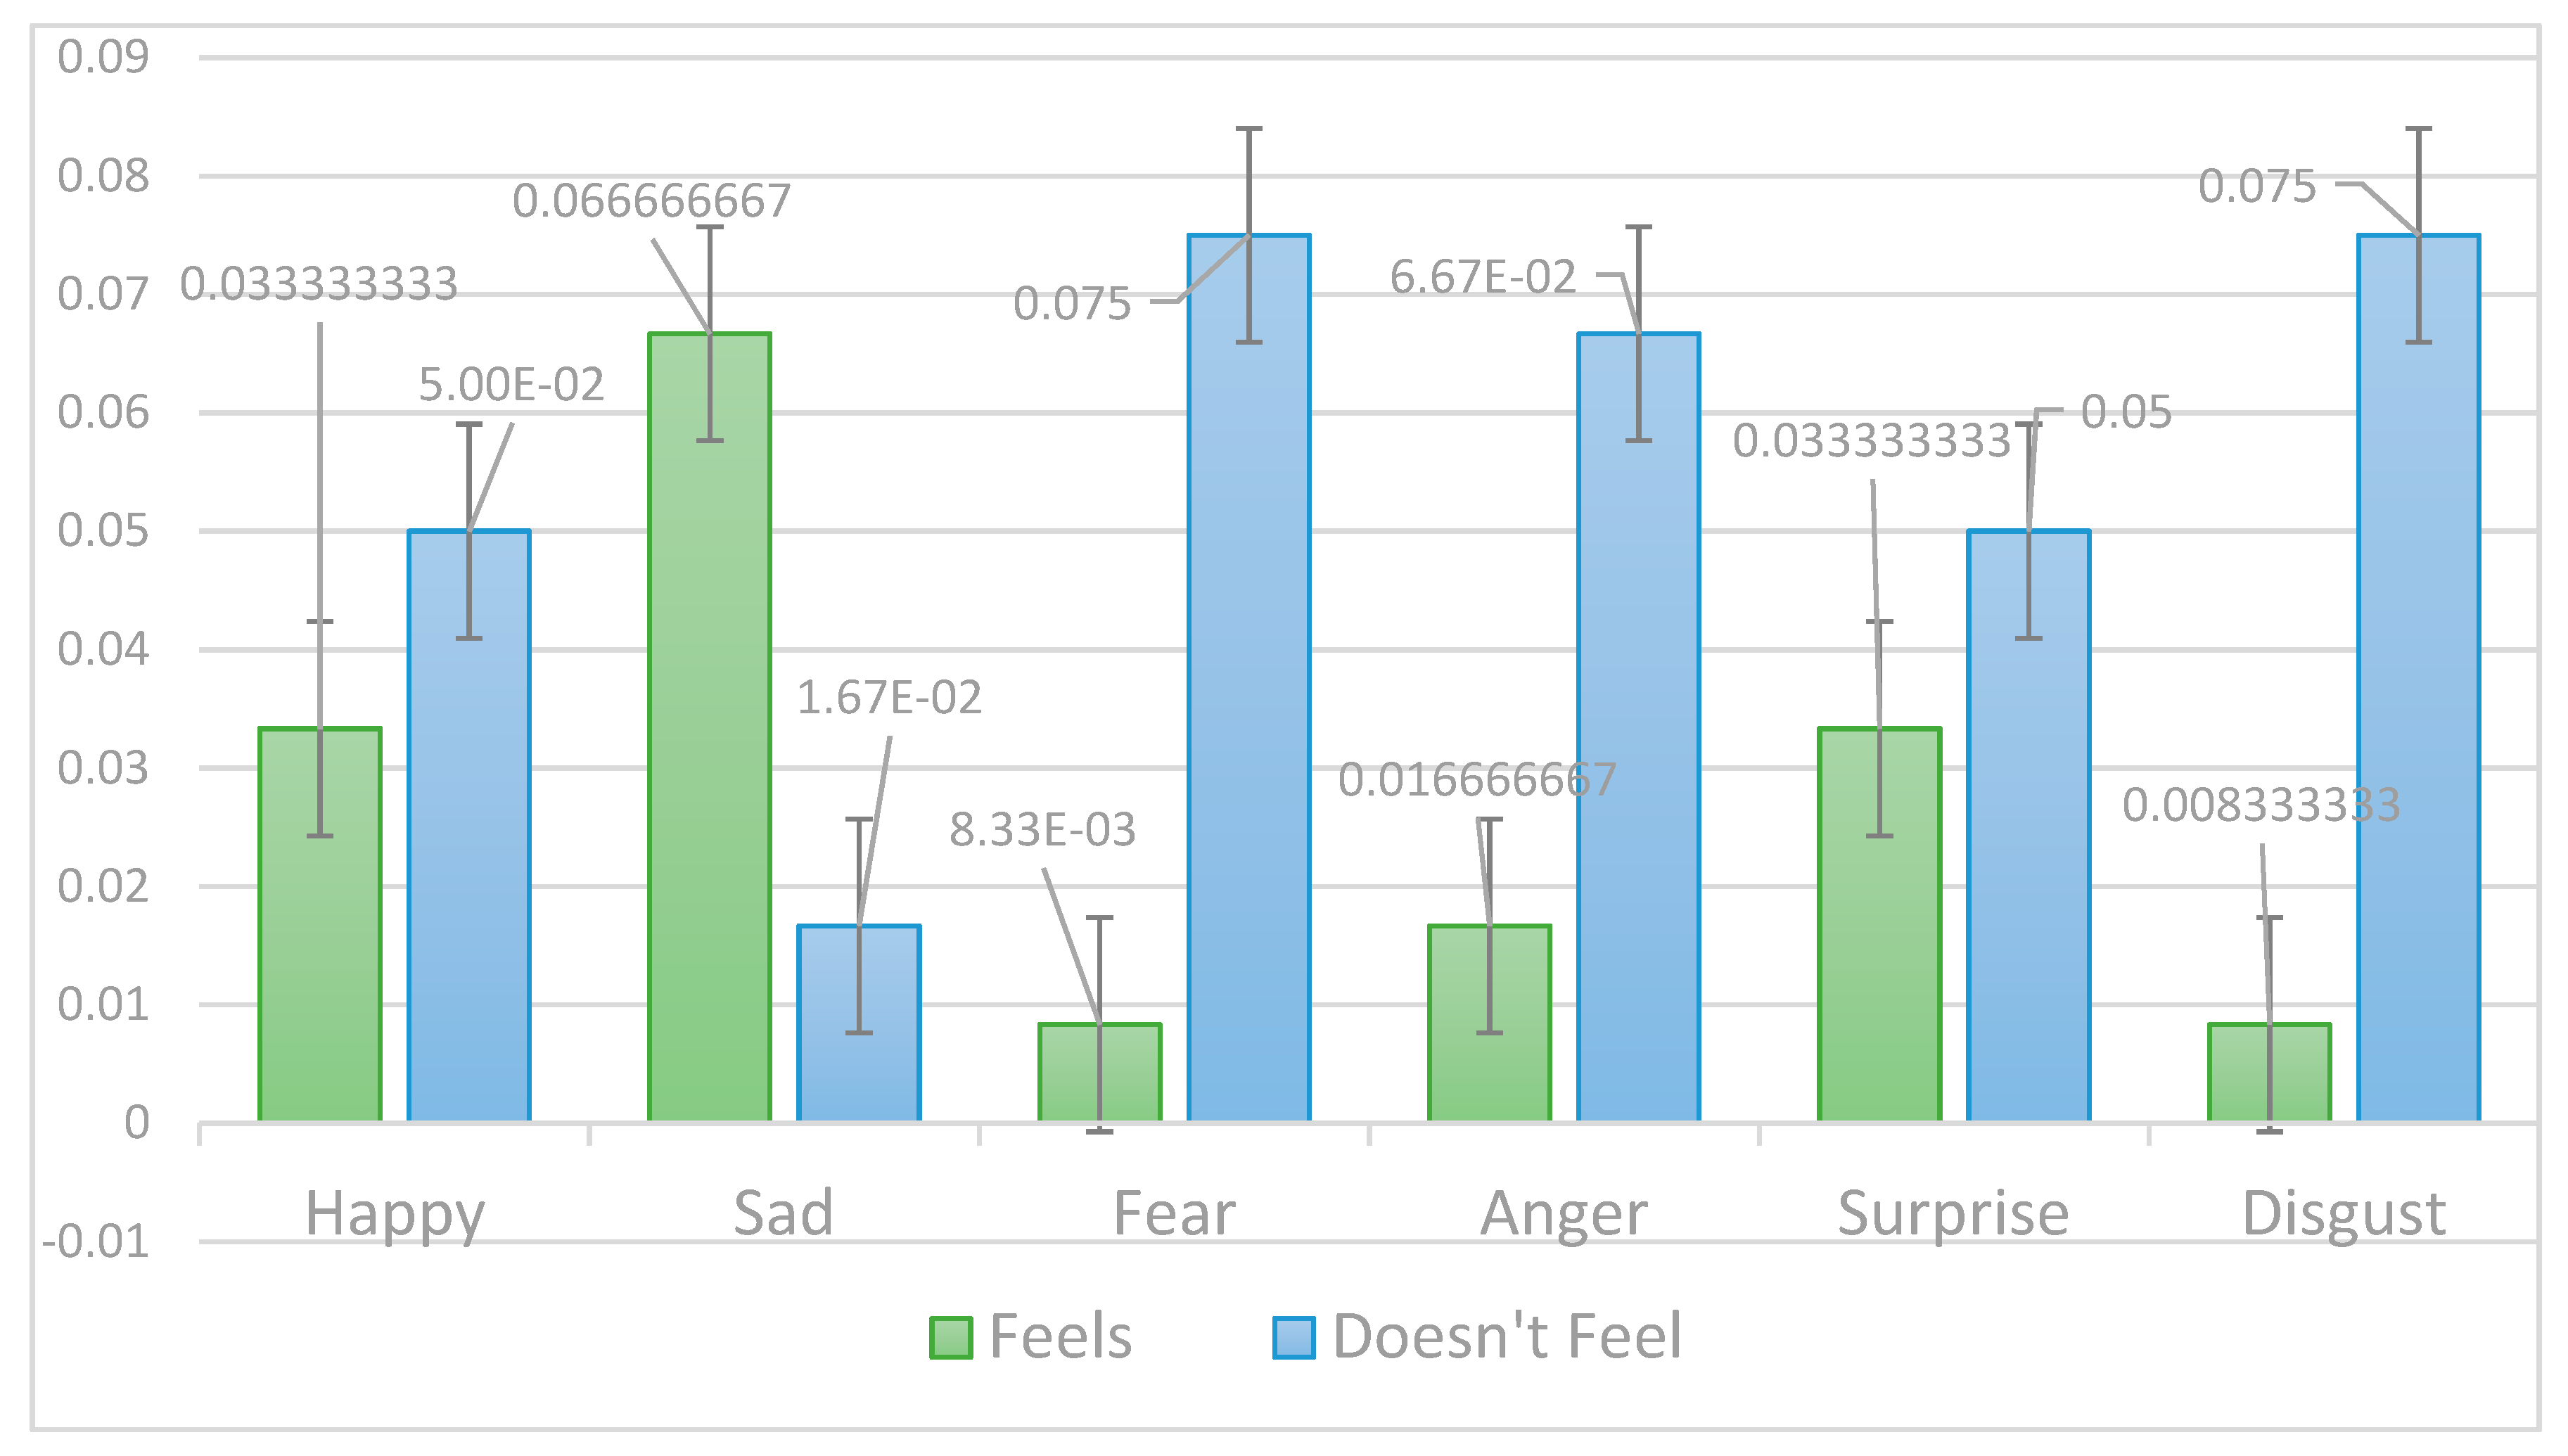
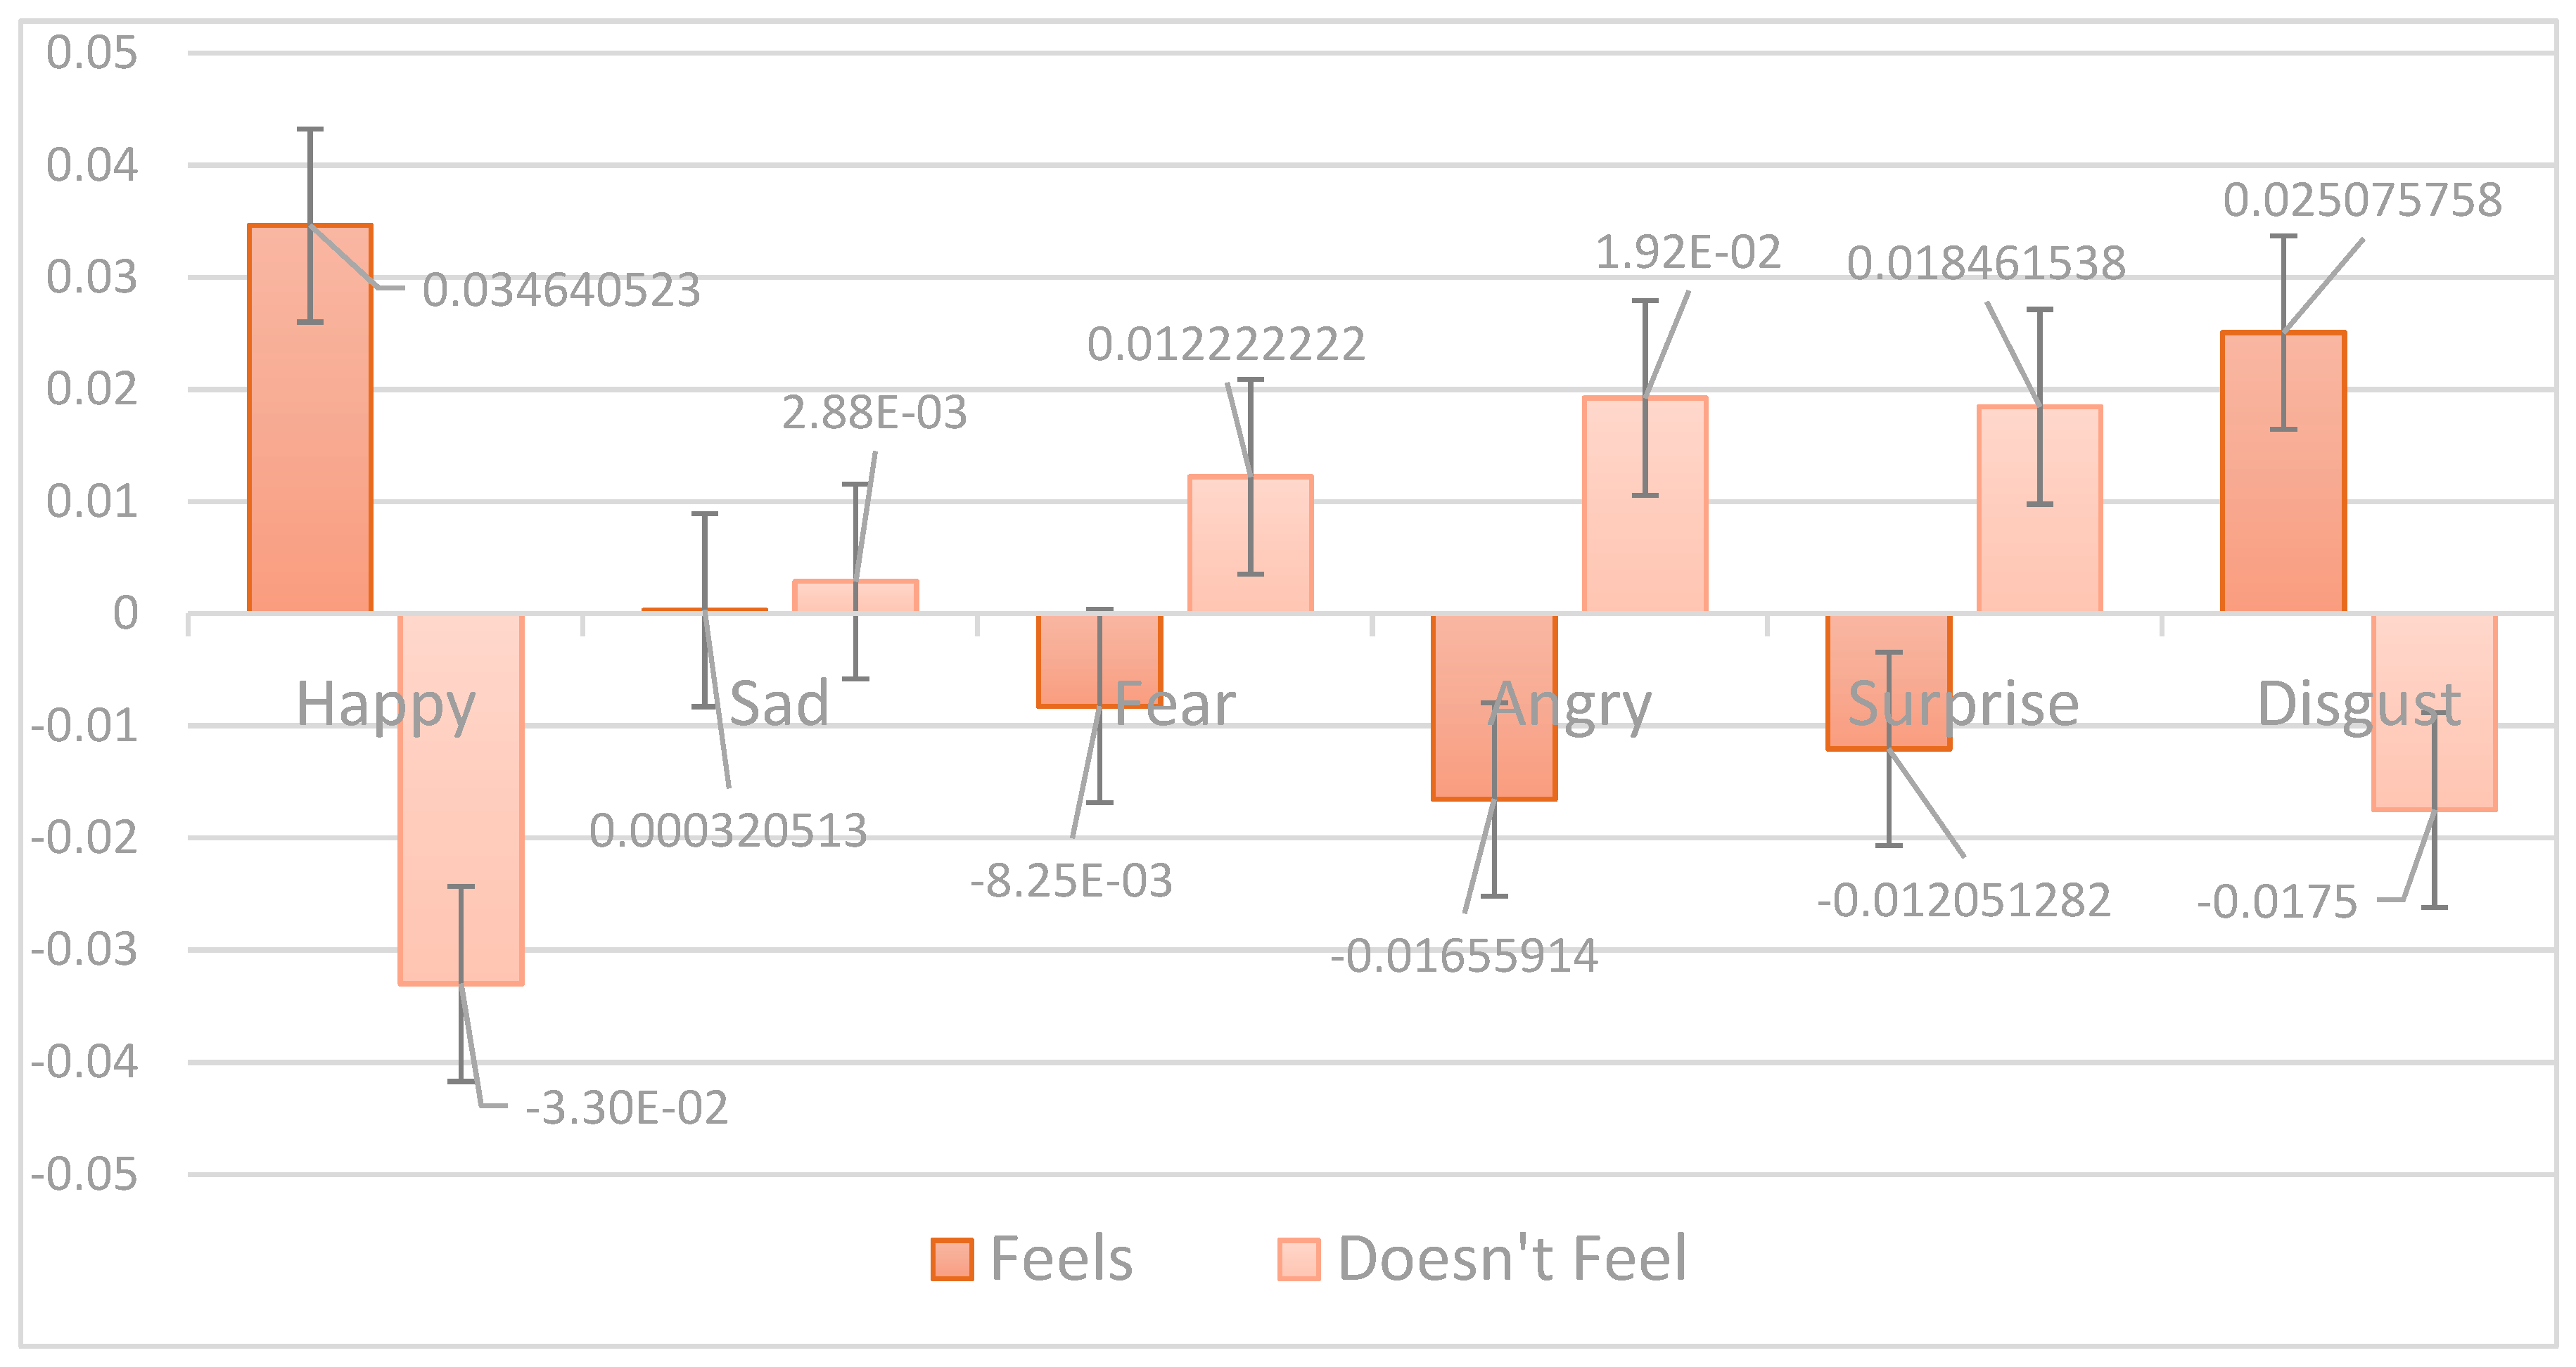
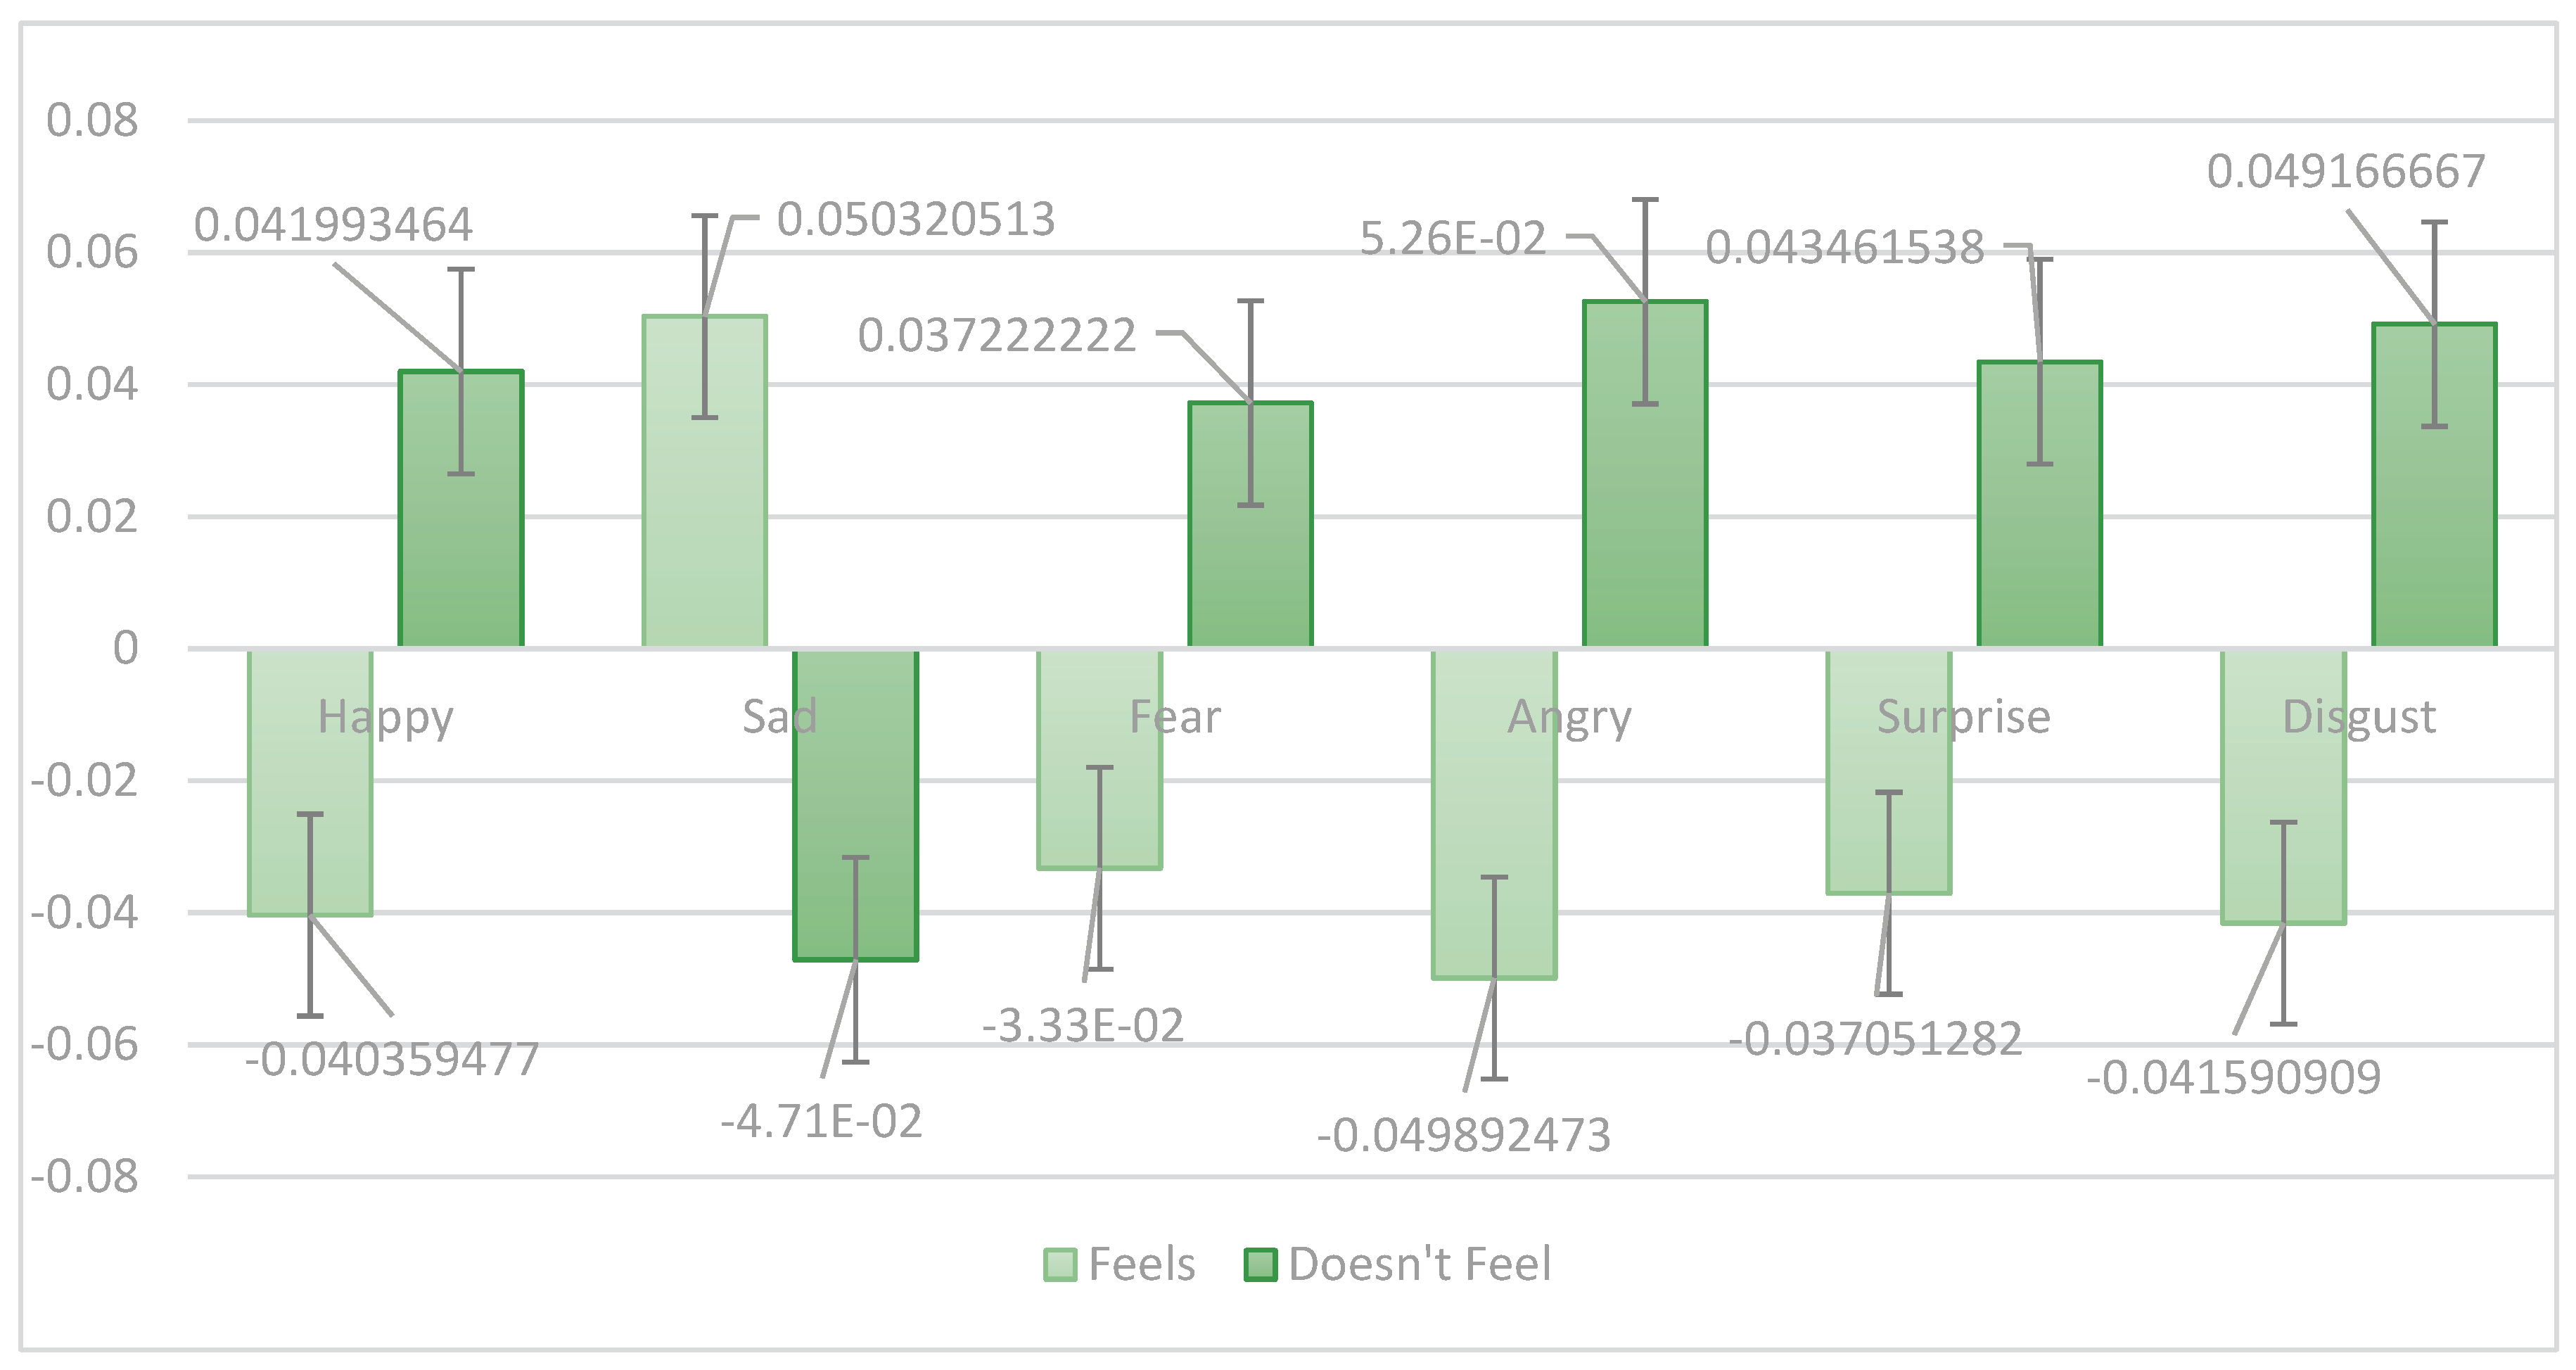
Regarding Song B (see Graph 2), the emotion of sadness predominates in the "Feels" module, while the emotions of happiness, fear, anger, surprise, and disgust predominate in the "Doesn't Feel" module.
Graph 2.
Modules of the Probable External Emotional States of Song B.
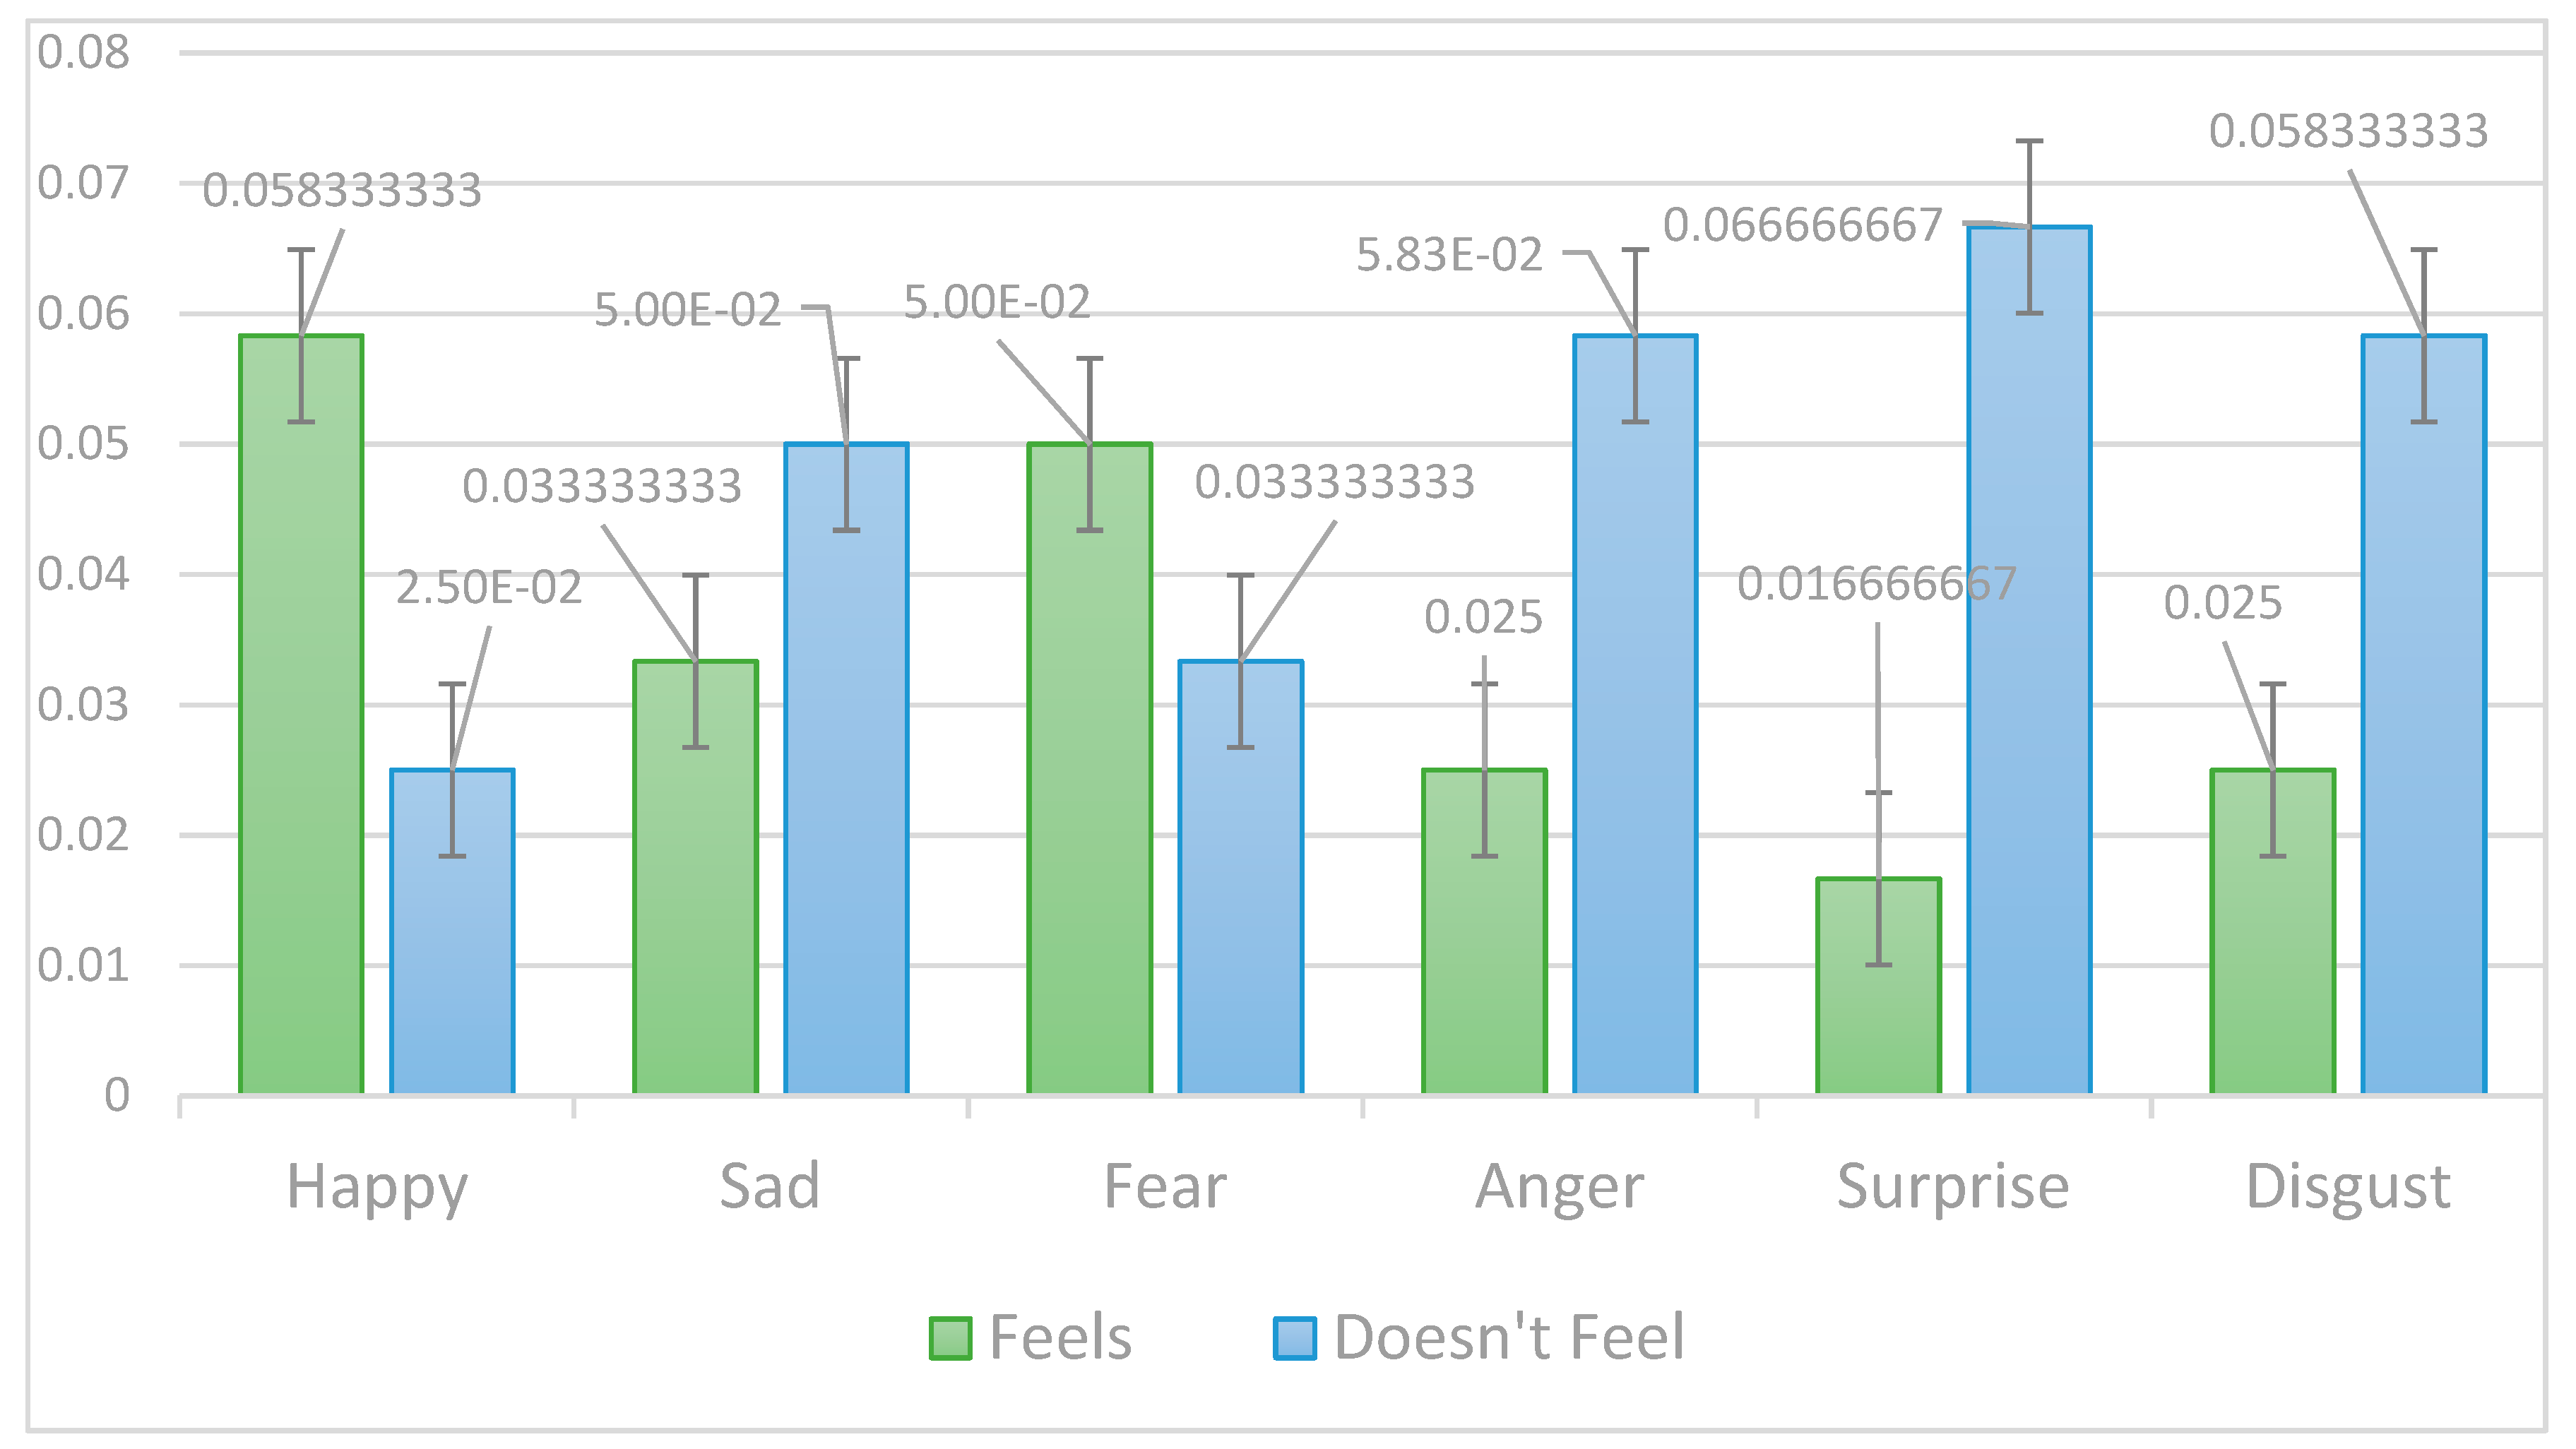
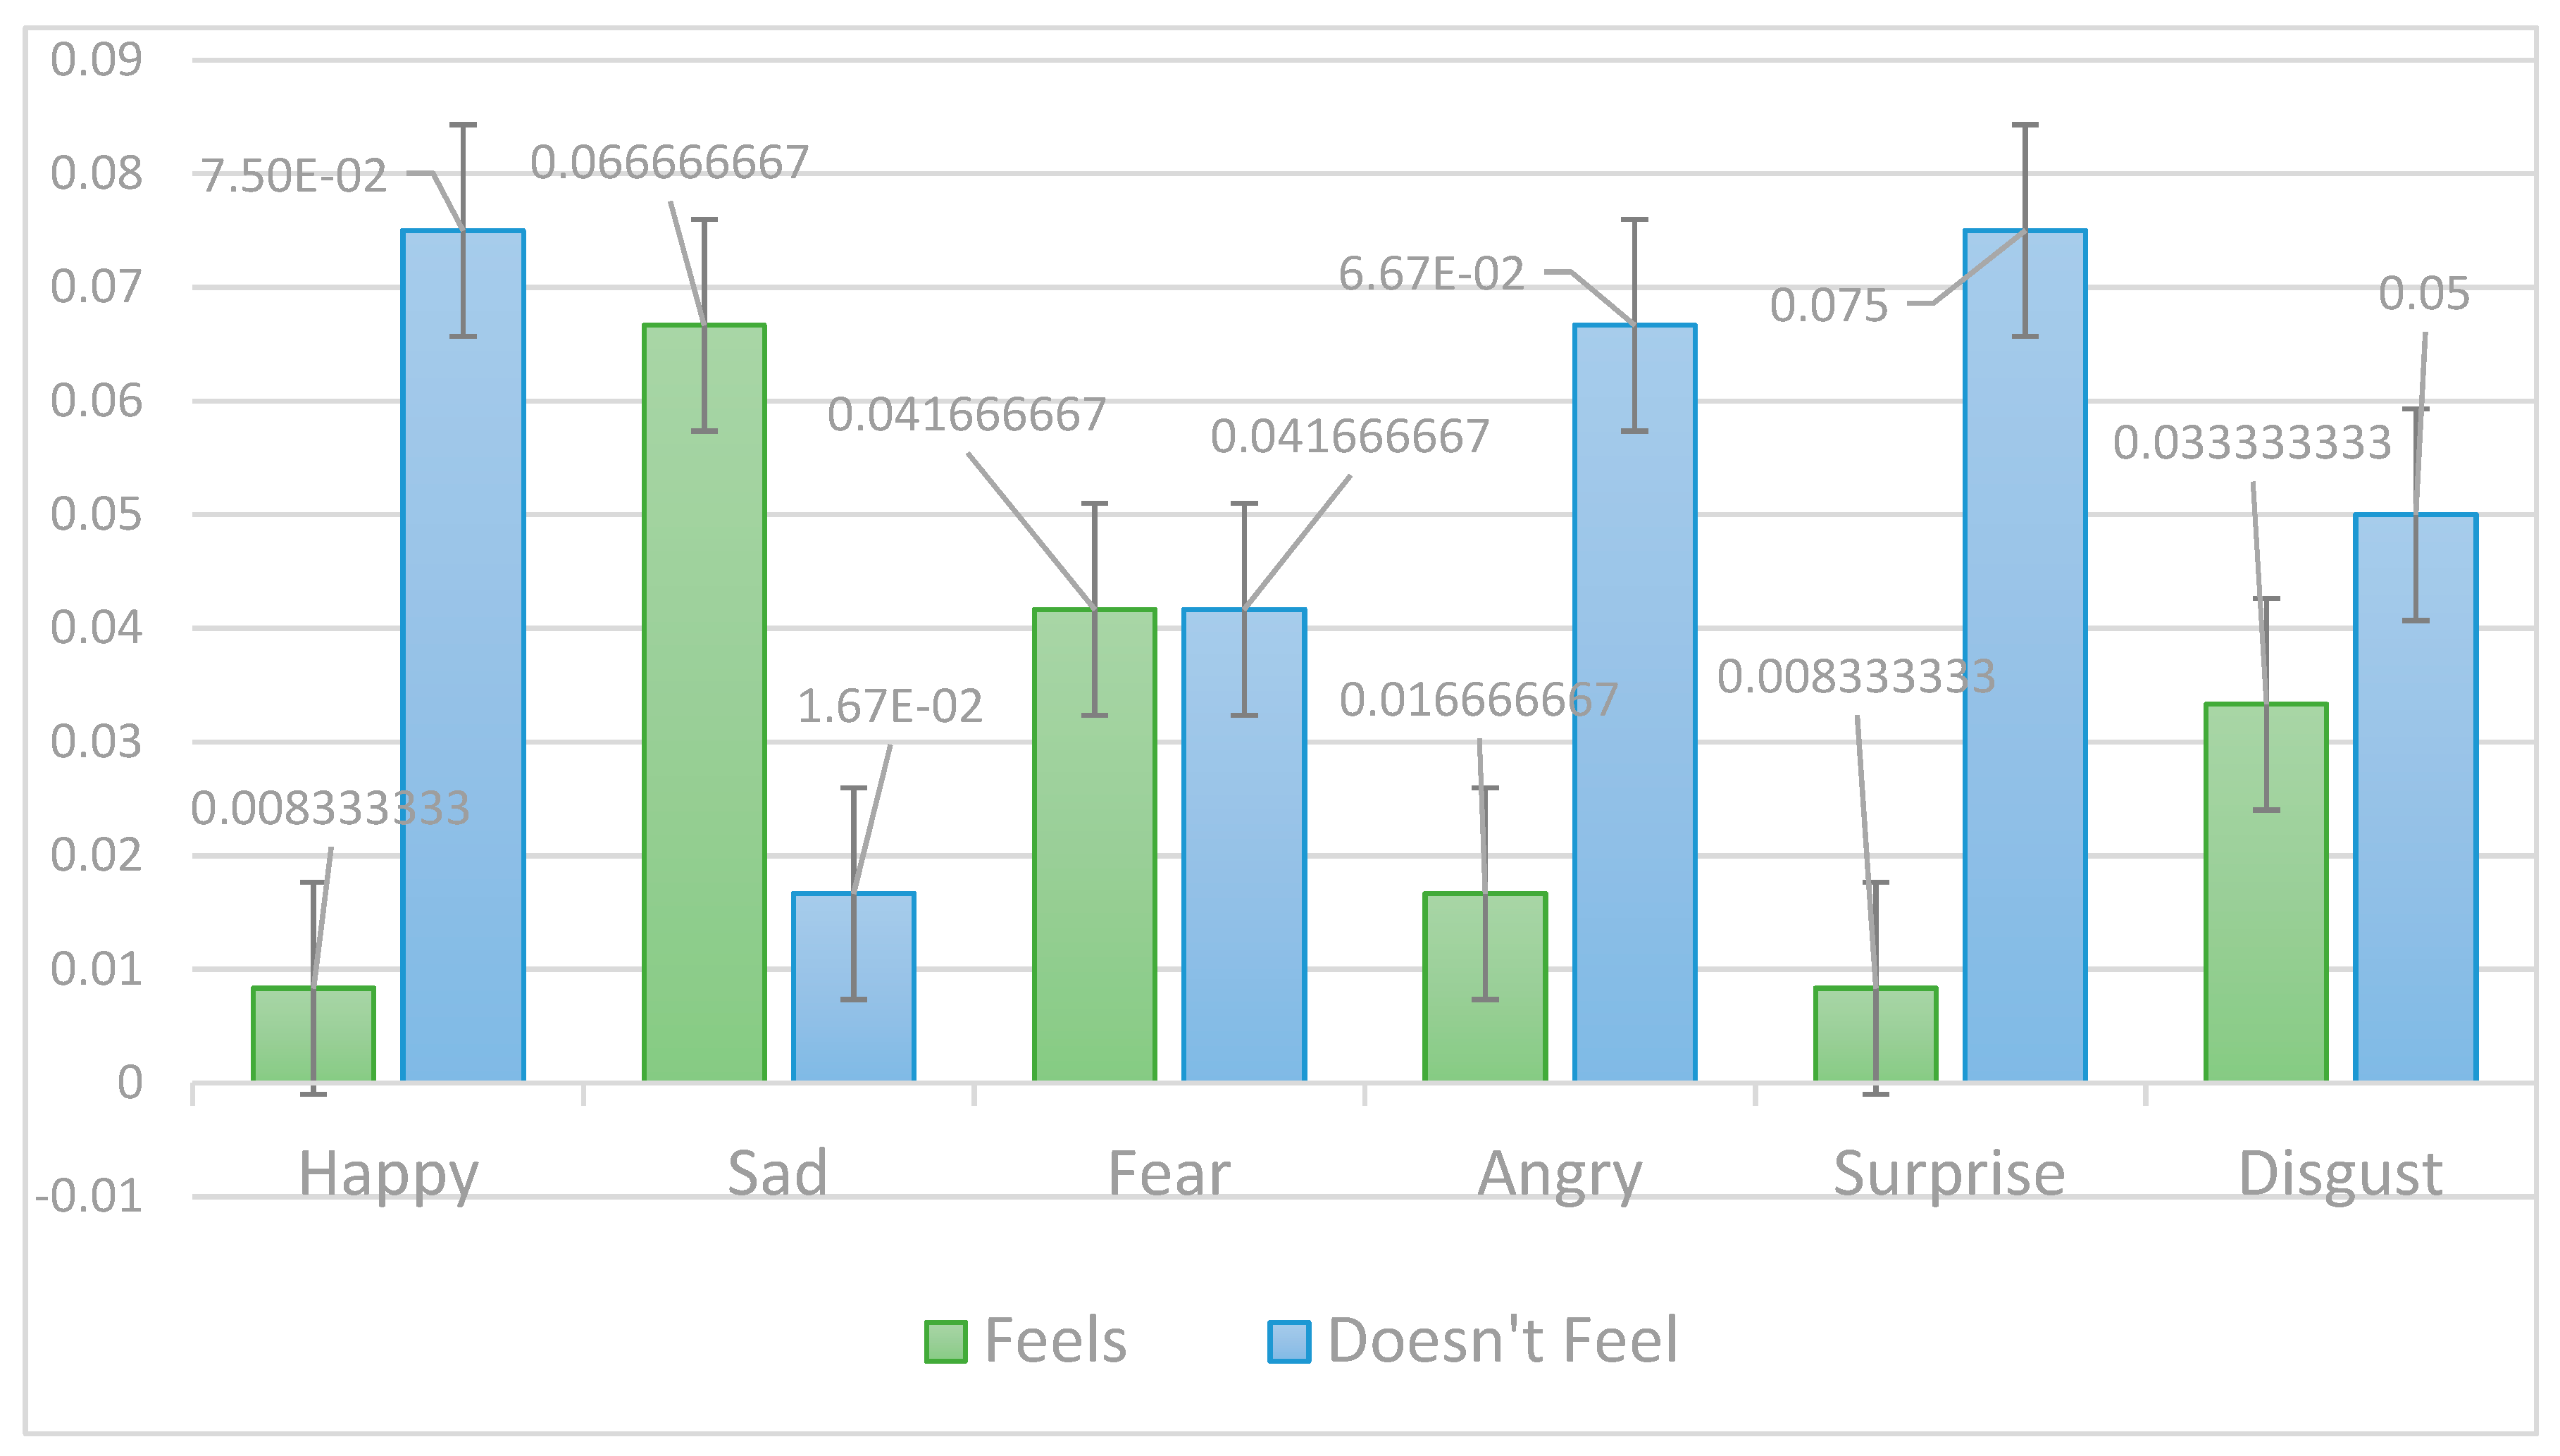
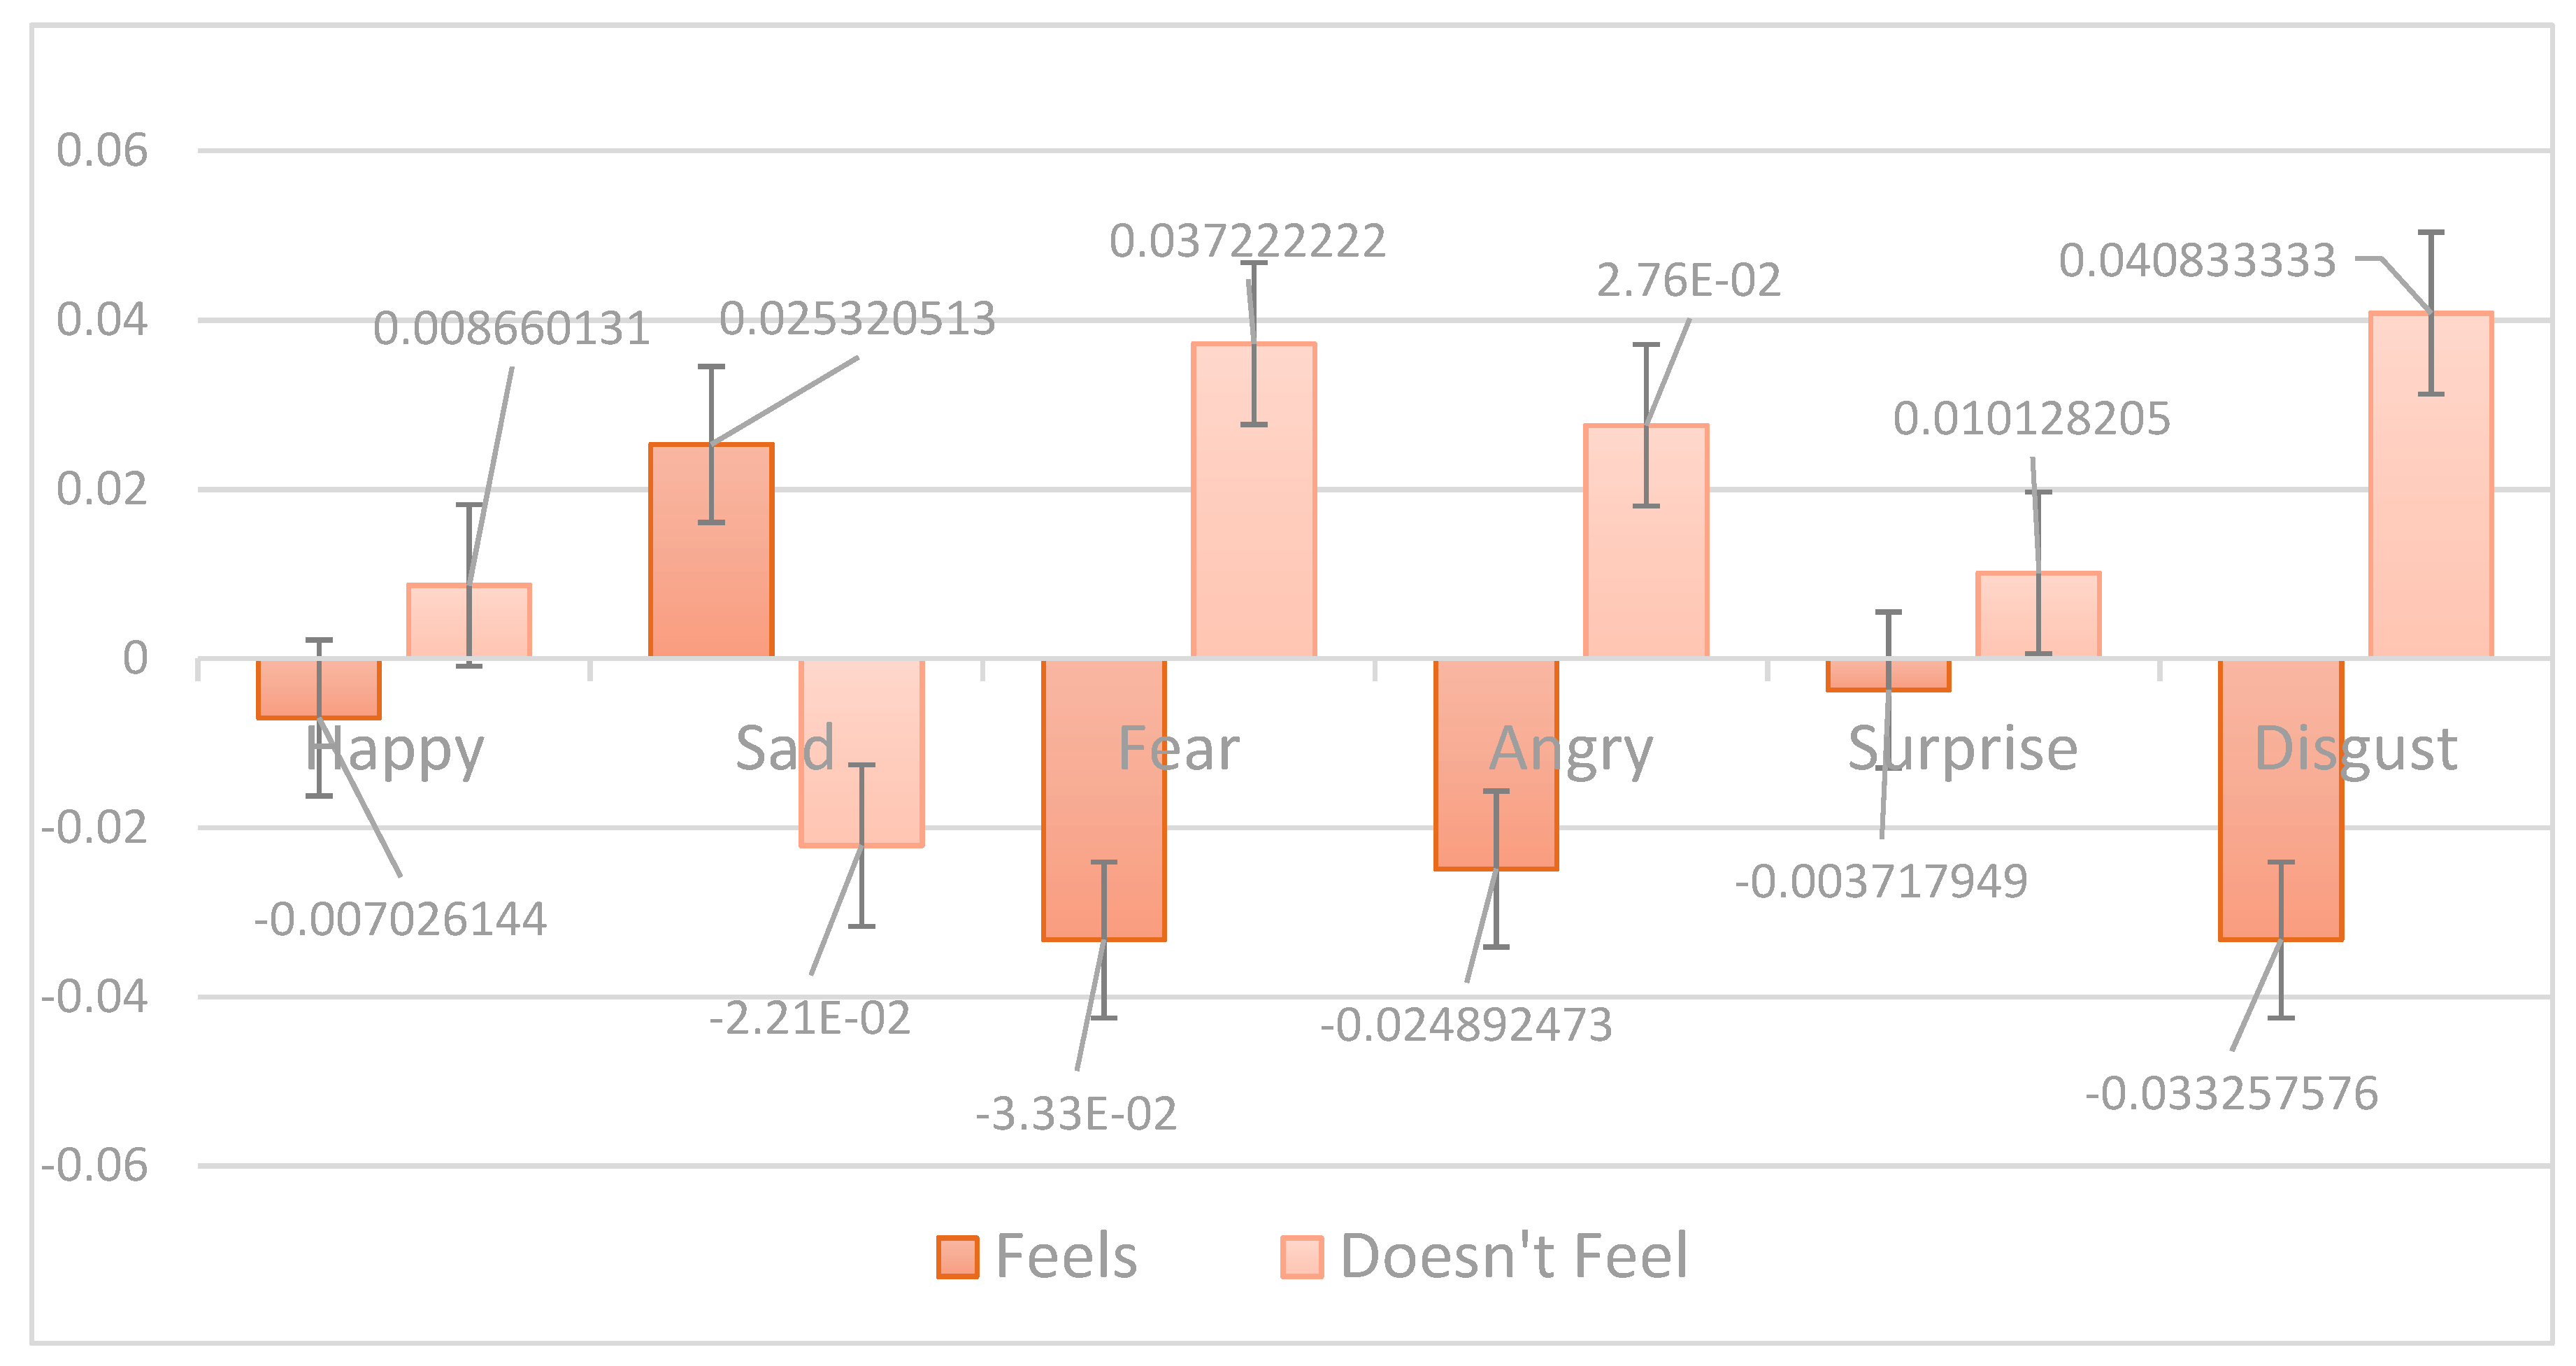
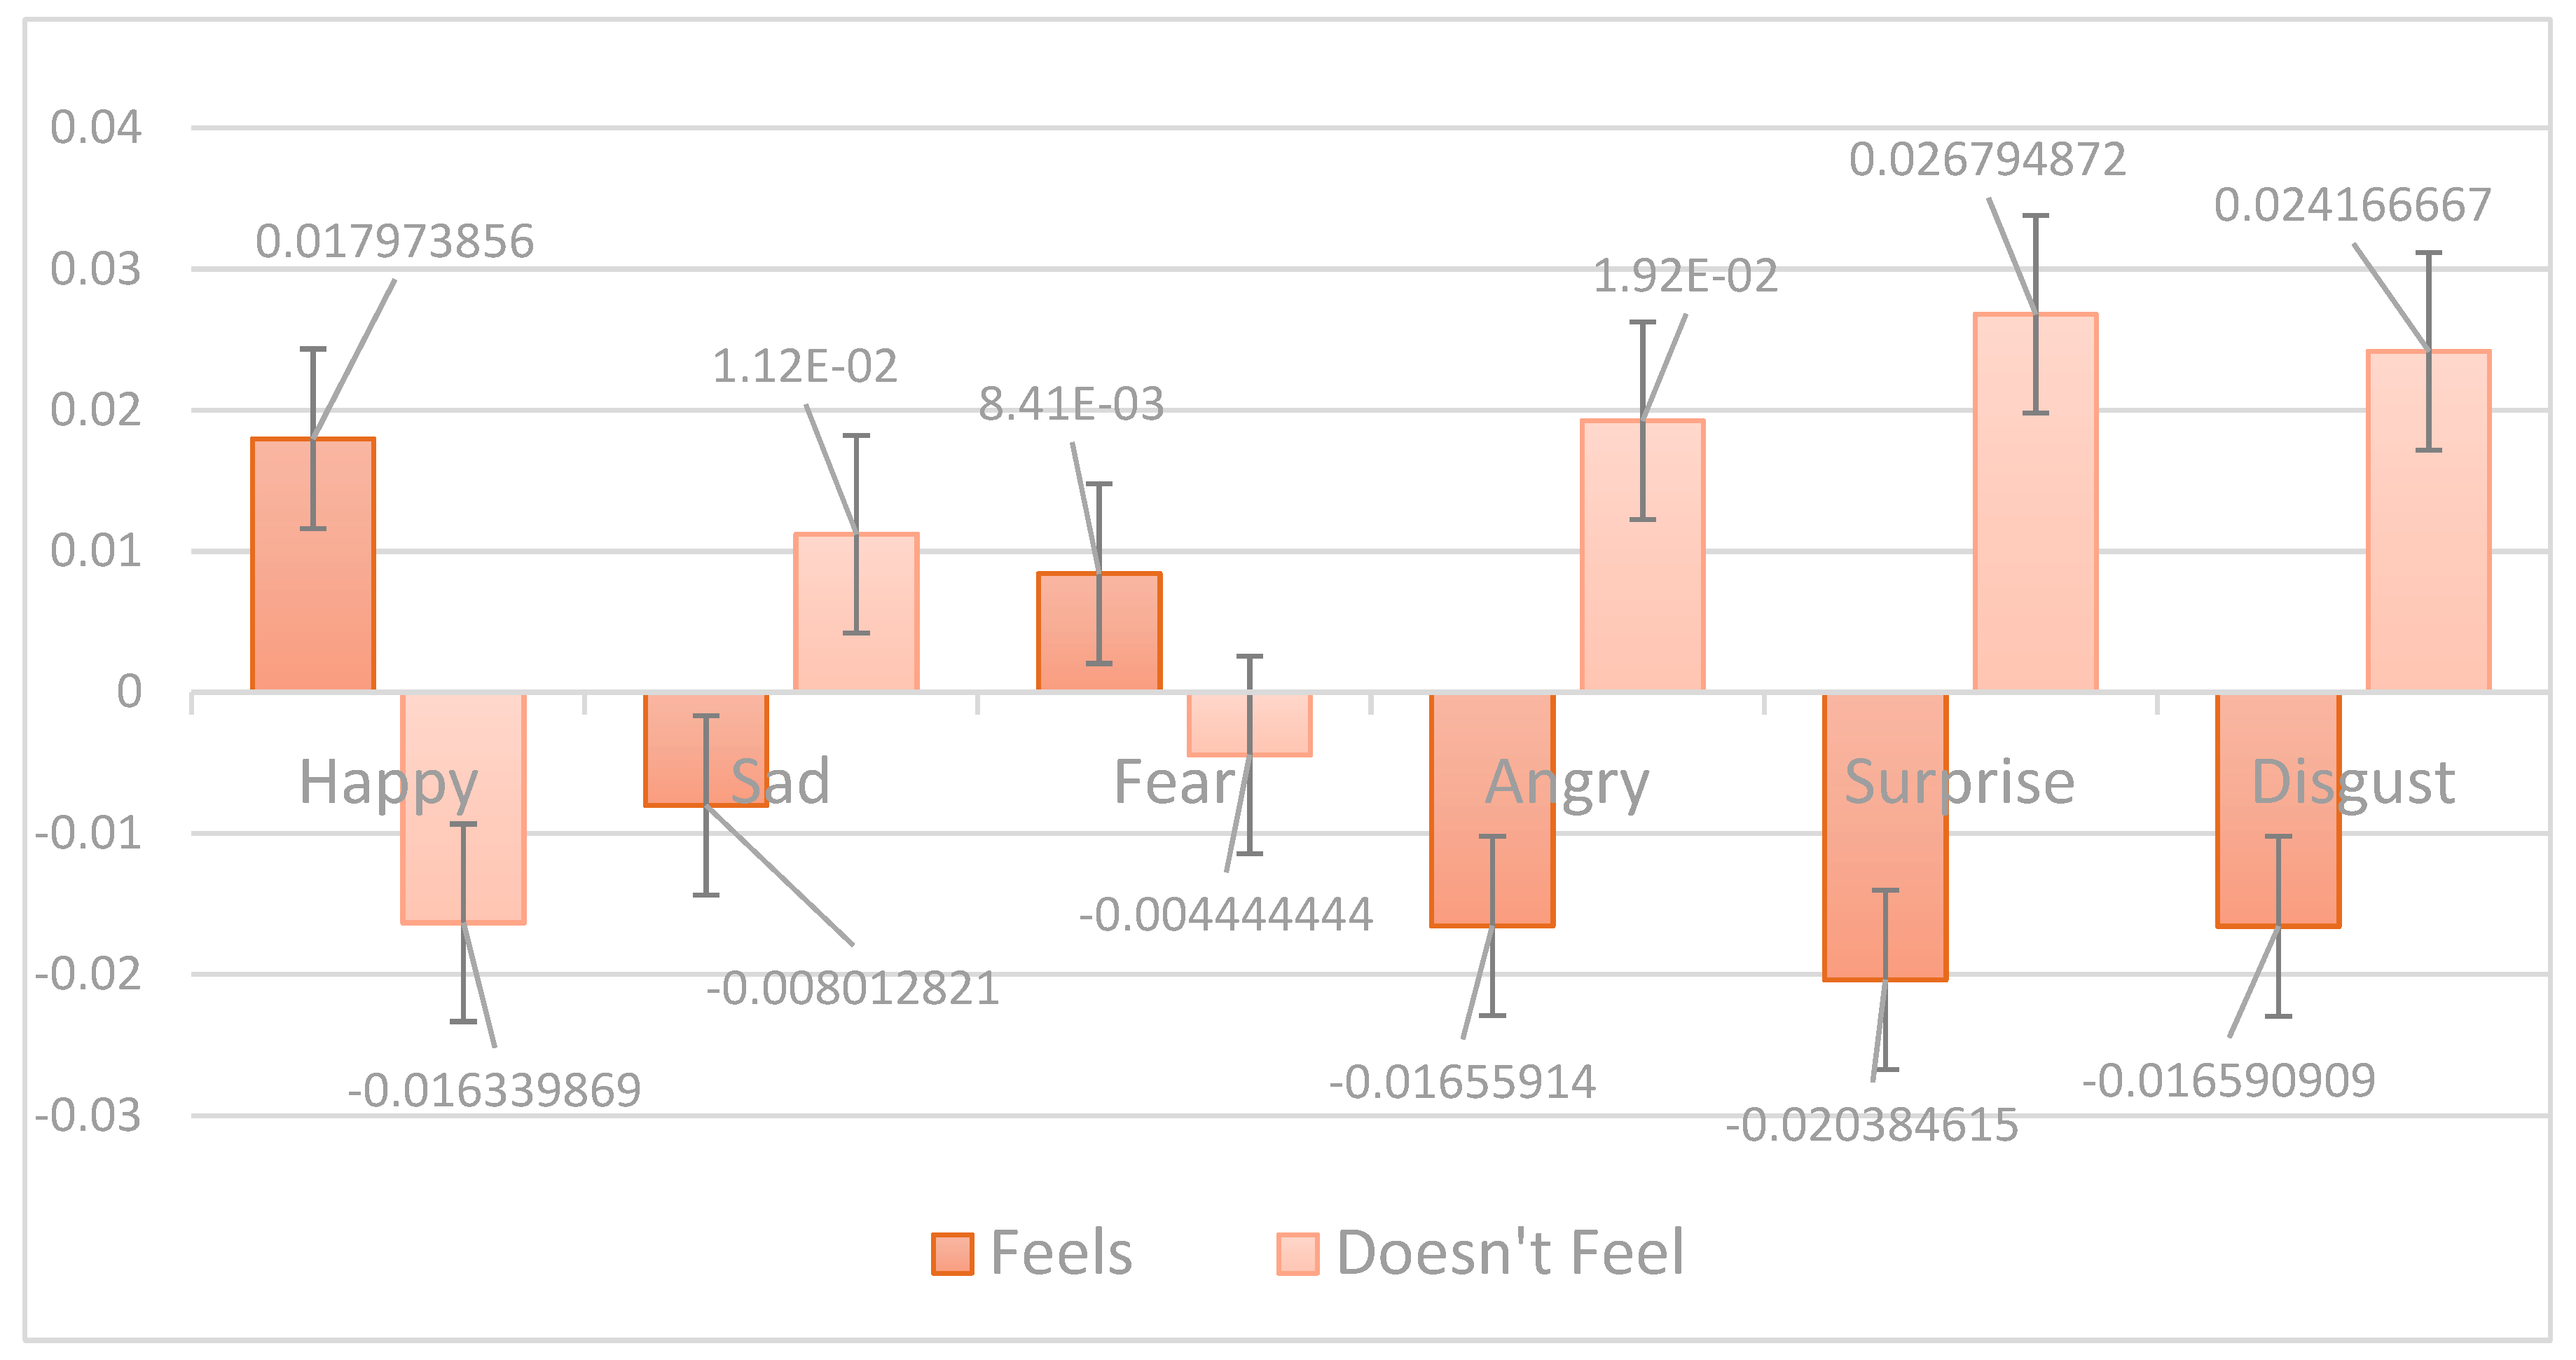
In Song C, the predominant emotions in the "Feels" modules are happiness and fear, while the predominant emotions in the "Doesn't Feel" modules are sadness, anger, surprise, and disgust. Finally, regarding Song D, only the emotion of sadness predominates in the "Feels" module, while the emotions of happiness, anger, surprise, and disgust predominate in the "Doesn't Feel" modules. As for fear, a balance is observed.
Graph 3.
Modules of the Probable External Emotional States of Song C.
Graph 4.
Modules of the Probable External Emotional States of Song D.
2nd step: Determine the MEEPI of the music consumer before listening to the songs.
The MEEPI of the music consumer, prior to listening to the songs, are as follows:
3rd step: Operate the MEEPI with the MEEPE of each song.
Using the known method (Lugos Abarca, 2023), the MEEPI (Graph 5) of the music consumer is applied to the MEEPE of the four songs. This way, the following possible emotional responses (MEEPI) are quantitatively obtained:
Graph 5.
Modules of the Probable Internal Emotional States of the Music Consumer Before Listening to Any of the Four Songs.
Graph 5.
Modules of the Probable Internal Emotional States of the Music Consumer Before Listening to Any of the Four Songs.
Based on the results from Graphs 6–9, we can summarize the following:
- Song A increases the "Feels" modules of happiness and disgust in the music consumer while also increasing the "Doesn't Feel" modules of sadness, fear, anger, and surprise.
- Song B increases the "Feels" module of sadness while also increasing the "Doesn't Feel" modules of happiness, fear, anger, surprise, and disgust.
- Song C increases the "Feels" modules of happiness and fear in the music consumer while also increasing the "Doesn't Feel" modules of sadness, anger, surprise, and disgust.
- Song D increases the "Feels" module of sadness while also increasing the "Doesn't Feel" modules of happiness, fear, anger, surprise, and disgust.
Graph 6.
. Modules of the Probable Internal Emotional States of the Music Consumer After Listening to Song A.
Graph 6.
. Modules of the Probable Internal Emotional States of the Music Consumer After Listening to Song A.
Graph 7.
Modules of the Probable Internal Emotional States of the Music Consumer After Listening to Song B.
Graph 7.
Modules of the Probable Internal Emotional States of the Music Consumer After Listening to Song B.
Graph 8.
Modules of the Probable Internal Emotional States of the Music Consumer After Listening to Song C.
Graph 8.
Modules of the Probable Internal Emotional States of the Music Consumer After Listening to Song C.
Graph 9.
Modules of the Probable Internal Emotional States of the Music Consumer After Listening to Song D.
Graph 9.
Modules of the Probable Internal Emotional States of the Music Consumer After Listening to Song D.
4th step: Calculate the possible level of emotional utility that would be achieved after listening to each song.
Once the MEEPI before and after the musical stimulus are known, it is possible to calculate the potential level of emotional utility that the music consumer could experience after the musical stimuli. Thus, using the known resolution process (Lugos Abarca, 2024), such a function is carried out for the obtained results.
Possible emotional utility achieved by the music consumer after listening to song A:
Possible emotional utility achieved by the music consumer after listening to song B:
Possible emotional utility achieved by the music consumer after listening to the song C:
Possible emotional utility achieved by the music consumer after listening to song D:
Afterward, the average emotional utility of each song is calculated using the following formula:
The resolution is as follows:
Song B presents the highest possible emotional utility. Therefore, this will be the first song to be placed in the playlist.
5th step: Repeat the process with the rest of the songs until they are exhausted.
To determine the second, third, and fourth songs to be included in the playlist according to the consumer's level of emotional utility, the same process explained previously will be followed. However, this time the song with the highest emotional utility will be omitted. Therefore, the first song in this stage will be B. Consequently, to determine the song that will be placed second in the playlist, song B will be excluded, and the MEEPI generated by song B will be used, i.e., Graph 7. This procedure will be repeated successively for the following songs in the playlist.
3. Results and Discussion
With the explained methodology, the levels of emotional utility found are presented.

Table 1.
Levels of the possible emotional utilities that the music consumer would achieve after listening to songs A, B, C, and D, sorted from highest to lowest by emotion.
Table 1.
Levels of the possible emotional utilities that the music consumer would achieve after listening to songs A, B, C, and D, sorted from highest to lowest by emotion.
| Happy utility | Sad utility | Fear utility |
| Anger utility | Surprise utility | Disgust utility |
Average:
As observed in the averages, song B generates the highest emotional utility for the consumer, so it is placed in the first position in the playlist. To determine the song in the second position, the possible MEEPI obtained after listening to song B (Graph 7) are used, and it is solved with the MEEPE of songs A, C, and D, which yields the following levels of emotional utility:
Table 2.
Levels of the possible emotional utilities that the music consumer would achieve after listening to songs A, C, and D, sorted from highest to lowest by emotion.
Table 2.
Levels of the possible emotional utilities that the music consumer would achieve after listening to songs A, C, and D, sorted from highest to lowest by emotion.
| Happy utility | Sad utility | Fear utility |
| Anger utility | Surprise utility | Disgust utility |
Average:
The song in the second place in the playlist will be D, given that it has the highest level of possible emotional utility. To calculate the song in the third place, the possible MEEPI obtained after listening to song D are used, using the initial MEEPI with which those of Graph 7 are resolved.
Graph 10.
Modules of the probable internal emotional states of the music consumer after listening to song D being the initial EMEPI, found in Graph 7.
Graph 10.
Modules of the probable internal emotional states of the music consumer after listening to song D being the initial EMEPI, found in Graph 7.
Operating with the MEEPE of songs A and D, the following levels of emotional utility are calculated:.
Table 3.
Levels of the possible emotional utilities that the music consumer would achieve after listening to songs A and C, sorted from highest to lowest by emotion.
Table 3.
Levels of the possible emotional utilities that the music consumer would achieve after listening to songs A and C, sorted from highest to lowest by emotion.
| Happy utility | Sad utility | Fear utility |
| Anger utility | Surprise utility | Disgust utility |
Average:
Therefore, the song in the third place will be C. By logic, the song in the fourth place will be A.
Table 4.
Levels of the possible emotional utilities that the music consumer would achieve after listening to song A, sorted from highest to lowest by emotion.
Table 4.
Levels of the possible emotional utilities that the music consumer would achieve after listening to song A, sorted from highest to lowest by emotion.
| Happy utility | Sad utility | Fear utility |
| Anger utility | Surprise utility | Disgust utility |
Average:
So, the playlist for this music consumer has the following order:
- First song: B
- Second song: D
- Third song: C
- Fourth song: A
This playlist is personalized according to the consumer profile described in Graph 5. Therefore, the order of the list will vary for another music consumer, depending on their emotional state prior to listening to the songs. Thus, the present model can be personalized and likewise, somewhat generalized in a more limited manner.
4. Conclusion
This article has proposed a mathematical model for creating playlists based on consumer emotional utility, theoretically developed from two previous studies. The results obtained have demonstrated coherence and relevance, representing a significant advancement in the field of microeconomics. This model can be utilized as a tool for making quantitative predictions and estimations regarding music consumer behavior towards playlists. Furthermore, it opens new avenues of research to enhance its practical efficiency in future endeavors.
The potential impact of this model is considerable, as it offers an innovative approach to understanding and satisfying consumer’s emotional needs in the context of online music. It is expected that future research will expand its application, considering a broader range of variables and usage scenarios, thus contributing to its continuous development and practical utility.
References
- Aguiar, L. , & Waldfogel, J. (2018). Platforms, promotion, and product discovery: Evidence from Spotify playlists (No. w24713). National Bureau of Economic Research.
- Amini, R. , Willemsen, M. C., & Graus, M. P. (2019). Affective Music Recommender System (MRS): Investigating the effectiveness and user satisfaction of different mood inducement strategies.
- Amster, P. , & Pinasco, J. P. (2014). Teoría de juegos: una introducción matemática a la toma de decisiones.
- Bautch, K. (2021). The Effect of Therapeutic Music Playlists on Symptoms of Anxiety: A Clinical Trial (Doctoral dissertation, University of the Pacific).
- Bonnin, G.; Jannach, D. Automated Generation of Music Playlists: Survey and Experiments. ACM Comput. Surv. 2014, 47, 1–35. [Google Scholar] [CrossRef]
- Choi, J. , Khlif, A. , & Epure, E. (2020). Prediction of user listening contexts for music playlists. In Proceedings of the 1st Workshop on NLP for Music and Audio (NLP4MusA) (pp. 23-27). [Google Scholar]
- De Mooij, A. M. , & Verhaegh, W. F. J. (1997). Learning preferences for music playlists. Artificial Intelligence, 97(1-2), 245-271.
- Ee, H. V. (2022). In The Mood For Mood: A musicological perspective on the mechanisms of the mood playlist (Master's thesis).
- Eriksson, M. , & Johansson, A. (2017). " Keep Smiling!": Time, Functionality and Intimacy in Spotify's Featured Playlists. Cultural Analysis, 16.
- Filipcic, A. M. L. (2021). The Age of Music Streaming: The Use of Music Metadata to Inform Music Therapy Clinical Decisions. The Florida State University.
- Garrido, S. (2019). Musical playlists for addressing depression in people with dementia. Music and dementia: From cognition to therapy, 122-137.
- Hagen, A.N. The Playlist Experience: Personal Playlists in Music Streaming Services. Popul. Music. Soc. 2015, 38, 625–645. [Google Scholar] [CrossRef]
- Kamehkhosh, I.; Bonnin, G.; Jannach, D. Effects of recommendations on the playlist creation behavior of users. User Model. User-Adapted Interact. 2020; 30, 285–322. [Google Scholar] [CrossRef]
- Kamehkhosh, I. , Jannach, D. How automated recommendations affect the playlist creation behavior of users. In ACM IUI 2018–Workshops.
- Keerthana, K. M. , Sanjana, V., Aishwarya, S., Nagesh, A. B., & Mahale, V. (2022). Musically Yours-Implementation of Music Playlist using Machine Learning and Music Therapy. Perspectives in Communication, Embedded-systems and Signal-processing-PiCES, 23-25.
- Li, Z.; Song, M.; Duan, S.; Wang, Z. Are users attracted by playlist titles and covers? Understanding playlist selection behavior on a music streaming platform. J. Innov. Knowl. 2022, 7, 100212. [Google Scholar] [CrossRef]
- Liang, Y. , & Willemsen, M. C. (2019, Adaptation and Personalization (pp. 276-284)., June). Personalized recommendations for music genre exploration. In Proceedings of the 27th ACM Conference on User Modeling.
- Abarca, J.A.L. ¿Qué emociones provoca una canción? Sobre un modelo probabilístico emocional – musical. Ricercare 2023, 59–119. [Google Scholar] [CrossRef]
- Lugos Abarca, J.A. (2024). A Utility Function for the Music Consumer Based on Emotions. Preprints. [CrossRef]
- Maasø, A.; Hagen, A.N. Metrics and decision-making in music streaming. Popul. Commun. 2020, 18, 18–31. [Google Scholar] [CrossRef]
- Mélo, D. Investigating the Role of Personalization When Creating Relaxing Playlists. WebMedia '20: Brazillian Symposium on Multimedia and the Web. (pp. 213-216).
- Pichl, M.; Zangerle, E.; Specht, G. Understanding Playlist Creation on Music Streaming Platforms. 2016 IEEE International Symposium on Multimedia (ISM). pp. 475–480.
- Prey, R.; Del Valle, M.E.; Zwerwer, L. Platform pop: disentangling Spotify’s intermediary role in the music industry. Information, Commun. Soc. 2022; 25, 74–92. [Google Scholar] [CrossRef]
- Sanchez, J. (2018). Algorithms And Curated Playlist Effect On Music Streaming Satisfaction. Texas Christian University.
- Siles, I.; Segura-Castillo, A.; Sancho, M.; Solís-Quesada, R. Genres as Social Affect: Cultivating Moods and Emotions through Playlists on Spotify. Soc. Media + Soc. 2019, 5, 2056305119847514. [Google Scholar] [CrossRef]
- Subramaniam, G. , Verma, J., Chandrasekhar, N., Narendra, K. C., & George, K. (2018, November). Generating playlists on the basis of emotion. In 2018 ieee symposium series on computational intelligence (ssci) (pp. 366-373). IEEE.
- Svensson, J. (2023). Generating personalized music playlists based on desired mood and individual listening data.
- van der Zande, M. M. (2018). Tune your mood with music: a personalized affective music player (Doctoral dissertation, Master thesis) Eindhoven University of Technology).
Disclaimer/Publisher’s Note: The statements, opinions and data contained in all publications are solely those of the individual author(s) and contributor(s) and not of MDPI and/or the editor(s). MDPI and/or the editor(s) disclaim responsibility for any injury to people or property resulting from any ideas, methods, instructions or products referred to in the content. |
© 2024 by the authors. Licensee MDPI, Basel, Switzerland. This article is an open access article distributed under the terms and conditions of the Creative Commons Attribution (CC BY) license (http://creativecommons.org/licenses/by/4.0/).
Copyright: This open access article is published under a Creative Commons CC BY 4.0 license, which permit the free download, distribution, and reuse, provided that the author and preprint are cited in any reuse.


