
Submitted:
06 March 2024
Posted:
06 March 2024
You are already at the latest version
Abstract
This paper examines the transformation of the Ukrainian stock market by analyzing daily returns from the PFTS stock index spanning 1995-2022. Segmented into sub-periods, it tests the hypothesis that the market's efficiency has grown over time. Various data properties, including persistence, volatility, normality, and resistance to anomalies, are explored using different statistical techniques and methods. Volatility, indicated by standard deviation, exhibits a general decreasing trend, suggesting a shift towards a more efficient market. Returns show no significant differences across sub-periods, except for 2005-2007. R/S analysis indicates the decrease of persistence in the market: a trend towards increased efficiency. Normality tests support a normal distribution of daily returns throughout sub-periods. An analysis of anomalies reveals the market's resilience to day-of-the-week effects, with no specific trends observed. The results suggest the absence of serious changes in data properties in the Ukrainian stock market over the time, means evolutionary processes over 25 years can’t be clearly observed. Reforms and changes have had limited impact, justifying continued reform for the market's evolution.
Keywords:
stock market
; persistence
; anomalies
; transformation
1. Introduction
One of the fundamental academic theories describing and explaining the behavior of financial markets is the Efficient Market Hypothesis (EMH), developed by Fama (1960). According to this theory, at any given moment, the price of a financial asset equals its fundamental value, making it impossible to make economic decisions that would yield profits from operations with asset in the financial market (so-called "you can't beat the market" rule).
This is explained by the random nature of price fluctuations in financial markets and by the fact that any discrepancy between the current market price of an asset and its fundamental value will be compensated by the corresponding actions of financial market participants, resulting in the almost instantaneous elimination of any deviation from the fair value (Samuelson, 1965).
Evolutionarily, markets move from inefficient (when prices have a non-random nature of changes and there is a fundamental possibility of predicting price movements, when information asymmetry is present, when there is an opportunity to make profits) to efficient, when prices are unpredictable, and their movements are random, information asymmetry is minimal, and financial markets are markets of perfect competition (Lo, 1994).
Stock markets are evolving and are moving from less efficient to more efficient state (Lo, 2004). This is a general consensus in the academic literature. The rationale for this includes the impact of the competition, mutation, reproduction, and natural selections which cause changes in behavior of financial institutions and market participants, with further transmission to the efficiency of markets (the adaptive market hypothesis).
Kim et al. (2011) showed that return predictability varies in time for the case of the Dow Jones Industrial Average index from 1900 to 2009.
Evolutionary nature of financial markets related to their efficiency was confirmed by Urquhart and Hudson (2013) who explored the persistence of returns in the US, UK and Japanese stock markets and found evidence in favor of the adaptive market hypothesis. Contrary Hull and McGroarty (2014) could not find evidence of persistence trending down over time. Means can’t show that market efficiency increased in time.
Alternative approach to analyze the evolutionary processes in the financial markets is exploration of market anomalies. A general idea in this case is as follows: market anomalies should not exist at all in the efficient market (Jensen, 1978).
Kohers, et al (2004) provide evidences that market efficiency evolves by exploring the day of the week effect and show that it tends to slowly disappear. Similar conclusions obtained by Plastun et al (2021). It was confirmed by Xiong et al. (2018) who found that calendar effects in the Chinese stock market vary over time.
Lim and Brooks (2011) provide a summary of existing literature on market efficiency evolution. A general conclusion is in favor of the adaptive markets hypothesis: market efficiency varies over time.
Ukrainian stock market is not widely explored in the academic literature. Plastun et al. (2023) analyzed efficiency of the Ukrainian stock market exploring differences between traditional and ESG indices. They showed that traditional indices should me more predictable compared with ESG analogues in the Ukrainian stock market. Despite some evidences regarding efficiency of the Ukrainian stock market, the evolutionary aspects are still uncovered. Partially because the Ukrainian stock market is rather young (less than 30 years old). This paper aims to fill this gap in academic literature and analyses evolution of the Ukrainian stock market through the prism of data properties.
This paper using the whole data available for the Ukrainian stock market (since the start of trades in 1995 till 2022) explores its evolution by analyzing key data properties (persistence, volatility, normality, anomalies resilience, etc) in order to test the following hypothesis: efficiency of the Ukrainian stock market increases in time. To do this regression analysis with dummy variables, normality tests, persistence analysis (R/S analysis) as well as a number of statistical tests (both parametrical and non-parametrical) are used. To study price anomalies the day of the week is explored.
2. Materials and Methods
We analyse daily data for leading Ukrainian stock market index PFTS (https://www.pfts.com.ua). The sample period goes from 1995 to 2022.
In order to explore the evolution of the market overall data set is divided into the following sub-periods: 1995-1999, 2000-2004, 2005-2007, 2008-2009, 2010-2013, 2014-2015, 2016-2019, 2020-2022. This division is based on key events in the development of the Ukrainian stock market. For example, 2008-2009 – the Global financial crisis. 2020-2022 – pandemic period, etc.
We analyse returns computed as follows:
where – returns on the і-th period in percentage terms;
– open price on the і-th period;
– close price on the і-th period.
Hypothesis to be tested: efficiency of the Ukrainian stock market increases in time.
To test this hypothesis the following methods and technics are used:
- Descriptive statistics (to explore differences between key quantitative characteristics of data sets belonging to different sub-periods);
- Parametric tests (t-tests, ANOVA-analysis) to identify statistically significant differences between data sets belonging to different periods;
- Non-parametric tests (Mann-Whitney, Kruskall-Wallis) to identify statistically significant differences between data sets belonging to different periods;
- Data normality tests (Kolmogorov-Smirnov test) in order to check the random nature of data with further conclusions about the efficiency/inefficiency of the market during the analyzed period;
- Methods to analyze price anomalies (the effect of the day of the week) as the signs of market inefficiency;
- R/S analysis to explore data persistence with further conclusions regarding the level of market efficiency during the analyzed period.
To measure the degree of persistence R/S analysis is applied. The first is based on the following algorithm (see Caporale and Plastun, 2024 for additional details):
1. A time series of length M is transformed into one of length N = M - 1 using logs and converting prices into returns:
2. This period is divided into contiguous A sub-periods with length n, such that An = N, then each sub-period is identified as Ia, given the fact that a = 1, 2, 3…, A. Each element Ia is represented as Nk with k = 1, 2, 3…, N. For each Ia with length n the average is defined as:
3. Accumulated deviations Xk,a from the average for each sub-period Ia are defined as:
The range is defined as the maximum index Xk,a minus the minimum Xk,a, within each sub-period (Ia):
4. The standard deviation is calculated for each sub-period Ia:
5. Each range RIa is normalised by dividing by the corresponding SIa. Therefore, the re-normalised scale during each sub-period Ia is RIa/SIa. In step 2 above, adjacent sub-periods of length n are obtained. Thus, the average R/S for length n is defined as:
6. The length n is increased to the next higher level, (M - 1)/n, and must be an integer number. In this case, n-indices that include the start and end points of the time series are used, and Steps 1 - 6 are repeated until n = (M - 1)/2.
7. The least square method is used to estimate the equation log (R / S) = log (c) + H*log (n). The slope of the regression line is an estimate of the Hurst exponent H. (Hurst, 1951).
The Hurst exponent lies in the interval [0, 1]. On the basis of the H values three categories can be identified: the series are anti-persistent, and returns are negatively correlated (0 ≤ H < 0.5); the series are random, returns are uncorrelated, and there is no memory in the series (H = 0.5); the series are persistent, returns are highly correlated, and there is memory in price dynamics (0.5 < H ≤ 1).
Regression analysis with dummy variables serves as an additional method to scrutinize data for statistically significant differences across various periods. Within this methodology, data from two sub-periods are consolidated into a unified dataset, distinguishing data assignments to specific subsets through the incorporation of dummy variables.
The model is as follows:
де – is the average value of overall data set for period i, – is the average value of the first data set (first sub-period); – is a coefficient for a dummy variable characterizing its influence on the average value of overall data set for period i; Di – is a dummy variable equal to 0 for the first data sub-period and 1 for the second data sub-period for period i.
3. Results
We start with descriptive statistics (see Table 1).
As can be seen key data characteristics vary for different periods. In particular, the average values of returns tend to be negative in crisis periods and positive in non-crisis periods, which is consistent with existing evidence from other countries and aligns with the overall logic: the stock market grows during economic expansion and declines during economic crises. As for volatility (measured in Table 1 by the parameter "standard deviation"), there is a general trend of decreasing this indicator, indicating a transition to a more efficient state of market functioning, which, due to a greater number of professional participants, reacts more adequately to various events without excessive price fluctuations. An increase in volatility is observed during times of crises which is a fairly typical reaction of the stock market.
Visual confirmation of these conclusions is provided in Figure 1, where the dynamics of average values and standard deviations is present.
Absolute differences, even with visual confirmation of their existence, merely suggest potential distinctions among the data across diverse periods, because it may lack statistical significance for drawing about the belonging of the data to different populations.
To obtain evidence in favor of the statistical significance of the identified differences, a series of statistical tests are performed (both parametric and non-parametric to account for possible deviations of data from the normal distribution). The results of the ANOVA analysis (parametric test) and the Kruskal-Wallis tests (non-parametric) are provided in Table 2.
As indicated, differences are statistically significant, meaning that not all of the analyzed periods belong to the same population. In other words, some periods demonstrated price behavior that was not typical compared to other periods.
However, based on the results from Table 2, it is not possible to conclude which periods were typical and which were not. To address this question, additional analysis is conducted. Each individual sub-period is explored for differences from the general population (the population, in this case, consisted of all data except for the period being examined). To do this parametric t-tests and ANOVA analysis as well as non-parametric Mann-Whitney tests are used. Results are provided in Table 3, Table 4 and Table 5 respectively.
The results of t-tests show that statistically significant differences are observed only during 2005-2007, and in all other periods the data behaved within the framework of the general population.
The data in Table 4 confirm the results of the t-tests: the only period that statistically different from the general population was the period from 2005 to 2007.
ANOVA analysis and t-tests are parametric tests, so to avoid potential methodological biases associated with the normality/non-normality of data, a non-parametric Mann-Whitney test is used.
The results of the Mann-Whitney tests confirm the previous findings of parametric tests.
As an additional method to validate the obtained results, a regression analysis with dummy variables is employed. The results are presented in Table 6.
The results of the regression analysis with dummy variables are in line with those from the statistical tests: the only period that statistically differs from overall data set is the period from 2005 to 2007.
Summarizing the analysis based on statistical tests and regression analysis with dummy variables, it can be concluded that the only case where data properties differ from general population was the period 2005-2007. Regarding the rest of the periods, despite crises or their resolutions, changes in the regulatory and economic landscape, the specificity of price behavior in the Ukrainian stock market remained relatively unchanged. In fact, there is a lack of evidence (except for the period 2005-2007) of qualitative transformations and evolution in the specificity of price fluctuations in the Ukrainian stock market.
A fundamentally different approach to analyzing market efficiency is the analysis of data persistence. The results of the R/S analysis for the whole dataset and sub-periods are presented in Table 7.
Overall, the Ukrainian stock market is characterized by the presence of persistence (long-term memory), meaning that past prices contain information about the future prices, thus prices on such a market are fundamentally predictable. The visualization of the Hurst exponent dynamics with a trend line is provided in Figure 2.
As can be seen, there is a certain trend in the dynamics of persistence in the Ukrainian stock market: a decrease in the Hurst exponent values. Essentially, this represents a shift in the specificity of price fluctuations from their fundamental predictability due to the presence of long-term memory to the random nature of price movements, which is typical for an efficient market. Therefore, we have confirmation in favor of certain evolutionary processes in the Ukrainian stock market: it transforms from less efficient state to more efficient one.
However, only there is only one period (from 2020 to 2022) which can be classified as non-persistent.
An important data property is type of data distribution (normal/not normal). The normality of data is one of the indicators of an efficient market. Accordingly, the "non-normality" of data is evidence in favor of market inefficiency. Changes in the behavior of this data property can be used as one of the signs of market evolution.
Preliminary conclusions about data normality can be made based on the analysis of descriptive statistics parameters kurtosis and skewness. Their presence within the range of [-1..1] is an indication of data normality. Going beyond this range raises doubts about the normality of data distribution.
In Table 8 the values of kurtosis and skewness parameters for each of the analyzed sub-periods are provided.
Skewness across all periods is within the range [-1..1], which is an indication of data normality. However, kurtosis significantly exceeds this range in all cases, which, in turn, is a sign of data non-normality.
To eliminate this uncertainty, there are numerous statistical tests for assessing the conformity of data to a normal distribution. One of the most popular ones is the Kolmogorov-Smirnov test. Results are presented in Table 9.
Results from Table 9 confirm the normal distribution of the data. Normal distribution was typical for all periods, implying that there were no radical changes in the behavior of this data property in the Ukrainian stock market from 1999 to 2022.
One of the main criticisms against the Efficient Market Hypothesis is the presence of anomalies – typical patterns in price behavior that should not exist in an efficient market but have been empirically identified by researchers. Anomalies range from calendar anomalies (month-of-the-year effect, day-of-the-week effect, Halloween effect, holiday effect, etc.) to anomalies related to small firms and price patterns emerging after abnormal price fluctuations, etc.
Therefore, studying price anomalies can provide additional information about the market efficiency. The presence of anomalies evidence in favor of market inefficiency, while the absence supports market efficiency.
Plastun et al. (2019) explored calendar anomalies in the U.S. stock market and showed that anomalies lost their strength with the development of the U.S. stock market and almost completely disappeared at the beginning of the 21st century. Thus, investigating price anomalies over different periods can offer valuable insights into the evolution and current state of the market in terms of efficiency.
Considering the specifics of the data used in this study (daily data over 2–5-year periods), it is impossible to analyze most anomalies due to their requiring a different data periodicity (monthly, for example) or a larger dataset. However, some anomalies can be explored with statistically significant results. One such anomaly is the day-of-the-week effect—one of the most well-known calendar anomalies studied on various markets (stock, currency, commodity, cryptocurrency) in different countries (U.S., Japan, China, etc.) and groups of countries (developed, emerging).
The first step in the analysis for the presence of this anomaly is the visual inspection of average daily returns for specific days of the week (Figure 3).
As can be seen, the only day when price dynamics was consistently positive (prices increased) was Friday, aligning perfectly with the classical day-of-the-week effect. Regarding another classical feature of the day-of-the-week effect—price declines on Mondays—this effect was vividly observed only in the first and last of the analyzed periods (1995-1999 and 2020-2022, respectively). For the rest of the days, the data were mixed. In certain periods, the dynamics on specific days appeared anomalously strong compared to other days. For instance, the price decline on Tuesdays during the 2008-2009 period, in absolute terms, was several times greater than the average dynamics on any other day of the week.
Based on visual analysis it can’t be concluded whether the observed differences are statistically significant. Therefore, the next stage of the analysis involves the use of statistical tests to answer the question of whether the differences are statistically significant. For these purposes both parametric and non-parametric tests are employed.
The results of the t-test are presented in Table 10.
t-test results evidence in favor of the absence of statistically significant differences in the price dynamics on different days of the week. All days belong to the same population, indicating that the day-of-the-week effect in the Ukrainian stock market is not confirmed for any of the analyzed periods.
The next parametric test used for additional verification is the ANOVA analysis. The results are presented in Table 11.
The results of the ANOVA analysis are in line with those obtained from the t-tests, confirming that no statistically significant differences are detected and providing no evidence of the existence of a day-of-the-week effect in the Ukrainian stock market.
Next step is the use of non-parametrical Kruskal-Wallis Tests (Table 12).
The results of the Kruskal-Wallis tests in general confirmed the conclusions of parametric tests with one exception: during the period 2020-2022, statistically significant differences were observed between different days of the week. However, this conclusion does not specify which days of the week differ from the others.
To clarify this point additional research for this period is provided. Visual analysis (see Figure 4) indicates that Monday is characterized by an anomalously strong price movement compared to other periods, namely a decline in prices.
As can be seen, returns on Monday were much lower compared with the other days of the week. To see whether this difference is statistically significant parametric ANOVA analysis and non-parametric Mann-Whitney tests are applied. The results of the ANOVA analysis are presented in Table 13.
The results of Table 13 confirm the conclusions of the ANOVA analysis for all days provided in Table 11 – there are no statistically significant differences between individual days of the week.
As for the non-parametric Mann-Whitney tests, they are presented in Table 14.
Non-parametric tests, unlike parametric ones, indicate that returns on Mondays and Wednesdays differ from the typical price behavior throughout the week. Therefore, there is evidence supporting a day-of-the-week effect during the period 2020-2022, characterized by a presence of negative returns in prices on Mondays and a tendency for the market to demonstrate positive dynamics on Wednesdays.
Considering that throughout all other periods, starting from 1995-1999, anomalies were entirely absent, it can be argued that there is a certain degradation of the Ukrainian stock market from the point of its efficiency.
In general, the analysis of anomalies has shown that the stock market in Ukraine was quite immune to the day-of-the-week effect. There are no specific trends in their development depending on the period. Thus, the hypothesis that the evolution of the stock market led to an increase in its efficiency in terms of the presence of fewer anomalies has not been confirmed.
4. Discussion
Summarizing the results of the evolution of the Ukrainian stock market, it can be concluded that the level of its efficiency did not demonstrate a clear trend of growth. Existing evidences are mixed, ranging from certain signs of movement towards greater efficiency (R/S analysis, data normality and volatility analysis) to clear signs of the degradation of the Ukrainian stock market (movement towards greater inefficiency observed for the case of day-of-the-week effect). Based on these results it is hard to call the latest 30 years a development of the Ukrainian stock market. The reforms and legislative as well as regulatory changes that took place had little or no impact on the nature of price behavior and the properties of prices as data series. This, in turn, justifies the relevance and necessity of further reforming the Ukrainian stock market and its evolution needs more time.
5. Conclusions
This paper explores the transformation of the Ukrainian stock market through the prism of data properties analysis. To do this, daily returns from leading Ukrainian stock market index PFTS over the period 1997-2022 are analyzed. Overall data set is divided into sub-periods in order to find differences in data properties. The following hypothesis is tested in this paper: efficiency of the Ukrainian stock market increases in time.
To test this hypothesis a number of data properties are explored: persistence, volatility, normality, resistance to anomalies. To do these different methods and technics are used: descriptive statistics, parametric tests (t-tests, ANOVA-analysis), non-parametric tests (Mann-Whitney test, Kruskal-Wallis test), data normality tests (Kolmogorov-Smirnov test), R/S analysis, regression analysis with dummy variables.
Volatility (measured by the indicator "standard deviation") demonstrates a general trend of decreasing, indicating a transition to a more efficient state of market. There are no statistically significant differences in returns for different sub-periods with the only exception (2005-2007).
The R/S results imply that the Ukrainian stock market is characterized by the presence of persistence (long-term memory), meaning that past prices contain information about the future prices, thus prices on such a market are fundamentally predictable. There is a trend in the dynamics of persistence in the Ukrainian stock market: a decrease in the Hurst exponent values. This is evidence in favor of certain evolutionary processes in the Ukrainian stock market: it transforms from less efficient state to more efficient one.
Normality tests in general evidence in favor of normal distribution of daily returns in the Ukrainian stock market which is typical for all of the analyzed sub-periods.
In general, the analysis of anomalies has shown that the stock market in Ukraine was immune to the day-of-the-week effect. There are no specific trends in their development depending on the period. There are even some signs of degradation: during the period 2020-2022 day-of-the-week effect was much more visible compared with other periods. Thus, the hypothesis that the evolution of the stock market led to an increase in its efficiency in terms of the presence of fewer anomalies has not been confirmed.
Author Contributions
Conceptualization, Alex Plastun and Lesia Hariaha; methodology, Alex Plastun; software, Oleksandr Yatsenko; validation, Alex Plastun, Olena Hasii and Liudmyla Slіusareva; formal analysis, Lesia Hariaha; investigation, Oleksandr Yatsenko; resources, Alex Plastun and Lesia Hariaha; data curation, Alex Plastun; writing—original draft preparation, Alex Plastun, Lesia Hariaha, Oleksandr Yatsenko, Olena Hasii and Liudmyla Slіusareva; writing—review and editing, Alex Plastun; visualization, Olena Hasii and Lesia Hariaha; supervision, Alex Plastun; project administration, Lesia Hariaha; funding acquisition, Alex Plastun. All authors have read and agreed to the published version of the manuscript.
Funding
This research received no external funding.
Data Availability Statement
Dataset available on request from the authors.
Acknowledgments
Alex Plastun gratefully acknowledges financial support from the University of Liverpool (UK).
Conflicts of Interest
The authors declare no conflicts of interest.
References
- Caporale G. M. & Plastun A., (2024). Persistence in high frequency financial data: the case of the EuroStoxx 50 futures prices, Cogent Economics &Finance, 12:1, 2302639. [CrossRef]
- Fama, E. (1965). The Behavior of Stock-Market Prices. The Journal of Business, 38 (1), 34-105.
- Hull, M. and McGroarty, F., (2014). Do emerging markets become more efficient as they develop? Long memory persistence in equity indices, Emerging Markets Review, 18, 45-61.
- Hurst, H. , (1951). Long-term Storage of Reservoirs. Transactions of the American Society of Civil Engineers, 799 p.
- Jensen, M. , (1978). Some anomalous evidence regarding market efficiency. J. Financ. Econ. 6, 95–101.
- Kim, Jae H., Abul Shamsuddin, Kian-Ping Lim, (2011). Stock return predictability and the adaptive markets hypothesis: Evidence from century-long U.S. data, Journal of Empirical Finance, 18 (5), 868-879.
- Kohers, G., Kohers, N., Pandey, V., & Kohers, T. (2004). The disappearing day-of-the-week effect in the world’s largest equity markets. Applied Economics Letters, 11(3), 167–171.
- Lim, K.-P. and Brooks, R. (2011), The evolution of stock market efficiency over time: a survey of the empirical literature. Journal of Economic Surveys, 25: 69-108.
- Lo, A. W. (2004). The adaptive markets hypothesis: Market efficiency from an evolutionary perspective. Journal of Portfolio Management, 30, 15–29.
- Mandelbrot B., 1972. Statistical Methodology For Nonperiodic Cycles: From The Covariance To Rs Analysis // Annals of Economic and Social Measurement, Volume 1, number 3, 259-290.
- Plastun Alex, Xolani Sibande, Rangan Gupta, Mark E. Wohar, (2019), Rise and fall of calendar anomalies over a century, The North American Journal of Economics and Finance, Volume 49, 181-205. [CrossRef]
- Plastun, Alex, Inna Makarenko, Liudmyla Huliaieva, Tetiana Guzenko and Iryna Shalyhina (2023). ESG vs conventional indices: Comparing efficiency in the Ukrainian stock market. Investment Management and Financial Innovations, 20(2), 1-15. [CrossRef]
- Samuelson, P. (1965). Proof that Properly Anticipated Prices Fluctuate Randomly. Industrial Management Review, 6(2), 41-49.
- Urquhart, A. , Hudson, R., (2013). Efficient or adaptive markets? Evidence from major stock markets using very long run historic data. Int. Rev. Finan. Anal. 28, 130–142.
- Xiong, X., Meng, Y., Li, X., Shen, D., (2019). An empirical analysis of the adaptive market hypothesis with calendar effects: Evidence from China. Finance Research Letters, 31. [CrossRef]
Figure 2.
Dynamics of average returns and their standard deviations in the Ukrainian stock market by sub-periods .
Figure 2.
Dynamics of average returns and their standard deviations in the Ukrainian stock market by sub-periods .
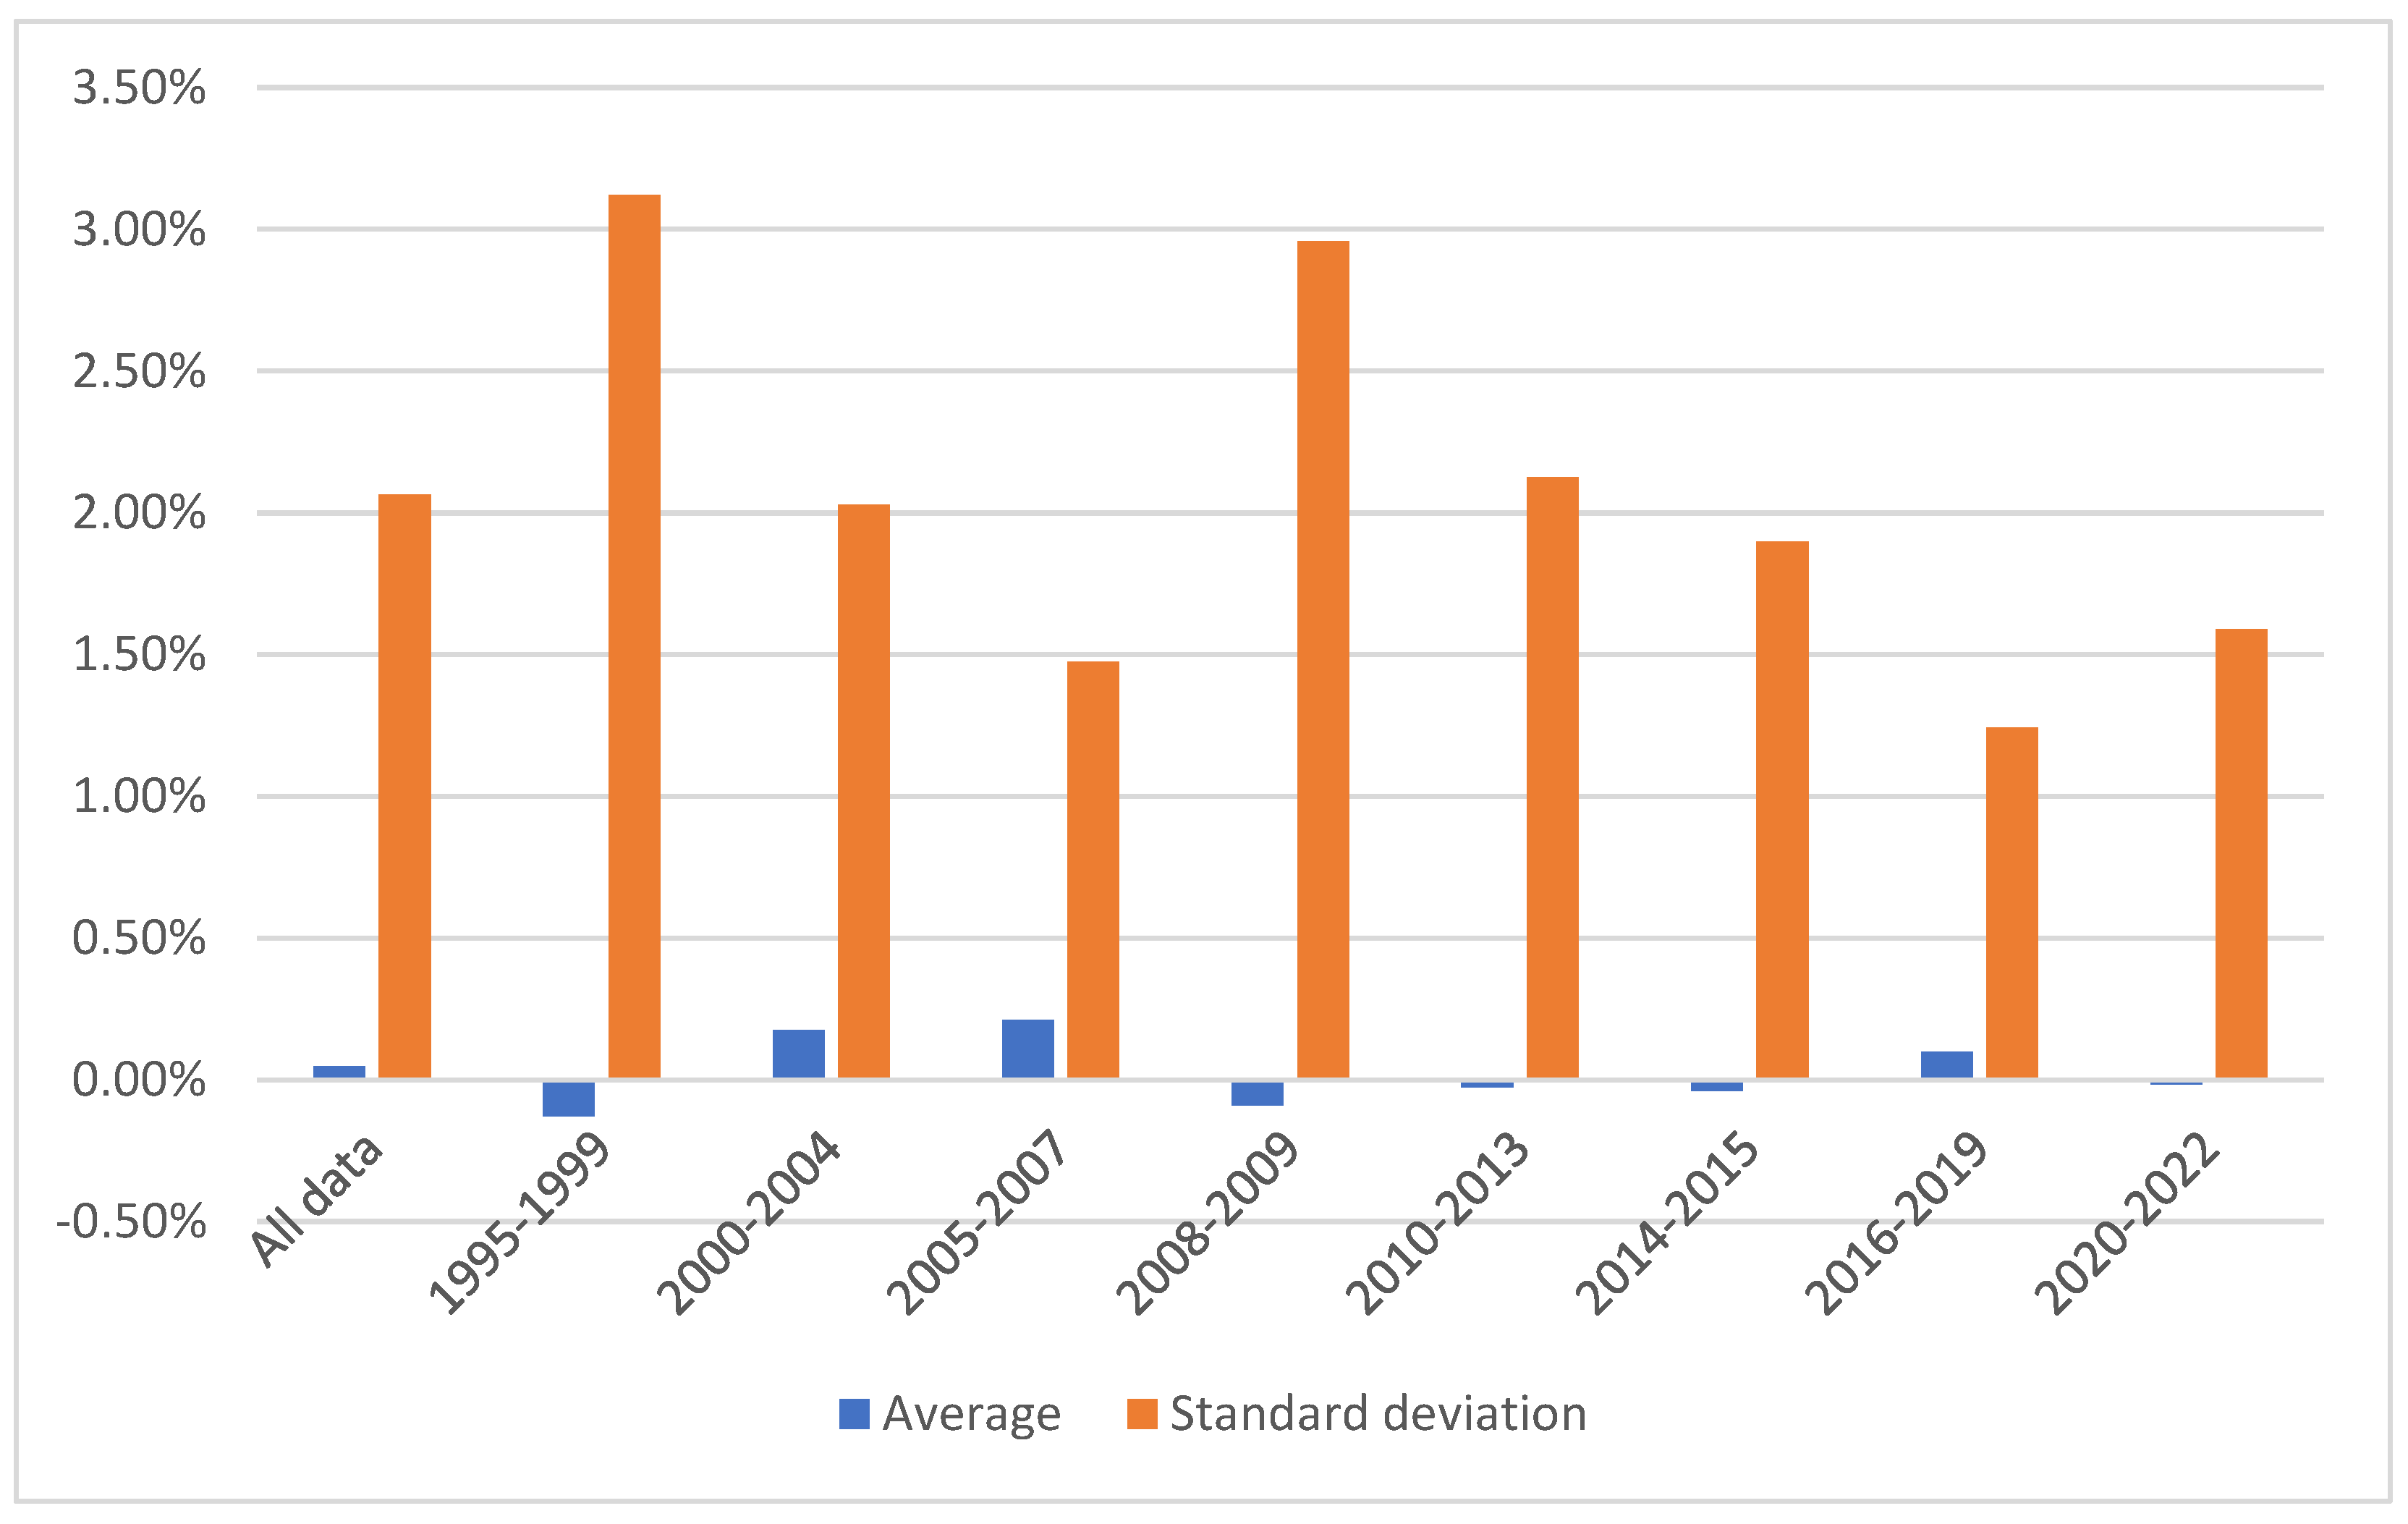
Figure 2.
Transformation of persistence in the Ukrainian stock market in time.
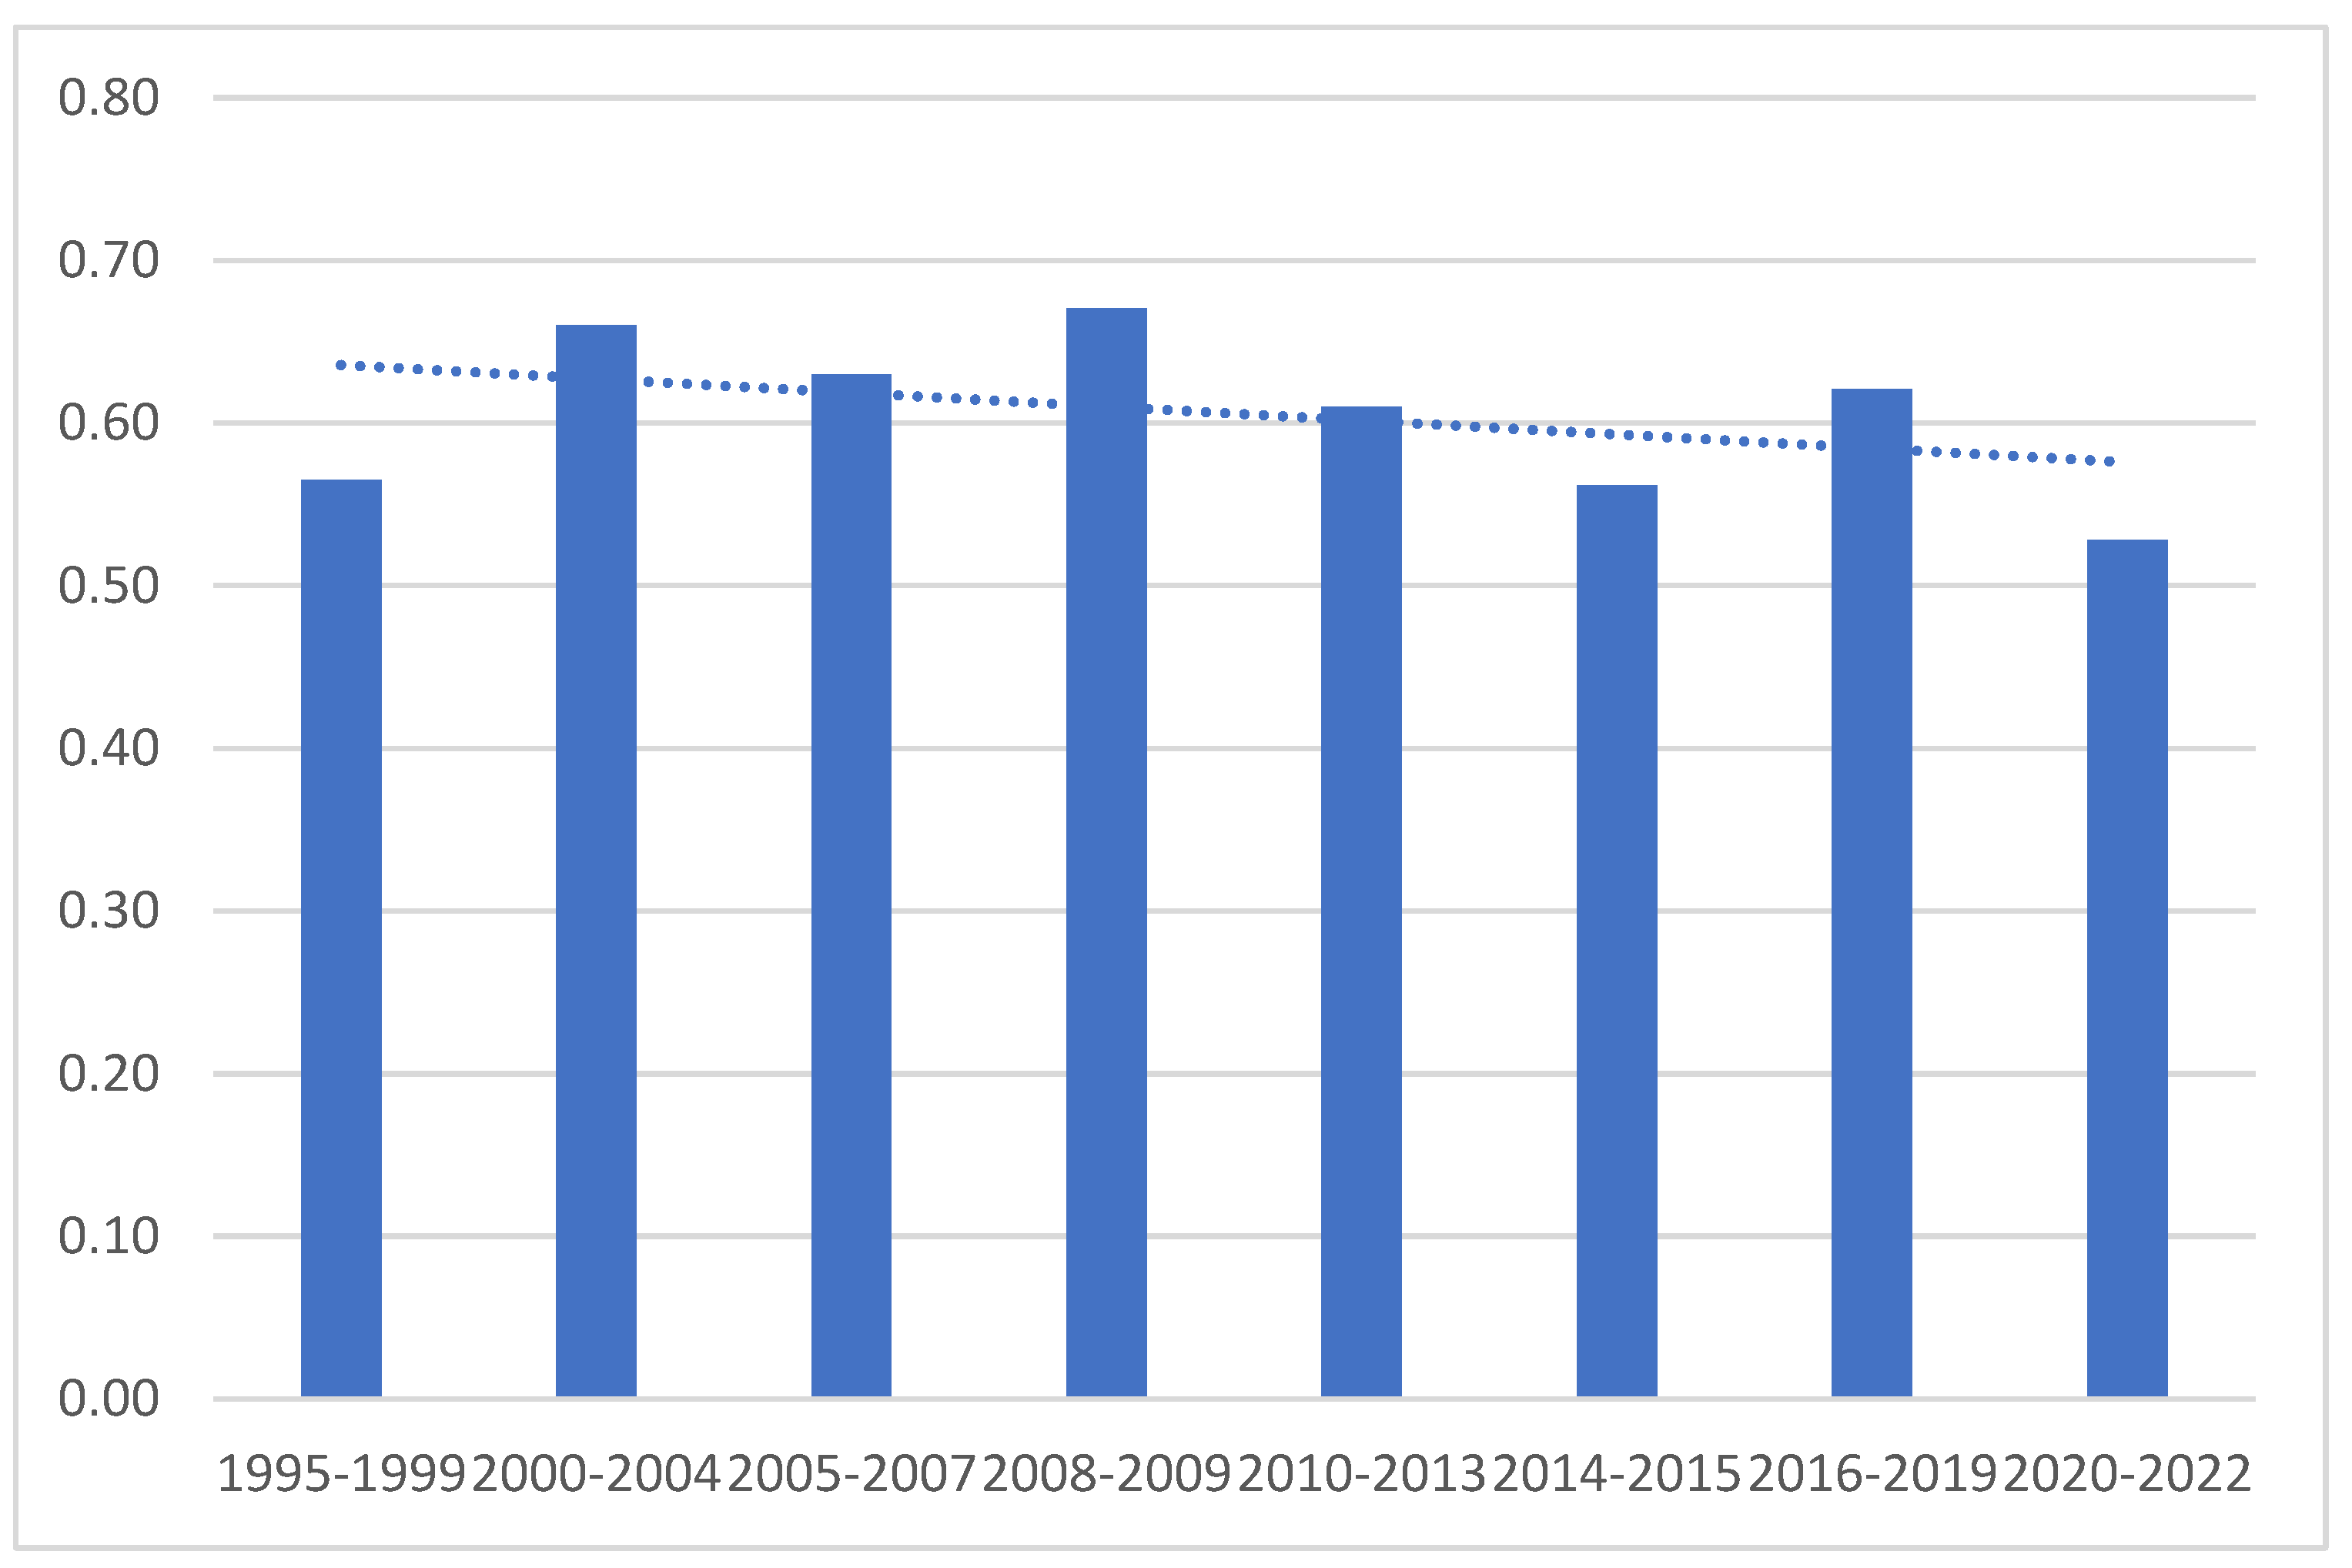
Figure 3.
Average Daily Price Fluctuations in the Ukrainian Stock Market by Day of the Week.
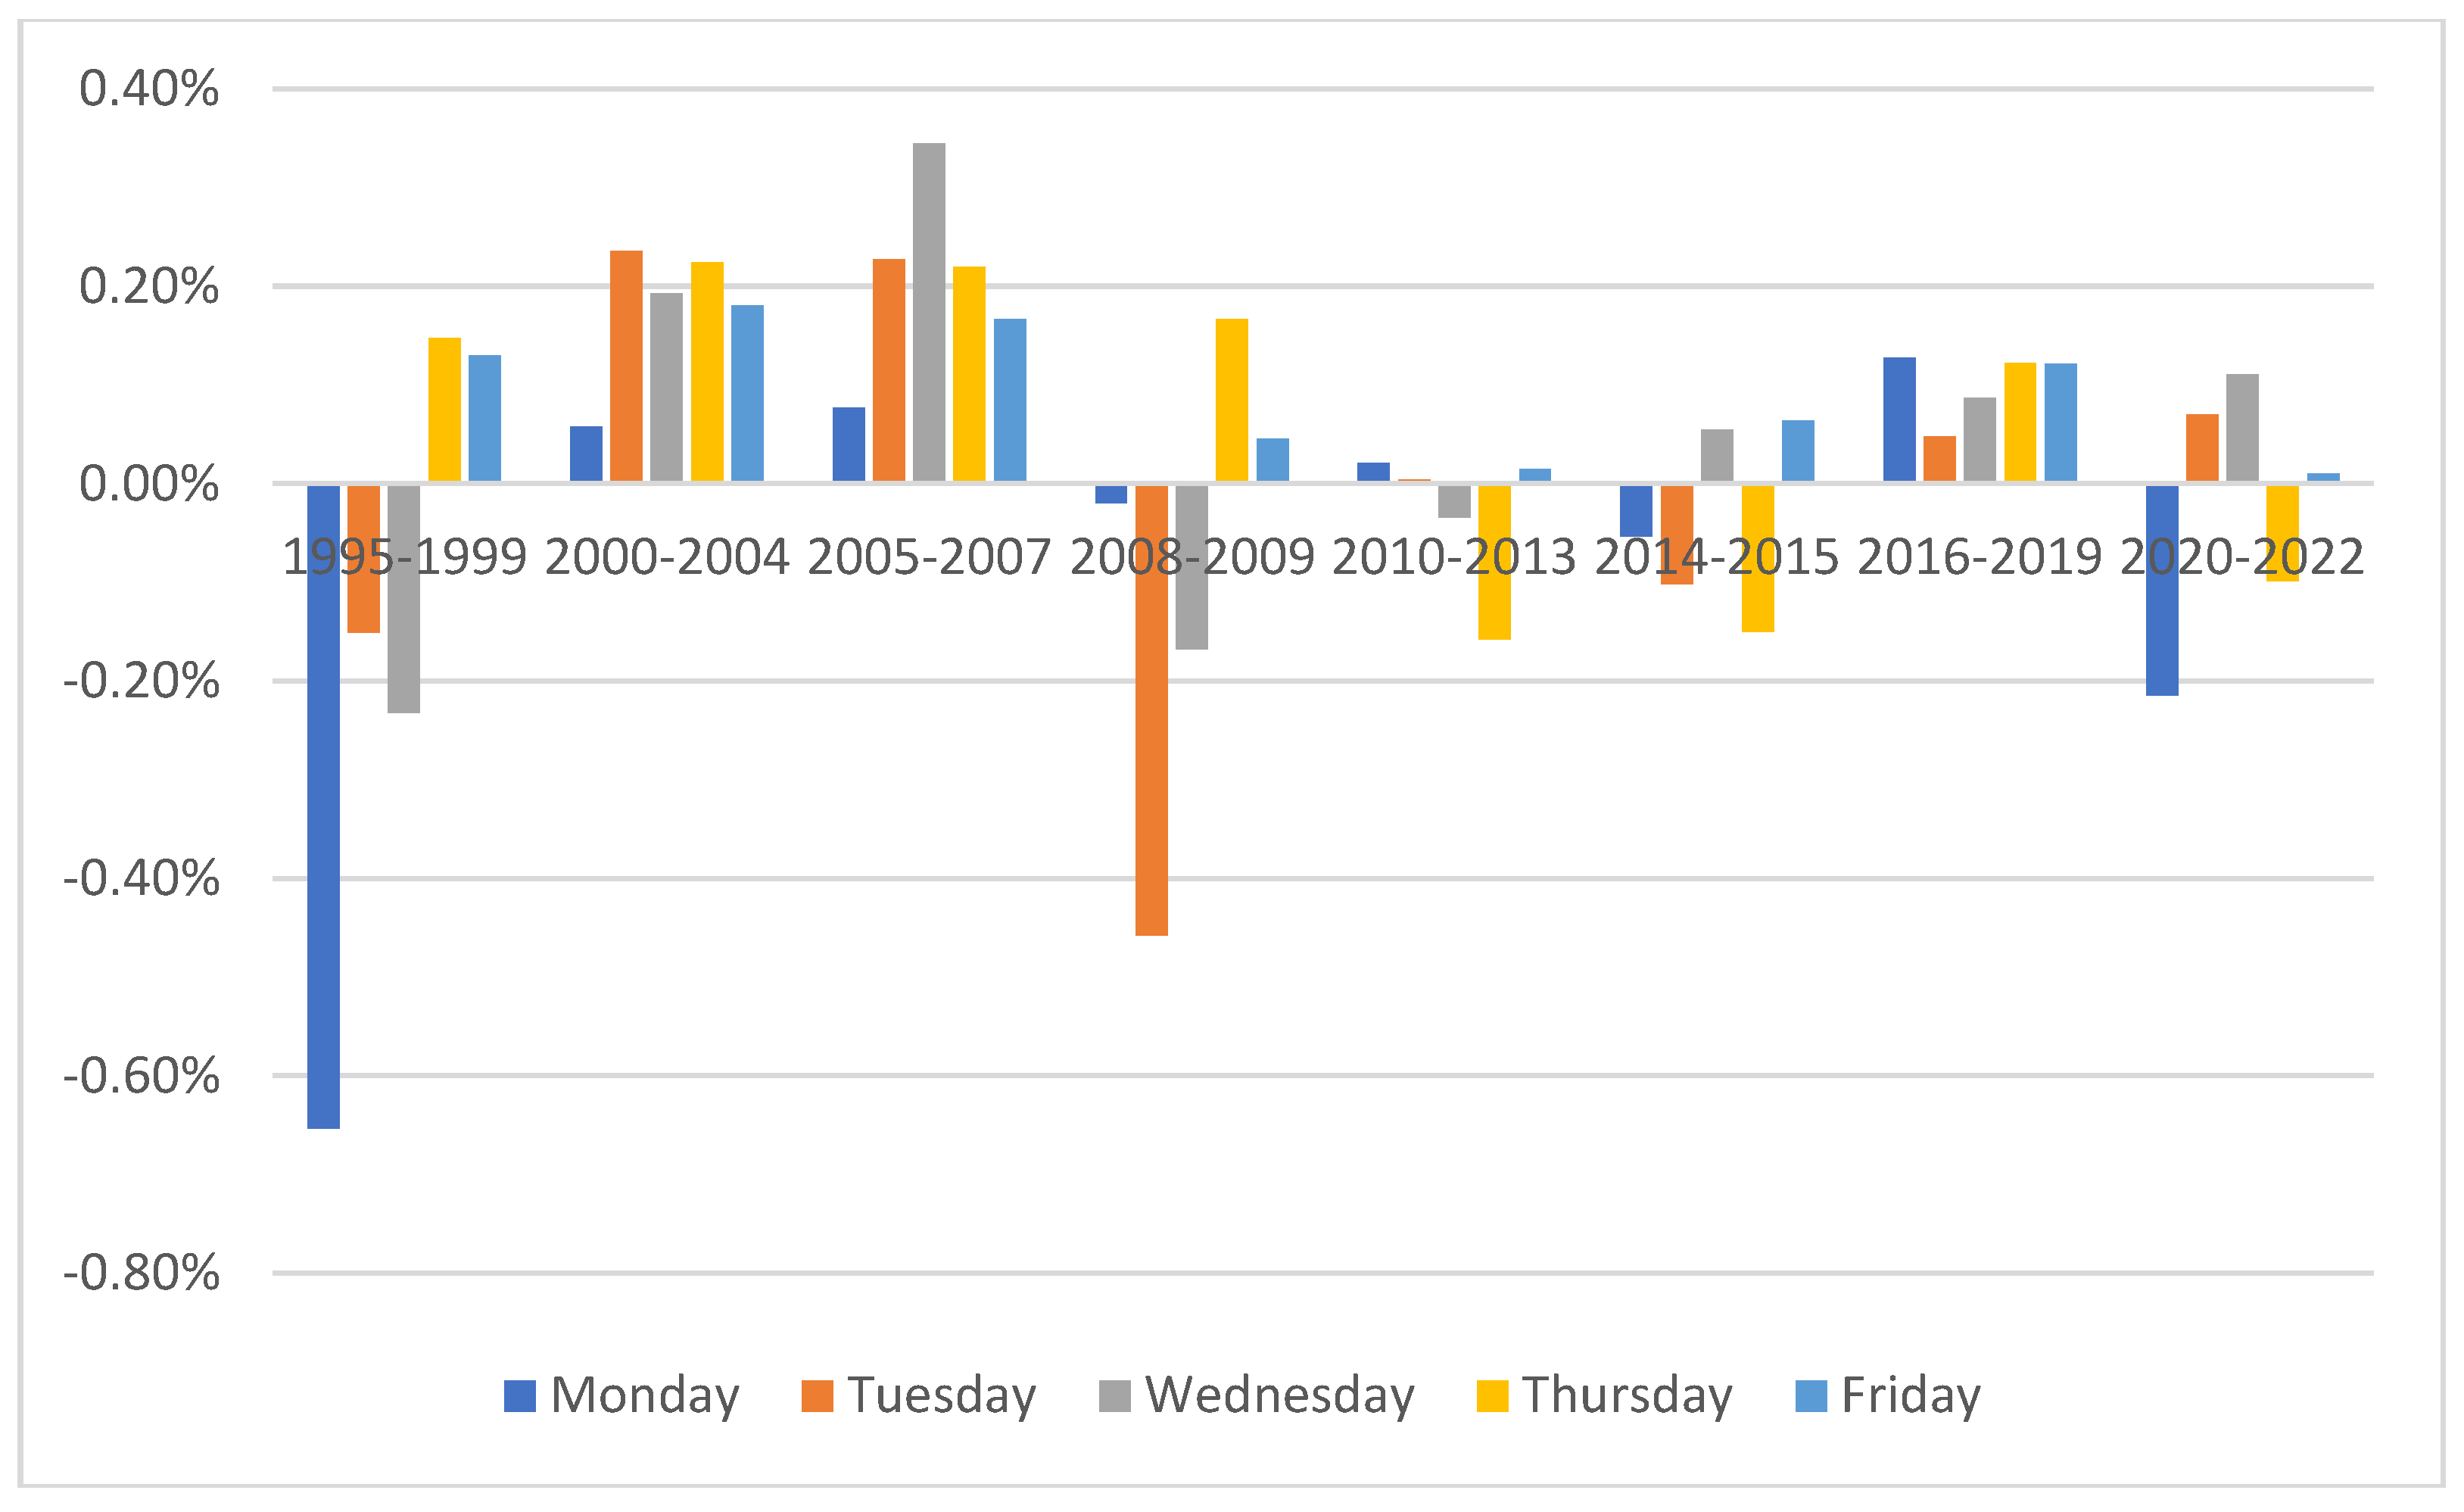
Figure 4.
Average daily returns in the Ukrainian stock market for the period 2020-2022: the case of days of the week.
Figure 4.
Average daily returns in the Ukrainian stock market for the period 2020-2022: the case of days of the week.
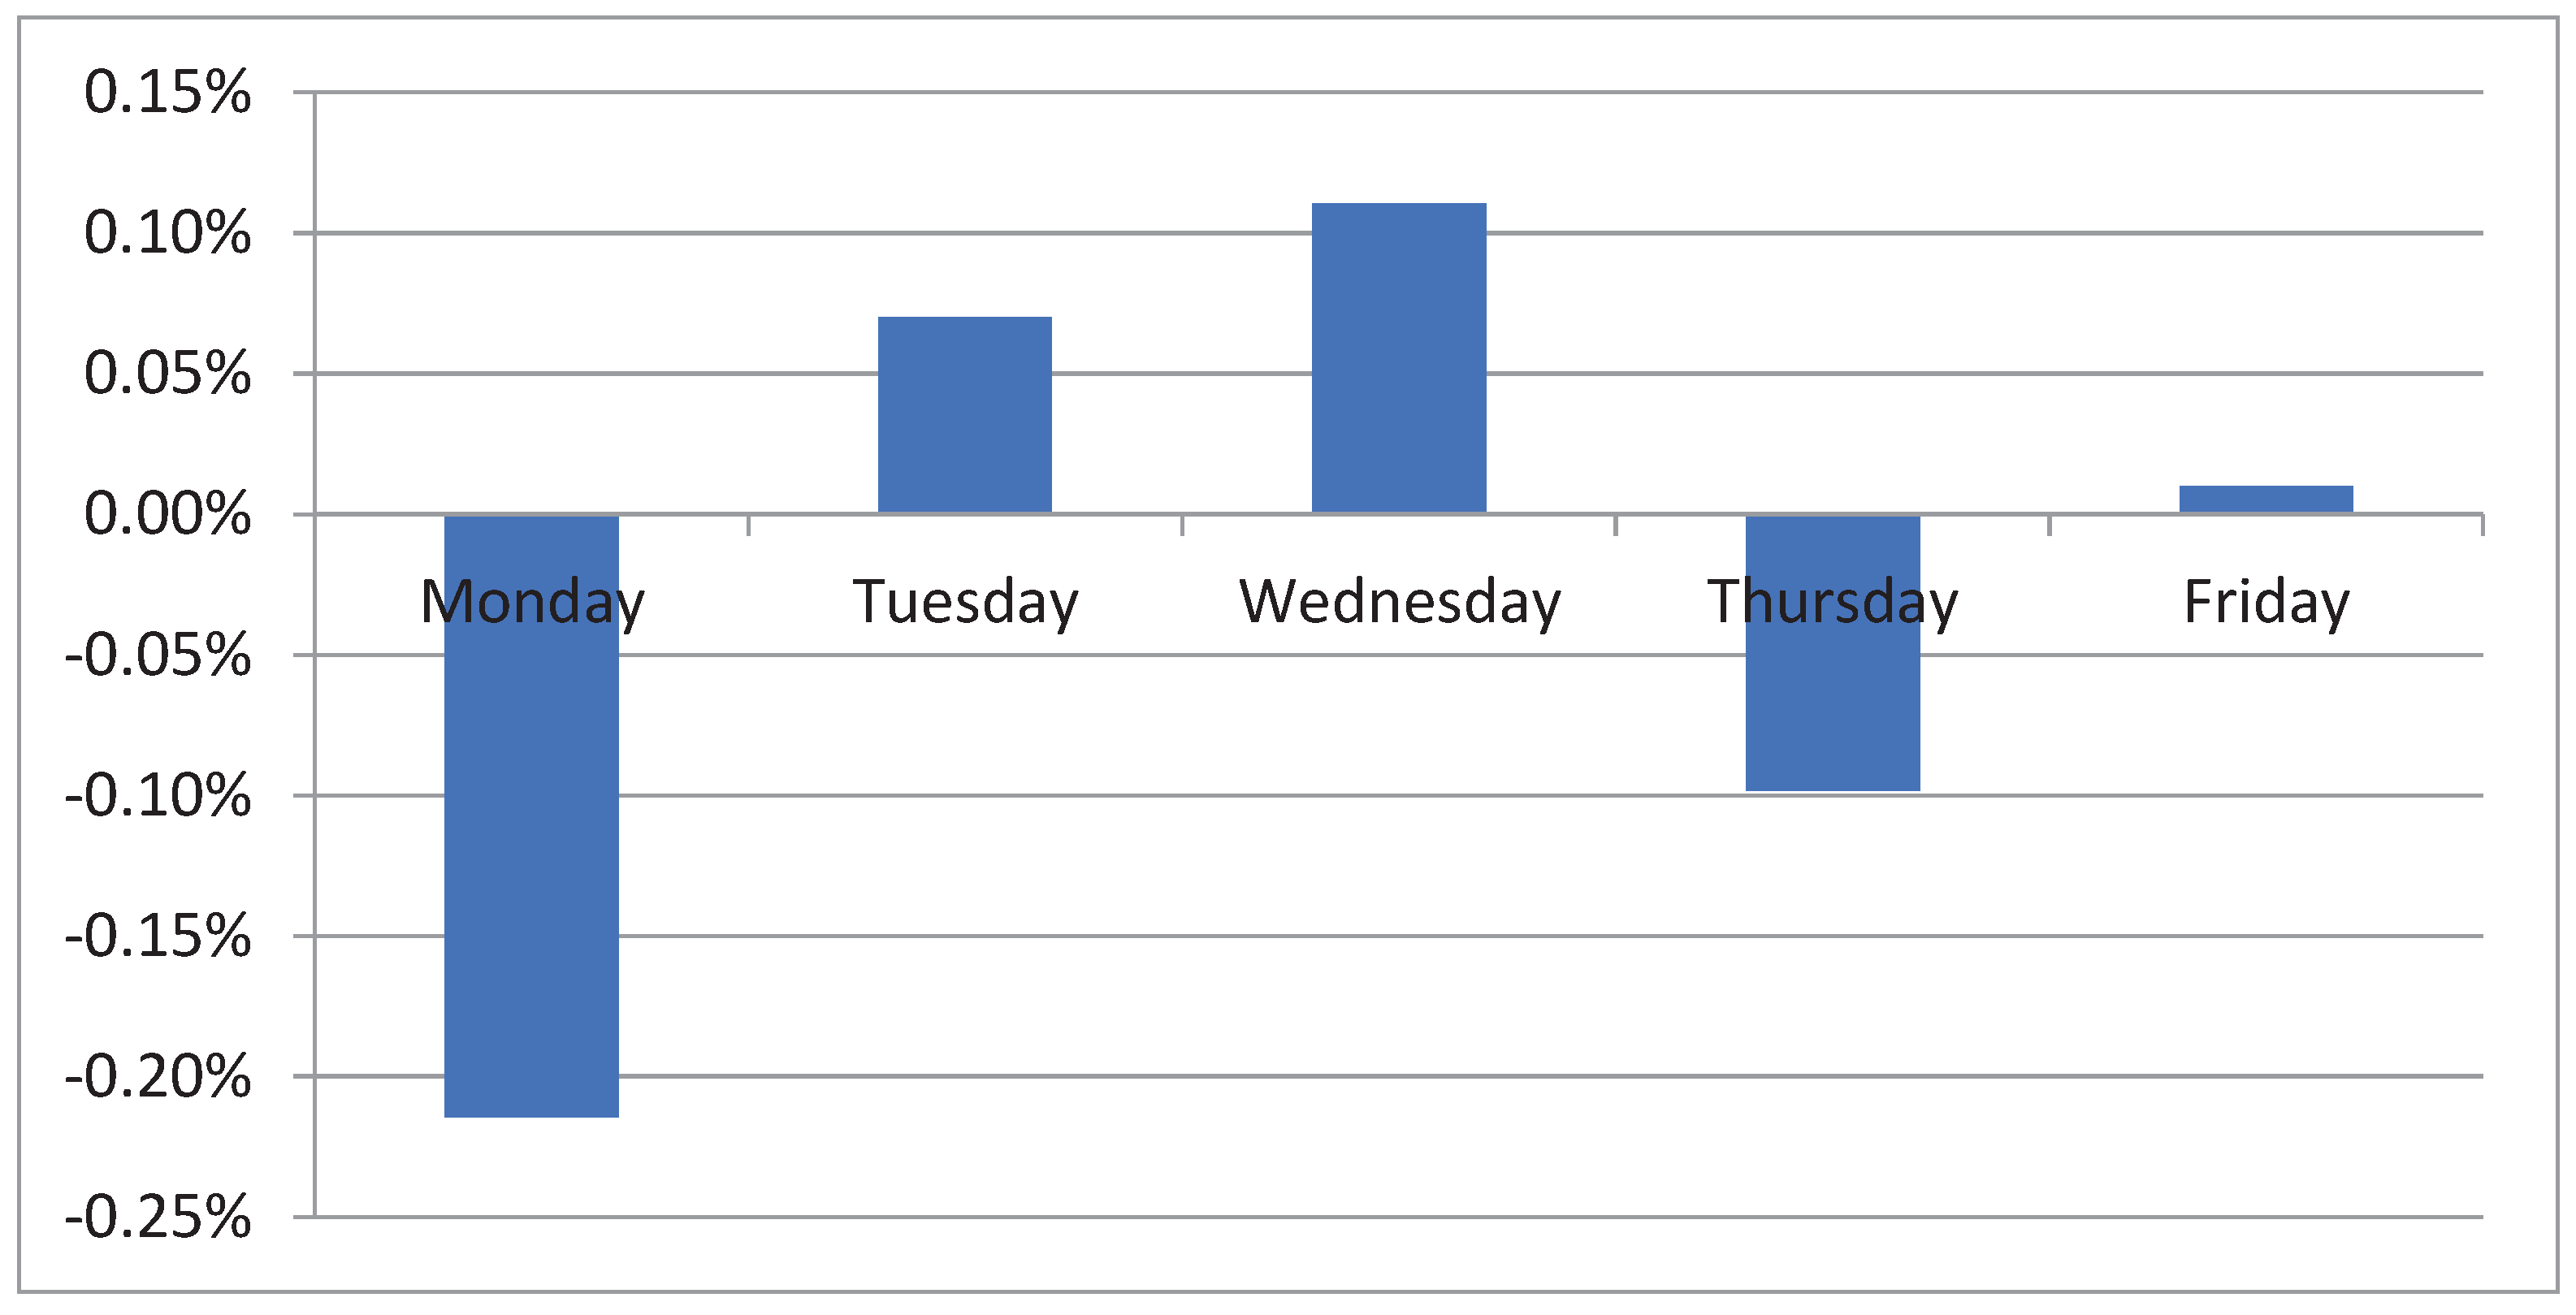

Table 1.
Descriptive statistics for all data and sub-period: the case of the Ukrainian stock market.
Table 1.
Descriptive statistics for all data and sub-period: the case of the Ukrainian stock market.
| Parameter | All data | 1995-1999 | 2000-2004 | 2005-2007 | 2008-2009 | 2010-2013 | 2014-2015 | 2016-2019 | 2020-2022 |
| Average | 0.05% | -0.13% | 0.18% | 0.21% | -0.09% | -0.02% | -0.04% | 0.10% | -0.02% |
| Standard error | 0.03% | 0.14% | 0.06% | 0.05% | 0.13% | 0.07% | 0.09% | 0.04% | 0.07% |
| Median | 0.06% | 0.10% | 0.10% | 0.19% | -0.10% | -0.04% | -0.05% | 0.06% | 0.03% |
| Standard deviation | 2.06% | 3.12% | 2.03% | 1.47% | 2.96% | 2.13% | 1.90% | 1.24% | 1.59% |
| Sample variance | 0.04% | 0.10% | 0.04% | 0.02% | 0.09% | 0.05% | 0.04% | 0.02% | 0.03% |
| Excess | 10.54 | 4.13 | 17.16 | 3.79 | 3.48 | 9.60 | 12.90 | 6.13 | 5.37 |
| Asymmetry | 0.00 | -0.64 | 1.01 | -0.26 | -0.05 | 0.32 | 0.66 | -0.09 | -0.27 |
| Interval | 38.05% | 26.57% | 37.25% | 13.40% | 24.76% | 29.83% | 26.94% | 15.68% | 18.37% |
| Minimum | -15.90% | -15.90% | -15.11% | -6.94% | -12.37% | -11.62% | -11.73% | -7.99% | -8.45% |
| Maximum | 22.15% | 10.67% | 22.15% | 6.46% | 12.38% | 18.21% | 15.21% | 7.69% | 9.92% |
| Count | 5895 | 526 | 1231 | 736 | 494 | 992 | 492 | 860 | 570 |
Table 2.
Results of ANOVA analysis and Kruskal-Wallis Tests for statistical differences between periods in the Ukrainian Stock Market.
Table 2.
Results of ANOVA analysis and Kruskal-Wallis Tests for statistical differences between periods in the Ukrainian Stock Market.
| Method | Value | p-value | Difference is statistically significant |
| ANOVA analysis | 2.67 | 0.01 | Yes |
| Kruskal-Wallis Tests | 25.22 | 0.00 | Yes |
Table 3.
Results of t-tests for statistical differences between periods in the Ukrainian stock market.
Table 3.
Results of t-tests for statistical differences between periods in the Ukrainian stock market.
| Period | t-criterion | t-critical (0.95) | Null hypothesis | Difference |
| 1995-1999 | 1.24 | 1.96 | Not rejected | absent |
| 2000-2004 | 0.87 | 1.96 | Not rejected | absent |
| 2005-2007 | 3.53 | 1.96 | Rejected | present |
| 2008-2009 | 0.82 | 1.96 | Not rejected | absent |
| 2010-2013 | 0.99 | 1.96 | Not rejected | absent |
| 2014-2015 | 0.54 | 1.96 | Not rejected | absent |
| 2016-2019 | 1.50 | 1.96 | Not rejected | absent |
| 2020-2022 | 0.97 | 1.96 | Not rejected | absent |
Table 4.
Results of ANOVA analysis for statistical differences between periods in the Ukrainian stock market.
Table 4.
Results of ANOVA analysis for statistical differences between periods in the Ukrainian stock market.
| Period | F | p-value | F critical | Null hypothesis | Difference |
| 1995-1999 | 1.55 | 0.21 | 3.85 | Not rejected | absent |
| 2000-2004 | 0.75 | 0.39 | 3.85 | Not rejected | absent |
| 2005-2007 | 12.50 | 0.00 | 3.85 | Rejected | present |
| 2008-2009 | 0.68 | 0.41 | 3.85 | Not rejected | absent |
| 2010-2013 | 0.99 | 0.32 | 3.85 | Not rejected | absent |
| 2014-2015 | 0.29 | 0.59 | 3.85 | Not rejected | absent |
| 2016-2019 | 2.26 | 0.13 | 3.85 | Not rejected | absent |
| 2020-2022 | 0.95 | 0.33 | 3.85 | Not rejected | absent |
Table 5.
Results of the Mann-Whitney tests for statistical differences between different periods for the case of the Ukrainian stock market.
Table 5.
Results of the Mann-Whitney tests for statistical differences between different periods for the case of the Ukrainian stock market.
| Period | Adjusted H | d.f. | p-value | Critical value | Null hypothesis | Difference |
| 1995-1999 | 0.09 | 1 | 0.77 | 3.84 | Not rejected | absent |
| 2000-2004 | 0.27 | 1 | 0.60 | 3.84 | Not rejected | absent |
| 2005-2007 | 18.90 | 1 | 0.00 | 3.84 | Rejected | present |
| 2008-2009 | 1.63 | 1 | 0.20 | 3.84 | Not rejected | absent |
| 2010-2013 | 2.05 | 1 | 0.15 | 3.84 | Not rejected | absent |
| 2014-2015 | 0.45 | 1 | 0.50 | 3.84 | Not rejected | absent |
| 2016-2019 | 3.05 | 1 | 0.08 | 3.84 | Not rejected | absent |
| 2020-2022 | 0.35 | 1 | 0.56 | 3.84 | Not rejected | absent |
Table 6.
Results of the regression analysis with dummy variables for statistical differences between periods in the Ukrainian stock market.
Table 6.
Results of the regression analysis with dummy variables for statistical differences between periods in the Ukrainian stock market.
| Period | F | p-value | Variable X1 | p-value X1 | Difference |
| 1995-1999 | 1.55 | 0.21 | -0.0017 | 0.21 | absent |
| 2000-2004 | 0.75 | 0.38 | 0.0006 | 0.38 | absent |
| 2005-2007 | 12.50 | 0.00 | 0.0022 | 0.00 | present |
| 2008-2009 | 0.67 | 0.41 | -0.0011 | 0.41 | absent |
| 2010-2013 | 0.98 | 0.32 | -0.0008 | 0.32 | absent |
| 2014-2015 | 0.29 | 0.59 | -0.0005 | 0.59 | absent |
| 2016-2019 | 2.25 | 0.13 | 0.0008 | 0.13 | absent |
| 2020-2022 | 0.94 | 0.33 | -0.0007 | 0.33 | absent |
Table 7.
Results of the persistence analysis for the case of the Ukrainian stock market in different periods.
Table 7.
Results of the persistence analysis for the case of the Ukrainian stock market in different periods.
| Period | Hurst exponent | p-value | Confidence interval (95%) | Type of data |
| All data | 0.65 | 0.00 | 0.63-0.66 | persistent |
| 1995-1999 | 0.56 | 0.00 | 0.44-0.69 | persistent |
| 2000-2004 | 0.66 | 0.00 | 0.64-0.68 | persistent |
| 2005-2007 | 0.63 | 0.00 | 0.60-0.66 | persistent |
| 2008-2009 | 0.67 | 0.00 | 0.63-0.71 | persistent |
| 2010-2013 | 0.61 | 0.00 | 0.58-0.63 | persistent |
| 2014-2015 | 0.56 | 0.00 | 0.54-0.58 | persistent |
| 2016-2019 | 0.62 | 0.00 | 0.61-0.63 | persistent |
| 2020-2022 | 0.53 | 0.00 | 0.49-0.57 | random |
Table 8.
Kurtosis and skewness of data for different periods in the Ukrainian stock market.
| Period | Kurtosis | Skewness |
| All data | 10.54 | 0.00 |
| 1995-1999 | 4.13 | -0.64 |
| 2000-2004 | 17.16 | 1.01 |
| 2005-2007 | 3.79 | -0.26 |
| 2008-2009 | 3.48 | -0.05 |
| 2010-2013 | 9.60 | 0.32 |
| 2014-2015 | 12.90 | 0.66 |
| 2016-2019 | 6.13 | -0.09 |
| 2020-2022 | 5.37 | -0.27 |
Table 9.
Kolmogorov-Smirnov test for different periods in the Ukrainian stock market.
| Period | Statistic | d.f. | p-value |
| 1995-1999 | 0.123 | 492 | 0.000 |
| 2000-2004 | 0.082 | 492 | 0.000 |
| 2005-2007 | 0.071 | 492 | 0.000 |
| 2008-2009 | 0.094 | 492 | 0.000 |
| 2010-2013 | 0.100 | 492 | 0.000 |
| 2014-2015 | 0.089 | 492 | 0.000 |
| 2016-2019 | 0.086 | 492 | 0.000 |
| 2020-2022 | 0.060 | 492 | 0.000 |
Table 10.
Testing the statistical significance of day-of-the-week effects: t-tests.
| Period | t-criterion (t-critical (0.95) = 1.96) | Null hypothesis | Difference | ||||
| Monday | Tuesday | Wednesday | Thursday | Friday | |||
| 1995-1999 | -1.66 | -0.04 | -0.32 | 1.17 | 1.02 | Not rejected | absent |
| 2000-2004 | -1.17 | 0.47 | 0.12 | 0.37 | 0.00 | Not rejected | absent |
| 2005-2007 | -1.17 | 0.17 | 1.27 | 0.11 | -0.37 | Not rejected | absent |
| 2008-2009 | 0.22 | -1.21 | -0.35 | 0.98 | 0.58 | Not rejected | absent |
| 2010-2013 | 0.35 | 0.26 | -0.02 | -0.98 | 0.37 | Not rejected | absent |
| 2014-2015 | -0.06 | -0.37 | 0.63 | -0.75 | 0.74 | Not rejected | absent |
| 2016-2019 | 0.33 | -0.62 | -0.17 | 0.22 | 0.28 | Not rejected | absent |
| 2020-2022 | -1.21 | 0.70 | 0.96 | -0.66 | 0.22 | Not rejected | absent |
Table 11.
Testing the statistical significance of day-of-the-week effects: ANOVA analysis.
| Period | F | p-value | F critical | Null hypothesis | Difference |
| 1995-1999 | 1.12 | 0.35 | 2.39 | Not rejected | absent |
| 2000-2004 | 0.29 | 0.89 | 2.38 | Not rejected | absent |
| 2005-2007 | 0.64 | 0.64 | 2.38 | Not rejected | absent |
| 2008-2009 | 0.66 | 0.62 | 2.39 | Not rejected | absent |
| 2010-2013 | 0.24 | 0.91 | 2.38 | Not rejected | absent |
| 2014-2015 | 0.25 | 0.91 | 2.39 | Not rejected | absent |
| 2016-2019 | 0.13 | 0.97 | 2.38 | Not rejected | absent |
| 2020-2022 | 0.76 | 0.55 | 2.39 | Not rejected | absent |
Table 12.
Testing the statistical significance of day-of-the-week effects: Kruskal-Wallis Tests.
| Period | Adjusted H | d.f. | P-value | Critical value | Null hypothesis | Difference |
| 1995-1999 | 5.95 | 4 | 0.20 | 9.49 | Not rejected | absent |
| 2000-2004 | 3.97 | 4 | 0.41 | 9.49 | Not rejected | absent |
| 2005-2007 | 2.88 | 4 | 0.58 | 9.49 | Not rejected | absent |
| 2008-2009 | 1.74 | 4 | 0.78 | 9.49 | Not rejected | absent |
| 2010-2013 | 1.63 | 4 | 0.80 | 9.49 | Not rejected | absent |
| 2014-2015 | 1.36 | 4 | 0.85 | 9.49 | Not rejected | absent |
| 2016-2019 | 0.98 | 4 | 0.91 | 9.49 | Not rejected | absent |
| 2020-2022 | 9.76 | 4 | 0.04 | 9.49 | rejected | present |
Table 13.
ANOVA analysis for the case of the day-of-the-week effects in the Ukrainian stock market during the period 2020-2022.
Table 13.
ANOVA analysis for the case of the day-of-the-week effects in the Ukrainian stock market during the period 2020-2022.
| Day | F | p-value | F critical | Null hypothesis | Difference |
| Monday | 2.59 | 0.11 | 3.89 | Not rejected | absent |
| Tuesday | 1.92 | 0.17 | 3.89 | Not rejected | absent |
| Wednesday | 1.06 | 0.30 | 3.89 | Not rejected | absent |
| Thursday | 0.36 | 0.55 | 3.89 | Not rejected | absent |
| Friday | 0.03 | 0.86 | 3.89 | Not rejected | absent |
Table 14.
Mann-Whitney tests for the case of the day-of-the-week effects in the Ukrainian stock market during the period 2020-2022.
Table 14.
Mann-Whitney tests for the case of the day-of-the-week effects in the Ukrainian stock market during the period 2020-2022.
| Day | Adjusted H | d.f. | P-value | Critical value | Null hypothesis | Difference |
| Monday | 6.27 | 1 | 0.01 | 3.84 | rejected | present |
| Tuesday | 2.39 | 1 | 0.12 | 3.84 | Not rejected | absent |
| Wednesday | 5.04 | 1 | 0.02 | 3.84 | rejected | present |
| Thursday | 0.22 | 1 | 0.64 | 3.84 | Not rejected | absent |
| Friday | 0.00 | 1 | 0.98 | 3.84 | Not rejected | absent |
Disclaimer/Publisher’s Note: The statements, opinions and data contained in all publications are solely those of the individual author(s) and contributor(s) and not of MDPI and/or the editor(s). MDPI and/or the editor(s) disclaim responsibility for any injury to people or property resulting from any ideas, methods, instructions or products referred to in the content. |
© 2024 by the authors. Licensee MDPI, Basel, Switzerland. This article is an open access article distributed under the terms and conditions of the Creative Commons Attribution (CC BY) license (http://creativecommons.org/licenses/by/4.0/).
Copyright: This open access article is published under a Creative Commons CC BY 4.0 license, which permit the free download, distribution, and reuse, provided that the author and preprint are cited in any reuse.


