
Submitted:
06 March 2024
Posted:
06 March 2024
You are already at the latest version
Abstract
This study explores optimizing Synthetic Aperture Radar (SAR) satellite constellation scheduling for multi-imaging missions in densely targeted areas using an in-house developed Modified Dynamic Programming (MDP) algorithm. By employing Mixed-Integer Linear Programming (MILP) to define the mission planning problem, the research aims to maximize observation of high-value targets within restricted planning horizons. Numerical simulations, covering a wide range of target numbers and satellite configurations, reveal the MDP algorithm’s superior mission allocation efficiency, enhanced success rates, and reduced revisit times, compared to the Greedy algorithm. The findings underscore the MDP algorithm’s improved operational efficiency and planning robustness for complex imaging tasks, demonstrating significant advancements over traditional approaches.
Keywords:
Optimal scheduling
; Synthetic Aperture Radar (SAR)
; Satellite constellation
; Multi-imaging mission
; High-density regional area
; Modified Dynamic Programming (MDP)
1. Introduction
Remote sensing technologies, particularly satellite-based systems, have revolutionized various sectors, offering unparalleled data for applications like environmental monitoring, urban planning, and disaster management [1]. A significant advantage of satellite-based Earth observation is its capability to operate uninhibited by international borders, providing a comprehensive geographical coverage in a single observational pass. Such an extensive array of applications has led to an ever-increasing demand for Earth observation missions, driving the projected market value close to 9 billion dollars by 2027 [2]. Synthetic Aperture Radar (SAR) sensors stand out as versatile tools within this domain. Unlike optical counterparts confined to the visible spectrum, SAR sensors offer a wider range of wavelengths, enabling high-resolution imaging across varying atmospheric conditions. This versatility allows for diverse applications, ranging from hydrological mapping to environmental monitoring [3].
A noticeable paradigm shift in satellite deployment focuses on constellations of smaller satellites instead of a few large platforms [4]. This transition is fueled by diversified mission requirements, including the demand for higher temporal resolutions like shorter revisit times, and the inherent advantages of small satellites such as modularity, cost-efficiency, and shorter development cycles. South Korea aligns well with this global trend, planning to deploy small satellites comprising over 130 units by 2030 [5,6]. Internationally, entities like Finland’s ICEYE and the United States’ Capella Space have already successfully deployed SAR satellite constellations, underlining the global consensus on their utility and efficiency.
Following this trend, there is an increased complexity and frequency in mission planning. For instance, while a sun-synchronous orbiting large satellite may revisit the Korean Peninsula every 12 hours, a constellation of 40 smaller satellites in inclined orbits could accomplish this in intervals as brief as 30 minutes [7]. This augmented observational capability necessitates a corresponding increase in planning intricacy. Traditional approaches of programming each satellite’s mission individually are becoming impractical due to the required human resources. Furthermore, advancements in satellite attitude control technologies have led to highly maneuverable platforms, while payload enhancements enable a diverse range of imaging modes for Earth observation [8].
In addition to the agility of these satellites, advancements in payload sensor technology now allow for more versatile observational strategies. Previously, focus was placed on observing a single target or area. However, recent developments enable multiple imaging modes, such as multi-stripmap or spotlight mode, allowing for the capture of multiple targets in a single pass as shown Figure 1. These capabilities, combined with the aforementioned advancements, add layers of complexity to the mission planning process and emphasize the crucial need for optimized strategies for the entire satellite constellation [9].
Literature Review
Optimized mission planning in satellite operations has attracted significant scholarly attention, leading to a variety of research methodologies. While traditional mathematical models often rely on Mixed-Integer Linear Programming (MILP) [10] and make use of established solvers like Gurobi, CPLEX and Xpress, they also explore algorithms such as Branch-and-Bound (BB) [11] and Dynamic Programming (DP) [12]. These approaches have been tailored to suit different satellite configurations, including both agile [13] and non-agile types [14], as well as to interact with ground stations [15]. In addition to MILP-based studies, meta-heuristic methods like Genetic Algorithms (GA) [16,17,18], Ant Colony Optimization (ACO) [19], and Particle Swarm Optimization (PSO) [20] have gained traction for complex scenarios, especially those requiring rapid response, such as natural disasters [21]. With the rise of Artificial Intelligence (AI), the field has seen a paradigm shift towards utilizing machine learning algorithms. Deep Reinforcement Learning (DRL) [22,23,24], in particular, is carving a niche for itself, offering enhanced capabilities in autonomous mission planning and a wide range of applications from online scheduling [25] to Agile Earth Observation Satellite (AEOS) planning [26]. In addition, the research landscape for satellite mission planning has evolved to address the distinctive challenges presented by satellite clusters. Recent studies have taken steps to optimize mission planning for satellite constellation, acknowledging their rising significance in space missions. Iacopino et al. [27] introduced the Mission Planning System (MPS), developed by Surrey Satellite Technology Ltd (SSTL), as a tool for planning Electro-Optical (EO) imaging tasks for small clusters of satellites. Moreover, Zheng et al. [28] extended optimization techniques to satellite swarms, specifically for onboard scheduling via a Hybrid Dynamic Mutation Genetic Algorithm (HDMGA). Furthermore, Cui and Zhang [29] tackled the problem of scheduling and assigning imaging missions and emergency tasks for clusters of up to five satellites with varying target priorities, ranging from 25 to 200. Lewis [30], on the other hand, utilized weighted-sums optimization algorithms to optimize mission planning for cubesat clusters.
Existing research has provided valuable methodologies for optimizing mission planning for a limited number of individual satellites, particularly in the context of Earth imaging and communication objectives. However, there is a relative scarcity of research focused on satellite constellations, aligning with the recent trend in satellite development. Additionally, the current body of work often relies on widely used meta-heuristic algorithms [16,17,18,19,20,21] for mission planning optimization. These algorithms, while effective in certain scenarios, tend to fall into local optima and lack consistency in producing identical results in each iteration. Furthermore, the emerging DRL based algorithms [22,23,24,25,26], though beneficial for their real-time computation capabilities, encounter inherent limitations in untrained areas, struggling to rectify inappropriate solutions, which poses a challenge for immediate application in high-robustness required ground station mission planning subsystems. This highlights a significant gap in the existing research, particularly in addressing mission planning scenarios involving numerous targets densely distributed within specific regional areas.
Recognizing these limitations, our research offers three contributions that aim to bridge these gaps. First, it broadens the scope of mission planning optimization to encompass satellite clusters, with a specific emphasis on South Korea’s emerging small SAR satellite constellation that has been relatively underexplored in the realm of satellite mission planning research. Second, we employ a Modified Dynamic Programming (MDP) algorithm, developed in-house [31], that surpasses traditional methods in adaptability to time-varying conditions and ensures the optimal solutions while effectively managing dynamic constraints. Lastly, our work uniquely focuses on the optimization of multi-imaging mission scheduling for high-density target regions with varying levels of significance and urgency, a challenging scenario in satellite mission planning. In summary, our research offers both a theoretical framework and practical applications for optimizing complex SAR satellite constellation operations, delivering actionable insights and robust solutions.
The remainder of this paper is organized as follows: Section 2 provides an overarching framework of the imaging mission, elaborating on the mathematical models that encapsulate the problem under study. In Section 3, we developed into the optimization algorithms, with a particular focus on the MDP algorithm developed by our team. For comparative analysis, this section will also introduce the widely-utilized Greedy algorithm as the heuristic approach employed in this paper. Section 4 delineates the numerical simulation scenarios and presents the resultant findings. Lastly, Conclusions Section 5 offer concluding remarks and outlines potential avenues for future research.
2. Problem Definition
2.1. Imaging Mission Description
In this study, the concept of an "Imaging Mission" is expanded to include a comprehensive series of processes in Earth observation satellite operations. This encompasses not only the remote sensing tasks where satellites equipped with sensors capture images of designated terrestrial regions, but also the entire sequence of steps from initial user request to the final delivery of processed images. This intricate process is initiated with the user’s requirements, which detail the desired area for observation, level of importance, resolution, and other specifications. These requirements are then compiled and conveyed to the ground station. At the ground station, an initial Imaging Acquisition Plan is formulated, taking into account the user’s needs. Following this, a comprehensive review of the satellite’s orbit and status information is conducted to establish an optimized imaging mission plan. As depicted in Figure 2, the process flow is represented by various colored lines: the blue line denotes the flow of user requirements, while the green line indicates the flow of information about the satellite, such as its orbit and status. These elements are integrated in the Mission Scheduling Subsystem to develop an optimized imaging mission plan, which is then communicated to the satellite via S-band telemetry. Once the imaging plan is received, a cluster of satellites executes the mission as per the instructions and transmits the raw data back to the ground station using X-band communication, illustrated by the red line in Figure 2. This data undergoes a series of corrections and post-processing steps before being rendered as a calibrated image product, ready for delivery to the user. The focus of this paper is primarily on the integration of user requirements with satellite information to establish an optimal imaging mission plan for satellite constellation, ensuring that the entire imaging mission is conducted efficiently, meeting the specific needs of the users.
2.2. Problem Modeling
This chapter describes how key subsystems are mathematically modeled for optimal scheduling, based on the imaging mission flow as depicted in Figure 2. Table 1 summarizes the definitions of the variables used in the modeling.
2.2.1. User Requests
Satellite imaging missions commence with user requests, and in the scheduling of these missions, the requirements of the users are the most critical considerations. Therefore, the foremost factor to prioritize in mission scheduling is the parameters related to the targets requested for imaging by the users. In this study, "significance " is a measure that reflects the hierarchy of importance of the targets desired for imaging from the user’s standpoint, while "urgency " indicates the time sensitivity concerning the user’s need for images of the target. To enhance our mission scheduling approach, we adopt the Eisenhower Matrix [32] as a guiding framework in Figure 3. This matrix, dividing tasks based on their significance and urgency, creates a comprehensive 9-cell grid, each cell representing a combination of low, medium, and high levels of these two dimensions. The profit derived from imaging a target is then determined by combining the target’s significance and urgency with the weighting factors . This enables a nuanced prioritization of imaging tasks, facilitating a strategic allocation of satellite imaging resources to address the most pressing and significant targets first. This strategic application of the matrix is expressed in the following Eq. (1):
2.2.2. Satellite Information
The performance of available satellites and payloads, as well as orbital information, are also very important considerations in making imaging schedules. In this study, the satellite is a small satellite under 500kg equipped with an active phased array SAR sensor. The satellite’s orbital motion is simulated using the J2 Perturbation propagator in the Systems Tool Kit (STK) program, forming a Walker Delta constellation with a total of 40 satellites. More specific parameters will be mentioned in Subsection 4.1, Test scenario. There are two assumptions related to the satellite in this study: 1. It is assumed that communication between the ground station and the satellite for transmission and reception is out of research scope, and that the satellite has already received the imaging scheduling command. 2. Contingencies such as functional failures of available satellites are not considered, and it is assumed that all satellites are operating normally.
2.2.3. Visible Time Window (VTW)
In this study, the concept of a Visible Time Window (VTW) is introduced to define the feasible opportunities for imaging a target with a specific satellite, based on the user request and satellite information data. Figure 4 illustrates a scenario where a single satellite aims to capture images of 1,000 targets over a 7-day period. Derived using the STK software, these VTWs serve as crucial input parameters for optimization algorithms, which are tasked with formulating the most efficient imaging scheduling strategy. The analysis reveals that, on average, approximately 1,000 VTWs are generated each day, culminating in nearly 7,000 VTWs over the course of a week. This data suggests a proportional increase in VTWs with more satellites, a greater number of targets, and longer scheduling periods. Consequently, the effective application of optimization algorithms becomes increasingly essential to establish efficient imaging schedules, highlighting their critical role in managing the growing number of VTWs.
2.2.4. Objective Function
The mission planning problem for satellites is mathematically modeled using the Mixed Integer Linear Programming (MILP) approach, which has been employed in previous researches [10,11,13,14]. The decision variable is formulated as binary variable, as shown in Eq. (2), where they take a value of 1 if a target is imaged and 0 otherwise. Specifically, represents the variable indicating whether target i is observed by satellite j during the VTW.
The objective function of the imaging mission scheduling model, as defined in Eq. (3), aims to maximize the number of imaged targets, prioritizing targets with higher profits . Therefore, the focus is on maximizing the total profit of the imaging sequence by strategically selecting targets, rather than simply capturing a large quantity of images.
2.2.5. Constraints
- Eq. (4) represents the constraint regarding the minimum and maximum number of times a target is observed. This constraint is modeled within a range to accommodate multiple imaging of the same target as per user requirements, and it is not set as a constant to allow for future model scalability.
- Eq. (5) pertains to the maximum observation time available for a satellite during one pass over the mission area. Various limitations of the satellite, such as power, thermal balance, and memory capacity, identified from the satellite development stage, are integrated into a single variable termed "duty time ". Therefore, this constraint ensures that the actual imaging mission time of the satellite does not exceed this duty time.
- Eq. (6) is a constraint necessary for the application of the MDP optimization algorithm used in this study. It relates to each time interval in the sub-problem formation, indicating that the start time of the time interval should be set before the imaging starts, and the end time of the interval after the imaging ends.
- Eq. (7), also related to the MDP algorithm, expresses the constraint that the imaging mission must be completed within each respective time interval. These time intervals serve as a fundamental criterion for segmenting the total targets within the mission area into several grouped segments. This segmentation considers the VTW, observation time, and gap time, ensuring that the end of the interval aligns seamlessly with the start of the interval. Such alignment is critical for the effective implementation of dynamic programming, which tackles the larger problem by sequentially addressing these interconnected sub-problems, each defined by its distinct segment.
- Eq. (8) addresses the requirement for a guaranteed gap time between consecutive imaging targets. This is a critical condition, especially for multi-imaging missions using active phased array SAR sensors, and is essential in determining the next target post-imaging of the current one.
Figure 5 illustrates the constraints mentioned above, including VTW, observation duration time, gap time, and time intervals. It visualizes various conditions required during consecutive imaging missions. In Figure 5, satellite j selects and images the VTW of target i, , and , ensuring an appropriate gap time between the targets, as depicted schematically.
3. Optimization Algorithm
3.1. Data Preprocessing
Before the optimization, an operation is carried out to place each for within the interval for each satellite j. Based on the Eq. (6). (7). (8), is placed on each interval . The total length of is calculated based on the first and the last in . After placing in each , connection information C among each is generated. Considering the use of active phased array SAR sensors, it is defined that a pair of in and is connected if their azimuth values fall within a certain range. The description of above procedure is written on Algorithm 1.
| Algorithm 1 Interval Data Preprocessor |
|
Require: (Set of visible time windows of every target and satellite) Ensure: Set of time intervals by satellite j, , Connection information, C
|
3.2. Modified Dynamic Programming (MDP)
The Modified Dynamic Programming (MDP) algorithm is an advancement developed by our research team, based on deterministic Dynamic Programming (DP). Recognized for its optimal methodology in managing time-varying systems, such as satellite mission planning, DP faces challenges when the number of variables and the problem space expand, leading to an exponential increase in computational demand (referred as the curse of dimensionality) [33,34]. To address this, our team developed the MDP algorithm, which has been successfully implemented in mission planning for multiple agile satellites equipped with EO/IR payloads [31]. Further refining this approach, the current paper extends the MDP algorithm’s application to mission planning for satellite constellations carrying SAR payloads, demonstrating its adaptability and enhanced performance in complex operational contexts.
Utilizing the previously defined variables , C, and , the MDP algorithm embarks on a recursive iteration process from to . This iterative process continues until it meets a predetermined stopping condition. Once this condition is satisfied, the algorithm captures the value of at within the . Subsequently, it initiates a backward traversal, examining the connectivity between at and with reference to C, and accordingly updates the with these interconnected pairs of . Completing this backward recursive journey, the algorithm culminates by presenting the updated , which reflects the highest profit outcome as the definitive output of the MDP algorithm. The detailed mechanics of this procedure are systematically described in Algorithm 2, as follows:
| Algorithm 2 MDP Algorithm for Optimized Imaging Schedule |
|
Require: Set of time intervals by satellite j, , Connection information C, Set of visible time windows, , Duty time Ensure: Optimized imaging schedule with MDP,
|
3.3. Greedy Algorithm
To facilitate a comparative analysis of optimization algorithms, this study adopts the widely used Greedy algorithm for solving mission planning problems. Drawing inspiration from the Greedy algorithm outlined by Cho et al. [10], we have refined this approach to suit the mission scheduling of satellite constellation.
In the case of the Greedy algorithm, it also utilizes , C, and . However, unlike MDP, which iterate to a certain interval or stopping condition and then performs calculations while backtracking, Greedy calculates from to or until a stopping condition is satisfied. In the first interval, it selects the with the highest from . After the first, the list in is created based on the last and Connection information C. the with the highest is chosen as the last target on the interval. If there are no connected , no action is taken in that interval and moves on to the next . The procedure of greedy is described on Algorithm 3 as follow:
| Algorithm 3 Greedy Algorithm for Optimized Imaging Schedule |
|
Require: Set of time intervals by satellite j, , Connection information C, Set of visible time windows, , Duty time Ensure: Optimized imaging schedule with Greedy,
|
4. Experimental Results
4.1. Test Scenario
The satellite system under consideration is a cluster satellite configuration, specifically a Walker Delta constellation. This constellation is comprised of 8 planes, with satellites ranging from 1 to 5 per plane, amounting to a maximum of 40 satellites. These satellites orbit at an altitude of 500 km and are equipped with state-of-the-art active phased array Synthetic Aperture Radar (SAR) sensors. The orbital trajectories and configuration of this satellite constellation are graphically represented in Figure 6, providing a clear visual understanding of the spatial arrangement.
Targets are randomly generated within the geographic boundaries of the Korean Peninsula, between latitude N and longitude E, with their count progressively increasing from 100 up to a maximum of 1000 in increments of 100. Figure 7 illustrates the spatial distribution of these targets within the mission area. Additionally, each target is randomly assigned a urgency and significance value, chosen from 0.3, 0.6, or 0.9, adding layers of complexity to the target prioritization process.
The mission planning period is set from 00:00 on January 1, 2024, to 00:00 on January 8, 2024, spanning 7 days. The test scenarios involve varying numbers of satellites, from 8 (one per plane) to 50 in total, and targets ranging from 100 to 1,000. This results in 50 unique test cases for the numerical simulation. Detailed simulation parameters are listed in Table 2.
The simulation environment is a crucial aspect, primarily focusing on the computing power and related resources required for the effective execution of the simulation. The specific simulation environment is provided in Table 3.
The workflow of our simulation is a multi-step process, initiated with user-inputted target information and satellite parameters fed into the STK program. Utilizing this input, STK generates target data and propagates satellite orbit. A critical output of this process is the VTW report, which becomes the foundational input for the MDP and Greedy algorithms, both written in Python language. These algorithms are used to derive the solution of the optimal mission scheduling. The entirety of this workflow, from initial input to final algorithmic processing, is depicted in Figure 8, offering a comprehensive visual guide to the simulation process.
4.2. Mission Allocation
Mission allocation refers to the outcomes produced by optimization algorithms in response to user-requested mission assignments. In Figure 9, the mission allocation results are depicted over a single day for all test cases, spanning from 100 to 1000 targets. The scenarios involve different numbers of satellite constellations (8 to 40) and apply two algorithms, MDP and Greedy. The upper graph illustrates the number of observed targets, representing the sum of instances where the binary decision variable is equal to 1. In simpler terms, it reflects the total count of occasions when targets are successfully observed, excluding the profit gained from observing a target in the objective function. Meanwhile, the lower plot corresponds to Eq. (3), revealing the objective function value of total profit derived from target observation. This calculation includes the profit associated with each target. In essence, the lower plot provides a comprehensive overview of the objective function value, taking into account the profits obtained through capturing individual targets.
Figure 9 illustrates an increasing trend in mission allocation results with a growing number of targets and satellites. Notably, the MDP algorithm consistently outperforms the Greedy algorithm. As the number of targets increases, the impact of an increased number of satellites on mission allocation results becomes more evident, along with the growing disparity between the MDP and Greedy algorithms. Moreover, when maintaining the same number of satellites, the mission allocation results tend to converge even as the number of targets increases, suggesting a threshold beyond which adding more targets has a limited effect on the number of successfully allocated missions. For example, with 8 satellites, the number of missions stabilizes at approximately 180, even as the number of targets increases to 1000. This phenomenon enables mission planners to determine the optimal number of satellites required based on the number of targets.
4.3. Mission Success Rate
To evaluate the efficacy of the mission plan in response to user requests, this study employs the mission success rate, a key concept in mission analysis being utilized by the Korea Aerospace Research Institute (KARI) [35]. Eq. (9) signifies the ratio of obtained profit to the total profit when successfully observing all targets. Eq. (10) expresses the ratio of observed targets to the total targets requested by the user.
Figure 10a illustrates the mission success rates achieved with 40 satellites and 500 targets over a day, utilizing both the MDP and Greedy algorithms. The MDP algorithm reached a 100% mission success rate around 17:50, surpassing the Greedy algorithm, which reached the same rate around 23:50. The efficiency of the mission planning process is highlighted by MDP’s ability to complete all missions in a shorter timeframe than Greedy, despite having an identical number of targets and satellites. These findings are further detailed in Figure 10b, depicting outcomes when extending the mission planning period from 1 day to 7 days. Notably, MDP, after 4 days, attained a profit of 91.0% and target observation of 86.4%, whereas Greedy achieved only 68.3% and 69.2%, respectively. Furthermore, considering the completion of a 7-day mission plan, MDP realized success rates of 95.2% and 92.4%, while Greedy demonstrated significantly lower success rate of 75.0% and 76.2%, revealing an approximately 20% difference in mission success rates.
Upon examining the correlation between the number of observed targets and resulting profit, it becomes evident that while Greedy consistently displays an increase in both metrics throughout all time periods, MDP consistently achieves a higher profit relative to the number of observed targets. Starting from the 4th day onward in Figure 10b, the objective function value in the case of the Greedy algorithm starts to fall below the target observation value. This observation underscores the clear alignment of MDP with the problem’s objective function, emphasizing the prioritization of high-profit target observation. This data described in Figure 10 can serve as a valuable reference for analyzing the completion of user-requested missions within the available satellite resources during the mission planning phase. To summarize, the outcomes indicate that the quantity of observed targets and resulting profits depend on the number of satellites and the planning horizon. The efficacy of the MDP algorithm is demonstrated by its adept implementation of the problem’s objective function. Employing the mission success rate as a metric proves instrumental in evaluating the efficiency of incorporating users’ requests into the mission plan.
4.4. Revisit Time
Revisit time is a crucial figure of merit (FOM) in satellite mission planning, representing the periodicity of a satellite’s return to a designated imaging target or region. In Figure 11, the mean revisit time is depicted based on the profit associated with each target under a test scenario involving a constellation of 16 satellites observing 100 targets five times over a 7-day period. Calculated as the temporal difference between the initiation of the first observation and the conclusion of the fifth, divided by four intervals. Target profit is determined by Eq. (1), categorized into nine segments. Figure 11 illustrates that, across all target profit segments, the mean revisit time for the MDP algorithm consistently outperforms that of the Greedy algorithm. Furthermore, the outcomes of linear regression fitting, as expressed in Eq. (11) and Eq. (12), indicate that MDP exhibits a steeper slope and a smaller y-intercept.
Delving into more detailed analysis, the mean revisit time for MDP at the lowest profit of 0.3 is 9.02 hours, compared to 10.56 hours for the Greedy algorithm, and at the highest profit of 0.9, MDP’s mean revisit time significantly shortens to 3.2 hours versus 5.1 hours for Greedy. This trend demonstrates that the difference between the two algorithms becomes more pronounced with increasing profit. The slope of the graph indicates that MDP is more effective at capturing as many high-profit targets as possible within the constraints of satellite mission planning.
Following this detailed analysis, it becomes pertinent to examine how this research diverges from prior work. Previous studies [7,36,37] have predominantly aimed at optimizing satellite constellations and orbits to reduce the mean revisit time to tens of minutes across areas such as the Korean Peninsula, often treating it as a single, uniform target for system-level performance evaluations. Contrary to this approach, the present study advances by accurately calculating the mean revisit times for individual targets within specific regions, thereby offering a more refined analysis. This shift from a broad, areal focus to a targeted, precise evaluation underscores the novelty and significance of our approach, setting it apart from earlier methodologies.
For a quantitative analysis of the results dataset, we present the mean revisit time using a box plot in Figure 12, along with key statistical metrics in Table 4. As illustrated in both Figure 12 and Table 4, the MDP algorithm exceeds Greedy’s performance in all metrics, excluding the minimum value. Notably, the standard deviation and presence of outlier values are significantly reduced in the case of the MDP algorithm. This emphasizes that the efficacy of the MDP algorithm is demonstrated in the satellite mission planning domain where a robust algorithm is essential.
4.5. Computation Time
Figure 13 presents the computation times for the MDP and Greedy algorithms as functions of the total number of targets, with the data displayed on a logarithmic scale. This visualization underscores the correlation between increased computation times and the rising numbers of both targets and satellites. It specifically highlights the exponential growth in computational demand as the number of satellites increases, a factor that is precisely plotted to illustrate its impact on computational time. Upon detailed analysis, it becomes apparent that the volume of targets exerts a more substantial impact on the computational complexity than does the satellite count. This augmented complexity primarily arises from the intricacies of generating sub-problems. Specifically, as the target count increases, the task of calculating each target’s visibility window and the intervals between them necessitates a significant escalation in computational resources.
A comparative assessment reveals that across all tested scenarios, the Greedy algorithm outperforms the MDP algorithm in computation time, especially in complex scenarios involving 1000 targets where Greedy’s computation time is merely 101 seconds compared to MDP’s 998 seconds. This efficiency of Greedy stems from its strategy of optimizing each sub-problem individually for immediate results, in contrast to MDP, which assesses the overall benefit pathway, leading to a more thorough optimization at the cost of longer computation times. However, despite its DP-based nature, MDP manages to complete even the most computationally demanding scenarios within a reasonable timeframe. With advancements in computing powers such as CPU and RAM, it is feasible to significantly reduce computation times, establishing the MDP algorithm’s suitability for satellite constellation mission planning by providing higher objective function outcomes efficiently. This underscores the need to balance algorithmic efficiency with optimization potential in computational resource allocation for complex tasks.
Furthermore, an interesting aspect of the computation times for both the MDP and Greedy algorithms emerges when considering the interplay between the number of targets and satellites. While the computation time for the Greedy algorithm increases directly with the number of targets and satellites, the MDP algorithm displays a more complex pattern of behavior. Specifically, scenarios with a lower count of satellites have occasionally demanded more computational time than those with a higher count. This observation is tied to the mission success rates discussed in SubSection 4.3. For example, an MDP scenario with 40 satellites and 1000 targets reaches a 100% mission success rate by January 3rd, whereas with only 8 satellites, a 95% success rate is only achieved by January 7th. This indicates that scenarios with fewer satellites, despite their reduced satellite count, incur greater computational demands due to the prolonged duration required to achieve mission success. In contrast, scenarios employing the Greedy algorithm for 1000 targets fail to reach a 100% mission success rate by January 7th, regardless of the satellite count, necessitating ongoing mission planning throughout the seven-day period. This scenario accounts for the relatively shorter computation times observed in situations with fewer satellites.
5. Conclusions
This research utilizes a MDP algorithm, developed in-house [31], aimed at optimizing imaging mission schedules for SAR satellite constellations. The core of this study lies in addressing the challenges of scheduling in regions with a high density of targets, showcasing the algorithm’s effectiveness by contrasting it with the Greedy algorithm, a widely used in existing literature. The formulation of the problem utilizes MILP to ensure the observation of the maximum number of high-profit targets within a set planning horizon.
Critical to the mission planning process, parameters such as VTWs, time intervals, and gap times are calculated through satellite orbit propagation using the STK software. The MDP algorithm, by segmenting the mission planning into discrete time intervals based on VTWs, strategically schedules consecutive target imaging. This includes calculating both the observation time duration and gap time to establish a comprehensive schedule for target imaging across various test scenarios. Additionally, this study provides a comparative analysis of optimal sequencing strategies for imaging targets, utilizing both the MDP and Greedy algorithms.
For the numerical simulations, the mission area around the Korean Peninsula is set, with 100 to 1000 targets of various levels of significance and urgency. The satellite constellation, equipped with SAR sensors, is configured as a Walker Delta constellation comprising 5 inclined orbits, with the satellite count ranging from 8 to 40, over a 7-day mission planning period. The evaluation of 50 test scenarios using both the MDP and Greedy algorithms yielded significant findings as follows:
1. In mission allocation analysis, the quantity of satellites significantly impacts the observation strategy, diminishing the importance of the total number of targets. This highlights the crucial role of satellite count in enhancing observation efficiency and profitability, despite the limited benefits of increasing target numbers.
2. Across all scenarios, the mission success rate for profit surpasses that for target observation, validating the goal of maximizing profit through prioritizing high-value targets—a strategy effectively implemented by the MDP algorithm.
3. Analysis of revisit times reveals that targets of higher value benefit from shorter intervals between observations. Confirmed by box plot analysis, this result highlights the robustness of the MDP algorithm.
Lastly, the MDP algorithm, despite taking more time than the Greedy algorithm, consistently achieves better outcomes in mission allocation, success rates, and revisit times. With advancements in computing power, the computational efficiency of MDP can be enhanced, making it a more suitable choice for complex satellite mission planning.
For future works, we plan to broaden the optimization scope to encompass both imaging missions and communication planning with ground stations. As ground stations become more globally accessible, satellite communication planning emerges as equally vital as imaging scheduling. This expansion includes integrating tasks such as receiving commands from ground stations, conducting imaging missions, and then transmitting the raw data back to Earth. By optimizing this whole mission workflow, we aim to significantly improve the operational efficiency of satellite constellations.
Author Contributions
Writing—original draft preparation, K.L.; writing—review and editing, K.L. and S.L.; methodology, D.K.; supervision, D.C.; project administration, D.C. and S.L.; funding acquisition, K.L. All authors have read and agreed to the published version of the manuscript.
Funding
This research was supported by the UST Young Scientist+ Research Program 2023 through the University of Science and Technology (No. 2023YS33), by the Satellite Operation Project of the Korea Aerospace Research Institute (No. FR24G00), and by a military scholarship from the Republic of Korea Air Force.
Data Availability Statement
Not applicable.
Conflicts of Interest
All authors declare no conflict of interest.
References
- Vongsantivanich, W.; Holvoet, N.; Chaimatanan, S.; Delahaye, D. Mission planning for non-homogeneous Earth observation satellites constellation for disaster response. SpaceOps Conference 2018, 2658. [Google Scholar]
- Euroconsult. Available online: https://www.euroconsult-ec.com (accessed on 24 Aug 2023).
- Kim, H.; Chang, Y. K. Optimal mission scheduling for hybrid synthetic aperture radar satellite constellation based on weighting factors. Aerospace Science and Technology 2020, 107, 106287. [Google Scholar] [CrossRef]
- Kwon, S. C.; Son, J. H.; Song, S. C.; Park, J. H.; Koo, K. R.; Oh, H. U. Innovative Mechanical Design Strategy for Actualizing 80 kg-Class X-Band Active SAR Small Satellite of S-STEP. Aerospace (MDPI) 2021, 8, 149. [Google Scholar] [CrossRef]
- Lee, K.; Kim, D.; Chung, D.; Lee, S. A Study on Modeling of Imaging Mission Planning for Earth Observation Satellite Using Mixed Integer Linear Programming (MILP). Journal of Korean Space Association for National Defense 2023, 1, 21–29. [Google Scholar]
- 4th Space Development Promotion Basic Plan. Available online: https://www.msit.go.kr/bbs/view.do?sCode=user& bbsSeqNo=65& nttSeqNo=3017397 (accessed on 15 Sep 2023).
- Shin, J.; Hwang, Y.; Park, S. Y.; Jeon, S.; Lee, E.; Song, S. C. Design of Micro-Satellite Constellation for Reconnaissance of Korean Peninsula. Journal of the Korean Society for Aeronautical & Space Sciences 2022, 50, 401–412. [Google Scholar]
- Lee, K.; Lee, S.; Chung, D. Conceptual Study on Mission Scheduling of Agile Satellite using Dynamic Programming. KSAS Fall Conference 2022, 28–29. [Google Scholar]
- Zhang, G.; Li, X.; Hu, G.; Zhang, Z.; An, J.; Man, W. Mission Planning Issues of Imaging Satellites: Summary, Discussion, and Prospects. International Journal of Aerospace Engineering 2021, 1–20. [Google Scholar] [CrossRef]
- Cho, D. H.; Kim, J. H.; Choi, H. L.; Ahn, J. Optimization-based scheduling method for agile earth-observing satellite constellation. Journal of Aerospace Information Systems 2018, 15, 611–626. [Google Scholar] [CrossRef]
- Ayana, S. E.; Kim, H. D. Optimal Scheduling of Imaging Missions for Multiple Satellites Using Linear Programming. International Journal of Aeronautical and Space Sciences 2022, 23, 559–569. [Google Scholar] [CrossRef]
- Peng, G.; Dewil, R.; Verbeeck, C.; Gunawan, A.; Xing, L.; Vansteenwegen, P. Agile earth observation satellite scheduling: An orienteering problem with time-dependent profits and travel times. Computers and Operations Research 2019, 111, 84–98. [Google Scholar] [CrossRef]
- She, Y.; Li, S.; Zhao, Y. Onboard mission planning for agile satellite using modified mixed-integer linear programming. Aerospace Science and Technology 2018, 72, 204–216. [Google Scholar] [CrossRef]
- Chen, X.; Reinelt, G.; Dai, G.; Spitz, A. A mixed integer linear programming model for multi-satellite scheduling. European Journal of Operational Research 2019, 275, 694–707. [Google Scholar] [CrossRef]
- Cho, D. H.; Kim, H. Y.; Choi, H. L. Optimal Continuous-Time Job Scheduling for Multiple Low Earth Orbit Satellites. In AIAA guidance, navigation, and control conference 2016, 2107. [CrossRef]
- Lee, J.; Kim, H.; Chung, H.; Ko, K. Genetic algorithm-based scheduling for ground support of multiple satellites and antenna considering operation modes. International Journal of Aeronautical and Space Sciences 2016, 17, 89–100. [Google Scholar] [CrossRef]
- Lee, J.; Kim, H.; Chung, H.; Kim, H.; Choi, S.; Jung, O.; Chung, D.; Ko, K. Schedule Optimization of Imaging Missions for Multiple Satellites and Ground Stations Using Genetic Algorithm. International Journal of Aeronautical and Space Sciences 2018, 19, 139–152. [Google Scholar] [CrossRef]
- Baek, S. W.; Han, S. M.; Cho, K. R.; Lee, D. W.; Yang, J. S.; Bainum, P. M.; Kim, H. D. Development of a scheduling algorithm and GUI for autonomous satellite missions. Acta Astronautica 2011, 68, 1396–1402. [Google Scholar] [CrossRef]
- Cui, K.; Xiang, J.; Zhang, Y. Mission planning optimization of video satellite for ground multi-object staring imaging. Advances in Space Research 2018, 61, 1476–1489. [Google Scholar] [CrossRef]
- Lee, Y.; Lee, K.; Seo, I.; Ko, S. S. Efficient Satellite Mission Scheduling Problem Using Particle Swam Optimization. Journal of the Society of Korea Industrial and Systems Engineering 2016, 39, 56–63. [Google Scholar] [CrossRef]
- Niu, X.; Tang, H.; Wu, L. Satellite scheduling of large areal tasks for rapid response to natural disaster using a multi-objective genetic algorithm. International Journal of Disaster Risk Reduction 2018, 28, 813–825. [Google Scholar] [CrossRef]
- Lu, J.; Chen, Y.; He, R. A Learning-Based Approach for Agile Satellite Onboard Scheduling. IEEE Access 2020, 8, 16941–16952. [Google Scholar] [CrossRef]
- Wang, X.; Wu, J.; Zhao, F.; Jin, Z. Deep reinforcement learning-based autonomous mission planning method for high and low orbit multiple agile Earth observing satellites. Advances in Space Research 2022, 70, 3478–3493. [Google Scholar] [CrossRef]
- Bao, X.; Zhang, S.; Zhang, X. An Effective Method for Satellite Mission Scheduling Based on Reinforcement Learning. Chinese Automatic Congress (CAC) 2020, 4037–4042. [Google Scholar]
- Wang, H.; Yang, Z.; Zhou, W.; Li, D. Online scheduling of image satellites based on neural networks and deep reinforcement learning. Chinese Journal of Aeronautics 2019, 32, 1011–1019. [Google Scholar] [CrossRef]
- He, Y.; Chen, Y.; Pedrycz, W.; Wang, L.; Wu, G. A Generic Markov Decision Process Model and Reinforcement Learning Method for Scheduling Agile Earth Observation Satellites. IEEE Transactions on Systems, Man, and Cybernetics: Systems 2022, 52, 1463–1474. [Google Scholar] [CrossRef]
- Iacopino, C.; Harrison, S.; Brewer, A. Mission planning systems for commercial small-sat earth observation constellations. In Proceedings of the 9th International Workshop on Planning and Scheduling for Space (IWPSS) 2015, 45–52. [Google Scholar]
- Zheng, Z.; Guo, J.; Gill, E. Swarm satellite mission scheduling & planning using hybrid dynamic mutation genetic algorithm. Acta Astronautica 2017, 137, 243–253. [Google Scholar]
- Cui, J.; Zhang, X. Application of a multi-satellite dynamic mission scheduling model based on mission priority in emergency response. Sensors 2019, 19, 1430. [Google Scholar] [CrossRef] [PubMed]
- Lewis, B. Mission Scheduling and Optimization Algorithm for Small Satellite Constellations. Master of Science, York University, Toronto, Jan 2021. [Google Scholar]
- Lee, K.; Kim, D. J.; Chung, D. W.; Lee, S. Optimal Mission Planning for Multiple Agile Satellites Using Modified Dynamic Programming. Journal of Aerospace Information Systems 2023, in press. [Google Scholar] [CrossRef]
- Mfondoum, A. N.; Tchindjang, M.; Valery, J.; Mfondoum, M.; Makouet, I. Eisenhower matrix* Saaty AHP= Strong actions prioritization? Theoretical literature and lessons drawn from empirical evidences. Iaetsd Journal For Advanced Research In Applied Sciences 2019, 6, 13–27. [Google Scholar]
- Arora, R. K. Optimization Algorithms and Applications; CRC Press: New York, U.S., 2015; pp. 289–297. [Google Scholar]
- Boyd, S.; Vandenberghe, L. Convex Optimization, 7th ed.; Cambridge University Press: Cambridge, U.K., 2009; pp. 436–445. [Google Scholar]
- Park, S.; Jung, O.; Lee, J.; Bae, H.; Chung, D.; Jeon, H. A Study on the Performance Indicators of Satellite Operations. KSAS Spring Conference 2020, 668–669. [Google Scholar]
- Kim, H.; Lee, S. S. A study on the Satellite Constellation Configuration and Orbit Control Method of Micro-Satellite System. KSAS Fall Conference 2023, 655–656. [Google Scholar]
- Lee, S. S. Target-oriented satellite constellation method for revisit performance. IEEE Transactions on Geoscience and Remote Sensing 2023, 61, 1–11. [Google Scholar] [CrossRef]
Figure 1.
Observation comparison between single target and multi-targets.
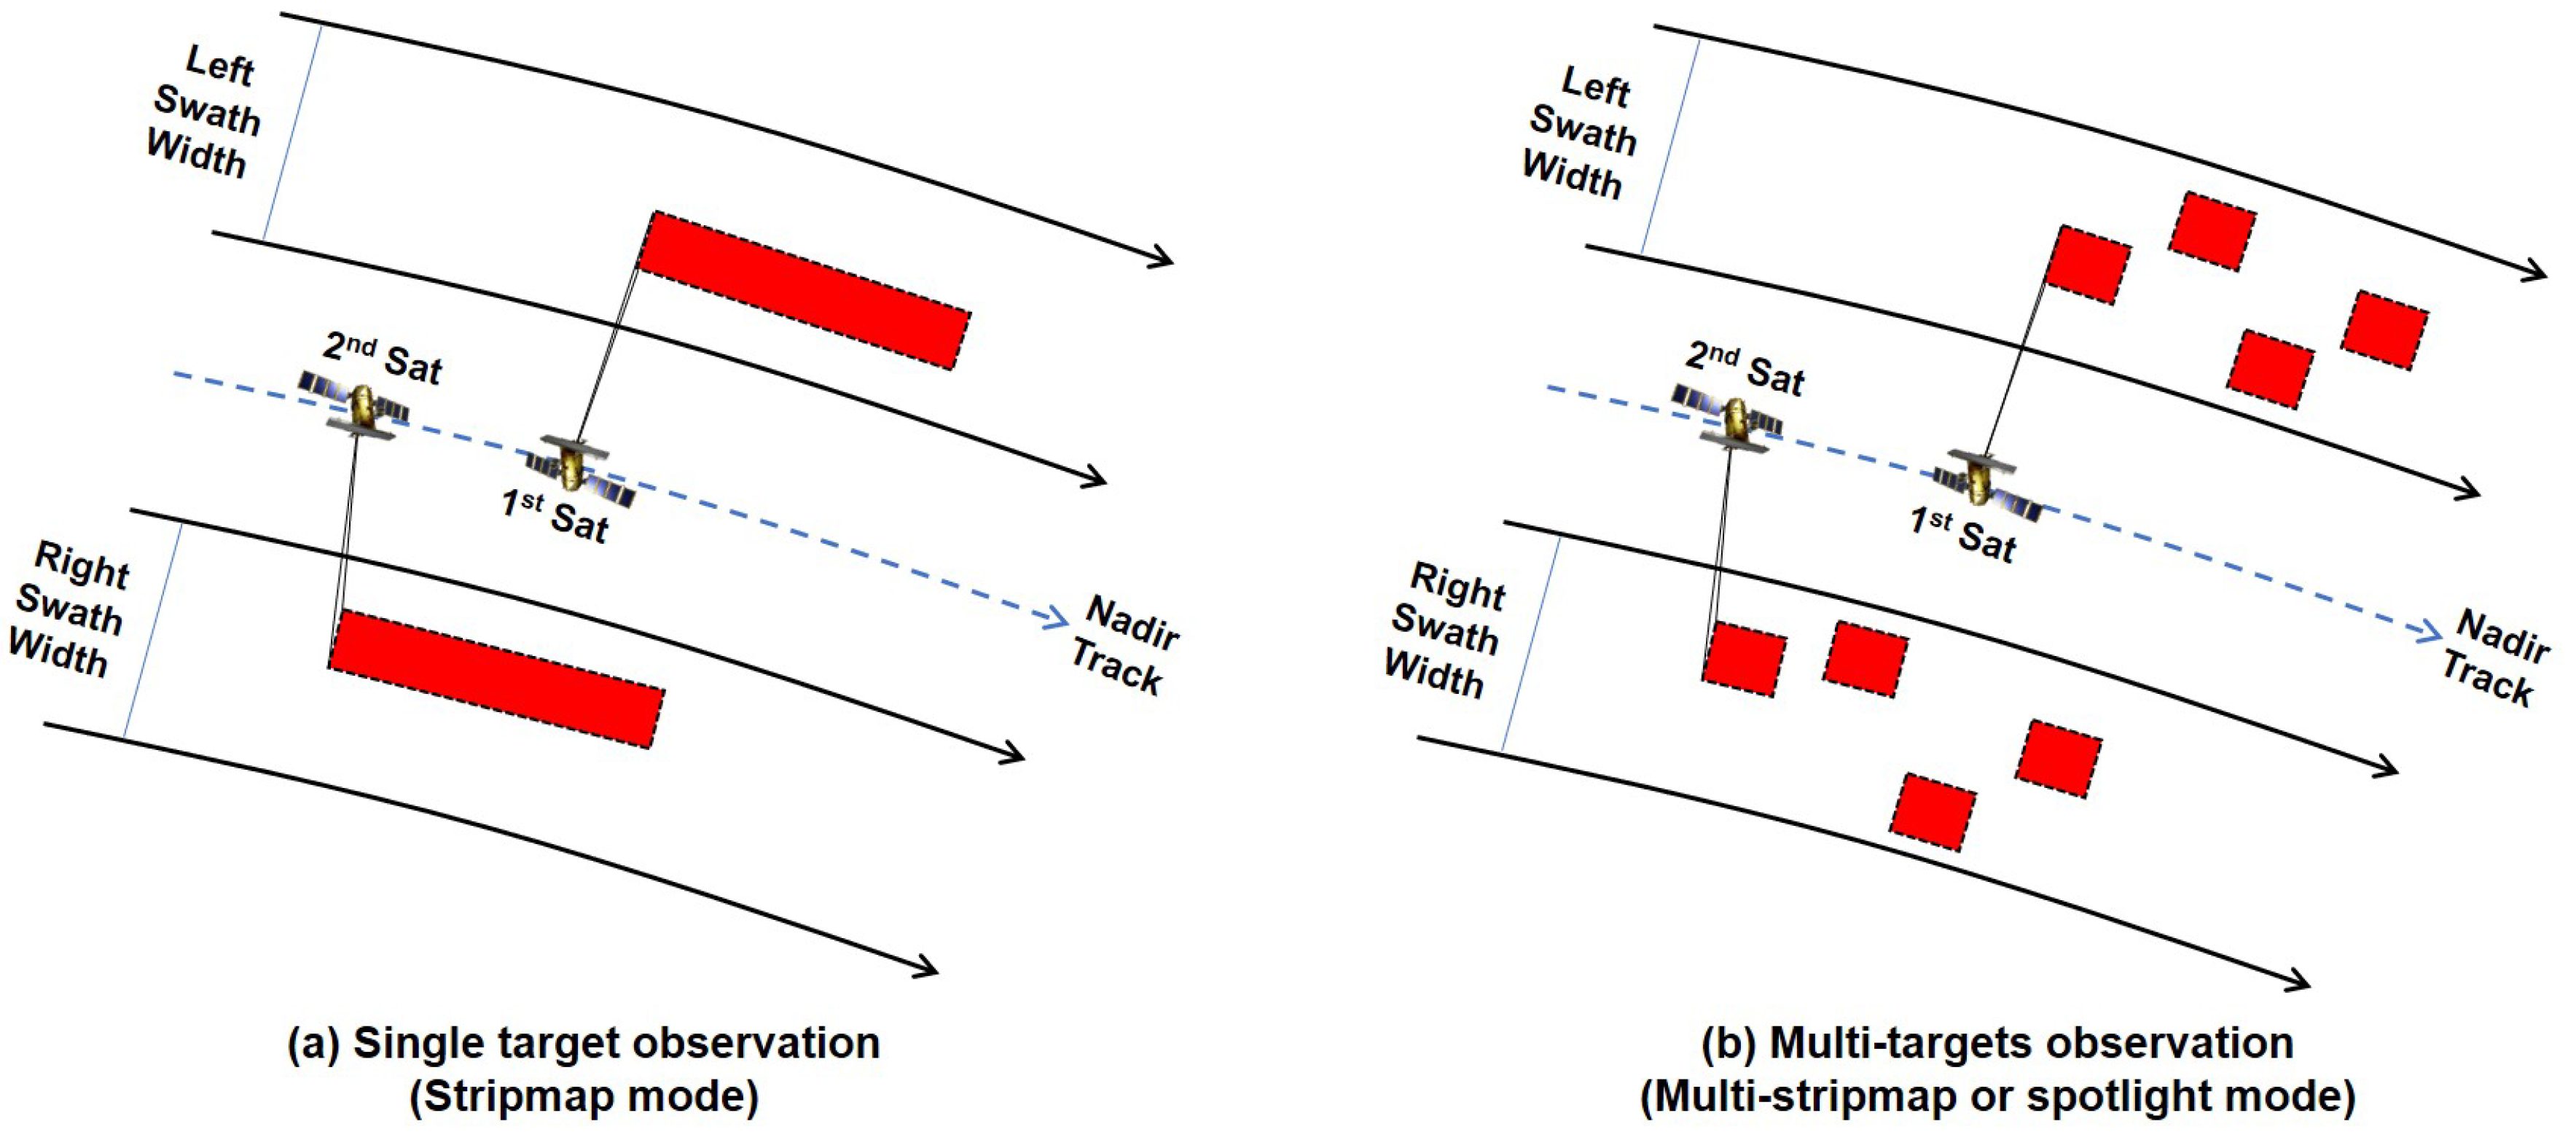
Figure 2.
Schematic illustration of imaging mission flow.
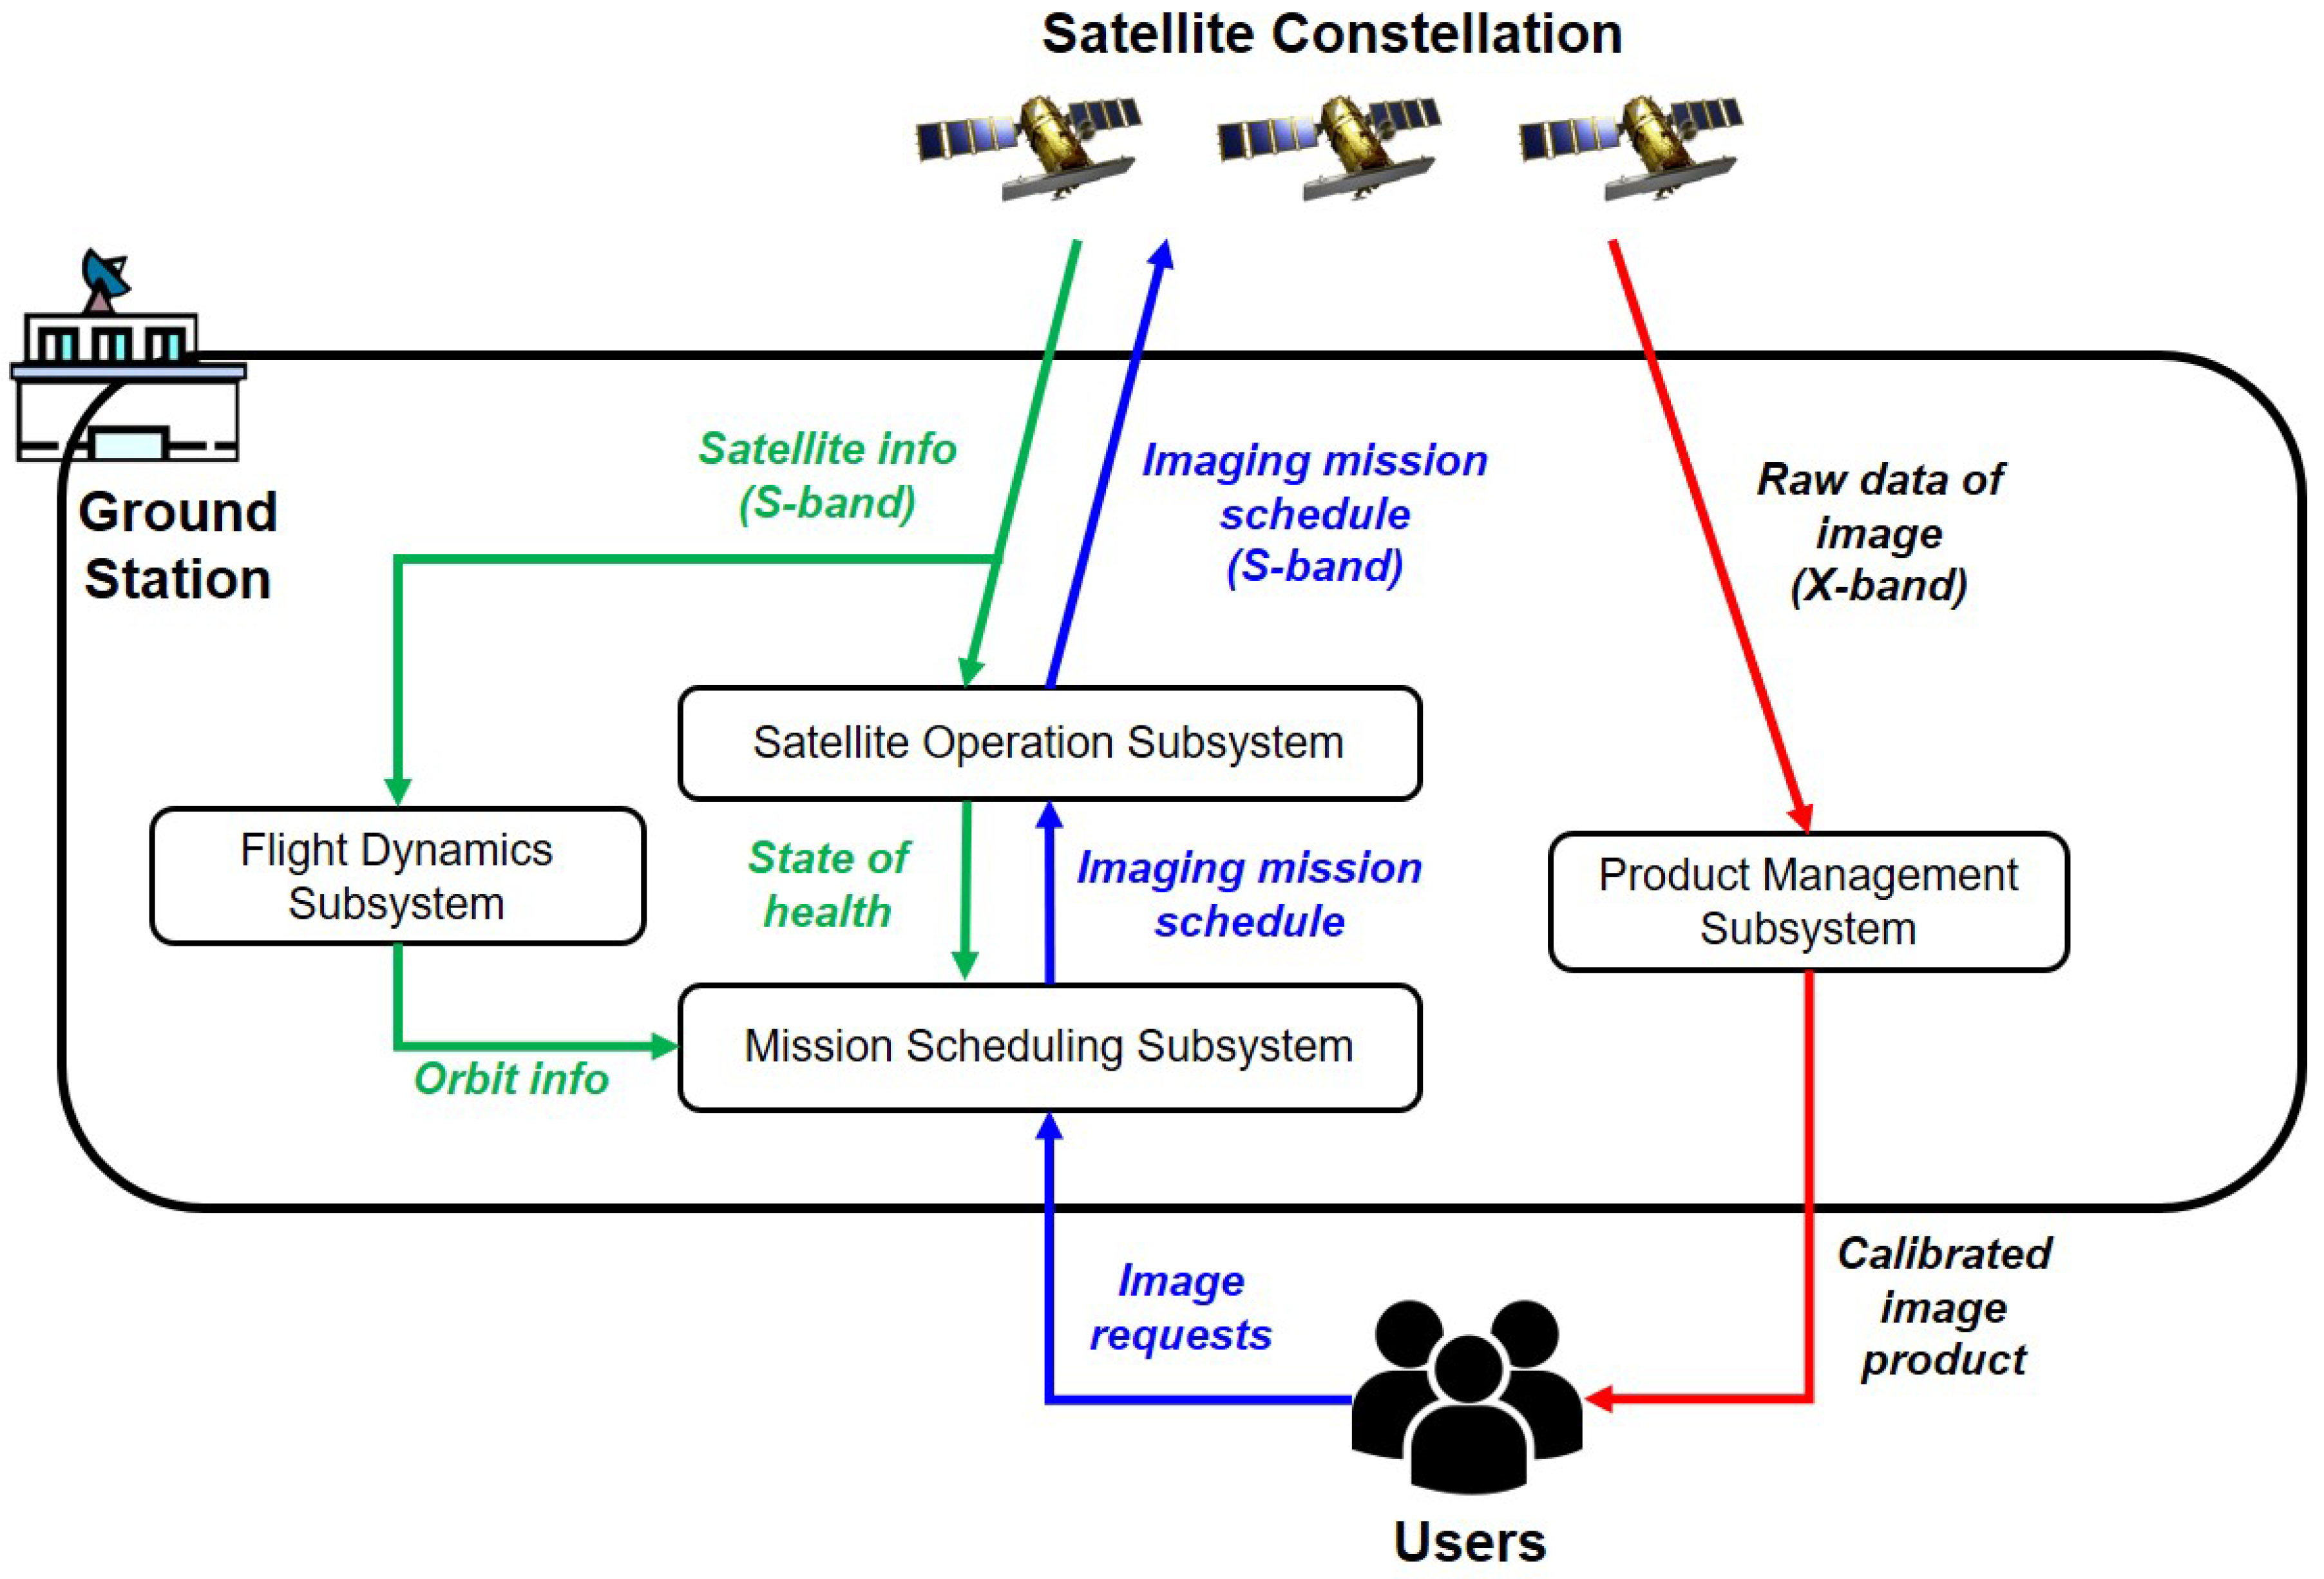
Figure 3.
Target priority in Eisenhower matrix framework.
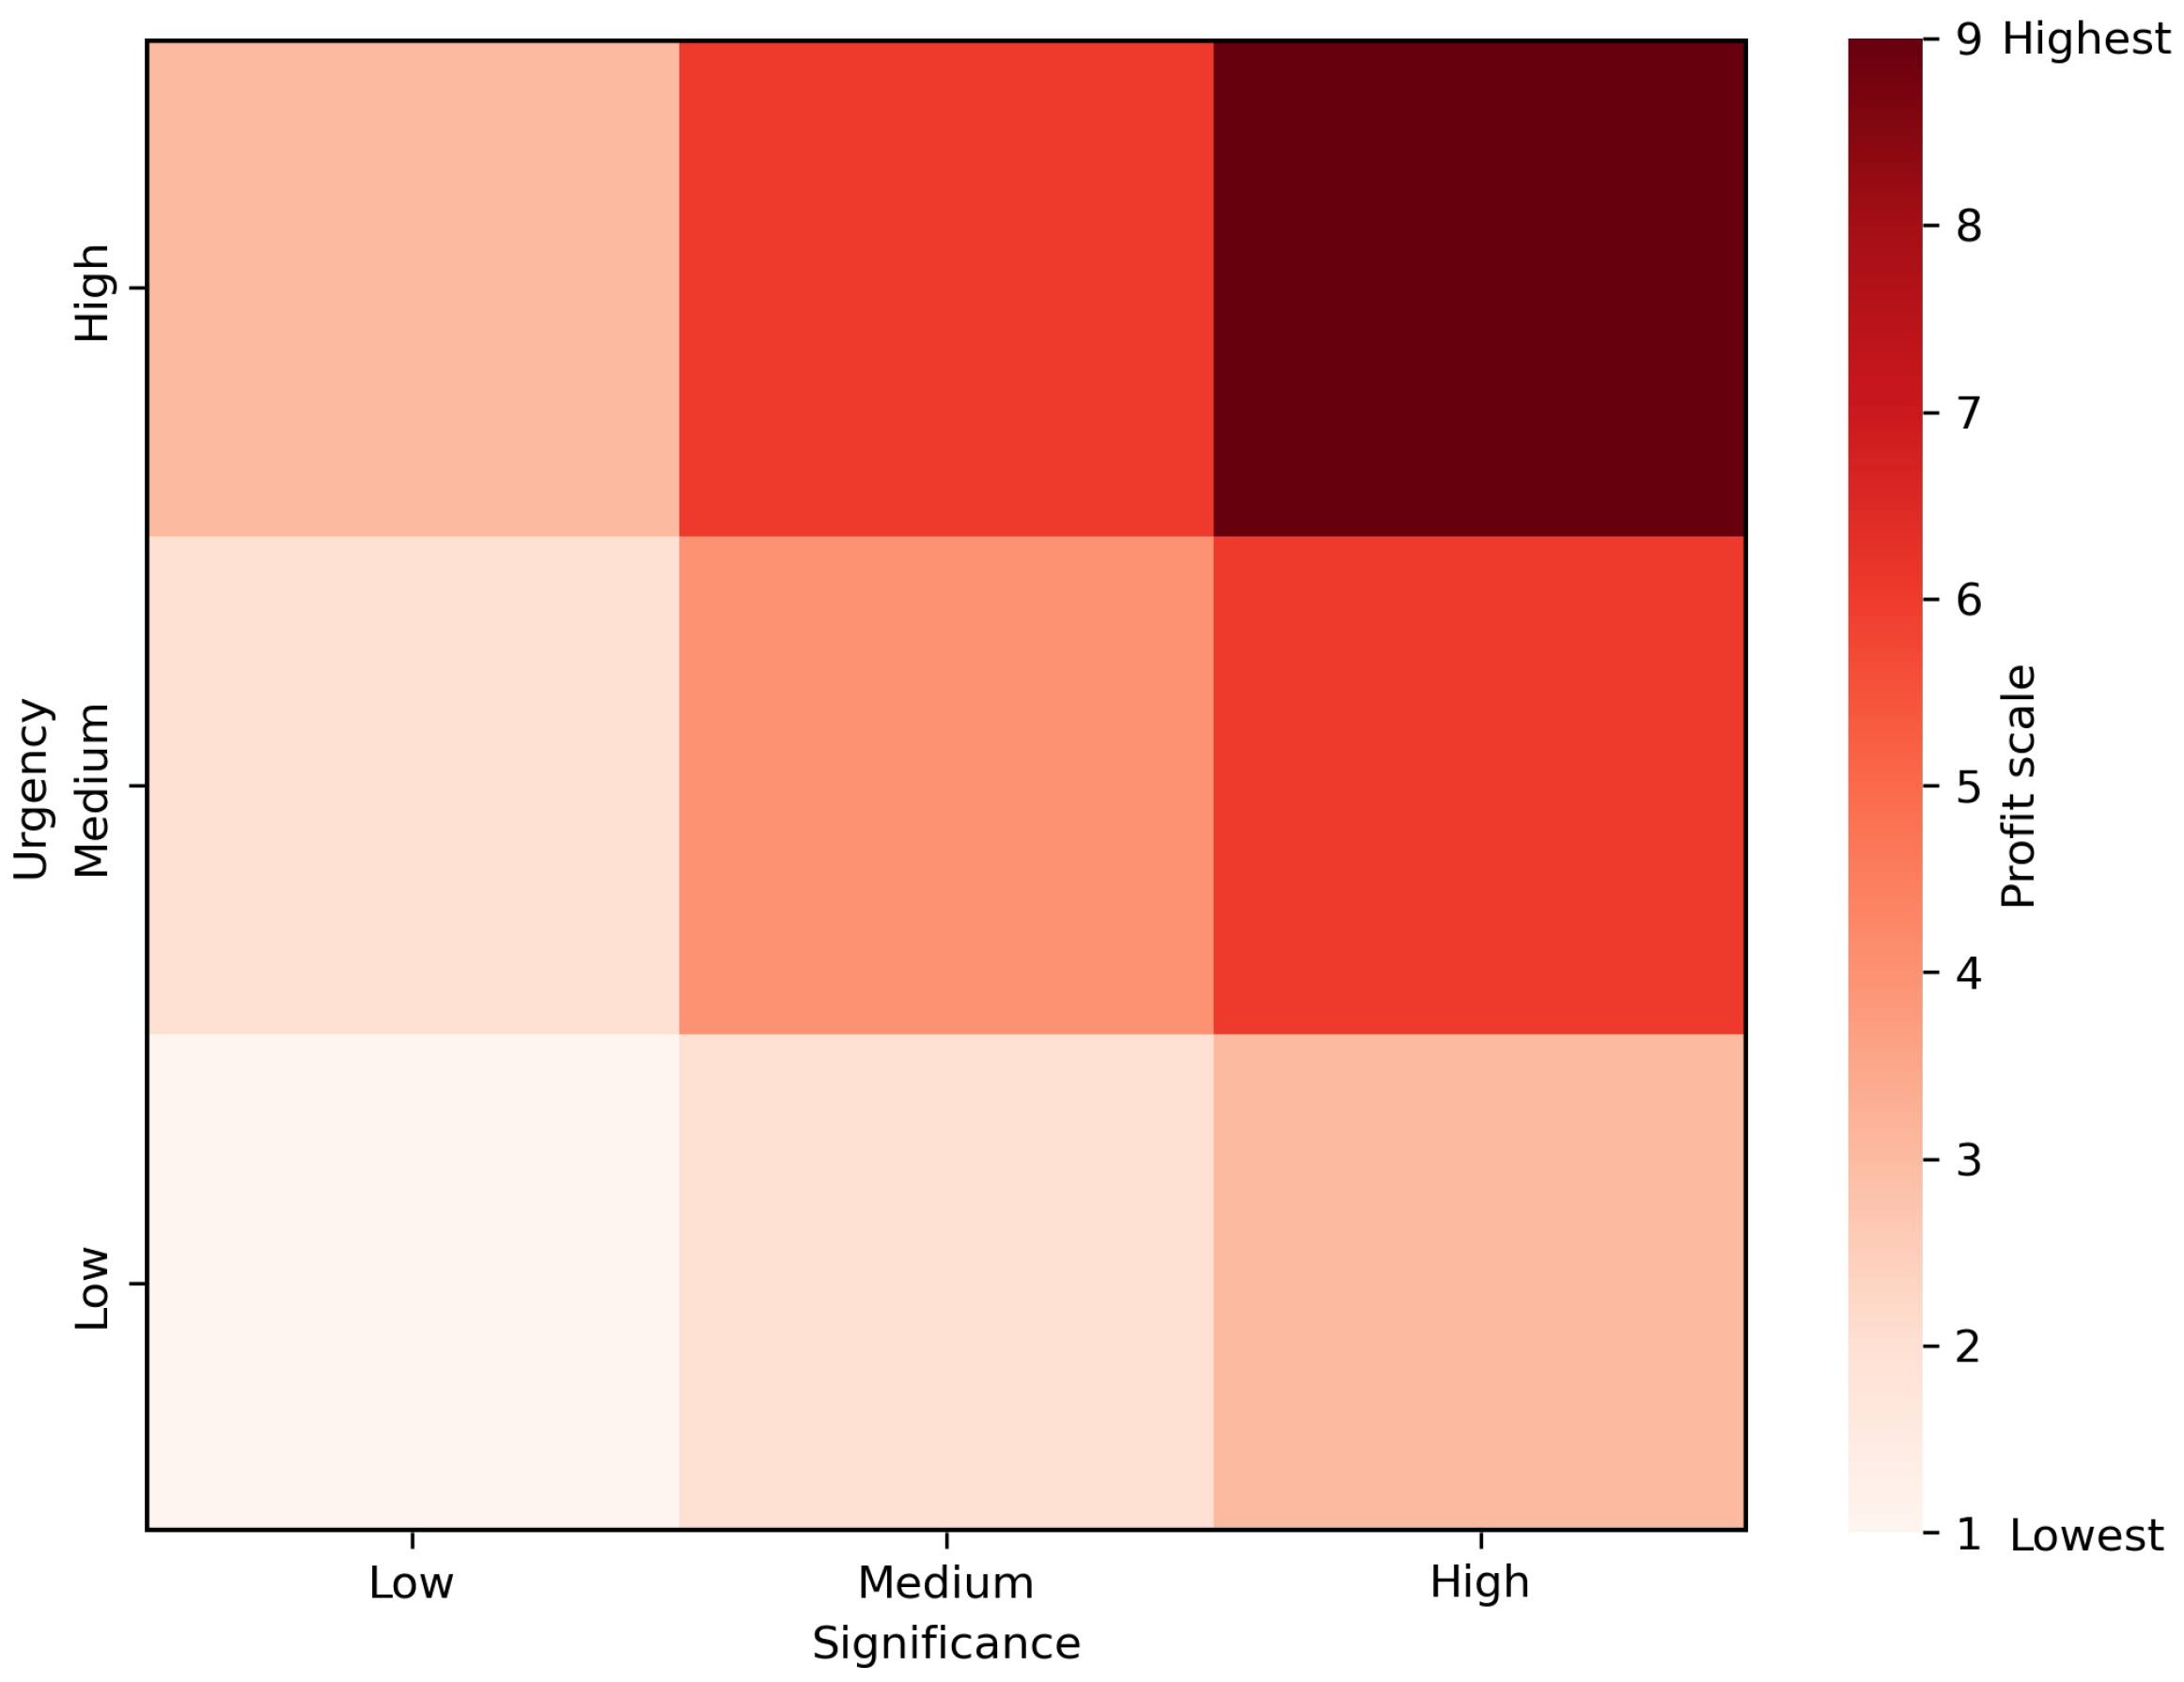
Figure 4.
Example of VTW count (case : single satellite and 1,000 targets during 7 days).
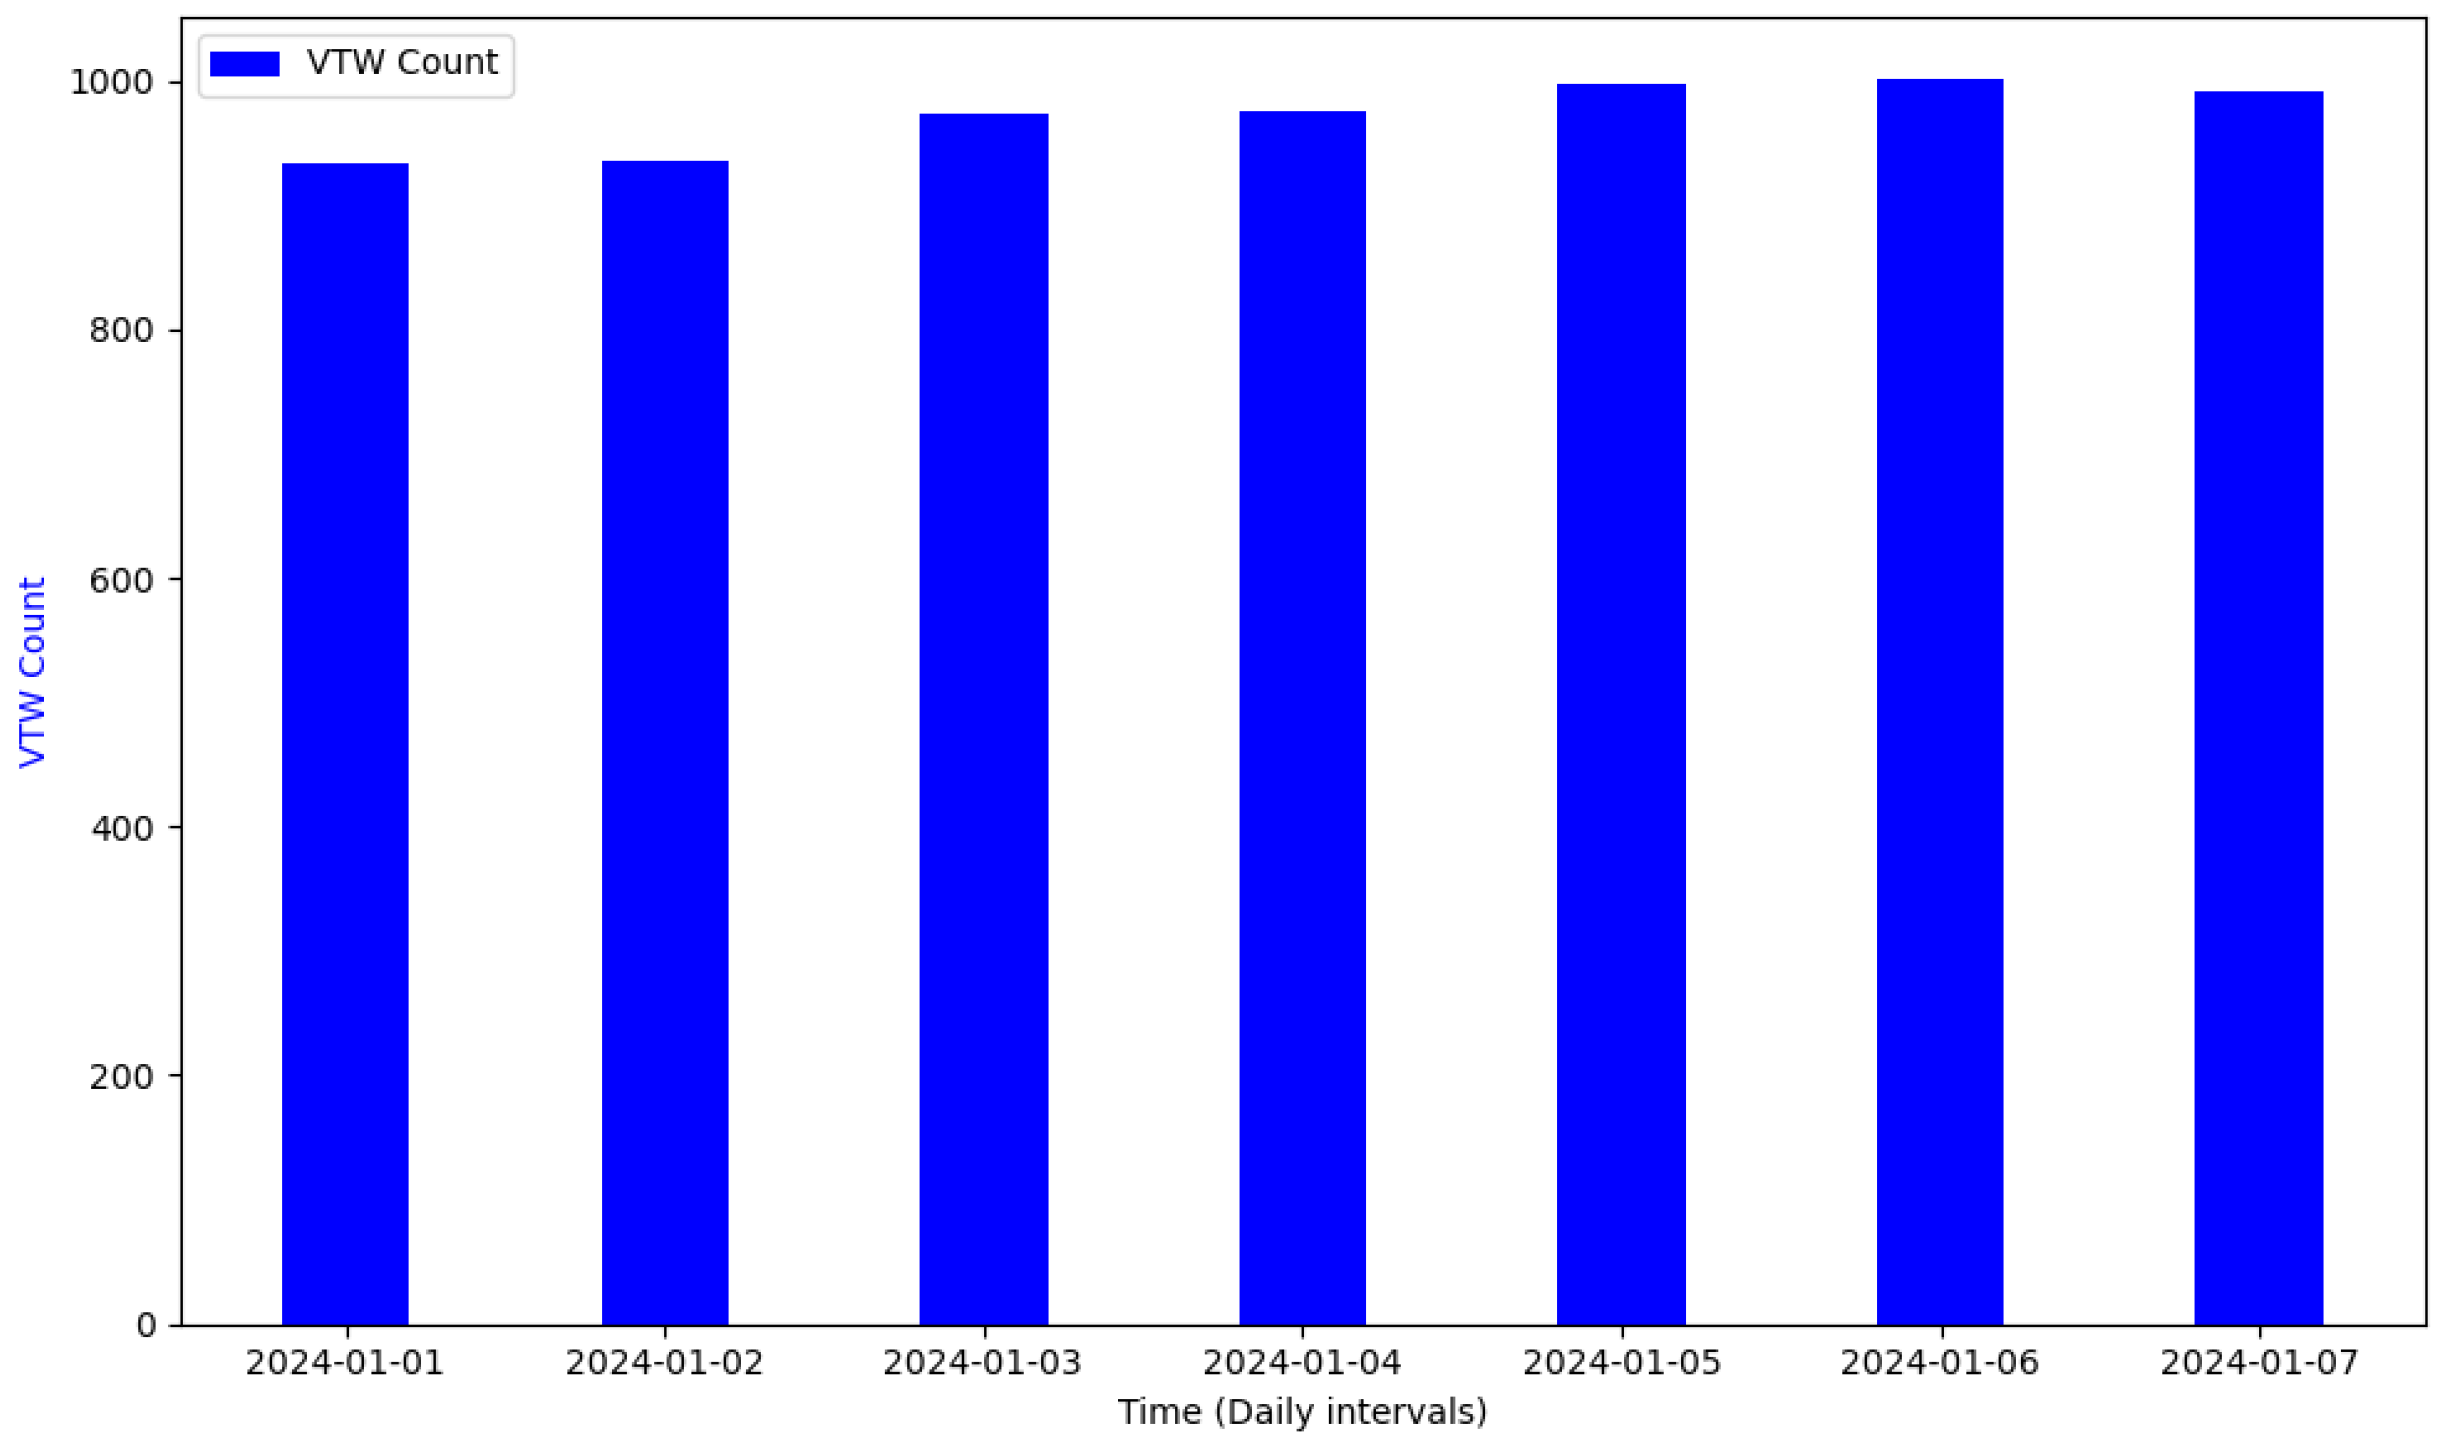
Figure 5.
A simplified illustration of the constraints.
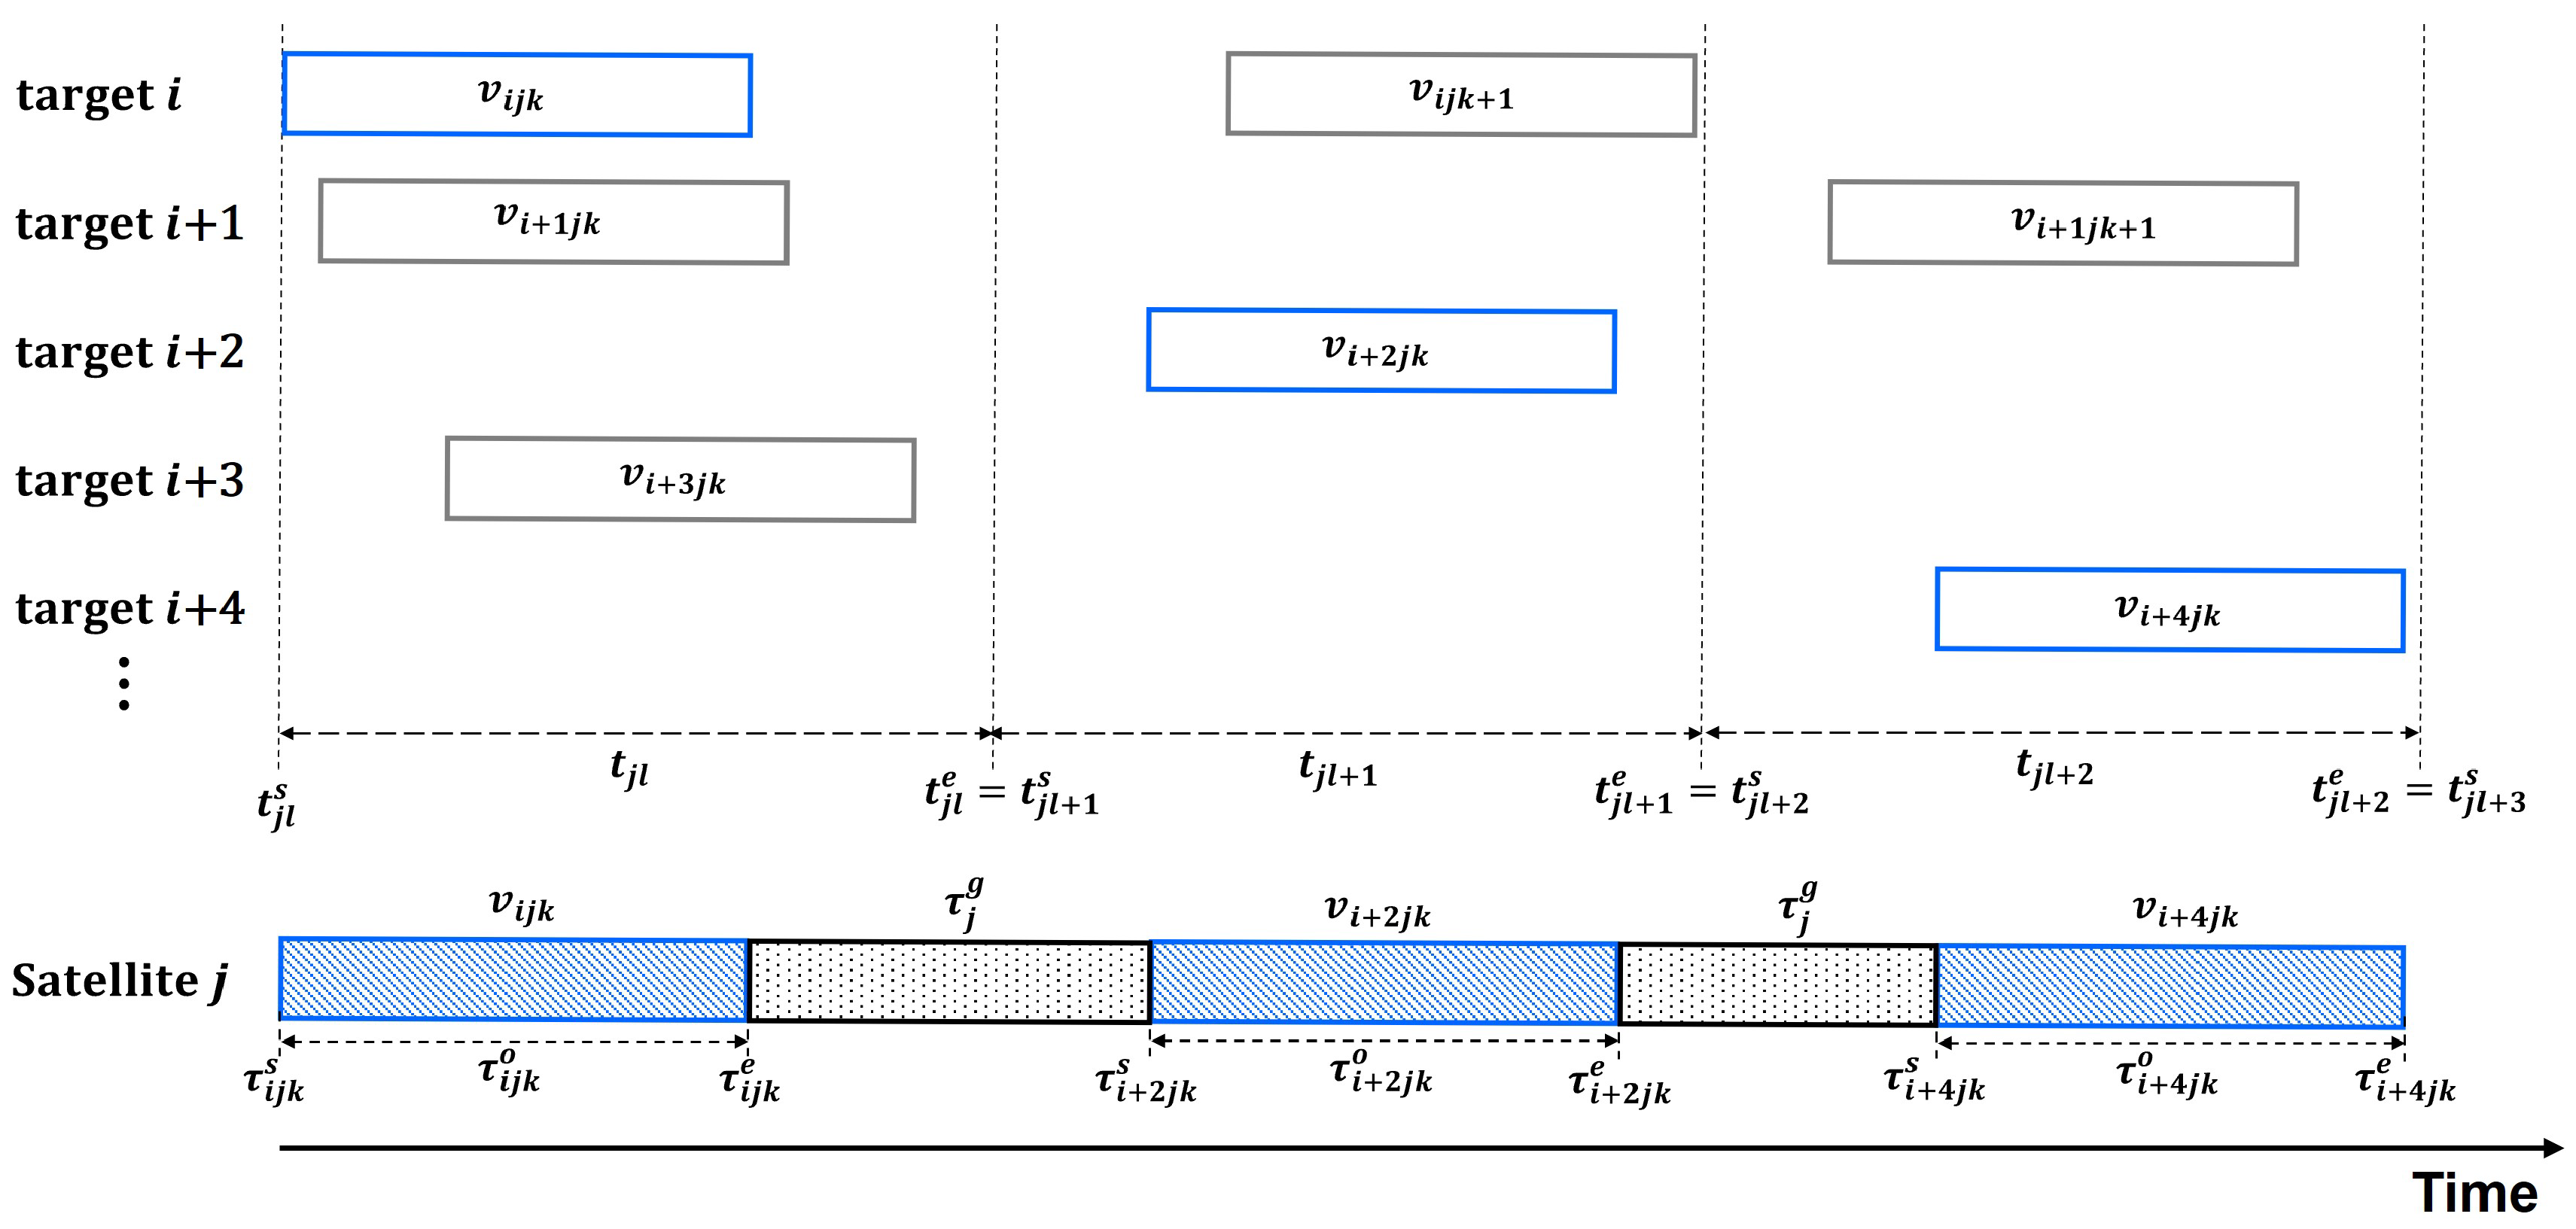
Figure 6.
Satellite constellation on 3D map.
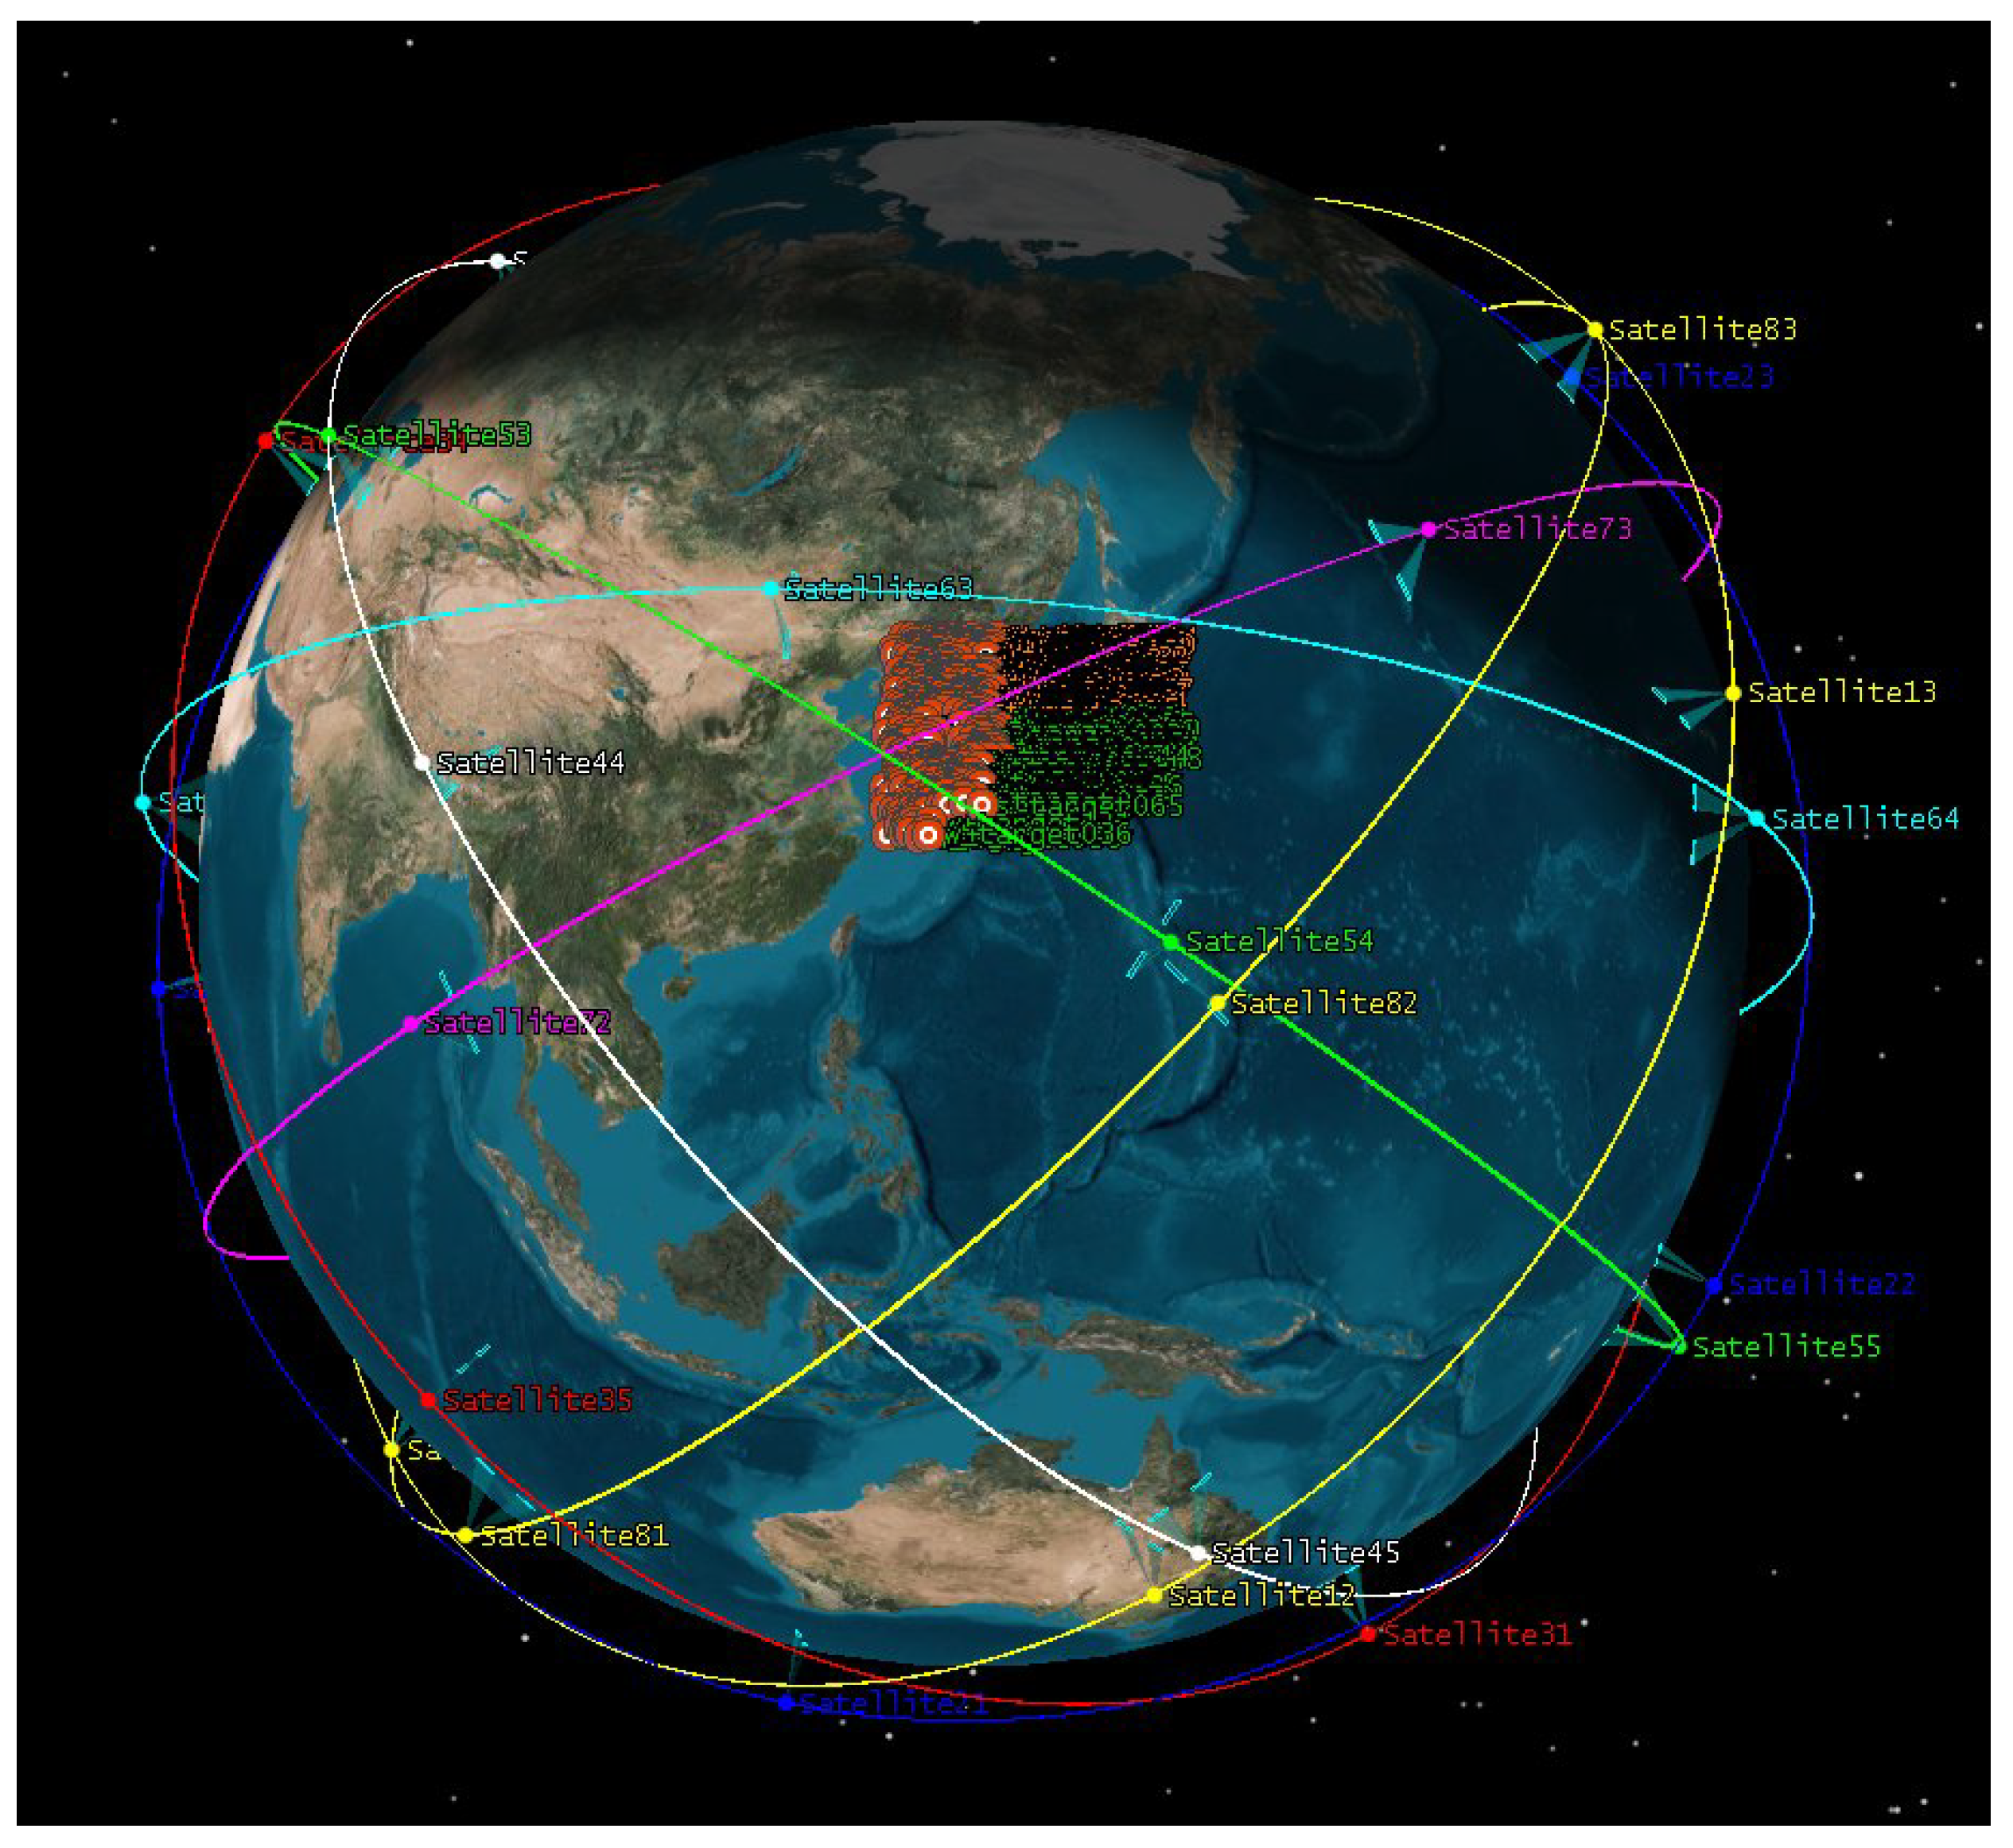
Figure 7.
Distribution of 1,000 targets in mission area.
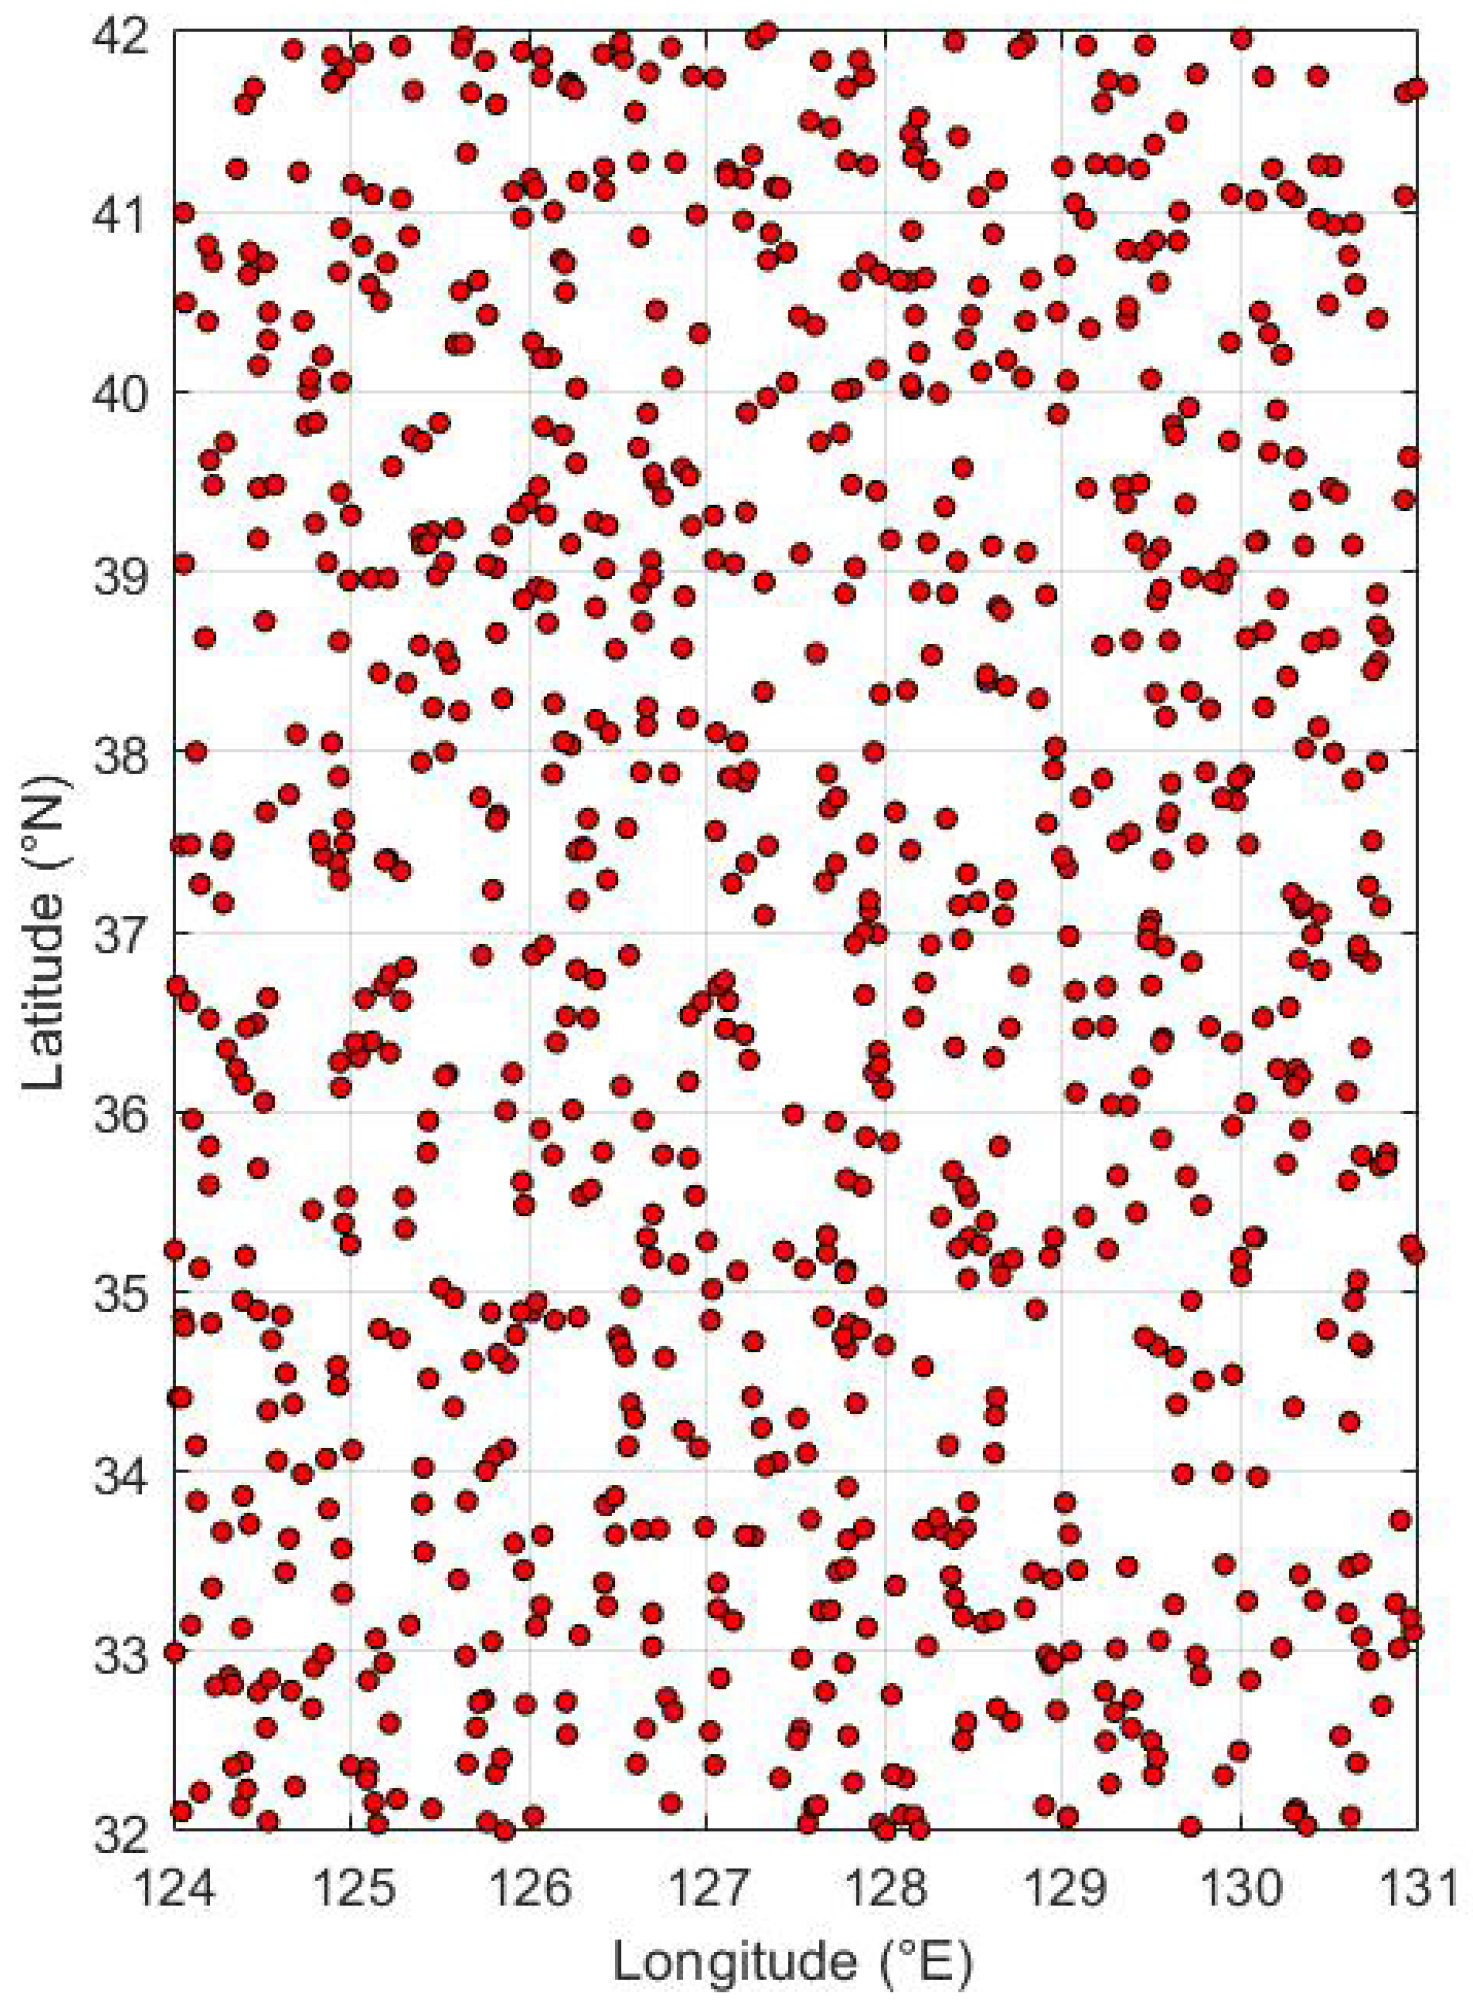
Figure 8.
Simulation Workflow.
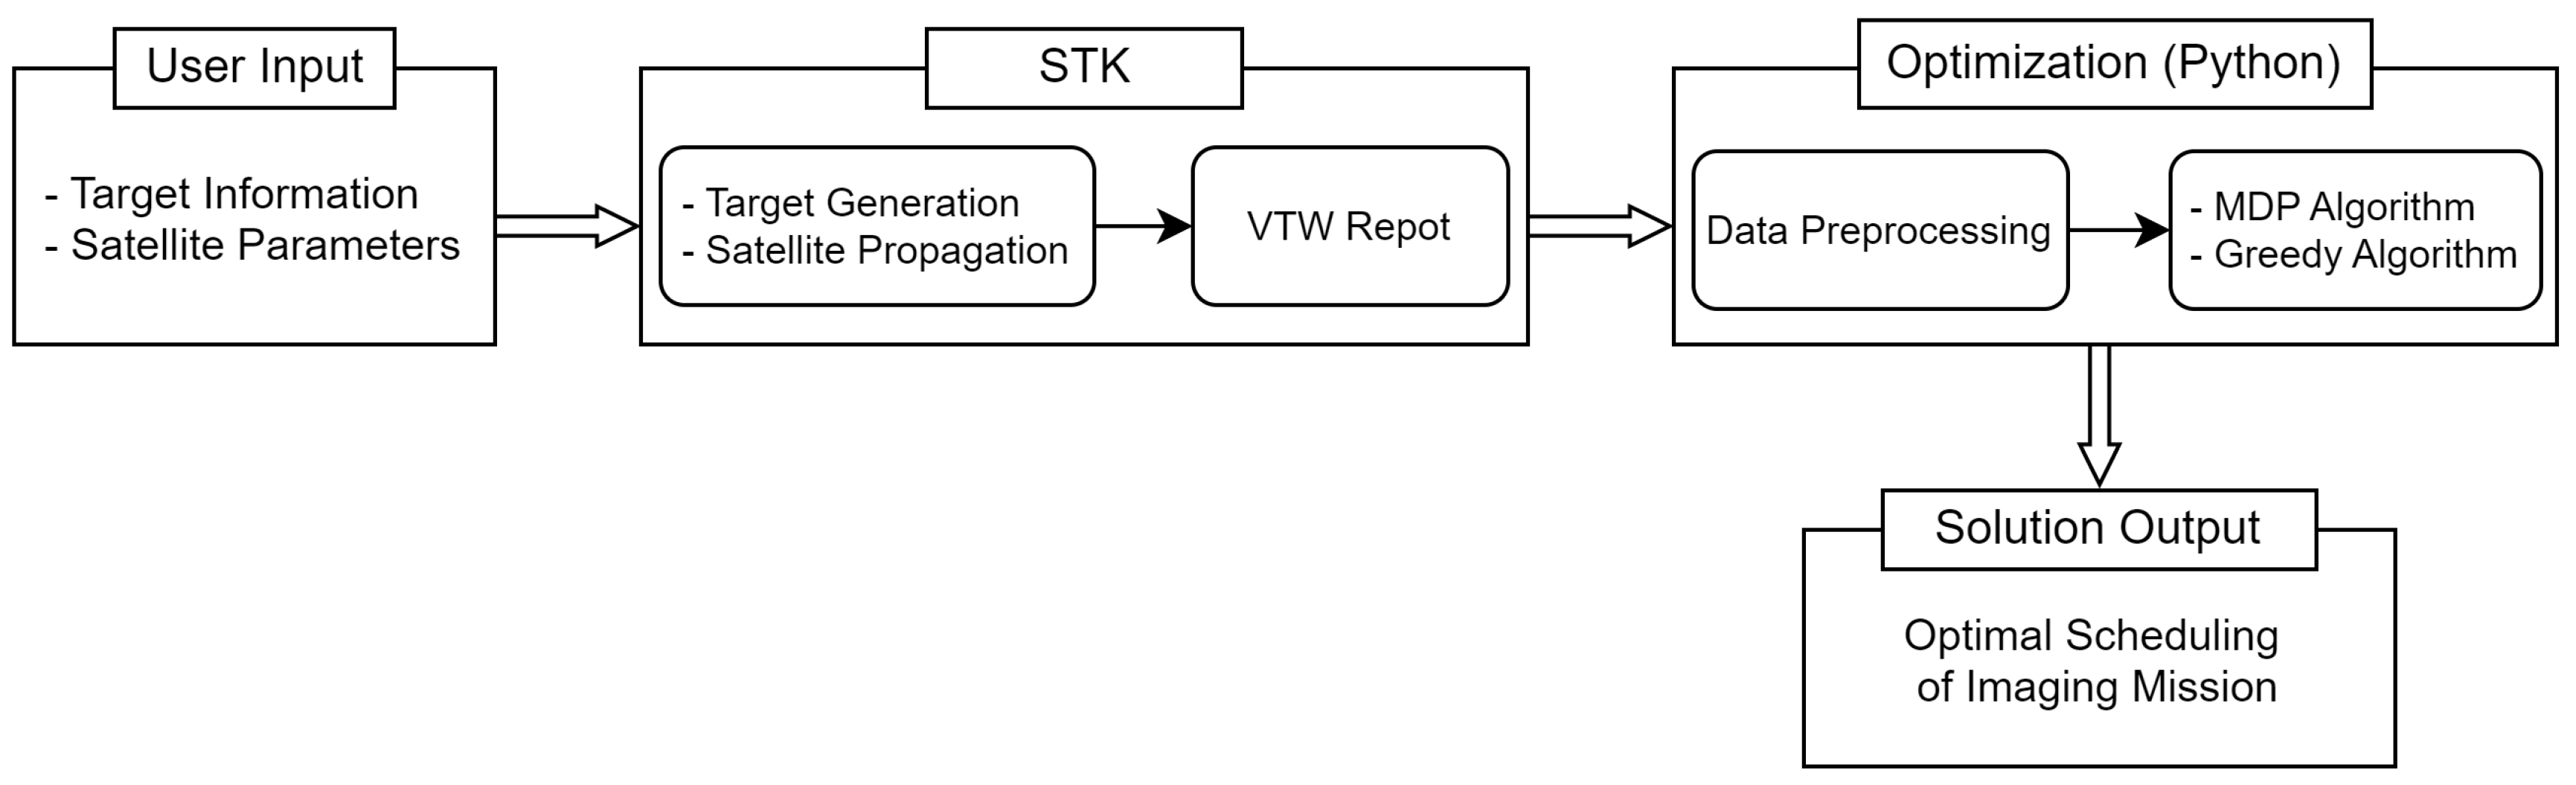
Figure 9.
Mission allocation results under all test cases.
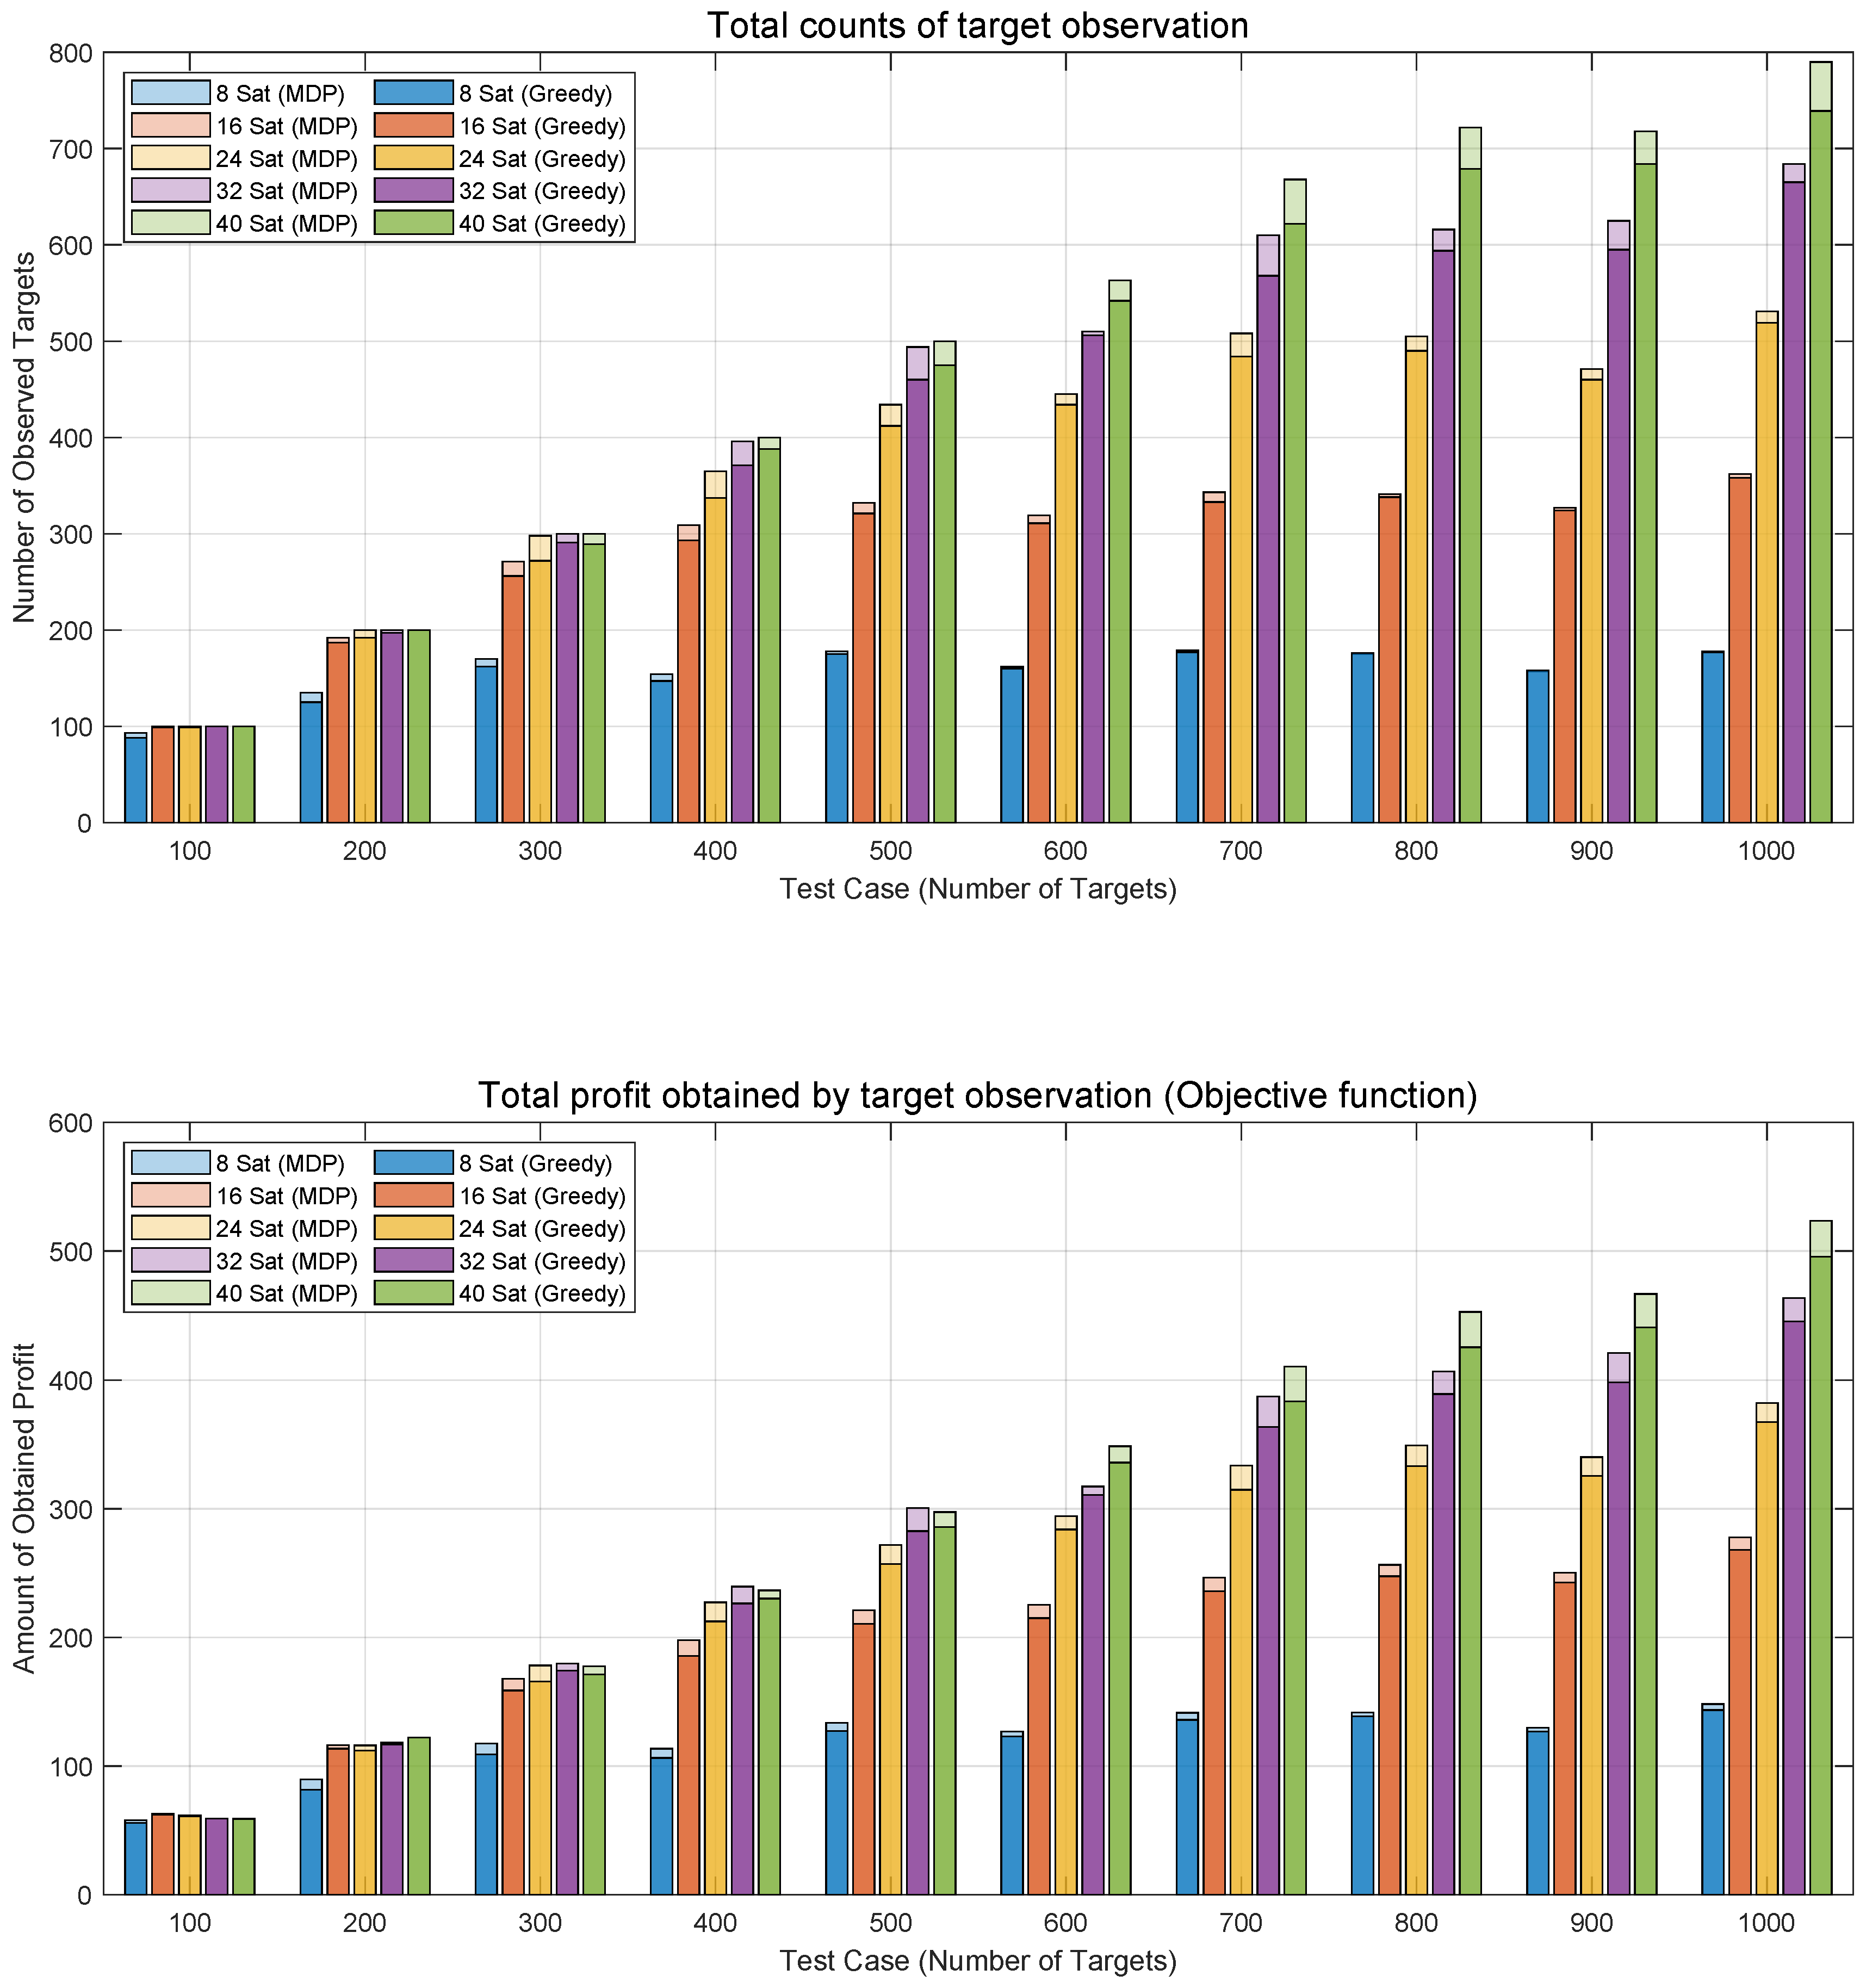
Figure 10.
Analysis of mission success rate.
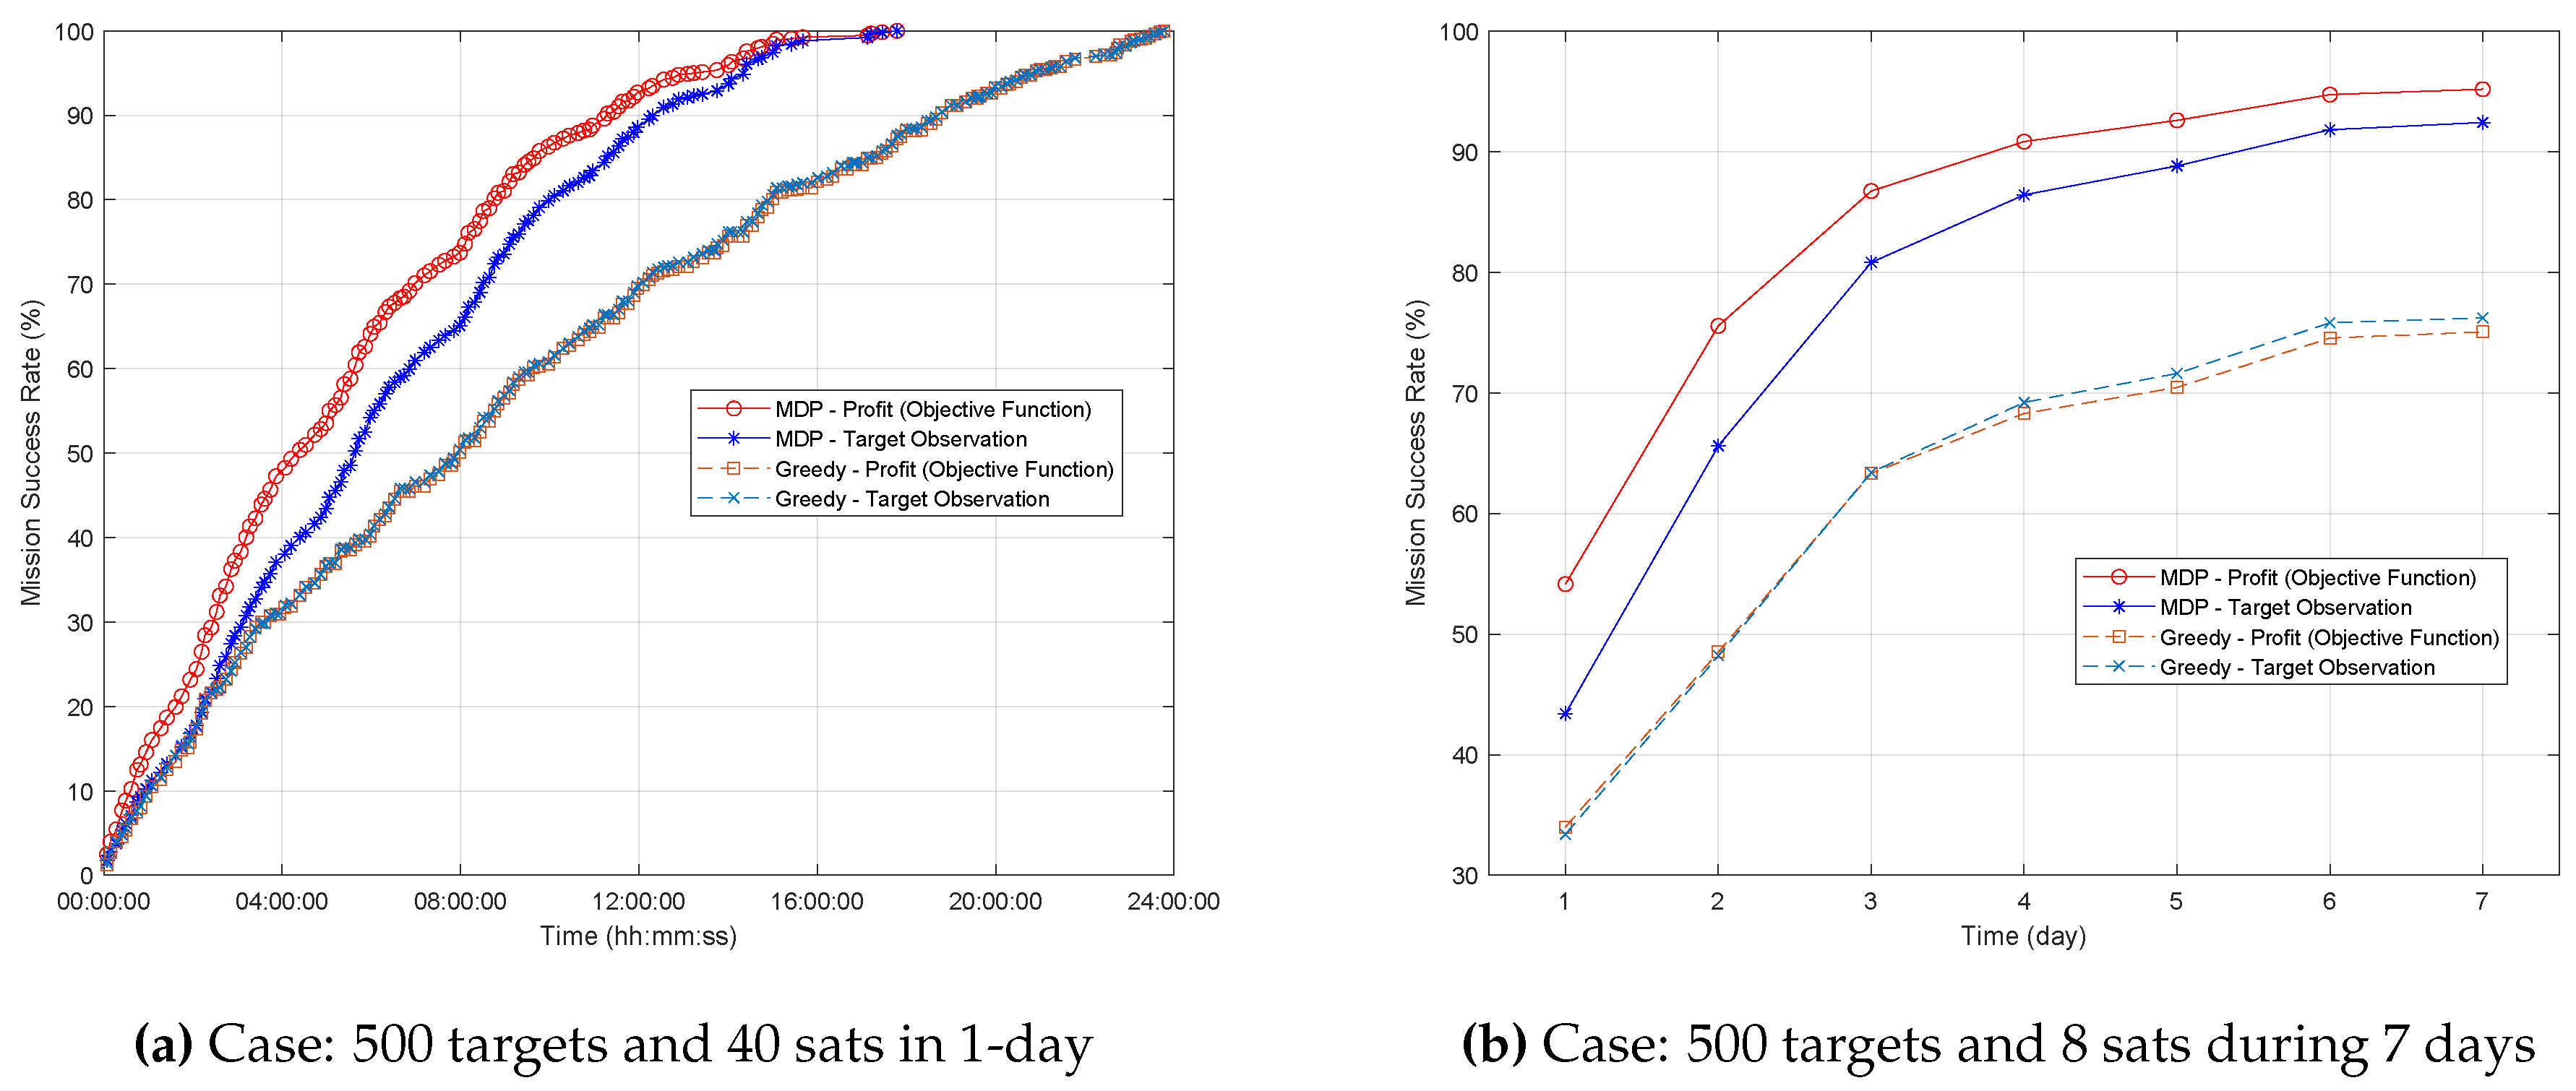
Figure 11.
Target profit vs. Mean revisit time (5 times revisit for 100 targets).
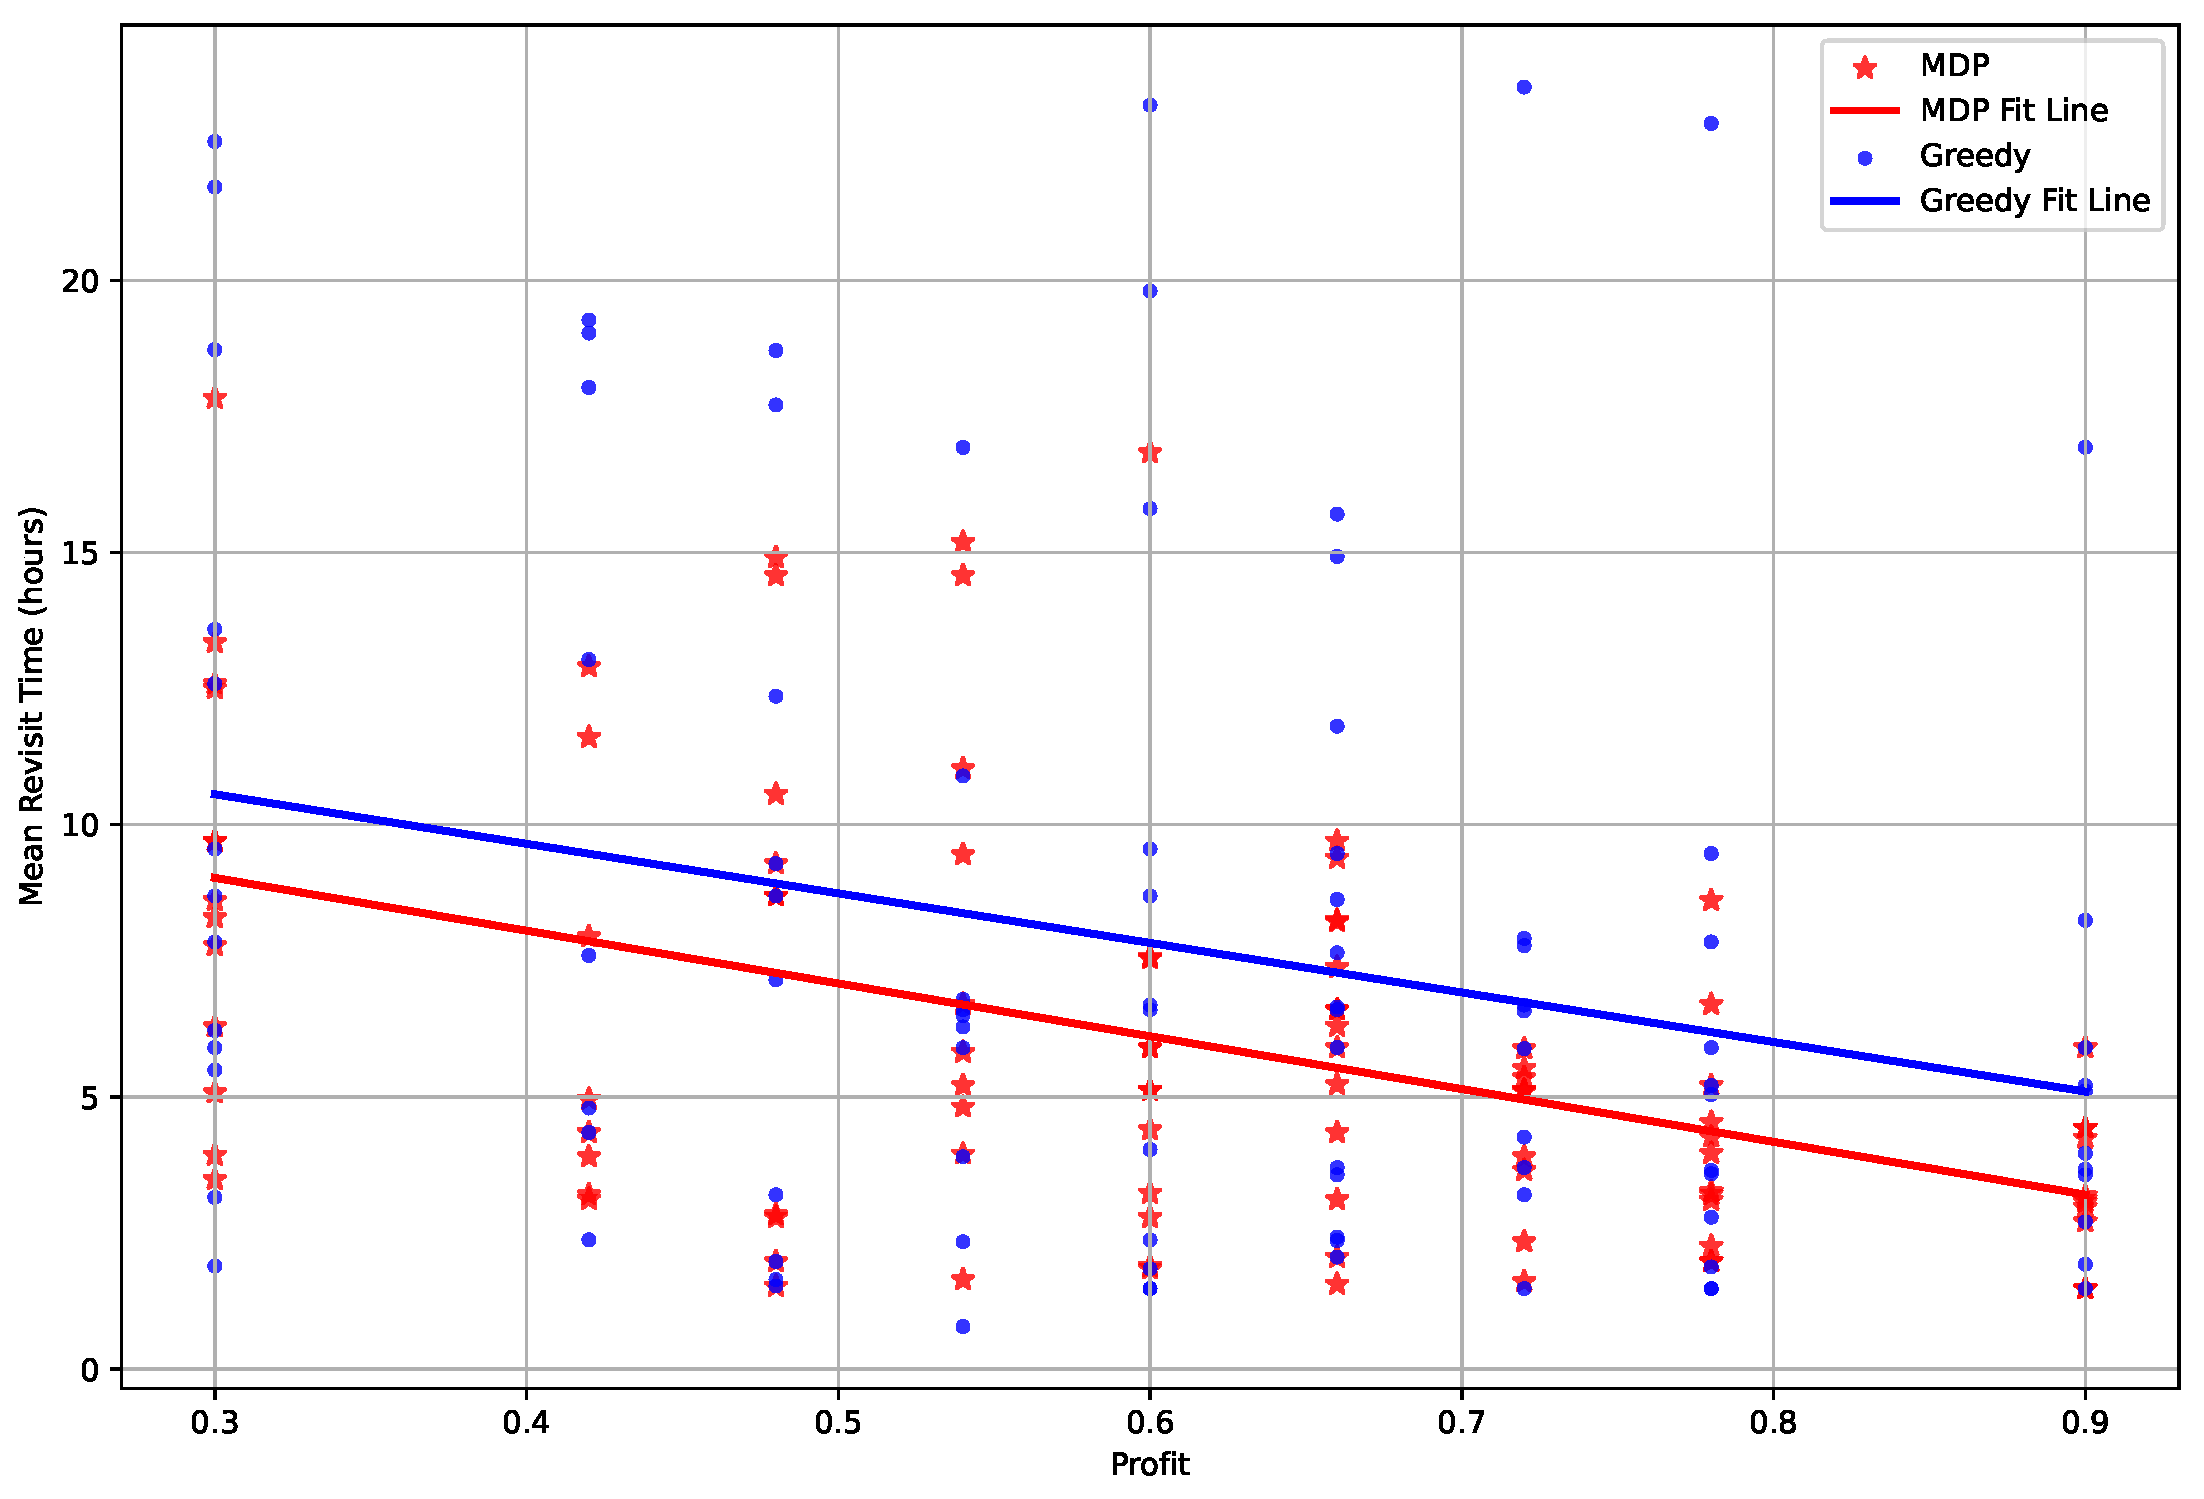
Figure 12.
Box plot of mean revisit time.
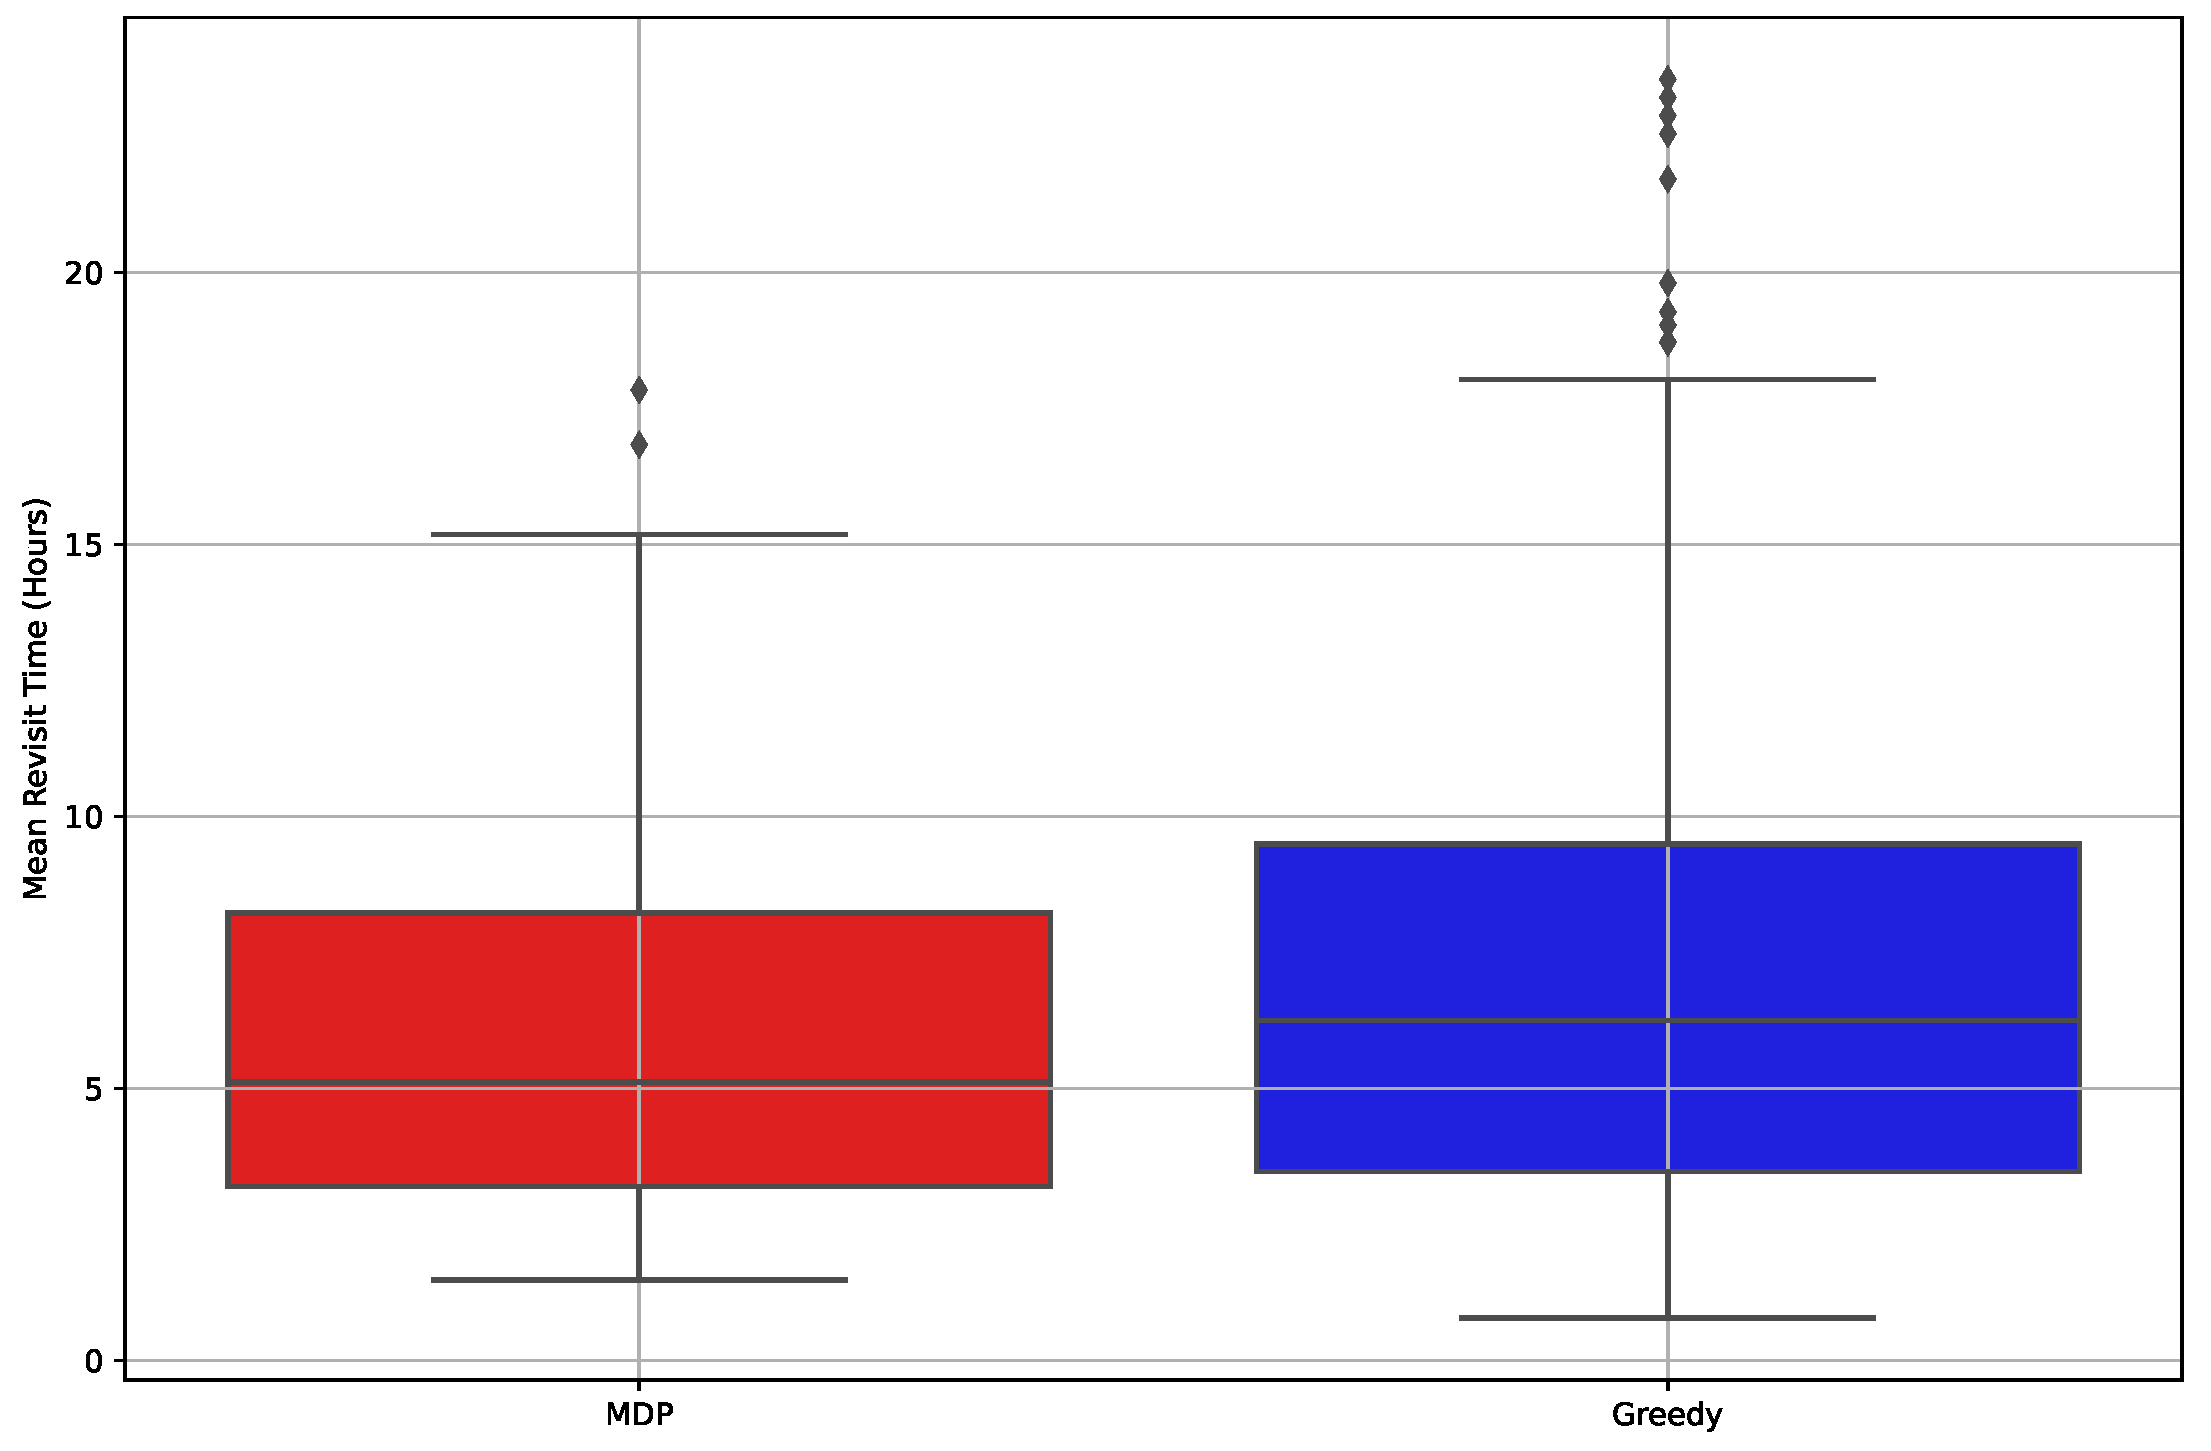
Figure 13.
Computation time comparison of MDP and Greedy algorithms under all test cases.
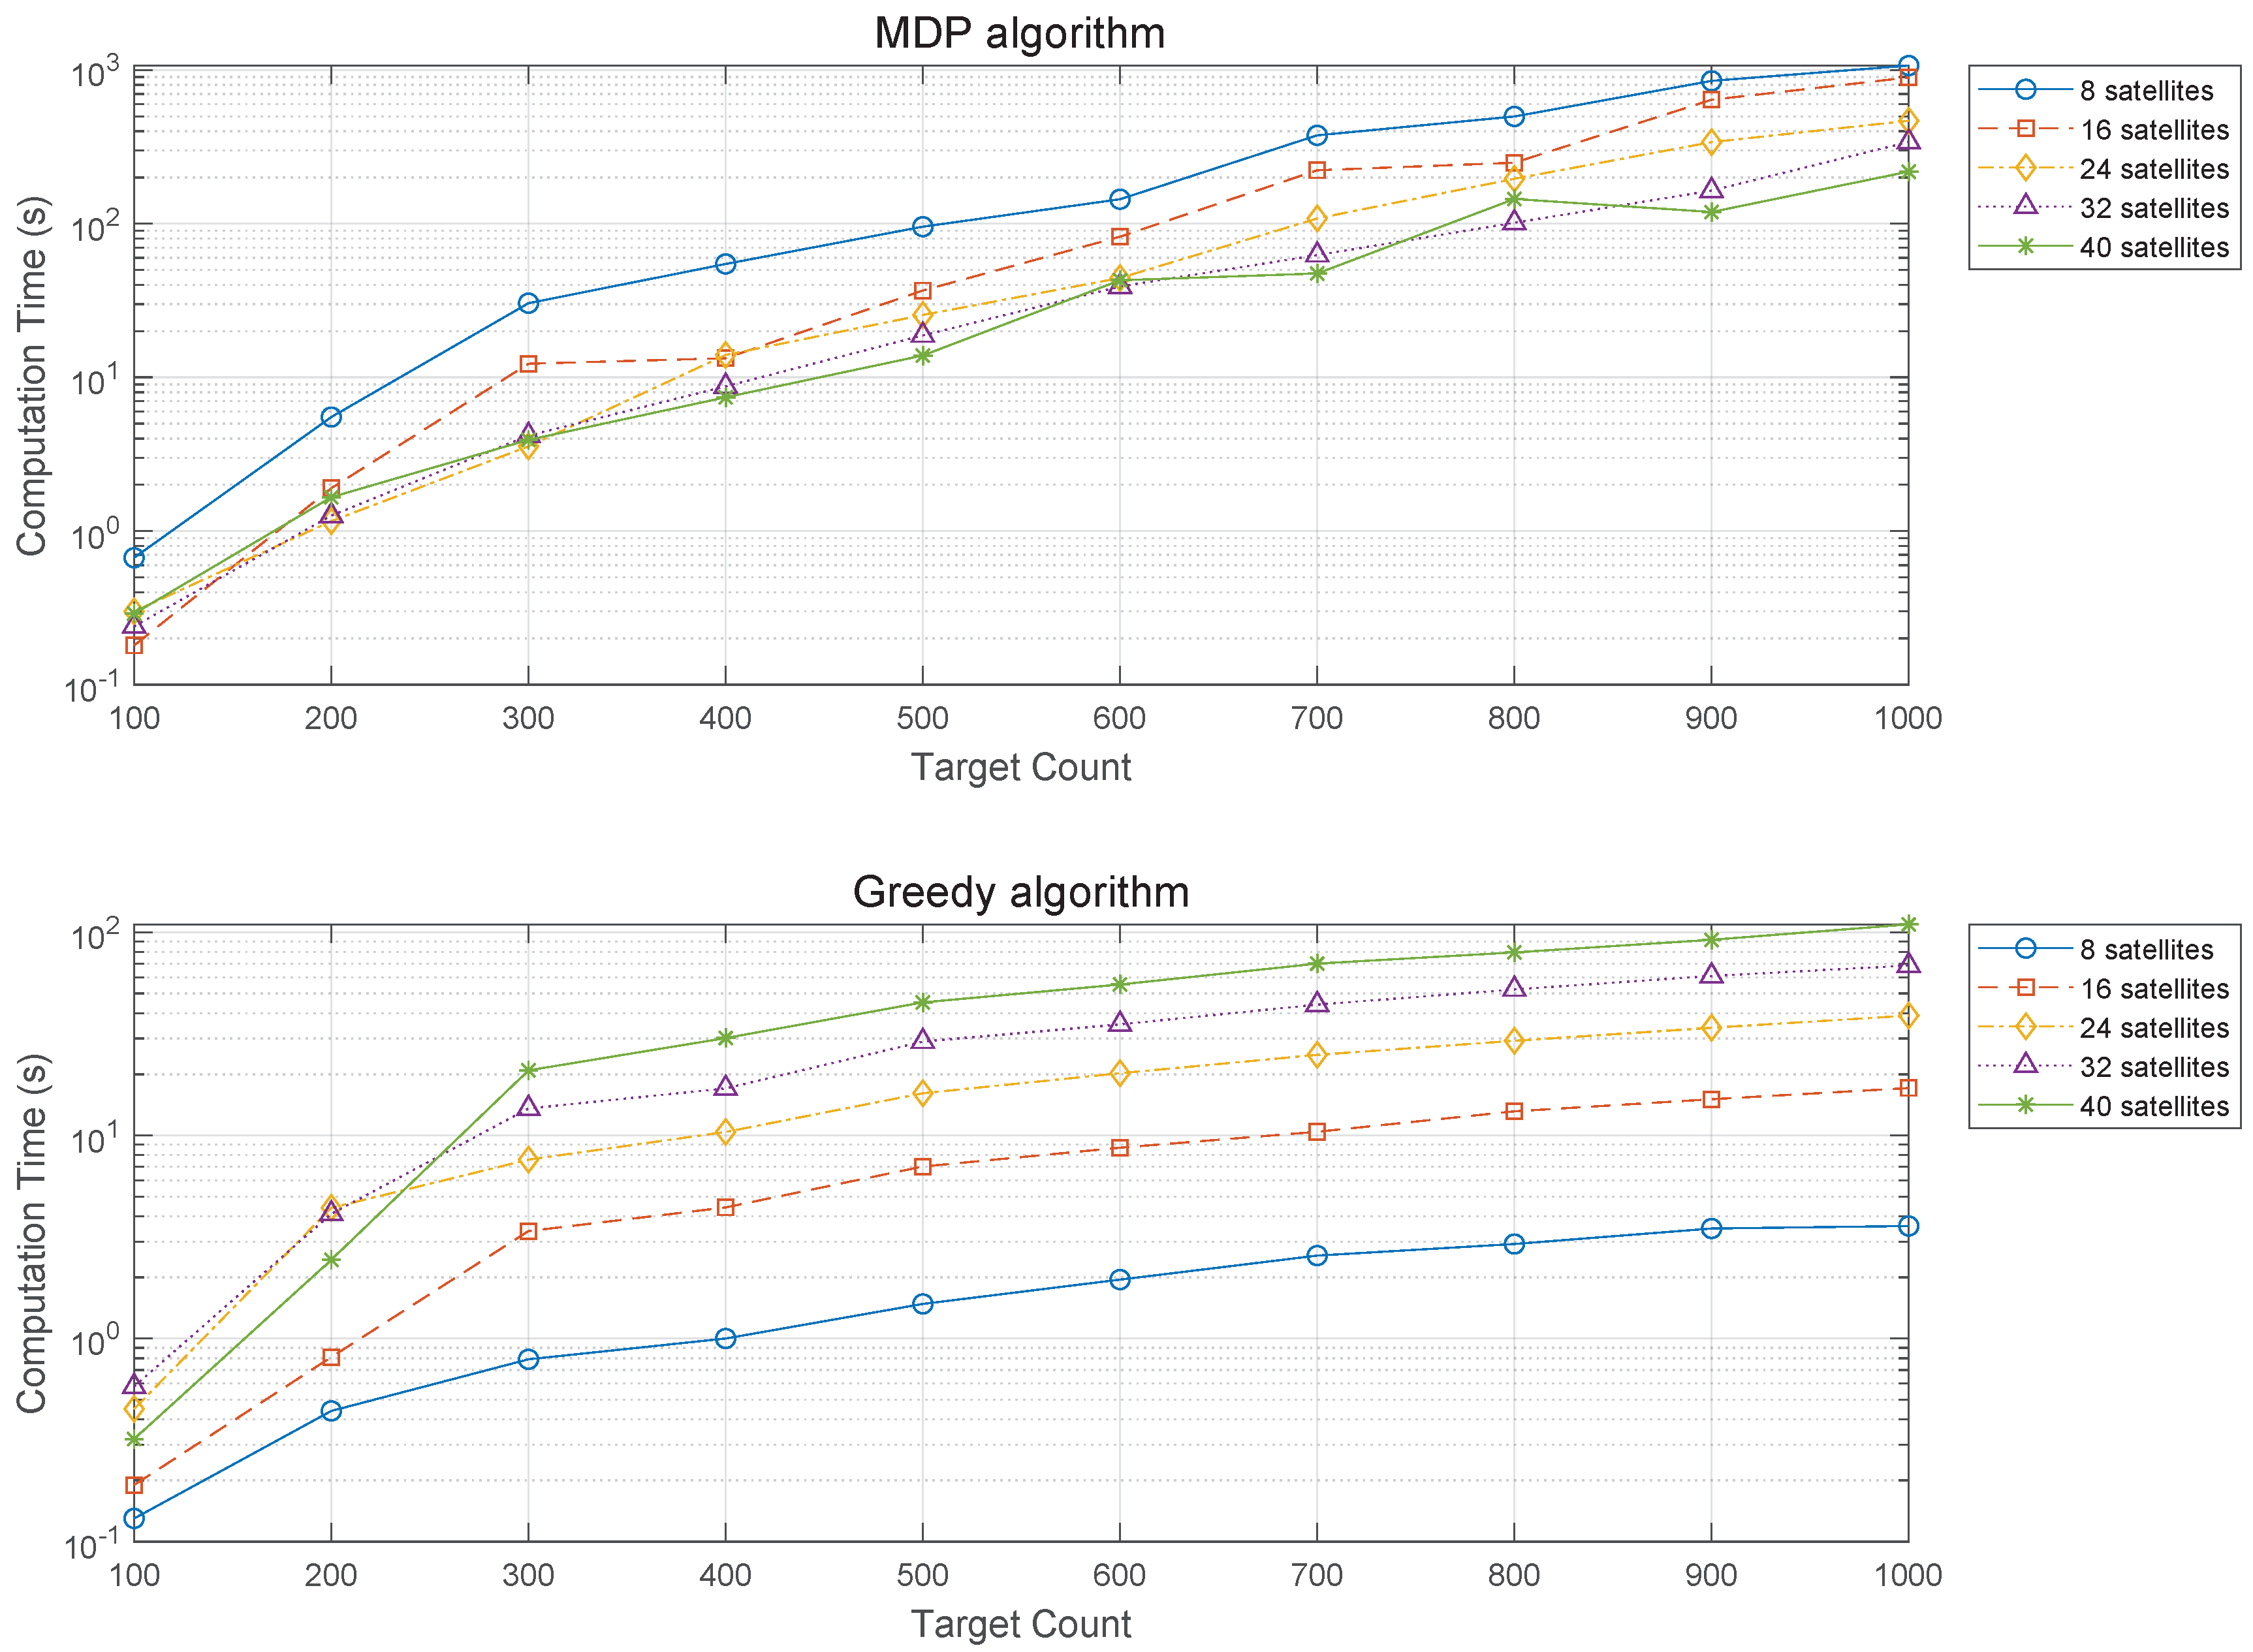

Table 1.
Notation.
| Variable | Definition |
|---|---|
| i | Index number of target candidates, |
| j | Index number of satellites, |
| k | Index number of visible time windows, |
| l | Index number of time intervals, |
| I | Set of target candidates |
| J | Set of satellites |
| Set of visible time windows of target i by satellite j | |
| Set of time intervals by satellite j | |
| visible time window of target i by satellite j | |
| time interval by satellite j | |
| Decision variable of target observation in | |
| Start time of | |
| End time of | |
| Start time of observation in | |
| End time of observation in | |
| Observation time duration in | |
| Gap time of satellite j | |
| Duty time per pass of satellite j | |
| Profit obtained when observing target i | |
| Significance measure of target i | |
| Urgency measure of target i | |
| Weighting factor |
Table 2.
Simulation parameters.
| Parameter | Value |
|---|---|
| Scheduling period (day) | |
| Mission area (°) | 32-42N, 124-131E |
| Number of targets | |
| Walker delta constellation | 44.1°: 40/8/1 |
| Altitude (km) | 500 |
| Incidence angle (°) | 25-45 |
| (s) | 20 |
| (s) | 10 |
| (s) | 60 |
| , | 1 |
| , | |
| 0.7, 0.3 |
Table 3.
Simulation environments.
| Index | Specification |
|---|---|
| Processor | Intel® Core™ i7-11700 |
| Memory (RAM) | 32 GB |
| Orbit analysis tool | AGI® STK (Systems Tool Kit) |
| Implement tool | VS Code |
| Framework | Python 3.10 |
Table 4.
Statistics of mean revisit time.
| Statistic | MDP (hour) | Greedy (hour) |
|---|---|---|
| Mean | 6.08 | 7.80 |
| Standard deviation | 3.77 | 6.00 |
| Minimum | 1.48 | 0.78 |
| 25th Percentile | 3.20 | 3.48 |
| Median | 5.13 | 6.25 |
| 75th Percentile | 8.23 | 9.49 |
| Maximun | 17.84 | 23.56 |
The bold text indicates the best parameter values for the two algorithms.
Disclaimer/Publisher’s Note: The statements, opinions and data contained in all publications are solely those of the individual author(s) and contributor(s) and not of MDPI and/or the editor(s). MDPI and/or the editor(s) disclaim responsibility for any injury to people or property resulting from any ideas, methods, instructions or products referred to in the content. |
© 2024 by the authors. Licensee MDPI, Basel, Switzerland. This article is an open access article distributed under the terms and conditions of the Creative Commons Attribution (CC BY) license (http://creativecommons.org/licenses/by/4.0/).
Copyright: This open access article is published under a Creative Commons CC BY 4.0 license, which permit the free download, distribution, and reuse, provided that the author and preprint are cited in any reuse.


