
Submitted:
04 March 2024
Posted:
05 March 2024
You are already at the latest version
Abstract
Pituitary adenylate cyclase-activating polypeptide receptor 1 (PAC1-R) has a higher affinity for pituitary adenylate cyclase- activating polypeptide (PACAP) than for vasoactive intestinal peptide (VIP). PACAP exerts its neuroprotective effects through PAC1-R. PAC1-R has become a target for drug development, and we targeted PAC1-R to screen small positive allosteric modulator 1 (SPAM1). SPAM1 has a neuroprotective effects, and in the D-galactose (D-gal) mouse model, SPAM1 improved the structure of the hippocampal dentate gyrus and restored the number of neurons. Compared with D-gal model mice, SPAM1 treatment upregulated the expression of Sirtuin 6 (SIRT6) and Lamin B1, and downregulated the expression of YinYang 1 (YY1) and p16. Consistent with this, the same results were obtained in senescent RGC-5 cells. Meanwhile, SPAM1 was also found to up-regulate SIRT6 and down-regulate YY1 expression in normal RGC-5 cells. Then, we further explored the mechanism of SPAM1 neuroprotection by whole transcriptome sequencing and proteomic analysis, and found that SPAM is involved in the longevity regulating pathway, and confirmed the up-regulation of neurofilament light polypeptide and neurofilament medium polypeptide by western blot, thus laying a pharmacological foundation for SPAM1 as a therapeutic agent for neurodegenerative diseases. polypeptide and neurofilament medium polypeptide. Thus, it lays a pharmacological foundation for SPAM1 as a therapeutic drug for neurodegenerative diseases.
Keywords:
pituitary adenylate cyclase- activating polypeptide (PACAP)
; Pituitary adenylate cyclase-activating polypeptide receptor 1 (PAC1-R)
; D-galactose (D-gal)
; neuroprotective effects
; transcriptomic
; proteomic
1. Introduction
Pituitary adenylate cyclase-activating polypeptide receptor 1 (PAC1-R) is a G protein-coupled receptor (GPCR) that has a higher affinity for pituitary adenylate cyclase- activating polypeptide (PACAP) than for vasoactive intestinal peptide (VIP). [1]. PAC1-R is widely distributed in the central nervous system, and in the adult brain, PAC1-R expression is particularly high in neurogenic regions such as the subventricular zone of the olfactory bulb or the dentate gyrus of the hippocampus [2]. PACAP's anti-apoptotic effects, induction of neural stem cell differentiation [3] and antioxidant effects are mediated by PAC1-R [4]. PACAP inhibits pathological processes in Alzheimer's disease (AD) and Parkinson's disease (PD) models through PAC1-R [5], and thus PAC1-R could be a target for the development of drugs for neurodegenerative diseases.
In a previous study, we used computerized molecular docking to screen Doxycycline and minocycline for docking with PAC1-R. Experiments verified that both had neuroprotective effects and confirmed that Doxycycline was a positive allosteric modulator targeting PAC1-R [6,7]. In addition, we obtained new positive allosteric modulators targeting PAC1-R by computerized virtual screening and laboratory screening which was named small positive allosteric modulator 1 (SPAM1) (Patent No.: CN202210388027.7; Molecular Formula: C20H19N3O4), And SPAM1 targeted PAC1-R with significantly higher affinity than DOX, and SPAM1 had more effective cytoprotective activity [8]. We showed in our latest study that SPAM1 induces nuclear translocation of PAC1-R, which exerts neuroprotective effects by regulating neuronal restriction silencing factor (NRSF) [9].
Sirtuin 6 (SIRT6) is a member of the Sirtuin family that promotes dendritic morphogenesis in hippocampal neurons during developmental stages [10]. SIRT6 is associated with the aging process and has DNA repair [11] and neuroprotective effects, and severely reduced levels of SIR6 have been observed in patients with Alzheimer's disease [12]. YinYang 1 (YY1) is a zinc finger protein that belongs to the GLI-Küppel gene family [13]. The expression level of YY1 increases with age [14]. Global knockout of YY1 resulted in mouse embryonic death, and mice exhibited motor deficits and cognitive deficits in the YY1 conditional knockout mouse model [15]. Studies have shown that a decline in LaminB1 levels during the aging process leads to senescence and neurodegenerative diseases such as Alzheimer's and Parkinson's disease [16]. Decreased LaminB1 expression levels cause age-dependent decrease in hippocampal neural stem cell activity [17]. Both p16 and Lamin B1 are recognized as biomarkers of cellular senescence [18].
In the present study, we demonstrated that SPAM1 up-regulated the expression of SIRT6 and Lamin B1 and down-regulated the expression of YY1 and p16 in the hippocampus of D-gal-induced aging model mice. In this study, we combined whole transcriptome sequencing and proteomic analysis to further investigate the mechanism by which SPAM1 exerts neuroprotective effects, thereby laying the pharmacological foundation for SPAM1 as a therapeutic agent for neurodegenerative diseases.
2. Results
2.1. SPAM1 Prevents D-gal- Mediated Reduction in the Number of Mouse Hippocampal Neurons
The dentate gyrus functions as a "gatekeeper" regulating the influx of information into the hippocampus. It plays a critical role in learning, memory consolidation, spatial navigation, and emotional regulation [19]. HE staining showed that the number of neurons in the hippocampus of the mouse brain was reduced after treatment with D-gal compared with the normal group. Nevertheless, SPAM1 with varying concentrations restored the number of neurons in the hippocampal region to its original form as per the group treated with it, in comparison to the D-gal group. Among them, 0.1μmol/kg/d SPAM1 group and 100μmol/kg/d SPAM1 had significant effects (Figure 1). Suggests that treatment with SPAM1 reverses the D-gal-mediated reduction in the number of hippocampal neurons in the mouse brain.
2.2. SPAM1 Ameliorated RGC-5 Cells Senescence
To investigate the effect of SPAM1 on the senescence of RGC-5 cells, RGC-5 cells were cultured for 40 days with SPAM1 (1-100 μM) and assayed by β-gal staining. It was observed that the number of β-gal-positive RGC-5 cells was significantly reduced by the action of SPAM1(Figure 2), indicating that SPAM1 has inhibitory properties on senescent RGC-5 cells.
2.3. SPAM1 Treatment Upregulated the Expression of SIRT6 and Lamin B1, and Downregulated the Expression of YY1 and p16 in RGC-5 Cells and Mouse Brain
In this study, we found that the expression levels of senescence-related proteins such as Lamin B1 and p16 in RGC-5 cells were affected by SPAM1, which down-regulated the expression of p16 and up-regulated the expression of Lamin B1 (Figure 3a-c). In the present study, we further investigated the mechanism of SPAM1 and found that SPAM1 down-regulated the expression of YY1 and up-regulated the expression of SIRT6 (Figure 3d). Interestingly, we found that SPAM1 similarly downregulated YY1 expression as well as upregulated SIRT6 expression in non-senescent 10-day-old RGC-5 cells (Figure 3e). These results suggests that SPAM1 exerts anti-aging and neuroprotective effects by regulating the expression of YY1 and SIRT6 in RGC-5 cells.
Immunohistochemical experiments showed that the expression of SIRT6 and Lamin B1 in the hippocampus of mice in the D-gal-treated group was decreased compared with that in the NOR group, while the use of SPAM1 increased the expression of Lamin B1(Figure 4a) and SIRT6 (Figure 4c). Compared with the NOR group, the expression of P16 and YY1 was increased in the hippocampus of D-gal-treated mice. The use of SPAM1 decreased the expression of P16(Figure 4b) and YY1 (Figure 4d). The results demonstrated the anti-aging and neuroprotective effects of SPAM1 at the brain tissue level.
2.4. Analysis of Differentially Expressed mRNAs, lncRNAs, circRNAs and miRNAs
|Fold Change| ≥ 1.5 and pvalue < 0.05 were used as the criteria for screening differentially expressed mRNAs, |Log2(Fold Change)| ≥ 1 and FDR < 0.05 were used as the criteria for screening differentially expressed LncRNAs and differentially expressed circRNAs, and |Log2(Fold Change)| ≥ 1 and pvalue < 0.05 as the criteria for screening differentially expressed miRNAs.
Whole transcriptome sequencing results showed that there were a total of 252 differentially expressed RNAs in the SP group compared to the DA group. 107 differentially expressed mRNAs, including 45 up-regulated and 62 down-regulated mRNAs. 44 differentially expressed lncRNAs, including 20 up-regulated and 24 down-regulated lncRNAs. 85 differentially expressed circRNAs, including 42 up-regulated and 43 down-regulated lncRNAs. 16 differentially expressed miRNAs, including 7 up-regulated and 9 down-regulated miRNAs. 43 down-regulated lncRNAs. differentially expressed miRNAs totalled 16, including 7 up-regulated and 9 down-regulated miRNAs. Hierarchical cluster analysis aims to cluster RNAs with identical or similar expression patterns. The heatmap consistently clustered the three samples from the DA and SP groups, indicating that differentially expressed mRNAs, lncRNAs, circRNAs and miRNAs are highly reproducible. These results confirm the reliability of the transcriptome analysis in this study (Figure 5a-d). The volcano plot permits observation of distinctions in the expression levels of mRNAs, lncRNAs, circRNAs and miRNAs between two groups, as well as the statistical significance of the differences (Figure 6a-d).
2.5. Functional Annotation and Enrichment Analysis of Differentially Expressed mRNAs
A total of 107 differentially expressed mRNAs were identified in this study, and GO and KEGG enrichment analyses were performed based on these differentially expressed mRNAs. The numbers of differentially expressed mRNAs annotated in GO and KEGG databases were 75 and 19, respectively (Figure 7a). This study shows the top 20 pathways with the least significant Q values in the KEGG pathway enrichment analysis of differentially expressed mRNAs. Differentially expressed mRNAs were enriched in renin-angiotensin system, phospholipase D signaling pathway, neuroactive ligand−receptor interaction, etc (Figure 8a).
2.6. Functional Annotation and Enrichment Analysis of Differentially Expressed LncRNA Target Genes
In this study, functional annotation of differentially expressed LncRNA target genes was performed, and a total of 492 significant differentially expressed LncRNA target genes were annotated, 442 (Figure 7b) and 87 were annotated in the GO database and KEGG database, respectively. This study shows the top 20 pathways with the least significant Q value in the KEGG pathway enrichment analysis of differentially expressed LncRNA target genes. Differentially expressed LncRNA target genes were enriched in the olfactory transduction, longevity regulating pathway - multiple species, longevity regulating pathway, circadian entrainmen, cell cycle, etc (Figure 8b).
2.7. Functional Annotation and Enrichment Analysis of Host Gene that Differentially Expresses circRNAs
In this study, functional annotation of host gene that differentially expresses circRNAs was performed, and a total of 71 significant host gene that differentially expresses circRNAs were annotated in the GO database and KEGG database, 71 (Figure 7c) and 30 respectively. This study shows the top 20 pathways with the least significant Q value in the KEGG pathway enrichment analysis of host gene that differentially expresses circRNAs. Host gene that differentially expresses circRNAs were enriched in ubiquitin mediated proteolysis, synaptic vesicle cycle, hedgehog signaling pathway, circadian rhythm, cGMP-PKG signaling pathway, cAMP signaling pathway, etc (Figure 8c).
2.8. Functional Annotation and Enrichment Analysis of Differentially Expressed miRNA Target Genes
In this study, we performed functional annotation of differentially expressed miRNA target genes, and a total of 4493 differentially expressed miRNA target genes were annotated, and 4246 (Figure 7d) and 975 were annotated in the GO database and KEGG database, respectively. This study shows the top 20 pathways with the least significant Q value in the KEGG pathway enrichment analysis of differentially expressed miRNA target genes. Differentially expressed miRNA target genes were enriched in protein digestion and absorption, lysine degradation, hematopoietic cell lineage, cAMP signaling pathway, calcium signaling pathway, basal cell carcinoma, etc (Figure 8d).
2.9. Whole Transcriptome Association Analysis
GO enrichment analysis showed that differentially expressed mRNAs, differentially expressed LncRNA target genes, differential circRNA host genes and differentially expressed miRNA target genes are all involved in synapses, synapse part, responses to stimulus, developmental process, signaling, cell proliferation, etc. Both differentially expressed LncRNA target genes and differentially expressed miRNA target genes are involved in antioxidant activity (Figure 7a-d).
In this study, genes in key RNAs were analyzed for pathway enrichment, and the top 5 most significantly enriched pathways were selected. The gene-to-gene relationships in these 5 pathways were extracted and integrated into a pathway network (Figure 9a).
In this study, targeting relationship Combined analysis was performed for differentially expressed RNAs. Differentially expressed circRNA as the center of targeting relationship combined analysis.The intersection of differentially expressed circRNAs with all circRNAs targeted by differentially expressed miRNAs was 65 circRNAs. the intersection of all circRNAs that used differentially expressed genes as host gene with all circRNAs targeted by differentially expressed miRNAs was 18 circRNAs (Figure 9b).
Combined analysis of targeting relationships centered on differentially expressed miRNAs. The intersection of differentially expressed miRNAs with all miRNAs targeted by differentially expressed mRNAs was 7 miRNAs. The intersection of differentially expressed miRNAs with all miRNAs targeted by differentially expressed circRNAs was 13 miRNAs. And the intersection of all miRNAs targeted by differentially expressed mRNAs with all miRNAs targeted by differentially expressed circRNAs was 897 miRNAs. the intersection of the triple intersection was 7 miRNAs (Figure 9c).
Combined analysis of targeting relationships centered on differentially expressed mRNAs. The intersection of all targeted mRNAs that differentially express miRNAs with all host genes that differentially express circRNAs was 26 mRNAs (Figure 9d).
2.10. Analysis of Differentially Expressed Proteins
In this study, proteomic analysis of DA and SP groups was further performed to look for differentially expressed proteins in mouse brain tissues after the action of SPAM1. FoldChange ≥1.2 or ≤0.83 with pvalue <0.05 was used as a screening criterion. Compared with the DA group, there were 41 differentially expressed proteins in the SP group, of which 32 were up-regulated and 9 were down-regulated (Figure 10a-b). Proteins up-regulated include barrier-to-autointegration factor, calcium/calmodulin-dependent protein kinase type II subunit alpha, calcium/ calmodulin-dependent protein kinase type II subunit beta, neurofilament light polypeptide (NEFL), neurofilament medium polypeptide (NEFM), neurofilament heavy polypeptide, peripherin, apolipoprotein D and leucine-rich repeat-containing protein 4.
To further grasp the connections between differentially expressed proteins, this study also mapped the differentially expressed protein string network (Figure 10c).
2.11. Functional Annotation and Enrichment Analysis of Differentially Expressed Proteins
In this study, we functionally annotated the differentially expressed proteins, and a total of 41 differentially expressed proteins were annotated, 39 and 41 in GO and KEGG databases, respectively. GO enrichment analysis showed that the differentially expressed proteins were involved in synapses, synapse part, responses to stimulus, developmental process, signaling, cell proliferation, etc (Figure 11a). This study shows the top 20 pathways with the least significant Q value in the KEGG pathway enrichment analysis of differentially expressed proteins. Differentially expressed proteins were enriched in neurotrophin signaling pathway, circadian entrainment, long-term potentiation, olfactory transduction, GnRH signaling pathway, etc (Figure 11b).
2.12. Combined Whole Transcriptome and Proteome Analysis
In this study, Spearman correlation coefficients were calculated based on the eigenvector values of the protein modules and the expression of the differential genes, and the interactions between differential genes and differential proteins could be found by Spearman correlation analysis to further explore the mechanism of action between strongly correlated genes and proteins. In this study, the top 50 genes with the smallest differential gene FDR values in transcriptomics analysis and the top 50 proteins with the smallest differential protein significance P-values in proteomics analysis were screened for the next correlation analysis (Figure 12a).
This study also screened 15 KEGG pathways, including calcium signaling pathway, neuroactive ligand-receptor interactions, and cholinergic-like synapses, which were common in transcriptomics and proteomics analyses.
In this study, the top 200 genes with the smallest differential gene FDR values in transcriptomics analysis and the top 50 proteins with the smallest differential protein P-values in proteomics were screened for network regulation analysis. Based on the top200 differential genes and top50 differential proteins screened, the correlation results with correlation absolute value >0.9 and correlation p-value <0.001 were further screened for network regulation mapping (Figure 12b).
2.13. Validation of Differentially Expressed Proteins
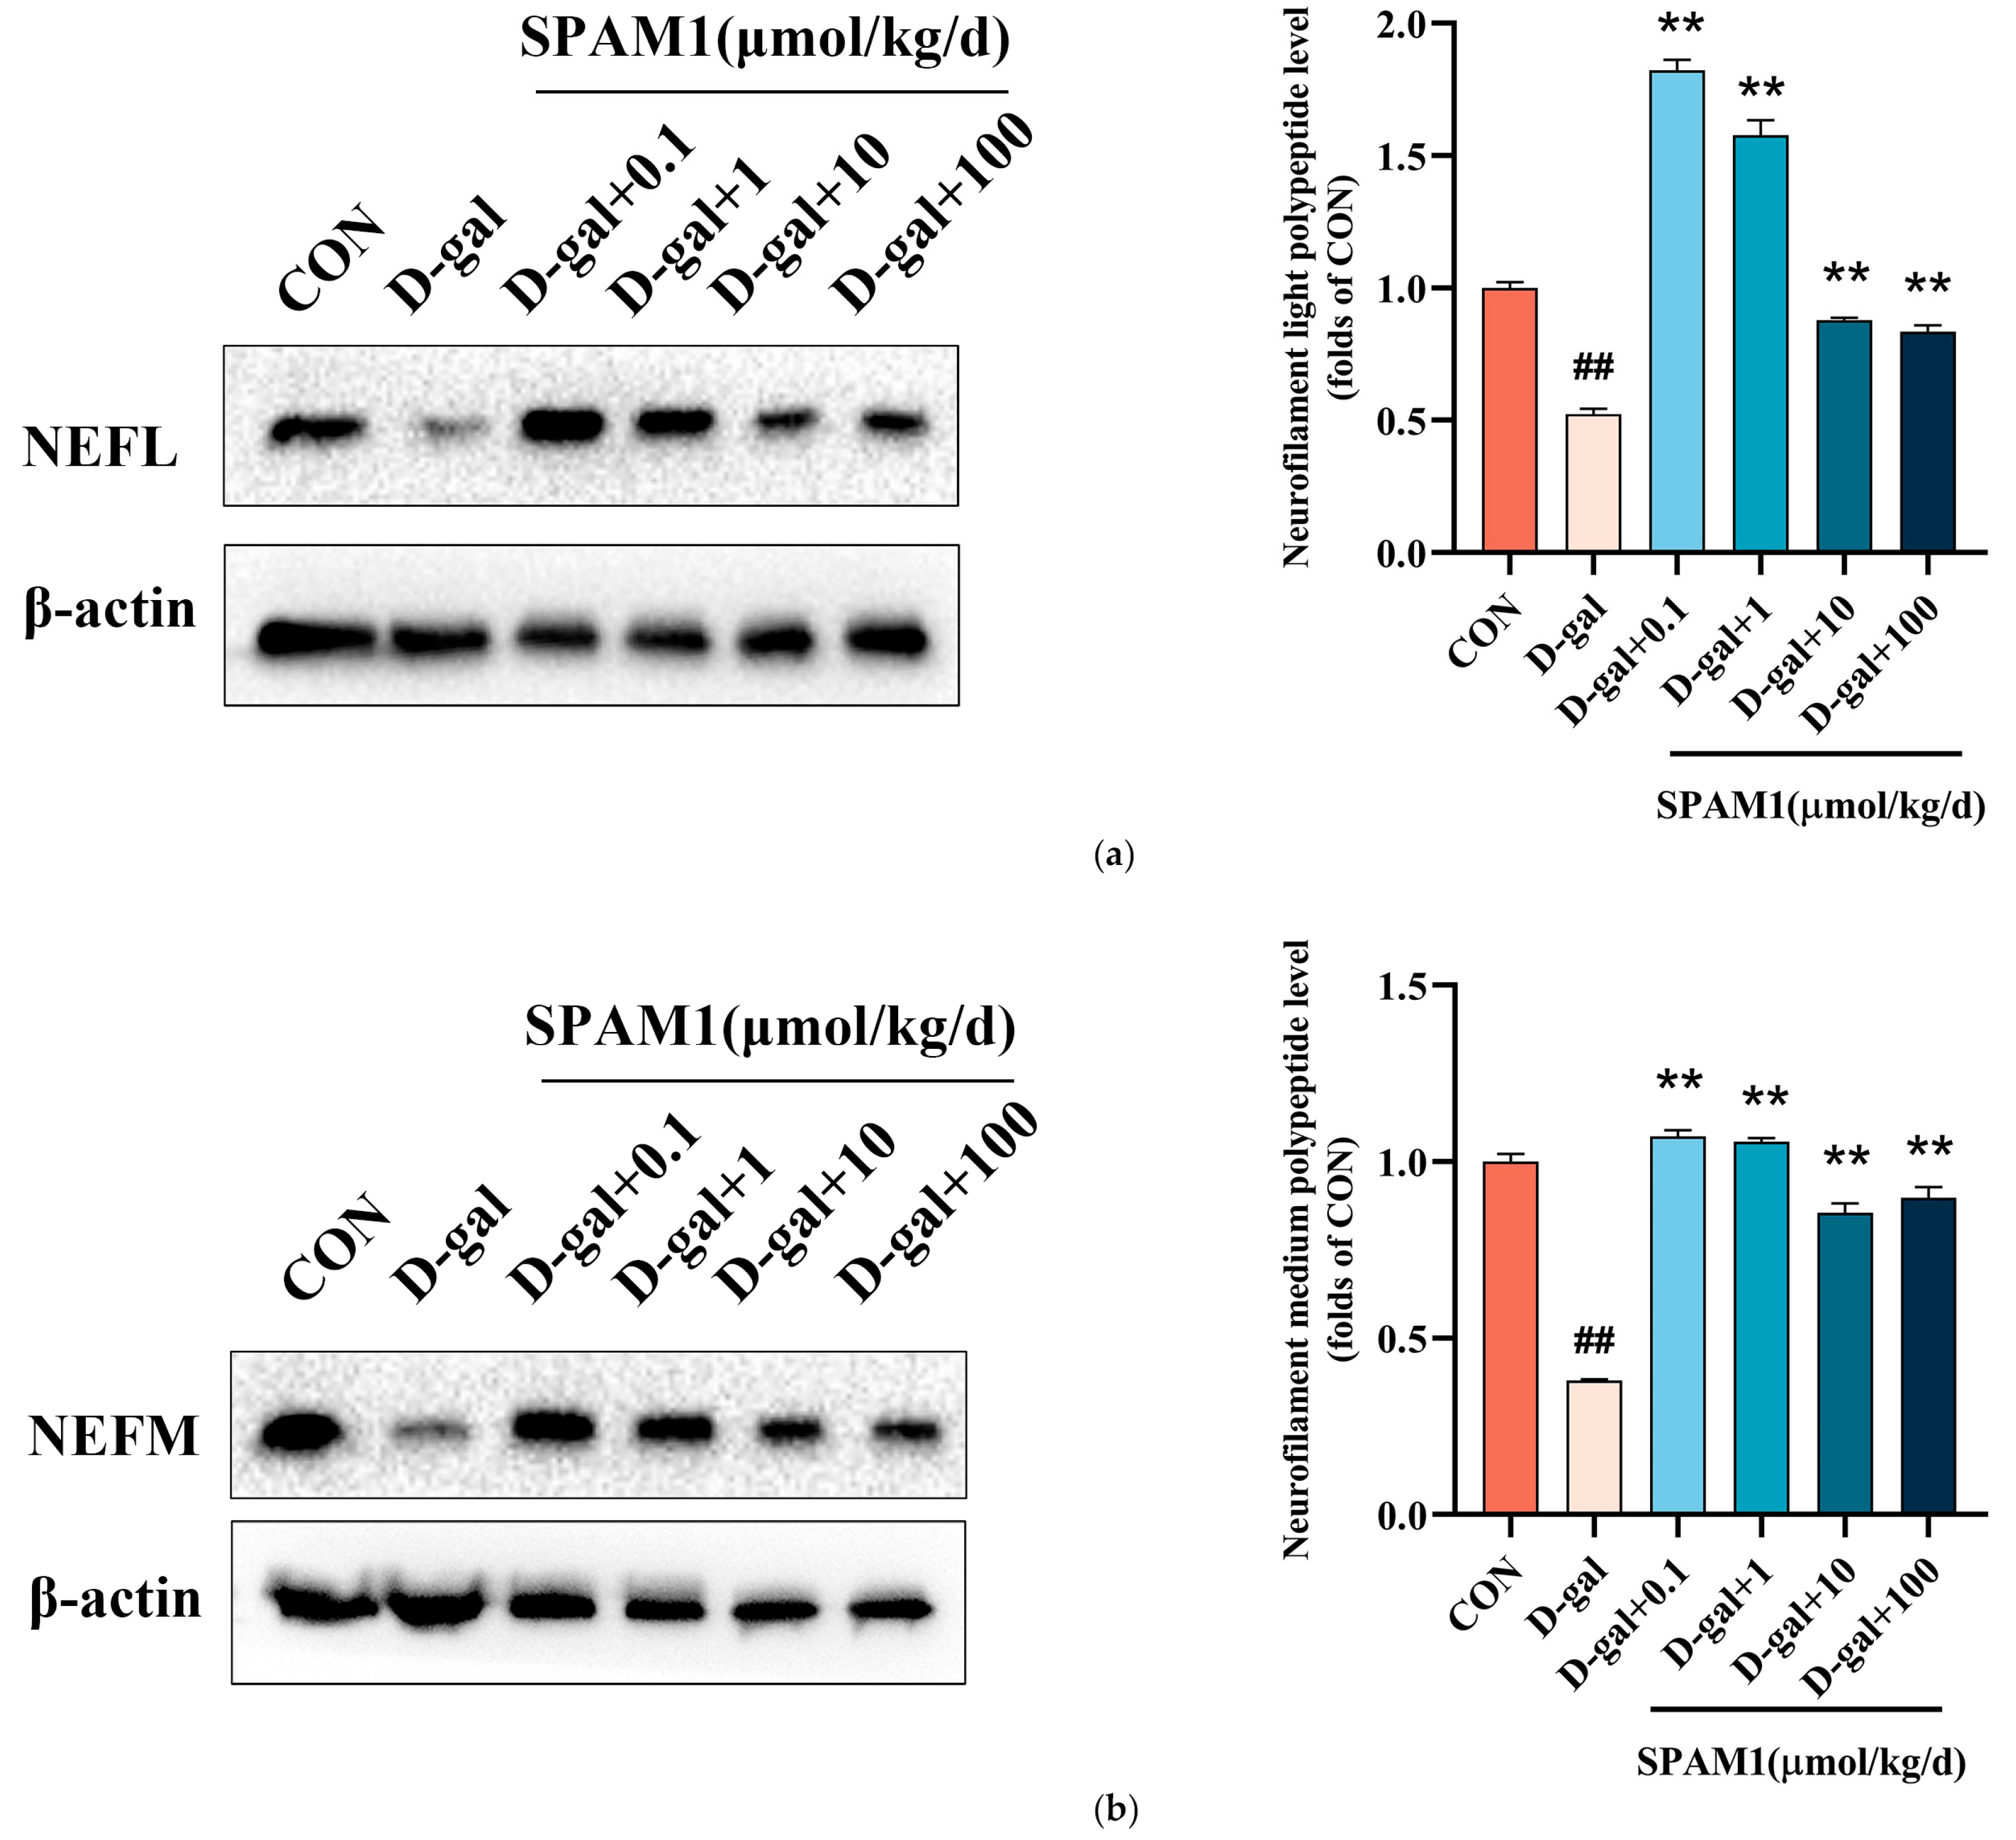
Based on the results of proteomic analysis, we further validated the protein expression levels after SPAM1 action in D-gal model mice. Consistent with the results of proteomic analysis, the protein levels of neurofilament light polypeptide (NEFL) and neurofilament medium polypeptide (NEFM) were significantly up-regulated by SPAM1 (Figure 13).
3. Discussion
GPCRs can regulate gene transcription through an unconventional mode of signal transduction, whereby the GPCR cleaves and relies on its carboxyl-terminal structural domain to translocate to the nucleus [20]. We demonstrated in a previous study that PAC1-R also has such a transduction pattern [9,21,22]. PAC1-R has a high affinity for PACAP due to a specific region of its N-terminal extracellular domain 1 (EC1) domain [1]. Because of its crucial role in the nervous system, PAC1-R has become a target for drugs [23]. In previous studies, we targeted PAC1-R-EC1 to screen doxycycline, minocycline, and SPAM1 in a previous study, and subsequent experiments demonstrated that SPAM1 had more significant neuroprotective activity [6,7,8]; nevertheless, little is known about the mechanism of action of SPAM1.
D-gal was used to induce a simulated aging model in mice [24]. DG plays a key role in hippocampal memory formation, and when DG lesions impair many hippocampus-dependent memory functions [25]. Accumulation of p16 occurs in senescent cells, and downregulation of Lamin BI is another important feature of cellular senescence [18]. SIRT6 is implicated in DNA repair, and mice knocked down for SIRT6 show a degenerative phenomenon similar to aging [26]. The new findings also suggest that the changes observed in SIRT6-deficient brains also occur in the aging human brain, particularly in patients with Alzheimer's, Parkinson's, Huntington's, and amyotrophic lateral sclerosis. SIRT6 is a key regulator of mitochondrial function in the brain and interacts with the transcription factor YY1 to jointly influence mitochondrial function [27]. It is accompanied by a decrease in SIRT6 levels and an increase in YY1 levels in aged mice [14]. Data from clinical studies indicate that plasma levels of YY1 are significantly elevated in patients with major depressive disorder [28]. Notably, we showed in a previous study by chromatin immunoprecipitation that YY1 may be recruited by the nuclear translocated PAC1-R [21]. In this study, we showed that compared with mice in the NOR group, the number of D-gal-induced DG neurons in the hippocampus of the brain was reduced and structural alterations were observed in the D-gal-induced senescent mouse model, which was accompanied by the down-regulation of the expression levels of SIRT6 and Lamin B1 in the DG, as well as the up-regulation of the expression levels of YY1 and p16. However, mice treated with different concentrations of SPAM1 showed an increase in the number of DG neurons, structural recovery, and reversal of the expression of the four proteins in the appeal, that is, up-regulation of SIRT6 and Lamin B1, and down-regulation of YY1 and p16. This suggests that SPAM1 plays a role in the maintenance of the structure of the hippocampus and in some of the protein expression levels, in other words, our results further support that SPAM1 has neuroprotective effects and treats neurodegenerative disorders. protective effects and therapeutic potential for neurodegenerative diseases. While at the cellular level, the same exploration was carried out in this study using RGC-5 cells and it was found that upregulation of p16 and downregulation of Lamin B1 accompanied in 40-day senescent RGC-5 cells compared to 10-day senescent RGC-5 cells, but the expression level of p16 was reduced and the level of Lamin B1 was elevated after the use of SPAM1. We likewise carried out the exploration of its mechanism and found that SPAM1 down-regulated the expression of YY1 and up-regulated the expression of SIRT6. Notably, such results were also presented in unsenescent 10-day-old RGC-5 cells, suggesting that this mechanism is also useful in normal neuronal cells. These results suggest that SPAM1 can exert anti-aging effects not only in senescent neuronal cells, but also in normal neuronal cells, and in corroboration with this, the present study found that the KEGG pathway involved in SPAM1 in transcriptomics includes the longevity regulating pathway.
The KEGG pathway of differentially expressed RNAs has also provided many new insights into the mechanism of SPAM1 action. For example, the brain renin-angiotensin system has been implicated in Alzheimer's disease neuropathology [29], and it may serve as a novel potential therapeutic target for Alzheimer's disease [30]. It has been shown that the phospholipase D signaling pathway is a key signaling pathway in Alzheimer's disease [31], and PACAP activates PAC1, and PAC1 is coupled to the phospholipase D signaling pathway to trigger downstream effects [32]. Differentially expressed mRNAs were enriched for neuroactive ligand-receptor interaction in addition to the two pathways described above. It has also been shown that PACAP has an important role in the olfactory system through PAC1-R [33]. PACAP is also involved in the regulation of circadian entrainment to light [34,35]. Differentially expressed LncRNA target genes were enriched in were enriched in the above two pathways in addition to the longevity regulating pathway − multiple species, longevity regulating pathway Cell cycle, etc. Interestingly, SIRT6 is also involved in the regulation of longevity [36]. The ubiquitin-proteasome system is involved in regulating synaptic plasticity and memory formation [37], and its dysfunction has been linked to Alzheimer's disease and dementia [38]. The PACAP/PKA pathway plays a role in tumor therapy by regulating the Hedgehog signaling pathway [39,40]. In addition to these two pathways, Host gene that differentially expresses circRNAs is also enriched in synaptic vesicle cycle, cGMP-PKG signaling pathway, cAMP signaling pathway, etc., and are also enriched in the circadian rhythm as are differentially expressed LncRNA target genes. Similarly, differentially expressed miRNA target genes were enriched in protein digestion and absorption and cAMP signaling pathway, in addition to Calcium signaling pathway.
Barrier-to-autointegration factor is a small DNA-binding protein [41] that plays a role in repairing DNA double-strand breaks [42] and repairing nuclear ruptures [43]. Mutations in it also cause premature aging syndrome [44]. Calcium/calmodulin-dependent protein kinase type II is the most abundant protein in excitatory synapses and is central to synaptic plasticity, learning and memory [45]. Neurofilaments play an important role in axon radial growth and nerve conduction [46]. PACAP was able to stimulate size-sieved stem cells to differentiate into neurons, a process accompanied by increased expression of the neurofilament light polypeptide [47]. Furthermore, PACAP induced the differentiation of serum-cultured SH-SY5Y cells into neuroblastic cell, a process accompanied by an increase in the mRNA levels of three neurofilament proteins [48]. This suggests that PACAP could be used for the treatment of neurodegenerative diseases such as amyotrophic lateral sclerosis (ALS), which is also the case [49,50,51,52]. In the present study, we have formally demonstrated that SPAM1 can up-regulate the expression of three types of neurofilaments at the proteomic level, and we have shown that SPAM1 has also been shown to up-regulate the expression of PACAP and PAC1-R, which suggests that SPAM1 may be useful in the treatment of ALS. It has been demonstrated that Apolipoprotein D is upregulated at the mRNA and protein levels after the action of PACAP [53]. Leucine-rich repeat-containing protein 4 is expressed in the hippocampus, promotes neurite extension in hippocampal neurons, and is involved in neuronal and glial cell differentiation [54]. In the present study, proteome sequencing showed that after the action of SPAM1, barrier-to-autointegration factor, calcium/calmodulin-dependent protein kinase type II subunit alpha, calcium/ calmodulin-dependent protein kinase type II subunit beta, neurofilament light polypeptide, neurofilament medium polypeptide, neurofilament heavy polypeptide, apolipoprotein D and leucine-rich repeat-containing protein 4 expression were increased. These aforementioned proteins that have been validated to be associated with PACAP or to play a role in the nervous system were confirmed to have increased expression in the proteome sequencing of this study.
Differentially expressed proteins were enriched to the Neurotrophin signaling pathway, which is consistent with our previous experimental data in RGC-5 cells [9]. Differently expressed proteins are also enriched for circadian entrainment and olfactory transduction, as are differentially expressed RNAs. PACAP was shown to regulate GnRH signaling [55], and differential proteins were also enriched for this pathway in this study.
Whole transcriptome and proteome sequencing results confirmed that SPAM1 exerts its biological functions through known signaling pathways such as cAMP signaling pathway and calmodulin pathway, and also suggested that SPAM1 also exerts its neuroprotective and anti-aging effects through other pathways, which helps to add to our further explorations of the mechanism of action of SPAM1.
4. Materials and Methods
4.1. Materials and Cell Lines
Mouse retinal ganglion cell (RGC-5) lines were provided by the Chinese Academy of Life Sciences (Shanghai, China). Peptide SPAM1 was synthesized by GL Biochem Ltd. (Shanghai, China) at 95% purity. The purity of the peptides was confirmed by reversed-phase high-performance liquid chromatography (HPLC) and they were characterized using matrix-assisted laser desorption/ionization time-of-flight (MALDI-TOF) mass spectrometry.
4.2. Grouping and Treatment of Animals
Male C57BL/6 mice (6 weeks old), purchased from Guangzhou Red Carrot Biotechnology Co., Ltd. (Guangzhou, China). Mice were allowed to eat and drink freely in a clean environment with 12 h of light, 24 °C ± 1 °C and 55 ± 5% humidity. The mice were randomly divided into 6 groups. After 10 days of acclimatization to the new environment, the mice were continuously medicated for 6 weeks with two injections per day. The first was an injection of D-galactose (D-gal) (150 mg/kg/day) or saline; SPAM1 or saline was injected 5 min after the first injection. Both injections were intraperitoneal; the first injection was in the left peritoneal cavity and the second in the right. The mice were grouped as follows: (1) normal control group (NOR): saline without D-gal; (2) D-gal group: D-gal + saline; (3) 0.1µmol/kg/day SMAP1 group: D-gal + 0.1µmol/kg/day SMAP1; (4) 1µmol/kg/day SMAP1 group: D-gal + 1µmol/kg/day SMAP1; (5) 10µmol/kg/day SMAP1 group: D-gal + 1µmol/kg/day SMAP1; (6) 100µmol/kg /day SMAP1 group: D-gal + 100µmol/kg/day SMAP1.
4.3. Tissue Preparation
After completion of dosing on day 42, mice were euthanized, weighed, and the brains were quickly removed, washed with RNase free water, some brain tissue was placed in 4 % paraformaldehyde solution, followed by paraffin embedding. And the remaining tissue was immediately put into liquid nitrogen and subsequently transferred to -80°C for storage.
4.4. Hematoxylin-Eosin Staining (HE) Staining
Paraffin sections were placed in dewaxing solution and different concentrations of ethanol, stained with hematoxylin stain for 3-5 minutes, eosin stain for 5 minutes, ethanol and xylene were used for dehydration, and the sections were sealed with neutral gum.
4.5. Senescence-Associated-β-Galactosidase Staining
The RGC-5 cells were plated and cultured for some time in six-well plates. When the cells reached the confluence rate of 80%, the experimental groups were subjected to treatment of SPAM1 (1µM-100µM) for 24 hours. The same volume fetal bovine serum-free basal medium used for the control group was treated without any treatment. The cell culture medium was aspirated, washed once with PBS, and then fixed and stained according to the instructions of the cell senescence β-galactosidase staining kit (Beyotime, shanghai, Chian). After incubation overnight at 37°C, the percentage of stained senescent cells was obtained by observing and counting under an ordinary light microscope. All experiments were performed in at least three parallel replicates and repeated three times.
4.6. Western Blotting Assays
RGC-5 cells in logarithmic growth phase were inoculated into 6-well culture plates with 2 × 10⁵ cells per well and cultured in F12 medium containing 10% fetal bovine serum at 37◦ C, 5% CO2, and 80% fusion. The experimental group was treated with SPAM1 (1-100 µM) for 40 days (or 10 days). The control group was treated with fetal bovine serum-free basal medium. Total protein was extracted from the cells using RIPA buffer (50 mM Tris-HCl (pH 7.4), 150 mM NaCl, 20 mM EDTA, 1% Triton X-100, 1% sodium deoxycholate,1% SDS, and protease inhibitors (Beyotime, Shanghai, China) on ice for 30 min and analyzed by sodium dodecyl sulfate-polyacrylamide gel electrophoresis. The membranes were co-incubated with the following polyclonal antibodies: anti-SIRT6 antibody (12486S; Cell Signaling Technology), anti-YY1 antibody (sc-7341; Santa Cruz Biotechnology), Lamin B1 Polyclonal antibody (12987-1-AP; Proteintech), anti-P16 antibody (AB51243; abcam), anti-NEFL antibody (2837T; Cell Signaling Technology), anti-NEFM antibody (67255S; Cell Signaling Technology), and anti-β-actin antibody (EM21002, HUABIO). It was then incubated with HRP-coupled secondary antibody (HA1006, HUABIO; ab150075, abcam). Protein bands were displayed using an enhanced chemiluminescence (ECL) kit (Beyotime Biotech). All experiments were performed in at least three parallel replicates and repeated three times.
4.7. Immunohistochemistry
The paraffin sections were put into dewaxing solution and different concentrations of ethanol, antigen repairing solution was used for antigen repairing, serum or BSA was used for sealing, SIRT6 was detected by SIRT6 Polyclonal antibody (13572-1-AP; Proteintech), YY1 was detected by anti-YY1 antibody (sc-7341; Santa Cruz Biotechnology), Lamin B1 was detected by Lamin B1 Polyclonal antibody (12987-1-AP; Proteintech), and P16 was detected by anti-P16 antibody(sc-1661; Santa Cruz Biotechnology), and the corresponding secondary antibody was added, the color was developed by diaminobenzidine, the nuclei of the cells were restained by hematoxylin, the cells were dehydrated with ethanol, n-butyl alcohol, and xylene, and the slices were sealed by sealer adhesive.
4.8. Whole Transcriptome Sequencing
3 samples were randomly selected from the D-gal group (subsequently named DA group) and 3 samples were randomly selected from the 100 µmol/kg/day SMAP1 group (subsequently named SP group). 6 mouse brain tissue samples were subjected to total RNA extraction by Genepioneer Biotechnologies Ltd. (Nanjing, China) and sequenced by Illumina Nova 6000 platform and NovaSeq 2500 platform after the libraries were tested and approved. Nova 6000 platform and Illumina NovaSeq 2500 platform for sequencing. Raw sequencing data were filtered with fastp (https://github.com/OpenGene/fastp) (accessed on 28 August 2023) and Cutadapt (v2.10) [56] to obtain high-quality Clean Data.Clean reads were compared to the Mus musculus genome (http://ftp.ensembl.org/pub/current_fasta/mus_musculus/) (accessed on 29 August 2023) using HISAT2 [57] and Bowtie (v1.2.2) (http://bowtie-bio.sourceforge.net/index.shtml) (accessed on 29 August 2023). Differentially expressed RNAs were functionally annotated and enriched using the Gene Ontology (GO) database (http://www.geeontology.org) (accessed on 29 August 2023) and the KEGG (Kyoto Encyclopedia of Genes and Genomes) database (http://www.kegg.jp) (accessed on 29 August 2023).
4.9. Proteomic Analysis
3 samples each from D-gal group (subsequently named DA group) and 100µmol/kg /day SMAP1 group (subsequently named SP group) were randomly selected. 6 mouse brain tissue samples were handed over to Genepioneer Biotechnologies Ltd. (Nanjing, China) for protein extraction and quantification, and TMT proteome assay was completed. The Mus musculus database (http://ftp.ensembl.org/pub/release-106/fasta/mus_musculus/) (accessed on 9 August 2023) was searched for mass spectrometry downstream data using Proteome Discovery software, and spectral peptides and proteins were quantified. Protein functional annotation was performed using BLAST software (version: 2.2.26) (https://blast.ncbi.nlm.nih.gov/Blast.cgi) (accessed on 9 August 2023). Interaction analysis of identified proteins was performed using StringDB protein interaction database (http://string-db.org/) (accessed on 9 August 2023), Gene Ontology (GO) database (http://www.geeontology.org) (accessed on 9 August 2023) and KEGG (Kyoto Encyclopedia of Genes and Genomes) database (http://www.kegg.jp) (accessed on 9 August 2023) for functional annotation and enrichment analysis of differentially expressed proteins.
4.10. Statistical Analyses
GraphPad Prism 8 was used for statistical analysis. All data were expressed as mean ± standard error of the mean (SEM). One-way analysis of variance (ANOVA) was used to assess differences between groups. When P < 0.05, the difference was statistically significant.
5. Conclusions
In conclusion, the present study confirmed that SPAM1 was able to restore the structure and neuron number of the brain hippocampus and resisted the senescence of RGC-5 cells. SPAM1 also up-regulated and D-gal senescence mouse model hippocampus expression of SIRT6 and Lamin B1, and down-regulated the expression of YY1 and p16, and this result was also confirmed in RGC-5 cells.
In the present study, we also combined whole transcriptome analysis and proteome analysis to further investigate the mechanism of SPAM1 action. The results of whole transcriptome and proteome analyses suggested that SPAM1 acts through neuroactive ligand-receptor interaction, longevity regulating pathway - multiple species, longevity regulating pathway, and other mechanisms. regulating pathway, cell cycle and other pathways.
We have demonstrated that SPAM1 up-regulates PACAP and PAC-1R expression [9], and the results of whole transcriptome and proteome analyses indicate that SPAM1 is indeed associated with the PACAP-PAC1-R pathway, e.g., SPAM1 is expressed through the cAMP signaling pathway, calcium signaling pathway, and neurotrophin signaling pathway.
It is confirmed that SPAM1 regulates PAC1-R through positive allosteric regulation and exerts neuroprotective effects both through the PACAP-PAC1-R pathway and through a pathway that is different from PACAP.
Furthermore, proteomics results showed that SPAM1 up-regulated the expression of neurofilament light polypeptide, neurofilament medium polypeptide, neurofilament heavy polypeptide and peripherin. In this study, western blot verified that SPAM1 could up-regulate the expression of neurofilament light polypeptide and neurofilament medium polypeptide, suggesting that SPAM1 could play a neuroprotective role by repairing neuronal structure.
Author Contributions
Conceptualization, data curation, funding acquisition, methodology and editing, R.Y.; investigation, formal analysis, visualization, and writing—original draft, L.L.; formal analysis and visualization, S.C.; investigation and editing W.S. and H.Z. All authors have read and agreed to the published version of the manuscript.
Funding
Please add: This research was funded by the National Natural Science Foundation of China (No. 31100545, No. 31670848); the Natural Science Foundation of Guangdong Province (No. 2016A030313087 and 2022A1515011158).
Institutional Review Board Statement
The animal study protocol was ap-proved by the Ethics Committee of Jinan University (IACUC-20200110-06, 7 May 2021).
Acknowledgments
We thank the molecule synthesis service from Biaolin Yin in South China University of Technology.
Conflicts of Interest
The authors declare no conflict of interest.
References
- Dautzenberg, F. M.; Mevenkamp, G.; Wille, S.; Hauger, R. L. N-terminal splice variants of the type I PACAP receptor: isolation, characterization and ligand binding/selectivity determinants. J Neuroendocrinol 1999, 11, 941–949. [CrossRef]
- Vaudry, D.; Falluel-Morel, A.; Bourgault, S.; Basille, M.; Burel, D.; Wurtz, O.; Fournier, A.; Chow, B. K.; Hashimoto, H.; Galas, L.; Vaudry, H. Pituitary adenylate cyclase-activating polypeptide and its receptors: 20 years after the discovery. Pharmacol Rev 2009, 61, 283-357. [CrossRef]
- Shioda, S.; Ohtaki, H.; Nakamachi, T.; Dohi, K.; Watanabe, J.; Nakajo, S.; Arata, S.; Kitamura, S.; Okuda, H.; Takenoya, F.; Kitamura, Y. Pleiotropic functions of PACAP in the CNS: neuroprotection and neurodevelopment. Ann N Y Acad Sci 2006, 1070, 550–560.
- Douiri, S.; Bahdoudi, S.; Hamdi, Y.; Cubi, R.; Basille, M.; Fournier, A.; Vaudry, H.; Tonon, M. C.; Amri, M.; Vaudry, D.; Masmoudi-Kouki, O. Involvement of endogenous antioxidant systems in the protective activity of pituitary adenylate cyclase-activating polypeptide against hydrogen peroxide-induced oxidative damages in cultured rat astrocytes. J Neurochem 2016, 137, 913–930. [CrossRef]
- Yang, R.; Jiang, X.; Ji, R.; Meng, L.; Liu, F.; Chen, X.; Xin, Y. Therapeutic potential of PACAP for neurodegenerative diseases. Cell Mol Biol Lett 2015, 20, 265–278. [CrossRef]
- Yu, R.; Zheng, L.; Cui, Y.; Zhang, H.; Ye, H. Doxycycline exerted neuroprotective activity by enhancing the activation of neuropeptide GPCR PAC1. Neuropharmacology 2016, 103, 1-15. [CrossRef]
- Song, S.; Wang, L.; Li, J.; Huang, X.; Yu, R. The allosteric modulation effects of doxycycline, minocycline, and their derivatives on the neuropeptide receptor PAC1-R. Acta Biochim Biophys Sin (Shanghai) 2019, 51, 627-637. [CrossRef]
- Fan, G.; Chen, S.; Tao, Z.; Zhang, H.; Yu, R. A novel small positive allosteric modulator of neuropeptide receptor PAC1-R exerts neuroprotective effects in MPTP mouse Parkinson's disease model. Acta Biochim Biophys Sin (Shanghai) 2022, 54, 1349-1364. [CrossRef]
- Fan, G.; Chen, S.; Liang, L.; Zhang, H.; Yu, R. Novel Small Molecule Positive Allosteric Modulator SPAM1 Triggers the Nuclear Translocation of PAC1-R to Exert Neuroprotective Effects through Neuron-Restrictive Silencer Factor. Int J Mol Sci 2022, 23. [CrossRef]
- Matsuno, H.; Tsuchimine, S.; Fukuzato, N.; O'Hashi, K.; Kunugi, H.; Sohya, K. Sirtuin 6 is a regulator of dendrite morphogenesis in rat hippocampal neurons. Neurochem Int 2021, 145, 104959. [CrossRef]
- Garcia-Venzor, A.; Toiber, D. SIRT6 Through the Brain Evolution, Development, and Aging. Front Aging Neurosci 2021, 13, 747989. [CrossRef]
- Kaluski, S.; Portillo, M.; Besnard, A.; Stein, D.; Einav, M.; Zhong, L.; Ueberham, U.; Arendt, T.; Mostoslavsky, R.; Sahay, A.; Toiber, D. Neuroprotective Functions for the Histone Deacetylase SIRT6. Cell Rep 2017, 18, 3052-3062. [CrossRef]
- Shi, Y.; Seto, E.; Chang, L. S.; Shenk, T. Transcriptional repression by YY1, a human GLI-Kruppel-related protein, and relief of repression by adenovirus E1A protein. Cell 1991, 67, 377–388. [CrossRef]
- Stein, D.; Mizrahi, A.; Golova, A.; Saretzky, A.; Venzor, A. G.; Slobodnik, Z.; Kaluski, S.; Einav, M.; Khrameeva, E.; Toiber, D. Aging and pathological aging signatures of the brain: through the focusing lens of SIRT6. Aging (Albany NY) 2021, 13, 6420-6441. [CrossRef]
- Pajarillo, E.; Nyarko-Danquah, I.; Digman, A.; Vied, C.; Son, D. S.; Lee, J.; Aschner, M.; Lee, E. Astrocytic Yin Yang 1 is critical for murine brain development and protection against apoptosis, oxidative stress, and inflammation. Glia 2023, 71, 450-466. [CrossRef]
- Koufi, F. D.; Neri, I.; Ramazzotti, G.; Rusciano, I.; Mongiorgi, S.; Marvi, M. V.; Fazio, A.; Shin, M.; Kosodo, Y.; Cani, I.; Giorgio, E.; Cortelli, P.; Manzoli, L.; Ratti, S. Lamin B1 as a key modulator of the developing and aging brain. Front Cell Neurosci 2023, 17, 1263310. [CrossRef]
- Bin Imtiaz, M. K.; Jaeger, B. N.; Bottes, S.; Machado, R. A. C.; Vidmar, M.; Moore, D. L.; Jessberger, S. Declining lamin B1 expression mediates age-dependent decreases of hippocampal stem cell activity. Cell Stem Cell 2021, 28, 967-977 e8. [CrossRef]
- Gorgoulis, V.; Adams, P. D.; Alimonti, A.; Bennett, D. C.; Bischof, O.; Bishop, C.; Campisi, J.; Collado, M.; Evangelou, K.; Ferbeyre, G.; Gil, J.; Hara, E.; Krizhanovsky, V.; Jurk, D.; Maier, A. B.; Narita, M.; Niedernhofer, L.; Passos, J. F.; Robbins, P. D.; Schmitt, C. A.; Sedivy, J.; Vougas, K.; von Zglinicki, T.; Zhou, D.; Serrano, M.; Demaria, M. Cellular Senescence: Defining a Path Forward. Cell 2019, 179, 813-827.
- Sun, D.; Mei, L.; Xiong, W. C. Dorsal Dentate Gyrus, a Key Regulator for Mood and Psychiatric Disorders. Biol Psychiatry 2023, 93, 1071-1080. [CrossRef]
- Ahmad, R.; Lahuna, O.; Sidibe, A.; Daulat, A.; Zhang, Q.; Luka, M.; Guillaume, J. L.; Gallet, S.; Guillonneau, F.; Hamroune, J.; Polo, S.; Prevot, V.; Delagrange, P.; Dam, J.; Jockers, R. GPR50-Ctail cleavage and nuclear translocation: a new signal transduction mode for G protein-coupled receptors. Cell Mol Life Sci 2020, 77, 5189-5205. [CrossRef]
- Fan, G.; Tao, Z.; Chen, S.; Zhang, H.; Yu, R. Positive allosteric regulation of PAC1-R up-regulates PAC1-R and its specific ligand PACAP. Acta Biochim Biophys Sin (Shanghai) 2022, 54, 657-672. [CrossRef]
- Yu, R.; Lin, Z.; Ouyang, Z.; Tao, Z.; Fan, G. Blue light induces the nuclear translocation of neuropeptide receptor PAC1-R associated with the up-regulation of PAC1-R its own in reactive oxygen species associated way. Biochim Biophys Acta Gen Subj 2021, 1865, 129884. [CrossRef]
- Liao, C.; de Molliens, M. P.; Schneebeli, S. T.; Brewer, M.; Song, G.; Chatenet, D.; Braas, K. M.; May, V.; Li, J. Targeting the PAC1 Receptor for Neurological and Metabolic Disorders. Curr Top Med Chem 2019, 19, 1399-1417. [CrossRef]
- Ho, S. C.; Liu, J. H.; Wu, R. Y. Establishment of the mimetic aging effect in mice caused by D-galactose. Biogerontology 2003, 4, 15–18. [CrossRef]
- Hainmueller, T.; Bartos, M. Dentate gyrus circuits for encoding, retrieval and discrimination of episodic memories. Nat Rev Neurosci 2020, 21, 153-168. [CrossRef]
- Mostoslavsky, R.; Chua, K. F.; Lombard, D. B.; Pang, W. W.; Fischer, M. R.; Gellon, L.; Liu, P.; Mostoslavsky, G.; Franco, S.; Murphy, M. M.; Mills, K. D.; Patel, P.; Hsu, J. T.; Hong, A. L.; Ford, E.; Cheng, H. L.; Kennedy, C.; Nunez, N.; Bronson, R.; Frendewey, D.; Auerbach, W.; Valenzuela, D.; Karow, M.; Hottiger, M. O.; Hursting, S.; Barrett, J. C.; Guarente, L.; Mulligan, R.; Demple, B.; Yancopoulos, G. D.; Alt, F. W. Genomic instability and aging-like phenotype in the absence of mammalian SIRT6. Cell 2006, 124, 315–329. [CrossRef]
- Smirnov, D.; Eremenko, E.; Stein, D.; Kaluski, S.; Jasinska, W.; Cosentino, C.; Martinez-Pastor, B.; Brotman, Y.; Mostoslavsky, R.; Khrameeva, E.; Toiber, D. SIRT6 is a key regulator of mitochondrial function in the brain. Cell Death Dis 2023, 14, 35. [CrossRef]
- Lu, J.; Jin, K.; Jiao, J.; Liu, R.; Mou, T.; Chen, B.; Zhang, Z.; Jiang, C.; Zhao, H.; Wang, Z.; Zhou, R.; Huang, M. YY1 (Yin-Yang 1), a transcription factor regulating systemic inflammation, is involved in cognitive impairment of depression. Psychiatry Clin Neurosci 2023, 77, 149-159. [CrossRef]
- Al-Kuraishy, H. M.; Jabir, M. S.; Albuhadily, A. K.; Al-Gareeb, A. I.; Rafeeq, M. F. The link between metabolic syndrome and Alzheimer disease: A mutual relationship and long rigorous investigation. Ageing Res Rev 2023, 91, 102084. [CrossRef]
- Loera-Valencia, R.; Eroli, F.; Garcia-Ptacek, S.; Maioli, S. Brain Renin–Angiotensin System as Novel and Potential Therapeutic Target for Alzheimer’s Disease. International Journal of Molecular Sciences 2021, 22. [CrossRef]
- Bottero, V.; Powers, D.; Yalamanchi, A.; Quinn, J. P.; Potashkin, J. A. Key Disease Mechanisms Linked to Alzheimer’s Disease in the Entorhinal Cortex. International Journal of Molecular Sciences 2021, 22. [CrossRef]
- Roy, A.; Derakhshan, F.; Wilson, R. J. Stress peptide PACAP engages multiple signaling pathways within the carotid body to initiate excitatory responses in respiratory and sympathetic chemosensory afferents. Am J Physiol Regul Integr Comp Physiol 2013, 304, R1070-84. [CrossRef]
- Hansel, D. E.; May, V.; Eipper, B. A.; Ronnett, G. V. Pituitary adenylyl cyclase-activating peptides and alpha-amidation in olfactory neurogenesis and neuronal survival in vitro. J Neurosci 2001, 21, 4625–4636. [CrossRef]
- Imai, N. Molecular and Cellular Neurobiology of Circadian and Circannual Rhythms in Migraine: A Narrative Review. Int J Mol Sci 2023, 24. [CrossRef]
- Holland, P. R.; Barloese, M.; Fahrenkrug, J. PACAP in hypothalamic regulation of sleep and circadian rhythm: importance for headache. J Headache Pain 2018, 19, 20. [CrossRef]
- Vitiello, M.; Zullo, A.; Servillo, L.; Mancini, F. P.; Borriello, A.; Giovane, A.; Della Ragione, F.; D'Onofrio, N.; Balestrieri, M. L. Multiple pathways of SIRT6 at the crossroads in the control of longevity, cancer, and cardiovascular diseases. Ageing Res Rev 2017, 35, 301-311. [CrossRef]
- Patrick, M. B.; Omar, N.; Werner, C. T.; Mitra, S.; Jarome, T. J. The ubiquitin-proteasome system and learning-dependent synaptic plasticity - A 10 year update. Neurosci Biobehav Rev 2023, 152, 105280. [CrossRef]
- Hegde, A. N.; Smith, S. G.; Duke, L. M.; Pourquoi, A.; Vaz, S. Perturbations of Ubiquitin-Proteasome-Mediated Proteolysis in Aging and Alzheimer's Disease. Front Aging Neurosci 2019, 11, 324. [CrossRef]
- Cohen, J. R.; Resnick, D. Z.; Niewiadomski, P.; Dong, H.; Liau, L. M.; Waschek, J. A. Pituitary adenylyl cyclase activating polypeptide inhibits gli1 gene expression and proliferation in primary medulloblastoma derived tumorsphere cultures. BMC Cancer 2010, 10, 676. [CrossRef]
- Waschek, J. A.; Dicicco-Bloom, E.; Nicot, A.; Lelievre, V. Hedgehog signaling: new targets for GPCRs coupled to cAMP and protein kinase A. Ann N Y Acad Sci 2006, 1070, 120–128.
- Zheng, R.; Ghirlando, R.; Lee, M. S.; Mizuuchi, K.; Krause, M.; Craigie, R. Barrier-to-autointegration factor (BAF) bridges DNA in a discrete, higher-order nucleoprotein complex. Proceedings of the National Academy of Sciences 2000, 97, 8997-9002. [CrossRef]
- Burgess, J. T.; Cheong, C. M.; Suraweera, A.; Sobanski, T.; Beard, S.; Dave, K.; Rose, M.; Boucher, D.; Croft, L. V.; Adams, M. N.; O'Byrne, K.; Richard, D. J.; Bolderson, E. Barrier-to-autointegration-factor (Banf1) modulates DNA double-strand break repair pathway choice via regulation of DNA-dependent kinase (DNA-PK) activity. Nucleic Acids Res 2021, 49, 3294-3307. [CrossRef]
- Halfmann, C. T.; Sears, R. M.; Katiyar, A.; Busselman, B. W.; Aman, L. K.; Zhang, Q.; O'Bryan, C. S.; Angelini, T. E.; Lele, T. P.; Roux, K. J. Repair of nuclear ruptures requires barrier-to-autointegration factor. J Cell Biol 2019, 218, 2136-2149. [CrossRef]
- Puente, X. S.; Quesada, V.; Osorio, F. G.; Cabanillas, R.; Cadinanos, J.; Fraile, J. M.; Ordonez, G. R.; Puente, D. A.; Gutierrez-Fernandez, A.; Fanjul-Fernandez, M.; Levy, N.; Freije, J. M.; Lopez-Otin, C. Exome sequencing and functional analysis identifies BANF1 mutation as the cause of a hereditary progeroid syndrome. Am J Hum Genet 2011, 88, 650–656. [CrossRef]
- Yasuda, R.; Hayashi, Y.; Hell, J. W. CaMKII: a central molecular organizer of synaptic plasticity, learning and memory. Nat Rev Neurosci 2022, 23, 666-682. [CrossRef]
- Yuan, A.; Rao, M. V.; Veeranna; Nixon, R. A. Neurofilaments and Neurofilament Proteins in Health and Disease. Cold Spring Harb Perspect Biol 2017, 9. [CrossRef]
- Tzeng, S. F.; Tsai, M. J.; Hung, S. C.; Cheng, H. Neuronal morphological change of size-sieved stem cells induced by neurotrophic stimuli. Neurosci Lett 2004, 367, 23–28. [CrossRef]
- Heraud, C.; Hilairet, S.; Muller, J. M.; Leterrier, J. F.; Chadeneau, C. Neuritogenesis induced by vasoactive intestinal peptide, pituitary adenylate cyclase-activating polypeptide, and peptide histidine methionine in SH-SY5y cells is associated with regulated expression of cytoskeleton mRNAs and proteins. J Neurosci Res 2004, 75, 320–329. [CrossRef]
- Magri, B.; D'Amico, A. G.; Maugeri, G.; Morello, G.; La Cognata, V.; Saccone, S.; Federico, C.; Cavallaro, S.; D'Agata, V. Neuroprotective effect of the PACAP-ADNP axis on SOD1G93A mutant motor neuron death induced by trophic factors deprivation. Neuropeptides 2023, 102, 102386. [CrossRef]
- D'Amico, A. G.; Maugeri, G.; Saccone, S.; Federico, C.; Cavallaro, S.; Reglodi, D.; D'Agata, V. PACAP Modulates the Autophagy Process in an In Vitro Model of Amyotrophic Lateral Sclerosis. Int J Mol Sci 2020, 21. [CrossRef]
- Maugeri, G.; D'Amico, A. G.; Rasa, D. M.; Federico, C.; Saccone, S.; Morello, G.; La Cognata, V.; Cavallaro, S.; D'Agata, V. Molecular mechanisms involved in the protective effect of pituitary adenylate cyclase-activating polypeptide in an in vitro model of amyotrophic lateral sclerosis. J Cell Physiol 2019, 234, 5203-5214. [CrossRef]
- Bonaventura, G.; Iemmolo, R.; D'Amico, A. G.; La Cognata, V.; Costanzo, E.; Zappia, M.; D'Agata, V.; Conforti, F. L.; Aronica, E.; Cavallaro, S. PACAP and PAC1R are differentially expressed in motor cortex of amyotrophic lateral sclerosis patients and support survival of iPSC-derived motor neurons. J Cell Physiol 2018, 233, 3343-3351.
- Kosacka, J.; Schroder, T.; Bechmann, I.; Kloting, N.; Nowicki, M.; Mittag, A.; Gericke, M.; Spanel-Borowski, K.; Bluher, M. PACAP up-regulates the expression of apolipoprotein D in 3T3-L1 adipocytes. DRG/3T3-L1 co-cultures study. Neurosci Res 2011, 69, 8-16. [CrossRef]
- Wu, M.; Huang, H.; Chen, Q.; Li, D.; Zheng, Z.; Xiong, W.; Zhou, Y.; Li, X.; Zhou, M.; Lu, J.; Shen, S.; Li, G. Leucine-rich repeat C4 protein is involved in nervous tissue development and neurite outgrowth, and induction of glioma cell differentiation. Acta Biochim Biophys Sin (Shanghai) 2007, 39, 731–738. [CrossRef]
- Halvorson, L. M. PACAP modulates GnRH signaling in gonadotropes. Mol Cell Endocrinol 2014, 385, 45-55. [CrossRef]
- Kechin, A.; Boyarskikh, U.; Kel, A.; Filipenko, M. cutPrimers: A New Tool for Accurate Cutting of Primers from Reads of Targeted Next Generation Sequencing. J Comput Biol 2017, 24, 1138-1143. [CrossRef]
- Kim, D.; Paggi, J. M.; Park, C.; Bennett, C.; Salzberg, S. L. Graph-based genome alignment and genotyping with HISAT2 and HISAT-genotype. Nat Biotechnol 2019, 37, 907-915. [CrossRef]
Figure 1.
SPAM1 attenuates D-gal-induced reduction in the number of mouse hippocampal neurons. HE staining showed that D-gal treatment led to a reduction in mouse hippocampal neurons, which was most significantly reversed by SPAM1 at concentrations of 0.1μmol/kg/day and 100μmol/kg/day. Data are presented as the mean ± SE, n = 8-10.
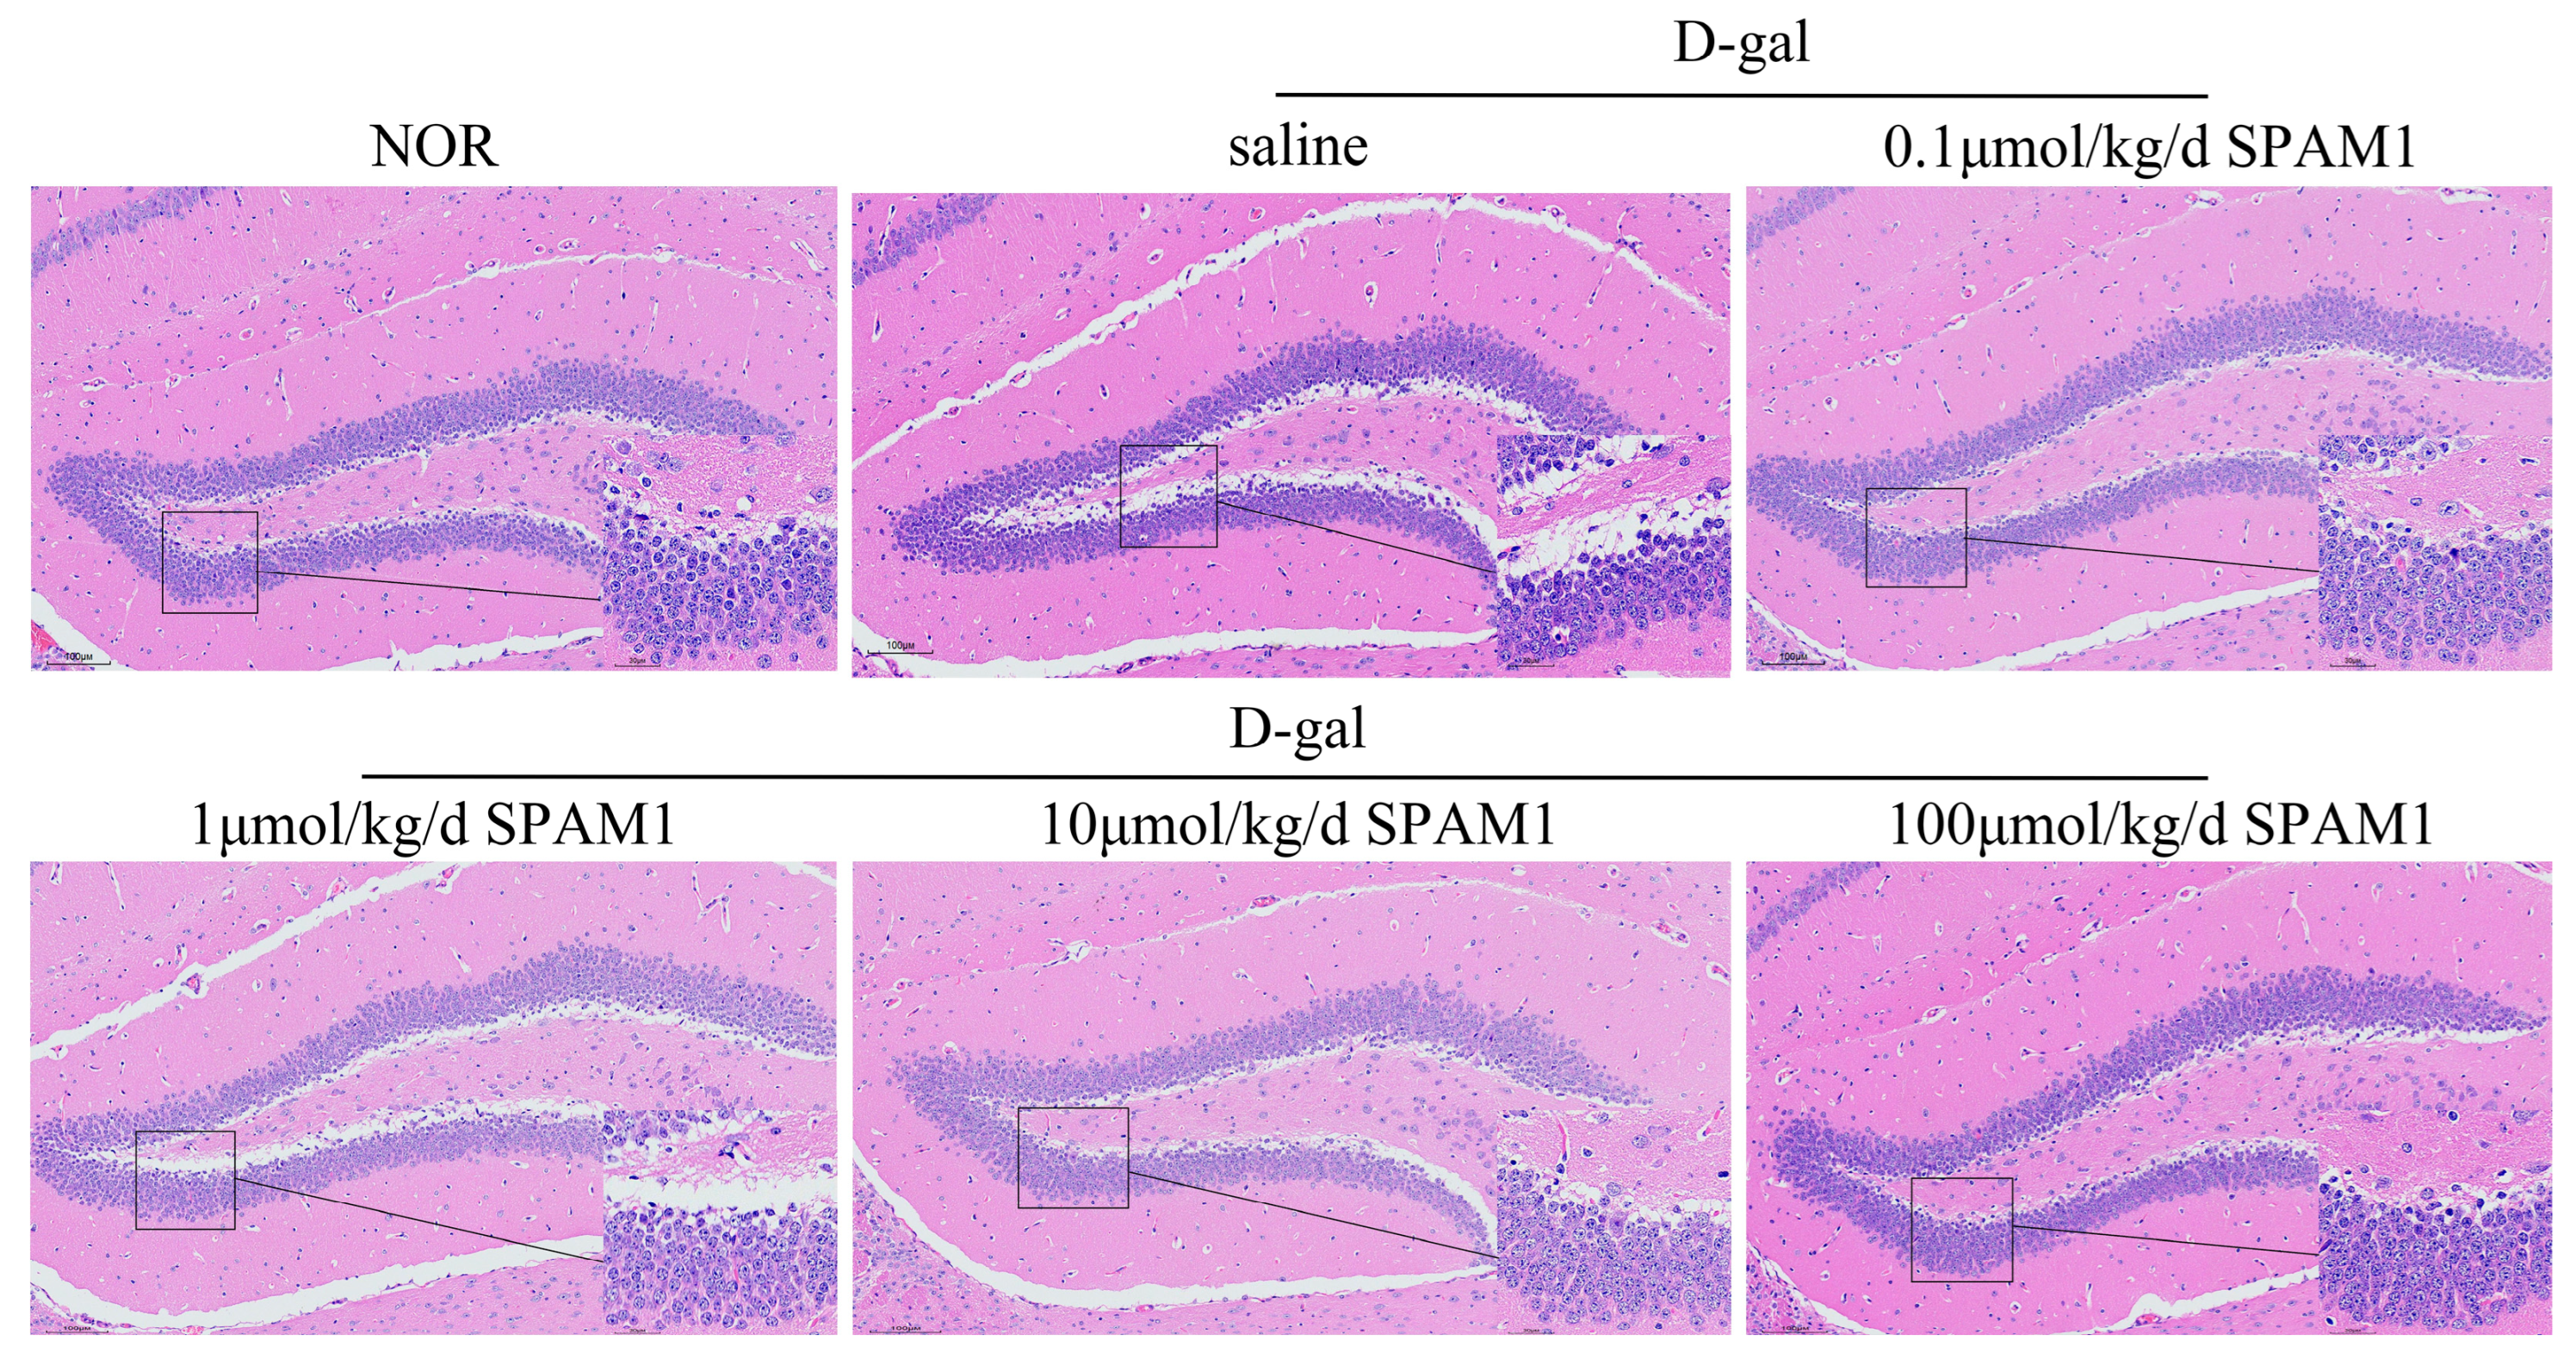
Figure 2.
SPAM1 ameliorated RGC cells senescence. (a) β-gal staining and (b) corresponding statistics showed that the number of β-gal-positive RGC-5 cells was significantly reduced after the action of different concentrations of SPAM1. **, P<0.01, vs. 40d. Data are presented as the mean ± SEM of three experiments.
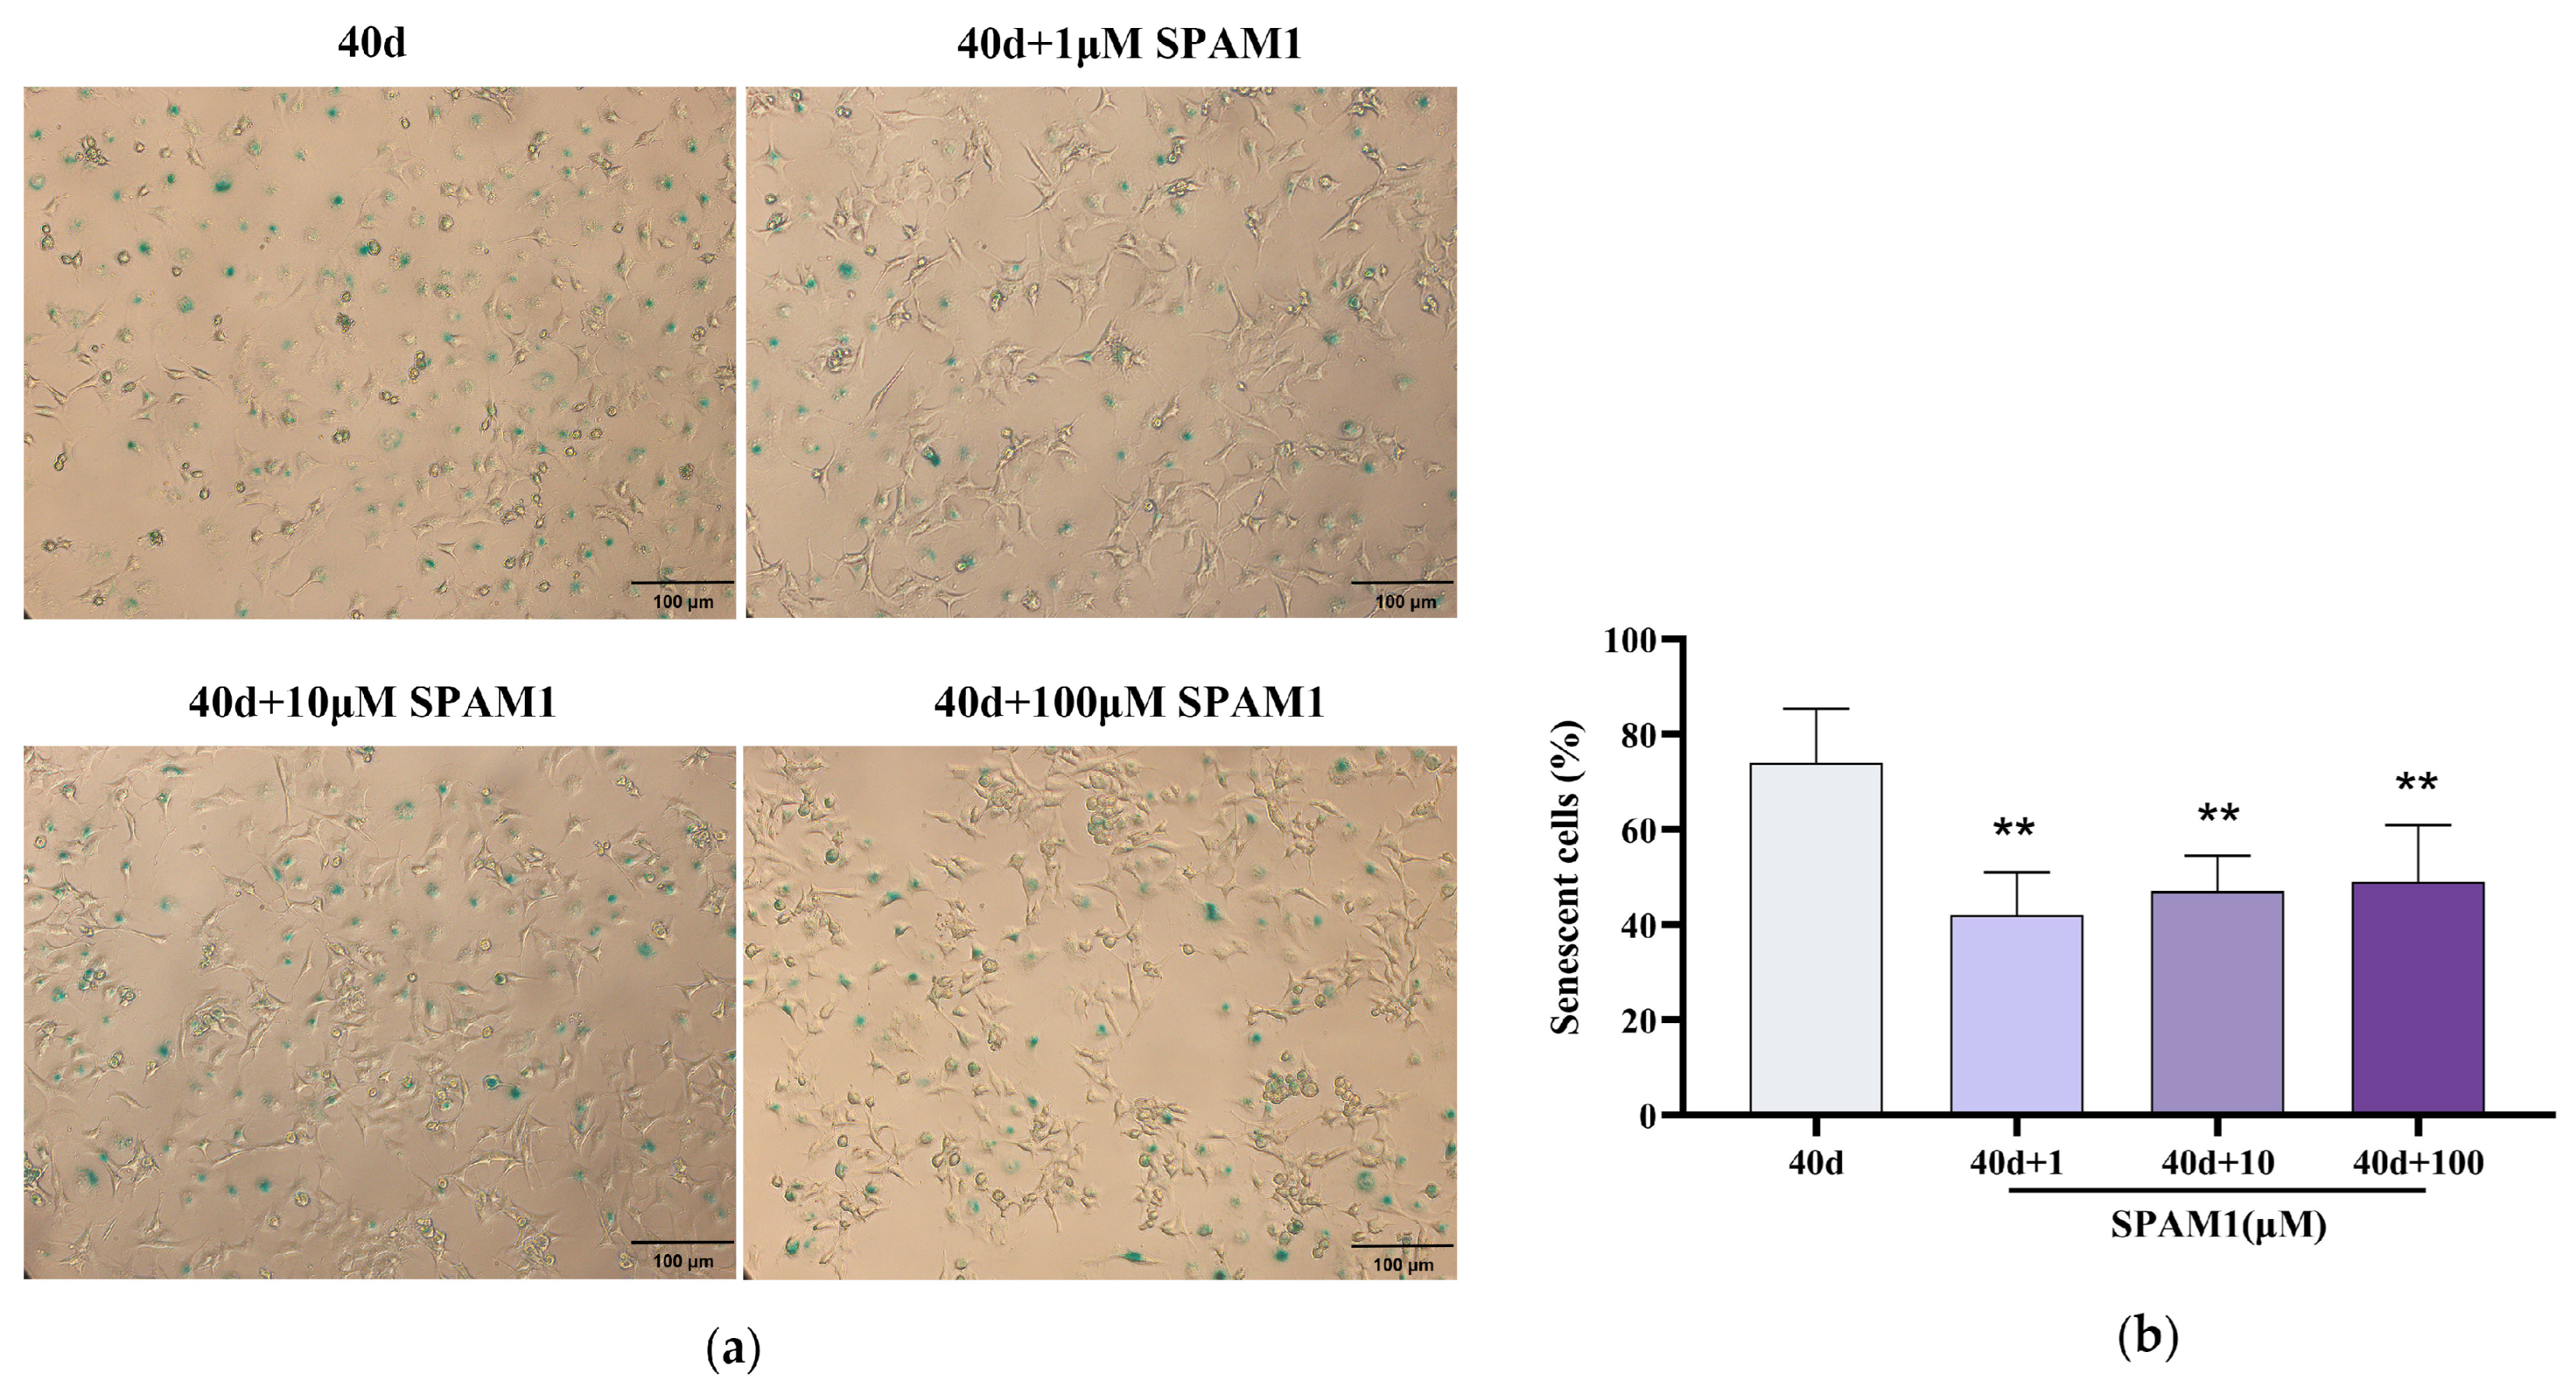
Figure 3.
Effect of SPAM1 on the expression levels of SIRT6, YY1, Lamin B1 and p16 in RGC-5 cells. (a)WB images of Lamin B1 and p16 in RGC-5 whole cells (left) and the corresponding statistics (right) show that the expression level of Lamin B1 was reduced and p16 expression was increased in RGC-5 cells at 40 days. **, P<0.01, vs. 10d. (b) WB images (left) and corresponding statistics (right) of Lamin B1 in RGC-5 whole cells at 40day show that 10~100μM concentration of SPAM1 significantly increased the expression of Lamin B1. **, P<0.01, vs. 40d. (c) WB images (left) and corresponding statistics (right) of p16 in RGC-5 whole cells. The images showed that different concentrations of SPAM1 could down-regulate the expression of p16. #, P<0.05, vs. 10d; **, P<0.01, vs. 40d. Data are presented as the mean ± SEM of three experiments. (d) WB images (left) and corresponding statistics (right) of YY1 and SIRT6 in RGC-5 whole cells showed that 100uM concentration of SPAM1 decreased the expression of YY1 and 1 to 100μM of SPAM1 upregulated the expression of SIRT6. **, P<0.01, vs. 40d. (e) WB images (left) and corresponding statistics (right) of YY1 and SIRT6 in RGC-5 whole cells (10days) showed that 100uM concentration of SPAM1 decreased the expression of YY1. **, P<0.01, vs. 10d.
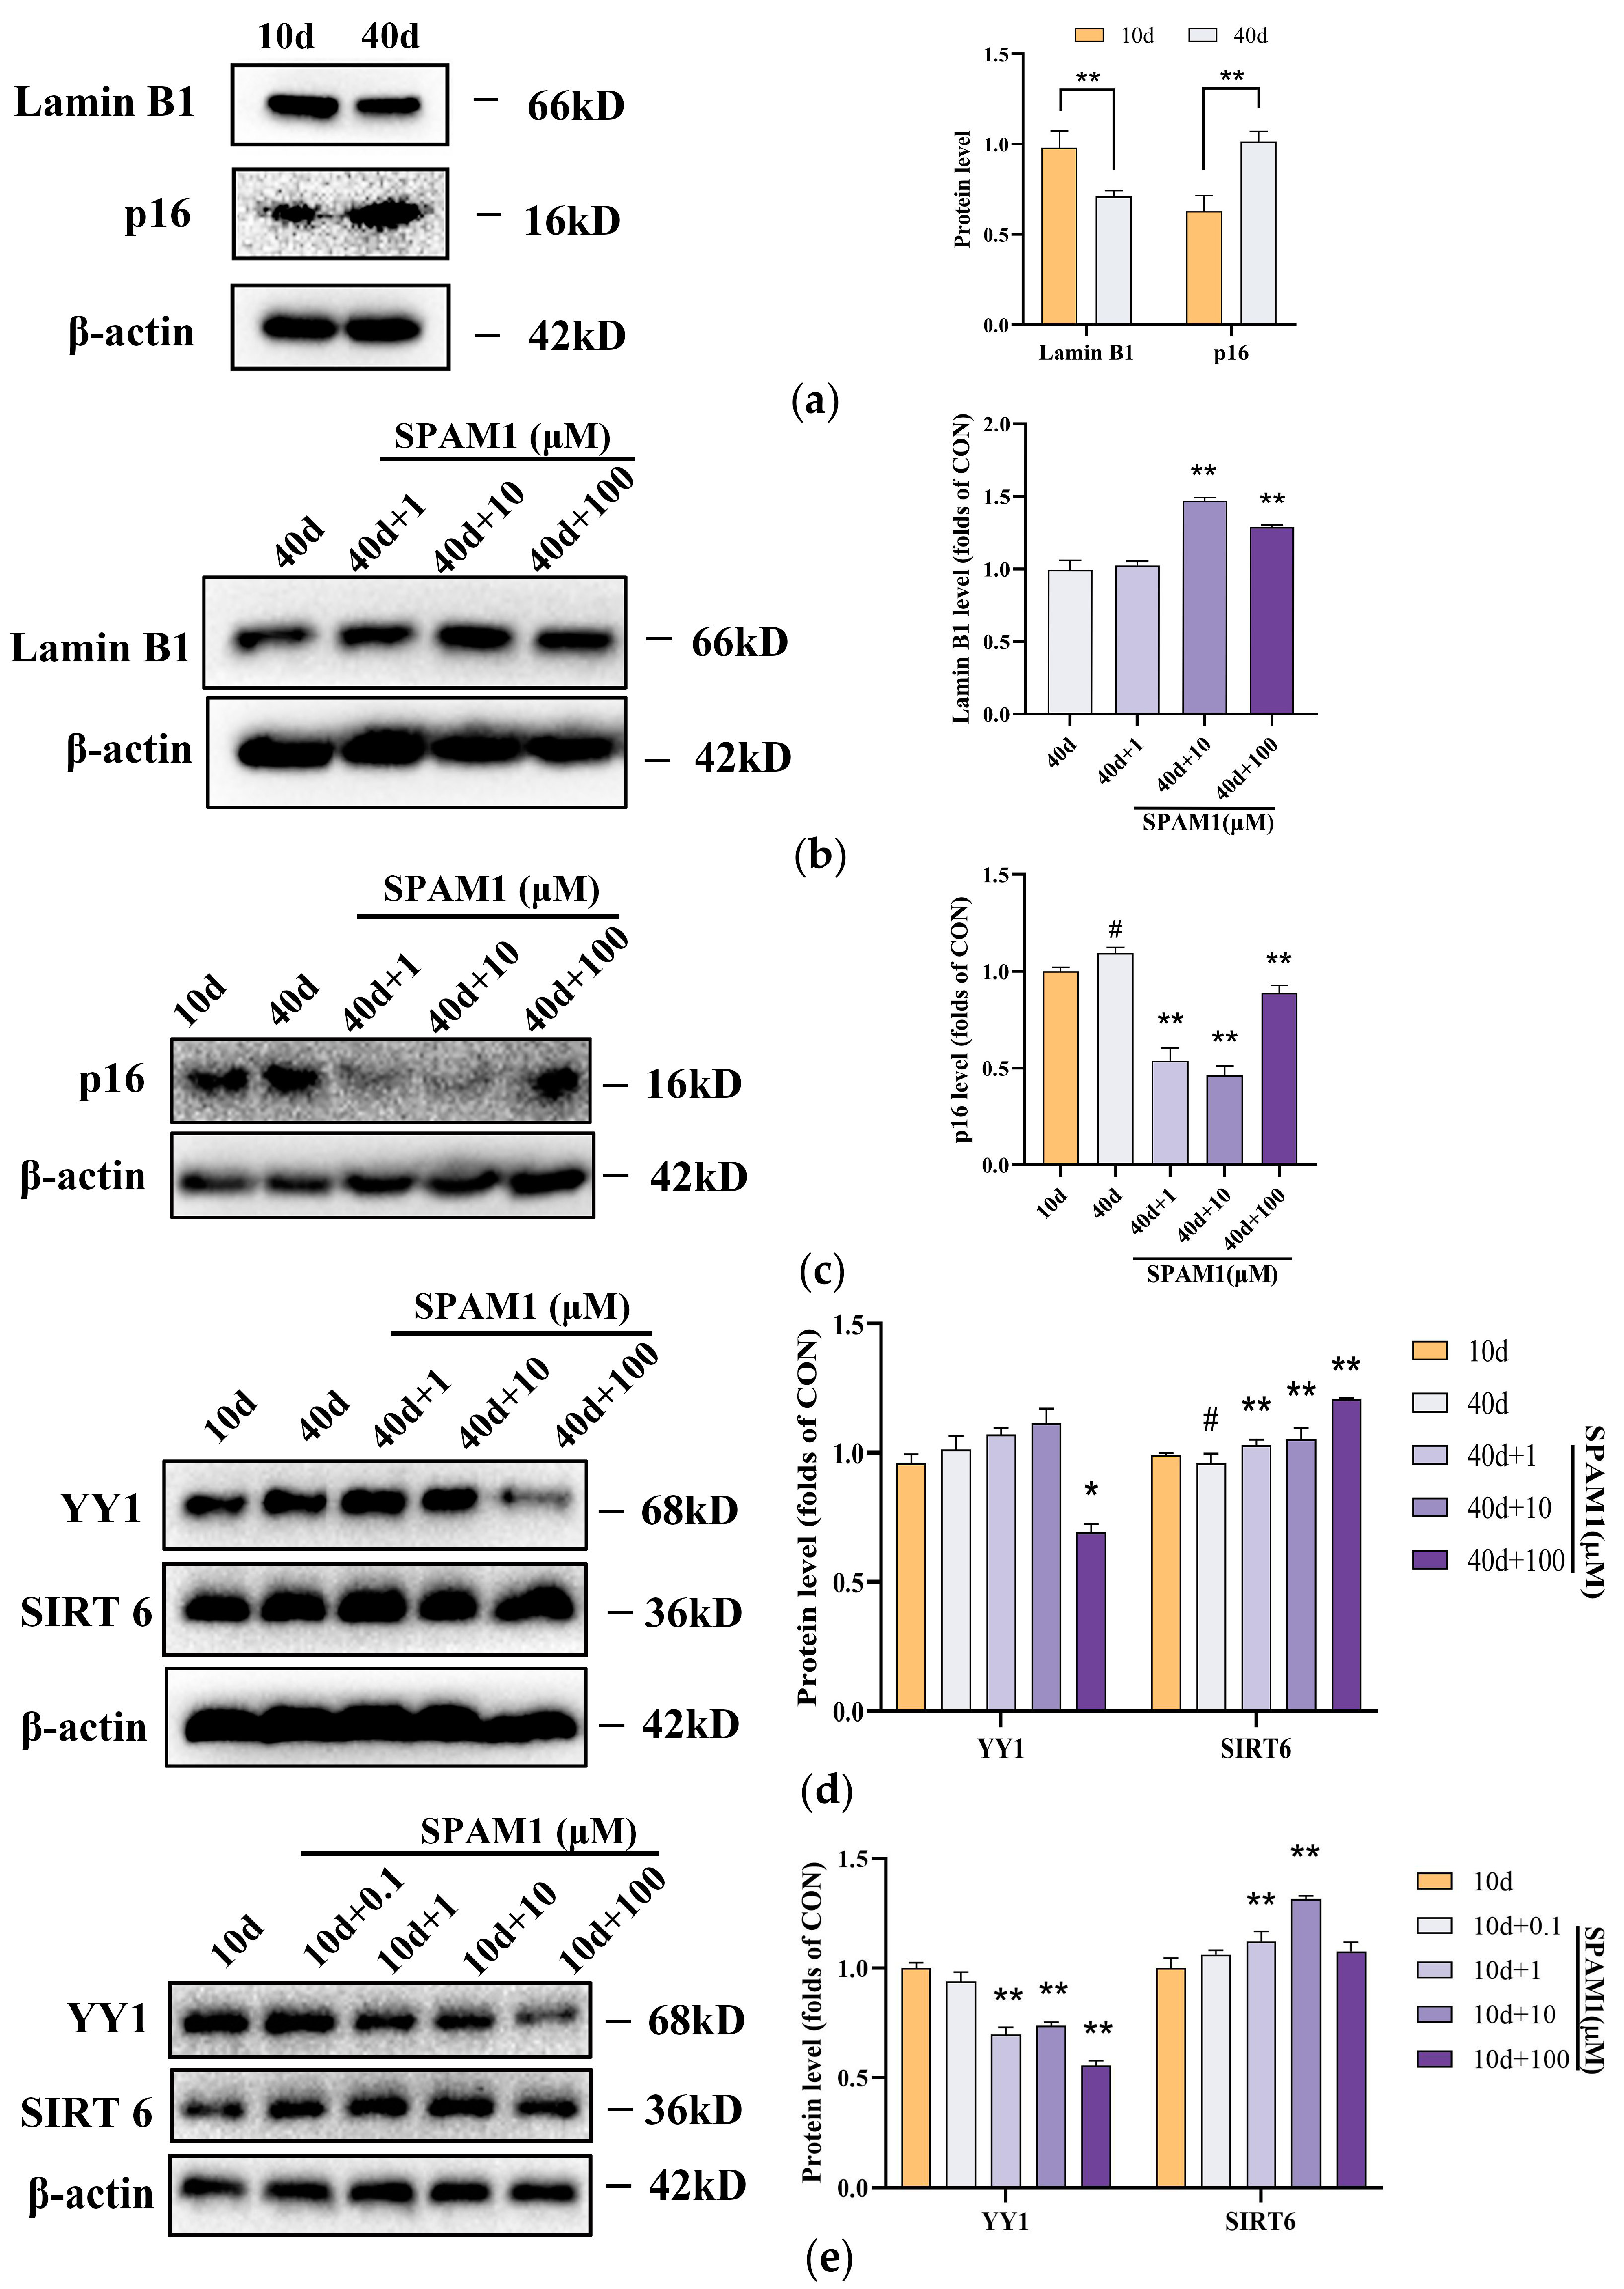
Figure 4.
Effect of SMAP1 treatment on the expression levels of SIRT6. (a) Immunohistochemical images of SIRT6 expression in the hippocampus (left) and corresponding statistical chart (right) of SIRT6 expression in the hippocampus. (b) Immunohistochemical images of SIRT6 expression in the hippocampus (left) and corresponding statistical chart (right) of Lamin B1 expression in the hippocampus. (c) Immunohistochemical images of SIRT6 expression in the hippocampus (left) and corresponding statistical chart (right) of p16 expression in the hippocampus. (d) Immunohistochemical images of SIRT6 expression in the hippocampus (left) and corresponding statistical chart (right) of p16 expression in the hippocampus. The data for the statistics graph is taken from the red + places in the graph above. #, P<0.05, vs. NOR; ##, P<0.01, vs. NOR; *, P<0.05, vs. saline; **, P<0.01, vs. saline. Data are presented as the mean ± SE, n = 8-10.
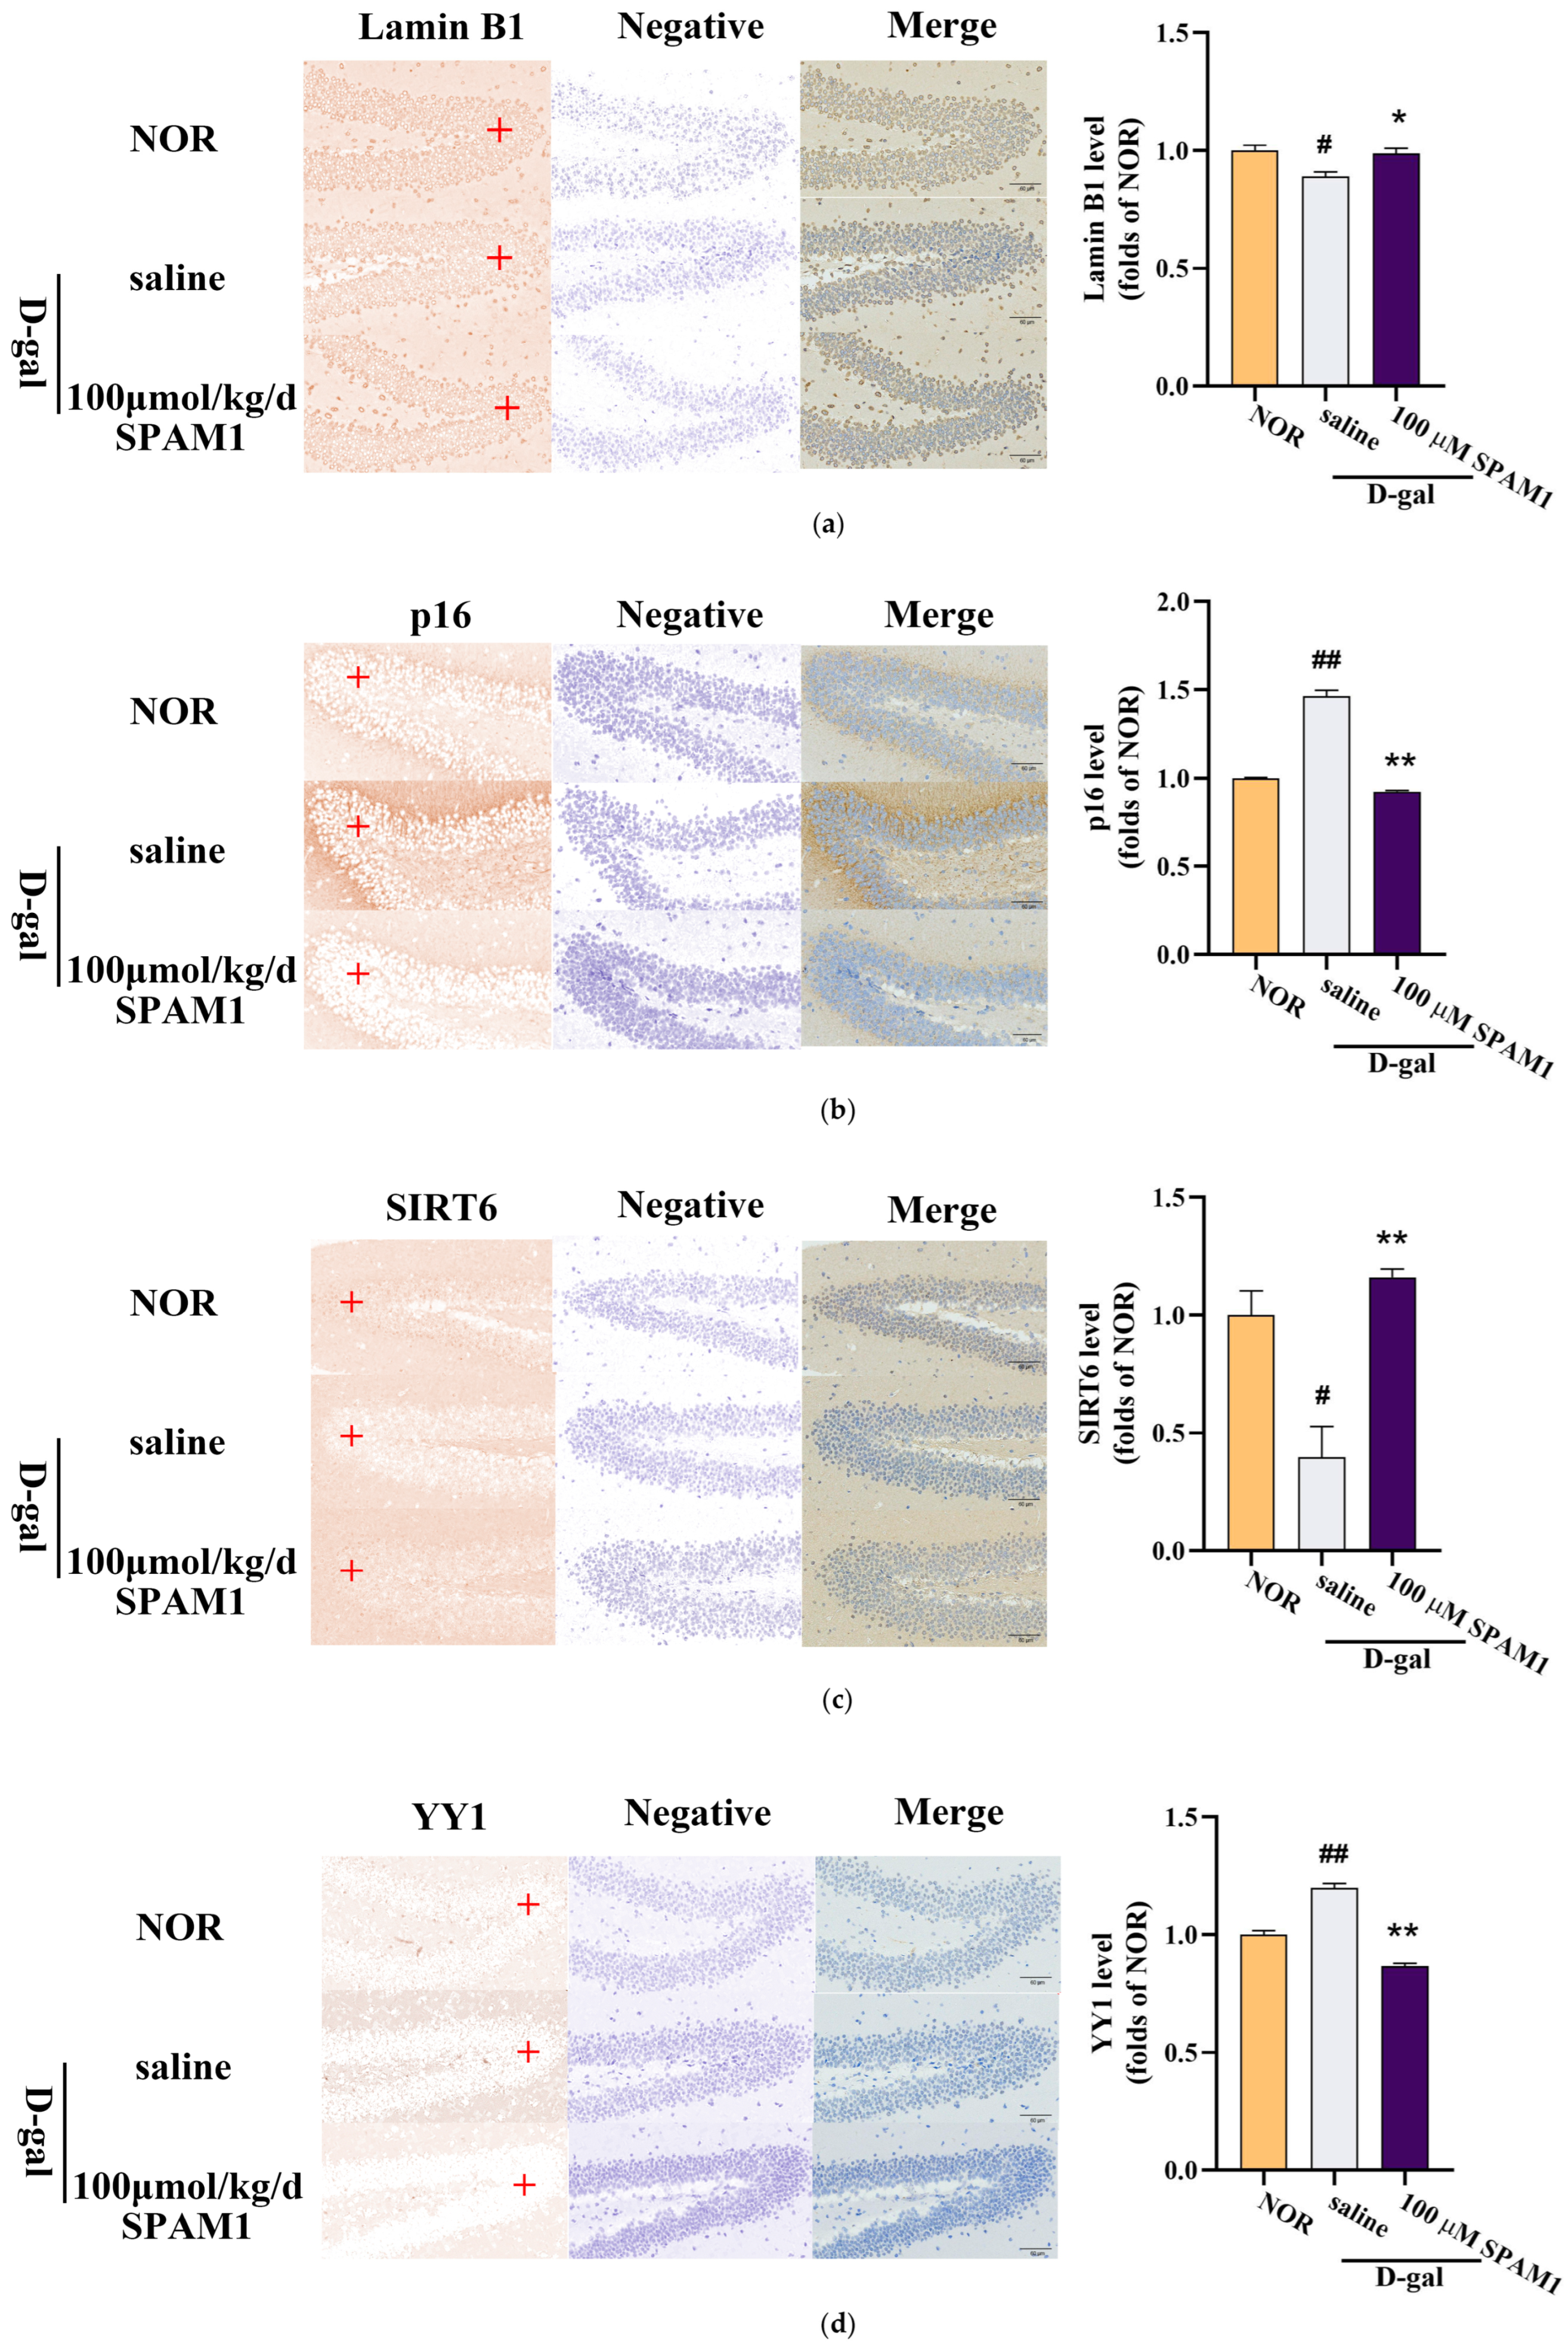
Figure 5.
Heatmaps of differential mRNAs, lncRNAs, circRNAs and miRNAs in DA and SP groups. (a) Heatmap of differentially expressed mRNAs; (b) Heatmap of differentially expressed lncRNAs; (c) Heatmap of differentially expressed circRNAs; (d) Heatmap of differentially expressed miRNAs.
Figure 5.
Heatmaps of differential mRNAs, lncRNAs, circRNAs and miRNAs in DA and SP groups. (a) Heatmap of differentially expressed mRNAs; (b) Heatmap of differentially expressed lncRNAs; (c) Heatmap of differentially expressed circRNAs; (d) Heatmap of differentially expressed miRNAs.
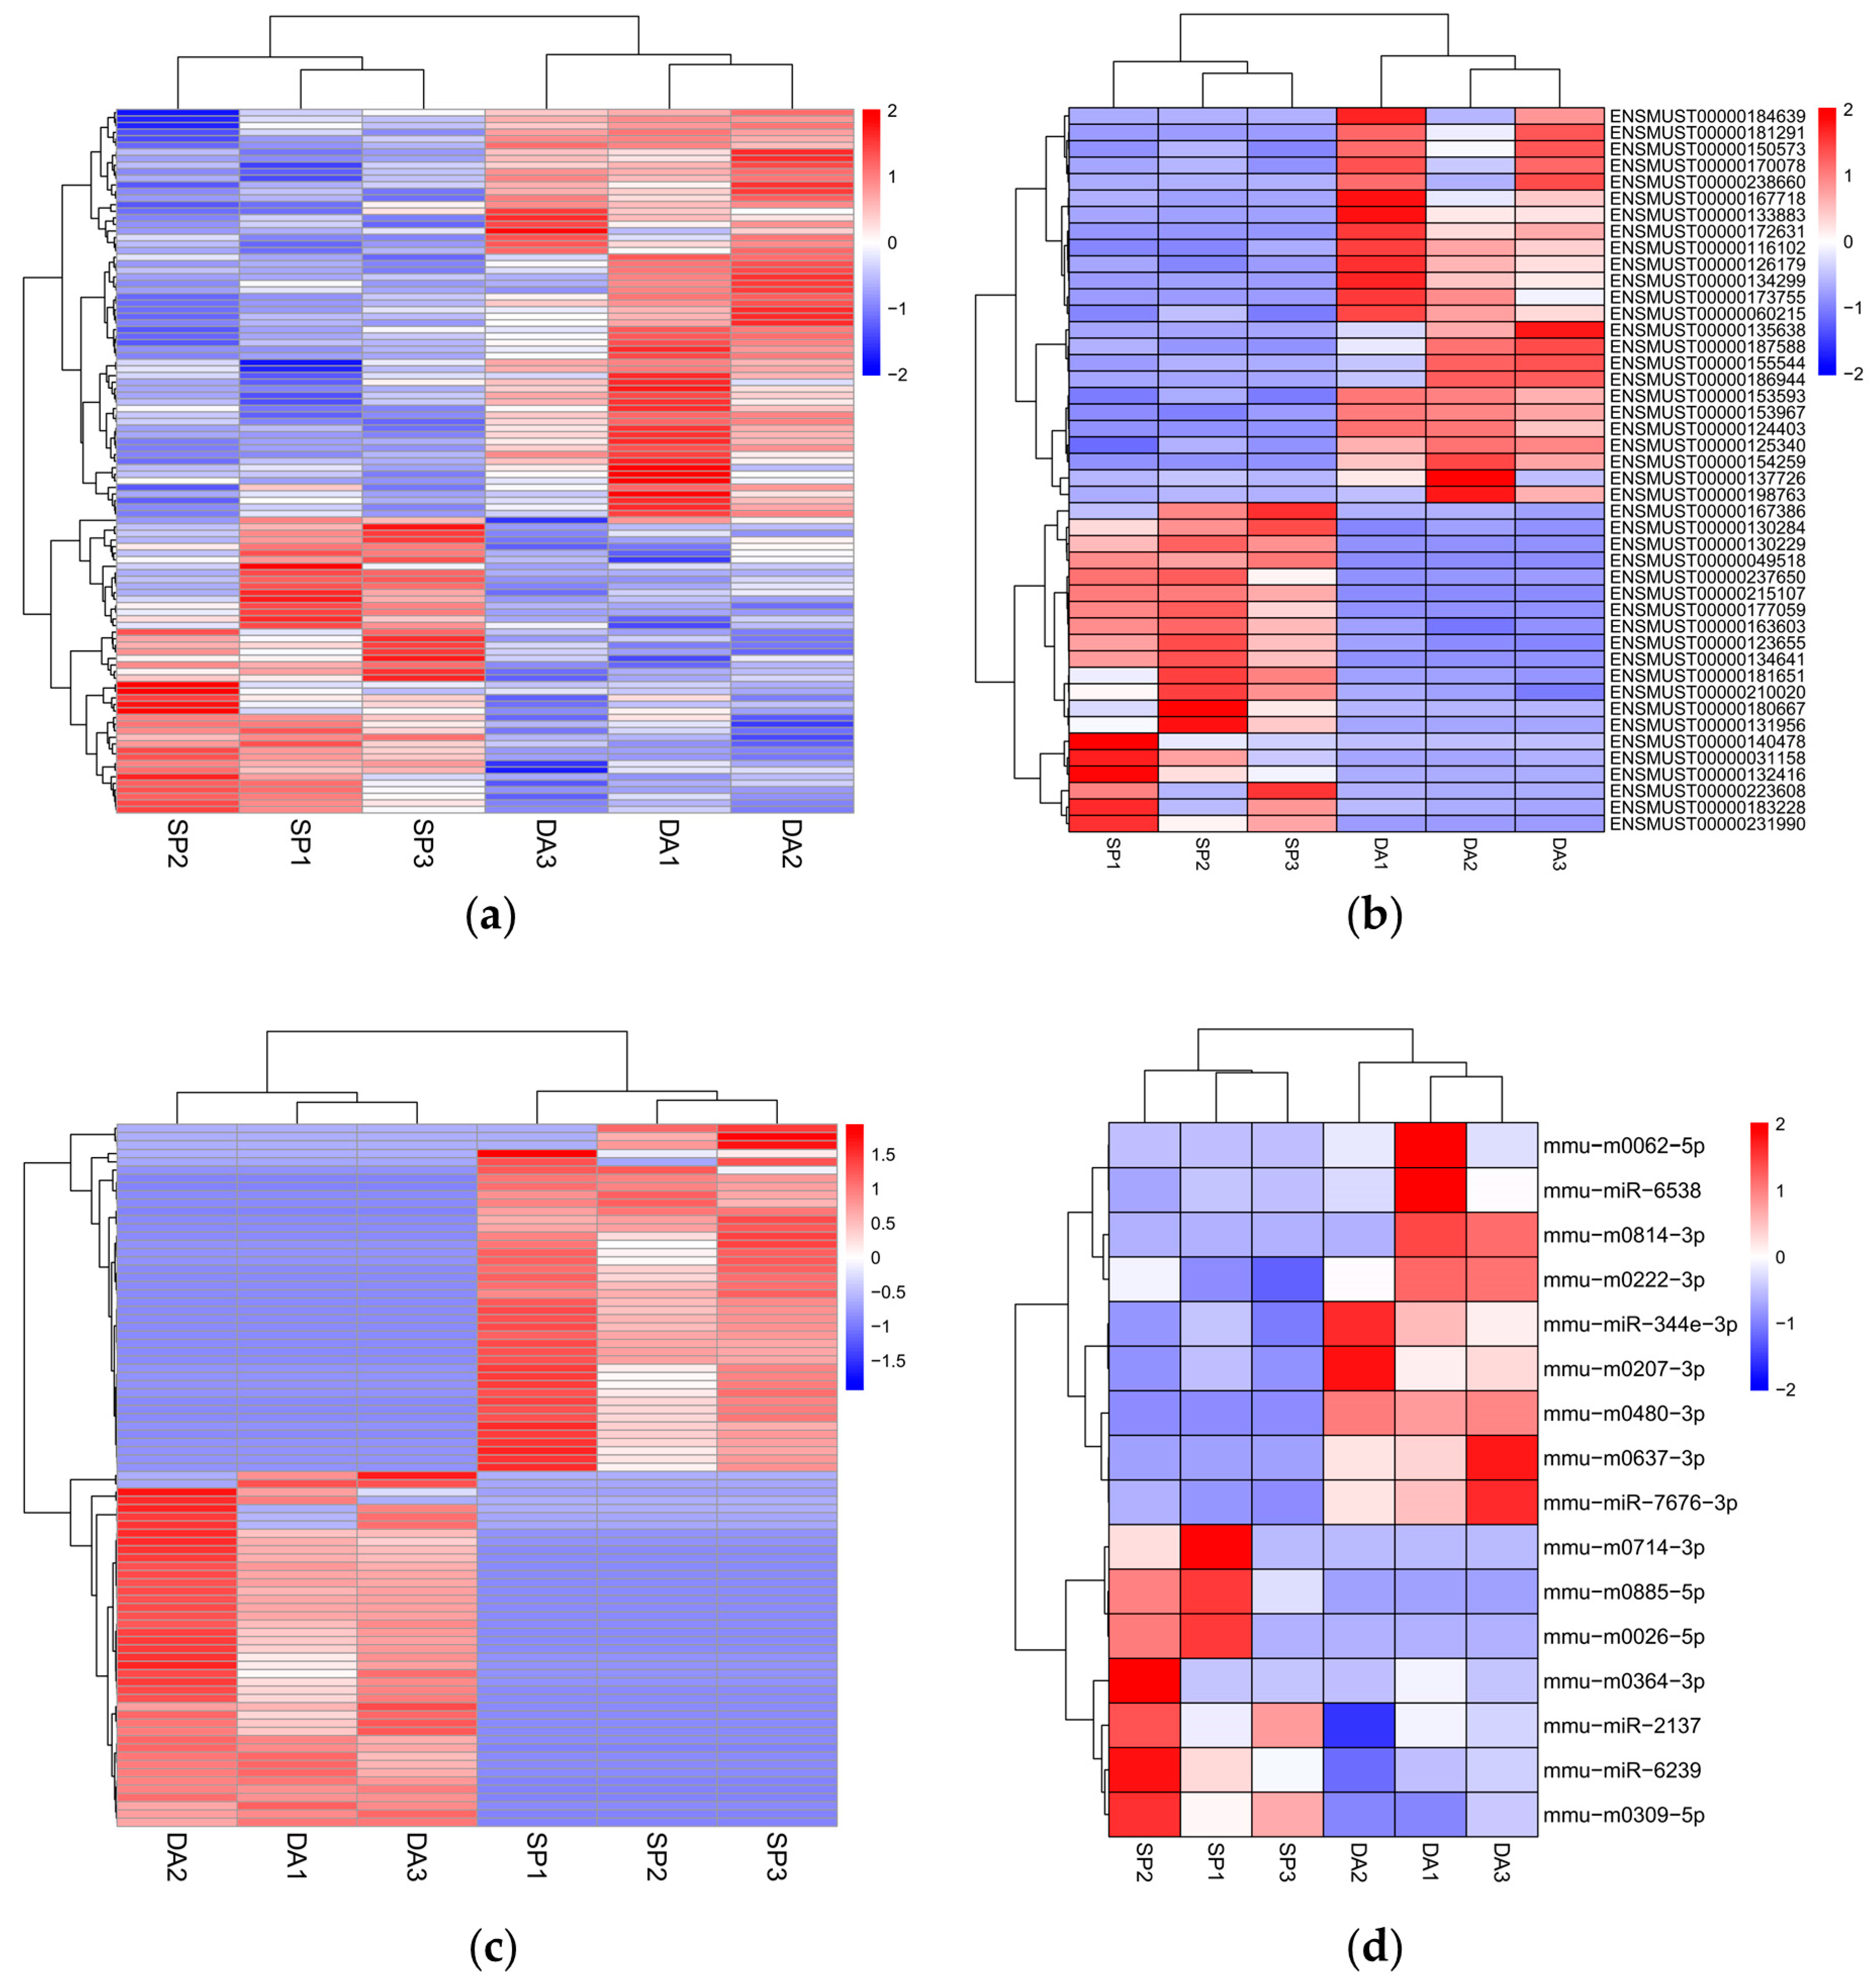
Figure 6.
Volcano plots of differential mRNAs, lncRNAs, circRNAs and miRNAs in DA and SP groups. (a) Volcano plot of 107 differentially expressed mRNAs; (b) Volcano plot of 44 differentially expressed lncRNAs; (c) Volcano plot of 85 differentially expressed circRNAs; (d) Volcano plot of 16 differentially expressed miRNAs.
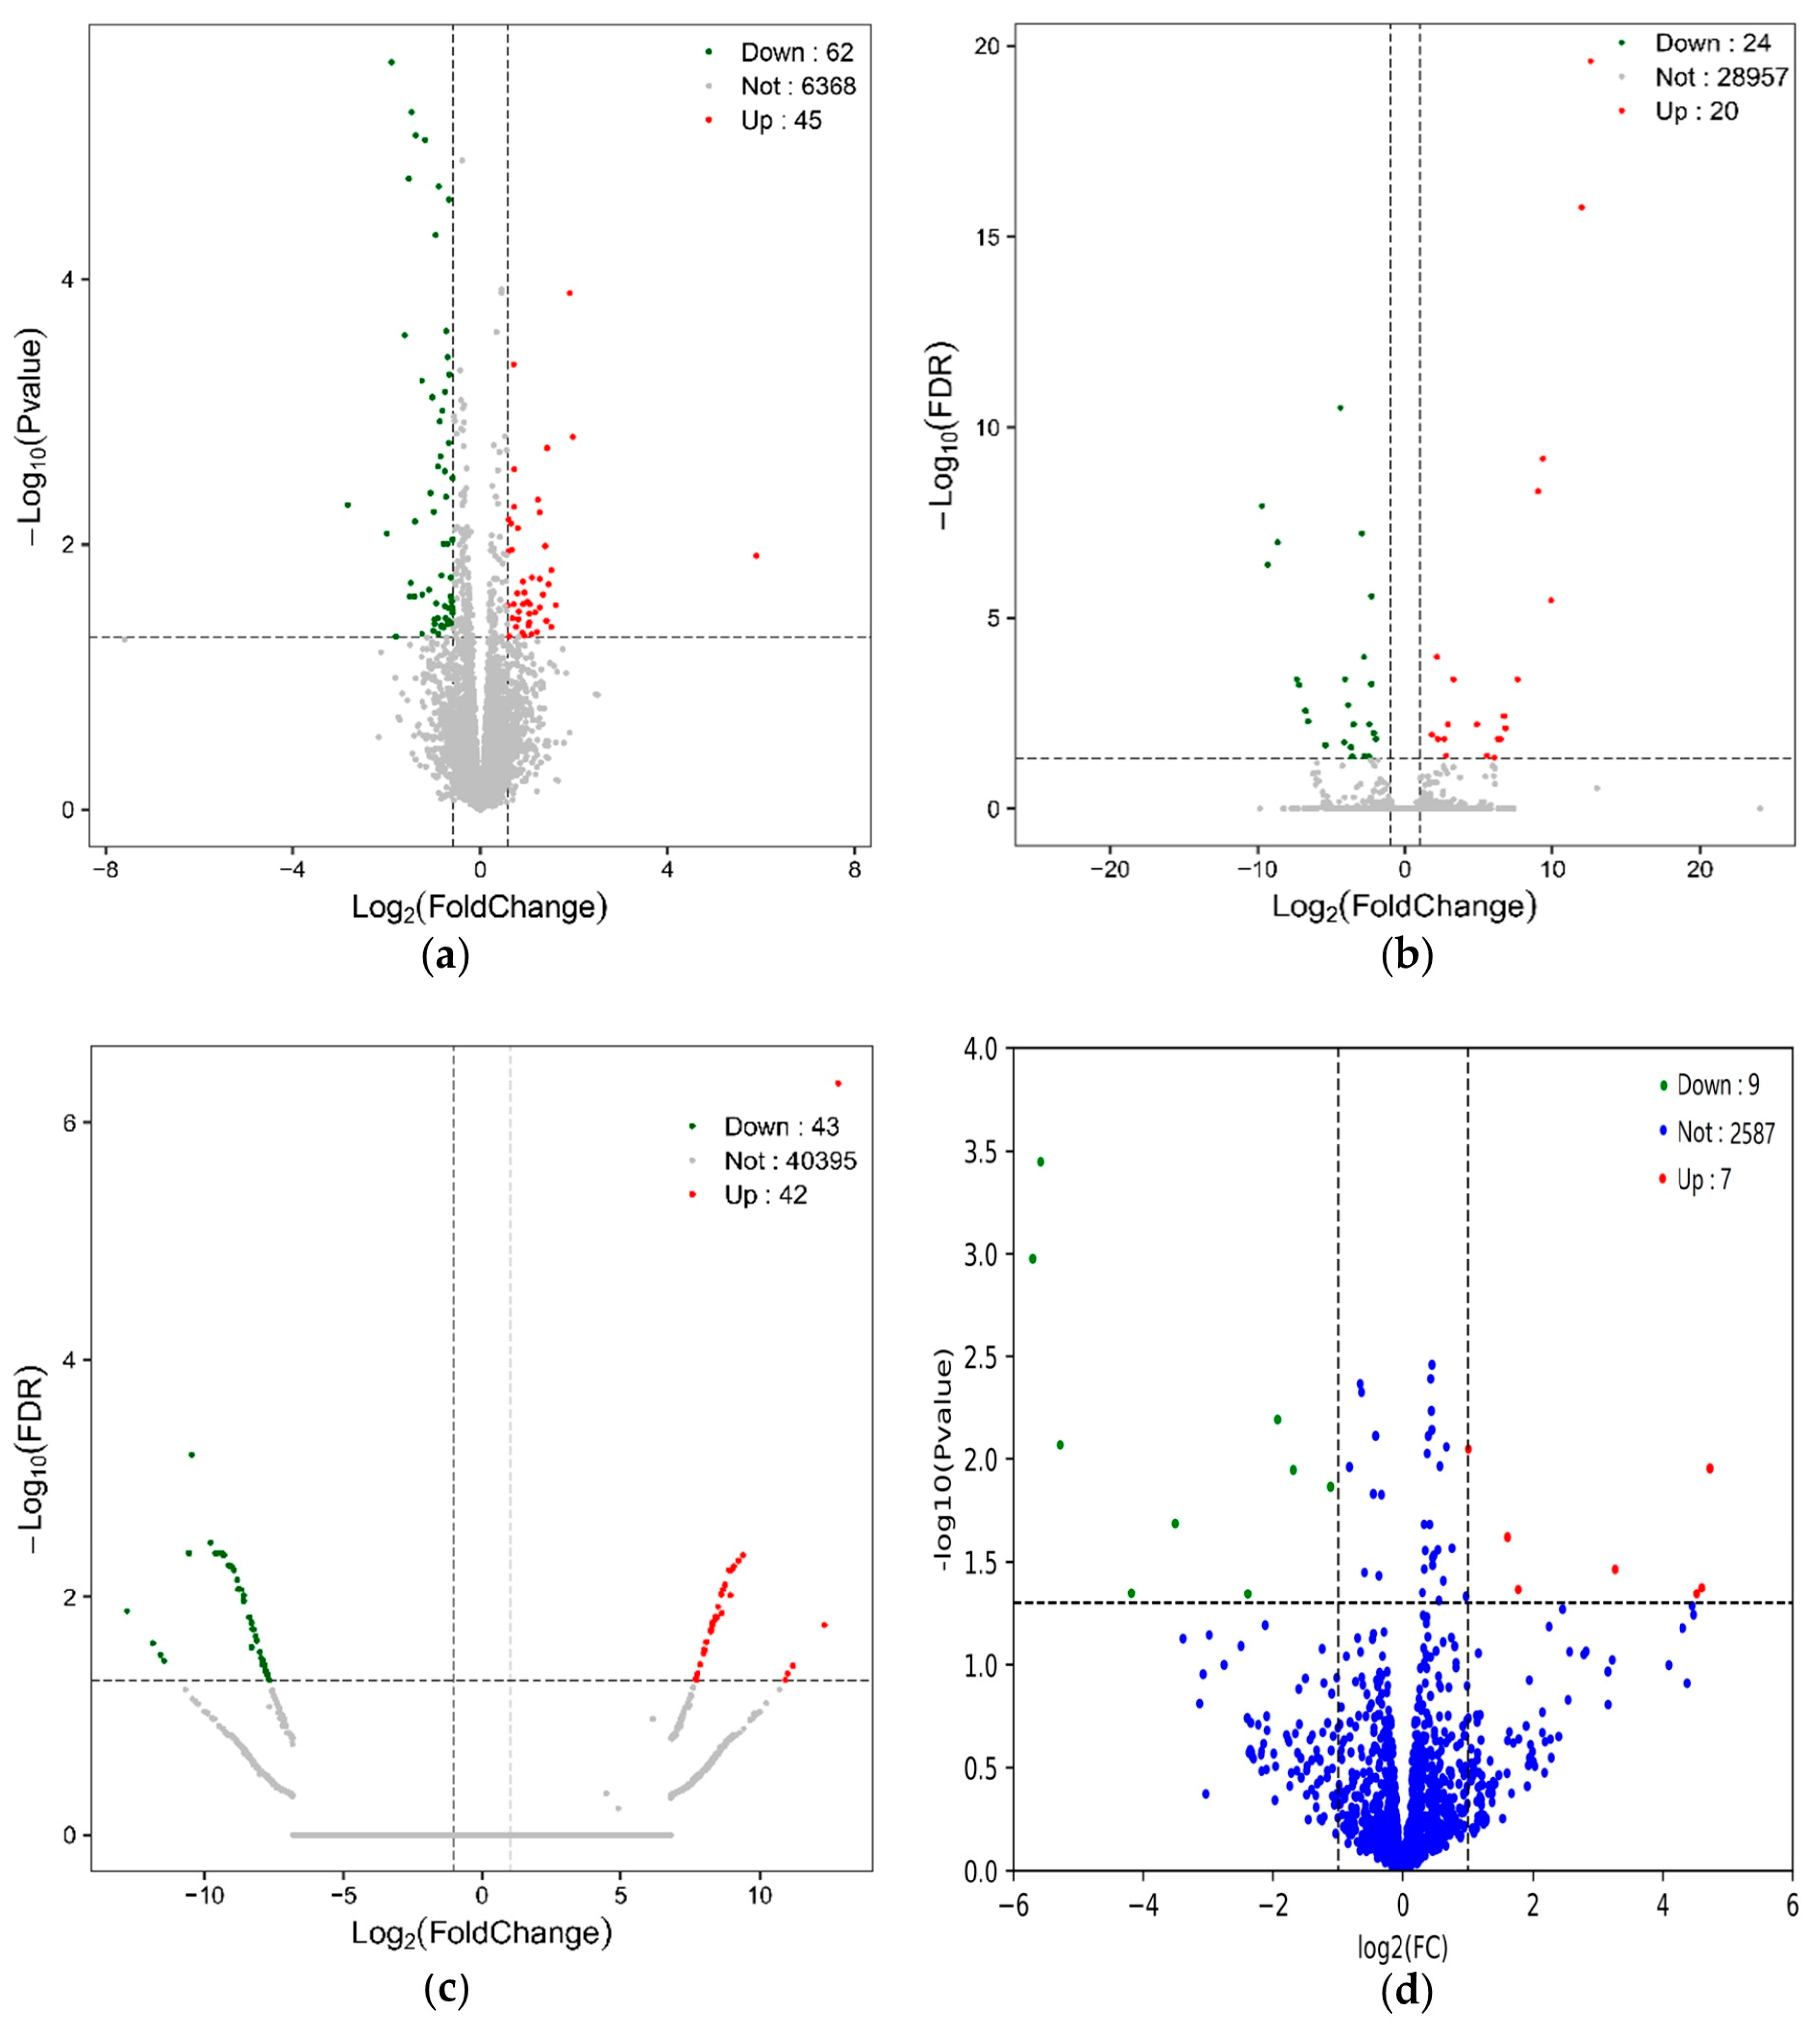
Figure 7.
GO enrichment analysis of differentially expressed mRNAs, differentially expressed LncRNA target genes, host gene that differentially expresses circRNAs and differentially expressed miRNA target genes. (a) GO biological functional analyses of differentially expressed mRNAs; (b) GO biological functional analyses of differentially expressed LncRNA target genes; (c) GO biological functional analyses of host gene that differentially expresses circRNAs; (d) GO biological functional analyses of differentially expressed miRNA target genes.
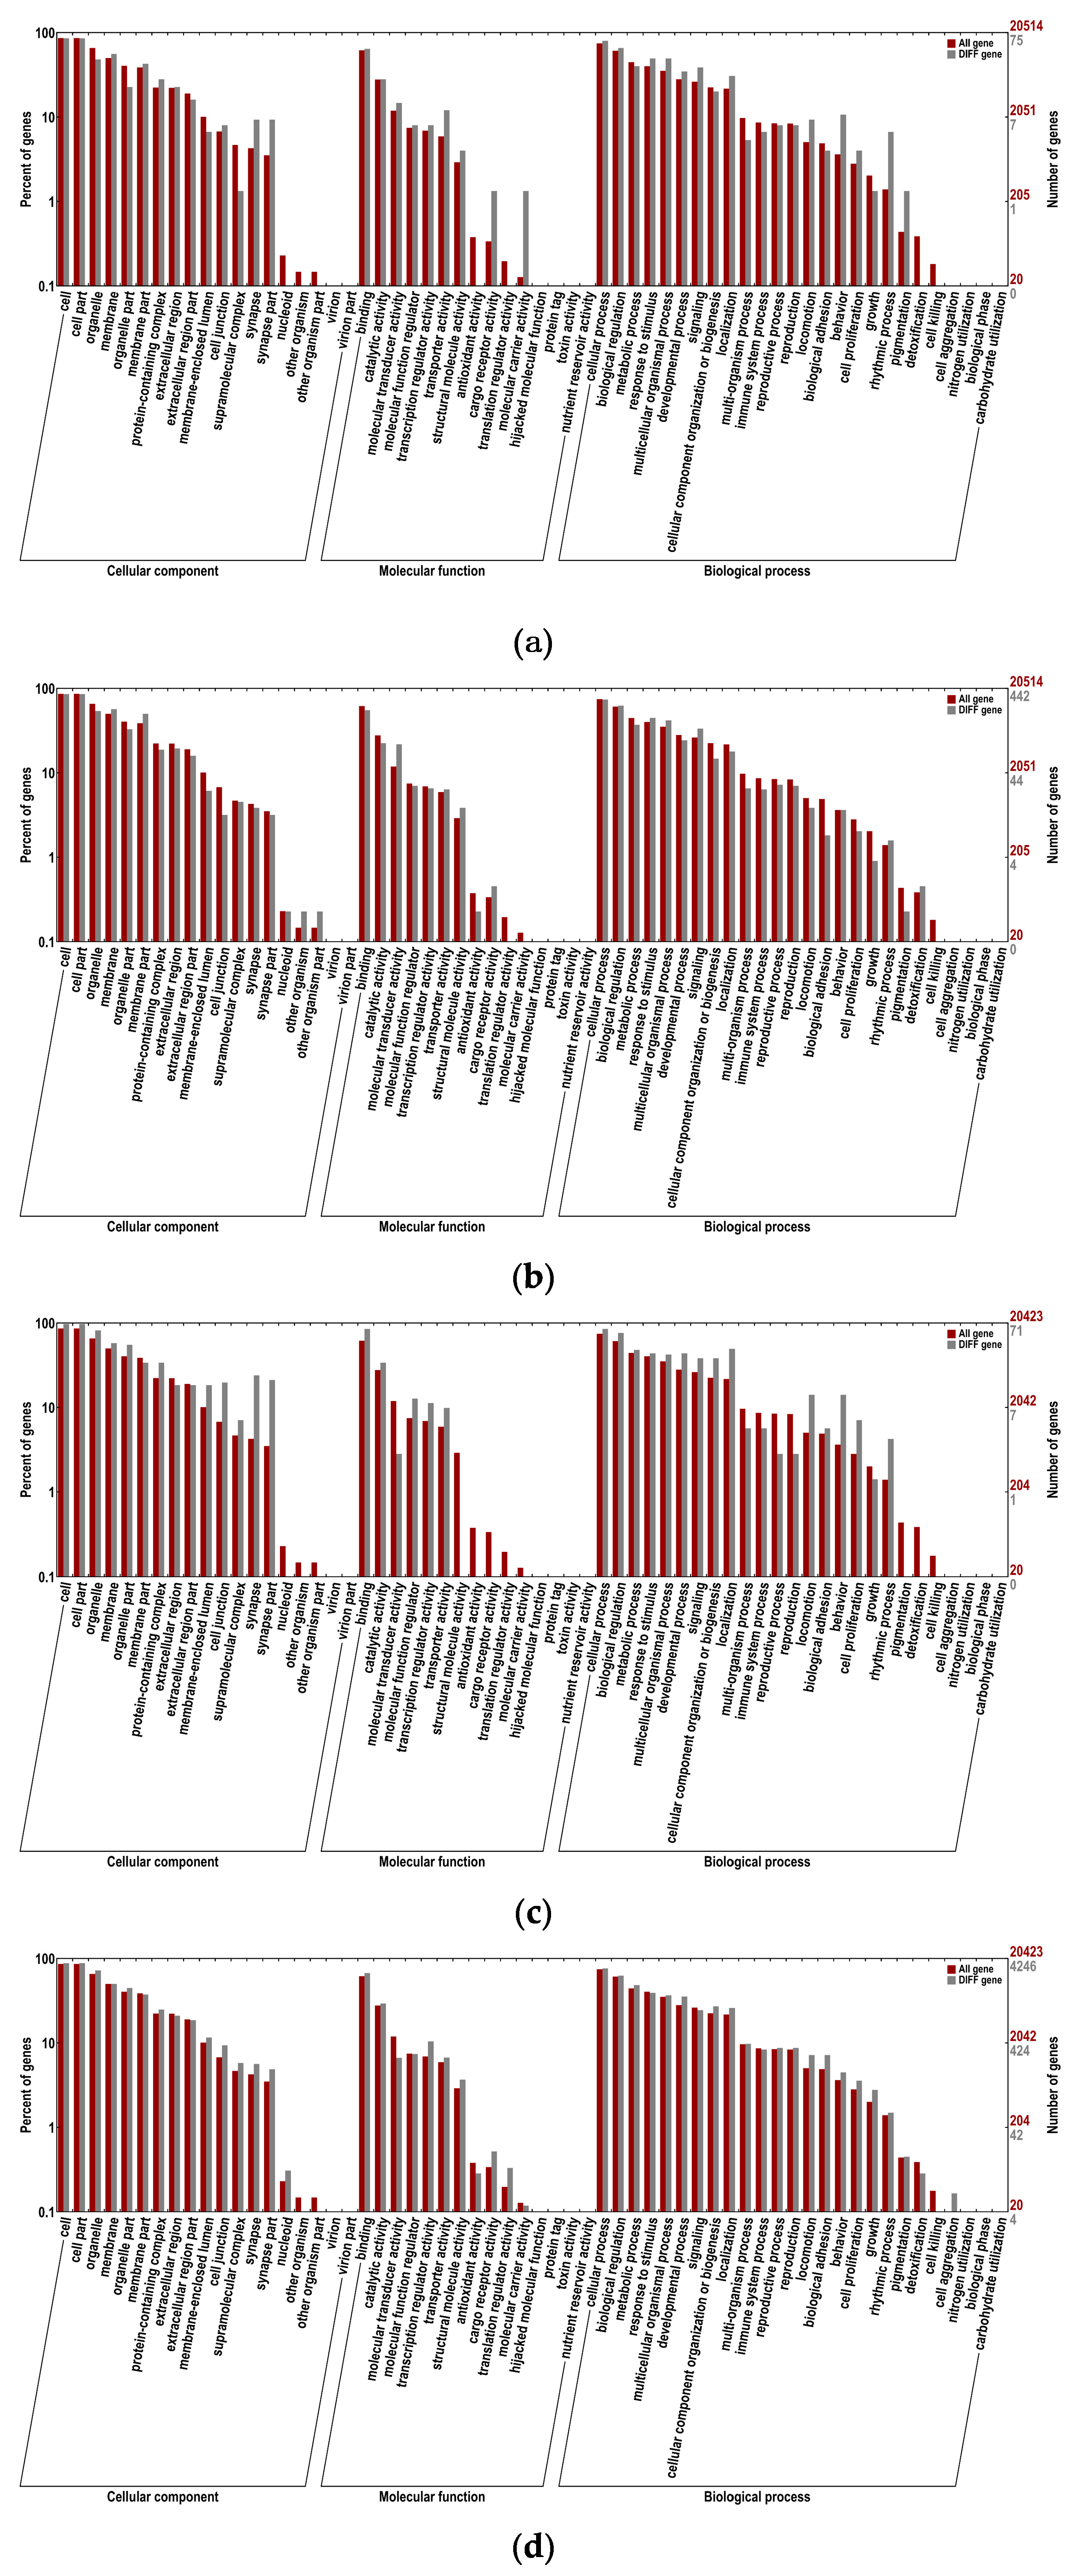
Figure 8.
KEGG pathway enrichment analysis of differentially expressed mRNAs, differentially expressed LncRNA target genes, host gene that differentially expresses circRNAs and differentially expressed miRNA target genes. (a) KEGG pathway analyses of differentially expressed mRNAs; (b) KEGG pathway analyses of differentially expressed LncRNA target genes; (c) KEGG pathway analyses of host gene that differentially expresses circRNAs; (d) KEGG pathway analyses of differentially expressed miRNA target genes.
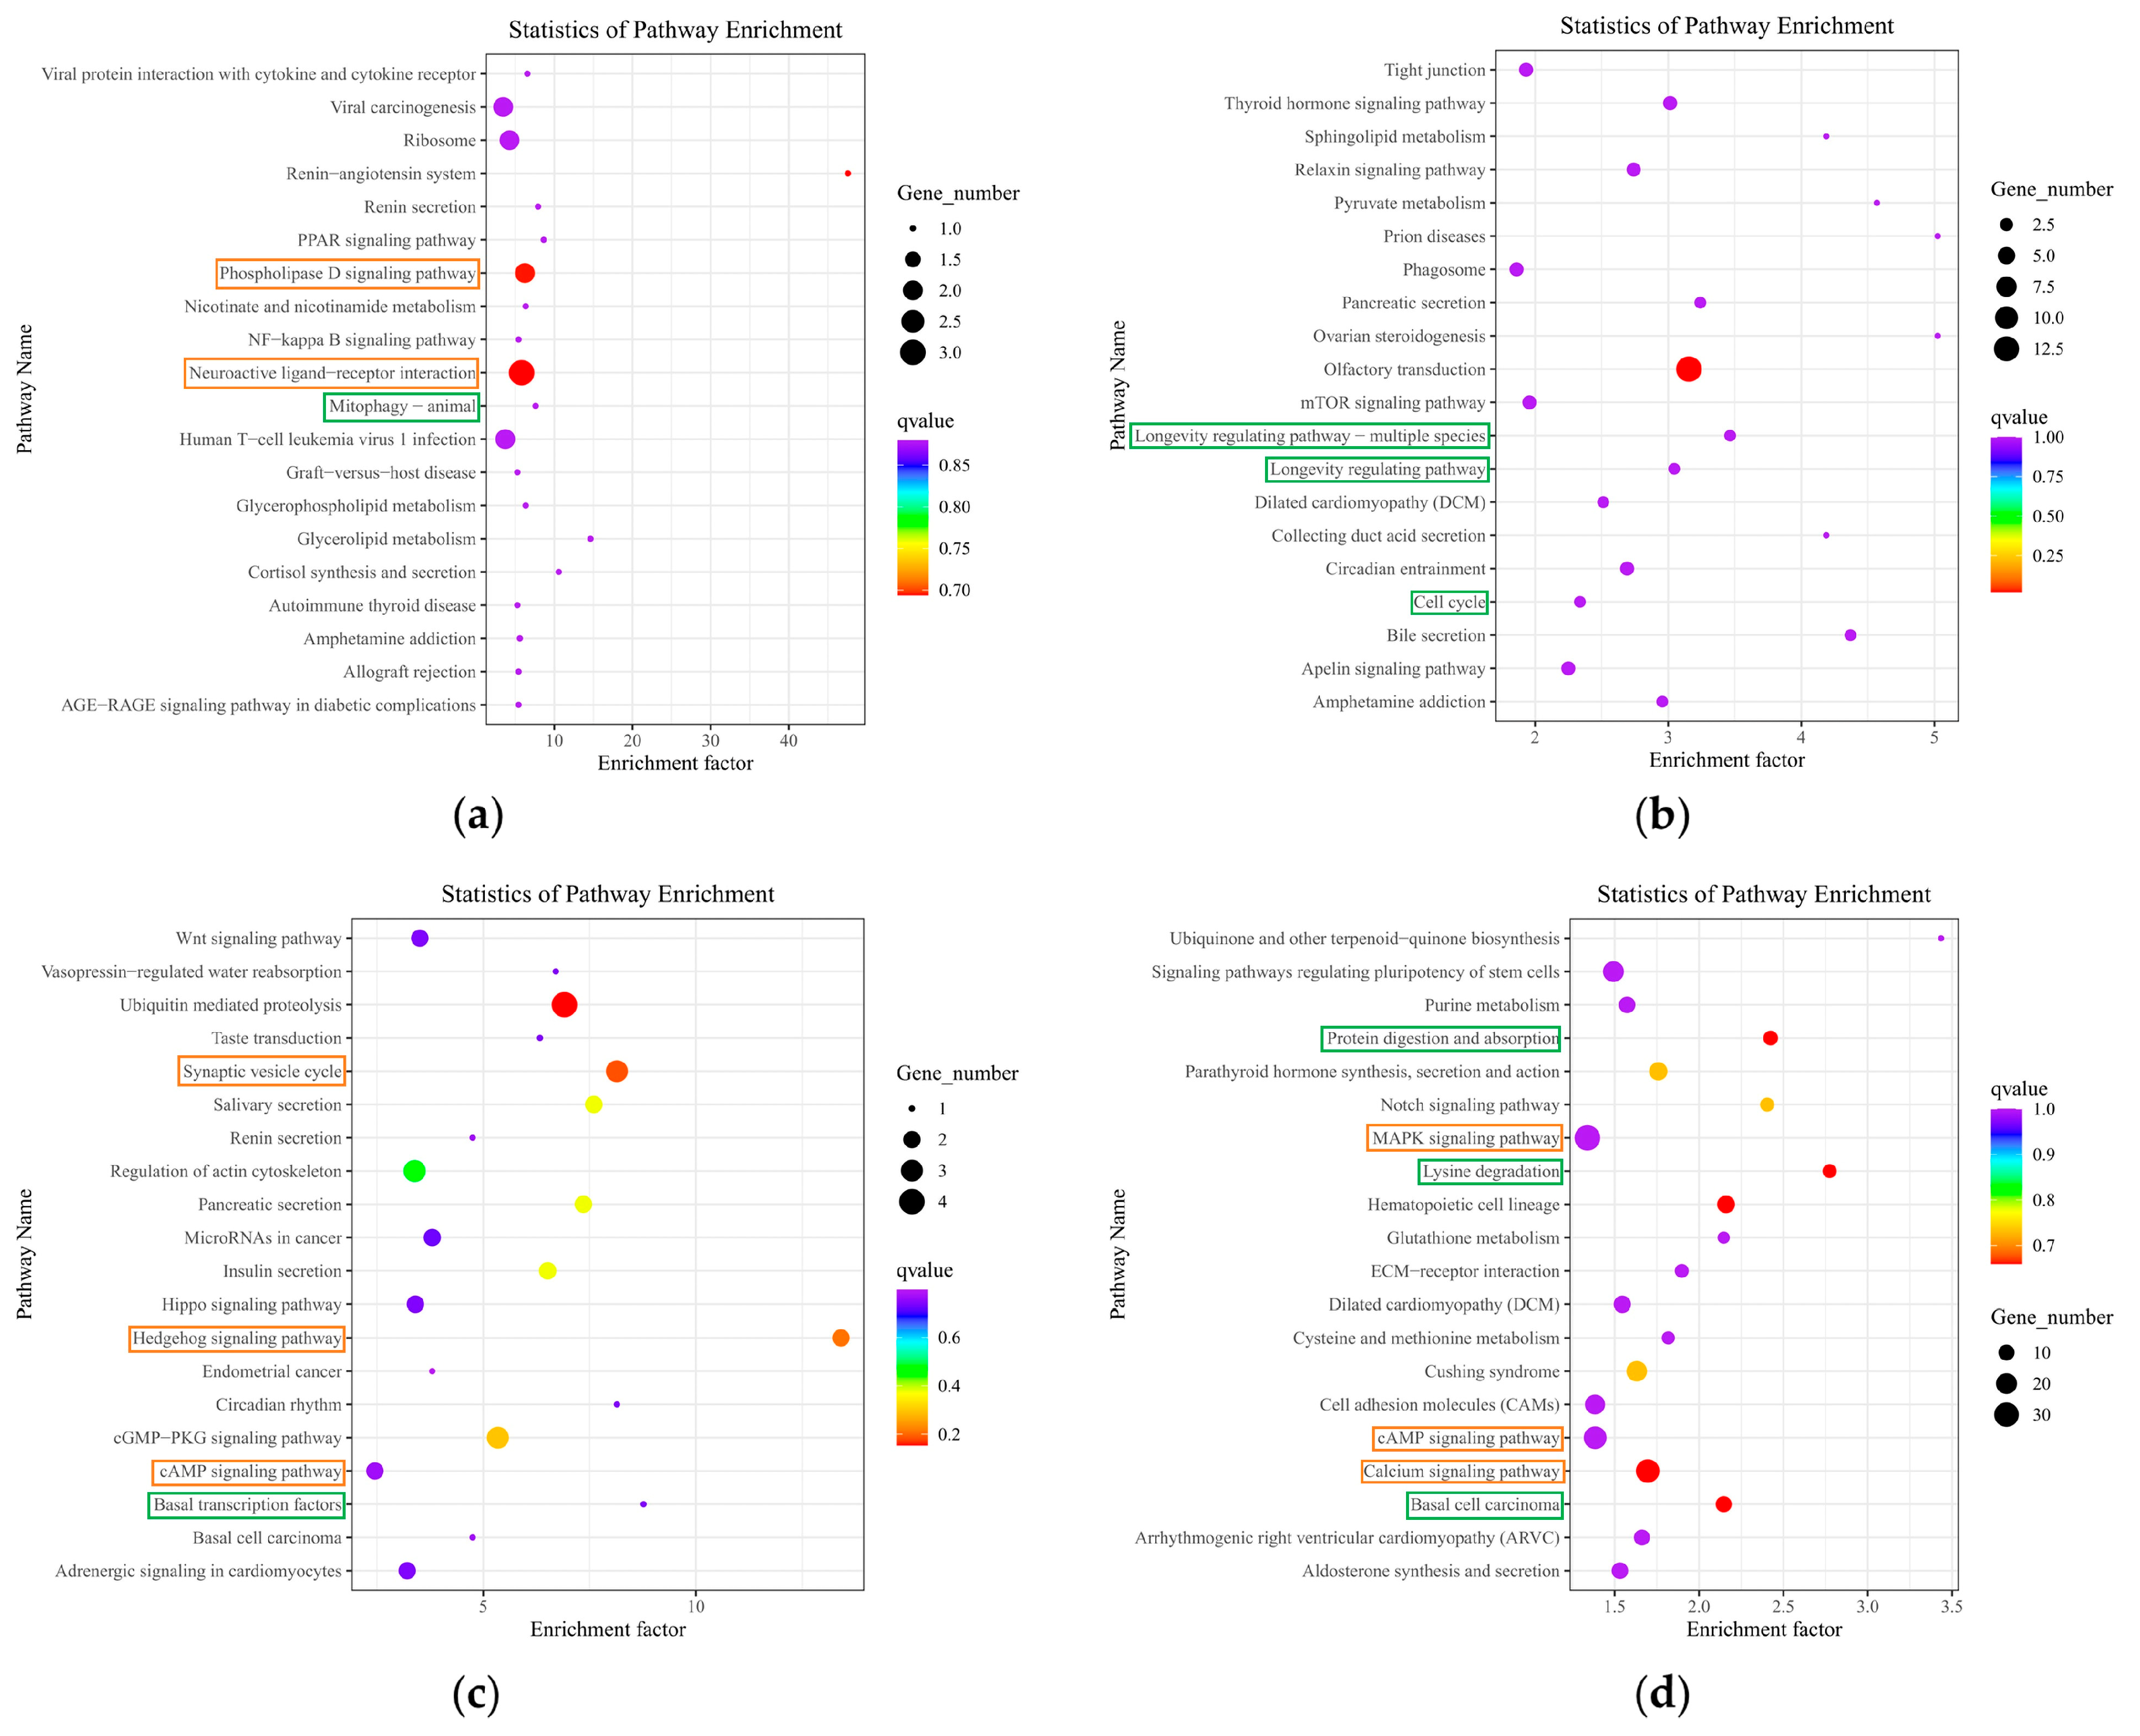
Figure 9.
Whole transcriptome association analysis. (a) KEGG integrated pathway network. Each dot represents a gene, each rectangle represents a pathway, and lines represent relationships between genes and genes or other pathways in the pathway. The colors of the different lines represent relationships from different pathways. The red dots are key genes. Combined analysis of differential RNA targeting relationships. (b) Host gene that differentially expresses circRNAs and the associated target RNAs were analyzed; (c)Analysis of target RNAs associated with differentially expressed miRNAs; (d)Analysis of target RNAs associated with differentially expressed mRNAs. DE_circRNA: differentially expressed circRNAs; DE_Hostgene_circRNA: all circRNAs with differentially expressed genes as the host gene; DE_miRNA_TargetcircRNA: all circRNAs targeted by differentially expressed miRNAs; DE_miRNA: differentially expressed miRNAs; DE _mRNA_TargetmiRNA: all miRNAs targeted by differentially expressed mRNA; DE_circRNA_TargetmiRNA: all miRNAs targeted by differentially expressed circRNAs; DE_mRNA: differentially expressed mRNAs; DE_miRNA_TargetmRNA: all target genes of differentially expressed miRNAs; DE_circRNA_Hostgene: differential expression of circRNAs for all host gene.
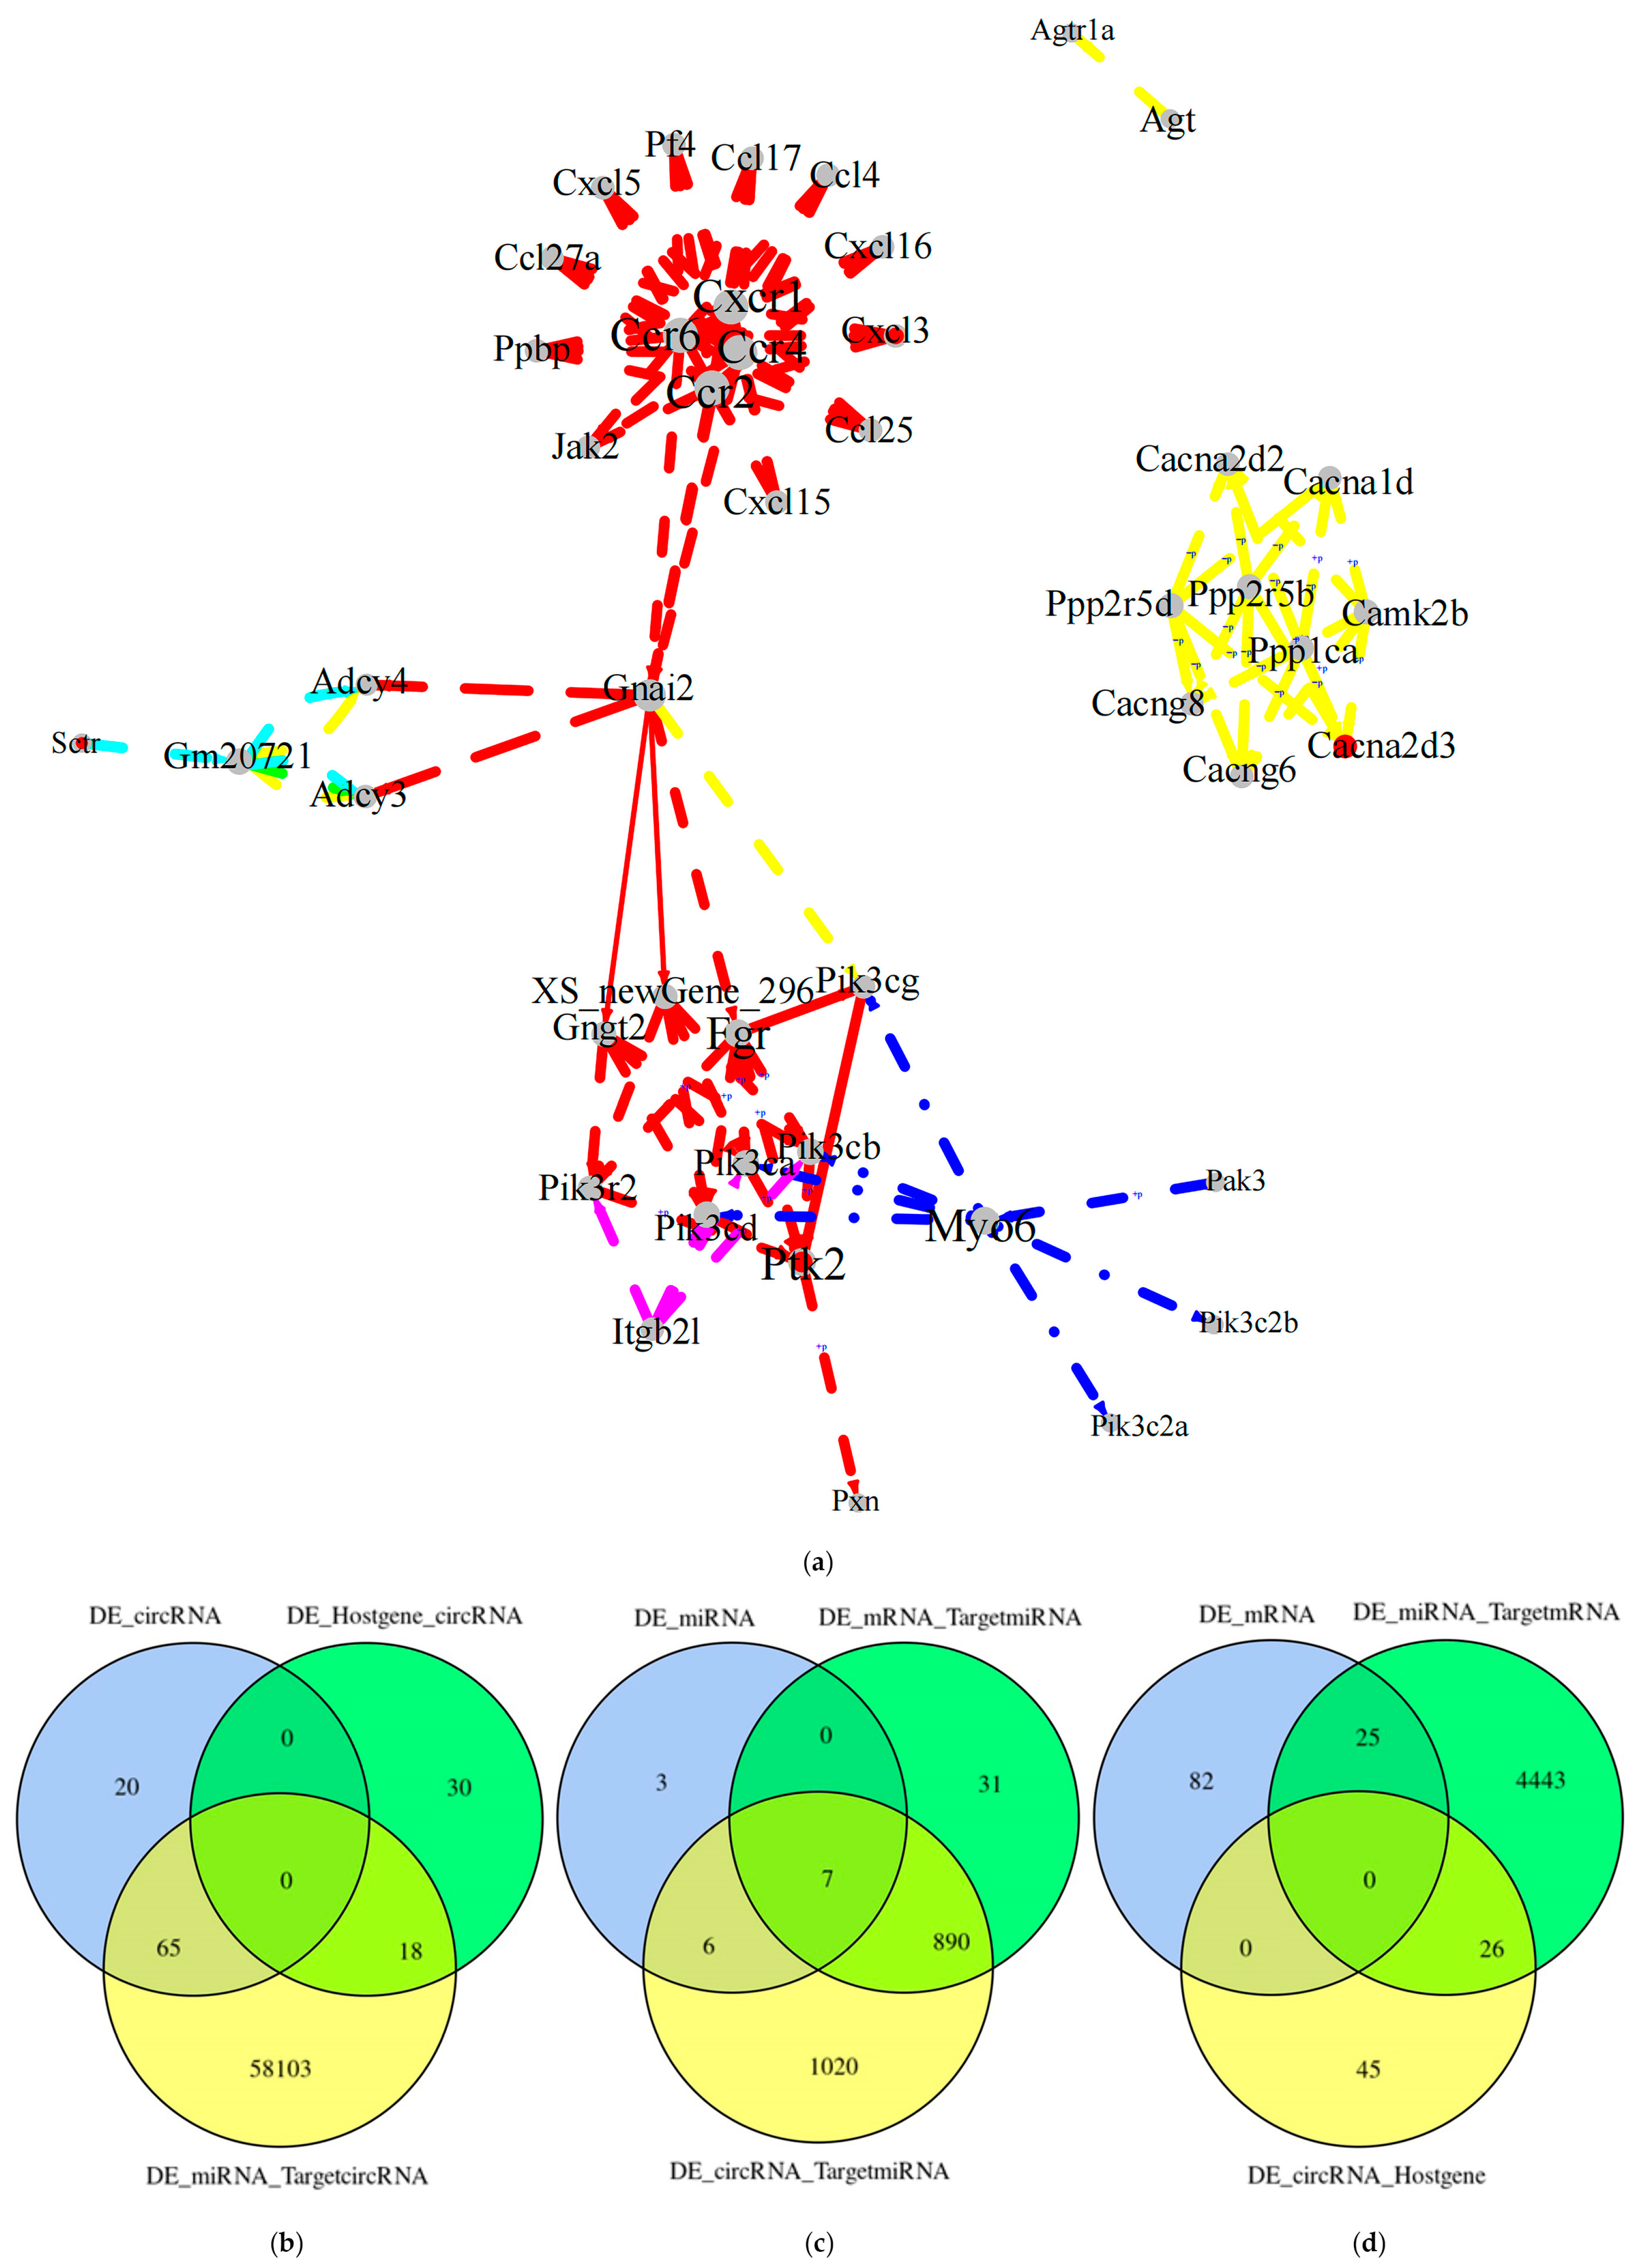
Figure 10.
Heatmaps and volcano plots of differentially expressed proteins in DA and SP groups. (a) Heatmap of differentially expressed proteins; (b) Volcano plot of differentially expressed proteins. (c)Differentially expressed protein string network graph. Each node represents a protein, with thicker lines representing higher association confidence.
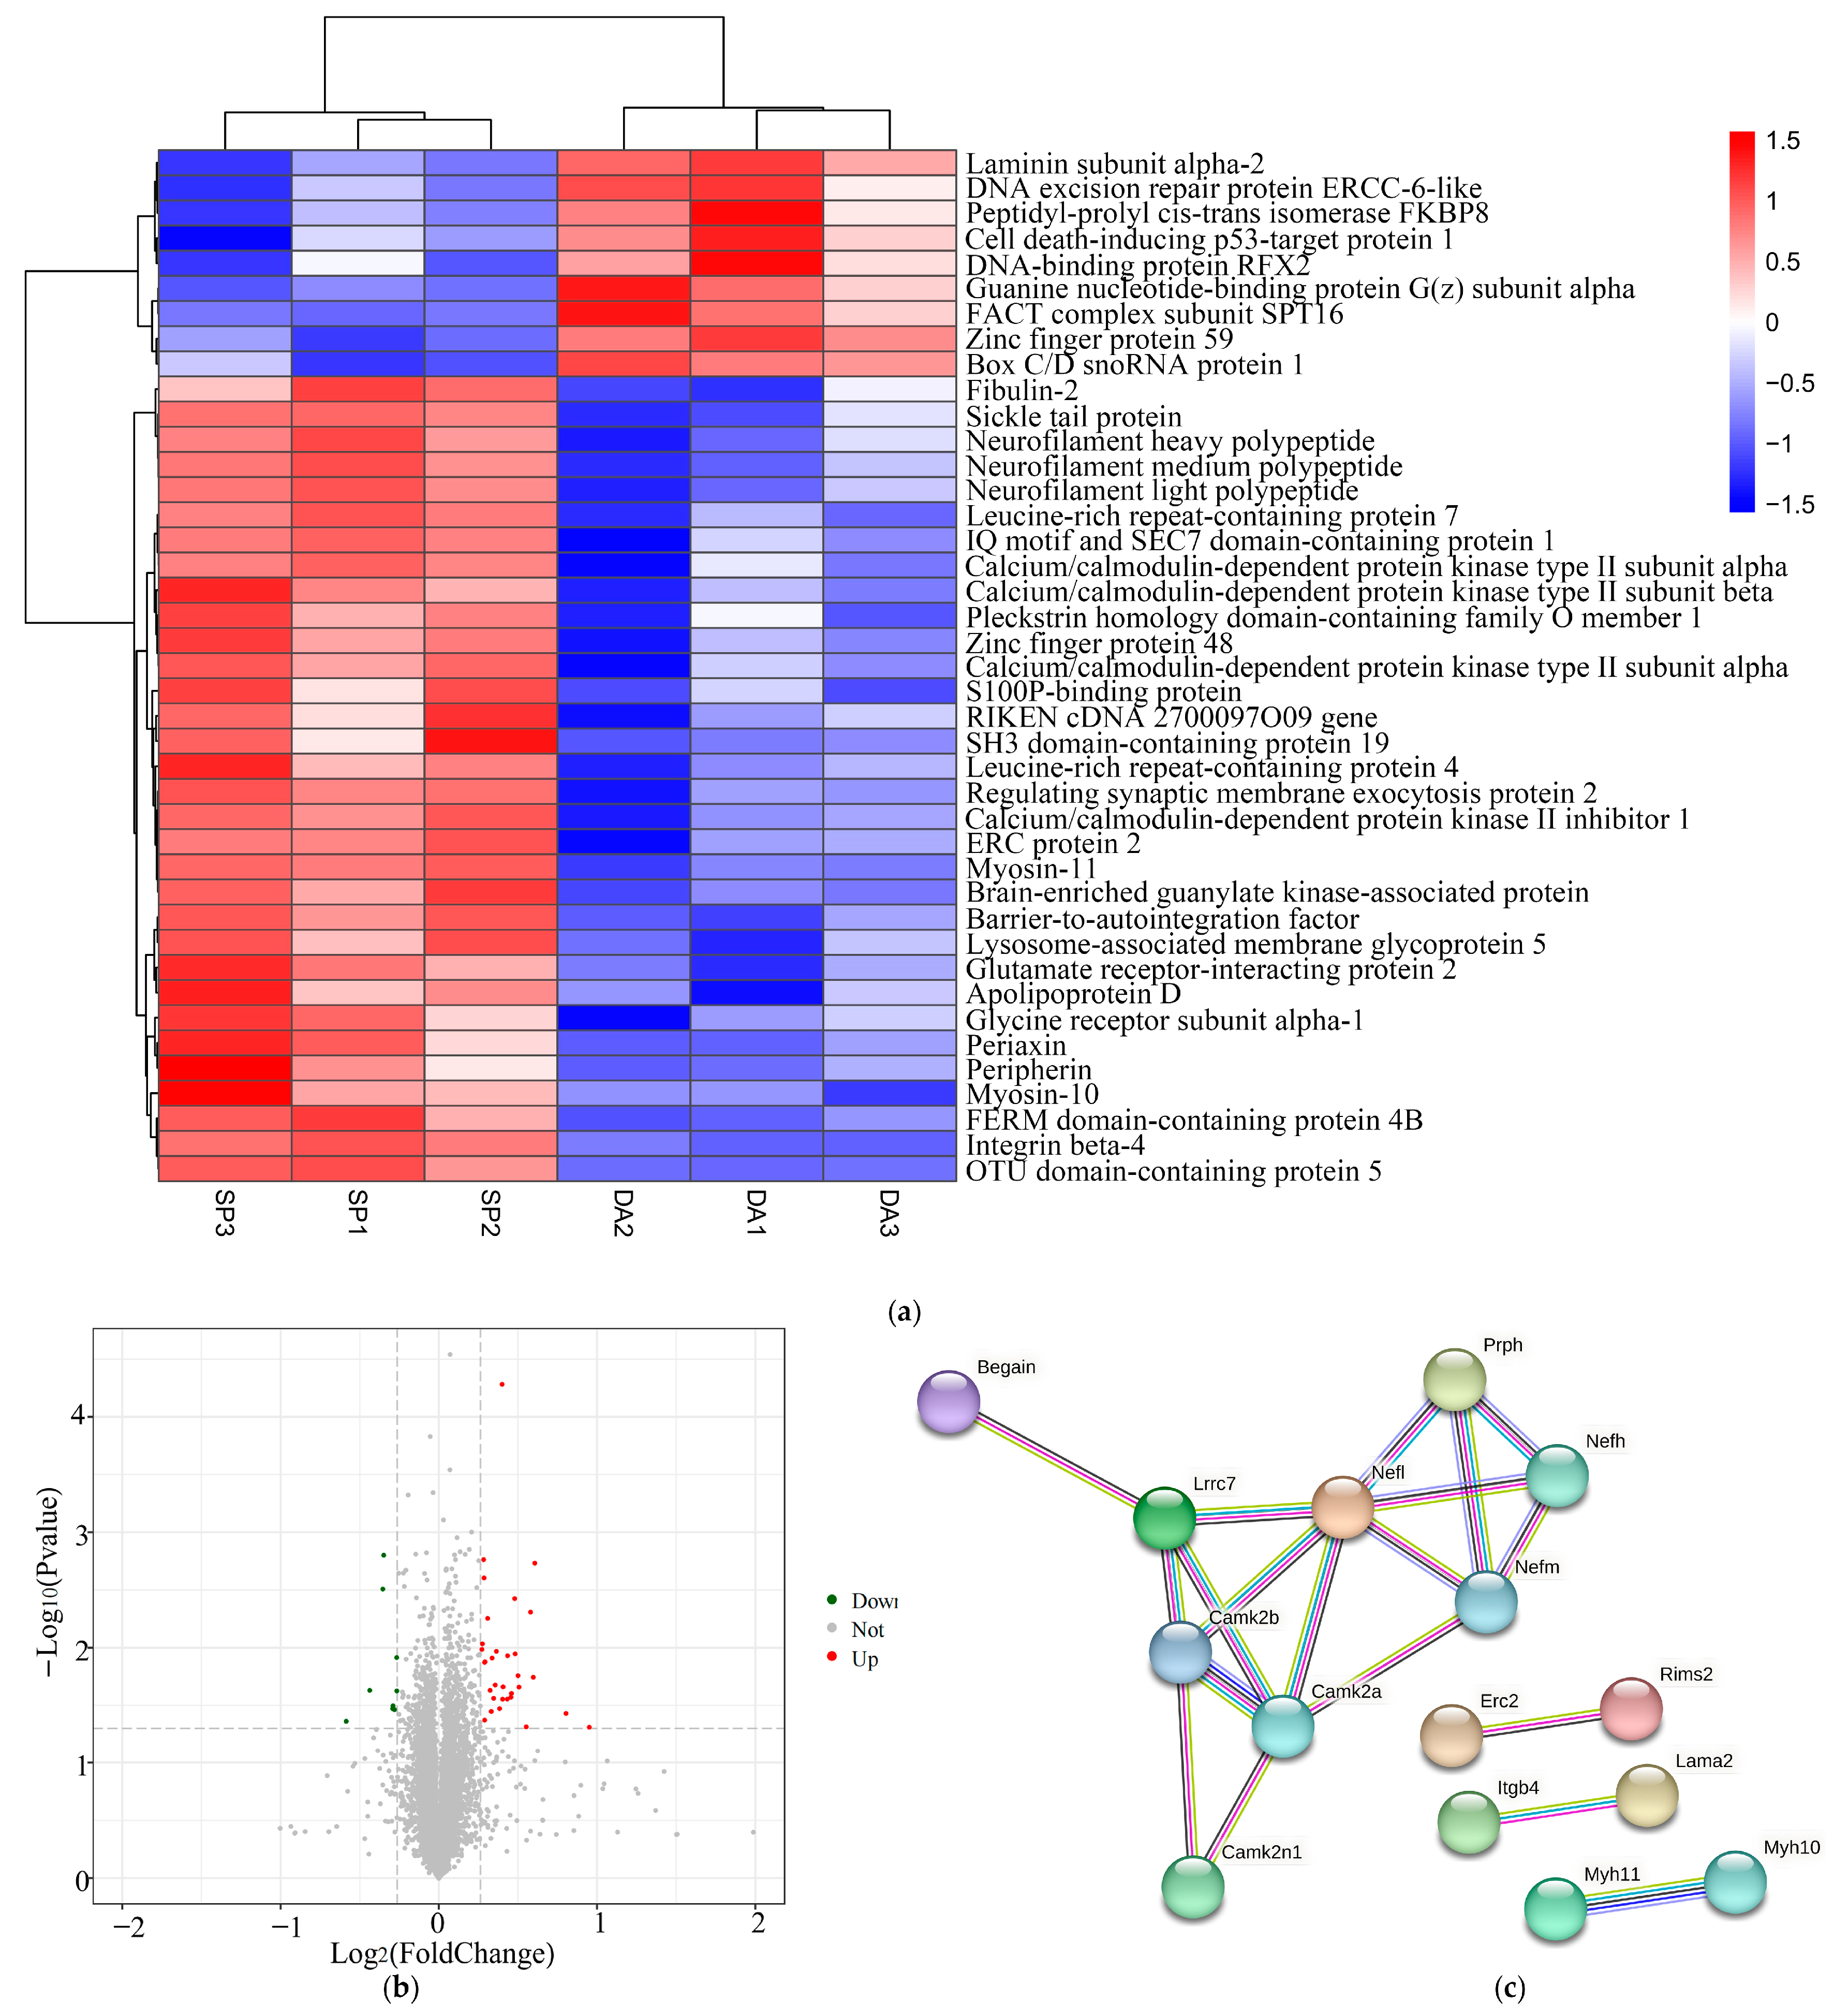
Figure 11.
GO enrichment analysis and KEGG pathway enrichment analysis of differentially expressed proteins. (a) GO biological functional analyses of differentially expressed proteins; (b) KEGG pathway analyses of differentially expressed proteins.
Figure 11.
GO enrichment analysis and KEGG pathway enrichment analysis of differentially expressed proteins. (a) GO biological functional analyses of differentially expressed proteins; (b) KEGG pathway analyses of differentially expressed proteins.
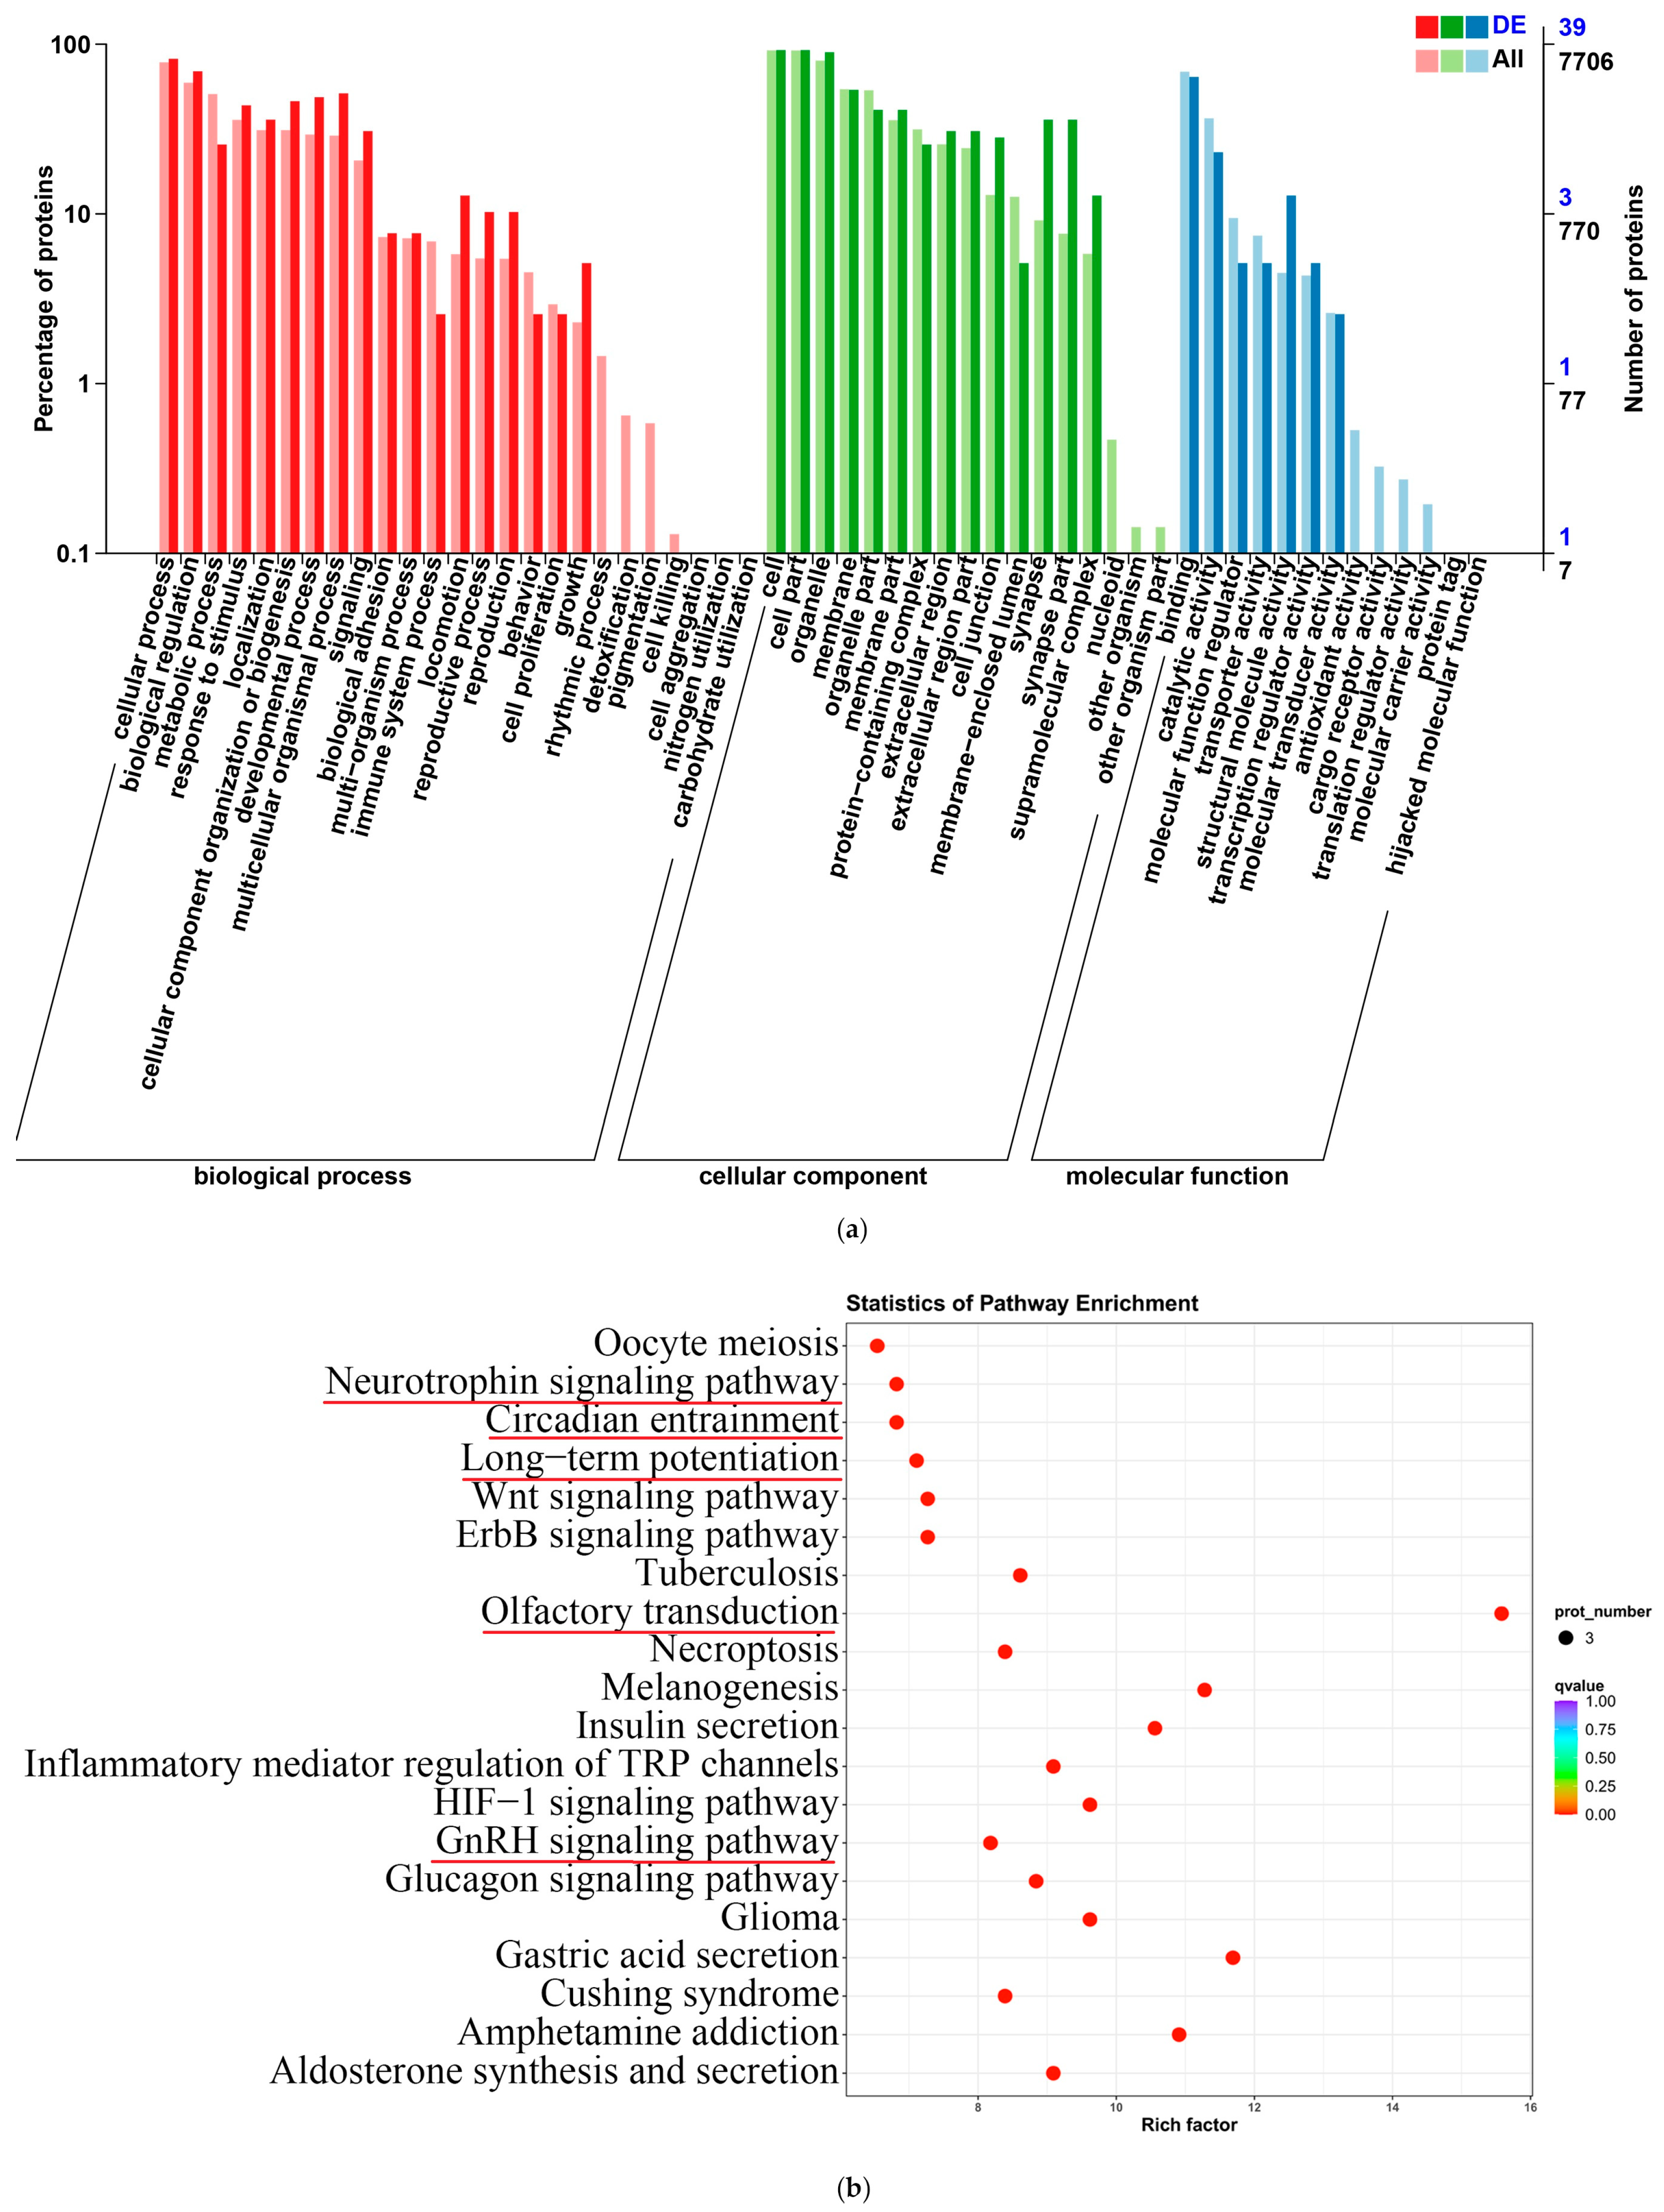
Figure 12.
(a) Spearman correlation heatmap. The columns represent differential proteins and the rows represent differential genes, and the magnitude of the correlation is shown by the difference in color. *, p < 0.05; **, p < 0.01. (b) Network diagram. The rectangles in the diagram are differential genes, the circles are differential proteins, the blue lines indicate negative correlations, and the red lines indicate positive correlations.
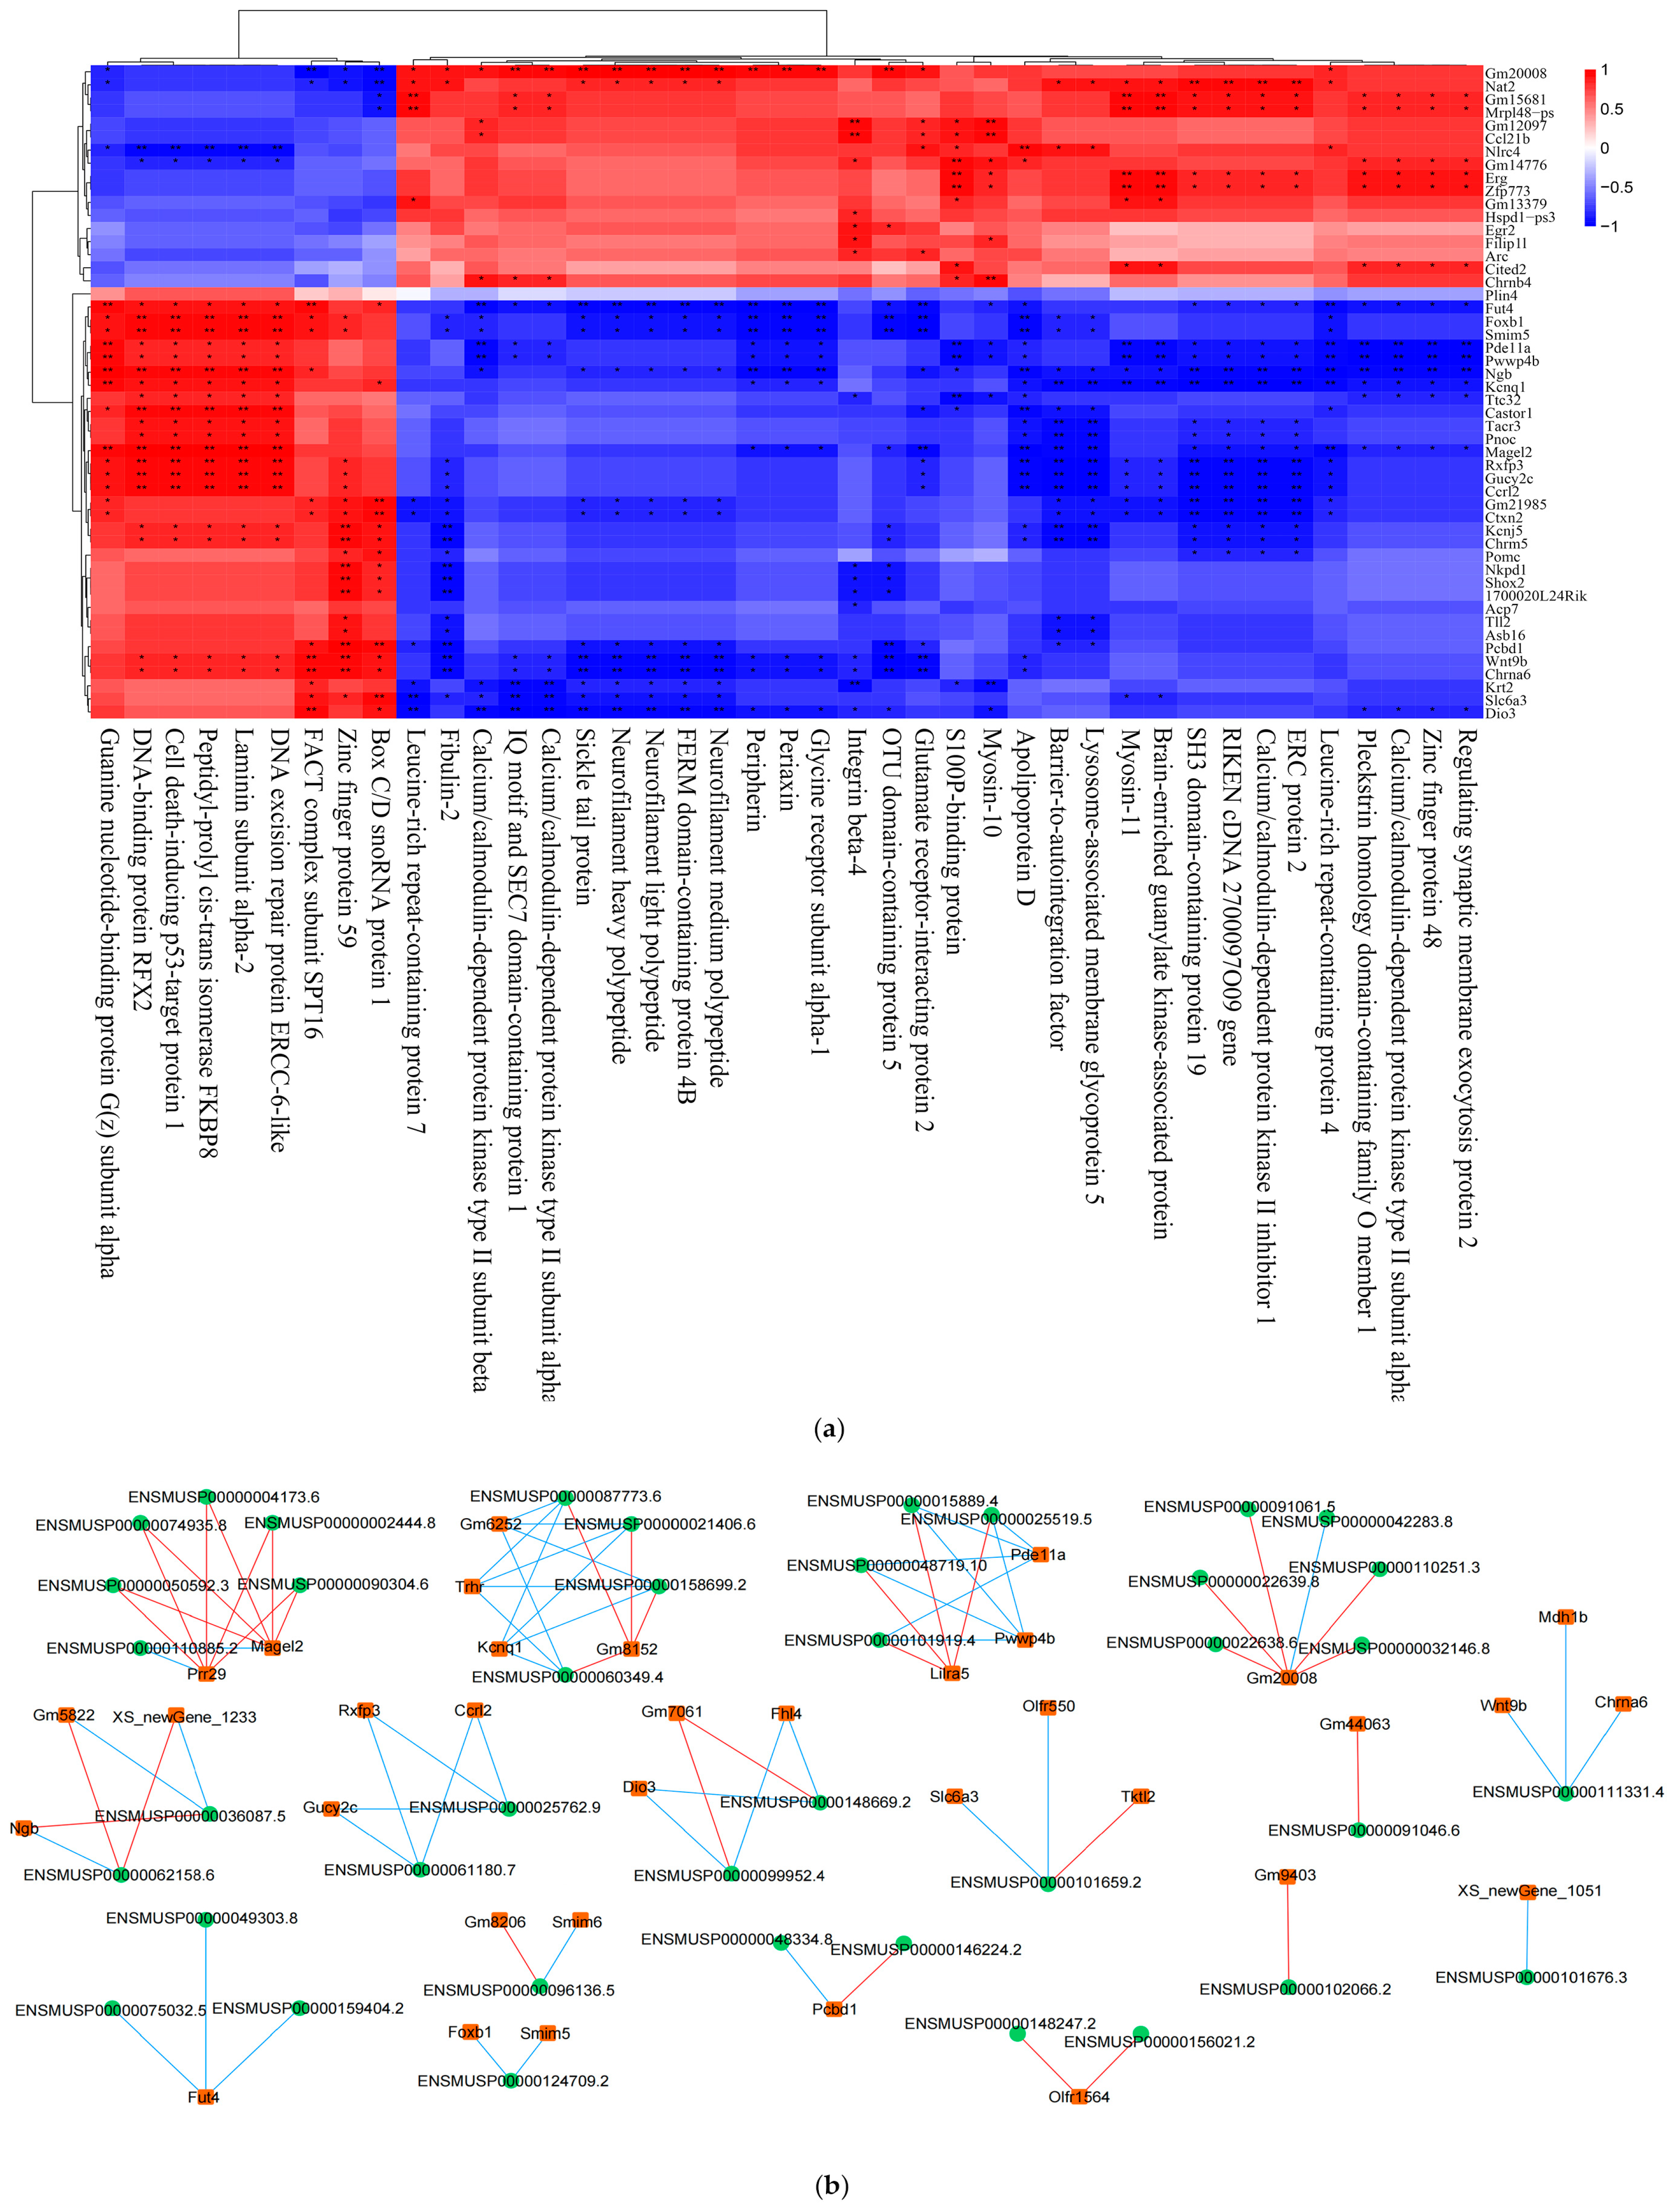
Figure 13.
Validation of differentially expressed proteins. (a) WB images (left) and corresponding statistics (right) of neurofilament light polypeptide (NEFL) in D-gal model mouse brain tissue showed that significant up-regulation of neurofilament light polypeptide (NEFL) expression at different concentrations of SPAM1. (b) WB images (left) and corresponding statistics (right) of neurofilament medium polypeptide (NEFM) in D-gal model mouse brain tissue showed that significant up-regulation of neurofilament medium polypeptide (NEFM) expression at different concentrations of SPAM1. ##, P<0.01, vs. CON; **, P<0.01, vs. D-gal. Data are presented as the mean ± SEM of three experiments.
Disclaimer/Publisher’s Note: The statements, opinions and data contained in all publications are solely those of the individual author(s) and contributor(s) and not of MDPI and/or the editor(s). MDPI and/or the editor(s) disclaim responsibility for any injury to people or property resulting from any ideas, methods, instructions or products referred to in the content. |
© 2024 by the authors. Licensee MDPI, Basel, Switzerland. This article is an open access article distributed under the terms and conditions of the Creative Commons Attribution (CC BY) license (http://creativecommons.org/licenses/by/4.0/).
Copyright: This open access article is published under a Creative Commons CC BY 4.0 license, which permit the free download, distribution, and reuse, provided that the author and preprint are cited in any reuse.


