Submitted:
01 March 2024
Posted:
05 March 2024
You are already at the latest version
Abstract
Climate change, growing world population and increasing food demand require higher yields and adaptability of crops, including spring bread wheat. Modern plant breeding based on achievements of genetics has a significant impact on plant resistance to diseases, climate variability and other factors. Genome wide association studies (GWAS) is one of genetics tools for mining of genome loci associated with economically important traits. In the current study, we applied GWAS to reveal QTL for spike productivity and grain quality using a panel of spring varieties of Triticum aestivum L. bred in different decades of the last century in Russia and Germany. The study has enabled to find new genetic markers associated with grain yield and quality. Studying genetic basis of grain yield and quality by comparison of wheat varieties from different breeding periods, including landraces preserved as the source of valuable genetic diversity for breeding and genetic studies, makes it possible not only to understand selection processes in the past, but also to develop strategies for future breeding work.
Keywords:
conservation of genetic diversity
; grain quality
; GWAS
; landraces
; spring bread wheat
; spike productivity
1. Introduction
Wheat (Triticum aestivum L.) is the most widely spread crop in the world, cultivated from the northern polar latitudes to the southernmost parts of Australia, Africa, and America. Wheat accounts for around 30% of world grain production and grain reserve [1,2]. Wheat yields affect the global economy. Breeders are keen to develop improved cultivars based on phenotypic records of grain yield and quality data expecting that stable harvest will be maintained under various environmental conditions [3]. The efforts to develop cultivars combining resistance to adverse biotic and abiotic factors with high yield have remained relevant for many years. Wheat is an allogexaploid, with a genome size of 17,2 Gbp [4,5,6]. There are a large number of studies conducted to detect genomic regions associated with morphological characteristics. The quantitative trait loci method (QTL) is often used for such studies. The use of this method made it possible to help detect QTLs on all wheat chromosomes. Most of these studies have used linkage mapping in biparental populations. This method is currently the most common tool for mapping causal plant genomic regions. But it can only examine the parental alleles, ignoring all other alleles found in the population from which the parents were selected. GWAS, unlike QTL, is a well-established and useful method for mapping various important morphological and agronomic traits of plants. GWAS is new modern approaches to molecular and genetic studies that are required for such a complex plant as wheat due to the size and structure of its genome [7]. Genome wide association studies (GWAS) is a field of biological research studying associations between genome variants and phenotypic traits [3,8]. Through GWAS, new genetic markers associated with grain yield and quality can be identified, and the association of previously detected loci can be confirmed. GWAS is widely applied to crop investigations in order to study genetic features related to important agricultural characteristics in plants [9]. The study results can be used for speed breeding and developing new cultivars with desirable traits. It is worthy of note that applying GWAS on plants has its limitations: it is sensitive to the presence of the large number of related samples that agricultural collections often possess. That is to detect loci using GWAS the population being studied must be as heterogeneous as possible with the sample size should be at least 100 samples. Increasing the number of samples studied in the GWAS method increases the statistical significance of the results. It is also necessary to consider the impact of the environment on trait expression and carry out sample studies in the field for three years. [10]. Also, the reliability will be influenced by the diversity of the sample based on geography and the selection of varieties from different originators. GWAS is currently widely used to study various wheat samples and identify loci associated with such economically valuable traits as yield, disease resistance, or nutrient content. [11,12,13]. Applying GWAS on samples of old local varieties and modern cultivars may contribute to a deeper understanding of genetic mechanisms underlying various aspects of plant biology and agriculture [11].
In the current study, we applied GWAS to reveal QTL for spike productivity and grain quality (as well as plant height and resistance to lodging) using a panel of spring varieties of T. aestivum L. bred in different decades of the last century in Russia and Germany.
2. Results
2.1. Phenotyping
In this study, 186 accessions were evaluated (location: Latitude: 59.71482042142053| Longitude: 30.42364618465661) over 3 years on field trials. The weather conditions of the experiment varied from year to year.
The spring of 2021 was cool, with double the normal amount of precipitation falling in May, which led to flooding of some plots. In June-July, a deficit of precipitation was observed. Most spring wheat samples were ripe by early
May 2022 was very dry, with only 4.3 mm of rainfall (normal is 46 mm). The summer of 2022 was at average temperatures in terms of temperature values, only July was a little cool. In August, almost double the norm of precipitation fell, which slightly lengthened the growing season of late wheat samples. Overall, weather conditions in 2022 were the most favorable for wheat.
The phenotypic stat (minimum, maximum, mean) of 5 traits are presented in Table 1.
The panel of spring bread wheat varieties includes genotypes based not only on their different origin and different breeding periods, but also on high variability in economically valuable traits (for example SL varies from 3.3 to 11.6, TGW - from 14.7 up to 61.7; Table 1). At the same time, the presence of approximately the same range of values for each accession for each trait over three years allows us to evaluate the contribution of the genetic component to the development of the trait.
2.2. Analysis of Genotyping Data
The studied samples of spring bred wheat were heterogeneous. Using the “Structure” program, they were divided into 6 groups or subpopulations (k=6) (Figure 1).
2.3. Association Analysis
The obtained phenotype and genotype data were used for association analysis. The results first were compared in QQ-plot. Then the Manhattan plots were designed.
2.3.1. Productivity
In addition to detecting significant markers for each year of the field study, meta analyses were conducted. For all three years of the study significant markers were identified. As a result, one locus associated with PH was revealed on chromosome 5A (585-609 Mb). This locus was observed for two years: in 2022 and 2023. Only one locus was found for TGW (chromosome 4A, 684 Mb) and SN (chromosome 7B, 648 Mb). These loci were identified by meta-analysis and have a suggestive level. In total, two loci associated with SL were identified on the chromosome 6A (410 Mb) and on chromosome 6B (470 Mb) also by meta-analysis. Five suggestive loci associated with RL were revealed on chromosomes 2A (779 Mb), 2B (448 Mb), 2D (634 Mb), 6A (613 Mb) and 7A (736 Mb).
2.3.2. Technological Evaluation
The evaluation of grain technological properties in the samples of spring soft wheat involved measuring the following indicators:
1). Protein content is one of the main indicators of the nutritional value of grain. It is considered that this parameter does not depend directly on gluten quality. In some cases, its antagonism is observed in relation to grain quality indicators associated with gluten properties.
2). Ash content also characterizes the nutritional and forage value of grain. Its increased values are regarded as an unfavourable factor that reduces nutritional value.
3). Grain unit is one of the important criteria for the technological properties of wheat grain. It has a direct impact on flour yield during grain milling. Moreover, this indicator is not directly linked to gluten or starch quality that makes it an independent trait in the genetic sense. Grain unit can be affected by grain size and its density.
4). Flour colour. This indicator was determined in whole-grain flour, therefore its intensity, aside from the colour of endosperm particles, depends on the ratio of grain hulls to endosperm. The higher its value, the more this ratio is shifted towards endosperm.
5). Sedimentation value. Sedimentation method of the evaluation of grain quality is widely used. In breeding and genetic research, the SDS-sedimentation techniques have received most recognition for the large-scale evaluation of the breeding material. Sedimentation value is considered to be a generalized criterion of grain quality that characterizes the capacity of its ground material for stable swelling, the quality of storage proteins and gluten. This approach for grain quality evaluation is highly efficient and involves low material consumption. It has been noted that sedimentation value has a high level of heritability in offspring compared to other criteria of grain quality.
All measured indicators of grain technological properties had high inter-cultivar variability while the samples had significant F-criterion differences (Table 3).
Based on the data of genotyping and evaluation of grain quality indicators GWAS was carried out for wheat samples studied in 2022 under field conditions at the scientific and production facility of VIR.
Loci associated with economically valuable traits associated with yield were detected on chromosomes 4А, 5А, 6А, 6В and 7В. Both significant and suggestive markers were identified (Table 4).
The significant locus associated with flour color was revealed on chromosome 5А (468 – 473 Mb). And one locus (suggestive level) was found on chromosome 2B (441 Mb).
Nine markers suggestive by grain natural weight indicator and five markers significant by protein content indicator were identified. Four markers for ash-content, 9 markers associated with flour color and 18 markers associated with flour sedimentation were detected. The detected markers were found on chromosomes 1А, 2А, 3A. 4A, 5А, 6А, 7А, 1B, 2B, 3B, 4B, 5В, 6В, 7В, 1D, 2D, 6D.
Thus, in the study, both loci associated with grain yield and quality, and individual markers widely covering soft wheat chromosomes were identified.
3. Discussion
In a number of studies, including those on wheat [[15[M1] –18] a comparison of varieties bred at different decades for the same cultivation area was conducted using DNA polymorphism analysis. The data obtained in these studies clearly demonstrated that at a certain period of cultivation there is a certain proportion of unique alleles that are no longer found in the next generation of varieties, bred for the same cultivation area. This genome-based data not only confirmed the need to preserve already existing ex situ collections and regularly replenish them, but also pointed to out-of-use cultivars as an important potential source of genetic diversity for breeding new varieties. Therefore, varieties bred at different decade periods and landraces, along with modern varieties, are widely included in panels used for comparative genetic studies [19,20,21]. This enables not only to find sources of valuable traits among ex situ collection samples (including sources for improving grain and flour quality among old cultivars [19,22,23]), but also to identify genome loci containing potentially valuable alleles. In turn, this makes it possible to develop technologies for accelerated marker selection and discover new target genes for editing [24,25].
Many studies of global and local genetic diversity of wheat and aimed at identifying donors have generally not taken into account landraces adapted to environmental conditions. In our work, the sample under study was formed of spring wheat varieties bred in different decades of the last century in Russia and Germany (Table 5), which allowed us to identify new markers associated with economically valuable traits.
The spike length, number of spikelets in a spike, thousand grain weight, plant height and resistance to lodging are traits that together determine the level of wheat yield. These traits correlate with each other, and by identifying a locus associated with one of these traits, we can see that it affects other traits as well. In this study, we identified a locus on chromosome 5AL associated with plant height and resistance to lodging (122.1-122.6 cM). It is located on chromosome 5A in the physical interval of 585.0–588.0 Mb, next to previously discovered [26,27,28]. Also four markers, associated with resistance to lodging were identified on chromosomes 2A, 2B, 2D, 6A, 7A. The spike length, number of spikelets in a spike traits, as shown in previous studies, are controlled by several genes, the main of which are located on chromosomes 5A, 2D and 3D [29,30], however, QTLs have been identified on almost all wheat chromosomes [31,32,33].
In our study with meta-analysis, we identified two markers associated with spike length: the marker (RAC875_c48456_444) on chromosome 6B, and a marker of suggestive level (Excalibur_rep_c92855_977) on chromosome 6A. Also, the marker of suggestive level associated with number of spikelets in a spike was revealed on the chromosome 7B (AX-94505099). As has been shown in the previous studies, many major QTLs related to thousand grain weight have been mapped to almost all wheat chromosomes [34,35,36,37,38,39,40,41,42,43,44]. We identified one marker associated with thousand grain weight (Excalibur_c4325_1150) on chromosome 4A.
A large number of studies are devoted to the search for genes associated with high protein content in grain. Thus, the NAM-B1 (Gpc-B1) gene is known, identified on wheat chromosome 1B [45]. Other candidate genes associated with grain protein content have also been identified, such as QGpc.ipk-7B [46], QGlc.ipk-5B and QGlc. ipk-7A [47]. These genes are localized on chromosomes 7B and 7A, respectively. In our study, we found new loci on chromosomes 1A, 1D, 2A and 2D. Other technological characteristics of wheat grain at the molecular level are also being studied, one of them being the color of flour. It is characteristic of wheat varieties that produce a lot of carotenoids. Discoloration of flour may be due to high activity of the enzyme lipoxygenase [48]. Lipoxygenase activity is associated with a locus on wheat chromosome 4BS, which has been well studied at the molecular level [49,50]. In addition to chromosome 4B, loci associated with this trait on chromosome 7A (QTL/7AL) were identified [51,52] and 1B (Psy-B1 and Lpx-B1) [53,54]. We discovered a locus on chromosome 5A and a marker on chromosome 2B associated with flour color.
Thus, in this study, we obtained new information and identified new loci associated with traits of wheat yield and grain quality. These studies must be continued to identify new candidate genes for their further use in obtaining new wheat varieties
4. Materials and Methods
4.1. Plant Material and Genotyping Data
The varieties panel was composed taking into account the genetic and phenotypic diversity. In total 186 accessions received in VIR from Gatersleben bread wheat collection (IPK) and are belonging to 10 bread wheat varieties (lutescens (Alef.) Mansf., ferrugineum (Alef.) Mansf., milturum (Alef.) Mansf., erythrospermum Korn., albidum Al., caesium (Alef.) Mansf., graecum (Koern.) Mansf., fulvocinereum Flaksb., subferrugineum (Vav.) Mansf. и pyrothrix (Alef.) Mansf.). The selected accessions included 51% varieties of Russian origin (from 24 regions), and 49% originating from breeding centers of Germany. Landraces, old and modern breeding varieties were among the studied wheats (Table 5). The names of the botanical varieties are given according to the classification adopted in VIR [55].
4.2. Field Experiment and Phenotyping
The experimental design at each trial was completed with three replications during 2021 – 2023 years on the fields of VIR experimental station in Pushkin, Sant-Petersburg, Russia (Latitude: 59.71482042142053| Longitude: 30.42364618465661). The study of the wheat collection was carried out in accordance with the methodological instructions of published earlier [56]. Each variety was grown of 1 m2 plot. The standard varieties were: Leningradskaya 97 and Leningradskaya 6. Chemical treatments were carried out against the Swedish fly with the drug Danadin. Sowing and harvesting were done manually. The sheaves were threshed using a Wintersteiger LD 350 thresher. During threshing, 10 typical plants were taken for each sample for ear analysis. To analyze the spike productivity traits and morphobiological characteristics of the accessions, 10 samples were randomly selected from the collected plants of each bread wheat (Triticum aestivum L.) variety.
The spring of 2023 was characterized by the following features: in March, almost three months of precipitation fell, and in May, on the contrary, there was a drought - only 7.1 mm of precipitation fell. However, the June rains had a positive effect on the further growth of wheat. In terms of temperature, July was cool, and August was at the level of long-term average values. September was warm.
4.3. DNA Isolation
DNA isolation was performed with the DNeasy Plant Mini Kit (Qiagen) under the manufacturer's protocol. The measurement of DNA concentration was carried out by the NanoPhotometr NanoDrop.
4.4. Sample Genotyping
The sample was genotyping using array 20K Wheat Illumina SNP chip containing 17267 polymorphic SNPs by TraitGenetics GmbH. (http://www.traitgenetics.com/en/). This array is an optimized and reduced 15K version [57] 385 markers from the 35K Wheat Breeders Array [58] have been added. SNPs with minor allele frequency (MAF) ≤0.05 and missing values >5% were removed from the subsequent analysis which left a set of 13375 polymorphic SNP markers.
4.5. Population Structure
Clustering of accessions was carried out using STRUCTURE v 2.3.4 software package [59].
4.6. Statistical Analysis
The statistical analysis (except GWAS) for all traits was conducted according Dospehov [60] and using STATISTICA 10.0.
4.7. Association Analysis
Association analysis was performed with the TASSEL 5 software [61] using the following formula: Y = Xa + Qb + e, where Y - is a vector for the phenotypic values, X - is a matrix of the genotypic values of the marker, a - is the vector of fixed effects of the marker, Q - is the Kinship-matrix, b - is a vector of the fixed effects of population structure, and e - is a vector of the residual effects. We used a mixed linear model (MLM) that accounts for a genetic relationship of varieties and sample structure.
To detect significant SNPs we employed Bonferroni threshold of 3.74*10-6, based on the significance level (0.05) divided by the number of effective markers (13 375). Thus, we used -log10(p-value) = 5.43 as the significance threshold for different traits in our study. We selected a robust model to account for population structure and believe it will already account for most false positives. We therefore set an estimated threshold of p < 10−4 to highlight candidates, that were small enough, but not reaching the significance level.
It is known that the techniques of combining p-values from several similar studies (meta-analysis) often help improve statistical power [62]. Therefore, we also combined the p-values of three years for each trait under the study. We used modified Fisher's method accounting for the non-independence implemented in R package “poolr”, because the results are not independent (we take the same genotypes each year) [63]. It exploits the effective rather than nominal number of tests, thus avoiding overestimation of statistical significance. The effective number of tests was calculated using Nyholt method [64].
4.8. Technological Evaluation of Grain
Grain unit was measured using micro grain unit scales in accordance with the guidelines by Vasilenko and Komarov [65]. The metal chamber of the micro grain unit scales was evenly filled with grain and compacted, then 10 mL volume was cut off using a special knife. Surplus grain was removed while grain remaining in the 10mL chamber was weighed to within 0,01. The resulting weight was multiplied by 100.The study included the following sedimentation techniques: by Bebyakin and Buntina for spring bread wheat [66].
Microsedimentation of 0,5g of whole-grain flour obtained on a cyclone mill is placed in a 10 mL measuring tube, then 4 mL of distilled water is added and shaken intensively. Then suspend on a rotator for 2 minutes. After that, 6 mL of the working solution is added (17% SDS, 3% acetic acid) and suspended again on a rotator for 5 min. Finally, sedimentation is carried out for 15 min, then sediment volume is measured and multiplied by 10 [66].
Protein content, ash content and whole-grain flour colour were identified indirectly using the Perten IM 9500 IR spectrometer according to the instructions for the device.
5. Conclusion
The results of the field study (phenotyping) of 186 spring wheat samples conducted in 2021-2023 in two-fold repetition at the research and production facility of VIR have been summarized. The samples have been evaluated by yield-related indicators, such as plant height (PL), resistance to lodging (RL), spike length (SL), grain number in a spike (SN), grain weight in a spike (SGW), 1000-grain weight (TGW). Resulting from GWAS, loci associated with important economically valuable traits have been detected. The results of the study highlight the importance of conserving the gene pool of landraces as a source of valuable genetic diversity for breeding and genetic research.
Author Contributions
Conceptualization, E.K., N.S., I.R., A.B. (Andreas Börner); writing—original draft preparation, N.S., I.R., M.S.; formal analysis, M.K., A.B. (Anna Brykova), A.A.; writing—review and editing, E.K., A.B. (Andreas Börner). All authors have read and agreed to the published version of the manuscript.
Funding
The article was made with the support of the Ministry of Science and Higher Education of the Russian Federation under agreement № 075-15-2020-911 date 16.11.2020 on providing a grant in the form of subsidies from the Federal budget of the Russian Federation. The grant was provided for state support for the creation and development of a World-class Scientific Center “Agrotechnologies for the Future”.
Conflicts of Interest
Declare conflicts of interest or state “The authors declare no conflicts of interest.”.
References
- Masalov, V.N.; Berezina, N.A.; Chervonova, I.V. The state of the grain farming in Russia, the role of grain crops in the feeding of agricultural animals and hu-man diet. Vestnik agrarnoj nauki, 2021, 89, 3–15. [Google Scholar]
- Andersson, A.A.; Andersson, R.; Piironen, V.; Lampi, A.M.; Nystrom, L. , Boros, D., Aman, P. Contents of dietary fibre components and their relation to associat-ed bioactive components in whole grain wheat samples from the HEALTHGRAIN diversity screen. Food chemistry. 2013, 136, 1243–1248. [Google Scholar] [CrossRef]
- Darrier, L.D.; Ramsay, B.; Russell, J.; Milner, S.G.; Hedley, P.E.; Shaw, P.D.; Ma-caulay, M.; Halpin, C.; Mascher, M.; Fleury, D.L.; et al. Comparison of mainstream genotyping platforms for the evaluation and use of barley genetic resources. Front. Plant Sci. 2019, 10, 1–14. [Google Scholar] [CrossRef]
- Song, Q.L.; Fickus, E.W.; Cregan, P.B. Characterization of trinucleotide SSR motifs in wheat // Theor. Appl. Genet. 2002, 104, 286–293. [Google Scholar] [CrossRef]
- Luo, M.C.; Gu, Y.Q.; Puiu, D. , Wang, H.; Twardziok, S.O.; Deal, K.R.; Huo, N.; Zhu, T.; Wang, L.; Wang, Y.; et al. Genome sequence of the progenitor of the wheat D genome Aegilops tauschii. Nature 2017, 551, 498–502. [Google Scholar] [CrossRef]
- Maccaferri, M.; Harris, N.S.; Twardziok, S.O.; Pasam, R.K.; Gundlach, H.; Span-nagl, M.; Ormanbekova, D.; Lux, T.; Prade, V.M.; Milner, S.G. Durum wheat genome highlights past domestication signatures and future improvement tar-gets. Nat Genet 2019, 51, 885–895. [Google Scholar] [CrossRef]
- Ling, H.Q.; Ma, B.; Shi, X.; Liu, H.; Dong, L.; Sun, H.; Cao, Y.; Gao, Q.; Zheng, S.; Li, Y. Genome sequence of the progenitor of wheat A subgenome Triticum urartu. Nature 2018, 557, 424–428. [Google Scholar] [CrossRef]
- Jaiswal, V.; Gahlaut, V.; Meher, P.K.; Mir, R.R.; Jaiswal, J.P.; Rao, A.R.; Balyan, H.S.; Gupta, P.K. Genome Wide Single Locus Single Trait, Multi-Locus and Mul-ti-Trait Association Mapping for Some Important Agronomic Traits in Common Wheat (T. aestivum L.). PLoS ONE 2016. [Google Scholar] [CrossRef] [PubMed]
- Wang, D.G.; Fan, J.B.; Siao, C.J.; Berno, A.; Young, P.; Sapolsky, R.; Ghandour, G.; Perkins, N.; Winchester, E.; Spencer, J.; et al. Large-scale identification, mapping, and genotyping of single-nucleotide polymorphisms in the human genome. Science. 1998, 280, 1077–1082. [Google Scholar] [CrossRef] [PubMed]
- Juliana, P.; Singh, R.P.; Singh, P.K.; Poland, J.A.; Bergstrom, G.C.; Huerta-Espino, J.; Bhavani, S.; Crossa, J.; Sorrells, M.E. Genome-wide association mapping for re-sistance to leaf rust, stripe rust and tan spot in wheat reveals potential candidate genes. Theor Appl Genet. 2018, 131, 1405–1422. [Google Scholar] [CrossRef] [PubMed]
- Guo, Z.; Chen, D.; Alqudah, A.M.; Ganal, M.W.; Schnurbusch, T. Genome-wide association analyses of 54 traits identified multiple loci for the determination of floret fertility in wheat. New Phytol. 2017, 214, 257–270. [Google Scholar] [CrossRef] [PubMed]
- Bhatta, M.; Shamanin, V. et. al. Marker-Trait Associations for Enhancing Agro-nomic Performance, Disease Resistance, and Grain Quality in Synthetic and Bread Wheat Accessions in Western Siberia. G3 Genes|Genomes|Genetics. 2019, 9, 4209–4222. [Google Scholar] [CrossRef] [PubMed]
- Klug, W.; Cummings, M.; et al. Essentials of Genetics. - Moscow: Tekhnosphere. 2021. Available online: https://www.studentlibrary.ru/book/ISBN9785948366234.html (accessed on 17 January 2024).
- Kristensen, P.S. Genome-Wide Association Studies and Comparison of Models and Cross-Validation Strategies for Genomic Prediction of Quality Traits in Ad-vanced Winter Wheat Breeding Lines. Frontiers in plant science. 2018, 9, 69. [Google Scholar] [CrossRef]
- 15 Donini, P.; Law, J.R.; Koebner, R.M.D.; Reeves, J.C.; Cooke, R.J. Temporal trends in the diversity of UK wheat. Theor Appl Genet. 2000, 100, 912–917. [Google Scholar] [CrossRef]
- Manifesto, M.M.; Schlatter, A.R.; Hopp, H.E.; Suarez, E.Y.; Dubcovsky, J. Quanti-tative evaluation of genetic diversity in wheat germplasm using molecular markers. Crop Sci. 2001, 41, 682–690. [Google Scholar] [CrossRef]
- Khlestkina, E.K.; Huang, X.; Quenun, S.Y.B.; Chebotar, S.; Röder, M.S.; Börner, A. Genetic diversity in cultivated plants – loss or stability. Theor. Appl. Genet. 2004, 108, 1466–1472. [Google Scholar] [CrossRef]
- Khlestkina, E.K.; Röder, M.S.; Efremova, T.T.; Börner, A.; Shumny, V.K. The ge-netic diversity of old and modern Siberian varieties of common spring wheat de-termined by microsatellite markers. Plant Breed. 2004, 123, 122–127. [Google Scholar] [CrossRef]
- Morozova, E.V.; Pshenichnikova, T.A.; Simonov, A.V.; Shchukina, L.V.; Chistya-kova, A.K.; Khlestkina, E.K. A comparative study of grain and flour quality pa-rameters among Russian bread wheat cultivars developed in different historical periods and their association with certain molecular markers. EWAC Newsl. 2016, 16, 49–56. [Google Scholar]
- Marone, D.; Russo, M.A.; Mores, A.; Ficco, D.B.M.; Laidò, G.; Mastrangelo, A.M.; Borrelli, G.M. Importance of Landraces in Cereal Breeding for Stress Tolerance. Plants. 2021, 10, 1267. [Google Scholar] [CrossRef]
- Adhikari, S.; Kumari, J.; Jacob, S.R.; Prasad, P.; Gangwar, O.P.; Lata, C.; Thakur, R.; Singh, A.K.; Bansal, R.; Kumar, S.; et al. Landrac-es-potential treasure for sustainable wheat improvement. Genet Resour Crop Evol. 2022, 69, 499–523. [Google Scholar] [CrossRef]
- Ermakova, M.F.; Chistyakova, A.K.; Shchukina, L.V.; Morozova, E.V.; Khlestkina, E.K.; Pshenichnikova, T.A. The diversity of Siberian bread wheat cultivars on grain quality in dependence of breeding period. EWAC Newsletter. 2008, 14, 174–176. [Google Scholar]
- Mulugeta, B.; Tesfaye, K.; Ortiz, R.; Geleta, M.; Haileselassie, T.; Hammenhag, C.; Hailu, F.; Johansson, E. Unlocking the genetic potential of Ethiopian durum wheat landraces with high protein quality: Sources to be used in future breeding for pasta production. Food and Energy Security. 2024, 13, 511. [Google Scholar] [CrossRef]
- Khlestkina, E.K.; Pshenichnikova, T.A.; Usenko, N.I.; Otmakhova, Yu.S. Promising opportunities of using molecular genetic approaches for managing wheat grain technological properties in the context of the “grain–flour–bread” chain. Russian Journal of Genetics: Applied Research. 2017, 7, 459–476. [Google Scholar] [CrossRef]
- Kuluev, B.R.; Mikhailova, E.V.; Kuluev, A.R.; Galimova, A.A.; Zaikina, E.A.; Khlestkina, E.K. Genome Editing in Species of the Tribe Triticeae with the CRISPR/Cas System. Mol Biol (Mosk). 2022, 56, 949–968. [Google Scholar] [CrossRef] [PubMed]
- Li, L.; Xu, D.; Bian, Y.; Liu, B.; Zeng, J.; Xie, L.; Liu, S.; Tian, X.; Liu, J.; Xia, X.; et al. Fine mapping and characterization of a major QTL for plant height on chromosome 5A in wheat. Theor Appl Genet 2023, 136. [Google Scholar] [CrossRef] [PubMed]
- He, X.; Lillemo, M.; Shi, J.; Wu, J.; Bjørnstad, Å.; Belova, T.; Dreisigacker, S.; Duveiller, E.; Singh, P. QTL characterization of fusarium head blight resistance in CIMMYT bread wheat line soru#1. PLoS ONE, 2016, 11, e158052. [Google Scholar]
- Xu, Q.; Xu, F.; Qin, D.; Li, M.; Fedak, G.; Cao, W.; Yang, L.; Dong, J. Molecular mapping of QTLs conferring fusarium head blight resistance in Chinese wheat cultivar Jingzhou 66. Plants 2020, 9, 1021. [Google Scholar] [CrossRef]
- Jin, J.; Liu, D.; Qi, Y.; Ma, J.; Zhen, W. Major QTL for seven yield-related traits in common wheat (Triticum aestivum L). Frontiers in Genetics. 2020, 11, 1012. [Google Scholar] [CrossRef]
- 30 Ji, G.; Xu, Z.; Fan, X. Identification of a major and stable QTL on chromo-some 5A confers spike length in wheat (Triticum aestivum L.). Mol Breeding. 2021, 41, 56. [Google Scholar] [CrossRef]
- Marza, F.; Bai, G.H.; Carver, B.F.; Zhou, W.C. Quantitative trait loci for yield and related traits in the wheat population Ning7840 x Clark. Theor Appl Genet. 2006, 112, 688–698. [Google Scholar] [CrossRef]
- Cui, F.; Li, J.; Ding, A.; Zhao, C.; Wang, L.; Wang, X.; Li, S.; Bao, Y.; Li, X.; Feng, D.; Kong, L.; et al. Conditional QTL mapping for plant height with respect to the length of the spike and internode in two mapping populations of wheat. Theor Appl Genet. 2011, 122, 1517–1536. [Google Scholar] [CrossRef] [PubMed]
- Sourdille, P.; Tixier, M.; Charmet, G. Location of genes involved in ear compactness in wheat (Triticum aestivum) by means of molecular markers. Mo-lecular Breeding 2006, 247–255. [Google Scholar] [CrossRef]
- Campbell, K.G.; Bergman, C.J.; Gualberto, D.G.; Anderson, J.A.; Giroux, M.J.; Hareland, G.; Fulcher, R.G.; Sorrells, M.E.; Finney, P.L. Quantitative Trait Loci Associated with Kernel Traits in a Soft Hard Wheat Cross. Crop Sci. 1999, 39, 1184–1195. [Google Scholar] [CrossRef]
- Huang, X.Q.; Coster, H.; Ganal, M.W.; Roder, M.S. Advanced backcross QTL analysis for the identification of quantitative trait loci alleles from wild relatives of wheat (Triticum aestivum L.). Theor. Appl. Genet. 2003, 106, 1379–1389. [Google Scholar] [CrossRef] [PubMed]
- Ramya, P.; Chaubal, A.; Kulkarni, K.; Gupta, L.; Kadoo, N.; Dhaliwal, H.S.; Chhuneja, P.; Lagu, M.; Gupt, V. QTL mapping of 1000-kernel weight, kernel length, and kernel width in bread wheat (Triticum aestivum L.). J. Appl. Genet. 2010, 51, 421–429. [Google Scholar] [CrossRef]
- Li, S.; Jia, J.; Wei, X.Y.; Zhang, X.; Li, L.; Chen, H.; Fan, Y.; Sun, H.; Zhao, X.; Lei, T.; et al. A intervarietal genetic map and QTL analysis for yield traits in wheat. Mol. Breed. 2007, 20, 167–178. [Google Scholar] [CrossRef]
- Marza, F.; Bai, G.H.; Carver, B.F.; Zhou, W.C. Quantitative trait loci for yield and related traits in the wheat population Ning7840 x Clark. Theor. Appl. Genet. 2006, 112, 688–698. [Google Scholar] [CrossRef]
- Liu, G.; Jia, L.; Lu, L.; Qin, D.; Zhang, J.; Guan, P.; Ni, Z.; Yao, Y.; Sun, Q.; Peng, H. Mapping QTLs of yield-related traits using RIL population derived from common wheat and Tibetan semi-wild wheat. Theor. Appl. Genet. 2014, 127, 2415–2432. [Google Scholar] [CrossRef]
- Roder, M.S.; Huang, X.Q.; Borner, A. Fine mapping of the region on wheat chro-mosome 7D controlling grain weight. Funct. Integr. Genom. 2008, 8, 79–86. [Google Scholar] [CrossRef]
- Sun, X.-Y.; Wu, K.; Zhao, Y.; Kong, F.-M.; Han, G.-Z.; Jiang, H.-M.; Huang, X.-J.; Li, R.-J.; Wang, H.-G.; Li, S.-S. QTL analysis of kernel shape and weight using recom-binant inbred lines in wheat. Euphytica 2009, 165, 615. [Google Scholar] [CrossRef]
- Simmonds, J.; Scott, P.; Leverington-Waite, M.; Turner, A.S.; Brinton, J.; Korzun, V.; Snape, J.; Uauy, C. Identification and independent validation of a stable yield and thousand grain weight QTL on chromosome 6A of hexaploid wheat (Triti-cum aestivum L.). BMC Plant Biol. 2014, 14, 191. [Google Scholar] [CrossRef]
- Zanke, C.D.; Ling, J.; Plieske, J.; Kollers, S.; Ebmeyer, E.; Korzun, V.; Argillier, O.; Stiewe, G.; Hinze, M.; Neumann, F.; et al. Analysis of main effect QTL for thou-sand grain weight in European winter wheat (Triticum aestivum L.) by ge-nome-wide association mapping. Front. Plant Sci. 2015, 6, 644. [Google Scholar] [CrossRef] [PubMed]
- Liu, T.; Wu, L.; Gan, X.; Chen, W.; Liu, B.; Fedak, G.; Zhang, B. Mapping quantitative trait loci for 1000-grain weight in a double haploid population of common wheat. International Journal of Molecular Sciences 2020, 21, 3960. [Google Scholar] [CrossRef]
- Asplund, L.; Bergkvist, G.; Leino, M.W.; Westerbergh, A.; Weih, M. Swedish spring wheat varieties with the rare high grain protein allele of NAM-B1 differ in leaf senescence and grain mineral content. PLoS ONE 2013, 8. [Google Scholar] [CrossRef] [PubMed]
- Khlestkina, E.K.; Giura, A.; Röder, M.S.; Börner, A. A new gene controlling the flowering response to photoperiod in wheat. Euphytica 2009, 165, 579–585. [Google Scholar] [CrossRef]
- Pshenichnikova, T.A.; Ermakova, M.F.; Chistyakova, A.K.; Shchukina, L.V.; Bere-zovskaya, E.V.; Lochwasser, U.; Roeder, M.; Berner, A. Mapping of quantitative trait loci (QTL) associated with quality indicators of soft wheat grain grown un-der various environmental conditions. Genetics 2008, 44, 74–84. [Google Scholar]
- Borrelli, G.M.; Troccoli, A.; Di Fonzo, N.; Fares, C. Durum wheat lipoxygenase ac-tivity and other quality parameters that affect pasta color. Cereal Chemistry 1999, 76, 335–340. [Google Scholar] [CrossRef]
- Hessler, T.G.; Thomson, M.J.; Benscher, D.; Nachit, M.M.; Sorrells, M.E. Associa-tion of a lipoxygenase locus, Lpx-B1, with variation in lipoxygenase activity in durum wheat seeds. Crop Science 2002, 42, 1695–1700. [Google Scholar] [CrossRef]
- Zhang, F.; Chen, F.; Wu, P.; Zhang, N.; Cui, D. Molecular characterization of lipoxygenase genes on chromosome 4BS in Chinese bread wheat (Triticum aes-tivum L.). Theor. Appl. Genet 2015, 128, 1467–1479. [Google Scholar] [CrossRef]
- Parker, G.D.; Chalmers, K.J.; Rathjen, A.J.; Langridge, P. Mapping loci associated with flour colour in wheat (Triticum aestivum L.). Theor. Appl. Genet 1998, 97, 238–245. [Google Scholar] [CrossRef]
- Parker, G.D.; Langridge, P. Development of a STS marker linked to a major locus controlling flour colour in wheat (Triticum aestivum L.). Mol. Breeding 2000, 6, 169–174. [Google Scholar] [CrossRef]
- He, X.Y.; He, Z.H.; Ma, W.; Appels, R.; Xia, X.C. Allelic variants of phytoene syn-thase 1 (Psy1) genes in Chinese and CIMMYT wheat cultivars and development of functional markers for flour colour. Mol. Breeding 2009, 23, 553–563. [Google Scholar] [CrossRef]
- Carrera, A.; Echenique, V.; Zhang, W.; Helguera, M.; Manthey, F.; Schrager, A.; Picca, A.; Cervigni, G.; Dubcovsky, J. A deletion at the LpxB1 locus is associated with low lipoxygenase activity and improved pasta color in durum wheat (Triti-cum turgidum ssp. durum). J. Cereal Science 2007, 45, 67–77. [Google Scholar] [CrossRef]
- Dorofeev, V.F.; Filatenko, A.A.; Migushova, E.F.; Udachin, R.A.; Jacubziner, M.M. Cultural Flora of USSR. Wheat; Kolos: Leningrad, Russia, 1979; pp. 1–348. [Google Scholar]
- Merezhko, A.F.; Udachin, R.A.; Zuev, E.V.; Filatenko, A.A.; Serbin, A.A.; Lyapun-ova, O.A.; Kosov, V.Yu.; Kurkiev, U.K.; Okhotnikova, T.V.; Navruzbekov, N.A.; et al. Replenishment, preservation and study of the world's collection of wheat, aegilops and triticale. (Methodological instructions). St. Petersburg, VIR 1999, 81. [Google Scholar]
- Soleimani, B.; Lehnert, H.; Keilwagen, J.; Plieske, J.; Ordon, F.; Naseri Rad, S.; Perovic, D. Comparison between core set selection methods using different Illu-mina marker platforms: A case study of assessment of diversity in wheat. Frontiers in Plant Science. 2020, 11, 1040. [Google Scholar] [CrossRef]
- Allen, A.M.; Winfield, M.O.; Burridge, A.J.; Downie, R.; Benbow, H.R.; Barker, G.L.A.; Wilkinson, P.A. (2016) Characterisation of a wheat breeders’ array suitable for high throughput SNP genotyping of global accessions of hexaploid bread wheat (Triticum aestivum). Plant Biotechnol. Plant Biotechnol. J. 2016, 390–401. [Google Scholar] [CrossRef]
- Pritchard, J.K.; Stephens, M.; Donnelly, P. Inference of population structure using multilocus genotype data. Genetics 2000, 155, 945–959. [Google Scholar] [CrossRef] [PubMed]
- Dospehov, B.A. Methodology of field experience (with the basics of statistical processing of research results). M.: Book on Demand. 2012. [Google Scholar]
- Bradbury, P.J.; Zhang, Z.; Kroon, D.E.; Casstevens, T.M.; Ramdoss, Y.; Buckler, E. ST ASSEL: Software for association maping of complex traits in diverse sam-ples. BIOINFORMATICS. 2007, Т. 23, №19, 2633–2635. [CrossRef]
- Jackson, D.; Turner, R. Power analysis for random-effects meta-analysis. Research synthesis methods 2017, 8, 290–302. [Google Scholar] [CrossRef]
- Cinar, O.; Viechtbauer, W. The poolr Package for Combining Independent and Dependent p Values. J. Stat. Softw. 2022, 101, 1–42. [Google Scholar] [CrossRef]
- Nyholt, D.R. A simple correction for multiple testing for single-nucleotide poly-morphisms in linkage disequilibrium with each other. The American Journal of Human Genetics 2004, 74, 765–769. [Google Scholar] [CrossRef] [PubMed]
- Vasilenko, I.I.; Komarov, V.I. Grain quality assessment: Reference book. M.: Ag-ropromizdat. 1987, 208. [Google Scholar]
- Bebyakin, V.M.; Buntina, M.V. Efficiency of grain assessment of spring soft wheat using the SDS test. Vestnik Agricultural Sciences. Sci. 1991, No. 1, 66-70.N.; Berezina, N. A.; Chervonova, I. V. The state of the grain farming in Russia, the role of grain crops in the feeding of agricultural animals and human diet. Vestnik agrarnoj nauki 2021, 89, 3–15. [Google Scholar]
Figure 1.
Subgrouping of wheat accessions based on 27,319 SNP markers. Delta K value (k = 6).
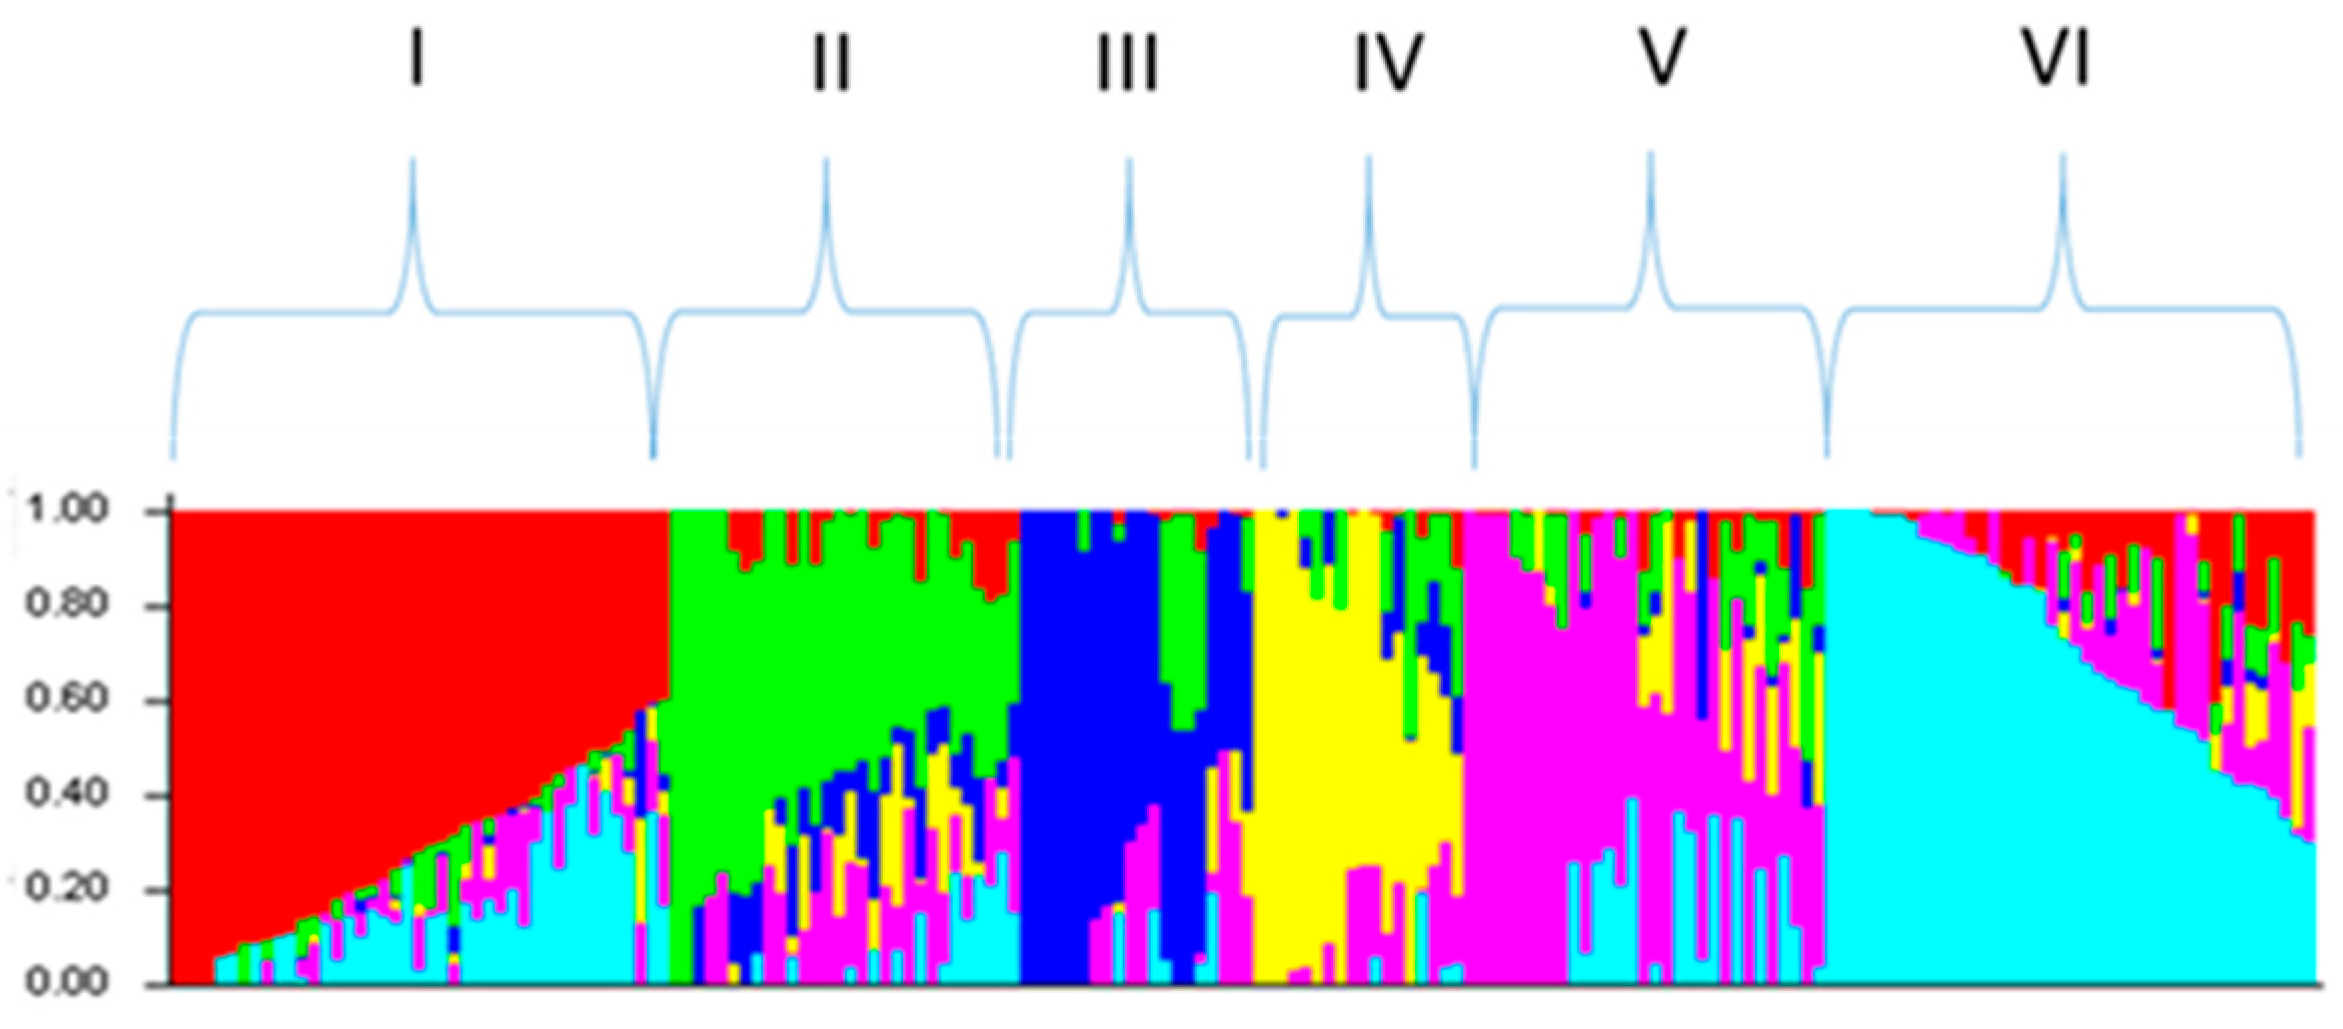
Figure 2.
Manhatten plots and QQ-plots of 5 argonomic traits: (a) PH; (b) RL; (c) SL; (d) TGW; (e) SN.
Figure 2.
Manhatten plots and QQ-plots of 5 argonomic traits: (a) PH; (b) RL; (c) SL; (d) TGW; (e) SN.
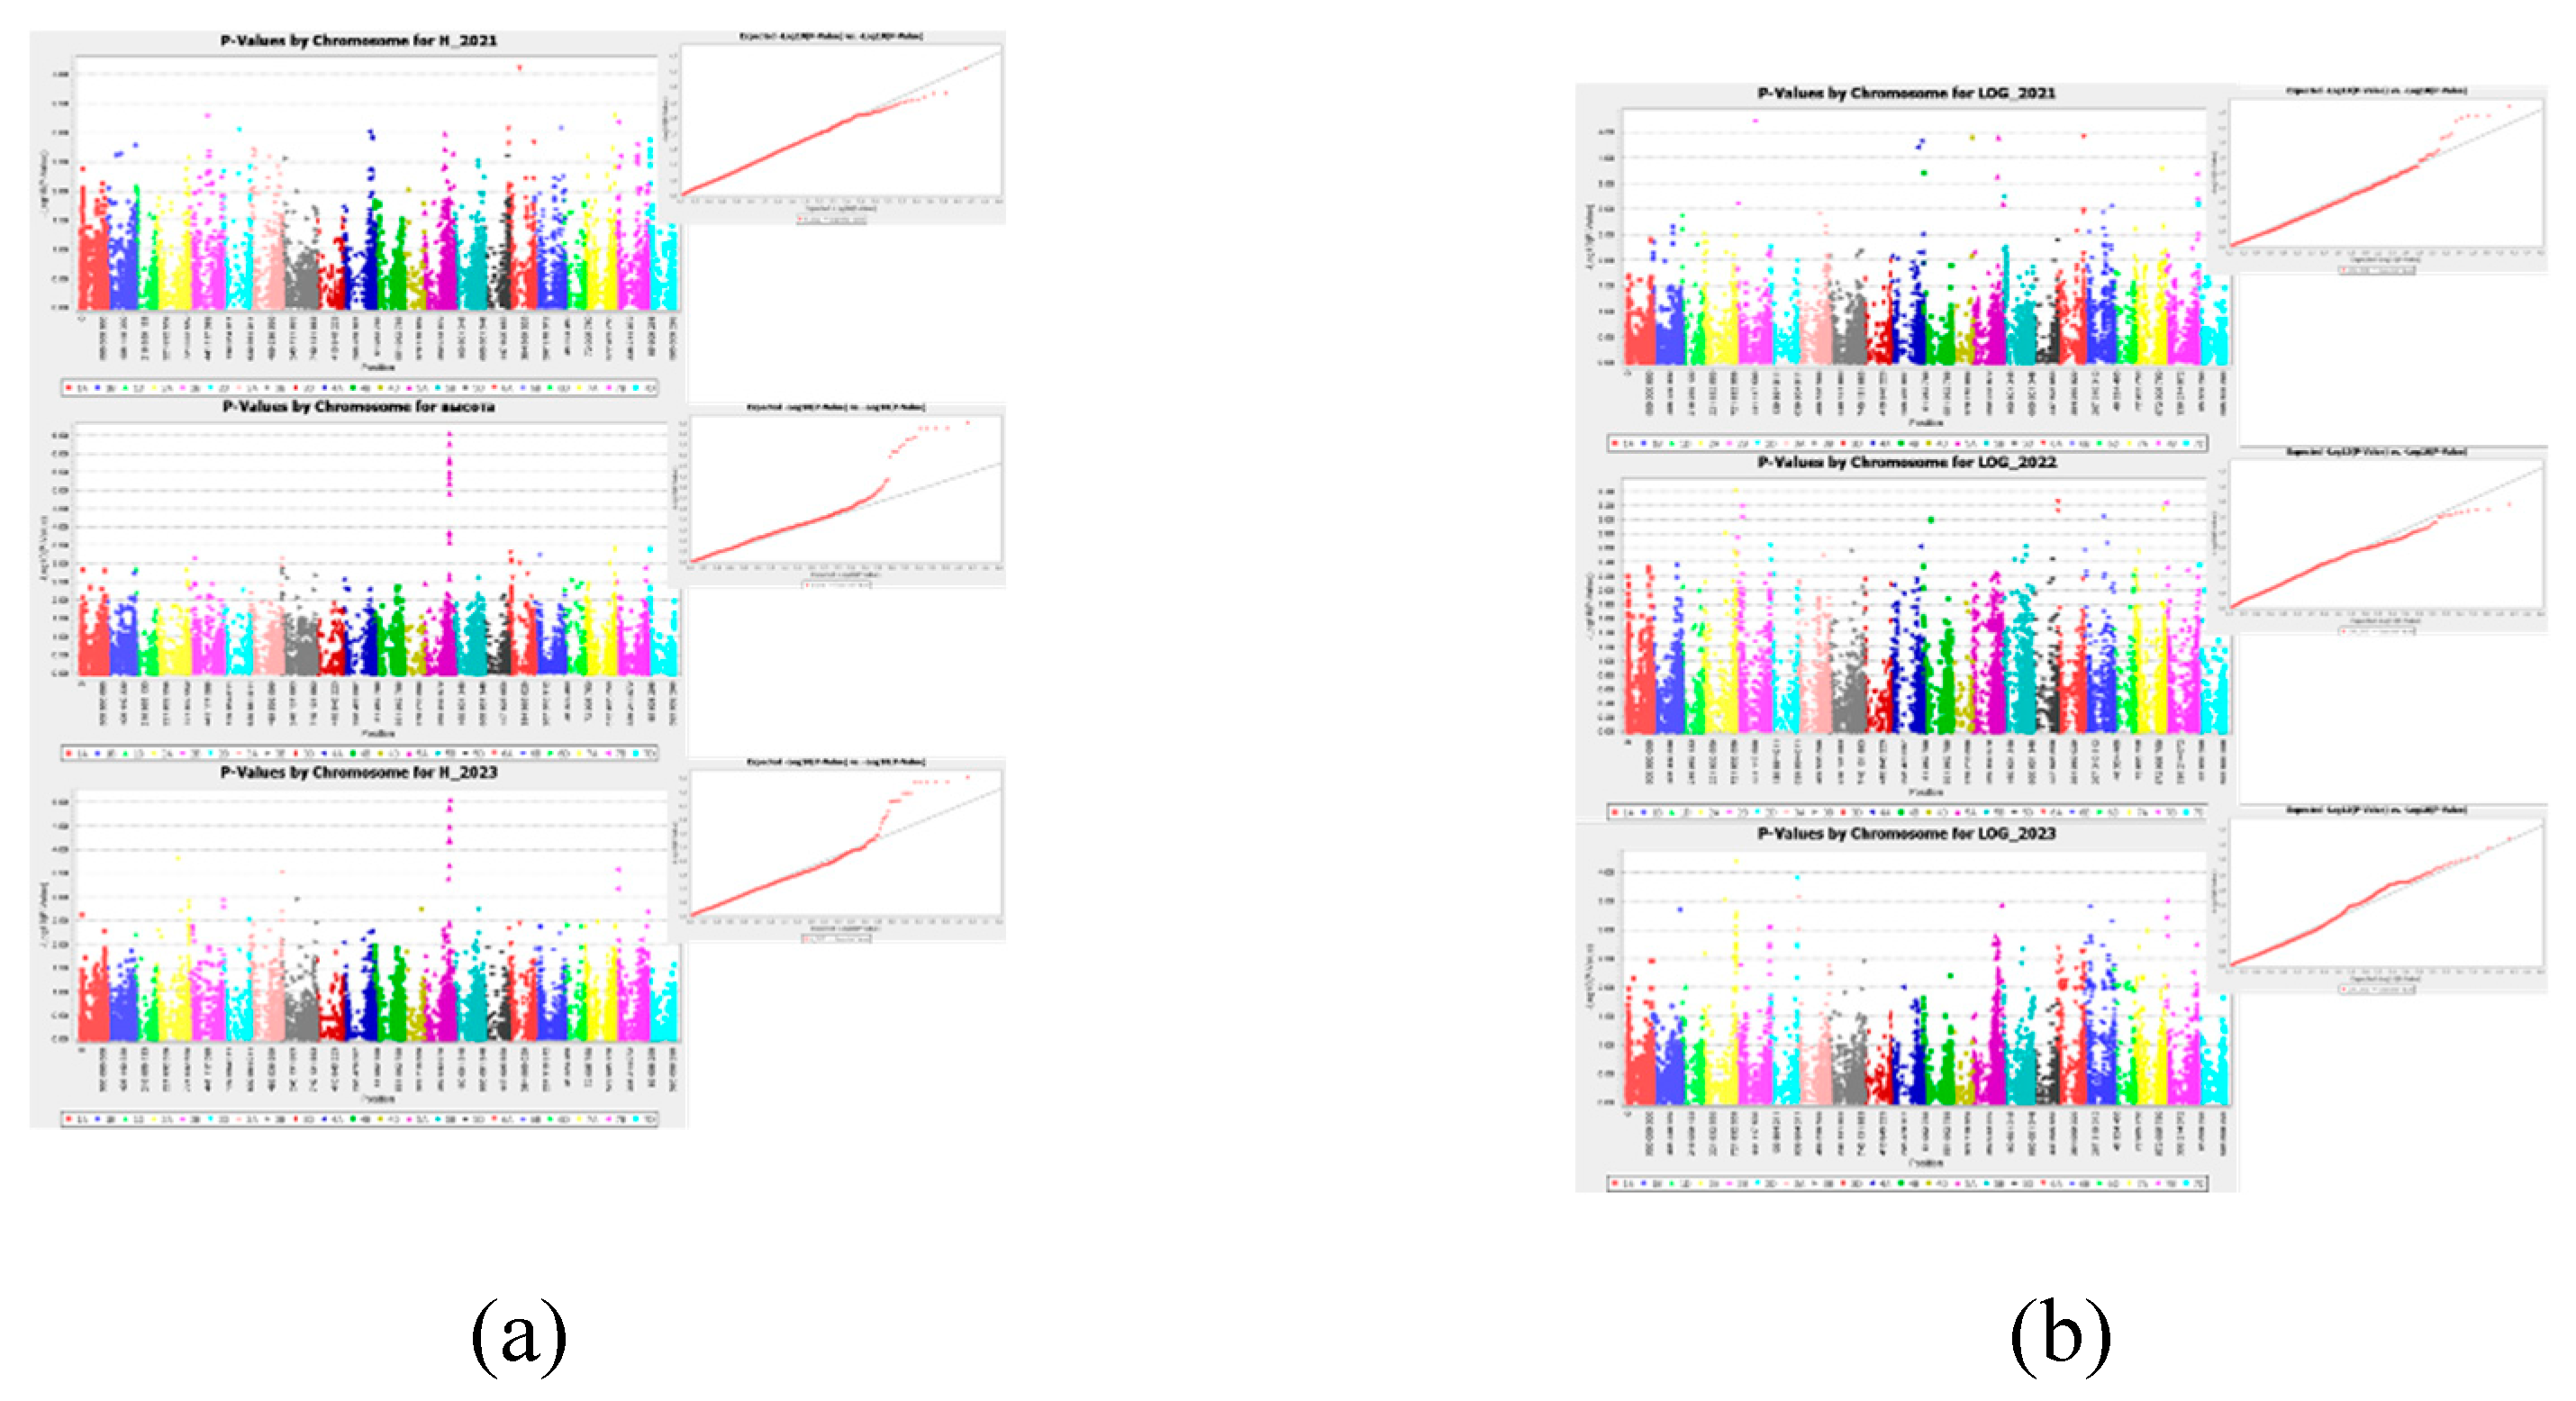

Table 1.
Descriptive statistics of studied phenotypic traits.
| Trait1 | Mean in during three years | Max | Min | ||||||
|---|---|---|---|---|---|---|---|---|---|
| 2021 | 2022 | 2023 | 2021 | 2022 | 2023 | 2021 | 2022 | 2023 | |
| Resistance to lodging (RL) |
8,0±1,6 | 7±2,3 | 7,9±1,4 | 9 | 9 | 9 | 1 | 3 | 3 |
| Spike length (SL) |
8,4±1,0 | 8,3±1,2 | 7,1±1,0 | 11,6 | 11,2 | 9,5 | 4,7 | 4,1 | 3,3 |
| Рlant height (PH) |
92±11 | 103±14,7 | 86,1±14,9 | 110 | 140 | 125 | 60 | 73 | 52,5 |
| Thousand grain weight (TGW) |
33,1±5,6 | 45,9±6,8 | 31,4±7,2 | 46,6 | 61,7 | 49,4 | 20 | 23,1 | 14,7 |
| Number of spikelets in a spike (SN) |
14,7±1,5 | 15±2,0 | 13,3±2,1 | 19,2 | 22 | 20,2 | 11 | 9 | 8 |
Table 2.
Summary of association mapping results for agronomic traits.
| Trait | Marker | Chr | Position | p-value |
|---|---|---|---|---|
| PH | RAC875_rep_c113313_607meta | 5A | 585240573 | 2,74E-06 |
| wsnp_Ex_c31799_405454782022,meta | 5A | 585403218 | 5,3E-07 | |
| wsnp_Ex_c31799_40545376meta | 5A | 585403320 | 1,08E-06 | |
| Excalibur_c7729_144meta | 5A | 585412831 | 1,05E-07 | |
| tplb0038h19_13942022,meta | 5A | 585431093 | 1,05E-06 | |
| RAC875_c9984_1003meta | 5A | 585458474 | 8,87E-07 | |
| wsnp_Ex_rep_c66689_650109882022,meta | 5A | 585609287 | 9.26E-08 | |
| BS00022071_512022,meta | 5A | 586604587 | 9.46E-08 | |
| TG0052meta | 5A | 587412057 | 1,08E-06 | |
| TG0053meta | 5A | 587412186 | 1.25E-06 | |
| TG00192022,meta | 5A | 587423597 | 9.74E-07 | |
| TG00412022,meta | 5A | 588550278 | 5,97E-08 | |
| wsnp_BF293620A_Ta_2_12022,meta | 5A | 588555309 | 1,04E-07 | |
| TA001896-0654meta* | 5A | 588848205 | 3,49E-06 | |
| AX-949207112023* | 5A | 609276661 | 9.01E-06 | |
| RL | wsnp_CAP11_rep_c4105_19409852021* | 2B | 448080584 | 1.91E-05 |
| tplb0050d17_14012021* | 6A | 613770166 | 3.87E-05 | |
| Tdurum_contig45618_10892023* | 7A | 736690246 | 9.18E-06 | |
| BS00024643_512023* | 2A | 779207402 | 4.98E-05 | |
| Excalibur_c16329_493meta* | 2D | 634296660 | 8.07E-05 | |
| SL | RAC875_c48456_444meta | 6B | 470800981 | 1,21E-06 |
| Excalibur_rep_c92855_977meta* | 6A | 410914096 | 3,8E-06 | |
| TGW | Excalibur_c4325_1150meta* | 4A | 684616475 | 2,38E-05 |
| SN | AX-94505099meta* | 7B | 648926257 | 6,31E-06 |
column p-value indicates the smallest value obtained; *suggestive (values are low enough, but not exceeding the threshold) physical positions were determined from data source International Wheat Genome Sequencing Consortium (https://www.ebi.ac.uk/ena/browser/view/GCA_900519105.1).
Table 3.
Spring bread wheat accessions structure by technological properties .
| Structural indicators | Indicators | ||||
|---|---|---|---|---|---|
| Protein, % | Ash content, % | Flour colour, % | Grain unit, g/L | Sedimentation value, mL | |
| Limits of variation | 11,5-20,7 | 1,53-2,80 | 74,8-84,1 | 622-832 | 16-82 |
| Experiment mean value | 14,79 | 1,99 | 81,27 | 760,27 | 61,49 |
| F-criterion (intervarietal) | 3,51* | 3,19* | 1,76* | 2,75* | 3,62* |
| НСР | 2,22 | 0,27 | 3,83 | 45,28 | 13,44 |
* - F-criterion significance.
Table 4.
Association mapping results for grain quality.
| Trait | Marker | Chr | Position | p-value |
|---|---|---|---|---|
| Hectolitre weight | Excalibur_c82557_201* | 1A | 9123021 | 7.20E-05 |
| BS00009789_51* | 5A | 451478823 | 2.85E-05 | |
| BobWhite_c8202_245* | 5A | 445191670 | 9.29E-05 | |
| IAAV8870* | 5B | 473114741 | 1.64E-05 | |
| AX-94541836* | 5B | 572140495 | 6.59E-05 | |
| BobWhite_rep_c48956_706* | 6A | 149925808 | 8.25E-05 | |
| IAAV8065* | 6B | 411097830 | 8.22E-05 | |
| RAC875_c17185_90* | 7A | 20164436 | 6.49E-05 | |
| Kukri_c49828_316* | 7B | 702501105 | 6.77E-05 | |
| Protein content | IAAV5730 | 1A | 344480854 | 5.00E-06 |
| TA004690-1102 | 1D | 435801686 | 3.33E-06 | |
| AX-94602991 | 2A | 776022491 | 3.28E-06 | |
| IACX8602 | 2A | 776040004 | 3.33E-06 | |
| JD_c63957_1176* | 2D | 20769330 | 2.20E-05 | |
| Аsh content | AX-94726440* | 3A | 197860384 | 6.66E-06 |
| BS00065543_51* | 5B | 17575036 | 7.19E-06 | |
| AX-94519170* | 6D | 464735570 | 4.00E-06 | |
| RAC875_c17185_90* | 7A | 20164436 | 1.25E-05 | |
| Flour color | Kukri_c57491_156* | 2B | 440825097 | 4.34E-06 |
| wsnp_Ex_c19647_28632894 | 5A | 470033197 | 1.87E-06 | |
| wsnp_JD_c6160_7327405 | 5A | 472344585 | 1.87E-06 | |
| RFL_Contig2187_1025 | 5A | 472346644 | 1.87E-06 | |
| IACX12578 | 5A | 467379740 | 2.71E-06 | |
| BobWhite_c46338_76 | 5A | 468462719 | 2.71E-06 | |
| Kukri_c17430_972 | 5A | 468467336 | 2.71E-06 | |
| AX-94436930* | 5A | 473312305 | 5.69E-06 | |
| RAC875_c79944_269* | 5A | 468463193 | 7.50E-06 | |
| Flour sedimentation | Kukri_c9898_1766 | 0 | 0 | 2.91E-08 |
| AX-94881376 | 1A | 30136011 | 3.78E-08 | |
| wsnp_BF474340A_Ta_2_1 | 1A | 556942097 | 4.63E-08 | |
| IAAV5776 | 1B | 675560975 | 3.13E-06 | |
| AX-94414376* | 1B | 552777509 | 6.20E-06 | |
| AX-95213897* | 2A | 510805288 | 9.11E-06 | |
| Kukri_c63797_354 | 3B | 761853919 | 1.89E-08 | |
| AX-94467468* | 4A | 599326520 | 9.08E-06 | |
| Tdurum_contig8028_870* | 4B | 586069506 | 5.78E-06 | |
| wsnp_Ku_c23772_33711538 | 5A | 476603824 | 4.11E-08 | |
| RAC875_rep_c109969_119 | 5A | 593332300 | 3.40E-07 | |
| RAC875_c2105_740 | 5B | 555011247 | 3.68E-08 | |
| Kukri_c13224_551 | 5B | 87230041 | 3.95E-08 | |
| AX-94878420 | 5B | 449201643 | 4.28E-08 |
* suggestive (values are low enough, but not exceeding the threshold) physical positions were determined from data source International Wheat Genome Sequencing Consortium (https://www.ebi.ac.uk/ena/browser/view/GCA_900519105.1).
Table 5.
Status of the studied wheat accessions.
| Accessions status | Number of wheat accessions | |
|---|---|---|
| from Russia | from Germany | |
| Lamdraces | 19 | 10 |
| Breeding varieties before 1950 | 19 | 51 |
| Breeding varieties 1951-1991 | 42 | 30 |
| Modern breeding varieties | 14 | 1 |
| Total | 94 | 92 |
The weather conditions of the experiment varied from year to year.
Disclaimer/Publisher’s Note: The statements, opinions and data contained in all publications are solely those of the individual author(s) and contributor(s) and not of MDPI and/or the editor(s). MDPI and/or the editor(s) disclaim responsibility for any injury to people or property resulting from any ideas, methods, instructions or products referred to in the content. |
© 2024 by the authors. Licensee MDPI, Basel, Switzerland. This article is an open access article distributed under the terms and conditions of the Creative Commons Attribution (CC BY) license (http://creativecommons.org/licenses/by/4.0/).
Copyright: This open access article is published under a Creative Commons CC BY 4.0 license, which permit the free download, distribution, and reuse, provided that the author and preprint are cited in any reuse.


