
Submitted:
29 February 2024
Posted:
29 February 2024
You are already at the latest version
Abstract
Because data on the fungal gut community structure of African children are scarce, we aimed to describe by reanalysing rRNA ITS1 and ITS2metabarcoding data from a study designed to assess the influence of microbiota in malaria susceptibility in Malian children from the Dogon country. More specifically, we aimed to establish the core gut mycobiome and compare the gut fungal community structure of breastfed children, aged 0-2 years, with other age groups.
Briefly, DNA was extracted from 296 children’s stool samples. Both rRNA ITS1 and ITS2 genomic barcodes were amplified and subjected to Illumina MiSeq sequencing.
The ITS2 barcode generated 1,975,320 reads and 532 operational taxonomic units (OTUs), while the ITS1 barcode generated 647,816 reads and 532 OTUs. The alpha diversity was significantly higher by using the ITS1 compared to the ITS2 barcode (p
Keywords:
Fungal gut community structure
; gut mycobiome
; core mycobiome
; ITS metabarcoding
; children
; Dogon country
Introduction
The human digestive tract is a complex polymicrobial ecosystem composed by several microorganisms such as fungi, bacteria and viruses, which colonize the host throughout life. In recent years, with the new sequencing technologies, the impact of fungi in health and disease show a great interest in research. Characterization of the gut mycobiome has become a major issue as fungal dysbiosis has been shown to be associated with certain diseases including colorectal cancer and inflammatory bowel disease (Gao et al. 2017; Coker et al. 2018; Sokol et al. 2017). Most studies of the healthy gut mycobiome have been performed on adult subjects living in industrialized countries. In this population, the mycobiome profile seems to be characterized by a dominance of the genera Saccharomyces, Malassezia and Candida (Hallen-Adams et al. 2015; Nash et al. 2017). However, data on the gut mycobiome in healthy children are scarce. The few existing studies have been conducted in children from industrialized countries in Europe and America. In this population, the mycobiome profile has been characterized by a dominance of the genera Penicillium, Aspergillus, Candida and Saccharomyces (Arrieta et al. 2018; Strati et al. 2016). In non-industrialized countries, particularly in Africa, little is known regarding the gut mycobiome profile of children. Recently, Candida, Malassezia, and Aspergillus were found to be dominant in the children's gastrointestinal tract 0-5 years-old children of a rural community in Ghana (Amenyogbe et al. 2021). Whether this is common to all African children remains unknown. Since microbial gut dysbiosis in early life has been shown to impact children’s development (Arrieta et al. 2018), studying the gut mycobiome might help to characterize specific profiles associated with certain diseases. To address this knowledge gap, the present study aimed to describe the fungal gut community structure of African children by reanalysing ITS metabarcoding data from a study on the influence of microbiota in malaria susceptibility in Malian children (Kodio et al. 2021). The objectives of this study were: 1) to determine the core gut mycobiome of Malian children, 2) to examine the effect of age by comparing breastfed children aged 0-2 years with other age groups by analysing ITS1 and ITS2.
Patients and Methods
Study Participants and Stool Collection
A total of 300 healthy children were included at the Bandiagara Malaria Project (BMP) clinical research centre in Bandiagara, Mali, as previously defined (Kodio et al. 2019). Stool samples from 296 children were collected in sterile containers and then aliquoted into Eppendorf tubes for storage at -20° C before shipping to Marseille, France, for analysis.
Stool DNA Extraction and ITS Metabarcoding
DNA was extracted using the semi-automatic extraction protocol of EZ1 Advanced XL (QIAGEN Instruments Hombrechtikon, Switzerland) with the EZ1 DNA tissue kit (Qiagen GmbH, Hilden, Germany) as described herein (Kodio et al. 2019). The rRNA ITS1 and ITS2 genomic regions were amplified separately with two hybridization temperatures of 52°C and 55°C for each DNA template. All the amplification procedures and the steps of the Illumina MiSeq sequencing until the production of the reads have been previously described (Kodio et al. 2021).
Statistical Analysis
We used R software to computer the alpha and beta diversity. Alpha diversity was estimated by the observed richness and Shannon diversity. Boxplots were made using the ggplot2 R package. To test whether there are differences in diversity between the amplified ITS regions, we used analysis of variance ANOVA to compare ITS1 and ITS2 using the rstatix R package. To test for differences in diversity between ages, ANOVA was also applied between age groups. A p-value under 0.05 was considered statistically significant.
Ethics and Consent of Participants
The study was approved by the Ethics Committee of the Faculty of Medicine of Mali (No 2017/133/CE/FMPOS). Written informed consent was obtained from each child and at least one parent or legal responsible.
Results
Demographic Characteristics of the Children
Of the 296 children studied (average age, 7.5 ± 3.9), there were 143 males and 153 females. We classified the children into 3 age groups of 0-2 years (mean age 1.2 ± 0.7, n=37), 3-8 years (mean age 5.5 ± 1.7, n=130) and 9-15 years (mean age 11.4 ± 1.7, n=129) to determine their gut mycobiome.
ITS Metabarcoding and Fungal Diversity
ITS sequencing produced a total of 2,623,136 reads, representing 1011 single operational taxonomic units (OTUs) for the two amplified regions. ITS2 generated 1,975,320 reads and 532 OTUs while ITS1 generated 647,816 reads and 532 OTUs. For further analysis, we grouped together OTUs that designated the same species. We used the observed species richness and Shannon diversity to measure alpha diversity. When comparing the amplified ITS regions, alpha diversity was significantly higher in ITS1 compared to ITS2 (p<0.05; Figure 1 A). However, there was no difference in alpha diversity between the 3 age groups regardless of the amplified ITS region (p>0.05, Figure 1B and 1C).
Relative Abundance and Prevalence
We analysed the dominant phyla and the most prevalent and abundant genera of the gut mycobiome of the children. Ascomycota and Basidiomycota were the most abundant phyla with 71.6% and 26.4% in ITS1, and 93.5% and 6.4% in ITS2, respectively (Figure 2A and 2B). At the genus level, 4 genera were most abundant in ITS1 including Pichia, Aspergillus, Candida and Saccharomyces while in ITS2, Saccharomyces, Aspergillus, Malassezia, Candida and Pichia were most abundant (Figure 2C and 2D). By analysing the genera present in at least 50% of all children, Pichia (90.9%), Aspergillus (88.5%), Candida (81.1%) and Saccharomyces (76%) were the most prevalent in ITS1 while Saccharomyces (99.6%), Malassezia (80.4%), Candida (76.3%) and Pichia (75.7%) and Aspergillus (59%) were the most prevalent in ITS2 (Table 1). The prevalence of the genera among the 3 groups of children was quite homogeneous in ITS1 and ITS2 (Figure 3A and 3B). At species level, Pichia kudriavzevii (90.9%), Aspergillus section Aspergillus (66.9%), Candida tropicalis (55.7%), Candida albicans (53.4%) and Saccharomyces cerevisiae (50.7%) were the most prevalent in ITS1 while Saccharomyces kudriavzevii (99.3%), Saccharomyces cerevisiae (91.2%), Malassezia restricta (78.7%), Pichia kudriavzevii (75.3%) and Candida albicans (64.5%) were the most prevalent in ITS2 (Table 2). The prevalence of species among the 3 groups of children was also quite homogeneous in ITS1 and ITS2, showing that there is no difference (Figure 3C and 3D).
Discussion
Fungi in the human gut may result from passage or colonization through the digestive tract from the first days of life. Here, we studied gut mycobiome structure in Malian children. We found no significant difference in alpha diversity between breastfed children aged 0-2 years with those aged 3-8 years and 9-15 years. These results in line with those of studies comparing healthy Italian children aged 0-2 years, 3-10 years and 11-17 years (Strati et al. 2016), and 0-5 years-old children from a rural community in Ghana (Amenyogbe et al. 2021). This suggests a relatively stable fungal diversity from birth to adolescence. Regarding the fungal genera structure, we found that Pichia, Candida, Saccharomyces, Aspergillus and Malassezia were the most abundant in of children’s gut mycobiome, with slight variations among the three age groups. These finding are in line with those of children from a rural community in Ghana where Candida, Malassezia and Aspergillus were found to be the most dominant (Amenyogbe et al. 2021). In contrast, Penicillium, Aspergillus and Candida were found to be most abundant in healthy Italian children of the same age group (Strati et al. 2016). One explanation of the high abundance of Malassezia, Candida, Aspergillus, Saccharomyces, and Penicillium in the digestive tract of children is that these genera have been found in the human breast milk mycobiome (Boix-Amorós et al. 2017, 2019).
At the species level, we found that Pichia kudriavzevii, Aspergillus sect. Aspergillus, C. tropicalis, C. albicans, S. cerevisiae, S. kudriavzevii and M. restricta were the most prevalent. In rural Ecuadorian children from 3 months of age, a fungal dysbiosis, characterized by a high abundance of P. kudriavzevii, was associated with childhood atopic wheeze to 5 years of age (Arrieta et al. 2018). The high prevalence of P. kudriavzevii observed in our studies therefore deserves further investigations. By analysing the gut mycobiome shared by the children, we found 103 and 69 species by using ITS1 or ITS2 barcoding, respectively. However, 31 species were found and amplified by both ITS1 and ITS2. Among them, S. cerevisiae, C. albicans, P. kudriavzevii, M. restricta, C. tropicalis and A. sect Aspergillus were detected in at least 50% of all children, suggesting that they constitute the core gut mycobiome of Malian children. S. cerevisiae, C. albicans, and M. restricta were shown to belong to the core gut mycobiome in healthy adults (Nash et al. 2017). These data suggest that there is a stable colonization of the human gut with some fungal species since birth.
Our analysis of the Malian children’s gut mycobiome structure showed that the alpha diversity was significantly higher by amplifying the ITS1 region compared to the ITS2; but we found no significant difference between breastfed children aged 0-2 years compared to other age groups.
Fungal metagenomics studies show heterogeneity in the choice of the amplified barcode. Some studies used the ITS1 (Frykman et al. 2015; Strati et al. 2016), while many have preferred using the ITS2 (Ward et al. 2018; Amenyogbe et al. 2021; Nash et al. 2017; Liguori et al. 2016; Jayasudha et al. 2019) as barcode for fungal identification. Whereas the barcode is a key determinant of the results, it is rarely discussed in the studies final results. Using both ITS1 and ITS2 in two studies of the gut mycobiome, we have previously found that there are biases in amplification in both regions (Hamad et al. 2017, 2018). The relatively higher alpha diversity that we observed by using the ITS1 barcode compared to the ITS2 barcode in this study is in agree with others who compared the performance of the ITS1 and ITS2 barcodes in an environmental study (Mbareche et al. 2020). Moreover, we found disparities in abundance and prevalence at the phyla, genus and species level when comparing the ITS1 or ITS2 barcodes results. For a given species, both abundance and prevalence varied by using the ITS1 or the ITS2 barcode. For example, P. kudriavzevii abundance and prevalence were 21.8% and 90.9%, by using the ITS1, compared to 10.5% and 75.3% by using the ITS2 barcode. The most striking results were the amplification of some species by only ITS1 or ITS2 with a particularly high prevalence, which clearly shows the amplification bias in fungal metagenomic studies. Similar disparities in ITS1 and ITS2 have also been highlighted by others (Hamad et al. 2017; Mbareche et al. 2020).
The main strength of our study were the relatively large children sample size and the analysis of the mycobiome using both ITS1 and ITS2 barcodes. The limitations of our study include the lack of follow-up over time, which could assess the stability of the digestive mycobiome, and the lack of information on the children’s diet, which might explain the abundance of certain fungal species in the children’s gut mycobiome.
In conclusion, the core gut mycobiome of Malian children includes fungal species of the genera Candida, Saccharomyces, Pichia, Aspergillus, and Malassezia. We found no evidence of an effect of age on the core gut mycobiome structure. Further studies in different African countries are needed to reach a global view on the core gut mycobiome of African children. They should also aim to compare the digestive mycobiome of breastfed African children with their mothers’ breast milk mycobiome.
Author Contributions
Conceptualization, Stéphane Ranque; Data curation, Abdourahim Abdillah; Formal analysis, Abdourahim Abdillah; Investigation, Kodio Aly; Methodology, Kodio Aly and Stéphane Ranque; Supervision, Stéphane Ranque; Writing – original draft, Abdourahim Abdillah and Kodio Aly; Writing – review & editing, Stéphane Ranque. All authors have read and agreed to the published version of the manuscript.
Funding
This study was supported by the IHU Méditerranée Infection.
Data Availability
Metabarcoding data are available at DOI: 10.13140/RG.2.2.36194.71366.
Competing Interests
The authors have no relevant financial or non-financial interests to disclose.
Ethics Approval
This study was performed in line with the principles of the Declaration of Helsinki. Approval was granted by the Ethics Committee of the Faculty of Medicine of Mali (No 2017/133/CE/FMPOS).
Consent to Participate
Freely-given, informed consent to participate was obtained from the parent or legal guardian of the participating children. Written informed consent was obtained from each child and at least one parent or legal guardian.
References
- Amenyogbe, Nelly Aku, Dennis Adu-Gyasi, Yeetey Enuameh, Kwaku Poku Asante, Dennis Gyasi Konadu, Kaali Seyram, David Dosoo, et al. 2021. “Bacterial and Fungal Gut Community Dynamics Over the First Five Years of Life in Predominantly Rural Communities in Ghana.” Front Microbiol 12 (July): 1–12. [CrossRef]
- Arrieta, Marie-Claire, Andrea Areevalo, Leah Stiemsma, Pedro Dimitriu, Martha E Chico, Sofia Loor, Maritza Vaca, et al. 2018. “Associations between Infant Fungal and Bacterial Dysbiosis and Childhood Atopic Wheeze in a Nonindustrialized Setting.” J Allergy Clin Immunol 142. [CrossRef]
- Boix-Amorós, Alba, Cecilia Martinez-Costa, Amparo Querol, Maria Carmen Collado, and Alex Mira. 2017. “Multiple Approaches Detect the Presence of Fungi in Human Breastmilk Samples from Healthy Mothers.” Scientific Reports 7 (1): 1–13. [CrossRef]
- Boix-Amorós, Alba, Fernando Puente-Sánchez, Elloise du Toit, Kaisa M. Linderborg, Yumei Zhang, Baoru Yang, Seppo Salminen, et al. 2019. “Mycobiome Profiles in Breast Milk from Healthy Women Depend on Mode of Delivery, Geographic Location, and Interaction with Bacteria.” Applied and Environmental Microbiology 85 (9): 1–13. [CrossRef]
- Coker, Olabisi Oluwabukola, Geicho Nakatsu, Rudin Zhenwei Dai, William Ka Kei Wu, Sunny Hei Wong, Siew Chien Ng, Francis Ka Leung Joseph Jao Yiu Sung Chan, and Jun Yu. 2018. “Enteric Fungal Microbiota Dysbiosis and Ecological Alterations in Colorectal Cancer.” Gut, gutjnl-2018-317178. [CrossRef]
- Frykman, Philip K, Agneta Nordenskjöld, Akemi Kawaguchi, Thomas T Hui, L Granström, Zhi Cheng, Jie Tang, David M Underhill, Iliyan Iliev, and Vince A Funari. 2015. “Characterization of Bacterial and Fungal Microbiome in Children with Hirschsprung Disease with and without a History of Enterocolitis : A Multicenter Study.” PLoS ONE, 1–13. [CrossRef]
- Gao, R, C Kong, H Li, L Huang, X Qu, N Qin, and H Qin. 2017. “Dysbiosis Signature of Mycobiota in Colon Polyp and Colorectal Cancer.” Eur J Clin Microbiol Infect Dis, no. 301: 2457–68. [CrossRef]
- Hallen-adams, Heather E, Stephen D Kachman, Jaehyoung Kim, and Ryan M Legge. 2015. “Fungi Inhabiting the Healthy Human Gastrointestinal Tract : A Diverse and Dynamic Community.” Fungal Ecology 5: 9–17. [CrossRef]
- Hamad, Ibrahim, Rita Abou Abdallah, Isabelle Ravaux, Saadia Mokhtari, Hervé Tissot-Dupont, Caroline Michelle, Andreas Stein, Jean Christophe Lagier, Didier Raoult, and Fadi Bittar. 2018. “Metabarcoding Analysis of Eukaryotic Microbiota in the Gut of HIV-Infected Patients.” PLoS ONE 13 (1): 1–19. [CrossRef]
- Hamad, Ibrahim, Stéphane Ranque, Esam I Azhar, and Muhammad Yasir. 2017. “Culturomics and Amplicon-Based Metagenomic Approaches for the Study of Fungal Population in Human Gut Microbiota.” Scientific Reports, no. November: 1–8. [CrossRef]
- Jayasudha, Rajagopalaboopathi, Sama Kalyana Chakravarthy, Gumpili Sai Prashanthi, Savitri Sharma, Mudit Tyagi, and Sisinthy Shivaji. 2019. “Implicating Dysbiosis of the Gut Fungal Microbiome in Uveitis , an Inflammatory Disease of the Eye.” Invest Ophthalmol Vis Sci.
- Kodio, A.; Coulibaly, D.; Doumbo, S.; Konaté, S.; Koné, A.K.; Tall, L.; Konaté, A.; Guindo, B.; L’Ollivier, C.; Levasseur, A.; Bittar, F.; Doumbo, O.K.; Didier, R.; Thera, M.A.; Ranque, S. Gut Microbiota Influences Plasmodium Falciparum Malaria Susceptibility. Preprints 2021, 2021050710. [Google Scholar] [CrossRef]
- Kodio, Aly, Drissa Coulibaly, Abdoulaye Kassoum Koné, Salimata Konaté, Safiatou Doumbo, Abdoulaye Guindo, Fadi Bittar, et al. 2019. “Blastocystis Colonization Is Associated with Increased Diversity and Altered Gut Bacterial Communities in Healthy Malian Children.” Microorganisms 7 (12): 1–11. [CrossRef]
- Liguori, Giuseppina, Bruno Lamas, Mathias L. Richard, Giovanni Brandi, Gregory da Costa, Thomas W. Hoffmann, Massimo Pierluigi Di Simone, et al. 2016. “Fungal Dysbiosis in Mucosa-Associated Microbiota of Crohn’s Disease Patients.” Journal of Crohn’s and Colitis 10 (3): 296–305. [CrossRef]
- Mbareche, Hamza, Marc Veillette, Guillaume Bilodeau, and Caroline Duchaine. 2020. “Comparison of the Performance of ITS1 and ITS2 as Barcodes in Amplicon-Based Sequencing of Bioaerosols.” PeerJ 2020 (2): 1–36. [CrossRef]
- Nash, Andrea K., Thomas A. Auchtung, Matthew C. Wong, Daniel P. Smith, Jonathan R. Gesell, Matthew C. Ross, Christopher J. Stewart, et al. 2017. “The Gut Mycobiome of the Human Microbiome Project Healthy Cohort.” Microbiome 5 (1): 153. [CrossRef]
- Sokol, Harry, Valentin Leducq, Hugues Aschard, Hang-Phuong Pham, Sarah Jegou, Cecilia Landman, David Cohen, et al. 2017. “Fungal Microbiota Dysbiosis in IBD.” Gut 66 (6): 1039–48. [CrossRef]
- Strati, Francesco, Monica Di Paola, Irene Stefanini, Davide Albanese, Lisa Rizzetto, Paolo Lionetti, Antonio Calabrò, et al. 2016. “Age and Gender Affect the Composition of Fungal Population of the Human Gastrointestinal Tract.” Front Microbiol 7 (August): 1–16. [CrossRef]
- Ward, Tonya L., Maria Gloria Dominguez-Bello, Tim Heisel, Gabriel Al-Ghalith, Dan Knights, and Cheryl A. Gale. 2018. “Development of the Human Mycobiome over the First Month of Life and across Body Sites.” MSystems 3 (3): 1–12. [CrossRef]
Figure 1.
Malian children’s fungal gut community structure. Fungal alpha diversity according to the amplified ITS genomic region and the children’s age group. (A) Observed species richness and Shannon diversity obtained by using ITS1 or ITS2. Observed species richness and Shannon diversity obtained by using ITS1 (B) or ITS2 (C) in comparison with age. Boxplots show medians with first and third quartiles (25% to 75%).
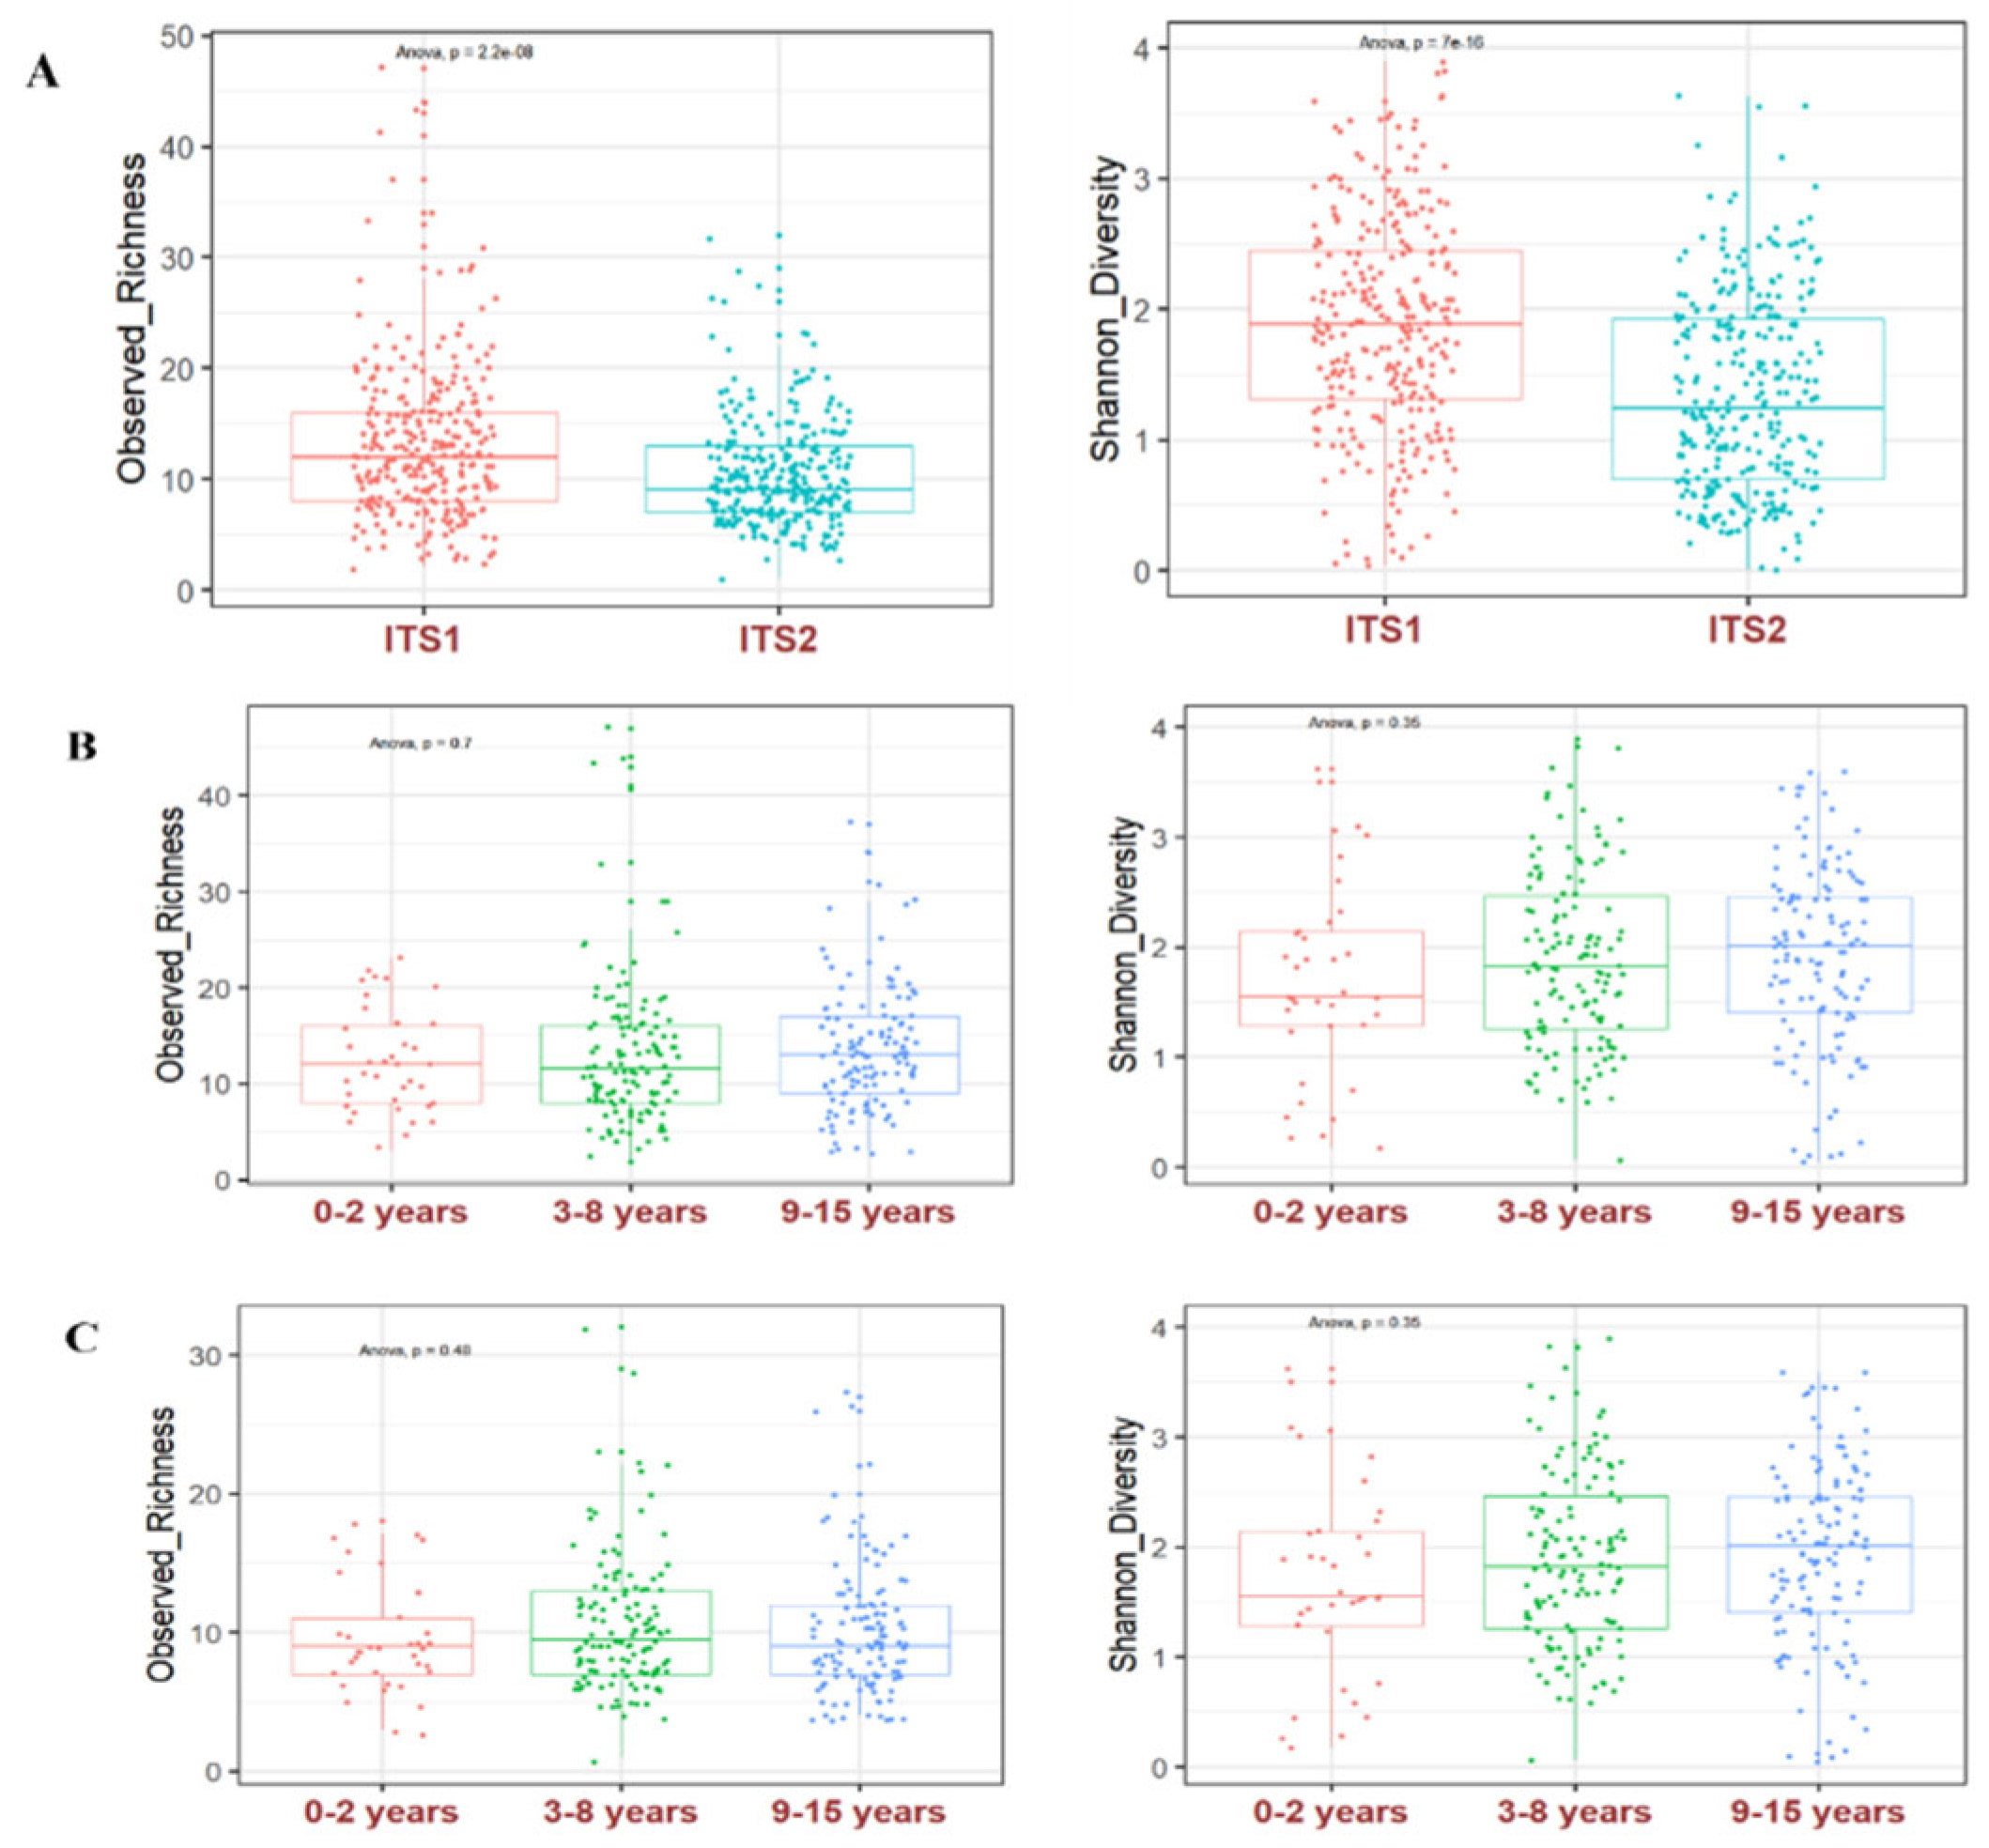
Figure 2.
Malian children’s fungal gut community structure. Relative abundance of fungi at the phylum and genus level. Relative abundance of fungal phyla in each sample in ITS1 (A) and ITS2 (B). Relative abundance of fungal genera in each sample in ITS1 (C) and ITS2 (D). Boxplots show medians with first and third quartiles (25% to 75%).
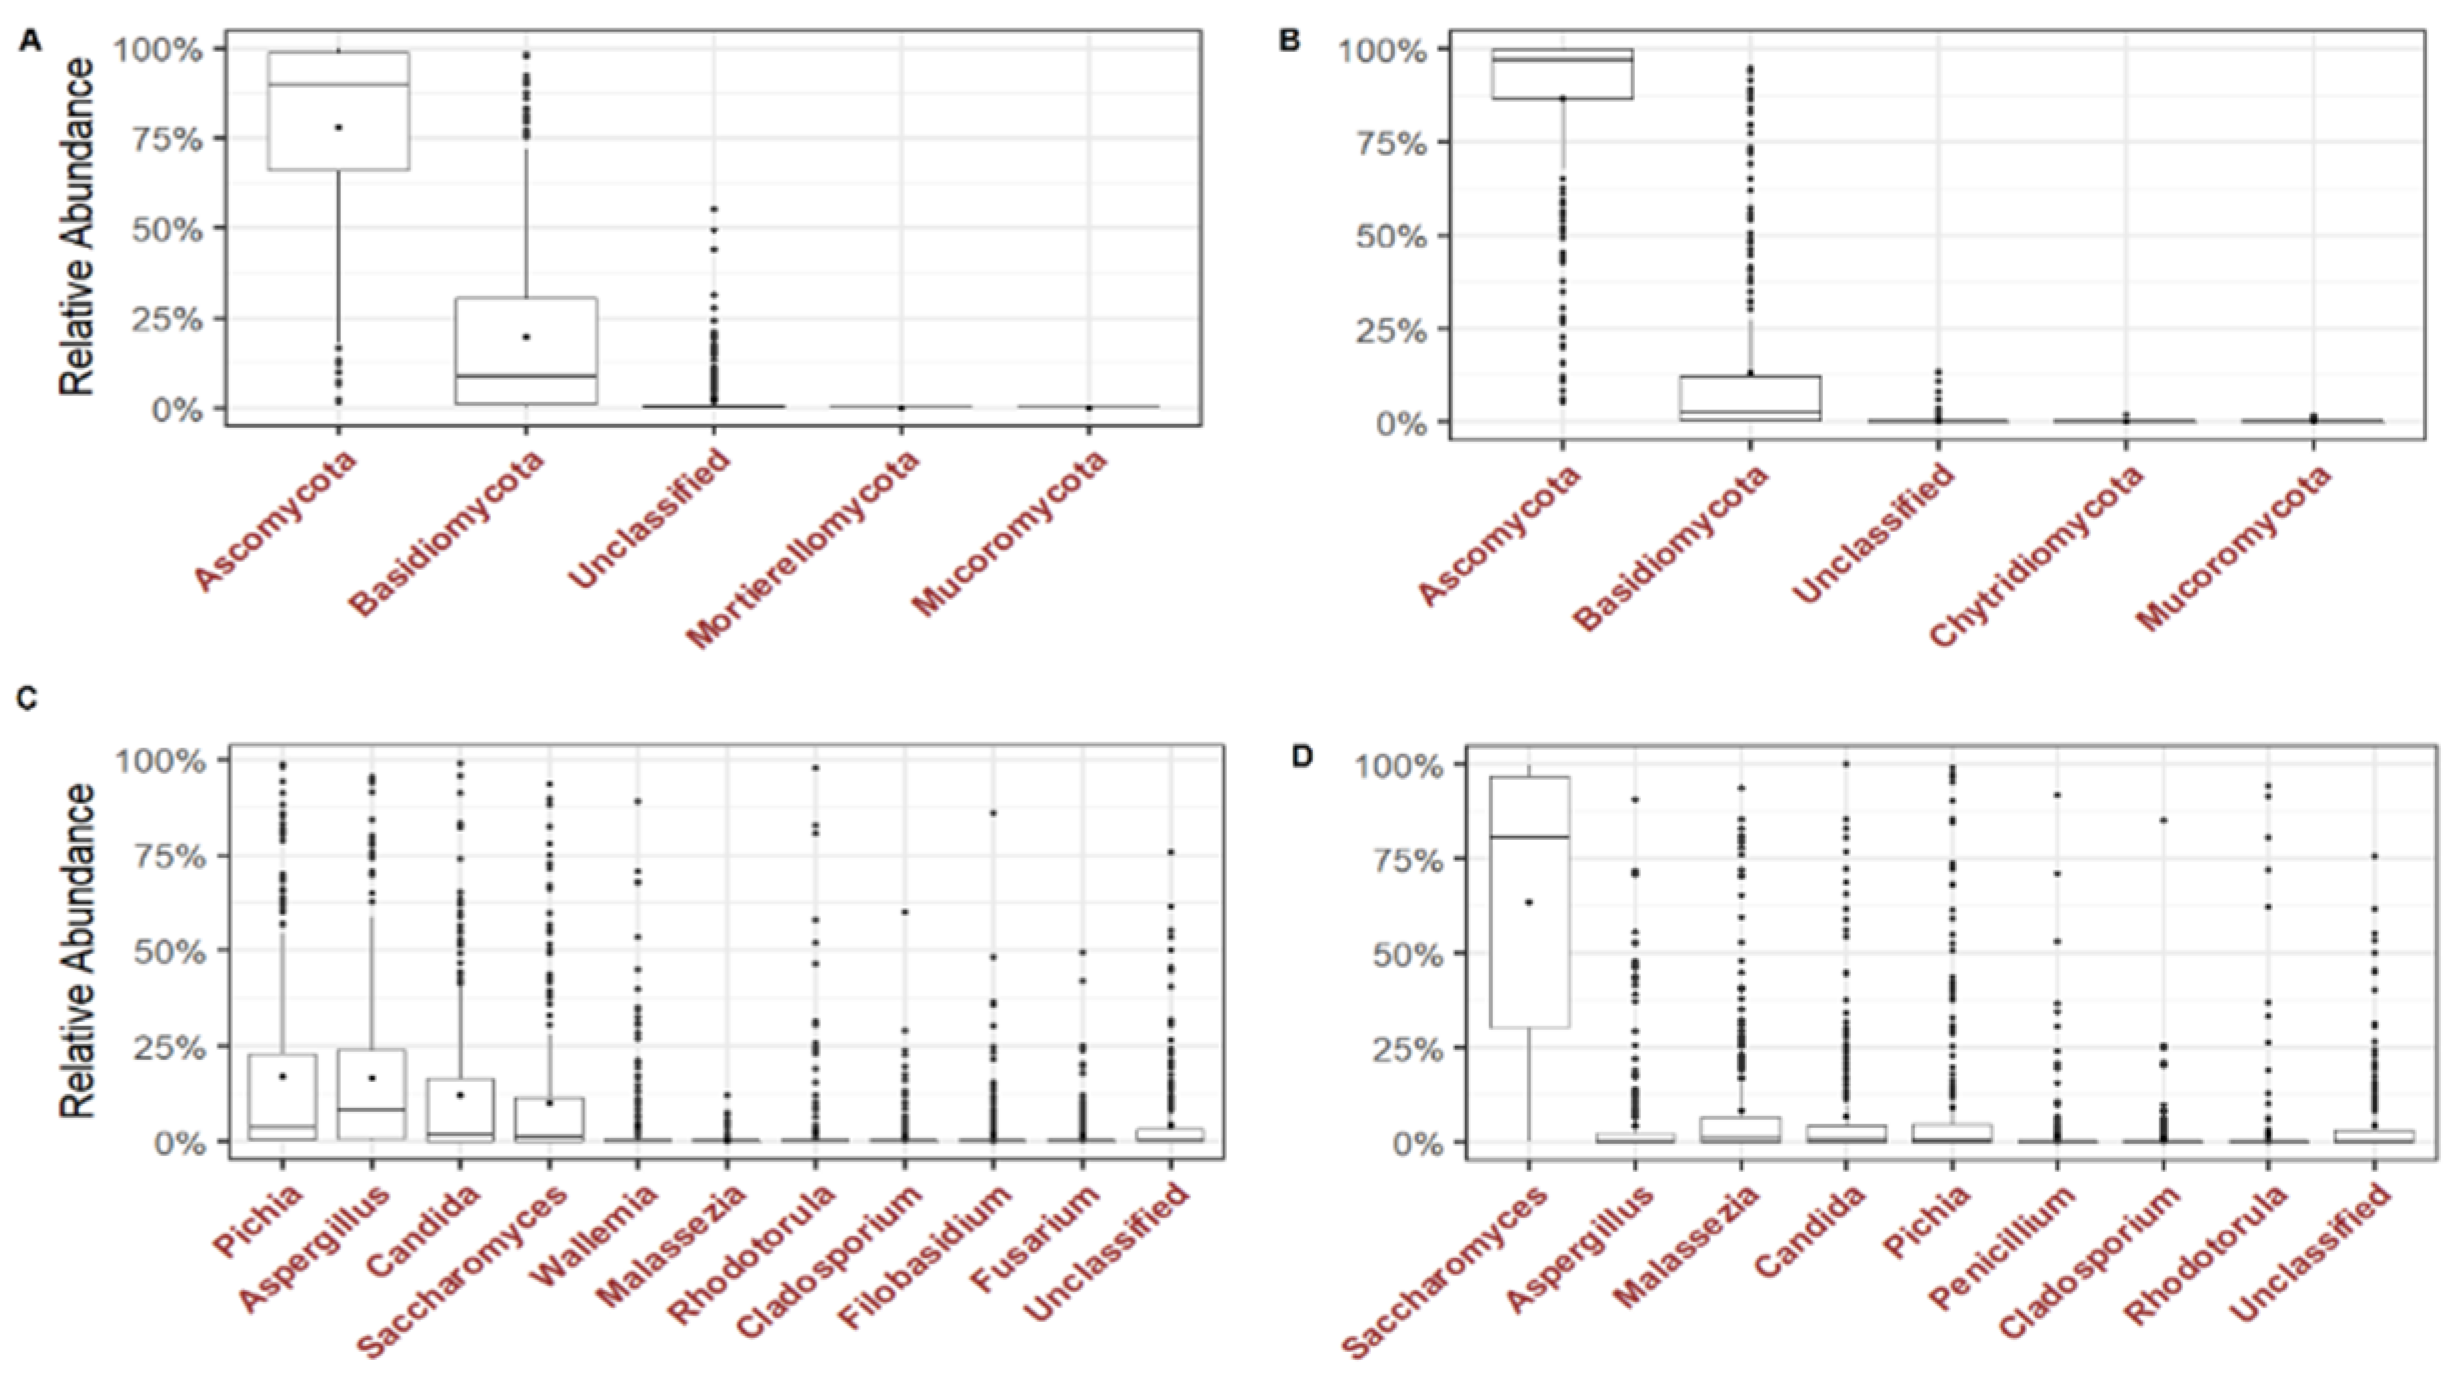
Figure 3.
Malian children’s fungal gut community structure. Distribution of fungal genera and species according to age obtained with ITS1 (A and C) or ITS2 (B and D) metabarcoding. Only genera and species present in at least 50% of the children are shown.
Figure 3.
Malian children’s fungal gut community structure. Distribution of fungal genera and species according to age obtained with ITS1 (A and C) or ITS2 (B and D) metabarcoding. Only genera and species present in at least 50% of the children are shown.
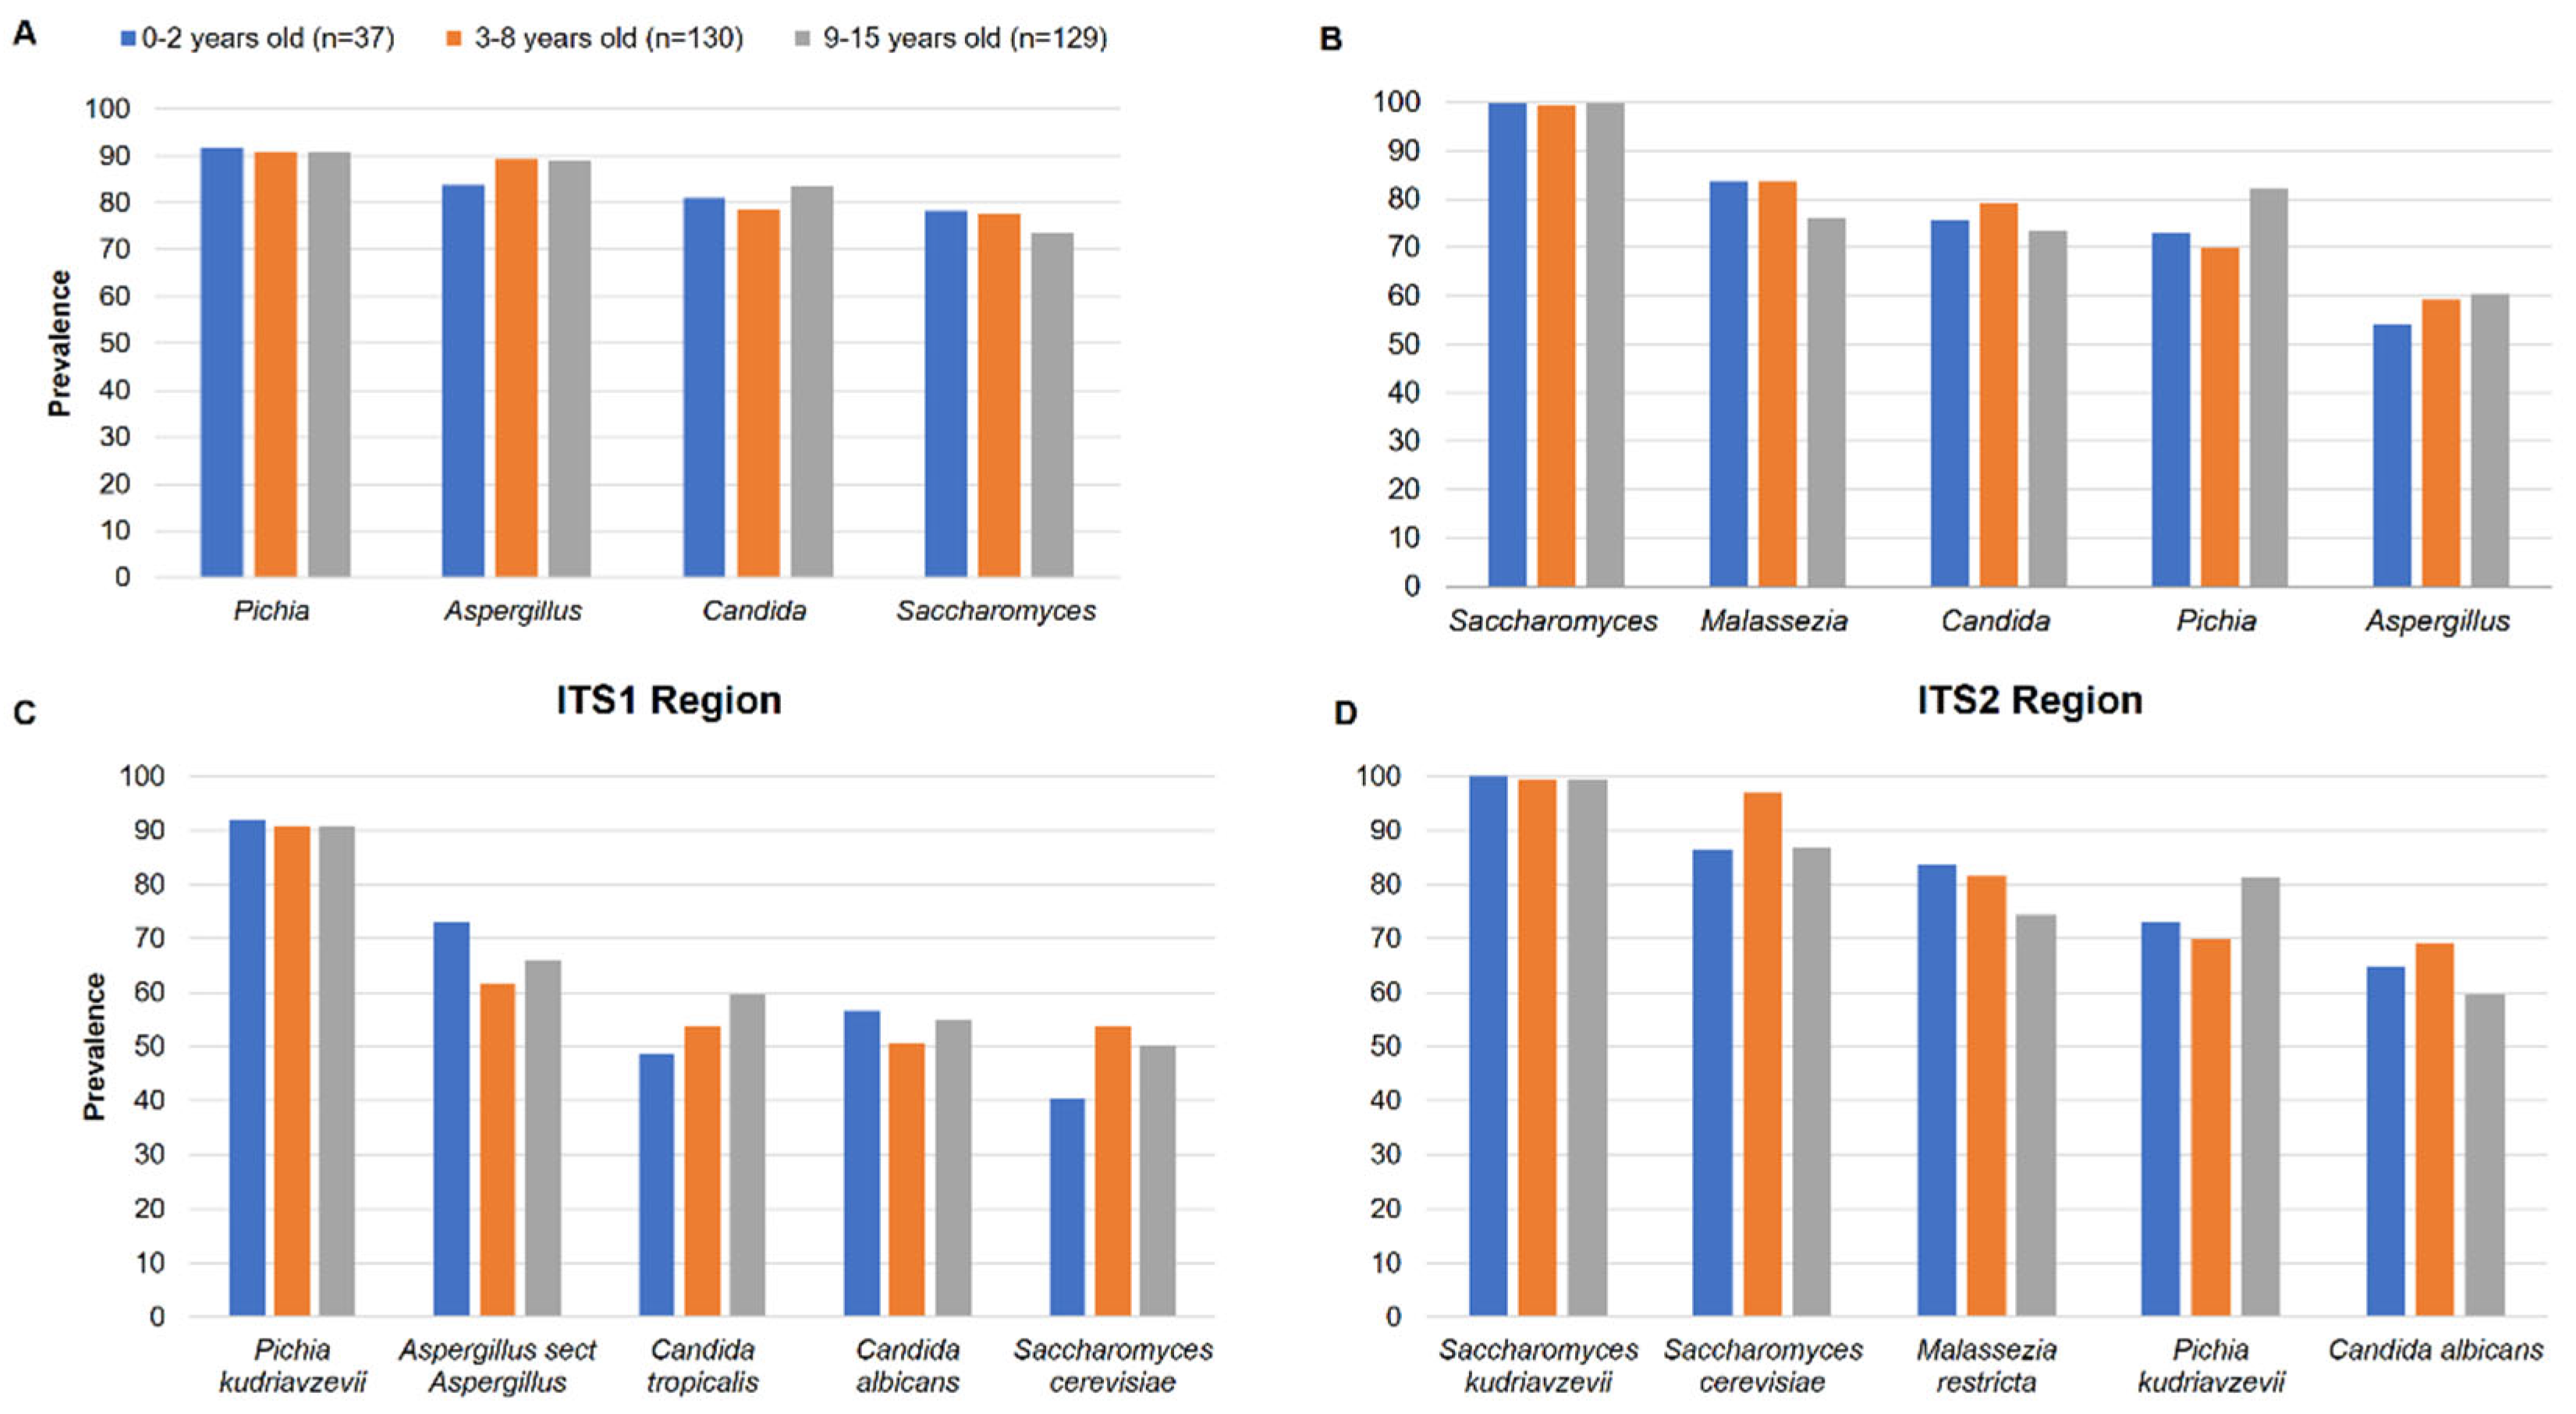
Figure 4.
Malian children’s fungal gut community structure. The mycobiome shared by children. Fungal species detected by using ITS1 (A) or ITS2 (B). (C) Mycobiome amplified by one or both regions comparing the common mycobiome from ITS1 and ITS2. In red color the species present in at least 50% of the children.
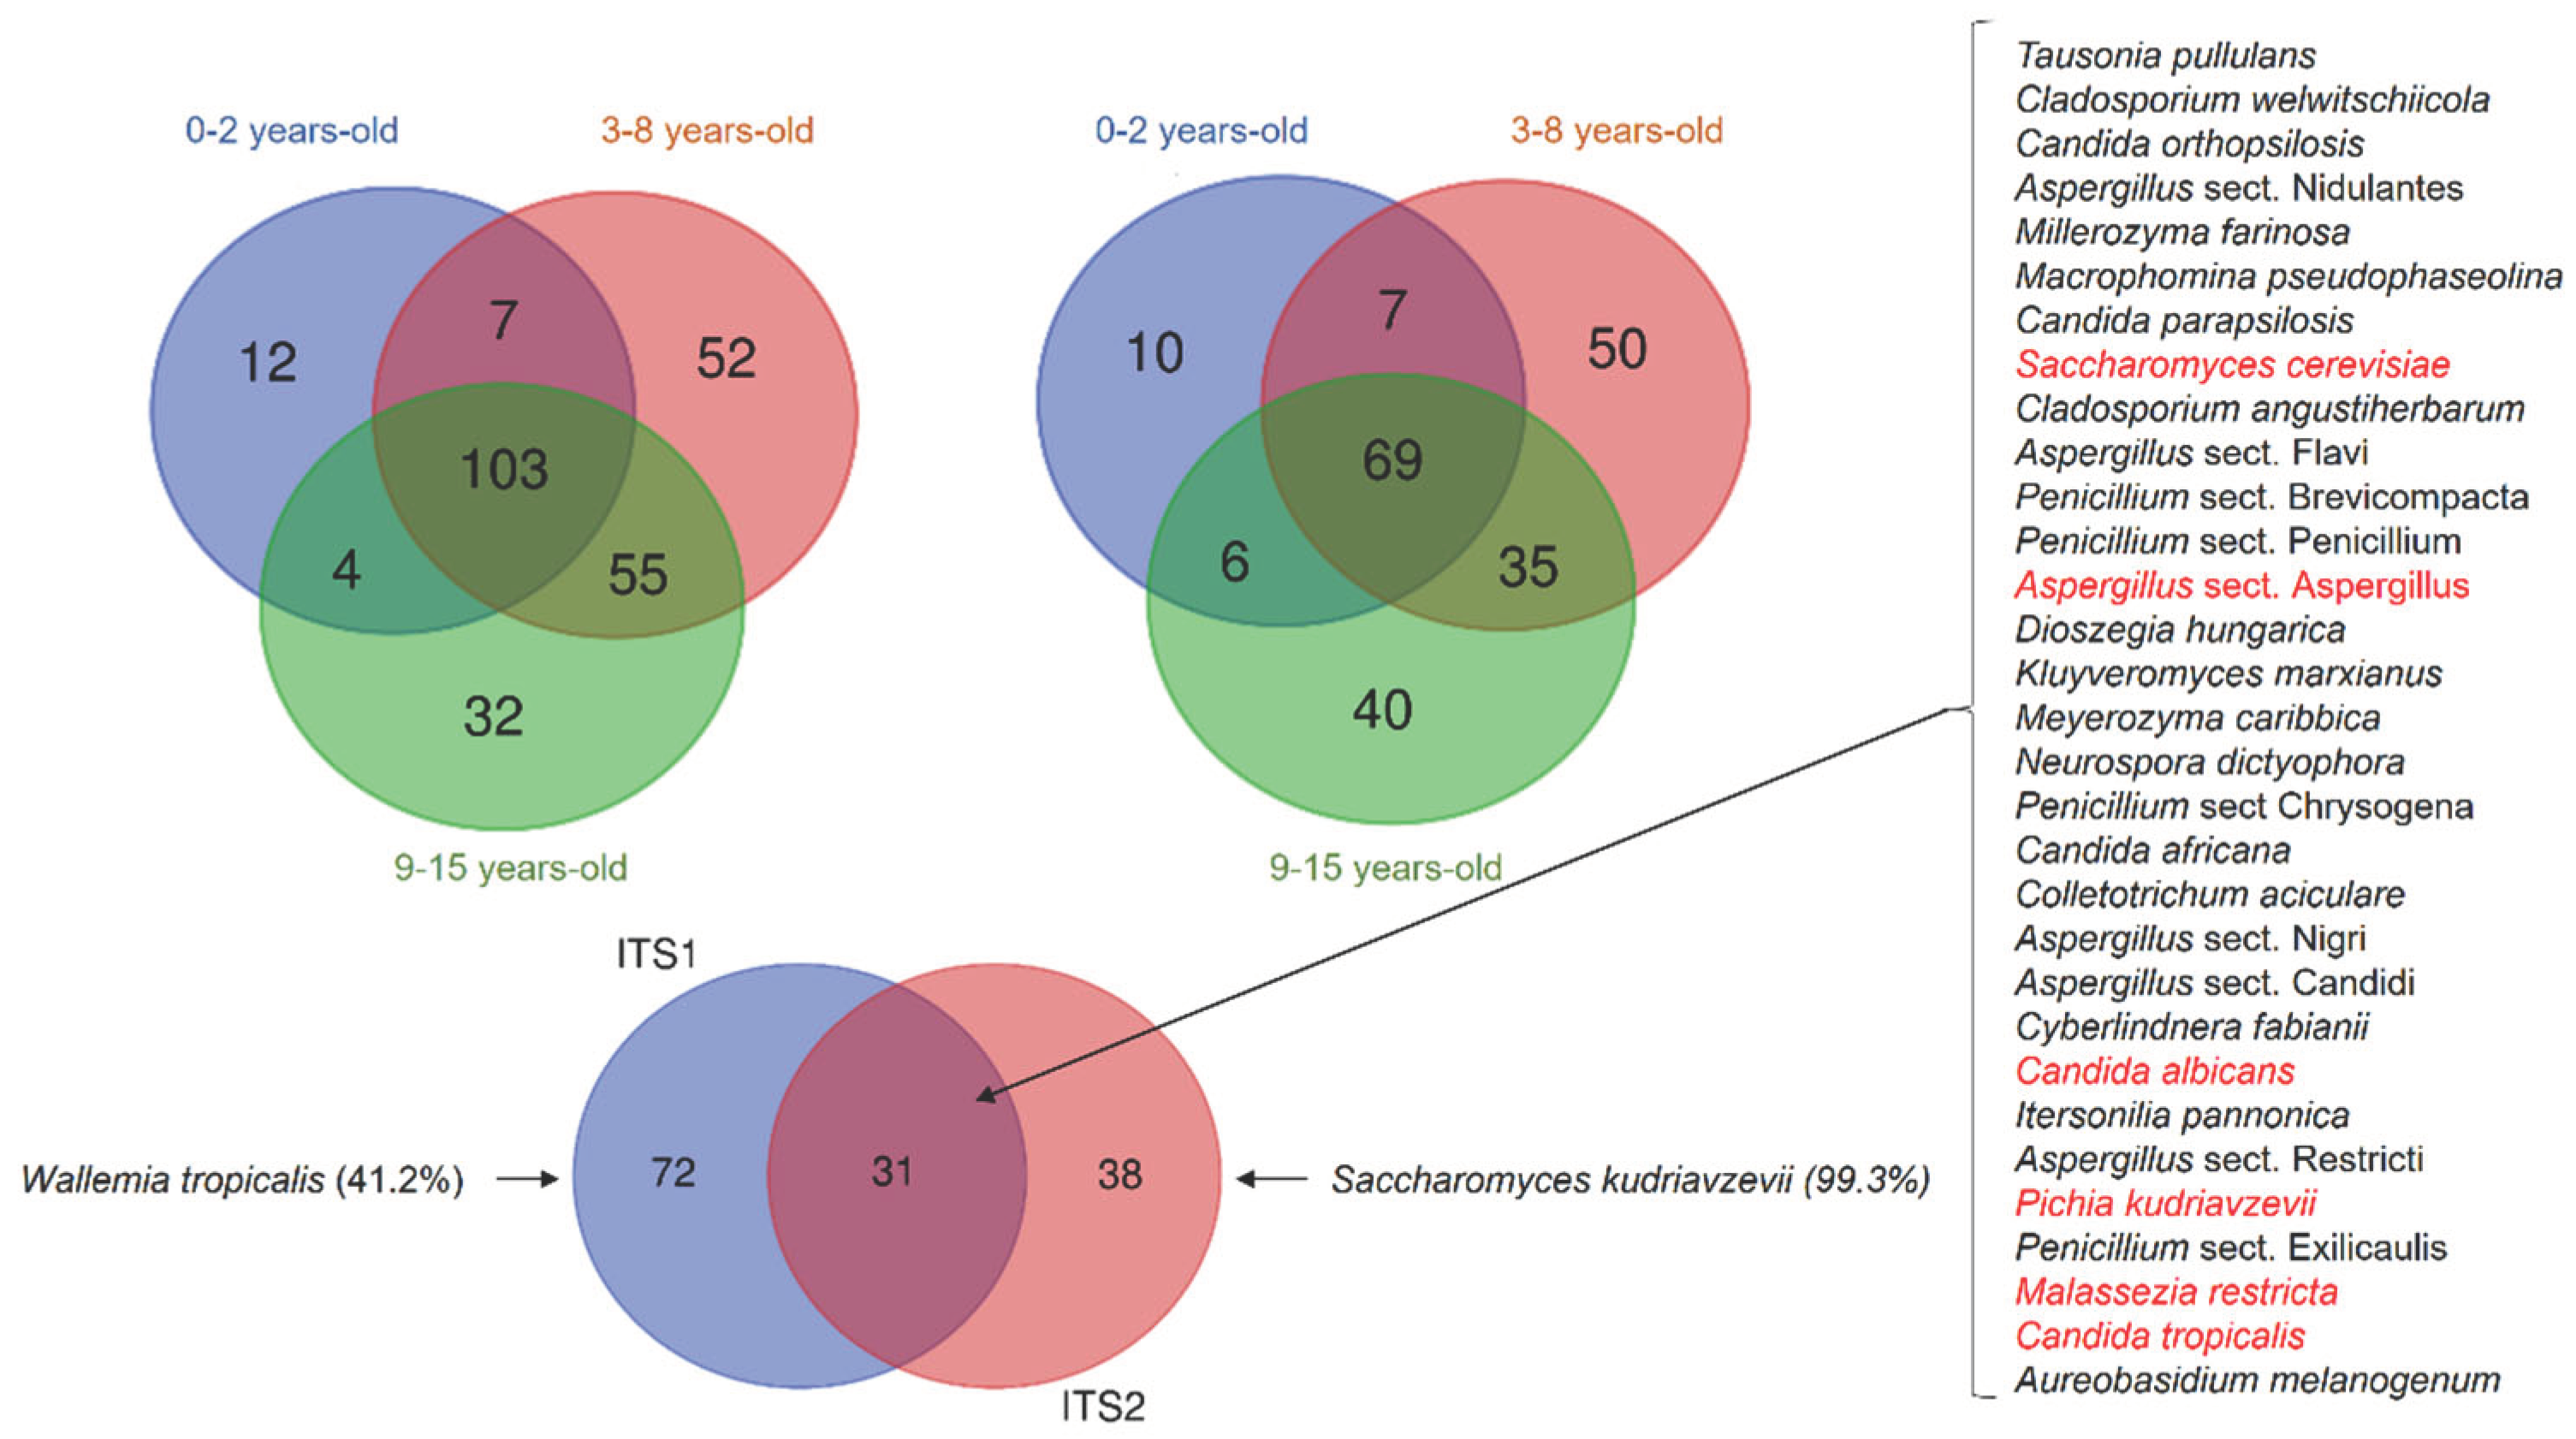

Table 1.
Malian children’s fungal gut community structure. The prevalence of genera and species present in at least 50% of children with the ITS1 and 2 regions.
Table 1.
Malian children’s fungal gut community structure. The prevalence of genera and species present in at least 50% of children with the ITS1 and 2 regions.
| % of children harbouringthe fungal genus | ITS1 barcode | ITS2 barcode |
| Pichia | 90.9% | 75.7% |
| Aspergillus | 88.5% | 59.0% |
| Candida | 81.1% | 76.3% |
| Saccharomyces | 76.0% | 99.6% |
| Malassezia | <50% | 80.4% |
| % of children harbouringthe fungal species | ITS1barcode | ITS2 barcode |
| Pichia kudriavzevii | 90.9% | 75.3% |
| Aspergillus sect. Aspergillus | 66.9% | Not detected |
| Candida tropicalis | 55.7% | <50% |
| Candida albicans | 53.4% | 64.5% |
| Saccharomyces cerevisiae | 50.7% | 91.2% |
| Saccharomyces kudriavzevii | Not detected | 99.3% |
| Malassezia restricta | <50% | 78.7% |
Disclaimer/Publisher’s Note: The statements, opinions and data contained in all publications are solely those of the individual author(s) and contributor(s) and not of MDPI and/or the editor(s). MDPI and/or the editor(s) disclaim responsibility for any injury to people or property resulting from any ideas, methods, instructions or products referred to in the content. |
© 2024 by the authors. Licensee MDPI, Basel, Switzerland. This article is an open access article distributed under the terms and conditions of the Creative Commons Attribution (CC BY) license (http://creativecommons.org/licenses/by/4.0/).
Copyright: This open access article is published under a Creative Commons CC BY 4.0 license, which permit the free download, distribution, and reuse, provided that the author and preprint are cited in any reuse.


