Submitted:
29 February 2024
Posted:
29 February 2024
You are already at the latest version
Abstract
(1) Background: TNF inhibitors (TNFi) have revolutionized the treatment of rheumatoid arthritis (RA). However, 30-40 % of RA patients do not respond adequately to those biologics. In addition to neutralizing soluble TNF, TNFi have the ability to bind the transmembrane form of TNF, tmTNF. Importantly, tmTNF can act itself as a receptor that induces a “Reverse Signaling” (RS) in cells. We previously showed that certolizumab, a Fab’ TNFi, activates RS in human primary monocytes, at least in part through the transcription factor NRF2 that is known to regulate the expression of genes involved in anti-inflammatory response and oxidative stress. (2) Methods: Here, we have developed an assay for the prediction of clinical response of RA patients to TNF inhibitors. This assay is based on mRNA quantitation of CD36 activation and of 6 genes induced by NRF2 following tmTNF RS in fresh monocytes. (3) Results: We could predict the response to anti-TNF monoclonal antibodies (mAbs) with 93.3 % accuracy. However, our method was not suitable for the prediction of the response to TNF soluble receptor etanercept. (4) Conclusions: We have developed a rather simple, short-term, test that can be standardized. Predicting the response to TNF mAbs will help physicians offer the best available treatment and provide patients with personalized medicine.
Keywords:
Rheumatoid Arthritis
; Anti-TNF
; NRF2
; Reverse Signaling
; Biotherapy
; Monoclonal Antibodies
; Monocytes
; Prediction.
1. Introduction
Rheumatoid arthritis (RA) is the most prevalent chronic autoimmune inflammatory rheumatism. Its pathophysiology is largely dependent on TNF [1]. TNF inhibitors (TNFi) have revolutionized the treatment of rheumatoid arthritis (RA)[2,3]. Among TNFi, three different classes of molecules with different clinical and biological properties are currently available: 3 mAbs (adalimumab/ADA, infliximab/IFX, golimumab/GOLI), 1 soluble receptor fusion protein (etanercept/ETA), and 1 Fab’ coupled to pegol (certolizumab/CZP). Despite their high efficacy, about 30-40% of patients do not reach adequate response. In addition to this inter-individual variability in the response to TNFi, there is also an intra-individual variability in terms of response to TNFi type [4]. To date, no theranostic test is routinely available to predict clinical response to TNFi in RA.
TNF is generated as a transmembrane precursor (tmTNF). Its cleavage by the TACE protease leads to release of a soluble form (sTNF) which can interact with its receptor during inflammation. TNFi have the ability to bind sTNF and consequently they decrease the pro-inflammatory burden of TNF, by preventing its fixation on TNF receptors 1 and 2 (TNFR1/2). However, neutralization of sTNF may not be related to amelioration of the disease. The different TNFi have similar affinity for sTNF and their ability to neutralize sTNF is comparable, but the clinical response of RA patients to TNFi is not dependent on serum TNF levels [5,6].
In addition to neutralizing sTNF, TNFi have the ability to bind tmTNF. Importantly, tmTNF can act itself as a receptor that induces a “Reverse Signaling” (RS) in cells [7]. We previously showed that certolizumab (CZP) activates RS in human primary monocytes, at least in part through the transcription factor NRF2 [8]. NRF2 regulates the expression of genes involved in anti-inflammatory response and oxidative stress [9]. Work from others highlighted that NRF2 has a protective role against murine arthritis [10]. Our group recently demonstrated in a triple transgenic (3TG, TNFR1-/-, TNFR2-/-, and tmTNFKI/KI) mouse model, that ETA and murine mAb (MP6-XT22) can induce RS and subsequently polarize macrophage towards a pro-resolutive phenotype, trigger the production of anti-inflammatory effectors and reduce arthritis [11]. We thus hypothesized that the RS of tmTNF plays an important role in the therapeutic response to TNFi also in humans.
In the current study, we assessed whether RS and its downstream NRF2 targets in human monocyte-derived macrophages exposed to mAbs TNFi could predict clinical response to TNFi in RA. We were able to show that not all individuals activated NRF2, which allowed us to define 2 statuses: NRF2 activator versus non-activator. Based on these observations, we conducted a clinical study to correlate the activation status of genes of the NRF2 pathway by RS with the clinical response of RA patients treated with TNFi, either mAbs or monoclonal receptor. We observed that the activation of the NRF2 pathway by RS triggered by mAbs was correlated with a good clinical response. Our findings support the usefulness of such approach to predict the clinical response to TNFi mAbs in RA.
2. Materials and Methods
Patients and Methods
Donors
Adult patients with RA (ACR/EULAR criteria) were recruited in our department of Rheumatology (CHU Toulouse Purpan, France). The study protocol was approved by the Ethics committee of the Institution (DC 2016-2804). All subjects provided signed informed consent. Included patients had active disease (DAS28 >2.6), with an indication to TNFi according to their rheumatologist. Patients receiving > 10 mg of prednisone equivalent/day within the prior 2 weeks were excluded [12,13]. Patients were included in the study prior to the initiation of the TNFi.
Samples from healthy donors (HD) were obtained from the EFS (Etablissement Français du Sang, France).
Cell culture
Blood monocytes were purified from fresh blood (40 mL) from RA patients or buffy coat (HD, layered on Pancoll gradient (PanBiotech, Aidenbach, Germany) from healthy blood donors, and positively isolated by CD14+ magnetic sort following manufacturer’s instructions (Life Technologies, CA, USA). Purified monocytes were plated and cultured at a density of 1x10⁶ cells/well (6-well plate, Falcon poly-styrene) in RPMI (Invitrogen, CA, USA) supplemented with 10% (Life Technologies), 1% penicillin/streptomycin (Invitrogen) and recombinant GM-CSF (20 ng/mL, Peprotech, NJ, USA) during 5 days for healthy blood donors and 16 hours for RA patients to induce their differentiation into macrophages. Then, to induce RS, cells were stimulated with 10 µg/mL of the TNFi ADA (Abbvie) for the monoclonal antibody class, or ETA (Pfizer) for the soluble receptor class.
Cell Fractionation and Western Blot Analysis
Macrophages were harvested after 5 days of differentiation and stimulated as specified with TNFi. Cells were washed twice with cold PBS and centrifuged. Pellets were resuspended in 500 μl of cytop Buffer (Triton 0.25%, Tris HCl 10 mM, EDTA 5 mM, EGTA 0.5 mM and proteases inhibitor cocktail) and incubated 3–5 min on ice. After centrifugation, supernatant was kept as soluble part (cytoplasm) and pellet was lysed with TNEN 250:0.1 buffer (NaCl 250 mM, TrisHCl 50 mM, EDTA 5 mM, NP40 0.1% and proteases inhibitor cocktail) 20–30 min on ice. In addition, to recover chromatin part from TNEN-treated pellet, after centrifugation, supernatants were kept as insoluble part (nucleus) and pellets were lysed in Urea 8 M, 10 min at 95°C (chromatin part). Total amount of protein was quantified by BCA assay.
Nuclear lysates were then subjected to SDS/PAGE on 4–12% polyacrylamide gels (ThermoFisher scientific, Walham, MA, USA). After transferring on 0.22 µm nitrocellulose membrane, proteins were revealed using NRF2 (D1Z9C, 04/2018, Cell Signaling Technology) and PCNA (PC10, sc-56, Santa Cruz Biotechnologies, CA, USA) specific antibodies and anti-rabbit or anti-mouse HRP-linked polyclonal antibodies (Cell Signaling, MA, USA). Protein revelation was done with the Chemidoc (Bio-Rad) and the image was analyzed by Image-Lab5.0 software (Bio-Rad).
RNA extraction and quantification by RT q PCR
Messenger RNA were extracted using High Pure RNA Isolation Kit (Roche, Switzerland) and reverse transcribed with iScript cDNA synthesis kit (Bio-Rad, CA, USA) according to the manufacturer’s instructions. All qPCRs were performed with SYBR green mastermix (Bio-Rad). Primer pair sequences are the following:
GAPDH: Forward 5’-ACC CAC TCC TCC ACC TTT GAC-3’; Reverse 5’-CTG TTG CTG TAG CCA AAT TCG T-3’.
CD36: Forward 5’-GCA GCA ACA TTC AAG TTA AGC A-3’; Reverse 5’-GCT GCA GGA AAG AGA CTG TGT-3’.
FBXO30: Forward 5’-CCG GCC GAG CTG GAC TGG C-3’; Reverse 5’-TCC CTG GCT CTG GCC TGG TC-3’.
GABARA: Forward 5’-CCG GAC AGG GTC CCC GTG AT-3’;
Reverse 5’-TCC CCA TGT CGC GCA CAC AC-3’.
HMOX1: Forward 5’-GGC AGA GGG TGA TAG AAG AGG-3’; Reverse 5’-AGC TCC TGC AAC TCC TCA AA-3’.
LBR: Forward 5’-AGC CCC TCC TCG CAG CGT TA-3’; Reverse 5’-CCT CGG CGT CTG GAA GGG GA-3’.
MAFG: Forward 5’-CCC TTG TCT TGC GCC TGC CT-3’; Reverse 5’-CCG GCT CCC GCT TCA CCT TC-3’.
OSGIN1: Forward 5’-CTG CCT GTC AGG TCC GCT GC-3’; Reverse5’-GCG TGC TCC TTC CGG TGC TT -3’.
Statistical analysis
All data were analyzed with GraphPad Prism5. Normality was tested by Agostino and Pearson test. In vitro data were analyzed with Student’s t-test or Mann-Whitney U-test. Data are represented as mean ± SEM, and p<0.05 (two-tailed) was considered to be statistically significant.
3. Results
TNFi are able to induce NRF2 translocation
We previously showed that anti-inflammatory properties of TNFi were associated with NRF2. NRF2 transcription factor is phosphorylated and translocated into the nucleus upon activation. We thus first assessed whether this activation occurred in all donors in the presence of monoclonal TNFi, ADA. HD monocytes were derived as macrophages and treated with ADA in vitro. By Western blot, we were able to confirm that stimulation of macrophages by ADA and ETA induced a nuclear translocation of NRF2 (Figure 1A-B). Interestingly, we observed two profiles: (i) donors inducing NRF2 nuclear translocation from 45 minutes, with or without maintenance of nuclear NRF2 after 2 hours, versus (ii) donors without increase in NRF2 nuclear translocation (Figure 1C). Only representative samples are described here.
Identification of target genes indicating a transcriptional activation of tmTNF NRF2 signaling in healthy donors.
We then assessed the induction of an anti-inflammatory response upon ADA treatment, in the context of NRF2 nuclear translocation. To determine the stimulation time to have an optimal gene expression, we referred to our previous study on human monocytes [8]. We showed that RS activation by Fab TNFi induced scavenger receptor CD36 and the NRF2-target gene HMOX1 expression. We then stimulated macrophages from HD using antibody TNFi (ADA) and analyzed CD36 and HMOX1 expression by RT-qPCR. According to our experience using CZP [8] and preliminary experiments we noted a peak of gene expression after 16 hours of stimulation. To go further, we analyzed transcriptional activity of NRF2 target genes activated by RS. We studied the modulation of 15 NRF2 target genes described in reference [15] by RT-qPCR in macrophages of HD after TNFi stimulation, and selected 6 of them. Thus, in addition to CD36, we selected the following NRF2 target genes (FBX030, GABARA, HMOX1, LBR, MAFG, OSGIN1) which play a role in the anti-oxidative stress response or anti-inflammatory pathway and were in our hands preferentially modulated upon TNFi stimulation. We observed 2 different subsets of healthy donors: donors in which TNFi stimulation increased mRNA of these target genes in macrophages (Figure 2, blue bars), and conversely donors with no significant upregulation in transcription of these target genes (Figure 2, red bars). Based on these observations, we classified donors into two different categories, “activators” or “non-activators” of tmTNF-induced NRF2 signaling upon antibody TNFi stimulation.
We then wanted to make a link between NRF2 transcriptional activity and its nuclear translocation. We observed that nuclear translocation of NRF2 is not always associated with the induction of selected target genes expression. Furthermore, some NRF2 nuclear translocation profiles are not clearly defined by Western blot. Therefore, we chose to focus on analyzing the relative amount of mRNA from NRF2 targets (based on modulation of the 6 selected target genes expression) rather than their nuclear translocation.
Identification of experimental variation of mRNA measurement and definition of tmTNF NRF2 activator/non-activator status.
To optimize our definition of tmTNF-induced NRF2 activation status, we calculated the coefficient of variation (CV) of RT-qPCR measurements. This CV was set at 0.06 because it corresponds to the highest value among all tested genes (Figure 3A).
Based on all these observations, we developed a protocol to classify donors or patients into activators or non-activators of tmTNF-induced NRF2 after antibody TNFi stimulation. After 16 hours of TNFi treatment, we first analyzed the CD36 mRNA ratio (Treated vs Non-Treated). Whenever this ratio was lower than 0.94, the donor/patient was classified as non-activator. If this ratio was upper than 1.06, then the modulation of 6 NRF2 target genes (GABARA, FBXO30, HMOX1, MAFG, LBR, OSGIN1) was analyzed. If upregulation of at least 50% of these NRF2 target genes was > 1.06, then the donor/patient was classified as tmTNF NRF2 activator. If not, the donor/patient was classified as non-activator (Figure 3B, C). Following this protocol, we analyzed the effect of our RT-qPCR machine variation on the classification. To this end, we repeated the RT-qPCR experiments 3 times, on different days and after frost and defrost cycles. In Figure 3C, we observed that technical variation was not biologically significant and did not impact patient/donor classification. However, it suggests that borderline data may require replicates since one of the 3 CD36 values fell within the 0.94 – 1.06 area of CV values. Finally, we tested the stability of mRNA expression over time in 3 HD and 1 RA patient (Suppl. Figure 1). The analysis was performed at day 0 and 7 days later, in the presence of ADA. In all 4 donors, the activation profile remained stable over this period of time.
Experimental protocol to predict TNFi clinical response depending on tmTNF NRF2 activator status.
We tried to link clinical response to antibody TNFi during arthritis and tmTNF NRF2 activation status. We hypothesized that “activators” and “non-activators” of tmTNF / NRF2 corresponded to the clinically responders and non-responders to antibody TNFi respectively.
Then, we developed an experimental protocol to predict TNFi clinical response through the determination of tmTNF / NRF2 activation status. Blood samples from RA patients were collected before initiation of TNFi therapy. CD14+ monocytes were purified prior being stimulated or not for 16 hours with the TNFi initiated in real-life (10 µg/mL antibody). Cells were harvested and NRF2-induced genes fbxo30, gabara, hmox1, lbr, mafg and osgin1 as well as CD36 which does note belong to the NRF2 pathway mRNA expression analyzed by RT-qPCR. Depending on genes modulation, patients were classified as NRF2 Activators or Non-activators by tmTNF. After 3 months, clinical response was evaluated by physicians and patients were classified as responder or non-responder to TNFi treatment following EULAR criteria. Baseline NRF2 and CD36 activation status was compared to the real-life month-3 clinical response to assess prediction accuracy.
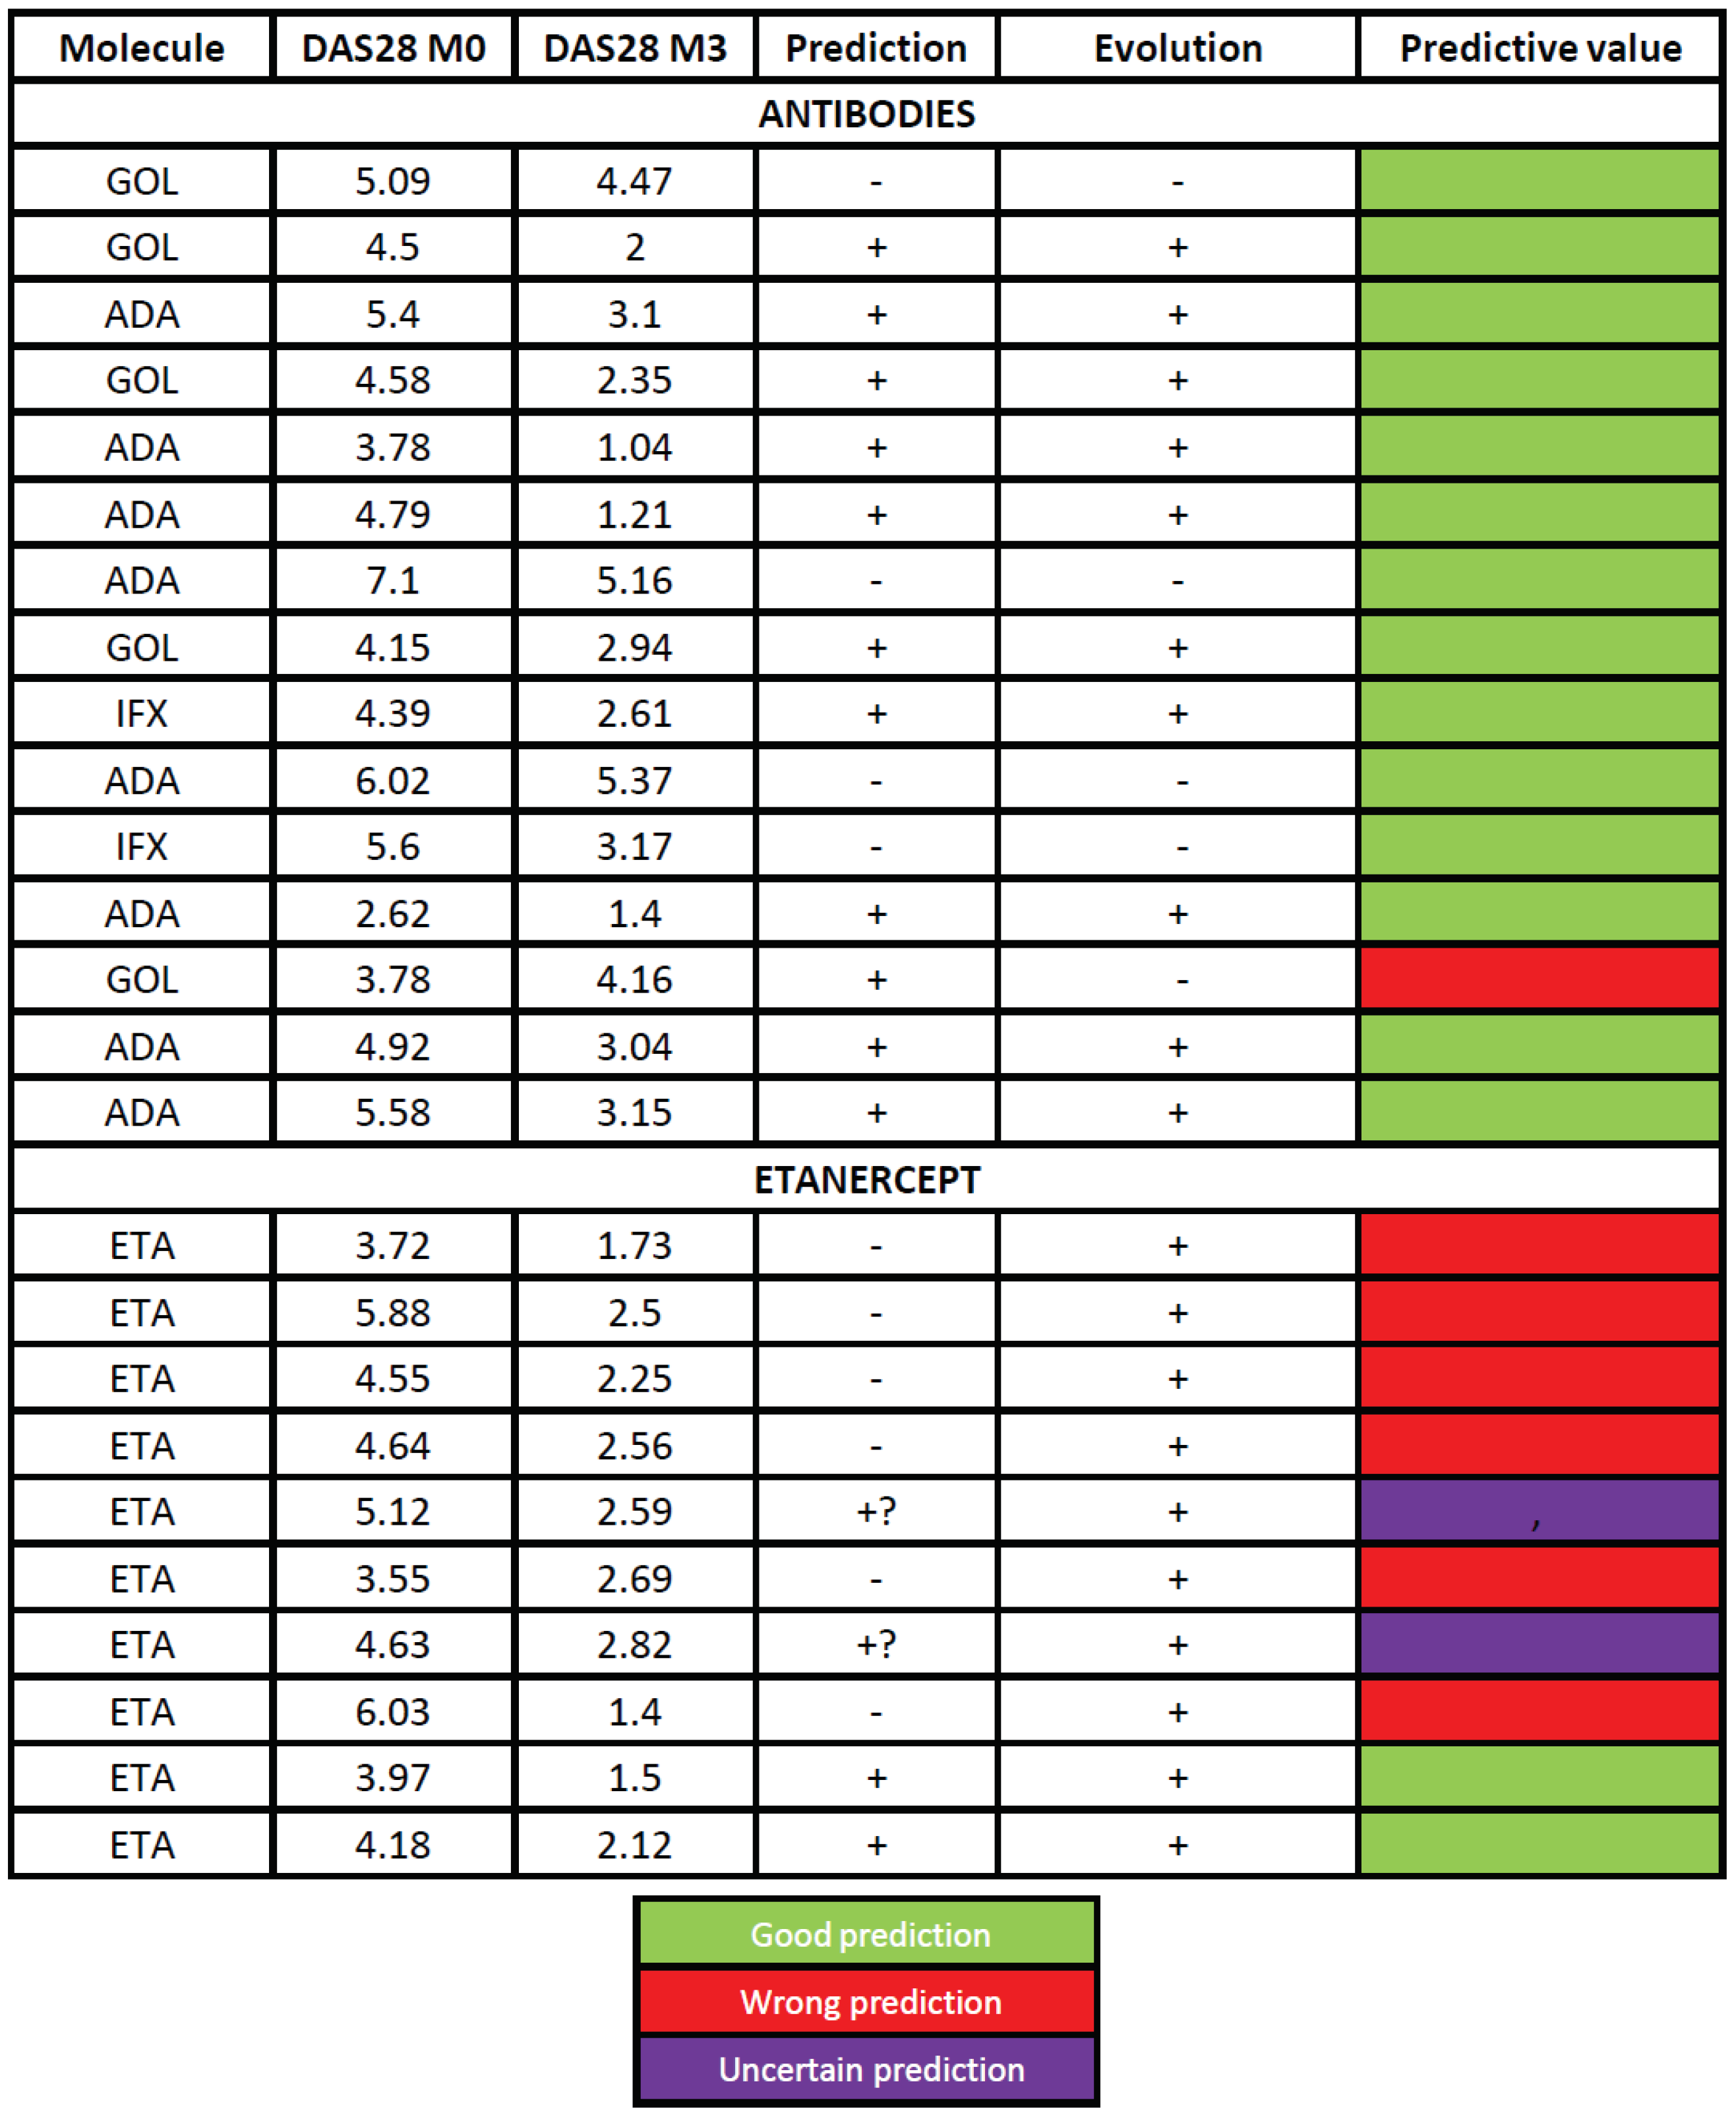
We included 15 RA patients treated with a mAb (ADA, GOLI, IFX) and 10 patients treated with the soluble receptor ETA. Table 1 shows the clinical characteristics of patients at inclusion. Based on our activator classification we successfully predicted the month-3 clinical response in 14/15 patients (93.3 %) treated with antibodies (Table 2). Patient #2, classified as activator, needed an increase in GOLI dose (50 to 100 mg) to achieve a satisfactory clinical response which was thus considered as successfully predicted. On the opposite, patient #13 did not reach satisfactory response to GOLI although it was predicted as a good responder. It was the only wrong prediction in the antibody group. The prediction thus reached 93.3 %. However, in patients treated with ETA the mRNA profile did not bring any insightful information as predictions were correct in none of the patients. Of note, in that series, all patients responded to the treatment.
Representative patterns are described here.
Blood CD14+ monocytes purified from 4 different HD were differentiated during 5 days into macrophages in the presence of recombinant GM-CSF and then stimulated with 10 µg/mL of TNF blockers: adalimumab (A) or etanercept (B). After 0.75, 2 or 5 hours of stimulation cells were harvested for cell fractionation. Nuclear translocation of NRF2 was analyzed by Western blot and normalized on PCNA (Proliferating cell nuclear agent) expression. (C) Representative Western blots of NRF2 nuclear translocation, or absence thereof, after a 5-hour stimulation.
Global description of data obtained from HD.
CD14+ monocytes purified from healthy blood donors were differentiated during 5 days into macrophages in presence of recombinant GM-CSF prior to being stimulated or not (NT) with adalimumab during 16 hours for Reverse signaling activation. Cells were harvested and cd36, fbx030, gabara, hmox-1, lbr, mafg and osgin1 mRNA expression analyzed by RT-qPCR. Donors were classified as Activators or Non-activators, based on mRNA upregulation. Data are presented as mean±SEM of mRNA fold change vs untreated condition, normalized to gapdh. Up to 17 samples for activators and 13 for non-activators were analyzed. * p<0.05, ** p<0.01, *** p<0.005 (paired t-test).
4. Discussion
In this work, using RS (NRF2 and CD36 activation), we developed a test to predict therapeutic response to TNFi in RA patients. In a first approach conducted on HD, we found that this signaling was not activated in all individuals. We therefore established criteria allowing us to define the activation status of RS based on the modulation of gene expression. In a second approach, we established a test to predict the clinical response to TNFi in patients with rheumatoid arthritis. This test that has an accuracy of 100 % for antibodies.
Evaluation of the benefit/risk ratio is essential for any treatment before its administration in order to ensure a good management of patients. TNFi biotherapies are expensive treatments, with adverse effects that can be serious. In the absence of drug intolerance, the evaluation of therapeutic efficacy is done after 3 months of treatment which in about 30% of cases results in a therapeutic failure with sometimes even a risk of worsening of the disease. Thus, the identification of biomarkers and the creation of tests to predict the response to these treatments would greatly improve patient management.
From macrophages of HD, we identified a panel of 7 genes whose expression is modulated by the activation of RS in some donors by the 3 classes of TNFi. This observation allowed us to classify individuals into activators and non-activators of the NRF2 pathway. These are the CD36 receptor and 6 nrf2 transcription factor target genes involved in the response to oxidative and anti-inflammatory stress [10,16]. The analysis of nrf2 target genes is all the more relevant since it has a protective role against experimental arthritis. Indeed, mice deficient for this transcription factor develop more severe arthritis compared to wild mice [10,16]. We assume that patients activating specific gene of RS will have a good response to TNFi antibody treatment.
From a methodological point of view, the identification of nrf2 genes activated by RS was made from healthy blood donors monocytes differentiated in macrophages in order to increase the expression of tmTNF expression. This differentiation was not necessary for RA patient monocytes. Indeed, the inflammatory environment from which they are derived results in higher expression of their tmTNF expression as compared to HD [17]. In addition, direct testing of newly isolated monocytes from patients helps to retain the imprint of the environment in which they were found.
Several studies have been conducted to identify markers for predicting the response to TNFi in relation or not with tmTNF in rheumatoid arthritis. For example, Nguyen and colleagues showed that the monocytes of the ADA responder patients expressed more tmTNF than the non-responders and that the increase in the binding of this TNFi is a marker of a good therapeutic response for ADA but not ETA [18]. Thus, ETA seems to behave differently from ADA in terms of inducing tmTNF as well as genes induced by RS [19]. It is of note that, contrary to what has been claimed, ETA is indeed capable of inducing RS as evidenced by our work [11]. Our data are in accordance with a different recruitment of signaling proteins in response to ADA and ETA. This dual response is reflected by accurate prediction for mAbs, but not ETA. Other work has identified CD11c expression as a marker for predicting ADA response by analyzing the transcriptome of patient blood monocytes. However, the prediction was taking into account only one TNFi and in addition was not valid when the latter is in association with methotrexate [20]. Another study conducted by Meusch and colleagues showed that following the activation of RS of tmTNF of monocytes, increased secretion of soluble forms of TNF and IL-1 receptors (sTNFR1 and sIL-1R1) and IL-10 was correlated with a good therapeutic response to ETA in patients with rheumatoid arthritis according to EULAR criteria [21]. These discoveries, like many others, have certain limitations such as the fact that only one TNFi has been tested in contrast to our study which considers the 2 main classes of TNFi. Unlike some studies, the prediction test we have developed is viable for patients with TNF monotherapy or in combination with other treatments (such as methotrexate). Its technicality is relatively rapid, simple and inexpensive, so the test can easily be reproduced in other laboratories with a standardized kit.
To better understand the activator/non-activator status, we need to further study the downstream signaling cascade of the tmTNF following the activation of NRF2-induced genes and CD36 by RS.
The internalization of the TNFi found in mice BMDM following the tmTNF binding was also described in dendritic cells [22] and human macrophages in our laboratory. It would seem that this internalization is necessary for the subsequent signaling. Based on data from the literature and observations made in the laboratory, we can make some assumptions about the signaling pathways initiated.
Transmembrane TNF is a signaling protein. The intracellular domain of tmTNF contains sequences of amino acids preserved between different species. In particular, it contains a consensus sequence of binding to casein kinase I (CKI) at the level of its cytoplasmic domain. Thus, on a murine macrophage line, casein kinase was shown to phosphorylate tmTNF which is dephosphorylated following the binding of soluble TNF receptors on tmTNF [23]. In addition, the activation of RS following stimulation by the LPS activates the signaling channels of the MAP kinase and the ERK pathway [24].
Analysis of the transcriptome of macrophages following the activation of RS may bring information on genes that are differentially modulated and thus on mobilized signaling pathways that could be different depending on the TNFi. Despite the many similarities (such as the speed of association and dissociation as well as the affinity of binding to the soluble TNF of Adalimumab, Infliximab or Etanercept which are similar (25), the differences between the TNFis both pharmacologically and functionally could justify this difference in signaling. Indeed, TNFis have a different stoichiometry: a molecule of Etanercept binds a single trimer of TNF while this same trimer can be linked by up to 3 molecules of Infliximab or Adalimumab [25]. This bond difference could result in the recruitment of different proteins at the cytoplasmic level of the tmTNF and thus a different downstream signaling cascade. Indeed, we hypothesize that RS would not be limited only to the signaling of tmTNF, but rather would involve an endocytic complex with the recruitment of neighboring proteins. This could explain the difference between mAbs and ETA in predicting the therapeutic response.
The identification of genes specifically modulated by each anti-TNF through transcriptomic analysis will allow us to increase the accuracy of the test. Similarly, the comparative analysis of macrophages RNAseq from responders versus non-responders could make it possible to identify key players in this signaling that explain the differences between activators and non-activators. In the future, this test can guide clinicians in the choice of treatment to be administered in order to optimize the management of patients with rheumatoid arthritis.
The test shows very satisfactory efficacy for prediction of response to antibody but is not adequate for the other two types of TNFi, namely the soluble receptor and Fab. This reflects the various aspects and signaling pathways initiated by RS. It appears clearly from this work that RS induced vary from on TNFi to another. The final objective of this work is to perform tests routinely before the administration of TNFi treatment so that the clinician can be guided in the choice of the TNFi to be administered. Thus, although the genes have been selected from macrophages derived from healthy blood donors, they appear to be adequate for prediction of response of RA patients to monoclonal anti-TNF antibodies, but not to ETA. This list of genes could certainly be adapted to each class of TNFi. The cell surface levels of tmTNF on macrophages from RA patients that respond to ADA have been shown to be increased [18]. This may be related to higher RS response and better predictive response.
TNFi are used in the treatment of pathologies other than RA. TNF is a cytokine involved in the pathophysiology of other chronic inflammatory diseases such as chronic inflammatory bowel disease (IBD), spondylitis, psoriatic arthritis, and intra- and inter-individual variability in response is also observed in these patients. Thus, we propose to evaluate the effectiveness of the prediction test in other diseases treated with TNFi in which RS and NRF2 activation could also play a role in patient response. Indeed, it has been shown in patients with IBD, that the level of tmTNF (but not that of soluble TNF) in monocytes is associated with a good response to TNFi thus suggesting the involvement of RS [26].
5. Conclusions
Signaling through tmTNF contributes to the therapeutic response to TNFi and thus constitutes a complementary mechanism of action. We also found that RS is not activated in all individuals. By testing the activation status of nrf2 genes and CD36 by RS, we were able to develop a predictive test of the clinical response to TNFi in patients with rheumatoid arthritis. This study needs nevertheless to be duplicated in a separate cohort. This test could significantly improve patient management.
Supplementary Materials
The following supporting information can be downloaded at the website of this paper posted on Preprints.org.
Author Contributions
Conceptualization: AC, BR, YD, JLD. Data curation: ABR, BR, MB, KD, JLD, YD. Original draft preparation: JLD, KD, YD; Review and editing reviewing: all authors; Patients recruitment: AC, ArC, ARW, JFB, YD; Laboratory investigation: ABR, BR, KD, MB, YD; Data analysis: all authors. Funding: AC, JLD. All authors have read and agreed to the published version of the manuscript.
Funding
This research was funded by MSD-AVENIR to AC and JLD
Institutional Review Board Statement
Ethics committee of our Institution: DC 2016-2804
Conflicts of Interest
The authors declare no conflicts of interest.
References
- Schett G, McInnes IB, Neurath MF. Reframing Immune-Mediated Inflammatory Diseases through Signature Cytokine Hubs. N Engl J Med. 2021;385:628–39. [CrossRef]
- Daien C, Hua C, Gaujoux-Viala C, Cantagrel A, Dubremetz M, Dougados M, et al. Update of French society for rheumatology recommendations for managing rheumatoid arthritis. Joint Bone Spine. 2019;86:135–50. [CrossRef]
- Smolen JS, Landewé RBM, Bijlsma JWJ, Burmester GR, Dougados M, Kerschbaumer A, et al. EULAR recommendations for the management of rheumatoid arthritis with synthetic and biological disease-modifying antirheumatic drugs: 2019 update. Ann Rheum Dis. 2020;79:685–99. [CrossRef]
- Gottenberg J-E, Brocq O, Perdriger A, Lassoued S, Berthelot J-M, Wendling D, et al. Non-TNF-Targeted Biologic vs a Second Anti-TNF Drug to Treat Rheumatoid Arthritis in Patients With Insufficient Response to a First Anti-TNF Drug: A Randomized Clinical Trial. JAMA. 2016;316:1172–80. [CrossRef]
- Taylor PC. Pharmacology of TNF blockade in rheumatoid arthritis and other chronic inflammatory diseases. Curr Opin Pharmacol. 2010;10:308–15. [CrossRef]
- Berkhout LC, l’Ami MJ, Ruwaard J, Hart MH, Heer PO, Bloem K, et al. Dynamics of circulating TNF during adalimumab treatment using a drug-tolerant TNF assay. Sci Transl Med. 2019;11. [CrossRef]
- Eissner G, Kolch W, Scheurich P. Ligands working as receptors: reverse signaling by members of the TNF superfamily enhance the plasticity of the immune system. Cytokine Growth Factor Rev. 2004;15:353–66. [CrossRef]
- Boyer JF, Baron M, Constantin A, Degboé Y, Cantagrel A, Davignon J-L. Anti-TNF certolizumab pegol induces antioxidant response in human monocytes via reverse signaling. Arthritis Res Ther. 2016;18:56. [CrossRef]
- Ahmed SMU, Luo L, Namani A, Wang XJ, Tang X. Nrf2 signaling pathway: Pivotal roles in inflammation. Biochim Biophys Acta Mol Basis Dis. 2017;1863:585–97. [CrossRef]
- Maicas N, Ferrándiz ML, Brines R, Ibáñez L, Cuadrado A, Koenders MI, et al. Deficiency of Nrf2 accelerates the effector phase of arthritis and aggravates joint disease. Antioxid Redox Signal. 2011;15:889–901. [CrossRef]
- Diallo K, Simons N, Sayegh S, Baron M, Degboé Y, Boyer J-F, et al. Evidence for tmTNF reverse signaling in vivo: Implications for an arginase-1-mediated therapeutic effect of TNF inhibitors during inflammation. iScience. 2021;24:102331. [CrossRef]
- van de Garde MDB, Martinez FO, Melgert BN, Hylkema MN, Jonkers RE, Hamann J. Chronic exposure to glucocorticoids shapes gene expression and modulates innate and adaptive activation pathways in macrophages with distinct changes in leukocyte attraction. J Immunol. 2014;192:1196–208. [CrossRef]
- Ehrchen J, Steinmüller L, Barczyk K, Tenbrock K, Nacken W, Eisenacher M, et al. Glucocorticoids induce differentiation of a specifically activated, anti-inflammatory subtype of human monocytes. Blood. 2007;109:1265–74. [CrossRef]
- van Gestel AM, Prevoo ML, van ’t Hof MA, van Rijswijk MH, van de Putte LB, van Riel PL. Development and validation of the European League Against Rheumatism response criteria for rheumatoid arthritis. Comparison with the preliminary American College of Rheumatology and the World Health Organization/International League Against Rheumatism Criteria. Arthritis Rheum. 1996;39:34–40. [CrossRef]
- Chorley BN, Campbell MR, Wang X, Karaca M, Sambandan D, Bangura F, et al. Identification of novel NRF2-regulated genes by ChIP-Seq: influence on retinoid X receptor alpha. Nucleic Acids Res. 2012;40:7416–29. [CrossRef]
- Wruck CJ, Fragoulis A, Gurzynski A, Brandenburg L-O, Kan YW, Chan K, et al. Role of oxidative stress in rheumatoid arthritis: insights from the Nrf2-knockout mice. Ann Rheum Dis. 2011;70:844–50. [CrossRef]
- Meusch U, Rossol M, Baerwald C, Hauschildt S, Wagner U. Outside-to-inside signaling through transmembrane tumor necrosis factor reverses pathologic interleukin-1beta production and deficient apoptosis of rheumatoid arthritis monocytes. Arthritis Rheum. 2009;60:2612–21. [CrossRef]
- Nguyen DX, Cotton A, Attipoe L, Ciurtin C, Doré CJ, Ehrenstein MR. Regulatory T cells as a biomarker for response to adalimumab in rheumatoid arthritis. J Allergy Clin Immunol. 2018;142:978-980.e9. [CrossRef]
- Paoletti A, Ly B, Bitoun S, Nocturne G, Rivière E, Manson JJ, et al. Restoration of Default Blood Monocyte-Derived Macrophage Polarization With Adalimumab But Not Etanercept in Rheumatoid Arthritis. Front Immunol. 2022;13:832117. [CrossRef]
- Stuhlmüller B, Häupl T, Hernandez MM, Grützkau A, Kuban R-J, Tandon N, et al. CD11c as a transcriptional biomarker to predict response to anti-TNF monotherapy with adalimumab in patients with rheumatoid arthritis. Clin Pharmacol Ther. 2010;87:311–21. [CrossRef]
- Meusch U, Krasselt M, Rossol M, Baerwald C, Klingner M, Wagner U. In vitro response pattern of monocytes after tmTNF reverse signaling predicts response to anti-TNF therapy in rheumatoid arthritis. J Transl Med. 2015;13:256. [CrossRef]
- Deora A, Hegde S, Lee J, Choi C-H, Chang Q, Lee C, et al. Transmembrane TNF-dependent uptake of anti-TNF antibodies. MAbs. 2017;9:680–95. [CrossRef]
- Watts AD, Hunt NH, Wanigasekara Y, Bloomfield G, Wallach D, Roufogalis BD, et al. A casein kinase I motif present in the cytoplasmic domain of members of the tumour necrosis factor ligand family is implicated in “reverse signalling.” EMBO J. 1999;18:2119–26. [CrossRef]
- Kirchner S, Boldt S, Kolch W, Haffner S, Kazak S, Janosch P, et al. LPS resistance in monocytic cells caused by reverse signaling through transmembrane TNF (mTNF) is mediated by the MAPK/ERK pathway. J Leukoc Biol. 2004;75:324–31. [CrossRef]
- Kaymakcalan Z, Sakorafas P, Bose S, Scesney S, Xiong L, Hanzatian DK, et al. Comparisons of affinities, avidities, and complement activation of adalimumab, infliximab, and etanercept in binding to soluble and membrane tumor necrosis factor. Clin Immunol. 2009;131:308–16. [CrossRef]
- Amini Kadijani A, Asadzadeh Aghdaei H, Sorrentino D, Mirzaei A, Shahrokh S, Balaii H, et al. Transmembrane TNF-α Density, but not Soluble TNF-α Level, is Associated with Primary Response to Infliximab in Inflammatory Bowel Disease. Clin Transl Gastroenterol. 2017;8:e117. [CrossRef]
Figure 1.
Variability of induction of NRF2 nuclear translocation by TNFi in HD.
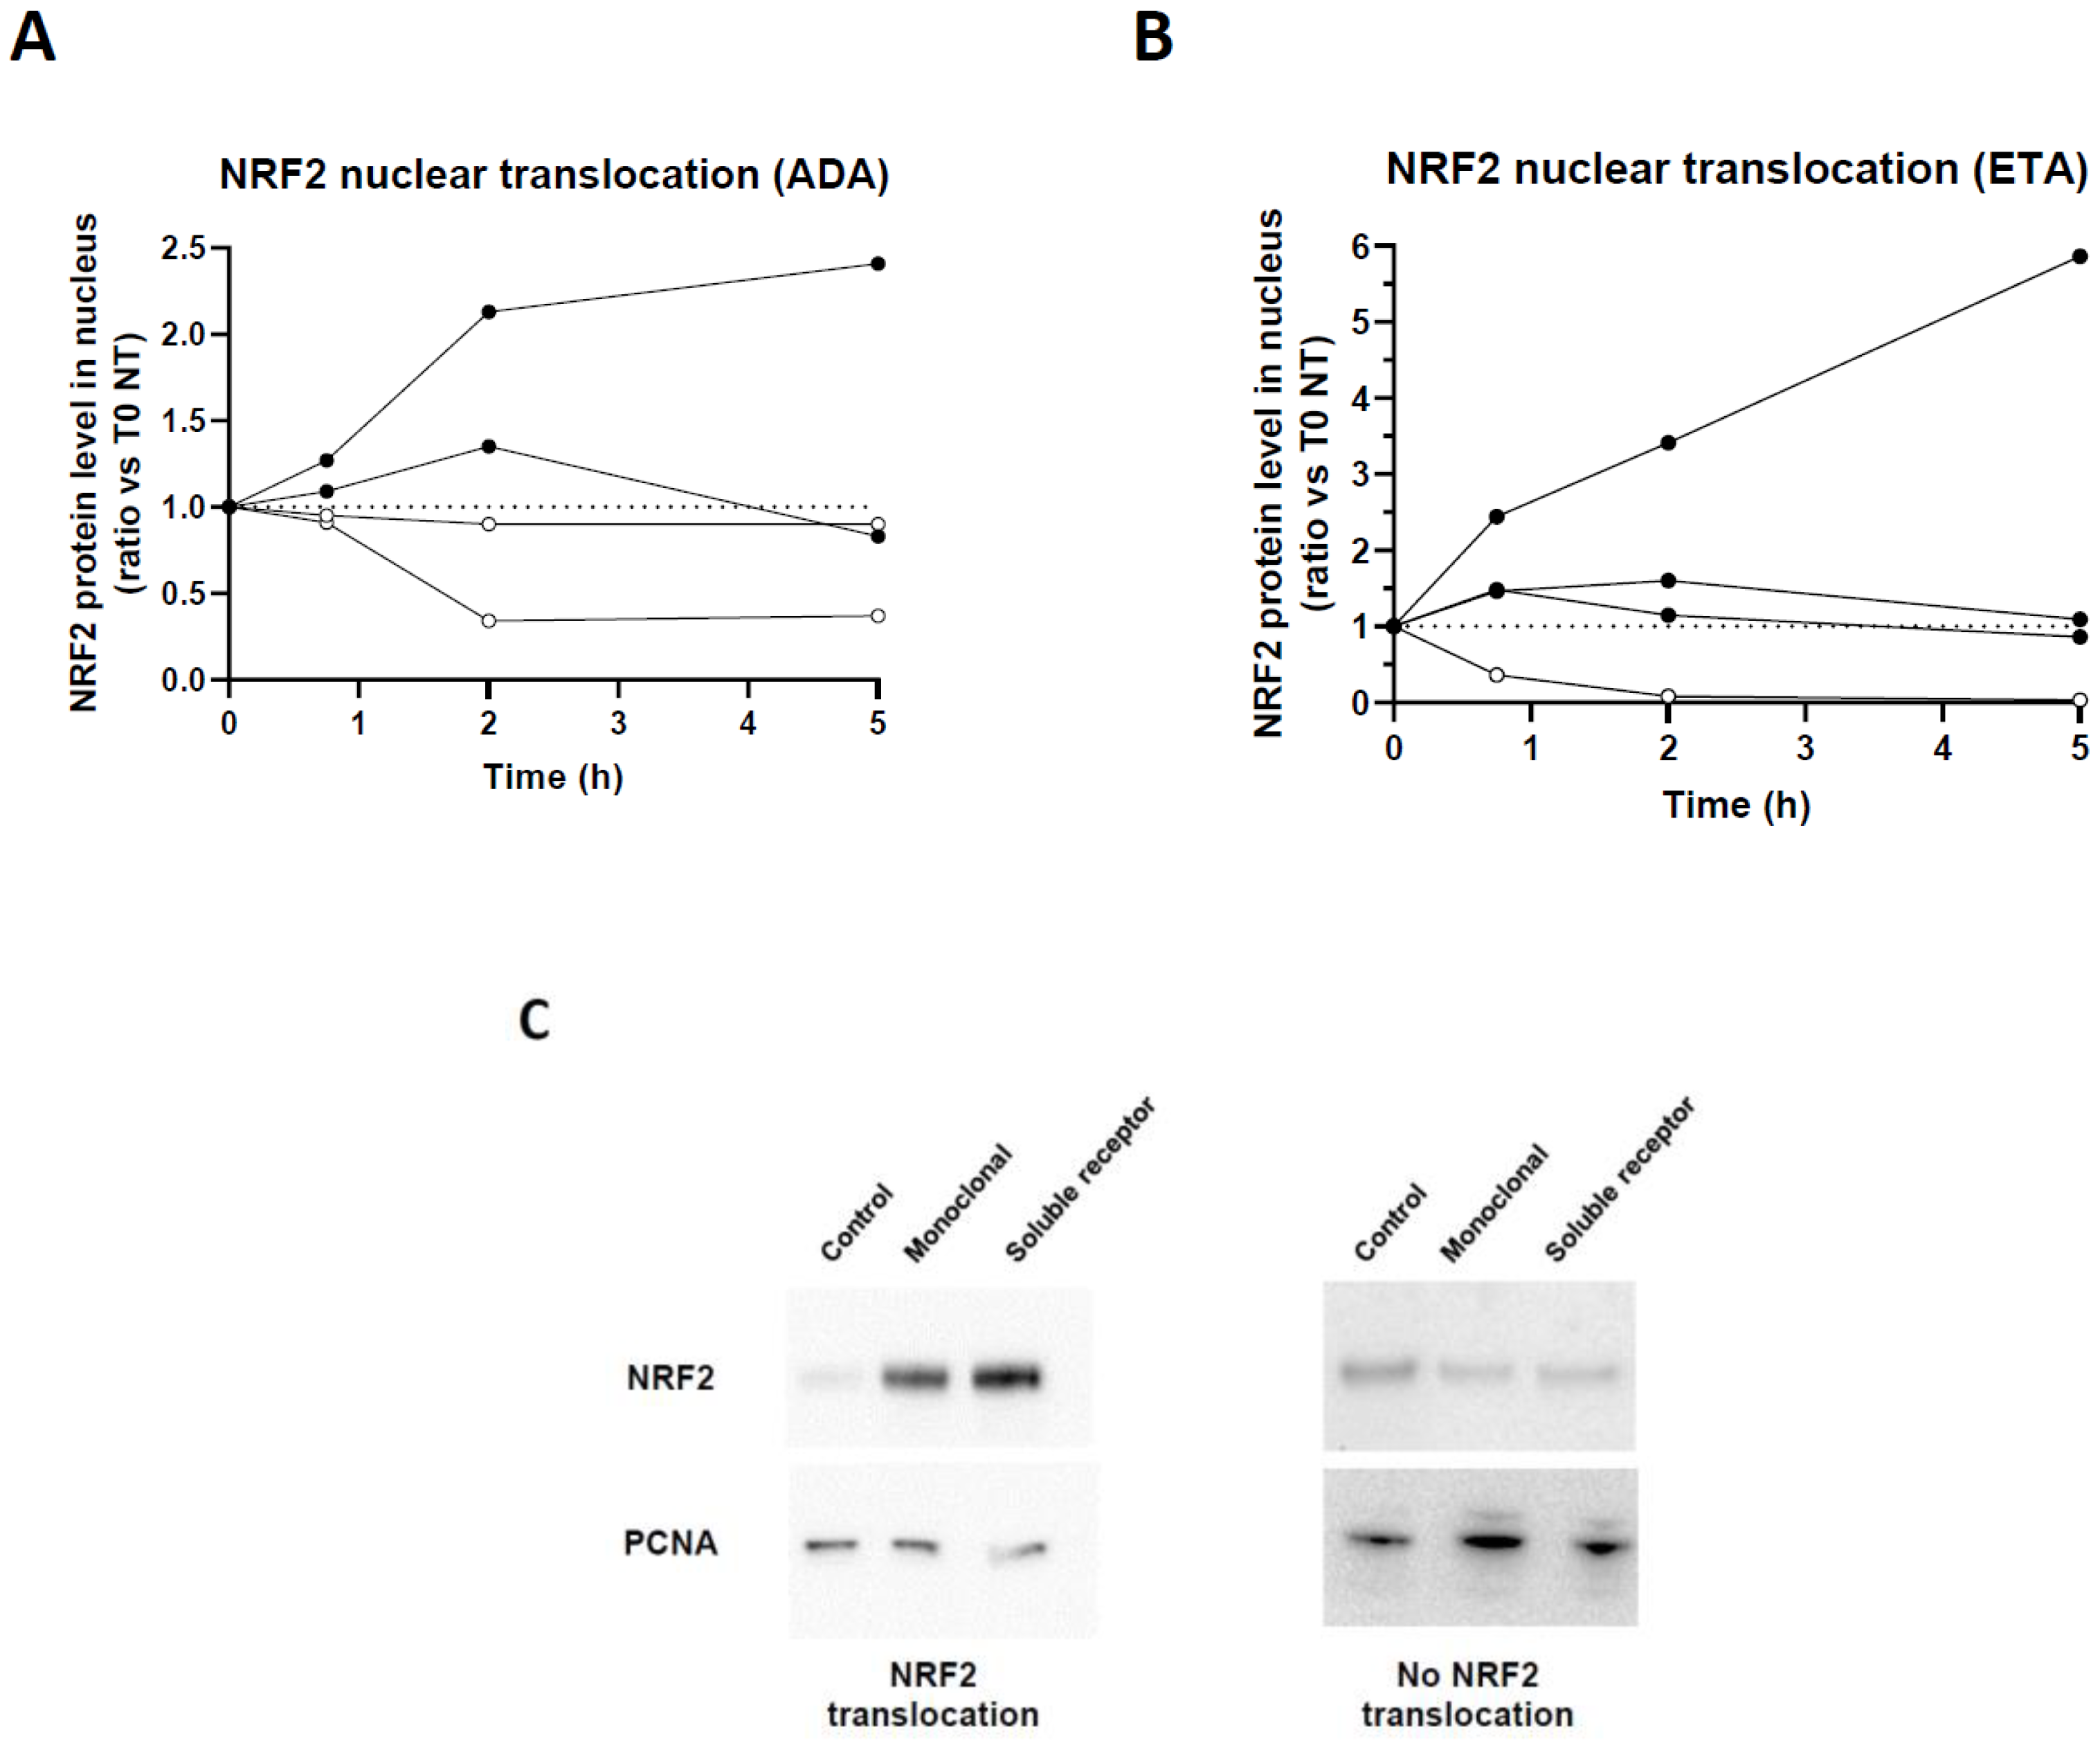
Figure 2.
Identification of target genes indicating a transcriptional activation of tmTNF reverse signaling in HD.
Figure 2.
Identification of target genes indicating a transcriptional activation of tmTNF reverse signaling in HD.
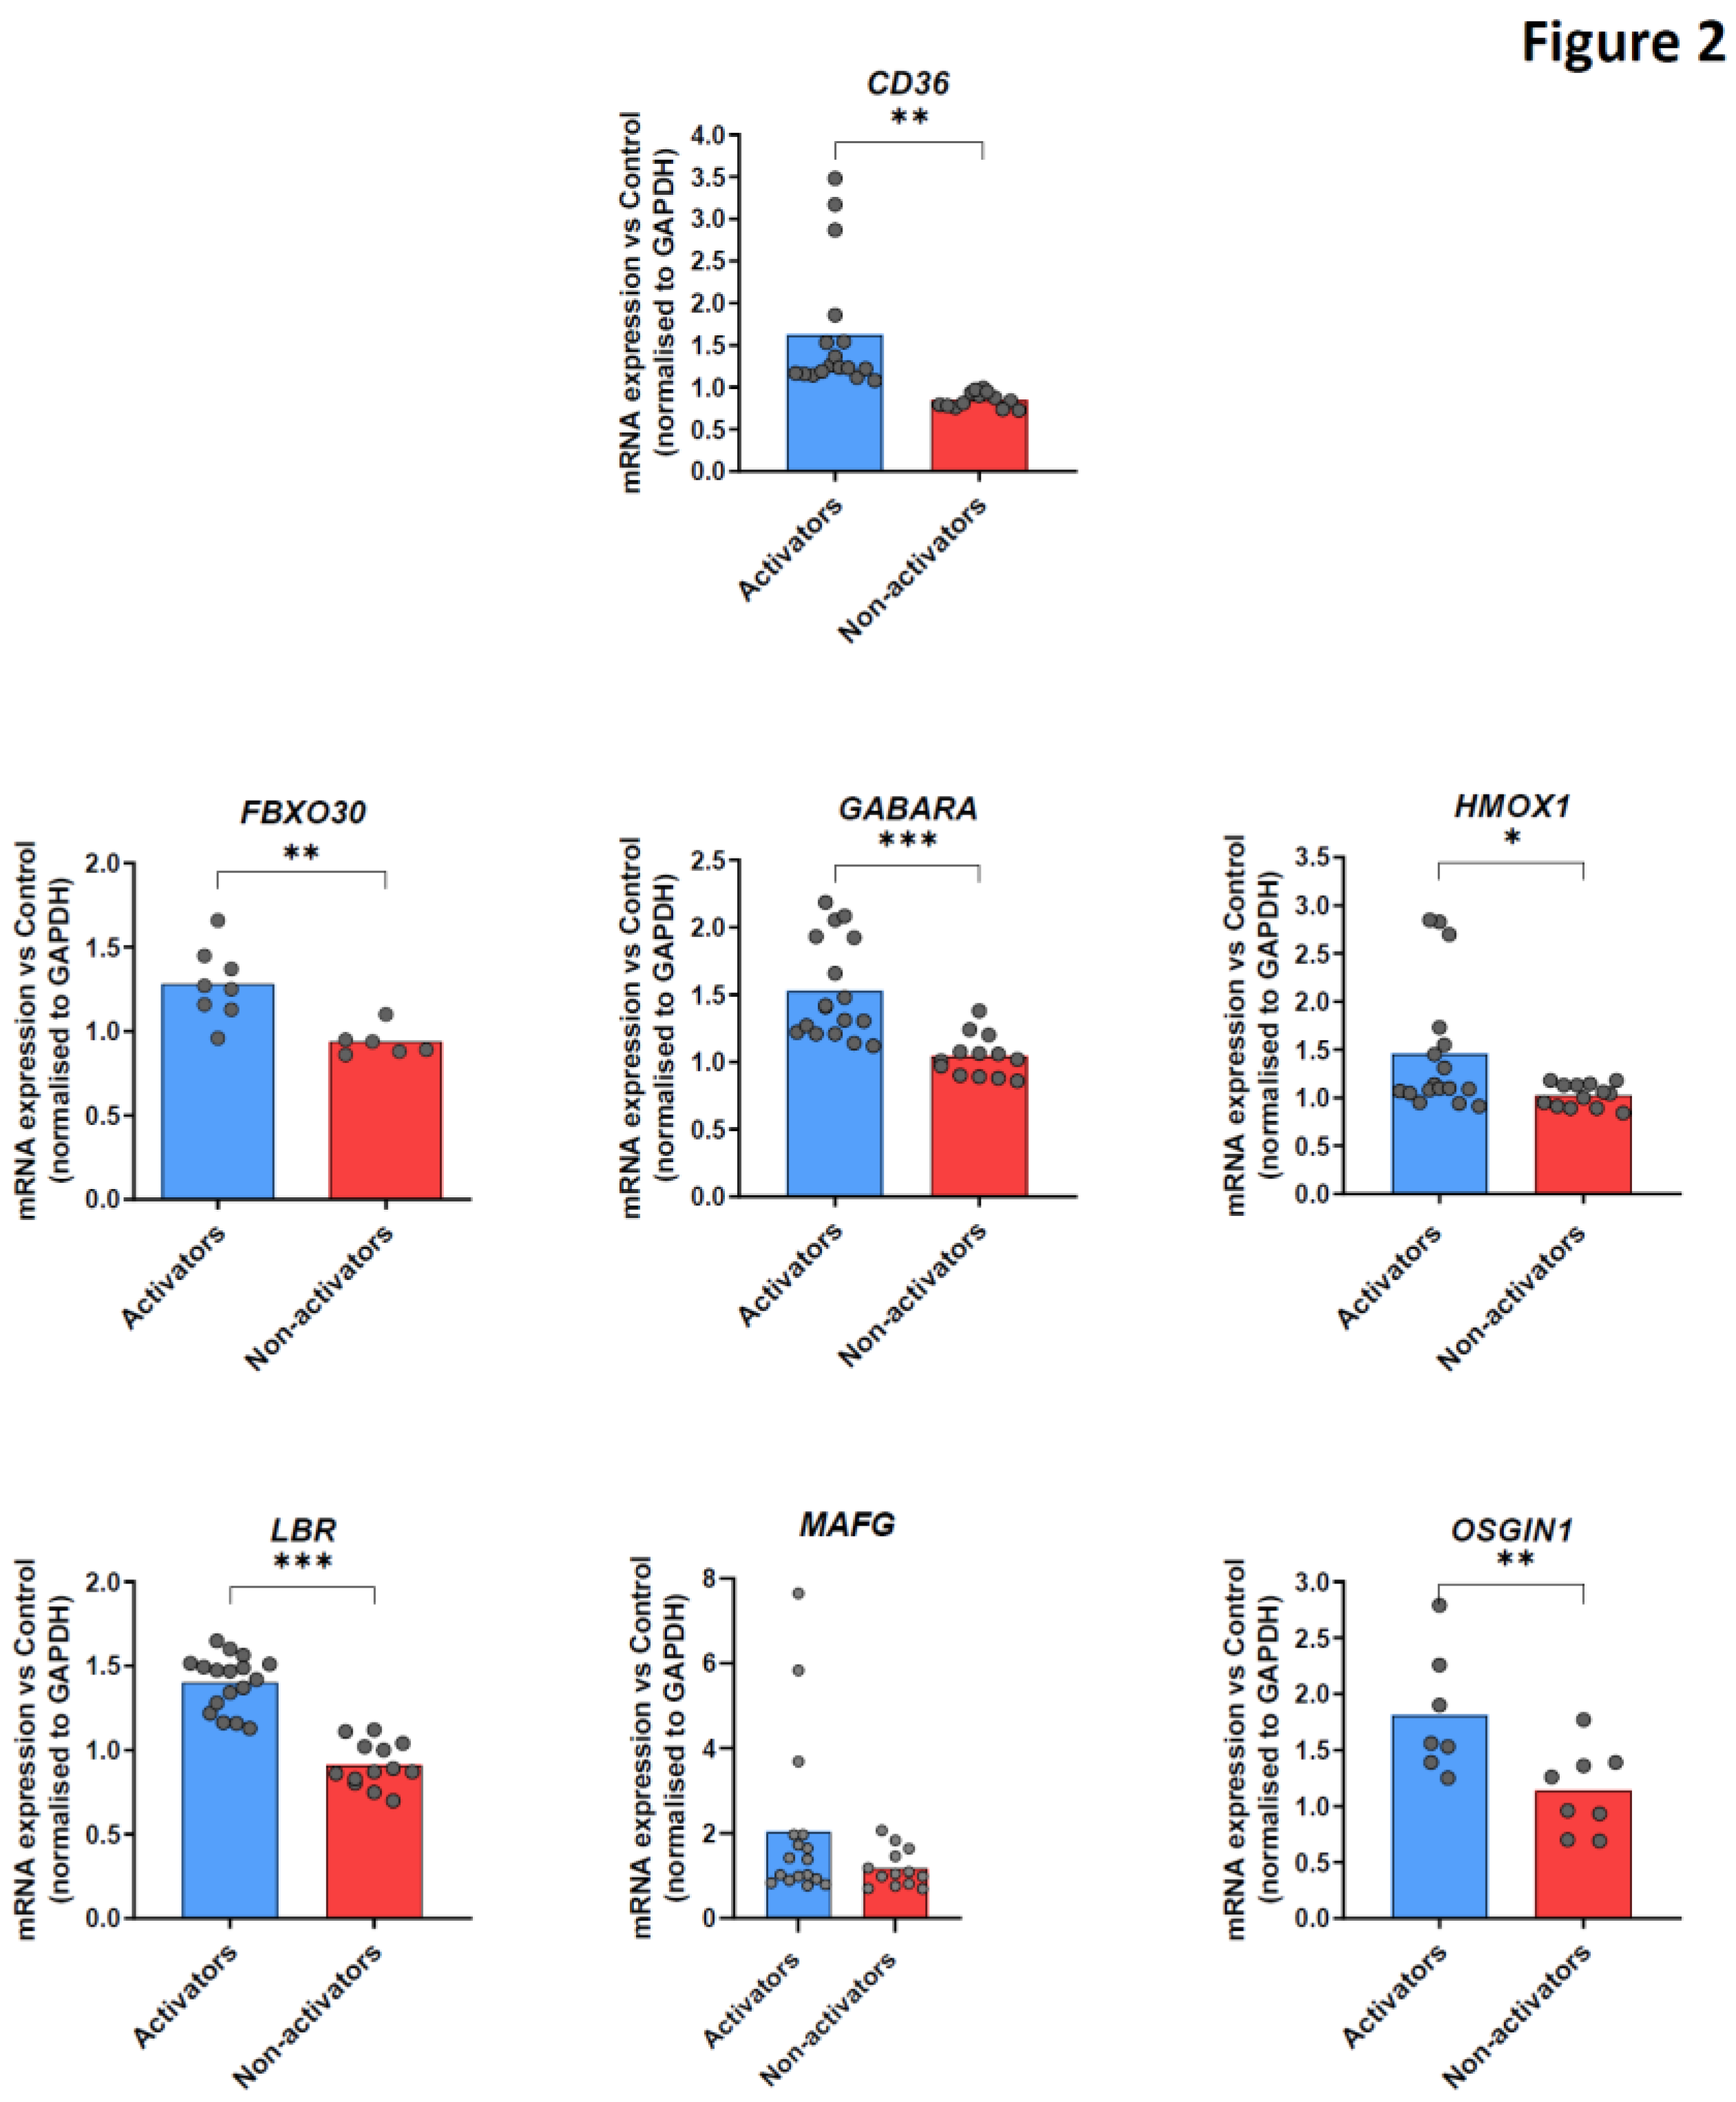
Figure 3.
Identification of experimental variation of mRNA measurement and algorithm for the definition of tmTNF reverse signaling activator/non-activator status. (A) Coefficient of variation (CV) of qPCR experiments was measured by repeating the quantification of cd36 of one sample. mRNA expression was analyzed by technical duplicate and repeated 94 times. Coefficient of variation was calculated by dividing the 94 samples mean by their standard deviation. (B) Algorithm for the definition of tm TNF Reverse signaling activator status. First of all, CD36 mRNA ratio expression (Treated/Untreated) was analyzed and after application of CVR. If this ratio was less than 0.94, individual was classified as non-activator. If CD36 ratio was greater than 1.06, an analysis of NRF2 target genes was necessary. If at least 50% of NRF2 target genes ratio are greater than 1.06 then individual was classified as activator. Otherwise, individual was classified as non-activator. (C) Example of algorithm application. Analysis of RT-qPCR replicates variability and its impact on tmTNF Reverse signaling status classification. 3 replicates of RT-qPCR were performed with 1 or 2 days of interval for a healthy non activator donor and a healthy activator donor. Application of CVR is represented by a scale cut between 0.94 and 1.06 on y axis. Data are presented as mean±SEM of mRNA fold change vs unstimulated control condition normalized to gapdh. (n=3).
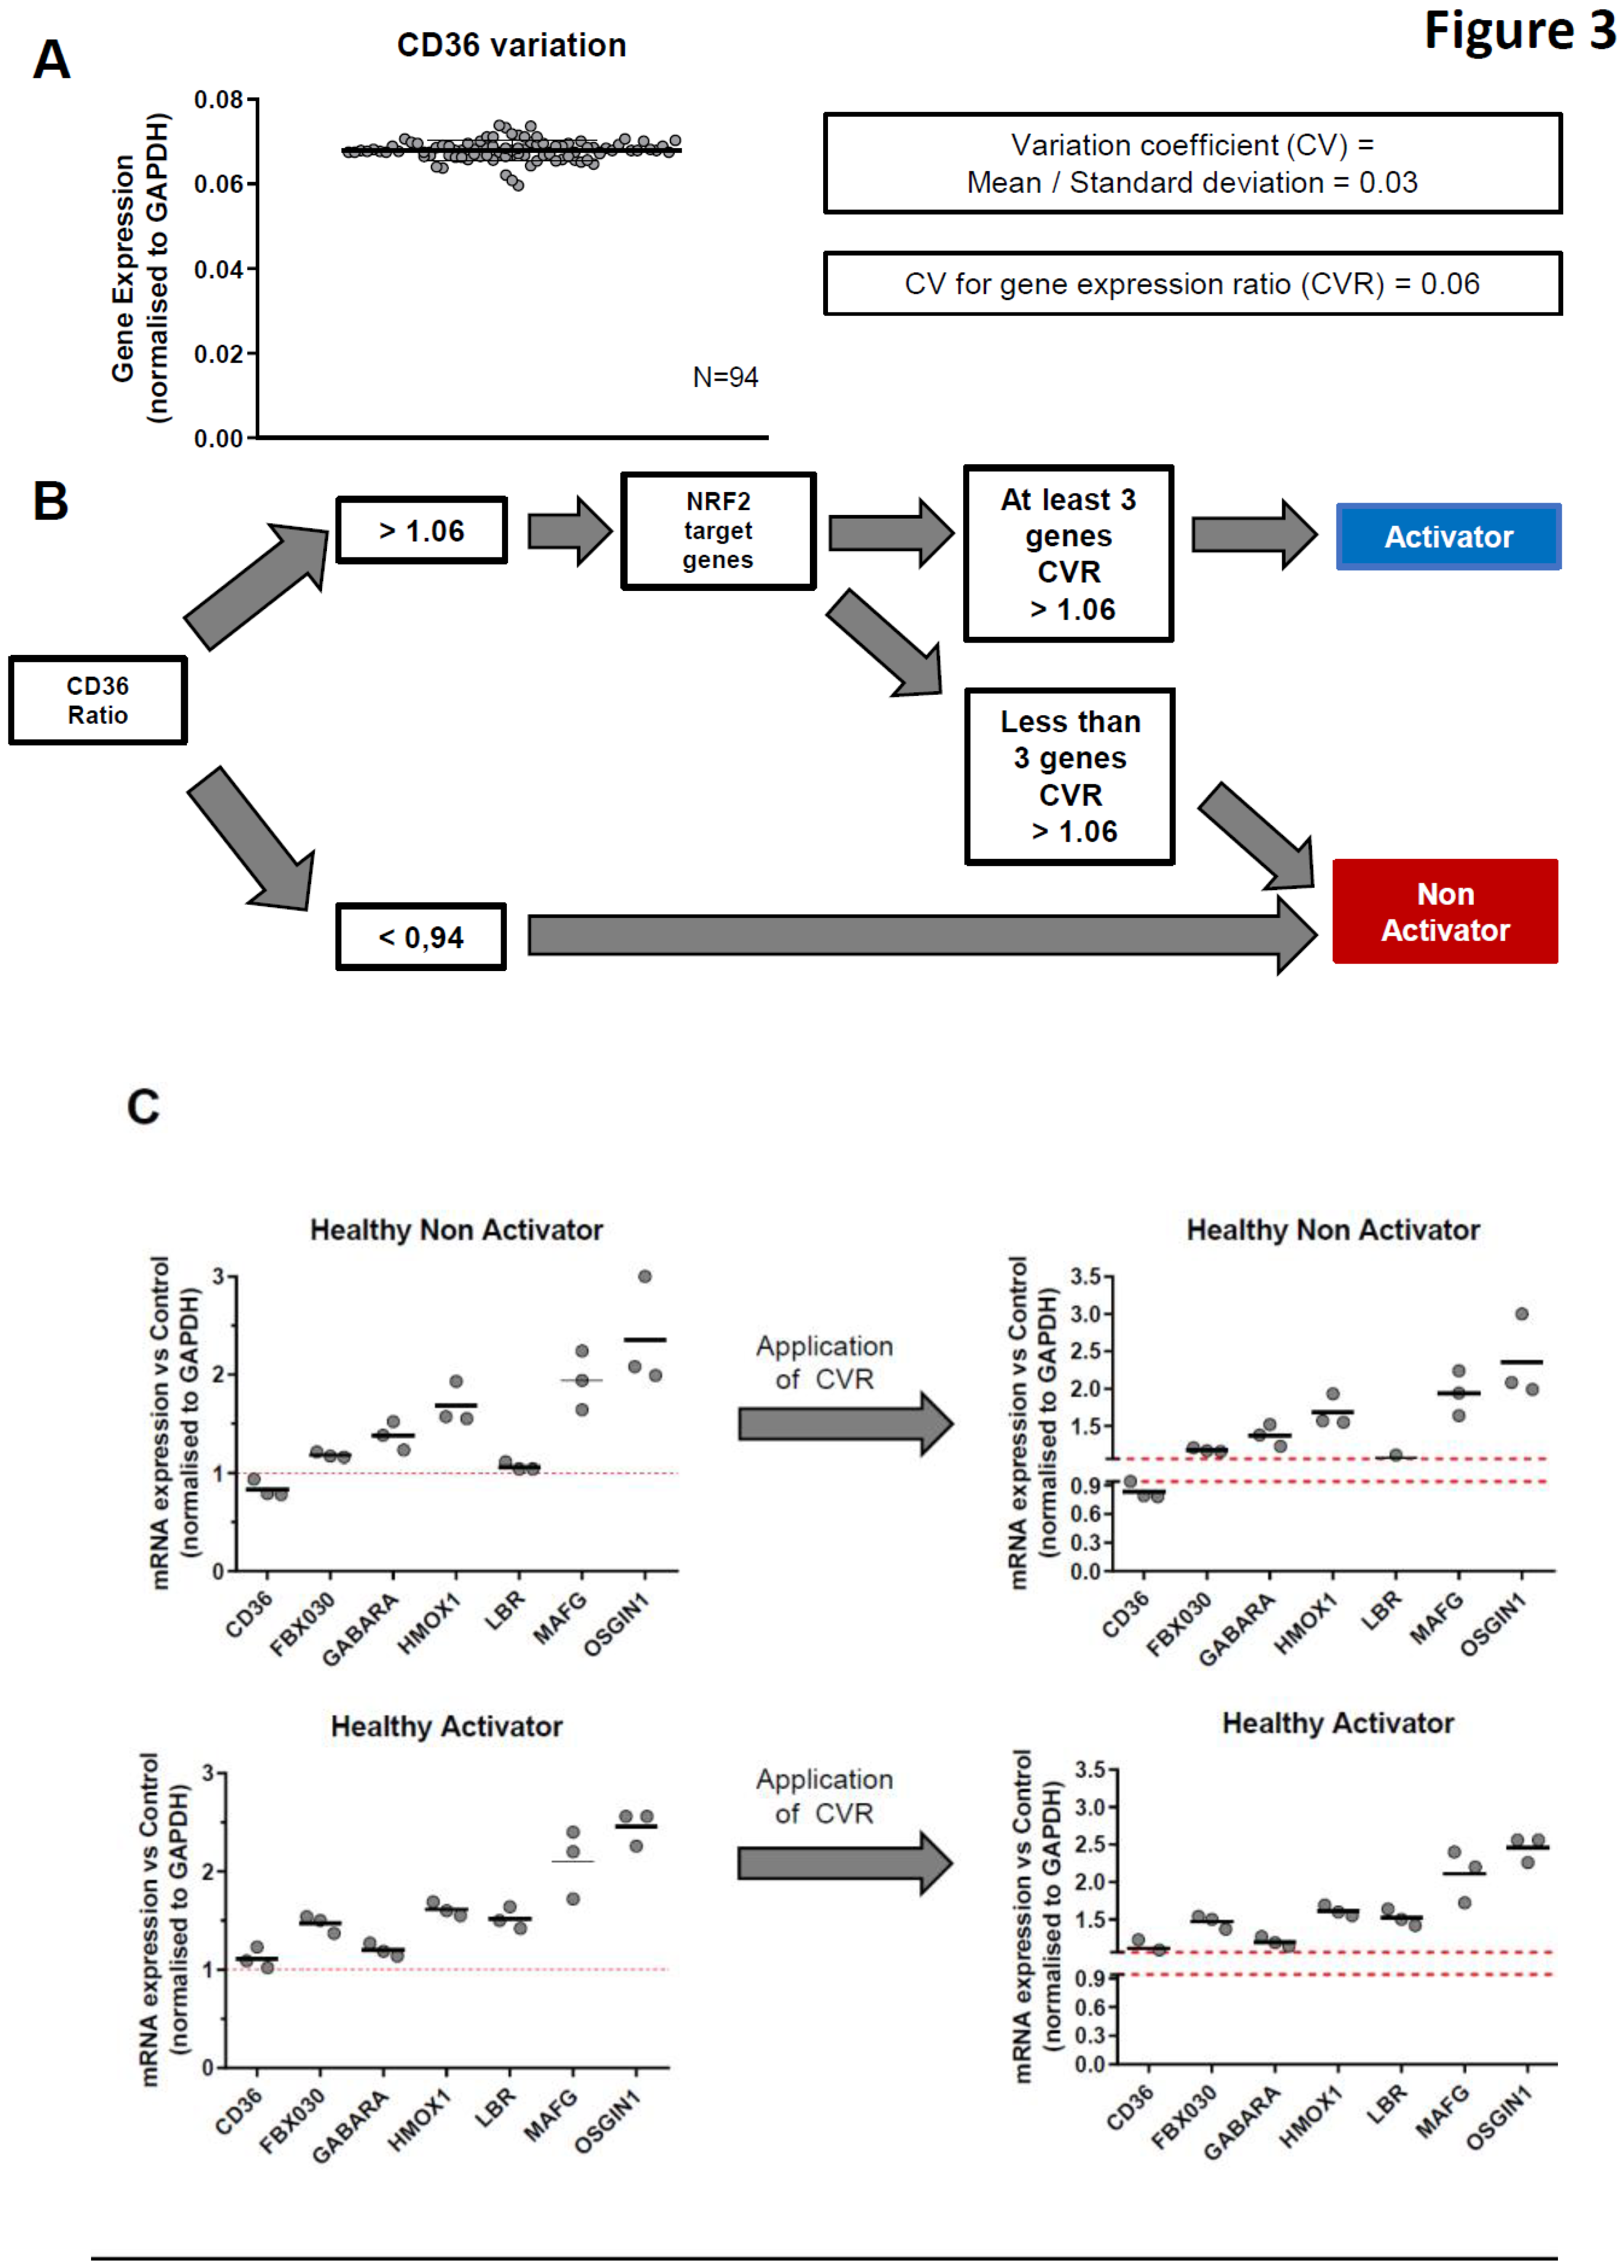
Figure 4.
Experimental protocol to predict TNFi clinical response depending on tmTNF reverse signaling activator status. Active RA Patients blood was collected before initiation of TNFi therapy. CD14+ monocytes are purified prior to being stimulated or not with different TNF blocker (adalimumab for the mAbs class, etanercept for the soluble receptor class) for 16 hours. Cells were harvested and cd36, fbx030, gabara, hmox-1, lbr, mafg and osgin1 mRNA expression analyzed by RT-qPCR. Depending of RT-qPCR results, patients are classified as Activators or Non-activators as a predictive marker of later clinical response. Clinical response was assessed at month-3 according to EULAR response criteria.
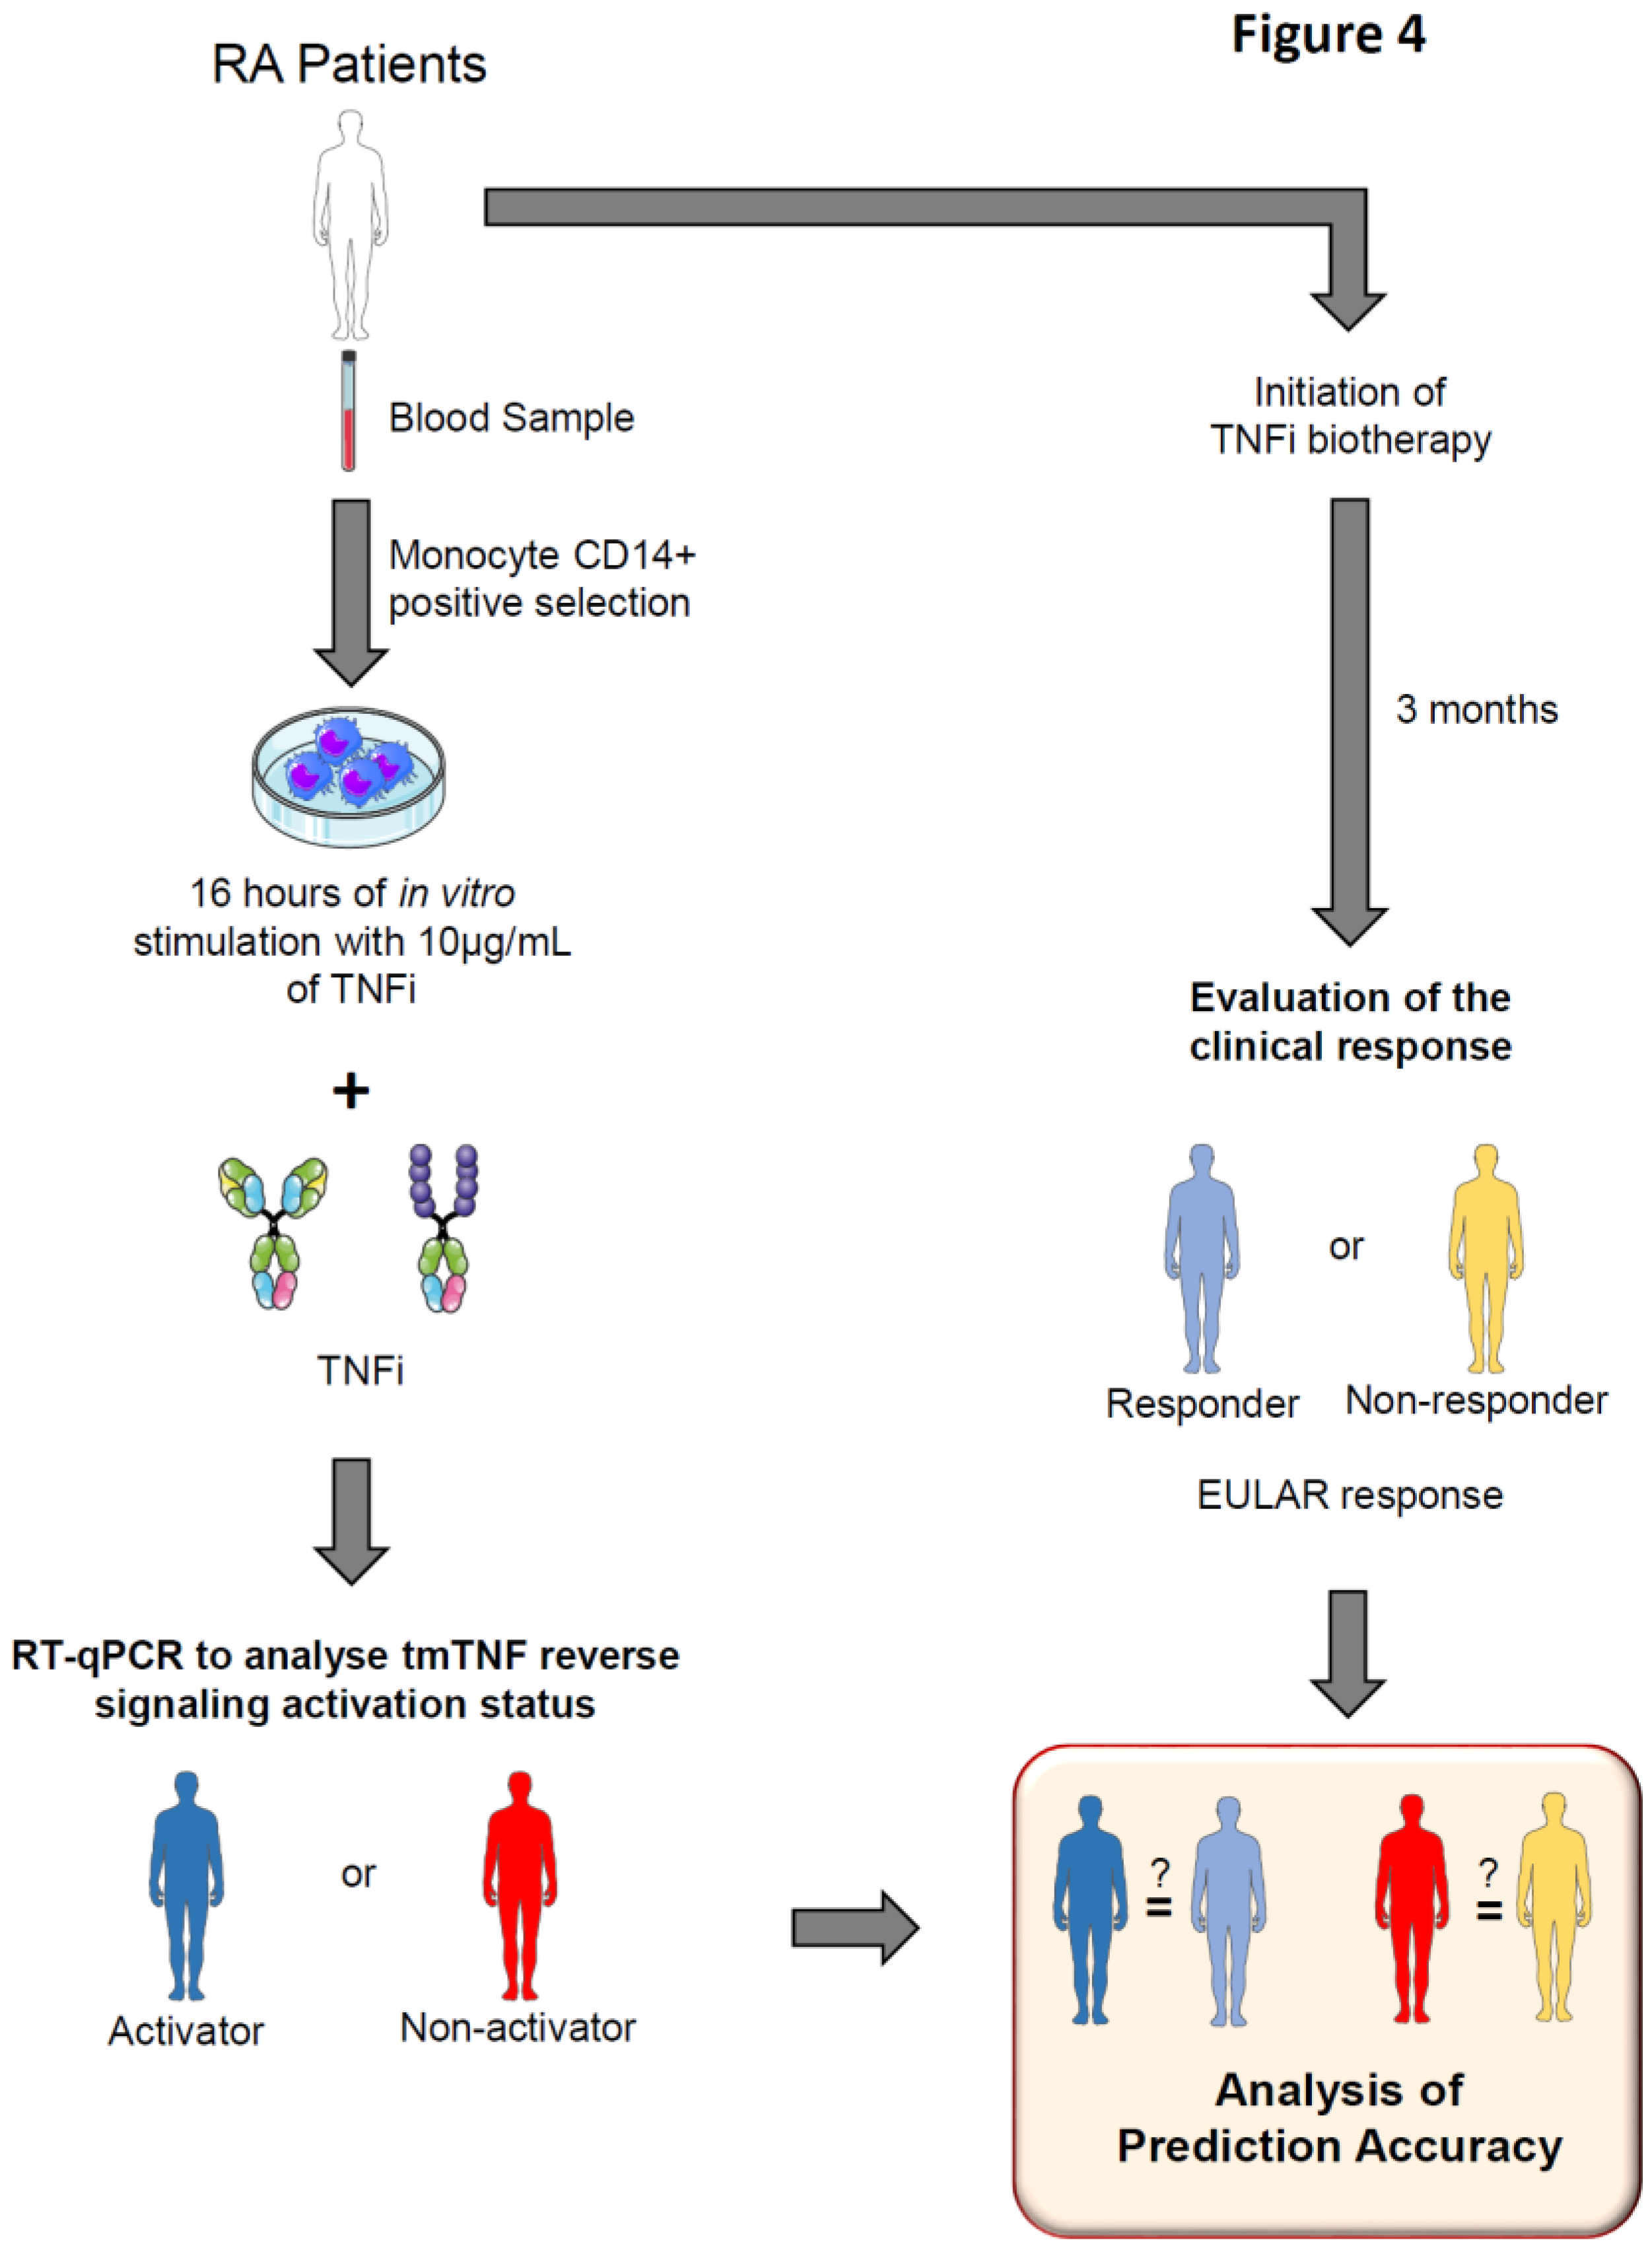

Table 1.
Characteristics of patients at inclusion.
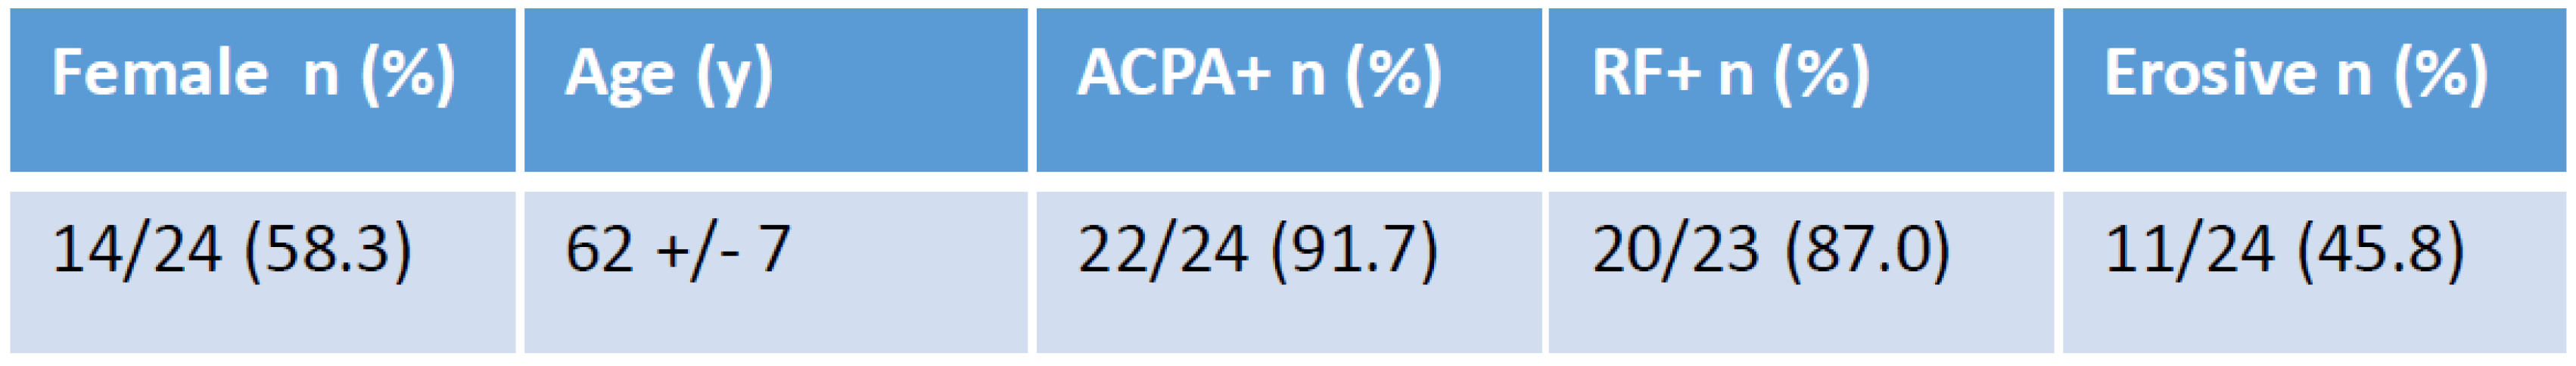
Table 2.
Evaluation of the predictive performance in RA patients. Disease activity (DAS28-CRP), clinical response at month-3 and prediction test for each individual treated with TNF blocker (etanercept/ETA, golimumab/GOLI, adalimumab/ADA or infliximab/IFX).
Table 2.
Evaluation of the predictive performance in RA patients. Disease activity (DAS28-CRP), clinical response at month-3 and prediction test for each individual treated with TNF blocker (etanercept/ETA, golimumab/GOLI, adalimumab/ADA or infliximab/IFX).
Disclaimer/Publisher’s Note: The statements, opinions and data contained in all publications are solely those of the individual author(s) and contributor(s) and not of MDPI and/or the editor(s). MDPI and/or the editor(s) disclaim responsibility for any injury to people or property resulting from any ideas, methods, instructions or products referred to in the content. |
© 2024 by the authors. Licensee MDPI, Basel, Switzerland. This article is an open access article distributed under the terms and conditions of the Creative Commons Attribution (CC BY) license (http://creativecommons.org/licenses/by/4.0/).
Copyright: This open access article is published under a Creative Commons CC BY 4.0 license, which permit the free download, distribution, and reuse, provided that the author and preprint are cited in any reuse.


