
Submitted:
18 August 2023
Posted:
19 August 2023
You are already at the latest version
Abstract
Acute lymphoblastic leukemia (ALL) is the most common childhood cancer. Although prognosis continually improved along years, a significant proportion of patients still relapse from the disease due to leukemia resistance to therapy. Methotrexate (MTX), a folic acid antagonist, is a chemotherapy agent commonly used against ALL and a immune-system suppressant for rheumatoid arthritis, that presents multiple and complex mechanisms of action and resistance. Previous studies have shown that MTX modulates the nuclear factor kappa B (NF-κB) pathway, an important family of transcription factors involved in inflammation, immunity, cell survival, and proliferation, frequently hyperactivated in ALL. Using gene set enrichment analysis (GSEA) on publicly available gene expression data from 161 newly diagnosed pediatric ALL patients, we found “TNF-α signaling pathway” to be the most enriched Cancer Hallmark in MTX poor responder patients. Transcriptomic analysis in a panel of ALL cell lines (6 BCP-ALL and 7 T-ALL) also identified the same pathway as differentially enriched among MTX resistant cell lines, as well as in slowly dividing cells. To better understand the crosstalk between NF-κB activity and MTX resistance, we genetically modified the cell lines to express luciferase under a NF-κB biding site promoter. We observed that the fold change in NF-κB activity triggered by TNF-α (but not MTX) treatment correlated with MTX resistance and proliferation across the lines. At the individual gene level, NFKB1 expression was directly associated with a poorer clinical response to MTX, and with both an increased TNF-α-triggered NF-κB activation and MTX resistance in the cell lines. Despite these results, pharmacological inhibition (with BAY 11-7082 and parthenolide) or stimulation (with exogenous TNF-α supplementation) of the NF-κB pathway did not alter MTX resistance of the cell lines significantly, evidencing a complex interplay between MTX and NF-κB in ALL.
Keywords:
acute lymphoblastic leukemia
; methotrexate
; NF-κB
; TNF-α
; drug resistance
Introduction
Methotrexate (MTX), a folic acid antagonist, has been a cornerstone agent in the treatment of acute lymphoblastic leukemia (ALL) for over 70 years. As an antimetabolite, MTX primarily disturbs cellular homeostasis through its impact on cellular metabolism, whose unbalance irradiates in a multiple and complex fashion. Despite its widespread use in clinics, MTX’s mechanisms of action, however, seem not to be fully understood.
High doses of MTX are used in cancer treatment, in which MTX inhibition of dihydrofolate reductase (DHFR) prevents the sequential conversion of folic acid to dihydrofolate (DHF) and tetrahydrofolate (THF), halting the synthesis of nucleotides and the methionine-homocysteine cycle – the main source of methyl radicals used by the cell –, resulting in cell death. In autoimmune diseases such as rheumatoid arthritis (RA), low-dose MTX inhibits the bifunctional purine biosynthesis protein PURH (ATIC), which blocks the conversion of aminoimidazole carboxamide ribonucleotide (AICAR) into inosine monophosphate (IMP), thus ceasing purine and adenosine synthesis – the latter, a potent pro-inflammatory metabolite. In this context, MTX anti-inflammatory effect was shown to be exerted through the decrease of nuclear factor kappa B (NF-κB) activity, by increasing lincRNA-p21 levels through a DNA-dependent protein kinase catalytic subunit (DNA PKcs) mechanism [1] – an effect that was abrogated by folinic acid supplementation [2]. MTX was also shown to inhibit the degradation of NF-κB repressor, IkB-α [3], and reduced levels of phosphorylated RelA (p65) were found in RA patients receiving low-dose MTX therapy [2].
The NF-κB family is an important family of transcription factors involved in inflammation, immunity, cell survival, and proliferation. It responds to stimuli such as stress, cytokines, free radicals, ultraviolet radiation, LDL oxidation and antigens [4,5,6]. For instance, basal NF-κB activity is required for hematopoietic stem cells (HSCs) self-renewal and differentiation into myeloid and lymphoid lineages [7]. Aberrant activation of this transcription factor is frequently encountered in cancer [8] – including hematological malignancies [9]. In fact, tumor necrosis factor alpha (TNF-α), the cytokine that triggers NF-κB signaling, is involved in all stages of leukemogenesis: from cell transformation, proliferation, angiogenesis and extramedullary infiltration; to its participation in the tumor microenvironment and in leukemic cells’ immune evasion, survival and resistance to chemotherapy [10]. Constitutive NF-κB signaling has been detected in 40% of acute myeloid leukemia (AML) cases and its aberrant activity enable leukemia cells to evade apoptosis and stimulate proliferation [11].
Although recent genomic studies did not highlight mutations in NF-κB genes [12], these transcription factors seem to be constitutively activated in ALL [13,14,15]. Importantly, the NF-κB pathway may be implicated in therapy resistance as well. For instance, NF-κB subunit RelA (p65) was an independent prognostic marker of survival with the capacity to predict the duration of response to therapy in chronic lymphocytic leukemia (CLL) [16]. In childhood acute lymphoblastic leukemia (ALL), up-regulation of the NF-κB signaling has been associated with poor outcome [17]- [19]. High levels of TNF-α were found in the plasma of ALL patients [20], being these values associated with higher white blood cell count at diagnostics [21] and worse outcome in childhood ALL [22].
By analyzing publicly available gene expression data from a cohort of 161 pediatric ALL patients [23], we confirmed the association between overexpression of the NF-κB signaling pathway and white blood cells count after “up-front” in vivo MTX treatment, suggesting a link between the NF-κB pathway, drug resistance and, ultimately, disease outcome. We investigated the transcriptional state of the NF-κB pathway in a panel of ALL cell lines – corroborating in vitro the findings on patients’ gene expression data – and generated stable transduced ALL cell lines expressing an NF-κB reporter construct that incorporate a copy of the firefly luciferase gene containing an NF-κB binding site within its promoter region. As a result, the synthesis of luciferase (and subsequent luminescence) was directly proportional to the level of active NF-κB present within the cell, allowing the association between gene expression and NF-κB activity. Lastly, pharmacological modulation of the NF-κB pathway was also performed aiming to understand the relation between modulation of NF-κB activity and MTX resistance.
Material and Methods
Cell lines. Six B-cell precursor (Nalm6, Nalm16, Nalm30, REH, RS4;11 and 697) and 7 T-ALL cell lines (ALL-SIL, CCRF-CEM, HPB-ALL, Jurkat, Molt-4, P12-ICHIKAWA and TALL-1) were studied. The cells were cultured in RPMI-1640 culture medium (Cultilab, Campinas, Brazil) supplemented with 10% fetal bovine serum (Cultilab), penicillin 100 IU/ml and 100 μg/ml streptomycin (Sigma-Aldrich, St Louis, MI, USA), and maintained at 37 °C and 5% CO2 atmosphere in all experiments.
Reagents. Methotrexate (MTX) and all other compounds were purchased from Sigma-Aldrich. Human recombinant TNF-αlpha was purchased from Peprotech (Rocky Hill, NJ, USA). All reagents were diluted according to the manufacturer’s instructions, being the stock solutions stored at -20 °C. Dilutions of the compounds to be used in the experiments were prepared only at the time of use.
Primary ALL gene expression and GSEA analysis. The gene expression data analyzed in this work was taken from the work of Sorich et al. [23] (GEO accession number GSE10255). Samples hybridization was done on HG-U133A Arrays (Affymetrix, Santa Clara, CA, USA). Expression values were obtained with the iterPLIER+16 algorithm and expressed in a Log2 scale. Gene set enrichment analysis (GSEA [24]) was performed by the GSEA software (https://www.gsea-msigdb.org/gsea/index.jsp) using ∆WBC count at day 3 (please see Sorich et al. [23] for more details about how ∆WBC was calculated) as a continuous phenotype and using Pearson’s metric for ranking genes.
Cell lines gene expression and ssGSEA analysis. Cell lines (5 to 10 × 106 cells) in the exponential growth phase were maintained overnight in fresh culture medium and then had their RNA extracted using the Illustra RNAspin Mini Kit (GE Healthcare Life Sciences, Pittsburgh, PA, USA). Samples were processed with the One-Cycle Target Labeling and Control Reagents Kit (Affymetrix, Santa Clara, CA, USA) and hybridized on HG-U133 Plus 2.0 Arrays (Affymetrix). Expression values were obtained with the iterPLIER+16 algorithm and expressed in a Log2 scale. For additional details, please see Silveira et al. [25]. Single sample gene set enrichment analysis (ssGSEA [24]) of Cancer Hallmarks was run using the “ssgsea-gui.r” script from the “SSGSEA 2.0” library (github.com/broadinstitute/ssGSEA2.0). The heatmap for visualization of Cancer Hallmarks’ normalized enrichment scores (NES) was created using the “heatmap.2” function from the “gplots” library in R (version 4.3.0); hierarchical clustering was performed using the “complete” method, and the Euclidean distance was used to compute the distances between the rows of the matrix.
Cell viability assays. Eighty microliters of a cell suspension (4 x 10⁵ cells/ml) were seeded in each well in a 96-well cell culture plate, followed by twenty microliters of culture medium containing MTX or other drug. Negative controls received only vehicle. Each dose was tested in three biological replicates. Experiments with TNF-α supplementation had the cytokine added once a day over the course of 4 days. After the desired treatment period, the conditioned medium in the wells was replaced with 0.2ml of phosphate buffer (PBS 1 X) containing 2 μmol/l of calcein AM (Sigma-Aldrich). The culture plates rested for 30 min before fluorescence reading (excitation/emission: 492/518 nm). To account for the heterogeneous cell distribution, fluorescence of each well was measured at 25 points (a 5x5 scan matrix) being the values integrated (summed) afterwards. Alternatively, the MTT (thiazolyl blue tetrazolium bromide, Sigma-Aldrich) reduction test was used to determine cell viability. Once completed the treatment period, 20 μl of MTT (5 mg/ml) were added to each well, following 4 h of incubation. The formazan crystals produced were dissolved by adding a 0.1 ml of a 10 mM HCl, 10% dodecyl sulfate solution. After overnight incubation, absorbance was measured at 570 nm. Survival at each dose was determined in relation to negative control. The use of calcein AM or MTT is indicated in each case.
Determination of the doubling time. Two hundred microliters of a 2.5 x 10⁵ cell/ml suspension were seeded per well, in triplicates, in a 96-well culture plate. Fifteen microliters of the cell suspension were collected daily for cell count under the microscope (exclusion by trypan blue). The doubling time of each cell line was determined from the proliferation curves obtained.
Transduction with NF-κB reporter vector. One hundred and forty microliters of a cell suspension (2.15 x 10⁵ cells/ml) were seeded in a 96-well culture plate. Ten microliters of a commercial viral suspension (Cignal Lenti NFκB Reporter (luc) Kit, CLS-013L, Qiagen) were added into each well with polybrene (8 μl/ml), resulting in a multiplicity of infection (MOI) around 11 viral particles/cell. Transduction controls, in which the commercial viral suspension was replaced by culture medium, were also prepared. Cells were subjected to a spin infection of 60 min at 580 g and 37 °C, followed by 24 h of incubation. One hundred and twenty microliters of the conditioned medium were replaced with fresh culture medium, following another incubation of 48 h. Puromycin (1.5 μl/ml) was then added to the culture medium for selection of the transduced cells.
Luminescence assay with transduced cells. 1.5 x 10⁵ cells were suspended in 100 μl of culture medium and seeded in a 96 well culture plate in the presence of either MTX (100 nmol/l), TNF-α (100 ng/ml) or vehicle. Following incubation, plates were centrifuged for 15 min at 400 g, being the supernatant discarded by inversion. Seventy-five microliters of phosphate buffered saline (PBS 1X) and the same volume of a luciferin solution (Dual Glo Luciferase, Promega, Madison, USA) were added to each well. After 10 min of incubation, luminescence was measured on a Synergy H1 Hybrid Reader (Biotek Instruments, Winooski, USA). Luminescence of each well was measured at 25 points (a 5x5 scan matrix, with acquisition gain at maximum) being values integrated (summed) afterwards.
Statistical analysis.t-tests and Mann-Whitney analysis, estimates of IC50 values and proliferation rates, dose-response curves and correlation plots were made in Prism (v.9, GraphPad Software, La Jolla, USA). Spearman correlation coefficient was preferred instead of Pearson´s given the non-parametric nature of the data. P-values ≤ 0.05 were considered significant.
Results
The NF-κB Signaling Pathway is Overexpressed in MTX-Resistant Primary ALL
We investigated the clinical relevance of the NF-κB pathway in the context of MTX resistance by analyzing the publicly available gene expression data of a cohort of 161 therapy naïve, newly diagnosed pediatric ALL cases. In this work of Sorich et al. [23], the authors had demonstrated that a high white blood cell (WBC) count following MTX single agent frontline therapy was predictive of shorter long-term disease-free survival. We wanted to investigate whether the NF-κB signaling pathway was associated with WBC following MTX treatment. For this purpose, we performed a gene set enrichment analysis (GSEA [24]), checking for the enrichment of the 50 Cancer Hallmarks. We found that “TNF-α signaling via NF-κB” was the most enriched Hallmark associated with high post-MTX WBC count (and, thus, linked to bad prognosis) (Figure 1a,b). We performed the same analysis only for the top (n=40) and bottom (n=40) quartiles of the patients, named as “poor” and “good” responders to MTX, respectively; again, “TNF-α signaling via NF-κB” was significantly enriched among poor responders (Supplementary Figure S1a,b).
The NF-κB transcription factor family in mammals consists of five proteins: p65 (RelA), RelB, c-Rel, p105/p50 (NF-κB1), and p100/52 (NF-κB2) that associate with each other to form distinct transcriptionally active homo- and heterodimeric complexes [26]. We performed a unpaired t-test to investigate whether the NF-κB family genes (NFKB1, NFKB2, RELA, RELB, REL) were differentially expressed in poor versus good responders. We found that NFKB1 and REL were overexpressed in poor responders compared to good responders (Figure 1c,d), whereas the other NF-κB family genes (NFKB2, RELA and RELB) were not differentially expressed (Supplementary Figure S1c–e).
Expression of the NF-κB Signaling Pathway is Associated with MTX Resistance in a Panel of ALL Cell Lines
To investigate if the same direct relation between “TNF-α signaling pathway via NF-κB” and MTX resistance found in primary samples was also observed in vitro in a panel of ALL cell lines, we performed a single-sample gene set enrichment analysis (ssGSEA [24]) to identify the differentially expressed Cancer Hallmarks across the cell lines. Our analysis showed that, while most of the Hallmarks were either over or under-expressed uniformly among the cell lines, a small subset of Hallmarks presented differential enrichment scores across the lineages – including “TNF-α signaling via NF-κB” (Figure 2a) – with BCP-ALL cell lines exhibiting a higher ssGSEA normalized enrichment score (NES) compared to T-ALL cell lines (Figure 2b).
In a previous study [27], we treated ALL cell lines with increasing doses of MTX for 48 or 96 h and determined their resistance to the drug (IC50 values in Supplementary Table S1). We also determined cell proliferation rate (in terms of doubling time) by allowing the cells to proliferate freely in complete culture media and in the absence of any treatment. We observed a strong positive correlation (Spearman r=0.7483; p=0.0051) between doubling time and MTX resistance, with less proliferative lines exhibiting increased resistance to the drug at 48 h, thus indicating that cycle-related features influence MTX resistance in short treatment periods.
In this work, we also found that the normalized enrichment score (NES) of the “TNF-α signaling pathway via NF-κB” Hallmark was positively correlated with MTX IC50 at 48 h (Figure 2c) and cellular doubling time (Figure 2d), thus offering a transcriptional explanation for the differential proliferation rate and MTX resistance observed across the cell lines. Similar to patient samples’ data, we looked for the NF-κB family genes whose expression were associated with MTX resistance. Again, NFKB1 expression was positively correlated with MTX resistance (Figure 2e); whereas NFKB2 expression (but not REL) showed up as inversely correlated to the in vitro resistance to the antifolate (Figure 2f).
MTX Modulates NF-κB Activity in a Cell LINE-Dependent Fashion
To study the crosstalk between NF-κB activity and MTX resistance, we generated stable transduced ALL cell lines expressing an NF-κB reporter construct. These cell lines were engineered to incorporate the firefly luciferase gene under the control of a basal promoter element (TATA box), joined to tandem repeats of NF-κB transcriptional response elements. The luciferase gene carries a protein destabilizing sequence, to reduce basal, non-induced luciferase activity. As a result, the synthesis of luciferase (and subsequent luminescence) was directly proportional to the level of active NF-κB present within the cell.
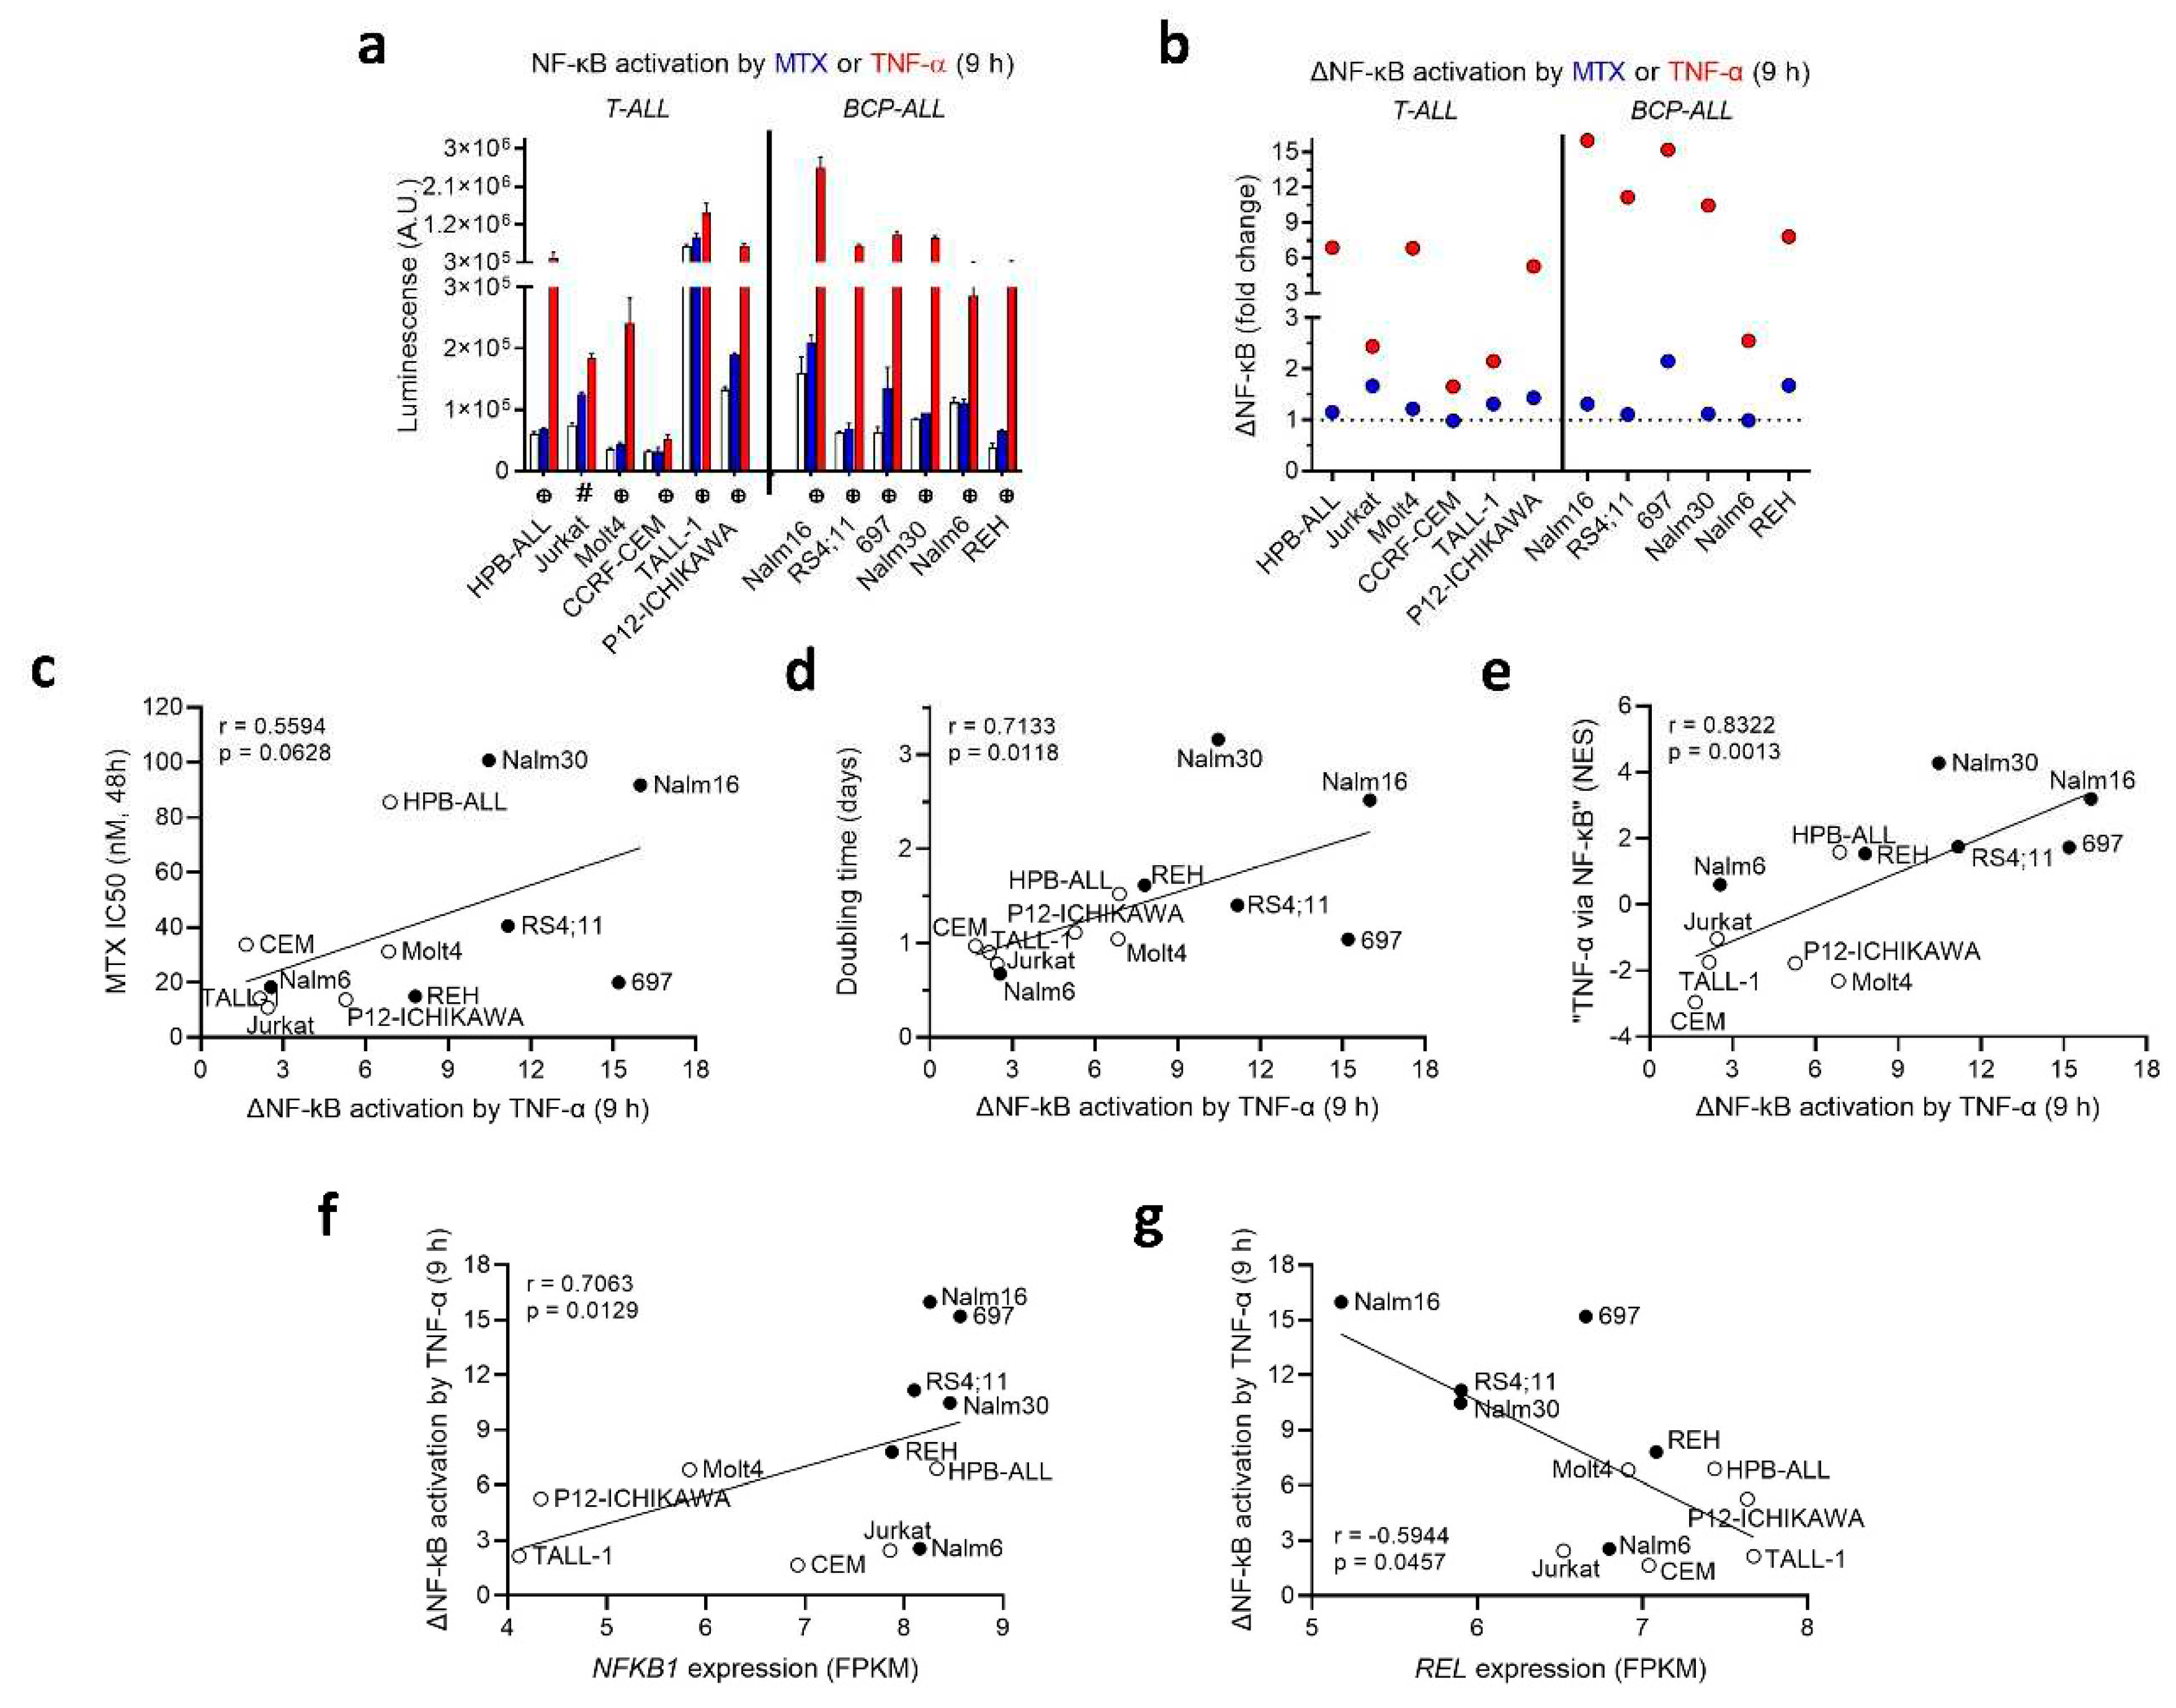
The transduced cells were treated with either MTX or TNF-α (used as a positive control). The extent of NF-κB activation varied significantly among the different transduced cell lines upon treatment with MTX and TNF-α. In general, 9 h treatment with MTX had no effect on NF-κB activity, except for an increase observed in Jurkat, 697 and REH (Figure 3a) (plots for NF-κB modulation at 16 and 24 h are in Supplementary Figure S2). Moreover, 4 (out of 6) BCP-ALLs showed a strong ΔNF-κB response (fold change > 10 in relation to control) in response to TNF-α, whereas 3 (out of 6) T-ALLs and 1 BCP-ALL presented an intermediate response (fold change between 5 and 8), and 3 T-ALLs and 1 BCP-ALL had a weak response (fold change < 3) to TNF-α stimulation (Figure 3b).
Interestingly, we found that ΔNF-κB activation triggered by TNF-α exhibited a positive association with and MTX resistance at 48 h (Figure 3c) and doubling time (Figure 3d) and the normalized enrichment score (NES) for the “TNF-α signaling via NF-κB” pathway (Figure 3e), suggesting that NF-κB activity is mainly determined at the transcriptional level, and could be influencing both cell proliferation and short-term MTX resistance. At the individual NF-κB gene level, ΔNF-κB activation by TNF-α was positively correlated with NFKB1 expression (Figure 3f), but inversely correlated with REL expression (Figure 3g). A correlation matrix depicting Spearman’s rank correlation coefficients and p-values between doubling time, MTX resistance, NF-κB family genes’ expression and ∆NF-κB activation by either MTX or TNF-α treatment can be found in Supplementary Table S2.
To assess the impact of NF-κB pathway inhibitors on the resistance of cell lines to MTX, we evaluated the effects of two pharmacological inhibitors: BAY 11-7082, an irreversible inhibitor of IKKα responsible for phosphorylating the NF-κB inhibitory protein IκBα; and parthenolide, which directly inhibits NF-κB and prevents its translocation to the nucleus [28]. Both compounds, however, did not enhance the cytotoxicity of MTX (Supplementary Figure S3). We also treated the cell lines with increasing doses of MTX in the presence of TNF-α, to investigate the effects of an increased NF-κB signaling on MTX resistance. Interestingly, TNF-α induced MTX resistance only in the BCP-ALL cell line REH; the cytokine was lethal to CCRF-CEM and 697 at the highest dose tested (100 ng/mL daily), and stimulated cell proliferation – not accompanied by an increase in MTX resistance – in the T-ALL cell lines Molt4, TALL-1, and ALL-SIL (Supplementary Figure S4). These findings suggest that exogenously induced NF-κB signaling plays, if any, a very limited cell-specific role in MTX resistance in vitro.
Discussion
MTX exerts its therapeutic effect through diverse and complex cellular mechanisms. While some treatment protocols for ALL use MTX as a single agent, others administer the antifolate combined with other chemotherapeutic drugs. Previous works had associated NF-κB with poor prognosis [17], [19]; however, these studies were either based on smaller cohorts or on targeted approaches (RT-PCR and antibodies). The study of Cleaver et al. [18], using GSEA analysis on microarray data, identified the expression of the NF-κB pathway as predictive of relapse, although this association was not exploited in the context of drug resistance to any chemotherapeutic agent. By performing a gene set enrichment analysis (GSEA) on the publicly available gene expression data from bone marrow-derived blasts of 161 newly diagnosed pediatric ALL patients, we identified the constitutive “TNF-α signaling via NF-κB” pathway as the most enriched Cancer Hallmark among patients with higher WBC count following a single agent-based, frontline therapy with MTX. This allowed us to unequivocally link NF-κB pathway overexpression to MTX clinical resistance.
We validated the findings from patient samples in a panel of 13 ALL cell lines. A ssGSEA analysis on the cell line’s transcriptomic data revealed that “TNF-α signaling via NF-κB” – one of the few Cancer Hallmarks that presented differential enrichment scores across the cell lines, overexpressed in BCP-ALL compared to T-ALL – was also directly associated with NF-κB activation by TNF-α, cell proliferation and MTX resistance, confirming the crosstalk between the expression of the signaling pathway and the phenotypic traits. At the individual gene level, NFKB1 was overexpressed in i) poor responder patients to MTX, ii) MTX resistant cell lines and in iii) samples with higher NF-κB activation by TNF-α, evidencing the important role of this NF-κB family gene on the pathway regulation and the phenotypes associated with it – such as resistance to MTX. Conversely, REL was overexpressed in MTX poor responders but inversely correlated with NF-κB activation by TNF-α, whereas NFKB2 expression was negatively correlated with MTX resistance only in cell lines, indicating a more context-specific role for these genes.
Using a panel of stable transduced ALL cell lines, we showed that MTX was able to modestly increase NF-κB activity in only a few of the cell lines tested. Previous works had shown that MTX inhibited NF-κB activation by increasing both adenosine release and activation of adenosine receptor A2a in rheumatoid arthritis [29]; and that MTX decreased TNF-α-mediated NF-κB activation in Jurkat through inhibition of IκBα phosphorylation and degradation [3], as well as by releasing adenosine – although dose (10 µM) and time of treatment (60 min) varied significantly from our experimental conditions. It is plausible to hypothesize that longer periods of treatment – like those tested in our study – may trigger stress responses and signaling pathways distinct than those described by other authors.
Our results also showed that, even in those cases in which MTX increased NF-κB levels, the magnitude of the activation was never higher than that induced by TNF-α treatment (the only exception was P12-Ichikawa at 16 h). This finding suggests that MTX may modulate NF-κB signaling through distinct mechanisms or pathways compared to the direct stimulation by TNF-α. The differential effects on NF-κB activation by these two stimuli highlight the complexity of NF-κB regulation and warrant further investigation to elucidate the underlying mechanisms and their implications in the context of MTX resistance. We also found that TNF-α-mediated NF-κB activation was positively correlated to MTX resistance and cell doubling time. There is a vast literature linking NF-κB signaling to cell proliferation – which, in its turn, is associated with cell susceptibility to short-term resistance MTX – making, thus, reasonable that these parameters were correlated to one another.
Functionally, treatment with NF-κB inhibitors (BAY 11-7082 and parthenolide) did not sensitize the cells to MTX, nor TNF-α supplementation induced resistance to the antifolate in the cell lines (except for REH). These pharmacological inhibitors target NF-κB in an non-specific manner, suggesting that more specific NF-κB inhibitors might be required to elicit a more conspicuous additive/synergistic effect. However, we cannot rule out the possibility that the overexpression of the NF-κB pathway is associated with, but not directly promoting MTX resistance in ALL cell lines; in this sense, NF-κB activation would be the byproduct of a transcriptional state characterized by MTX resistance, but not the leading cause of it. In fact, the cellular processes attributed to TNF-α signaling via NF-κB can range from proliferation to apoptosis, depending on the signal strength, the signaling molecules recruited, and the crosstalk with other pathways [30].
In sum, we observed a direct association between the overexpression of the NF-κB pathway and poorer clinical response to MTX, as well as between NF-κB genes overexpression, NF-κB activation by TNF-α, MTX resistance and reduced cell proliferation in a panel of ALL cell lines. Further studies must be conducted to investigate whether inhibiting NF-κB (both family genes and pathway) results in drug re-sensitization and therapeutic benefit in ALL.
Author Contributions
RRC and JAY conceived the study. RRC and NMC performed the experiments and analyzed the data. JAY supervised the study. RRC and JAY wrote the manuscript. All authors contributed to the article and approved the submitted version.
Data Availability Statement
The data presented in the study are deposited in the Gene Expression Omnibus (GEO) repository, accession number GSE218348.
Acknowledgements
This work was supported by grants 08/10034–1 and 12/12802-1 from São Paulo Research Foundation (FAPESP) to JAY. RRC and NMC received FAPESP fellowships (RRC: 2009/04167-1 and 2012/11952-0; NMC: 2014/08247-8). JAY receives a productivity fellowship from the National Counsel of Technological and Scientific Development (CNPq, processes 301596.2017-4 and 308399/2021-8).
Conflict of Interest
The authors declare that the research was conducted in the absence of any commercial or financial relationships that could be construed as a potential conflict of interest.
References
- Spurlock, C.F. , 3rd.; Tossberg, J.T.; Matlock, B.K.; Olsen, N.J.; Aune, T.M. Methotrexate inhibits NF-kappaB activity via long intergenic (noncoding) RNA-p21 induction. Arthritis Rheumatol. 2014, 66, 2947–2957. [Google Scholar] [CrossRef] [PubMed]
- Spurlock, C.F. , 3rd.; et al. Methotrexate-mediated inhibition of nuclear factor kappaB activation by distinct pathways in T cells and fibroblast-like synoviocytes. Rheumatology 2015, 54, 178–187. [Google Scholar] [CrossRef] [PubMed]
- Majumdar, S.; Aggarwal, B.B. Methotrexate suppresses NF-kappaB activation through inhibition of IkappaBalpha phosphorylation and degradation. J. Immunol. 2001, 167, 2911–2920. [Google Scholar] [CrossRef] [PubMed]
- Gilmore, T.D. The Rel/NF-kappaB signal transduction pathway: Introduction. Oncogene 1999, 18, 6842–6844. [Google Scholar] [CrossRef] [PubMed]
- Chandel, N.S.; Trzyna, W.C.; McClintock, D.S.; Schumacker, P.T. Role of oxidants in NF-kappa B activation and TNF-alpha gene transcription induced by hypoxia and endotoxin. J. Immunol. 2000, 165, 1013–1021. [Google Scholar] [CrossRef] [PubMed]
- Qin, H.; Wilson, C.A.; Lee, S.J.; Zhao, X.; Benveniste, E.N. LPS induces CD40 gene expression through the activation of NF-kappaB and STAT-1alpha in macrophages and microglia. Blood 2005, 106, 3114–3122. [Google Scholar] [CrossRef] [PubMed]
- Bosman, M.C.; Schuringa, J.J.; Vellenga, E. Constitutive NF-kappaB activation in AML: Causes and treatment strategies. Crit. Rev. Oncol. Hematol. 2016, 98, 35–44. [Google Scholar] [CrossRef]
- Panday, A.; et al. Transcription Factor NF-kappaB: An Update on Intervention Strategies. Arch. Immunol. Ther. Exp. 2016, 64, 463–483. [Google Scholar] [CrossRef]
- Li, F.; et al. NF-kappaB in cancer therapy. Arch. Toxicol. 2015, 89, 711–731. [Google Scholar] [CrossRef]
- Zhou, X.; Li, Z.; Zhou, J. Tumor necrosis factor alpha in the onset and progression of leukemia. Exp. Hematol. 2017, 45, 17–26. [Google Scholar] [CrossRef]
- Zhou, J.; Ching, Y.Q.; Chng, W.J. Aberrant nuclear factor-kappa B activity in acute myeloid leukemia: From molecular pathogenesis to therapeutic target. Oncotarget 2015, 6, 5490–5500. [Google Scholar] [CrossRef] [PubMed]
- Iacobucci, I.; Mullighan, C.G. Genetic Basis of Acute Lymphoblastic Leukemia. J. Clin. Oncol. 2017, 35, 975–983. [Google Scholar] [CrossRef] [PubMed]
- Kordes, U.; Krappmann, D.; Heissmeyer, V.; Ludwig, W.D.; Scheidereit, C. Transcription factor NF-kappaB is constitutively activated in acute lymphoblastic leukemia cells. Leukemia 2000, 14, 399–402. [Google Scholar] [CrossRef]
- Dos Santos, N.R.; Ghezzo, M.N.; da Silva, R.C.; Fernandes, M.T. NF-kappaB in T-cell Acute Lymphoblastic Leukemia: Oncogenic Functions in Leukemic and in Microenvironmental Cells. Cancers 2010, 2, 1838–1860. [Google Scholar] [CrossRef]
- Vilimas, T.; et al. Targeting the NF-kappaB signaling pathway in Notch1-induced T-cell leukemia. Nat. Med. 2007, 13, 70–77. [Google Scholar] [CrossRef] [PubMed]
- Hewamana, S.; et al. Rel a is an independent biomarker of clinical outcome in chronic lymphocytic leukemia. J. Clin. Oncol. 2009, 27, 763–769. [Google Scholar] [CrossRef]
- Hafez, M.; et al. Markers of apoptosis and proliferation related gene products as predictors of treatment outcome in childhood acute lymphoblastic leukemia. Hematology 2007, 12, 209–218. [Google Scholar] [CrossRef]
- Cleaver, A.L.; et al. Gene-based outcome prediction in multiple cohorts of pediatric T-cell acute lymphoblastic leukemia: A Children’s Oncology Group study. Mol Cancer 2010, 9, 105. [Google Scholar] [CrossRef]
- Kamienska, E.; et al. Activation of NF-kB in leukemic cells in response to initial prednisone therapy in children with acute lymphoblastic leukaemia: Relation to other prognostic factors. Pol. J. Pathol. 2011, 62, 5–11. [Google Scholar]
- Aguayo, A.; et al. Angiogenesis in acute and chronic leukemias and myelodysplastic syndromes. Blood 2000, 96, 2240–2245. [Google Scholar]
- Potapnev, M.P.; Petyovka, N.V.; Belevtsev, M.V.; Savitskiy, V.P.; Migal, N.V. Plasma level of tumor necrosis factor-alpha (TNF-alpha) correlates with leukocytosis and biological features of leukemic cells, but not treatment response of children with acute lymphoblastic leukemia. Leuk. Lymphoma 2003, 44, 1077–1079. [Google Scholar] [CrossRef] [PubMed]
- Kalmanti, M.; et al. Serum levels of tumor necrosis factor and soluble interleukin 2 receptor as markers of disease activity and prognosis in childhood leukemia and lymphoma. Int. J. Hematol. 1993, 57, 147–152. [Google Scholar] [PubMed]
- Sorich, M.J.; et al. In vivo response to methotrexate forecasts outcome of acute lymphoblastic leukemia and has a distinct gene expression profile. PLoS Med. 2008, 5, e83. [Google Scholar] [CrossRef]
- Subramanian, A.; et al. Gene set enrichment analysis: A knowledge-based approach for interpreting genome-wide expression profiles. Proc. Natl. Acad. Sci. USA 2005, 102, 15545–15550. [Google Scholar] [CrossRef]
- Silveira, A.B.; et al. PI3K inhibition synergizes with glucocorticoids but antagonizes with methotrexate in T-cell acute lymphoblastic leukemia. Oncotarget 2015, 6, 13105–13118. [Google Scholar] [CrossRef] [PubMed]
- Oeckinghaus, A.; Ghosh, S. The NF-kappaB family of transcription factors and its regulation. Cold Spring Harb. Perspect. Biol. 2009, 1, a000034. [Google Scholar] [CrossRef]
- Canevarolo, R.R.; et al. Glutathione levels are associated with methotrexate resistance in acute lymphoblastic leukemia cell lines. Front Oncol 2022, 12, 1032336. [Google Scholar] [CrossRef]
- Ghashghaeinia, M.; et al. The NFkB pathway inhibitors Bay 11-7082 and parthenolide induce programmed cell death in anucleated Erythrocytes. Cell Physiol. Biochem. 2011, 27, 45–54. [Google Scholar] [CrossRef]
- Cronstein, B.N.; Aune, T.M. Methotrexate and its mechanisms of action in inflammatory arthritis. Nat. Rev. Rheumatol. 2020, 16, 145–154. [Google Scholar] [CrossRef]
- Mercogliano, M.F.; Bruni, S.; Elizalde, P.V.; Schillaci, R. Tumor Necrosis Factor alpha Blockade: An Opportunity to Tackle Breast Cancer. Front. Oncol. 2020, 10, 584. [Google Scholar] [CrossRef]
Figure 1.
Gene set enrichment analysis on 161 pediatric ALL cases identifies Cancer Hallmarks associated with higher circulating WBCs. a, List of Hallmarks enriched in ALL blasts at diagnosis in samples with increased circulating WBCs (and associated with worse prognosis) following MTX therapy. Highlighted, the top-most enriched pathway, “TNF-α signaling via NF-κB”, whose enrichment plot is shown in (b). Size = number of genes that compose the Hallmark; ES = enrichment score; NES = normalized enrichment score; NOM p-val = nominal p-value; FRD q-val = false discovery rate (q-value); FWER p-val = familywise error rate p-value. (c – d), Expression of NFKB1 and REL in the top (n=40) and bottom (n=40) quartiles with the poorest (“Poor”) and best (“Good”) clinical response to MTX. P-values for unpaired t-test. Analysis made on data from Sorich et al. [23].
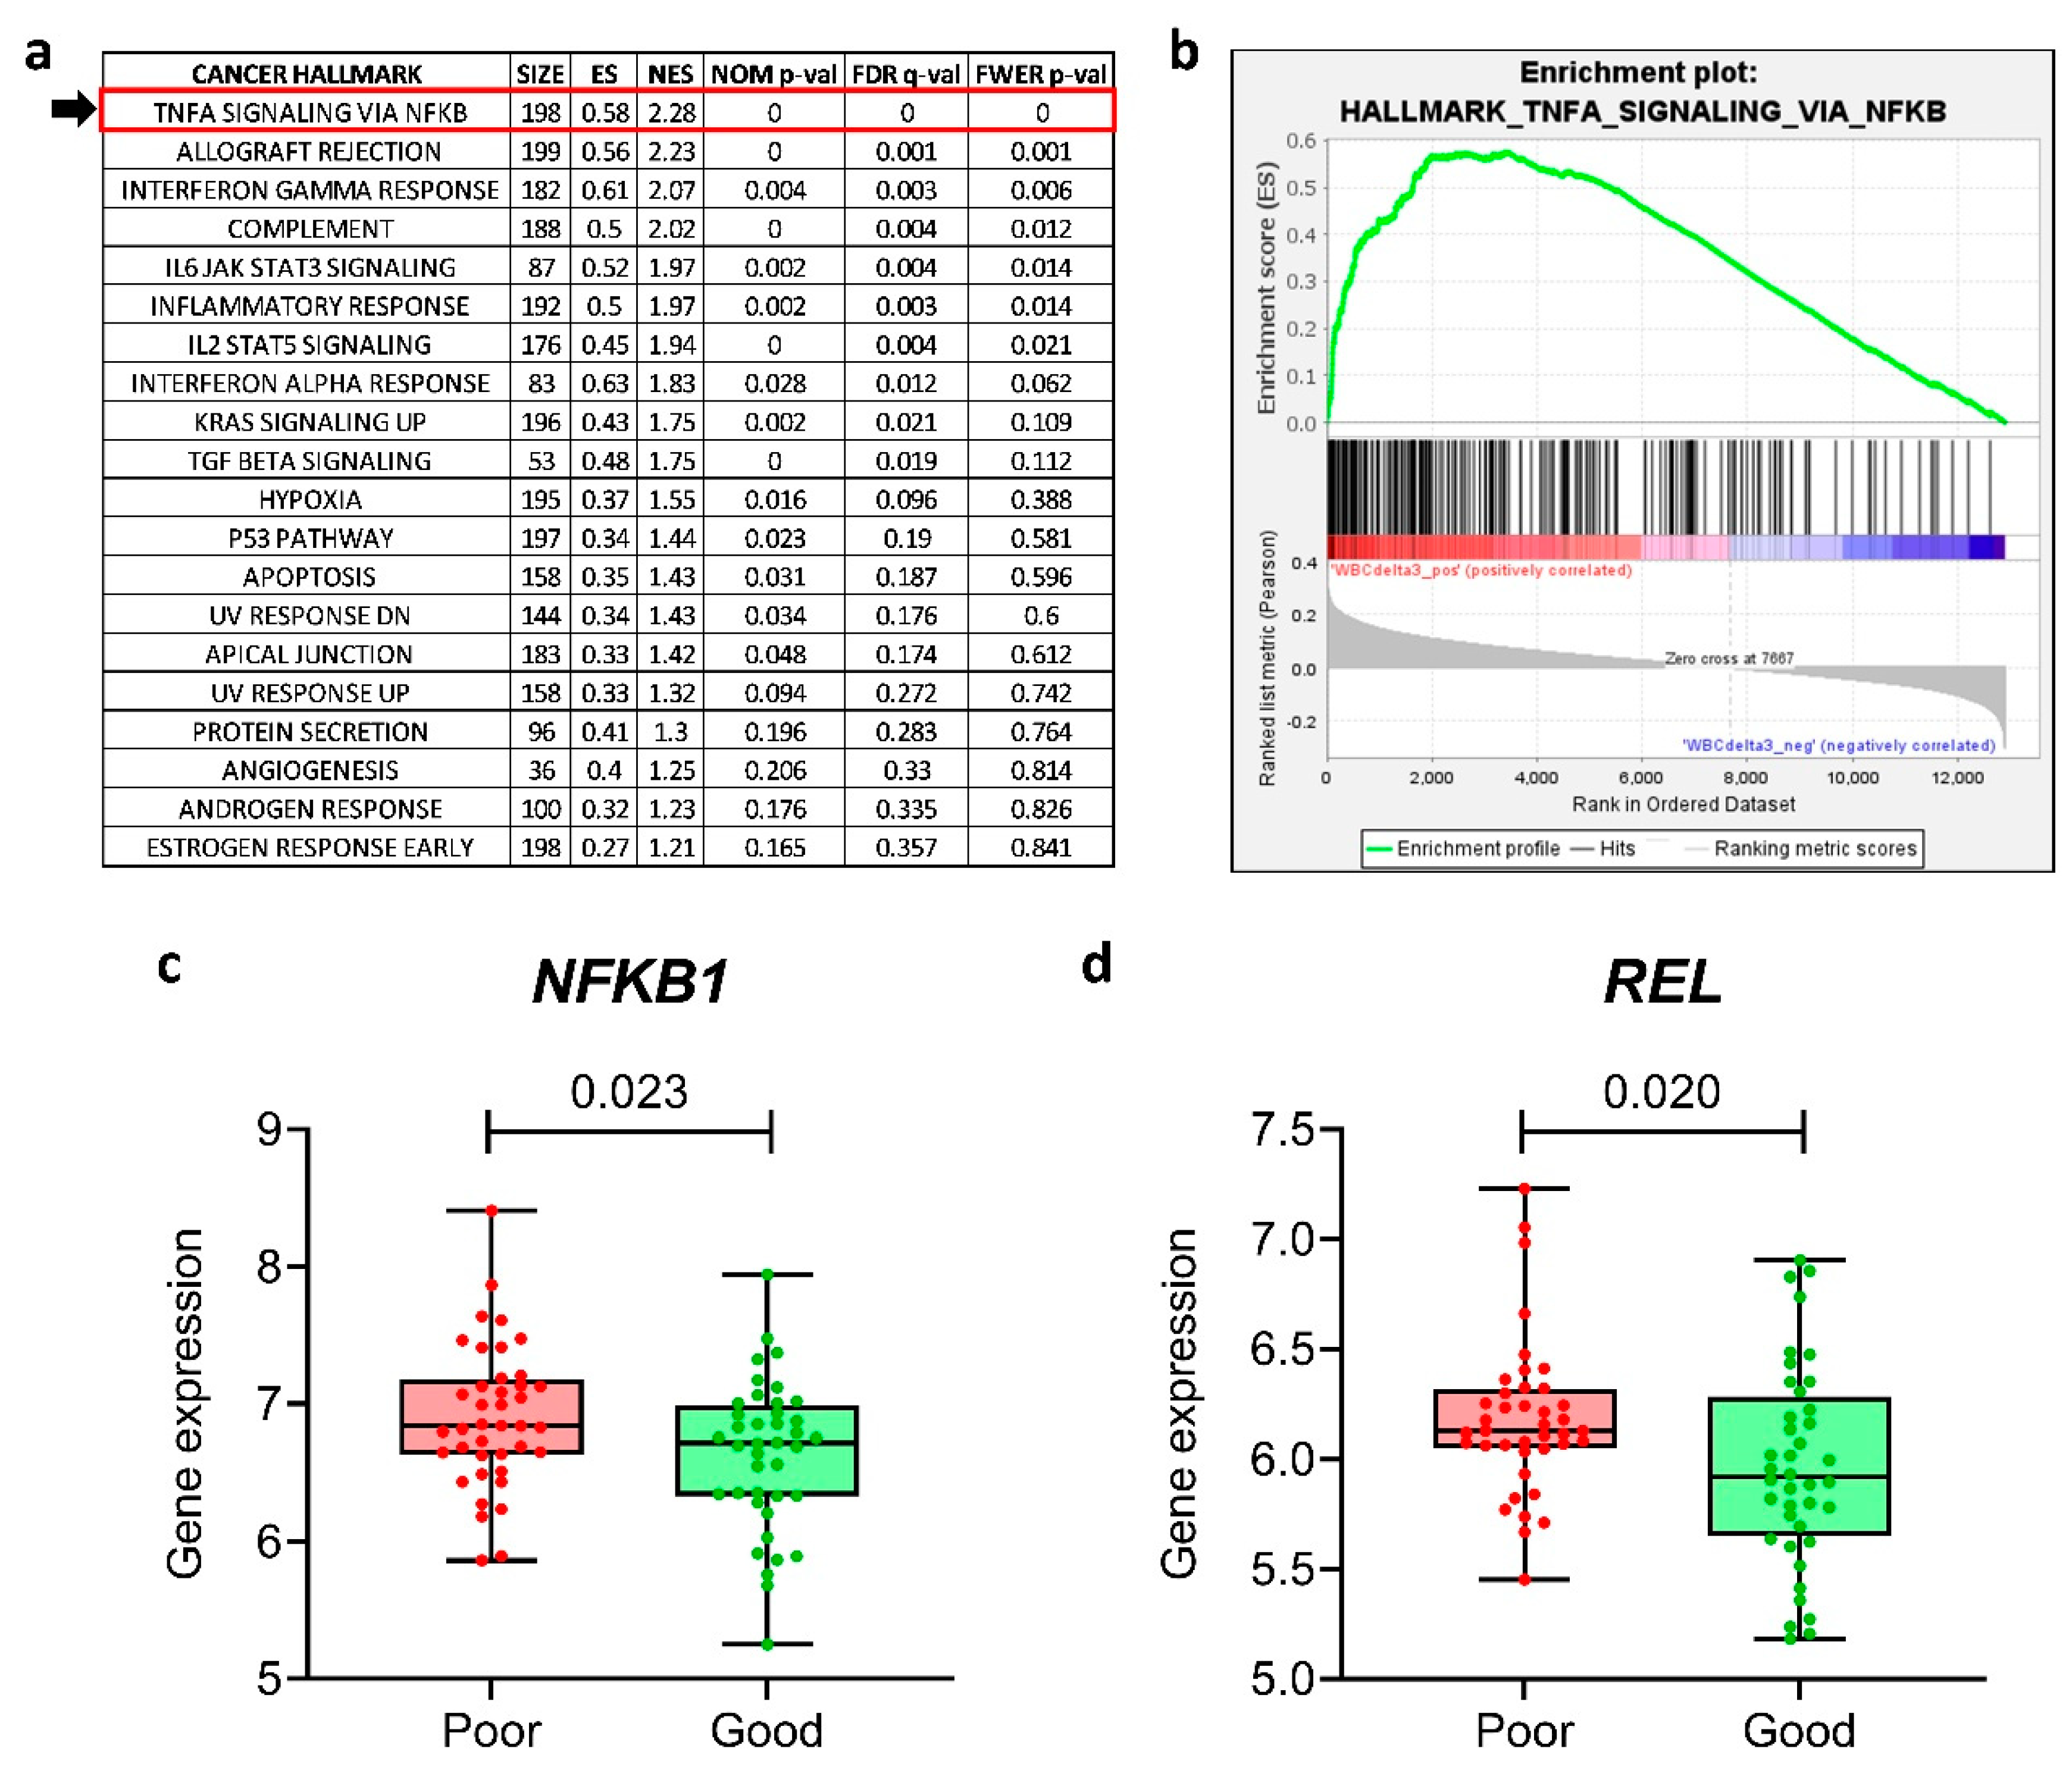
Figure 2.
The transcriptional status of the NF-κB signaling pathway correlates with proliferation and MTX resistance. a, Normalized enrichment score (NES) of the 50 Cancer Hallmarks per cell line, calculated by ssGSEA. Highlighted, “TNF-α signaling via NF-κB”. b, Normalized enrichment score of “TNF-α signaling via NF-κB” in T-ALL and BCP-ALL cell lines (p-value for Mann-Whitney test). c, Association between “TNF-α signaling via NF-κB” NES and MTX resistance, or (d) Doubling time. e, Correlation between NFKB1 or (f) NFKB2 expression and MTX resistance. r and p refer to Spearman’s correlation coefficient and p-value, respectively. BCP-ALL and T-ALL are depicted as black and white dots, respectively.
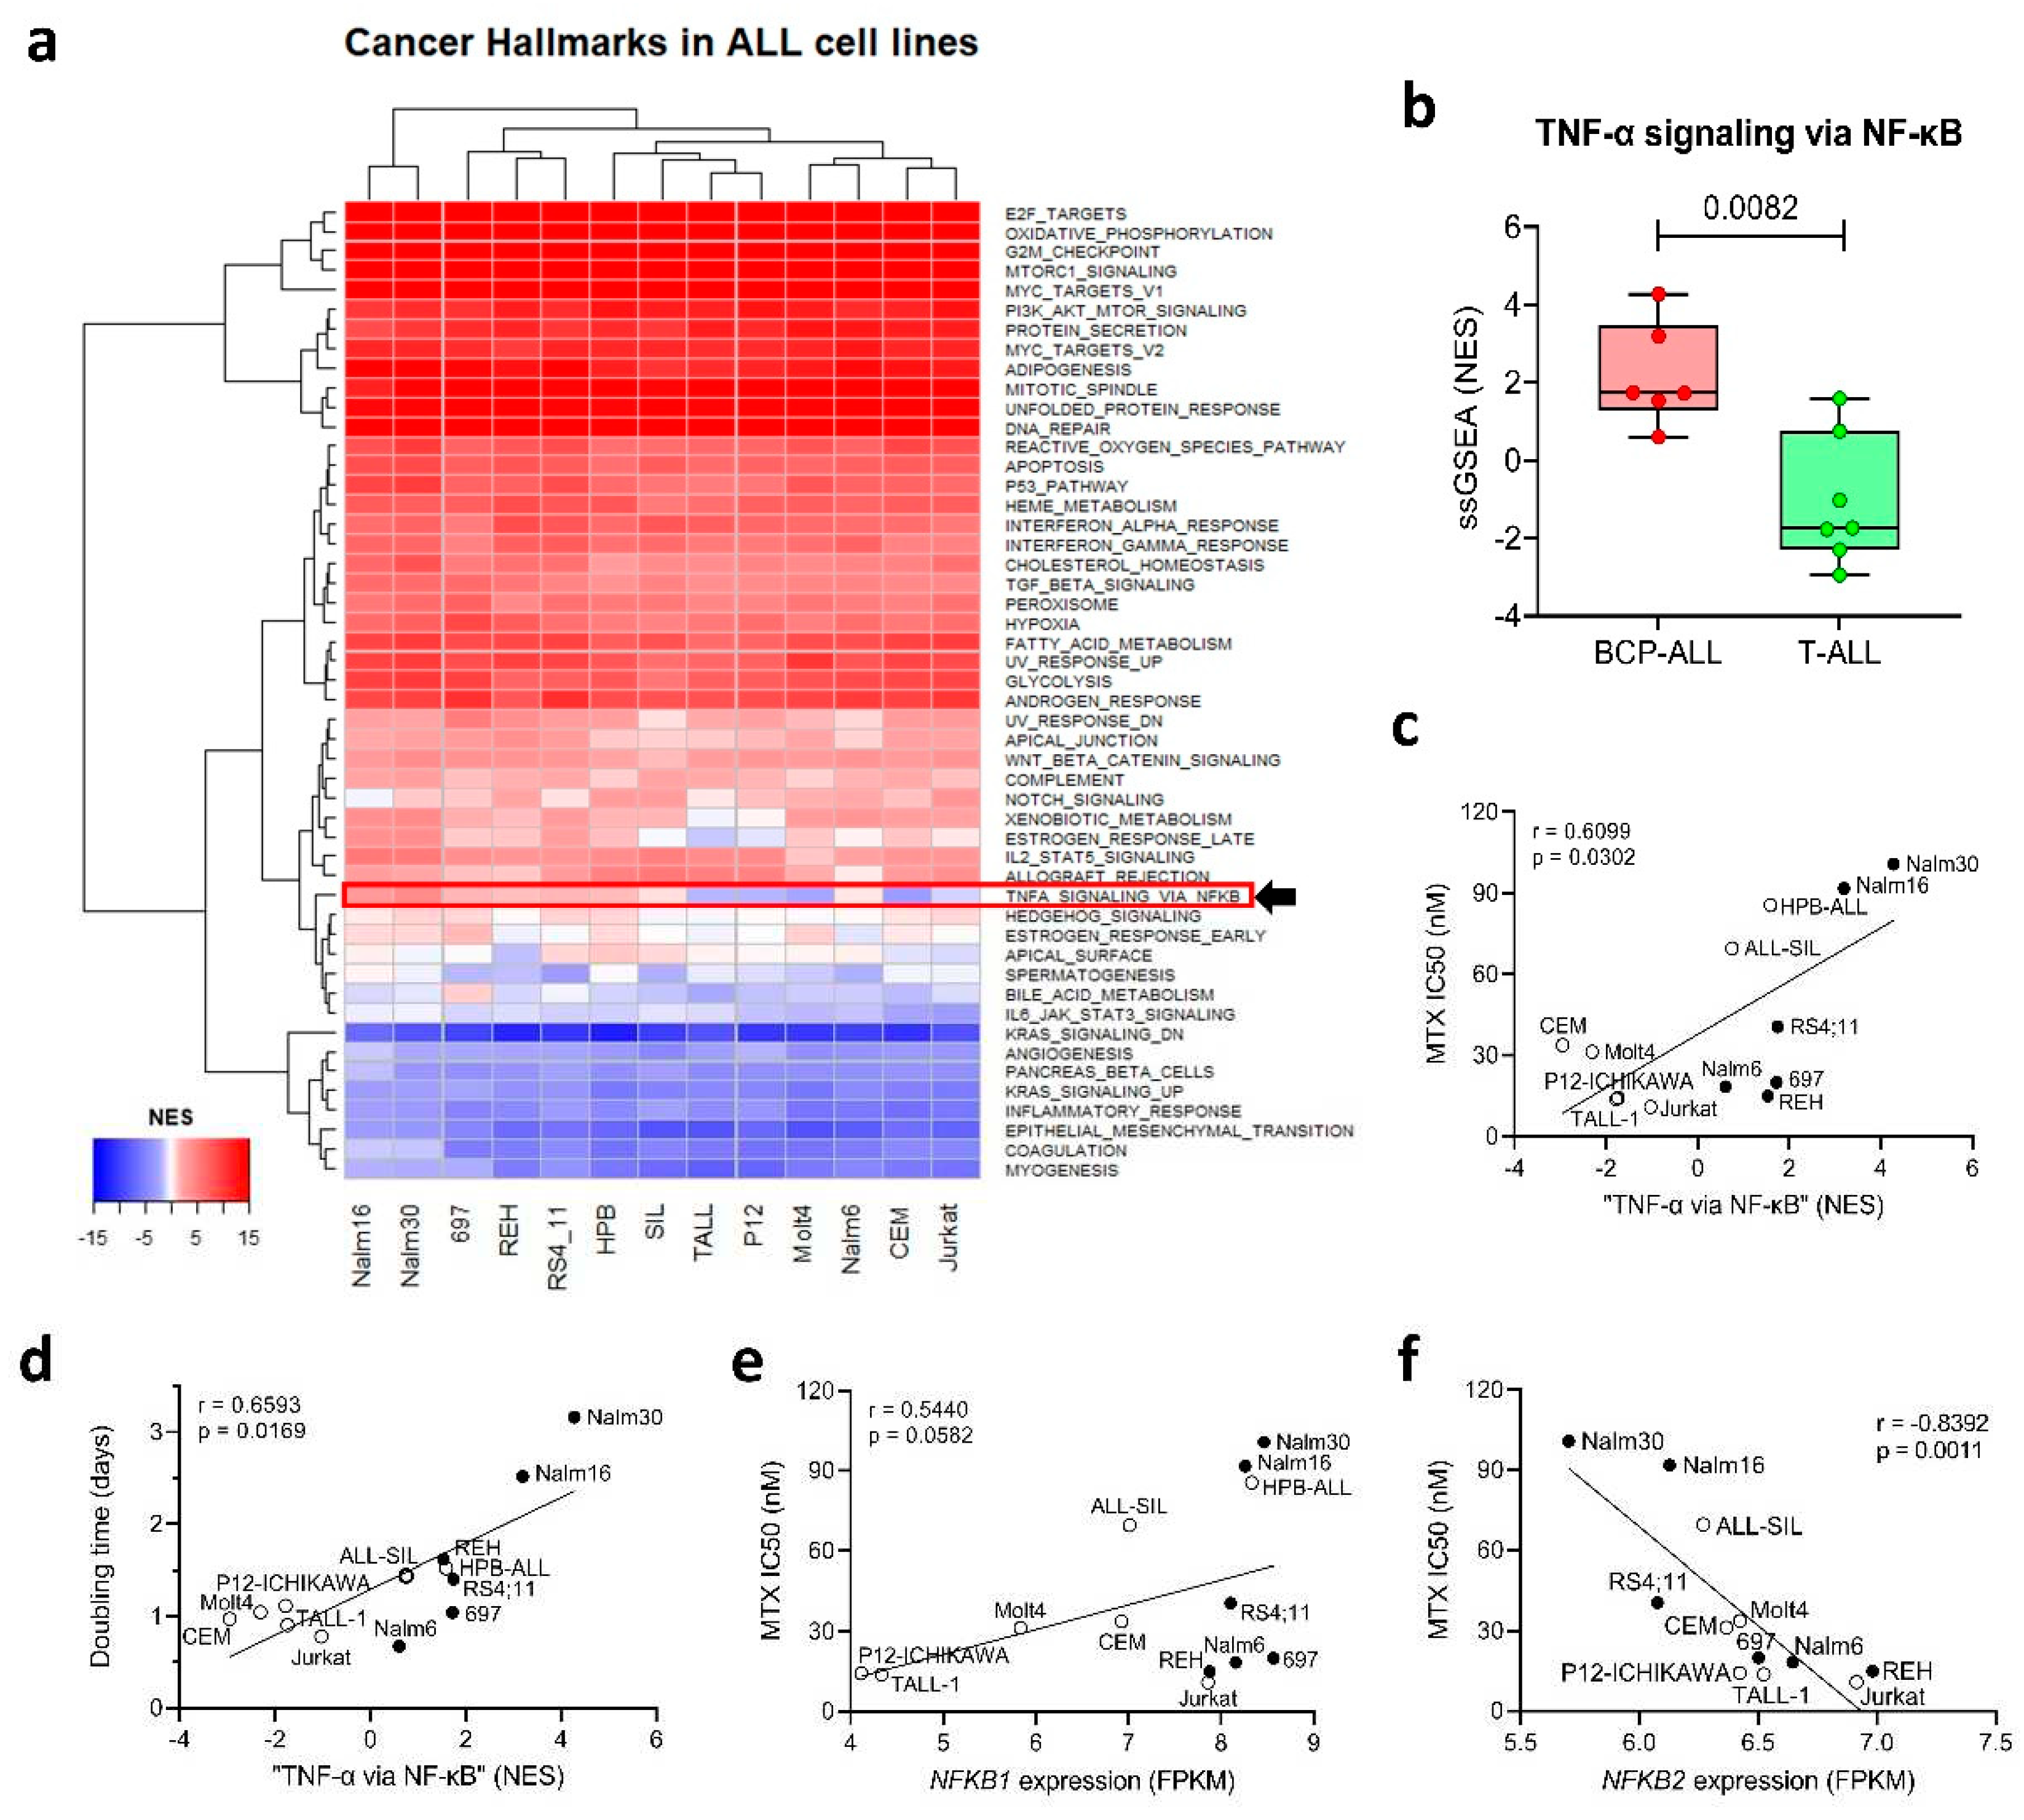
Figure 3.
NF-κB activation induced by TNF-α correlates with proliferation and MTX resistance. a, NF-κB signal in cell lines treated with MTX (100 nmol/l, in blue), TNF-α (100 ng/ml, in red) or vehicle (Ctrl, white bars) for 9 h. One-way ANOVA followed by Tukey’s post-test was performed for each cell line. ⊕: TNF-α differed from Ctrl and MTX, which did not differ between each other; #: all three groups differed from one another. b, Ratio between averages in a, depicting fold change (∆) of NF-κB modulation by MTX (blue dots) or TNF-α (red dots) in relation to control (dashed line, normalized per cell line). (c – g) Association between ∆NF-κB activity triggered by TNF-α and MTX resistance, doubling time, “TNF-α signaling via NF-κB” pathway normalized enrichment score (NES) from ssGSEA analysis, NFKB1, and REL expression, respectively. r and p refer to Spearman’s correlation coefficient and p-value, respectively. BCP-ALL and T-ALL are depicted as black and white dots, respectively.
Disclaimer/Publisher’s Note: The statements, opinions and data contained in all publications are solely those of the individual author(s) and contributor(s) and not of MDPI and/or the editor(s). MDPI and/or the editor(s) disclaim responsibility for any injury to people or property resulting from any ideas, methods, instructions or products referred to in the content. |
© 2023 by the authors. Licensee MDPI, Basel, Switzerland. This article is an open access article distributed under the terms and conditions of the Creative Commons Attribution (CC BY) license (http://creativecommons.org/licenses/by/4.0/).
Copyright: This open access article is published under a Creative Commons CC BY 4.0 license, which permit the free download, distribution, and reuse, provided that the author and preprint are cited in any reuse.


