
Submitted:
28 February 2024
Posted:
29 February 2024
You are already at the latest version
Abstract
The Internet of Things (IoT) is a concept based on the integration of various devices and methods of communication to exchange information in order to contribute to the improvement of everyday life, business and environment. This paper focuses on the establishment of a modern Internet of Things platform to ensure secure collection, processing and storage of data, under unexpected events. This platform establishes reliable connectivity which enhance system uptime; the key to success when implementing an IoT strategy. For this purpose, we proposed a hybrid approach combining different connectivity technologies to ensure the availability and smooth operation of the system and the prevention of data loss in unforeseen cases.
Keywords:
Internet of Things
; Cloud Computing
; Edge Computing
; Big Data
; IoT Communications Protocols
1. Introduction
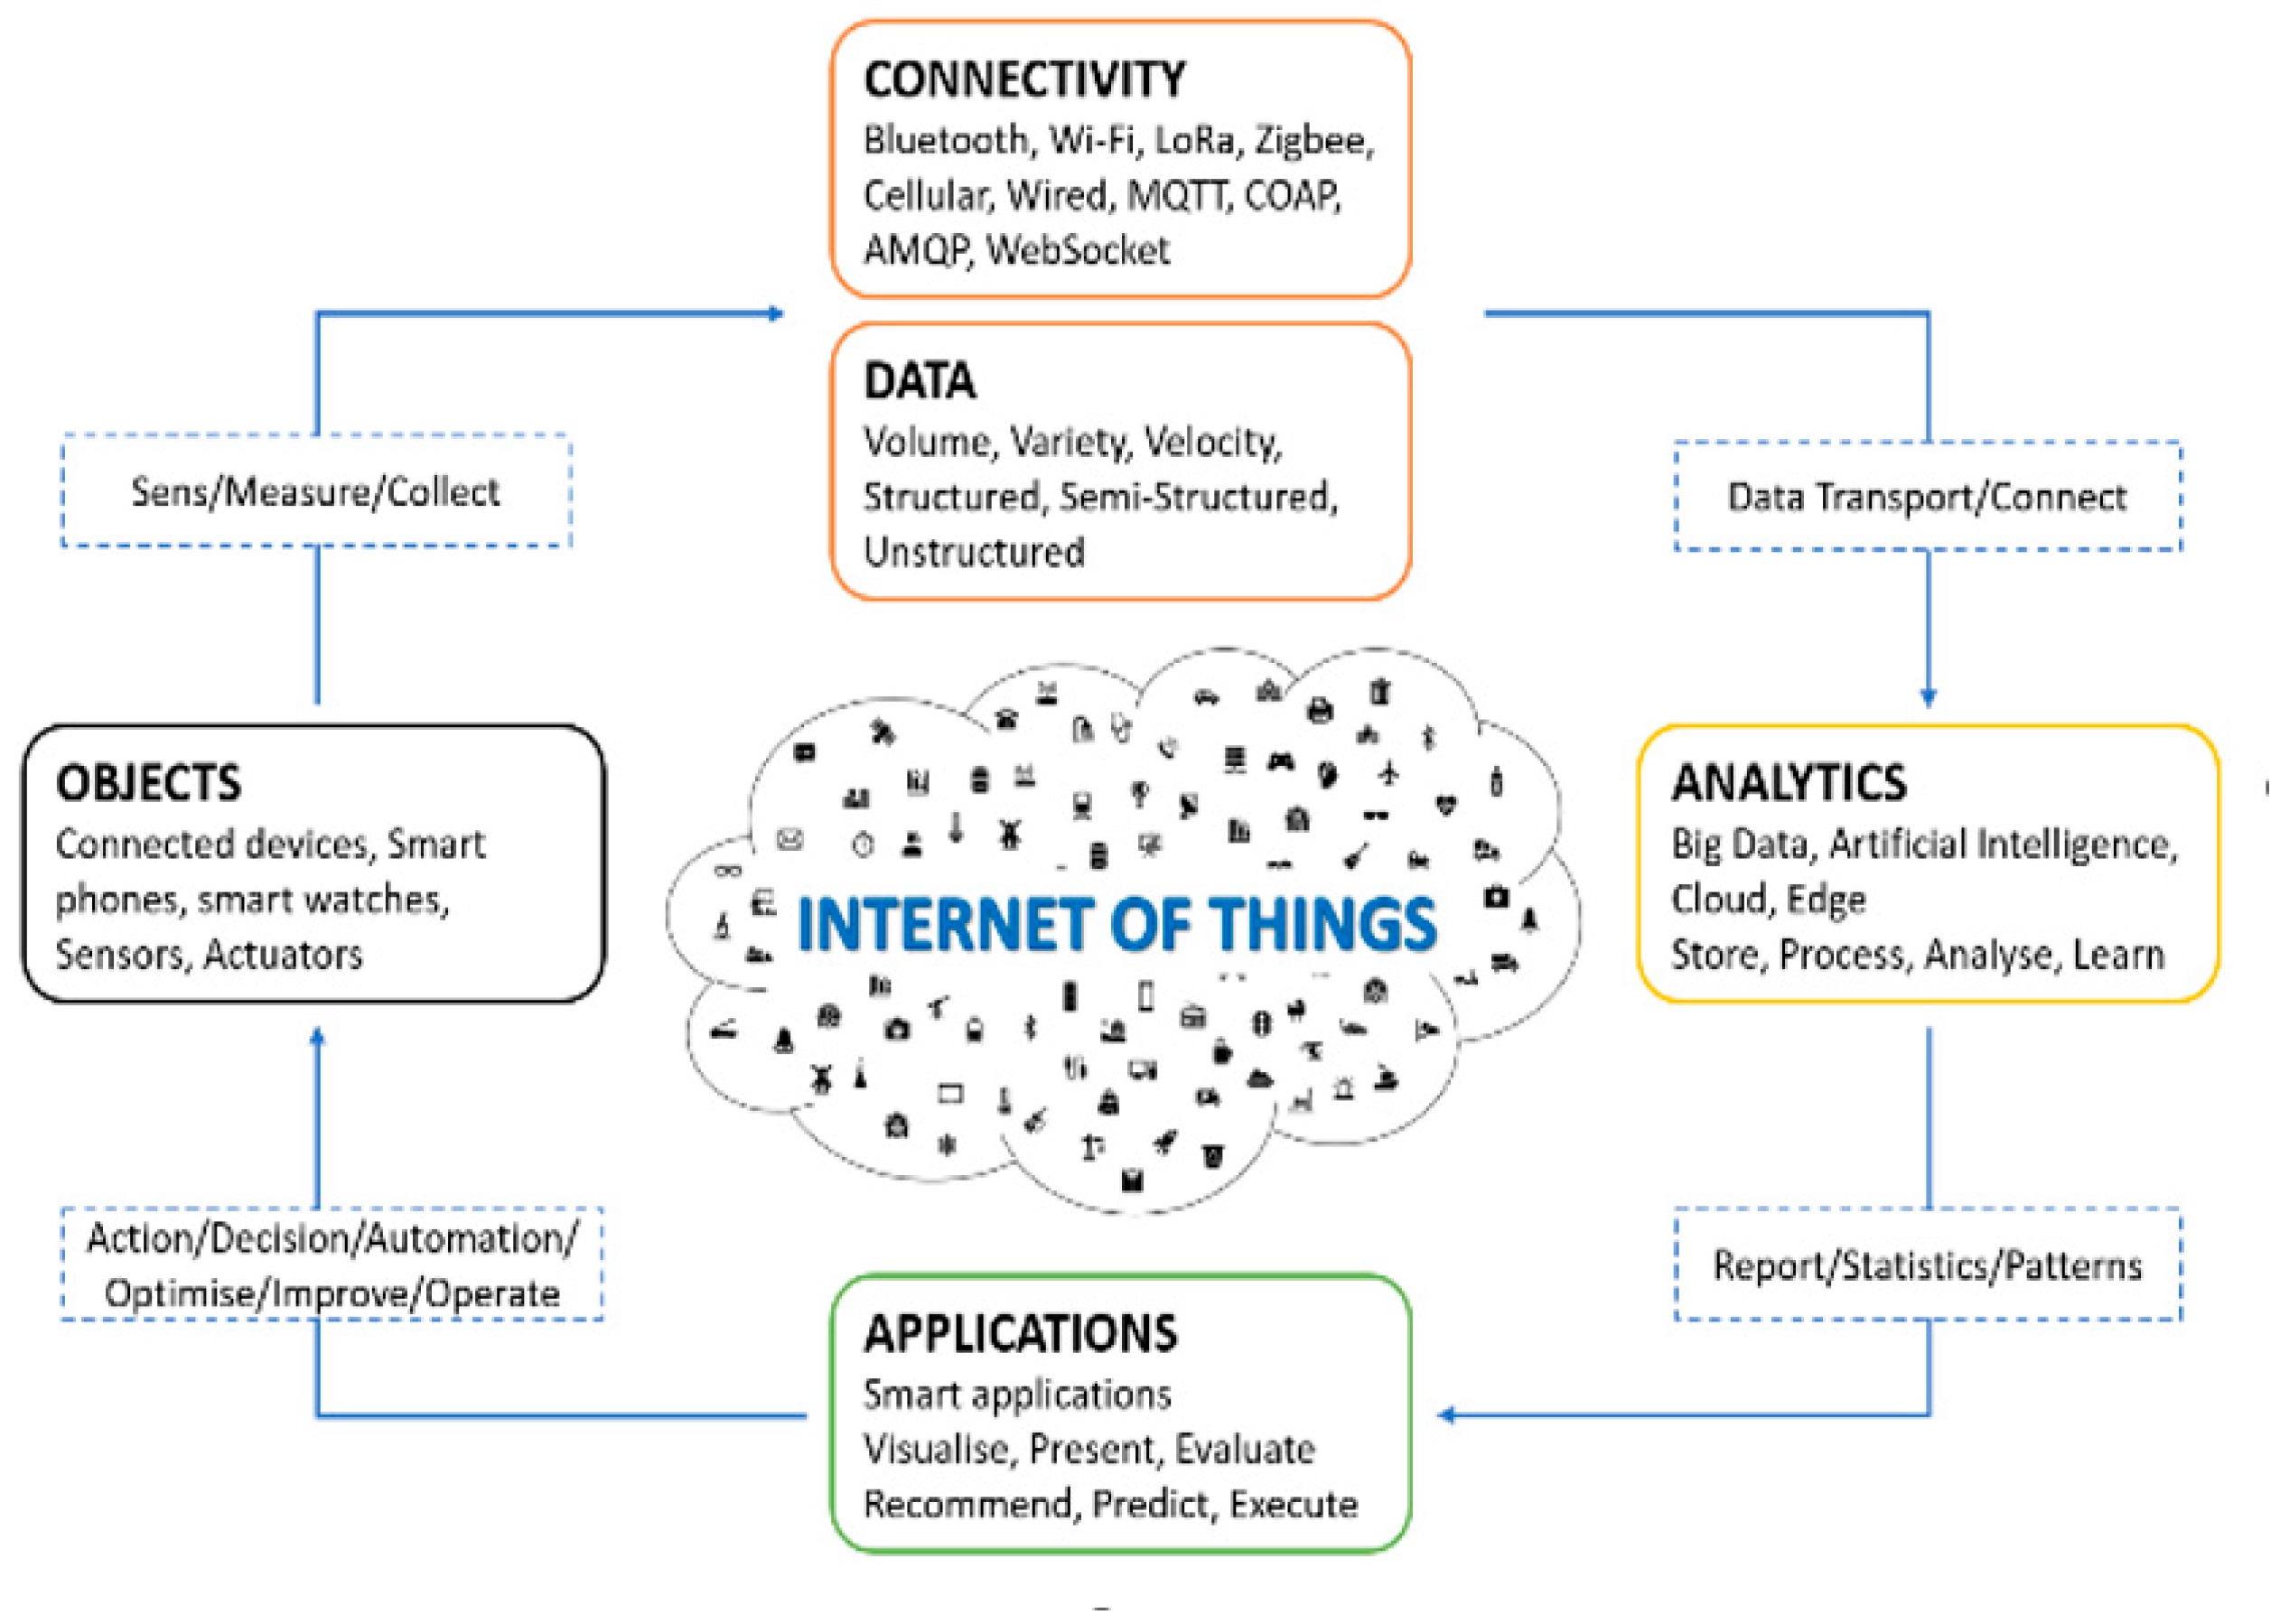
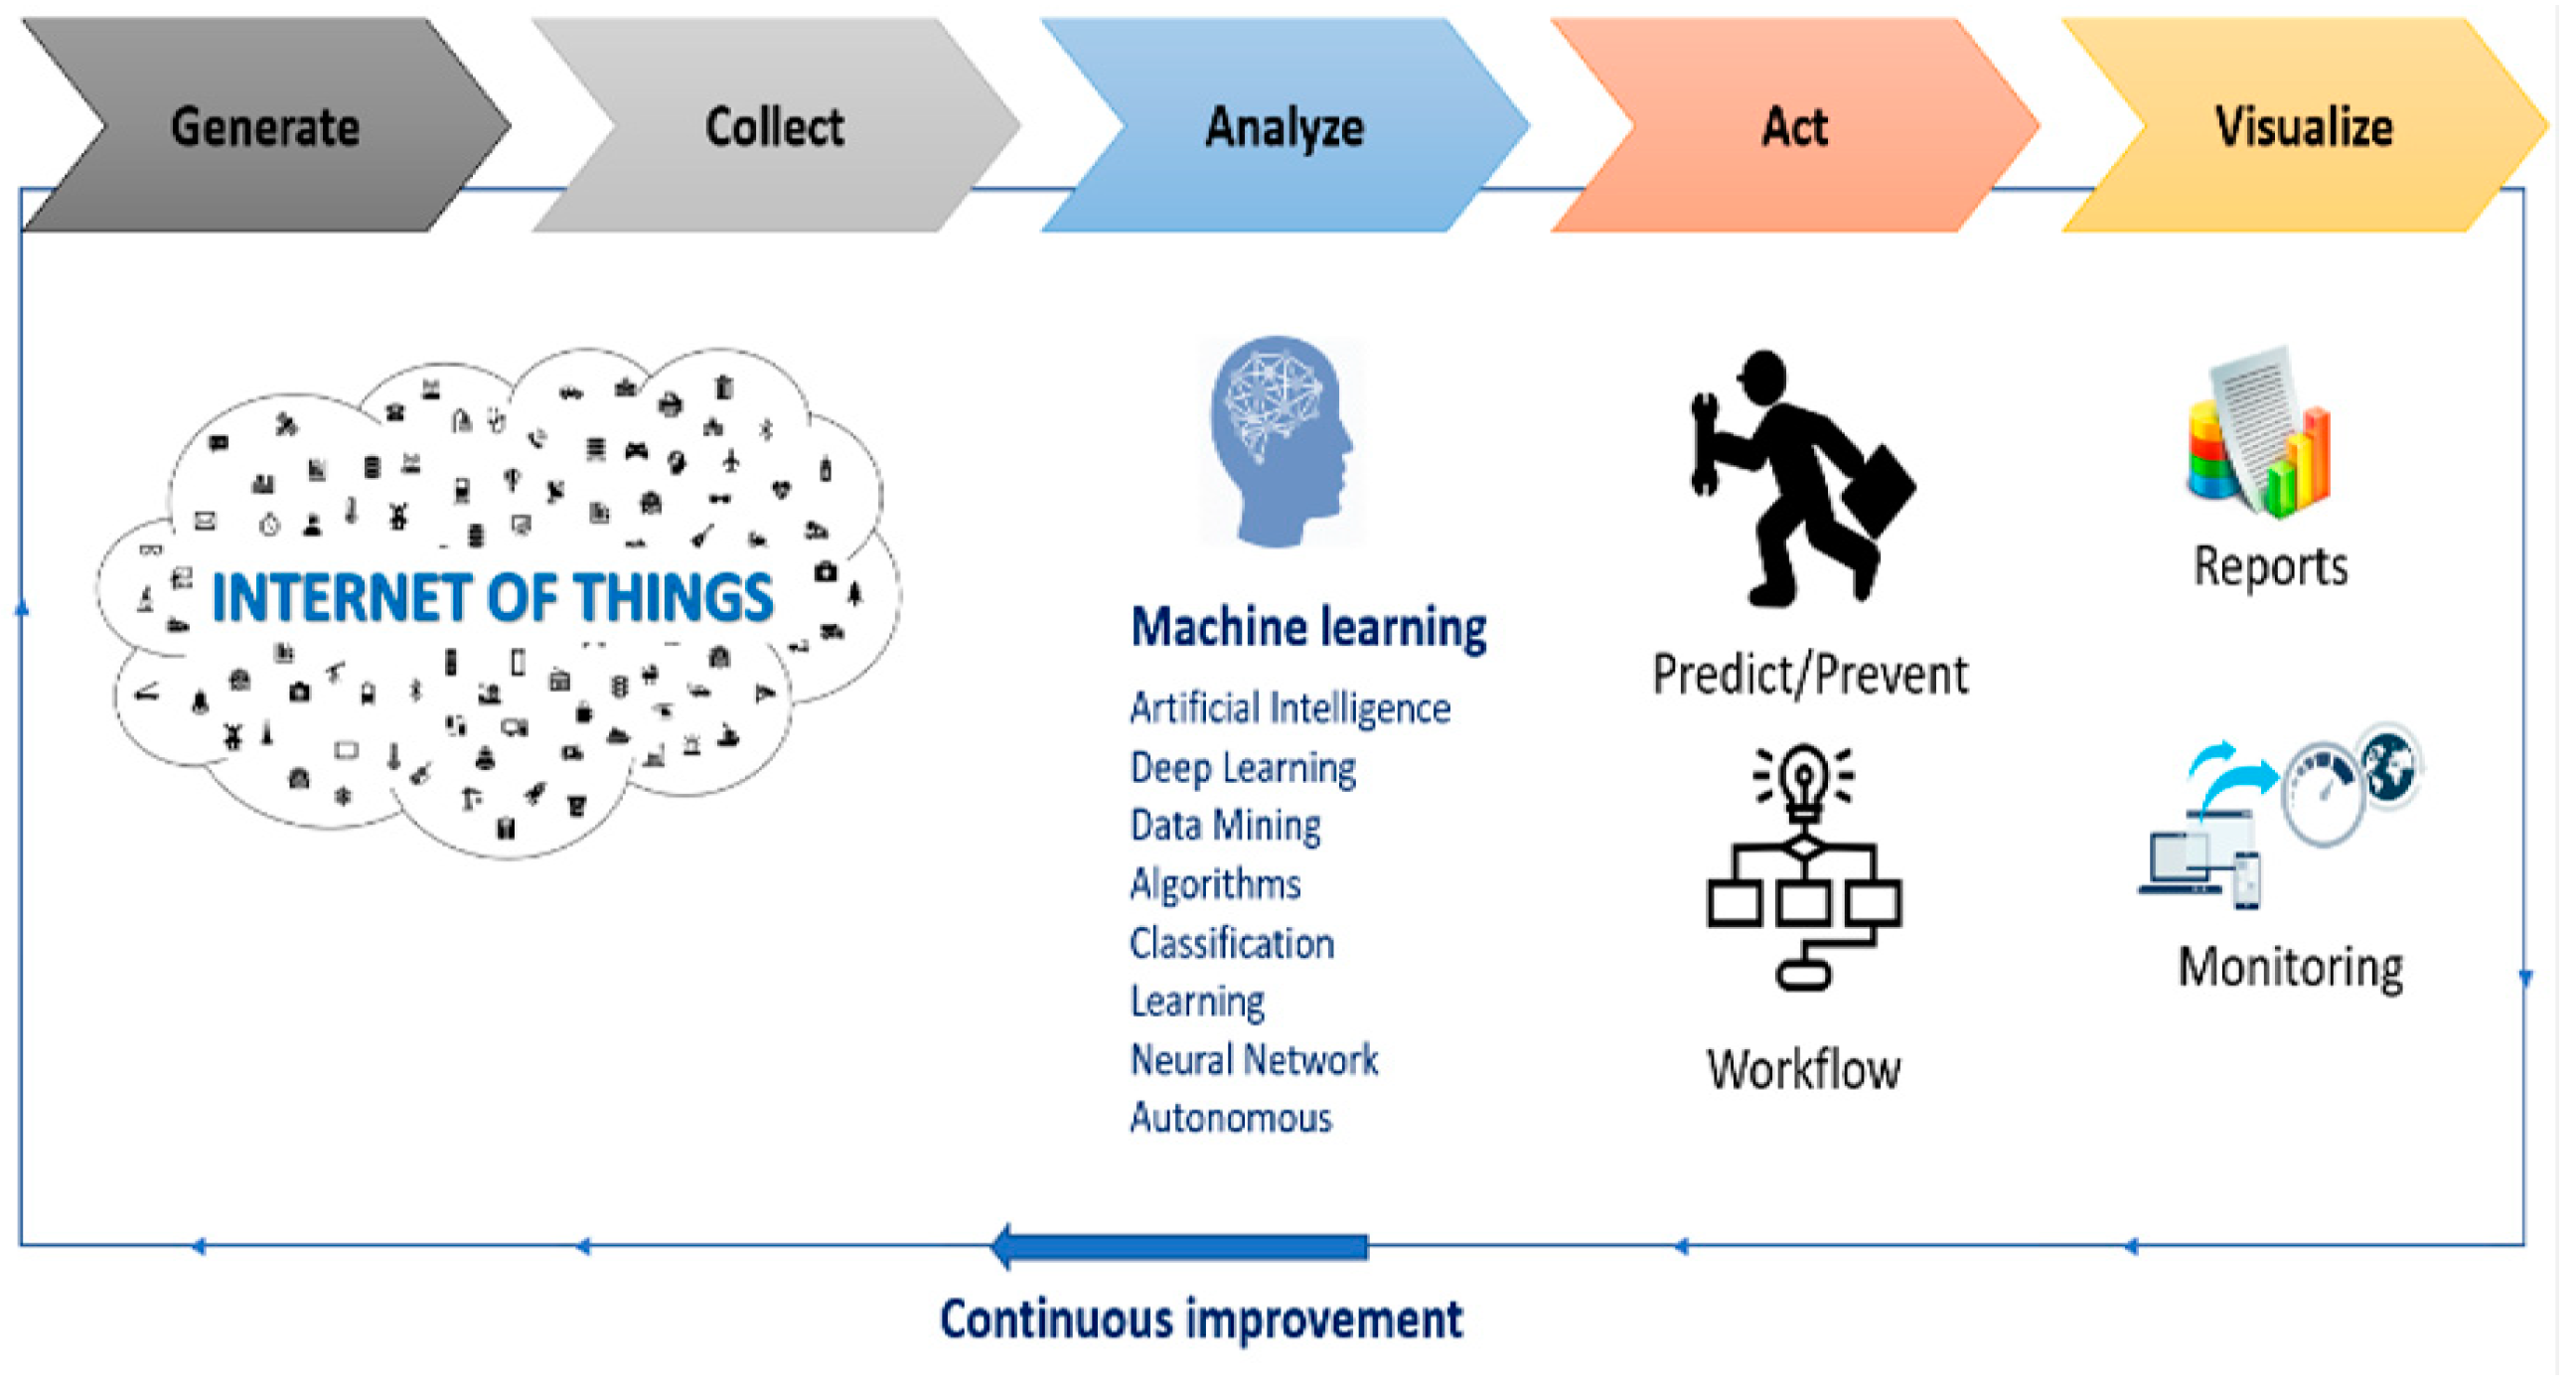
The basis of the Internet of Things is to connect physical entities across the web and to enable the extraction, analysis and processing of data to lead to actions or predictions.
Figure 1.
The extent of the Internet of Things.
The amount of data generated from the Internet of Things keeps increasing and needs to be managed reliably. However, setting up a platform for processing, storing and retrieving information from this huge amount of data remains very complicated and far too costly. That’s why today we are moving towards the Cloud to meet this stringent challenge. By providing a shared infrastructure that enables centralized access from anywhere in the world, the Cloud can efficiently manage this huge amount of data with its resources. Nevertheless, it remains necessary to process these data to extract information, model and forecast the outcome. This is where Big Data comes into play and thanks to its well-developed technologies that allow better analysis and storage. Finally, the collected data will feed Machine Learning algorithms to build solid forecasts and avoid failures.
This revolution has not only helped improve life but has also added value to individuals and businesses. Because thanks to this connectivity between objects in the web, more and more data are collected, analyzed and presented for forecasting purposes. Consequently, the anticipation action is available and greatly helps prevent any possible system failure.
A major challenge for such systems, although their applications span different domains and target different clients, remains the dependence on connectivity and its implications such as latency, throughput and power consumption [1].
To cope with such a problem, it is important to take into consideration the basic need in most Internet of Things platforms, which is the need to transmit the data generated to the Cloud for analysis, processing and storage to follow up on useful information, actions and predictions.
Apart from the need for connectivity, which is the core of the dependencies in such systems and the challenge of its availability, it is important to consider the immense amount of data generated that need to be processed and analyzed in extremely rapid ways.
Characterized by their volume, variety and velocity, these data are used to improve the processes by automating them or by extracting constructive and useful information. This information can serve as the basis for immediate or future actions, thereby offering advanced service levels and changing operational methods.
Due to these collected, processed and stored data, which are then used for monitoring and control in different use cases, the Internet of Things has made its way into various areas such as health, smart cities, industry, and has had a global economic and social impact by being part of the most sophisticated technologies [2,3,4,5,6].
Figure 2.
Application of the Internet of Things.

Indeed, nowadays, there are more and more systems that can monitor the environment such as temperature, humidity, pressure and collect information on their variations over time. Subsequently, through the transmission of these data that will be processed and stored, forecasts can be made. However, in such system, loss of connectivity will lead to data loss, which may lead to erroneous conclusions and results due to lack of real-time information and non-compliance which can be a serious problem affecting the reliability of the information. That is why it is important to come up with a complementary or even an alternative solution which can be used as a backup in such to face such problem.
In this paper, we will begin by presenting the different parts of the Internet of Things infrastructure, starting from the connectivity protocols as it is the main point that represents the bond between all parts, the Edge Computing as it is an alternative to speed up processes, the Cloud Computing as it offers a great solution in terms of infrastructure to handle the big amount of data, and to finish with Big Data and Artificial Intelligence as data must be fast processed and lead to automatic action taken and prediction made. Then, we will present our solution to deal with the risk of wireless connectivity loss that can lead to data loss, by presenting a solution based on a multiple connectivity protocols to keep control on the system and keep data safe. After that, we will show some results from our solution as we provide a responsive web interface for users to monitor, control and consult reports. Finally, we concluded the paper with some results and future work. We believe that, the proposed solution is based on low-cost components that are available massively in the market to build a complete IoT system and thus demonstrated that setting up an Internet of Things platform is more affordable than ever before.
2. Problem Definition
The data created by an IoT device goes through three stages. The first step is the initial creation, which takes place on the device and is then sent over the Internet. The second step is to know how the central system collects and organizes this data. The third step is the continued use of this data for the future by applying some data analytics to extract meaningful conclusions and actionable insights in the form of trends, patterns, and statistics to implement effective decision-making processes. For smart devices and sensors, each event can and will create data. This information can then be sent over the network to the central application. Depending on the device, the network and the energy consumption constraints, data can be sent in real time or in batches at any time. Nevertheless, the actual value is derived from the order in which the data points are created. Indeed, the order in which the data was generated is very important to give rise to more precise analyzes, because, if from the beginning data is distorted, the analysis models on which is based predictions or the implementation of automation tasks on a certain set of conditions, will be defective. Taking as an example a thermostat that measures the energy consumption of a house, if the peak of heating use during the winter is associated in storage with a date during the summer, the findings will be erroneous because this may predict the malfunctioning of the thermostat instead of a normal finding since during the winter the use of heating increases.
However, we have to face the fact that there are many factors that can block data transmission due to an intermittent or dropping wireless connection, such as routers that are not working, interference occurs when conflicting with some wireless devices that are also using the same frequency in the network, the device turns off, a power failure and power disturbances. Such issues can disrupt the entire communication chain, leading to potential data mess and loss. This is why ensure that important data is not lost permanently during a failure and warrant data conformity, it will be necessary to rethink the backup strategies that would allow these systems to remain operational for a given period of time with maintaining continuous information transmission and collection. These strategies could be based on having a redundant network connection. Indeed, to handle a loss of Internet connectivity for a few hours, a redundant connection is one option. But a redundant connection does not just mean wireless and wired connections if they go through the same provider. Instead, a redundant connection uses different providers and network operators. This means that even if one network encounters difficulties, the other network can take over. The ideal is to adopt several strategies to guarantee data continuity and consistency. However, in our solution we will focus on a strategy where several technologies of connectivity will be used with a backup system for data storage.
3. Related Works
An overview of the IoT was presented in [7], including evolution, architecture, protocols, and applications. The authors emphasize the importance of having intelligent sensors that communicate directly without human intervention. In [8], the authors propose a system based on a Raspberry Pi 3 which controls several Arduino which is integrated with a few sensors, motors and other components, for the implementation of a system capable of detecting fires and locating the affected region. The sensors collect data and send it to the Arduino microcontrollers for processing. Subsequently, the Raspberry Pi receives this data and sends a warning message to the administrator using the GSM module. The administrator will then check the validity of the system warning message and confirm or deny the existence of an alert. Continuing with the same type of systems, in [9], a fire monitoring and control system was designed where the authors used various sensors such as flames, smoke, gas sensors managed by a Raspberry Pi to detect the fire and observe the fire extinguishing process. They also used the GSM / GPS system to locate the location of the fire. In [10], the authors present a fire alarm detection system designed with the ZigBee wireless module. The system, which comprises an Arduino Uno microcontroller, a temperature sensor, an audible alarm, and operating software, uses the temperature sensor to detect fire and transmit signals from up to 10 meters away. In another type of system was implemented in [11], the authors built a low-cost home security system which allows remote monitoring of the house. Starting from the fact that there are several home security systems having issues such as the delay in alerting by phone calls, SMS, or email transfers in adverse situations, they propose a system to detect an intruder or any other event when there is no one at home. This system uses a PIR sensor to detect an intruder and a camera to capture the image of the intruder. It allows the user to control the house remotely more effectively and efficiently. In [12], authors present a weather station based on the IoT. It uses environmental sensors to monitor the weather at a location and uploads the data to a server in real time. The weather parameters are downloaded and live recorded. The system also allows the user to set alerts for instances and if the environment settings exceed certain values, the system will provide warnings to the user. This article gives a clear idea of the sensors, the acquisition of sensor data, the basic decision to perform and control movements under current conditions and how the sensor data is uploaded to a server.
Focus of the Paper
After going through the literature survey on the subject and the implementation of smart monitoring systems, we observed that the reduction of latency is a paramount parameter in real-time surveillance systems such as home security. This first observation will be considered when setting up our system by integrating edge computing for faster processing and action execution. In addition, we have noticed the efficiency of using components like Arduino and Raspberry Pi to set up a highly efficient IoT system, which is an advantage for us as our system is based on the use of such components which are inexpensive and available in the market.
The contribution and the novelty of this paper is that the system put in place offers monitoring, control and alerts in real time with the adoption of a strategy based on several connectivity technologies and a local backup system to prevent the risk of data loss and ensure the proper functioning of the system in the event of loss of the Internet connection.
4. IoT Infrastructure
Figure 3.
Internet of Things Infrastructure.
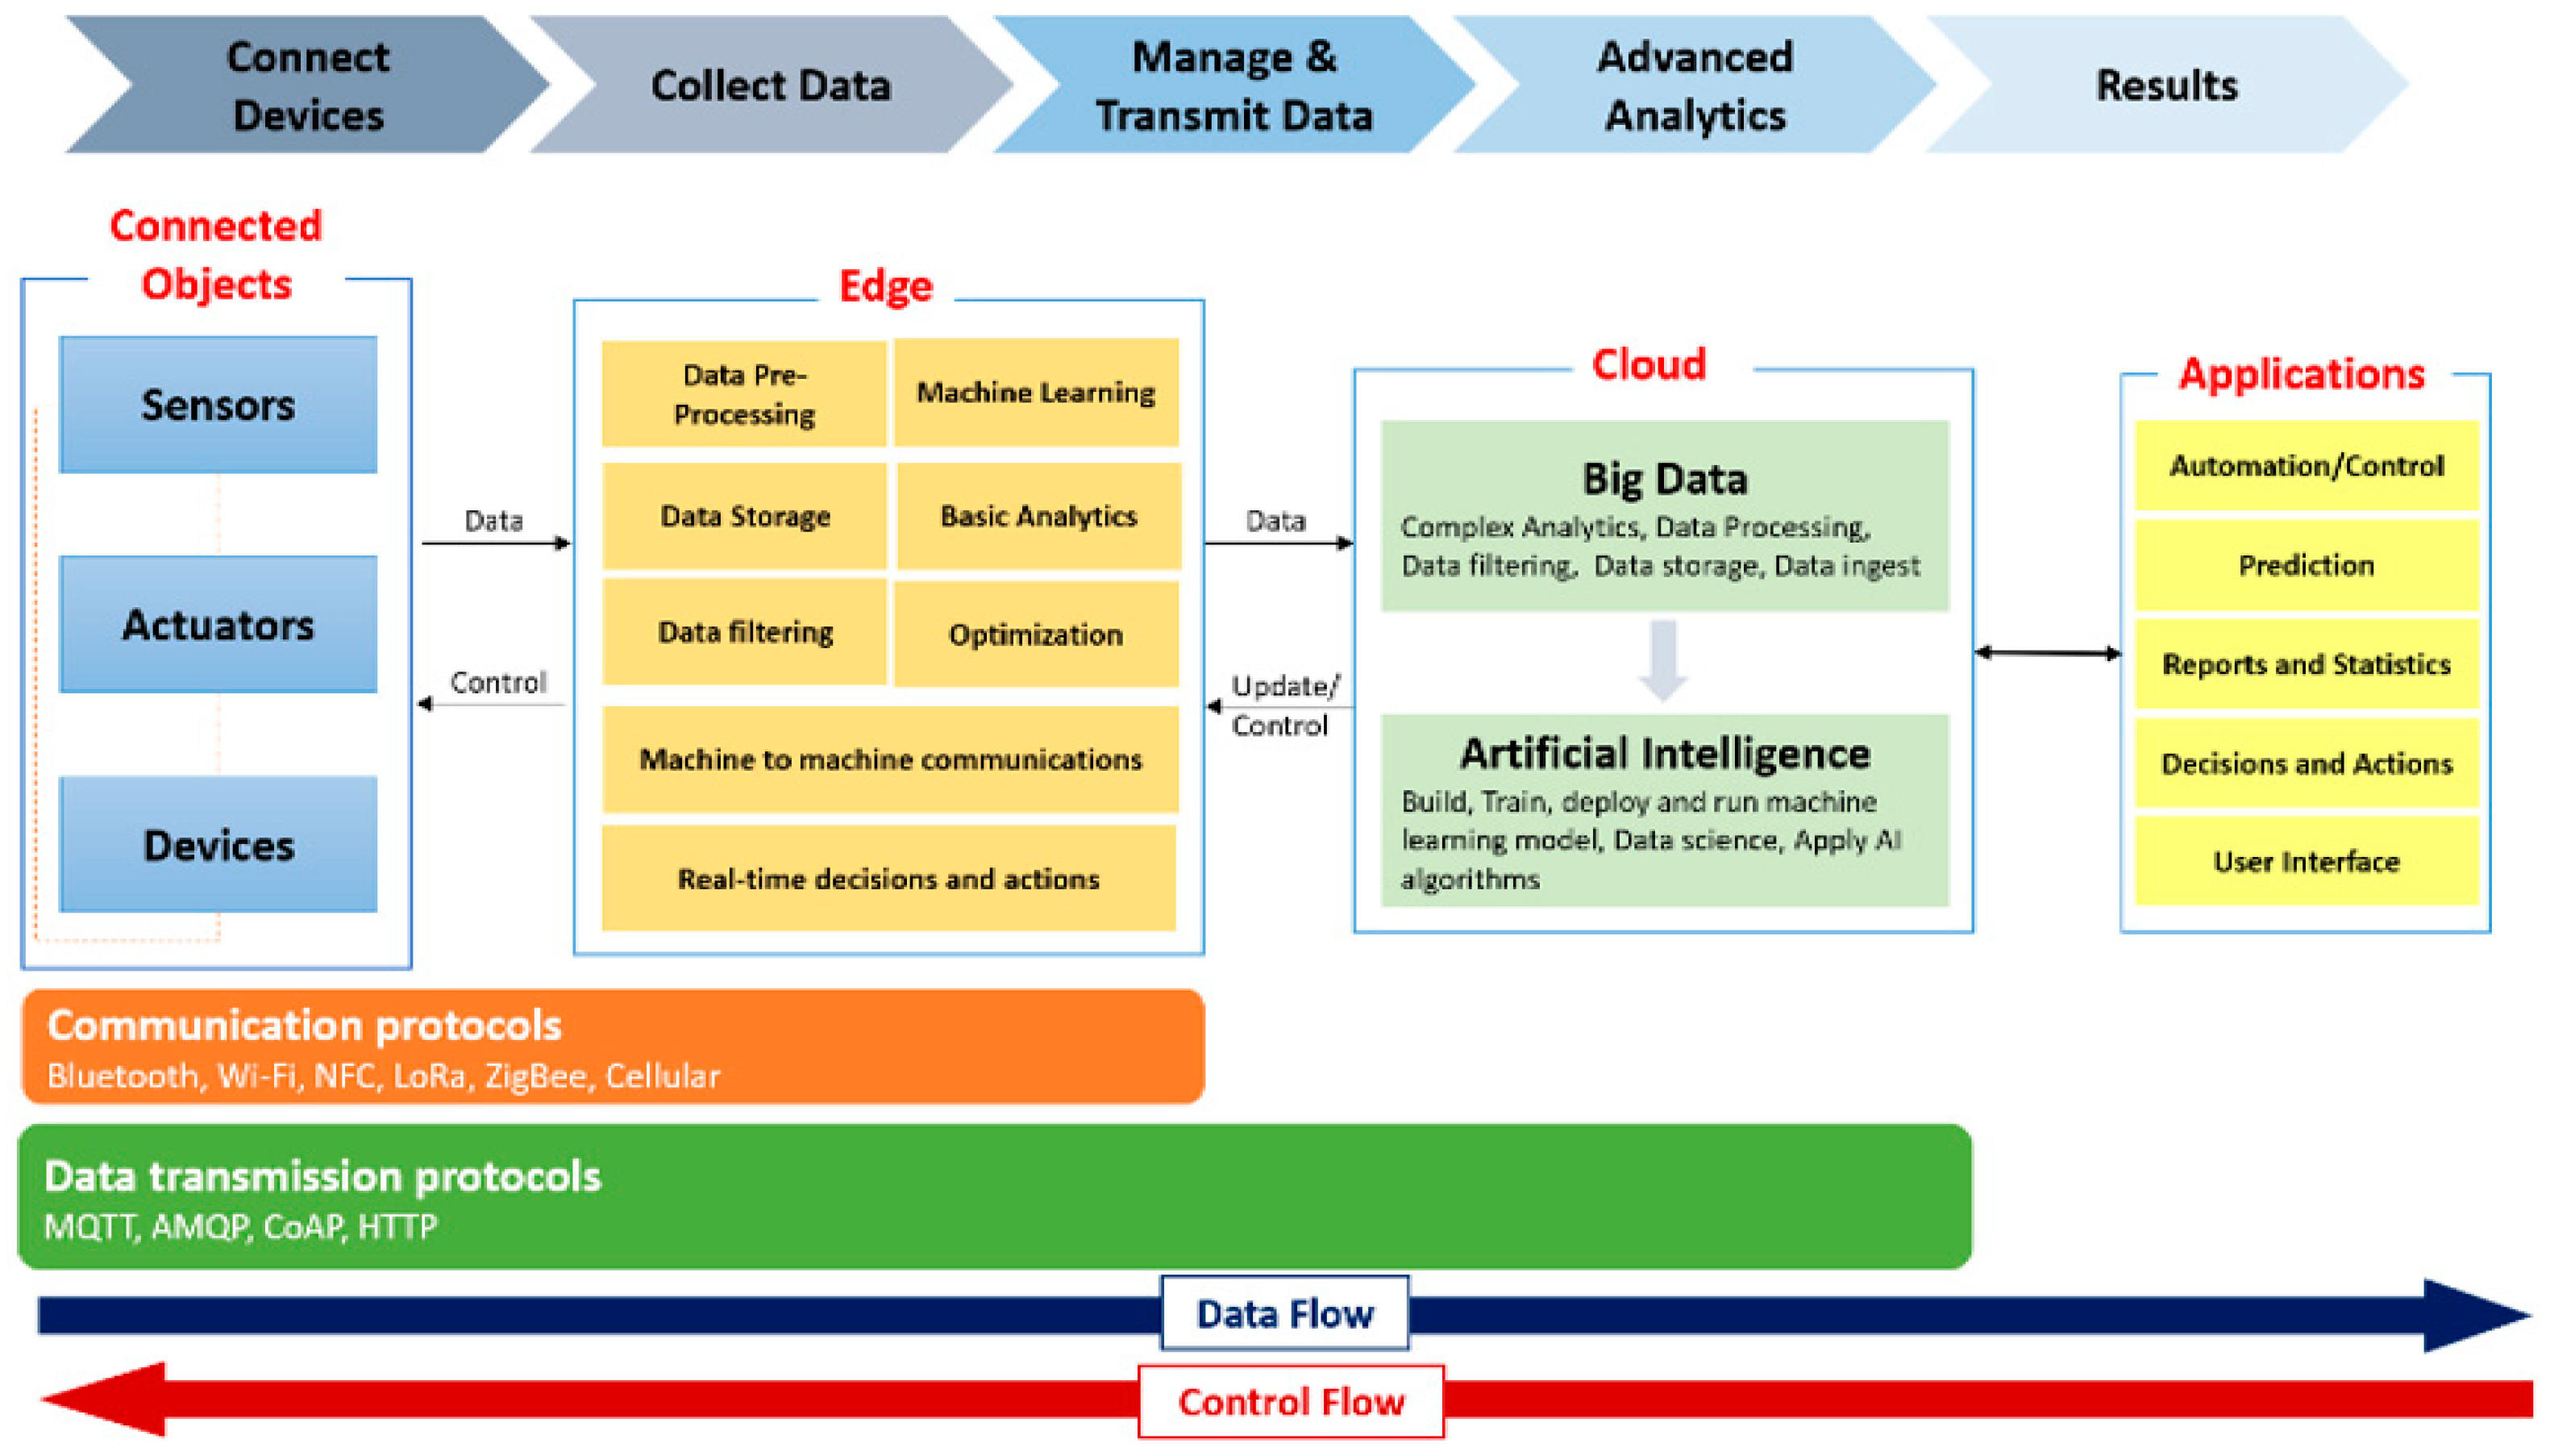
The typical infrastructure of the Internet of Things consists essentially of four main modules [18]. These modules are connected objects data exchange, connectivity and data transport medium, processing and storage and finally the applications.
First, objects, such as sensors [19], play the role of input by feeding the system with data collected on their environments, such as temperature sensors or video cameras and actuators that are the outputs that perform the actions.
Then, this collected data must be transmitted, hence the second component which is the connectivity to ensure the transfer of data for their processing. There are several types of technologies that can perform data transfers such as cellular, Wi-Fi, or direct connection via Ethernet cables.
Next, followed by the collection and transfer of data that are characterized usually by their large amounts and their diversity. The third, component which is the data processing which is complex and central task. Indeed, since the main purpose of this data collection is the extraction of relevant information, it is essential to proceed with the processing of these data, which must in some cases give rise to actions to be undertaken.
Finally, the fourth component is the applications including user interfaces and user experience. In the end, even though we tend to automate systems as much as possible, it’s important to let users track and report statistics. In addition to allowing access and monitoring, it is necessary to give the user the ability to control and execute some needed actions.
4.1. Communication and Data Transmission Protocols
Communication is the essential element of the establishment of the Internet of Things system allowing the interconnection of different objects since the idea behind the concept is that everything must be connected. Indeed, in the absence of such components, the system cannot be set up and collection, detection, storage and processing become unnecessary.
Selecting the right connectivity protocol is the key to the success of the project. It is therefore important to analyze system requirements, such as communication intervals, data flow, security, and bandwidth. [14,15]
Protocols for the Internet of Things could be split into two groups. Communication protocols such as Bluetooth, Wi-Fi, LoRa and data transmission protocols such as MQTT and CoAP. [16]
As shown in Table 1, the emergence and diversity of communication protocols give us a wider choice for the type of connectivity, the fundamental element of any Internet of Things projects, adopted for the transmission and reception of data.
However, each technology has its advantages and disadvantages and can be effective in one context and less in another. Indeed, each protocol offers different capacities and qualities to meet the objectives of the system to set up. Therefore, it is important to take into consideration the needs of the Internet of Things systems such as short and long-distance data transmission, the massive deployment of different integrated technologies and including the Cloud and Edge Computing systems as well as offering real-time communication.
An advantageous alternative is to leverage the diversity of connectivity protocols and create a hybrid solution that overcomes the limitations of one protocol with another, resulting in better results, increased availability, and improved management of connectivity for large-scale projects.
As presented in Table 2, the same goes for data transmission protocols with each having its advantages and disadvantages, which implies that each protocol can be useful in different operating scenarios.
However, to make the right choice and adopt the most advantageous protocol for the system, it is necessary to take into account the main factors that will be involved, such as quality of service, security, performance, power, size, the cost and reliability required for the application.
4.2. Edge Computing
Figure 4.
Edge Computing and IoT [26].
Figure 4.
Edge Computing and IoT [26].

Faced with the need for more processing speed to take action in certain use cases that must be in real time and knowing the limitations of the Cloud in terms of latency since the information has to be transmitted to process and return, Edge Computing is an alternative that comes to face these limitations and essential needs. [19]
In fact, bringing the data processing close to the action taking devices or called actuator through the Edge Computing, reduces the response time compared to the communication and storage in the Cloud. In addition, Edge Computing contribute to more efficient data management, as data processing in the Edge will allow a much better quality of filtering and finish the priorities more efficiently of the data. Indeed, by eliminating unnecessary data and presenting only the important data and good quality for processing and backup in the Cloud which gives rise to better analytics and prediction.
4.3. Cloud Computing
Figure 5.
Cloud Computing and IoT [25].
Figure 5.
Cloud Computing and IoT [25].
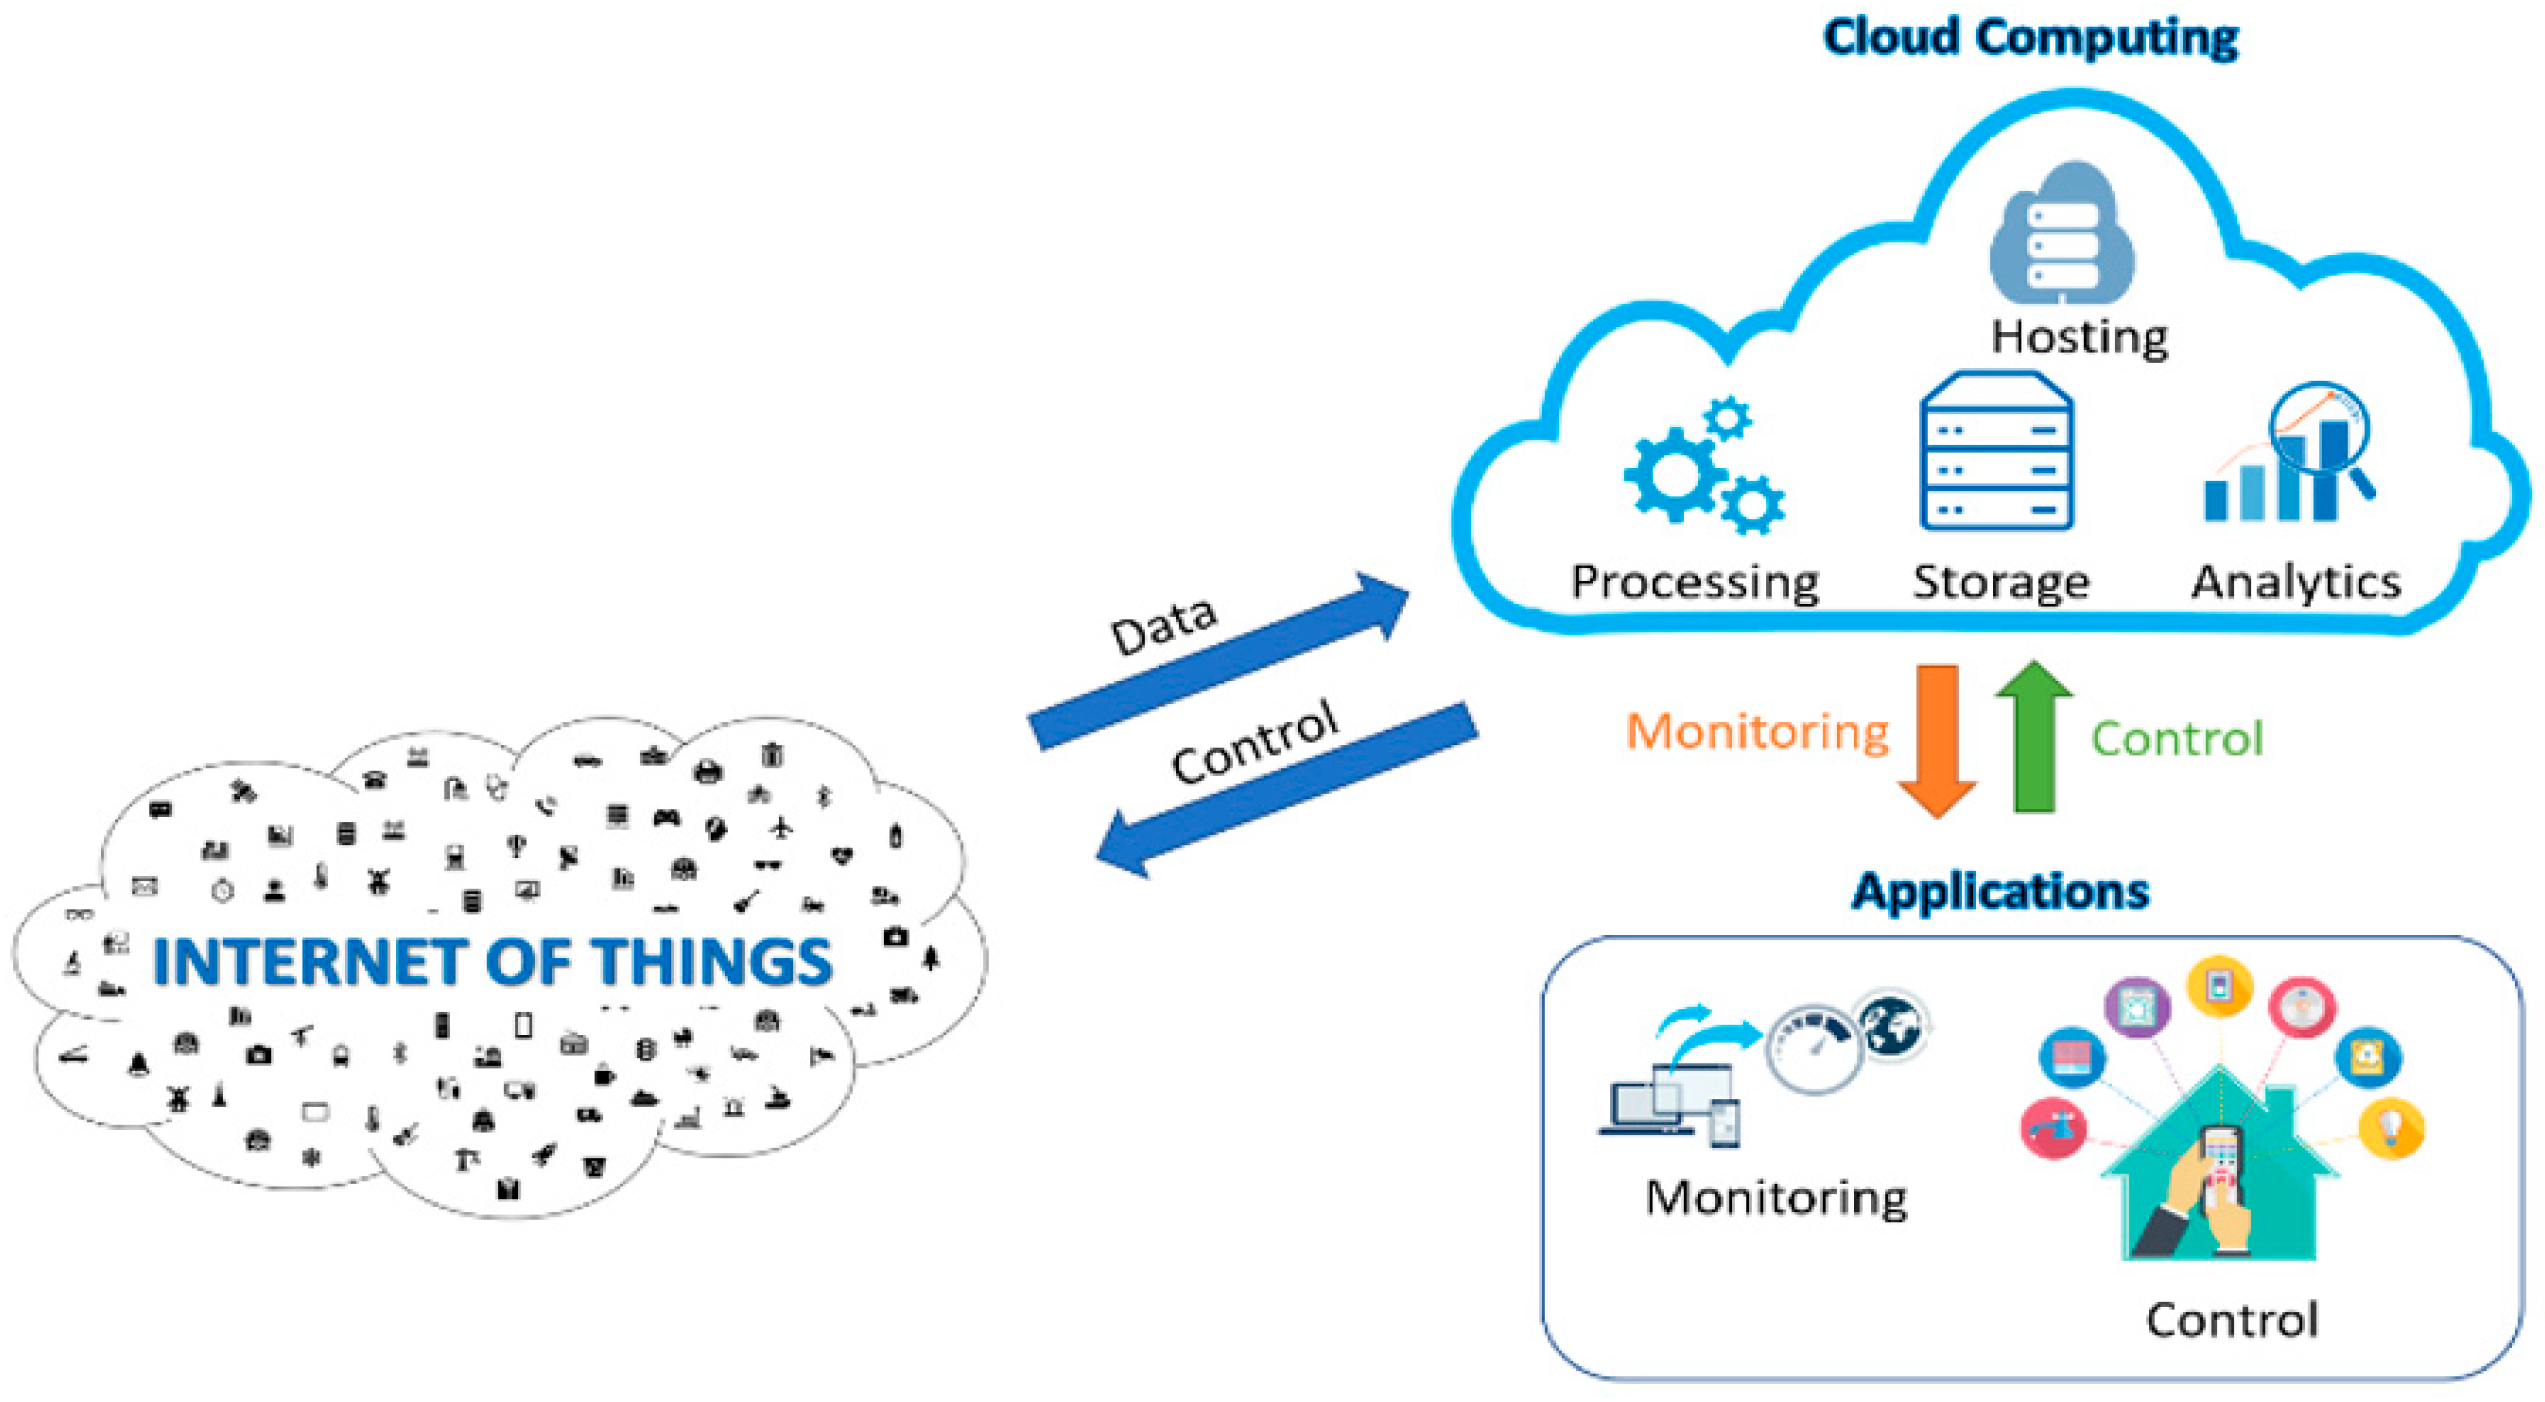
In the Internet of Things systems, huge amounts of data are generated, these data, put aside the need for their storage for prior consultation, they must be processed and structured in order to derive relevant and useful information [17,18].
This need has made the Cloud and the Internet of Things become two very closely associated future Internet technologies and the convergence of these two technologies has brought many benefits among them citing, the third-party infrastructure that offer the Cloud for Internet of Things systems, the huge storage spaces for sharing and saving data for use, increasing performance with available resources that enable better performance for data processing and data transmission and to finish the benefit of the payment method for Cloud platforms as you only pay for what you use, that save money where users do not have to worry about buying storage, they can easily scale storage as the data generated increases and pays for the storage that they consume.
4.4. Big Data
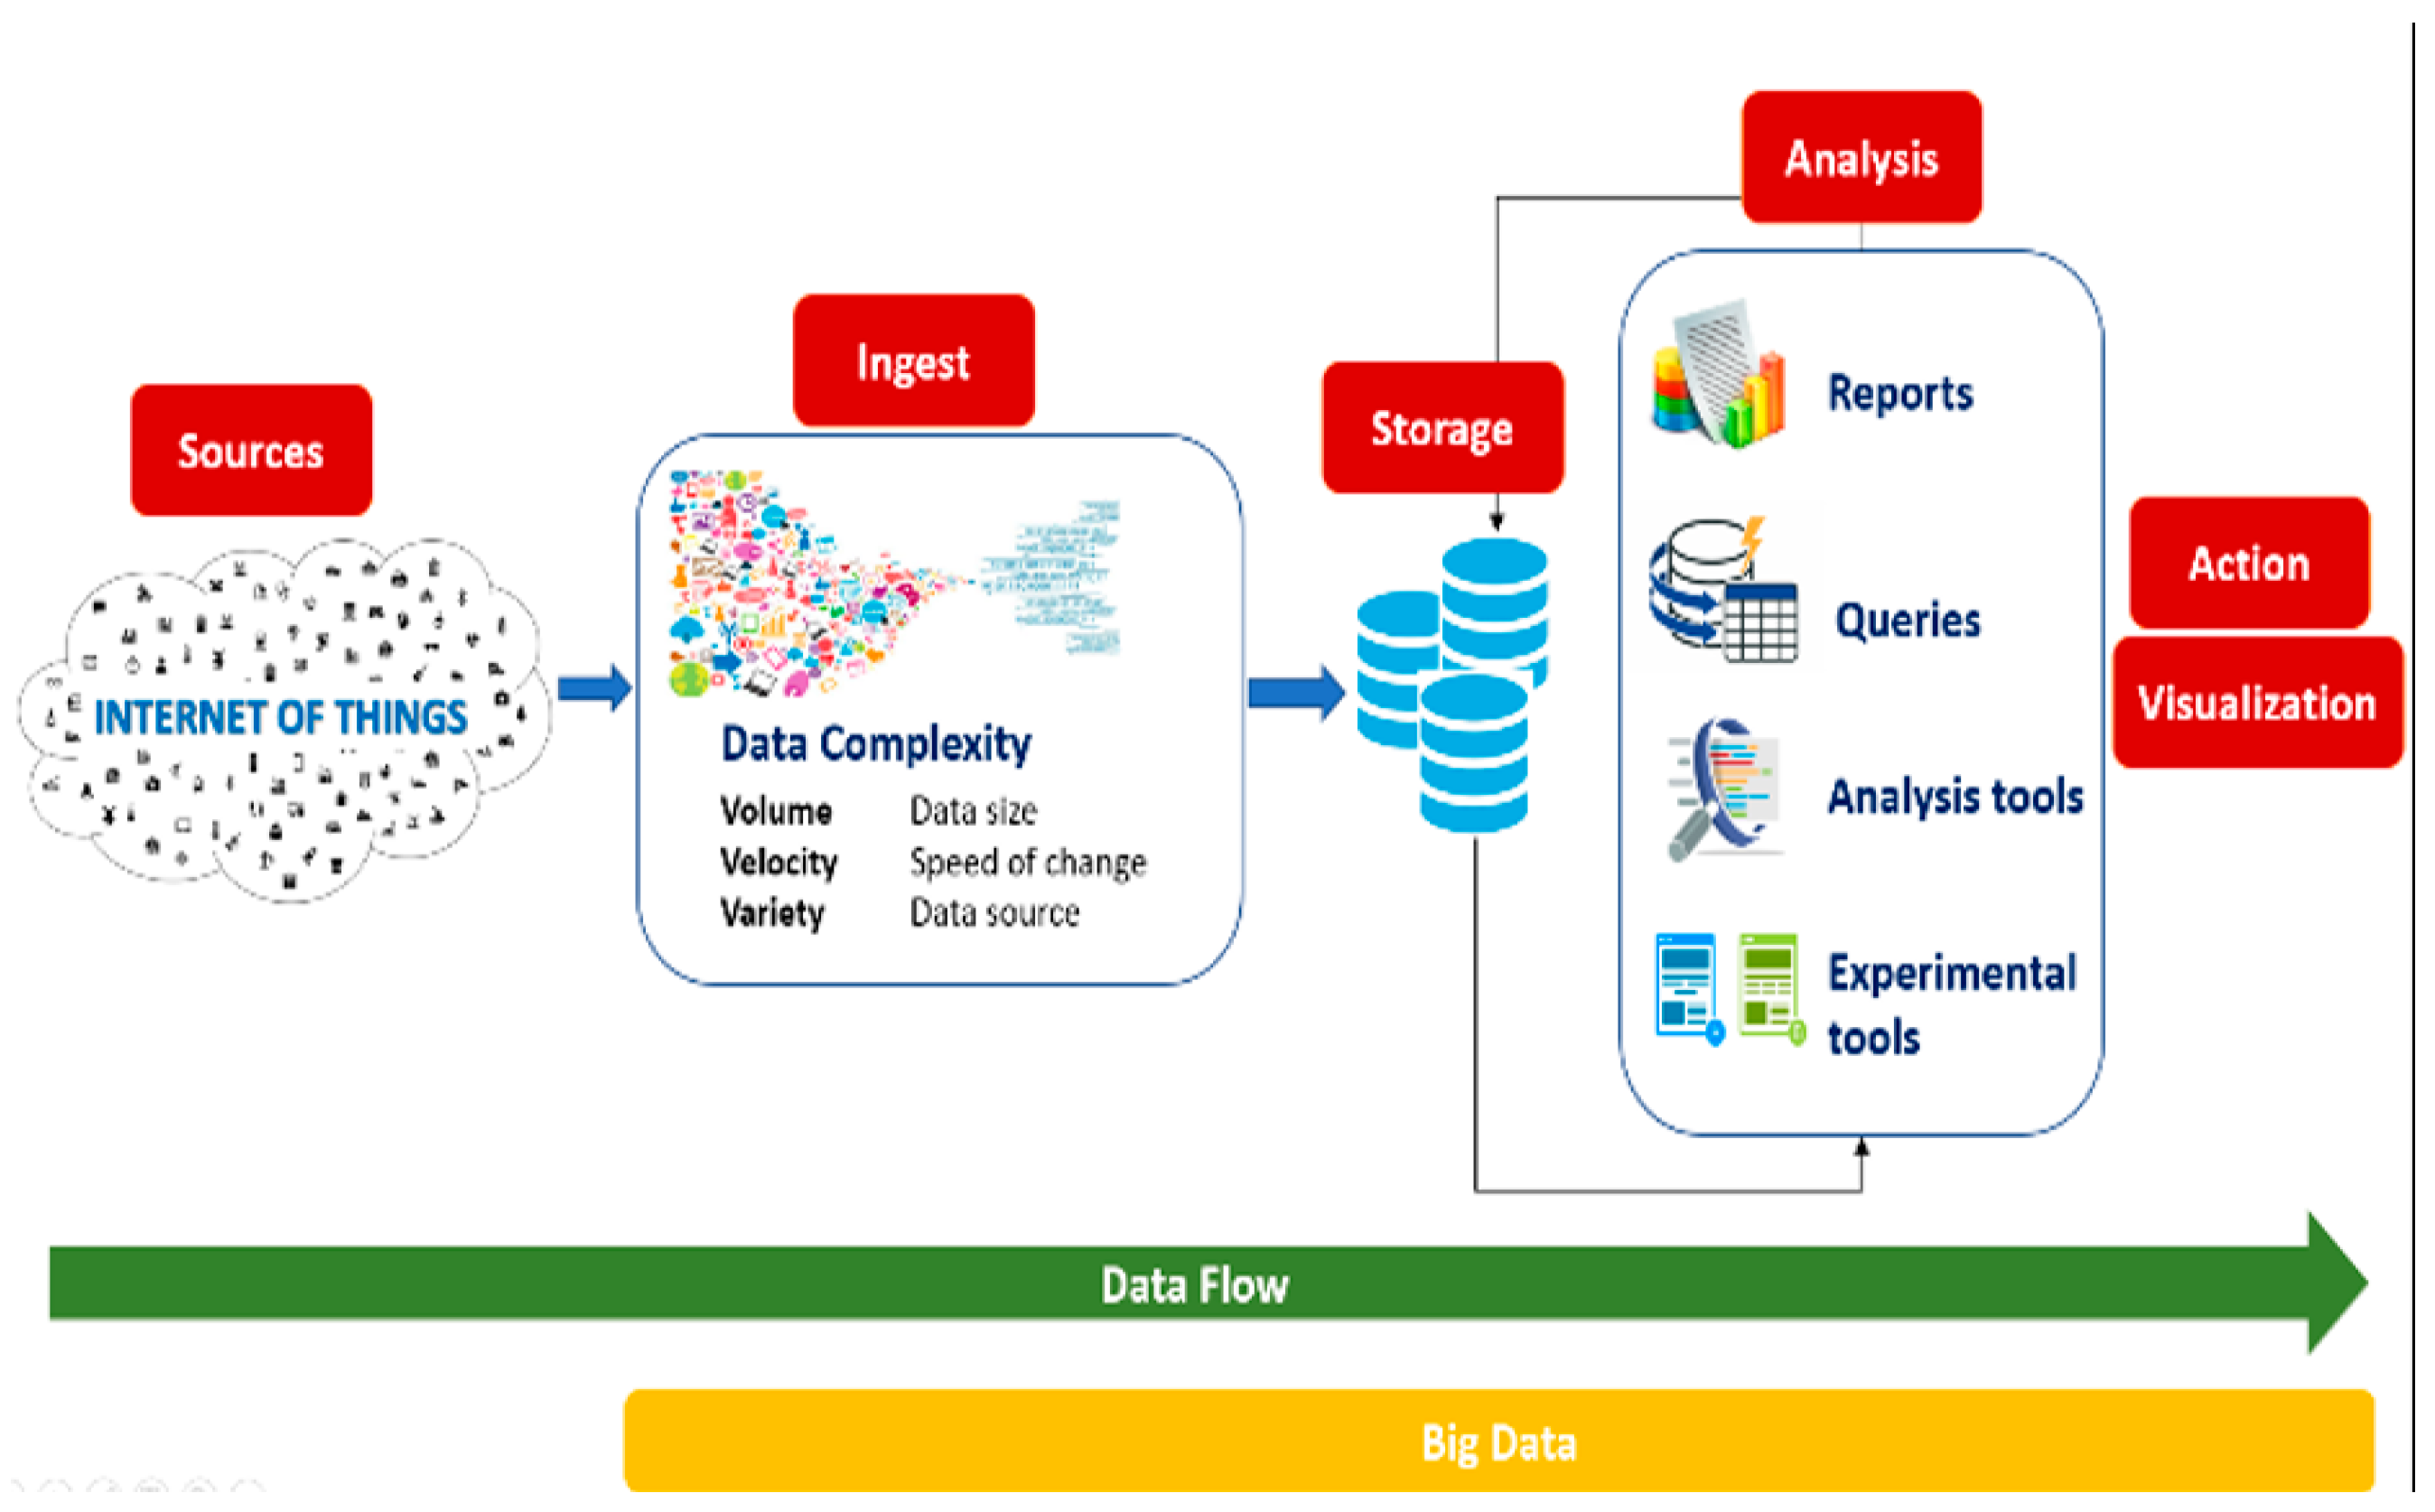
Figure 6.
Big Data and IoT.
According to studies, Cisco IBSG [20] estimated that 50 billion devices will be connected to the Internet from 2011 to 2020 (physical objects), which implies more and more devices connected and data generated, which must be collected, processed, analyzed and stored in the fastest way possible.
Indeed, it has already been proven that the advantage of the Internet of Things comes from taking advantage of these generated data otherwise its use becomes limited and its expansion would not be as important.
It is at this level that the concept of Big Data comes into play, the technologies put in place to meet the challenges of the continuous increase in the quantity of data and allow the improvement and the increase of the process of treatment and storage of this data source characterized by its volume, velocity and variety, to follow up on better results when making decisions. [21]
The processing of the data starts with the collection of data generated from connected objects. These generated data can be unstructured or semi structured and are characterized by their velocity, variety and volume. Then, this large amount of data is stored in large data files. After that, the data stored will be analyzed by specific tools. And finally, these data analyzed will give rise to results in several forms such as reports and statistics.
The advantage of Big Data is that it will allow to examine, reveal trends, find invisible patterns, find hidden correlations, and reveal new information.
4.5. Machine Learning (ML) and Artificial Intelligence (AI)
Figure 7.
Machine Learning and IoT.
Deploying thousands of sensors at different locations results in the accumulation of huge amounts of data and information sources for organizations and businesses. However, the exploitation of this data source is not obvious until the processes are automated because the human capacity in terms of the speed of processing and analysis may be greatly exceeded by the machines. In order to take advantage of such data source Machine Learning and Artificial Intelligence comes to end this problem and make the most of this data source and information. Indeed, thanks to Machine Learning, the generated data will be analyzed and processed to build models and understand behavior in order to data to follow up on results, findings and predictions made. This is what made many companies like Siemens and others effectively apply the predictive maintenance for their products which made them reduce maintenance costs, unexpected failures and downtime for repairs in one hand. And increase production, safety and profits, on the other hand. [22,23,24,25]
5. Proposed Solution
The proposed solution includes several steps such as interfacing circuits, sensors, actuators and microcontrollers, development and optimization of firmware [26], configuration and implementation of servers and databases, creation and the development of user interfaces.
Figure 8.
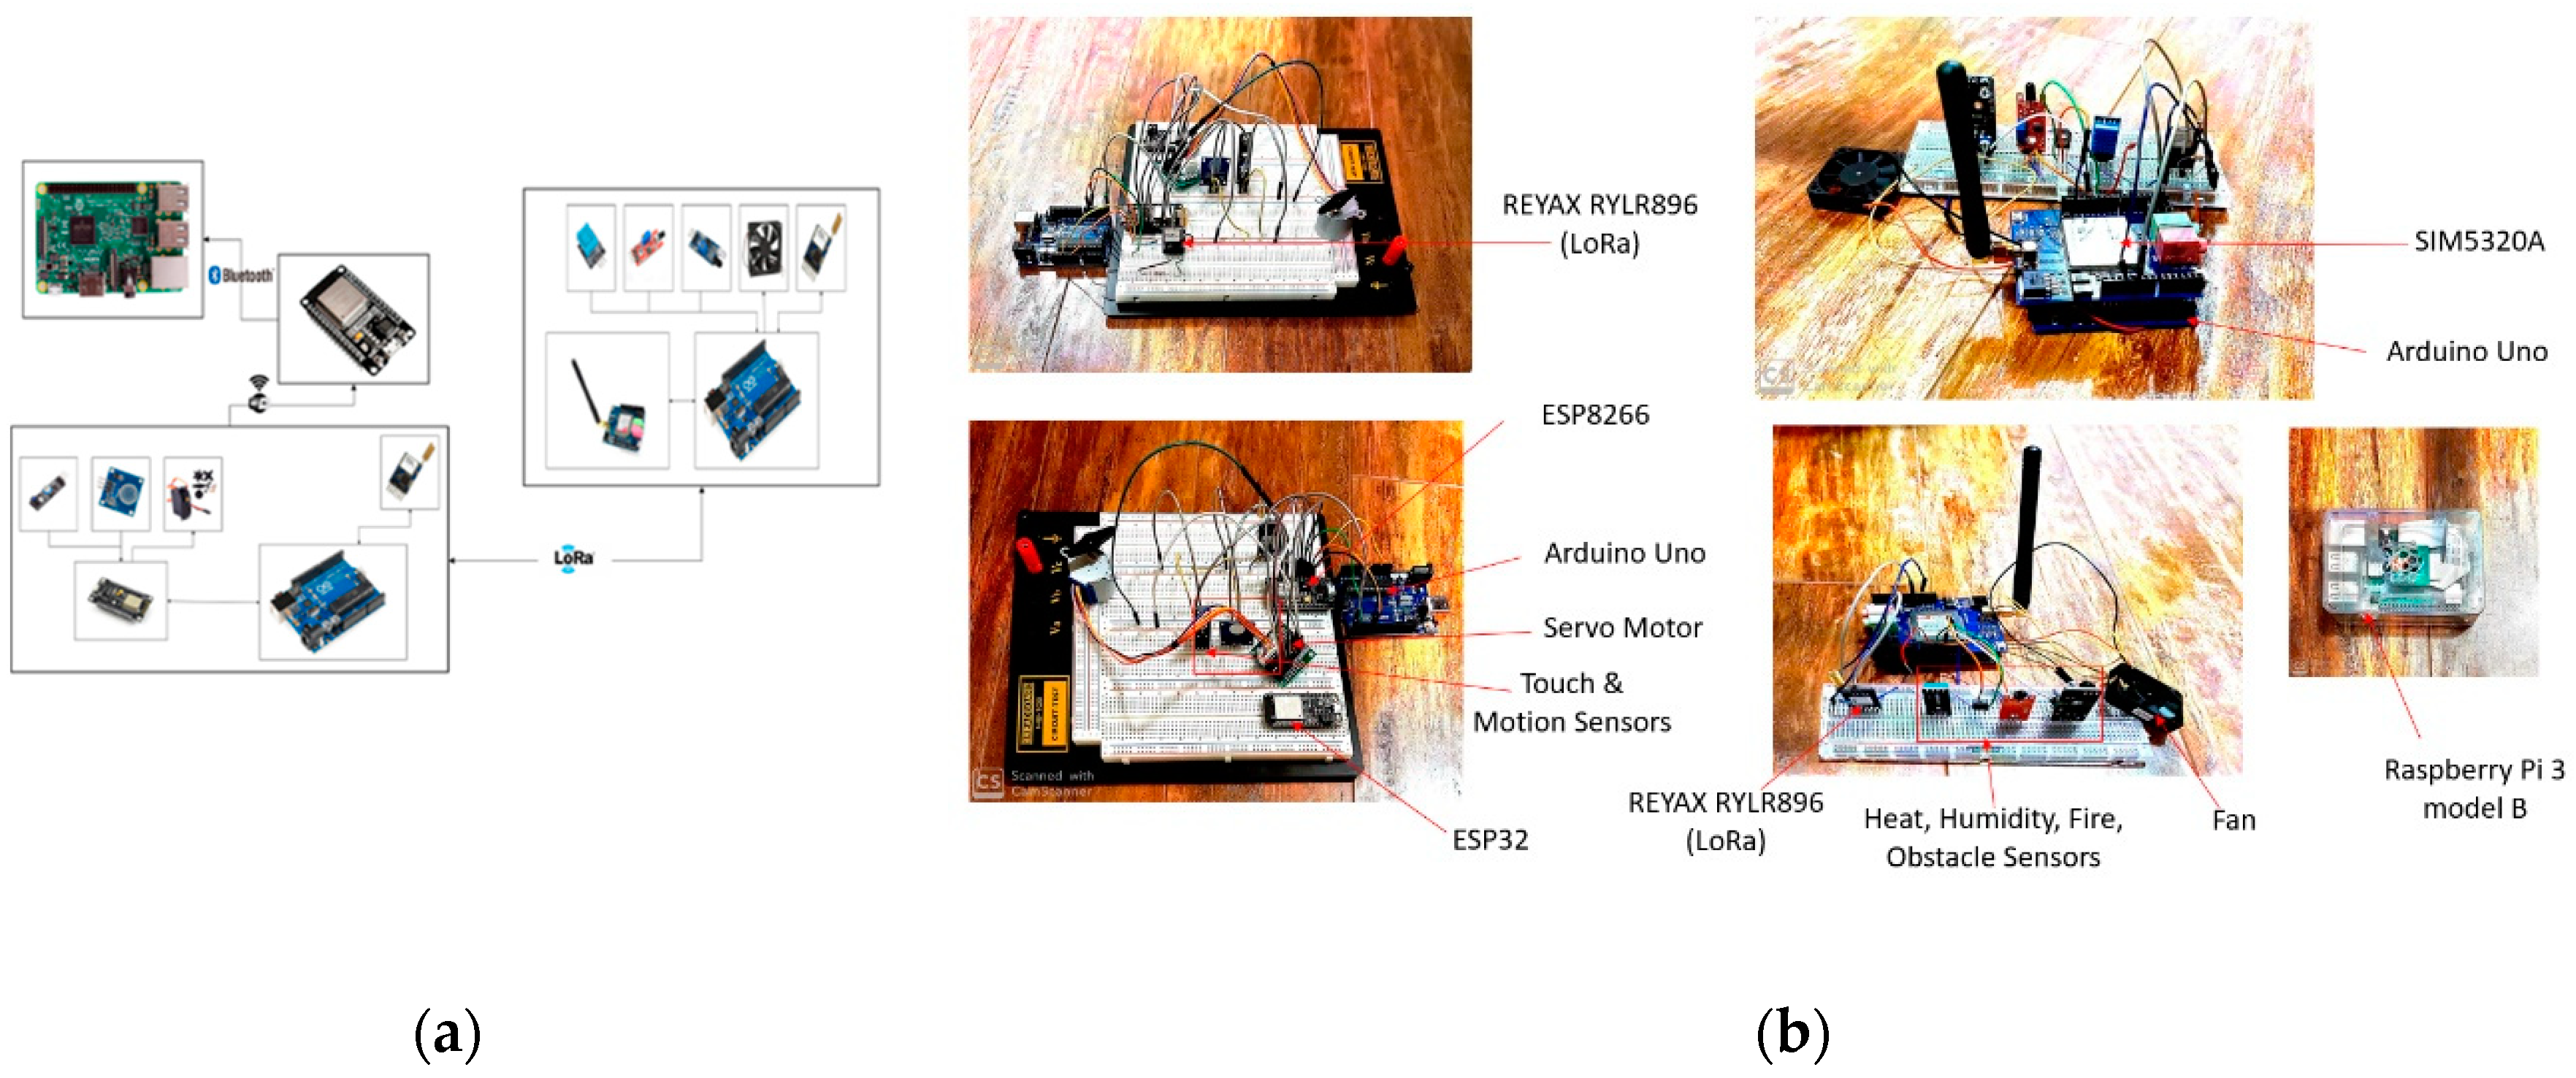
Circuit overview: (a) Circuit overview; (b) Circuit component overview.
5.1. Circuit Overview
Our solution is composed of three physically independent modules with each module that includes different components and offering diversified functionalities. Nevertheless, these modules will communicate effectively and exchange data through different communication protocols. Each module plays a role in our system and contributes to the efficiency and smooth functioning of the system.
The identification of the components included in each module of the system were chosen after having carried out a study and in-depth analysis of the needs of the solution. This process allowed us to identify the elements to be included in each part based on the objective of the system. The system parameters such as security, the most critical and risky elements, the specificities of each component, rate and transmission delay, the expected result and the available equipment to eventually come up with three modules as follows:
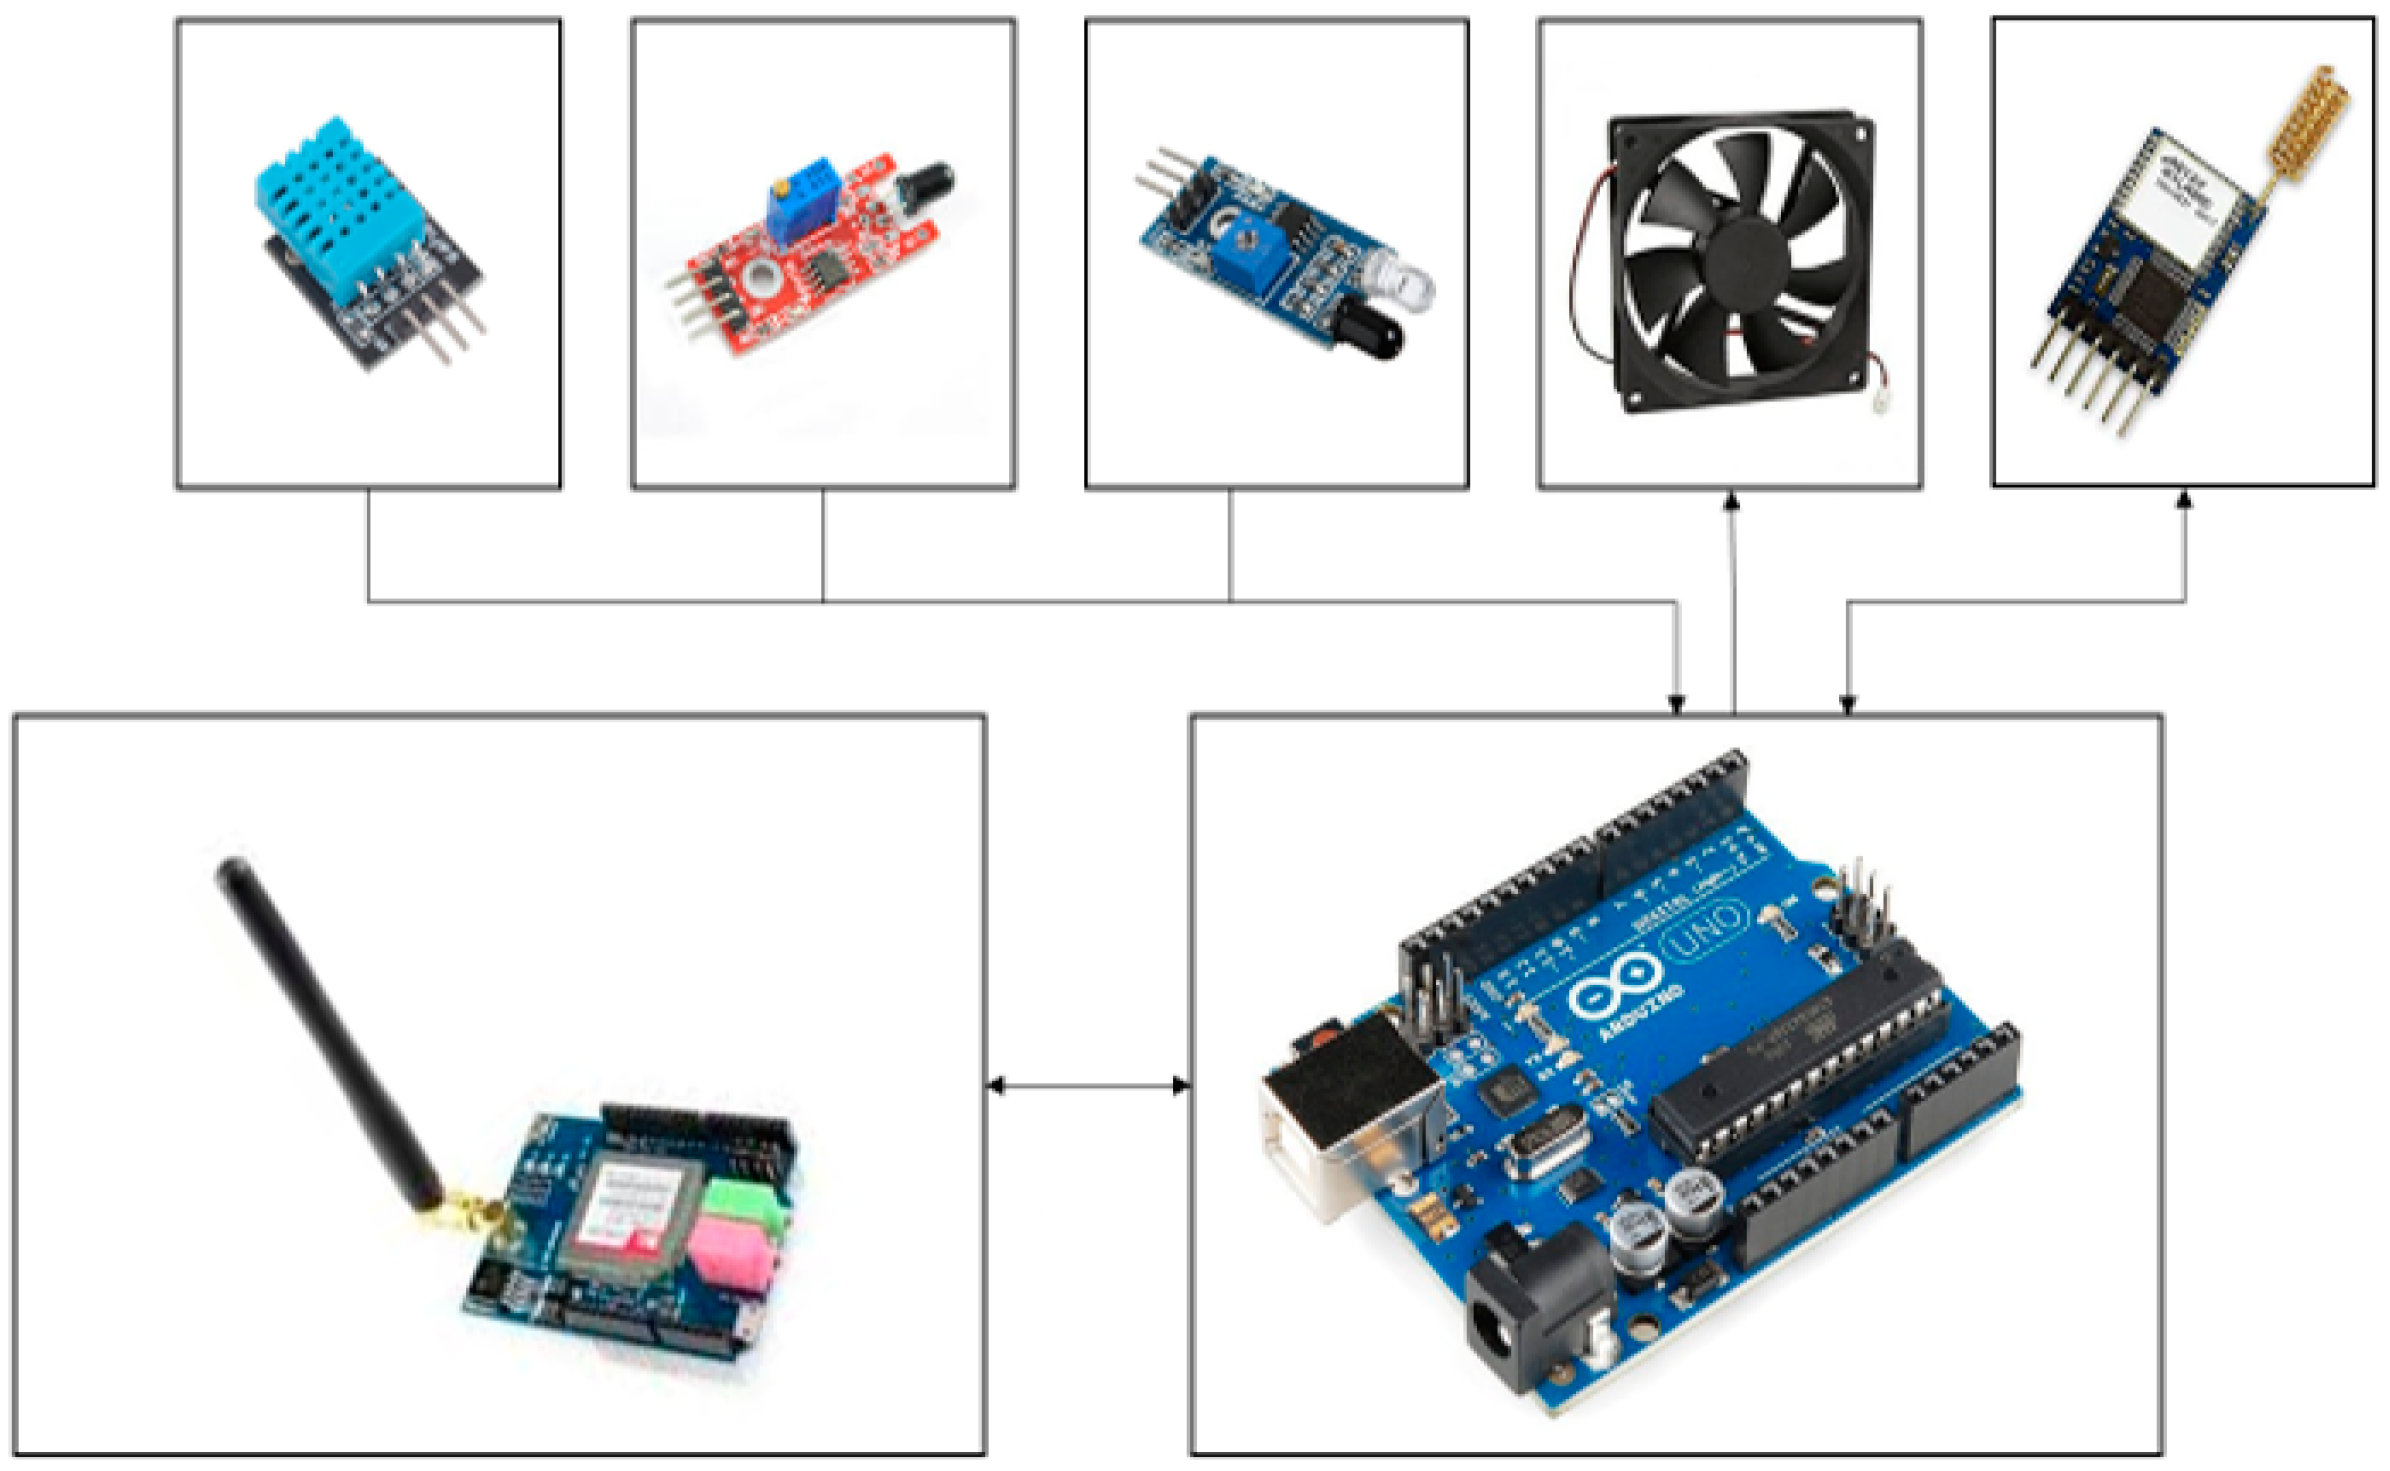
First Module (Figure 9): This module includes an Arduino Uno [27], REYAX RYLR896 LoRa module [28], SIM5320A 3G cellular module [29], along with various sensors and actuators.
Figure 9.
First module.
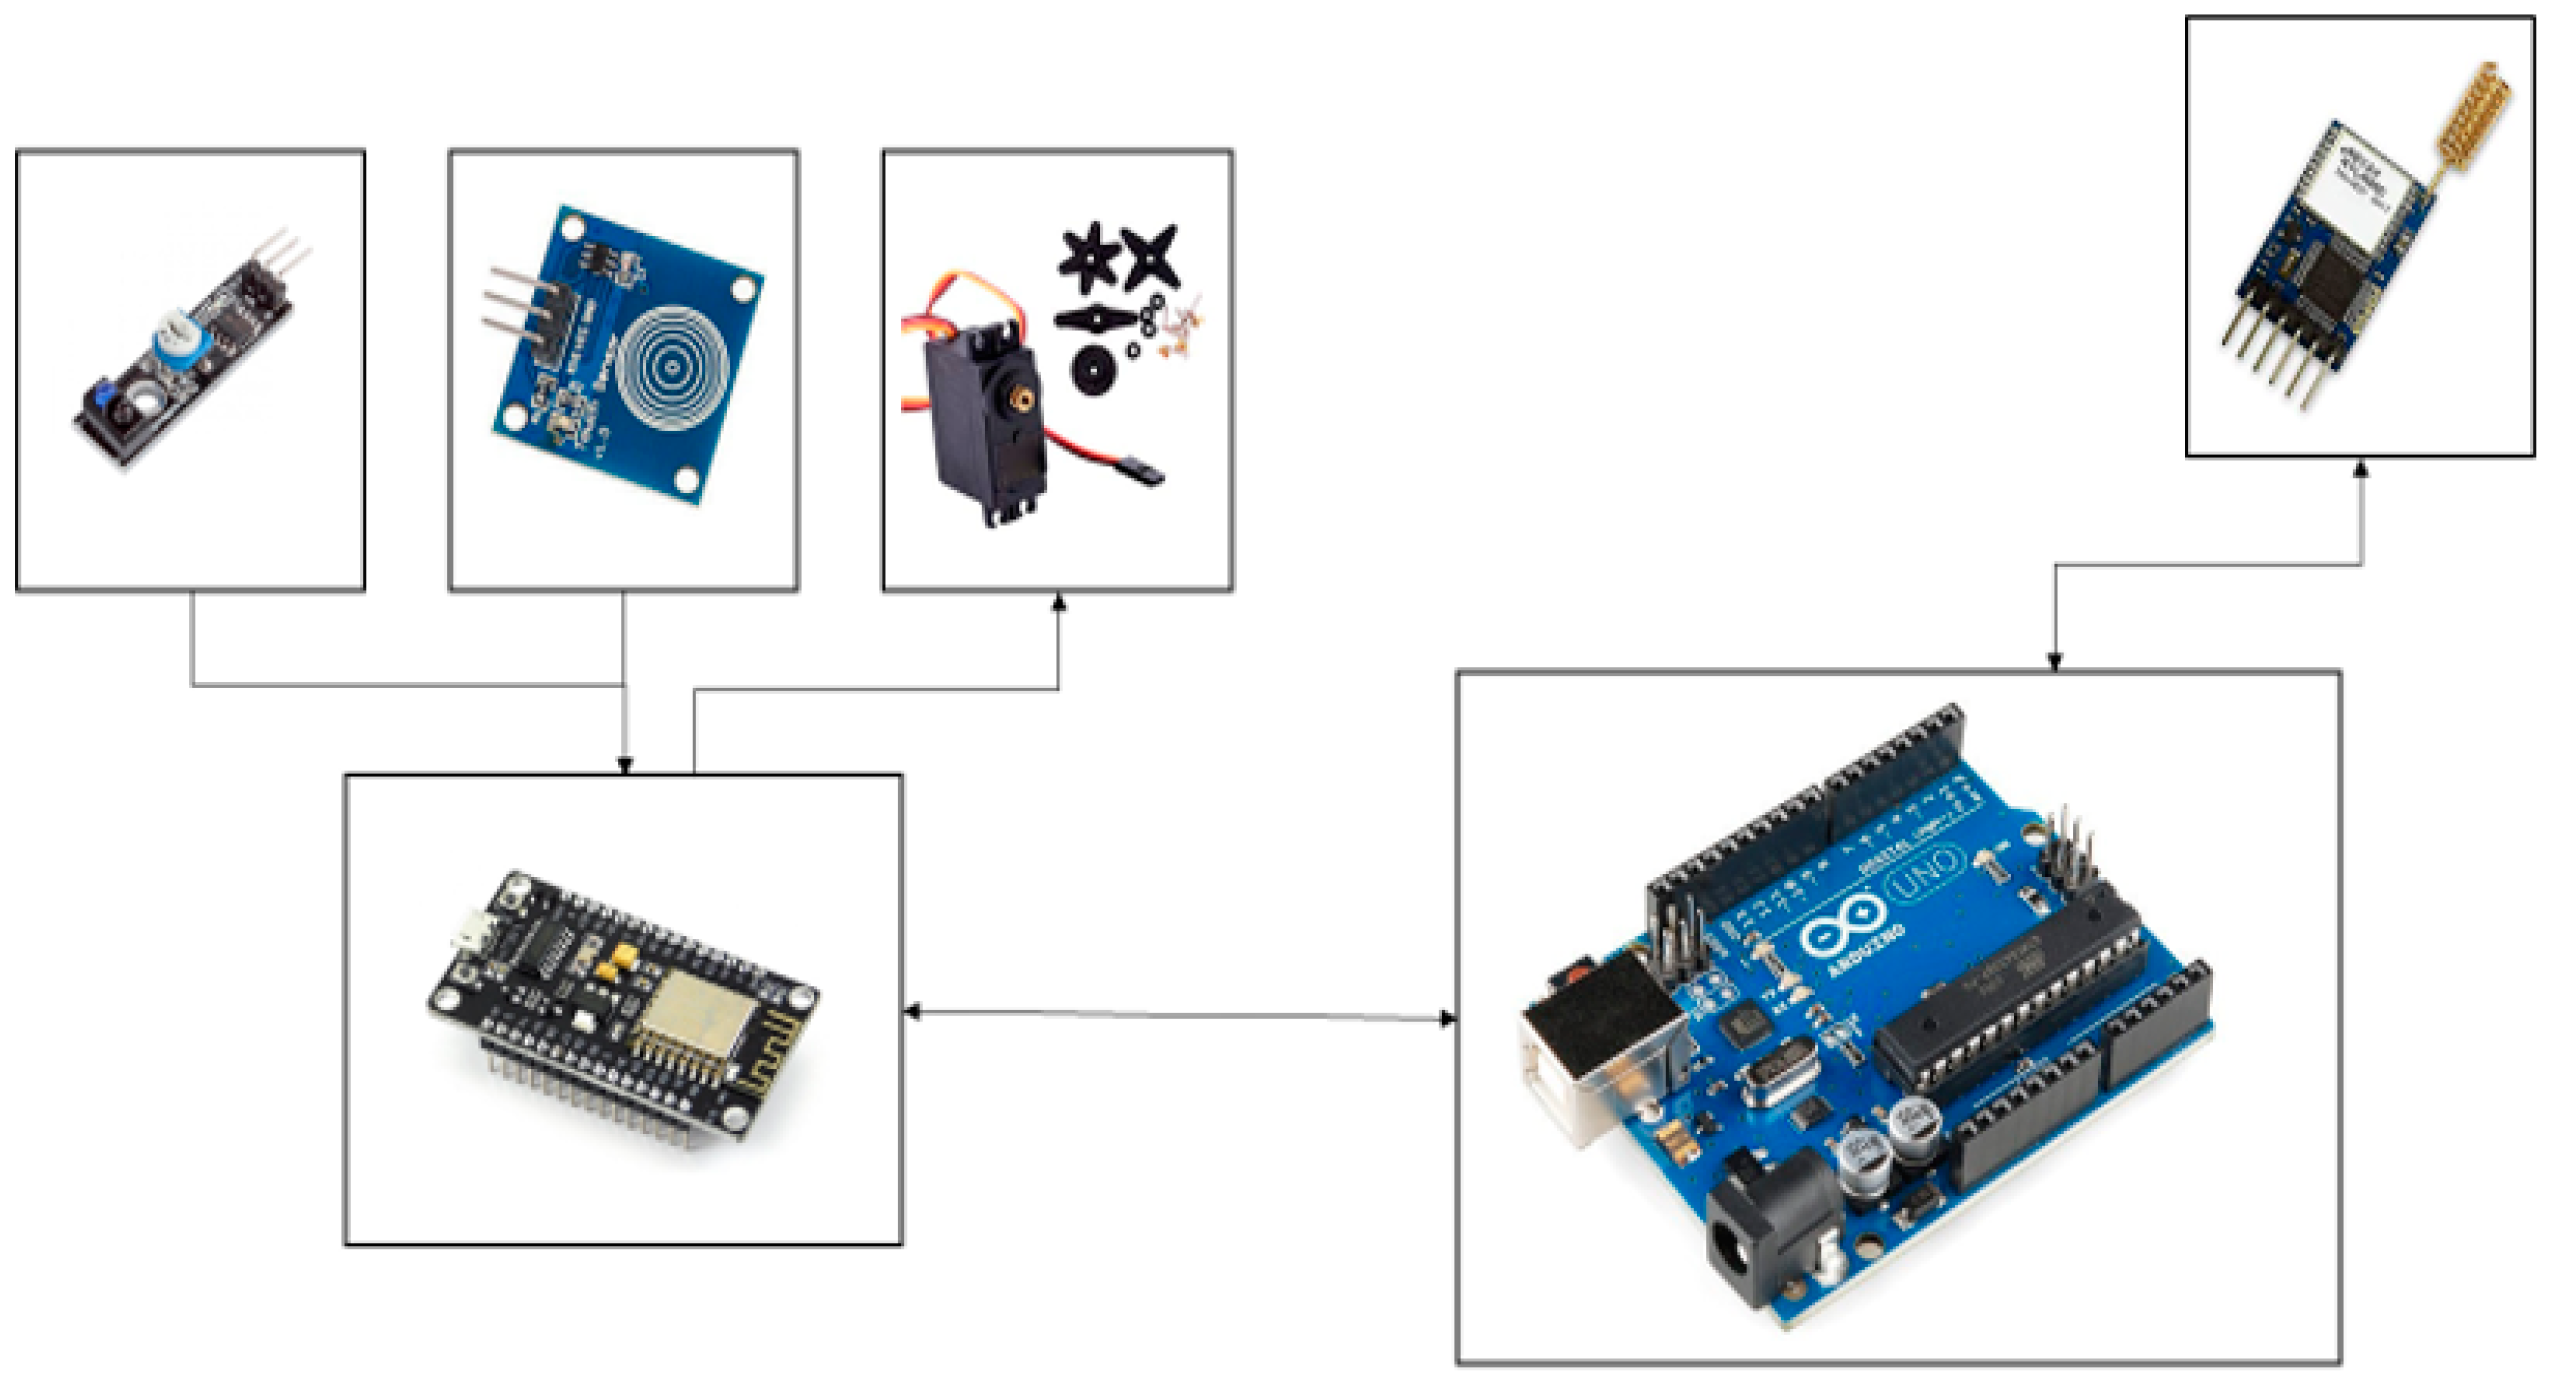
Second Module (Figure 10): This configuration incorporates an Arduino Uno, REYAX RYLR896 LoRa module, ESP8266 Wi-Fi module [30], and a range of sensors and actuators.
Figure 10.
Second module.
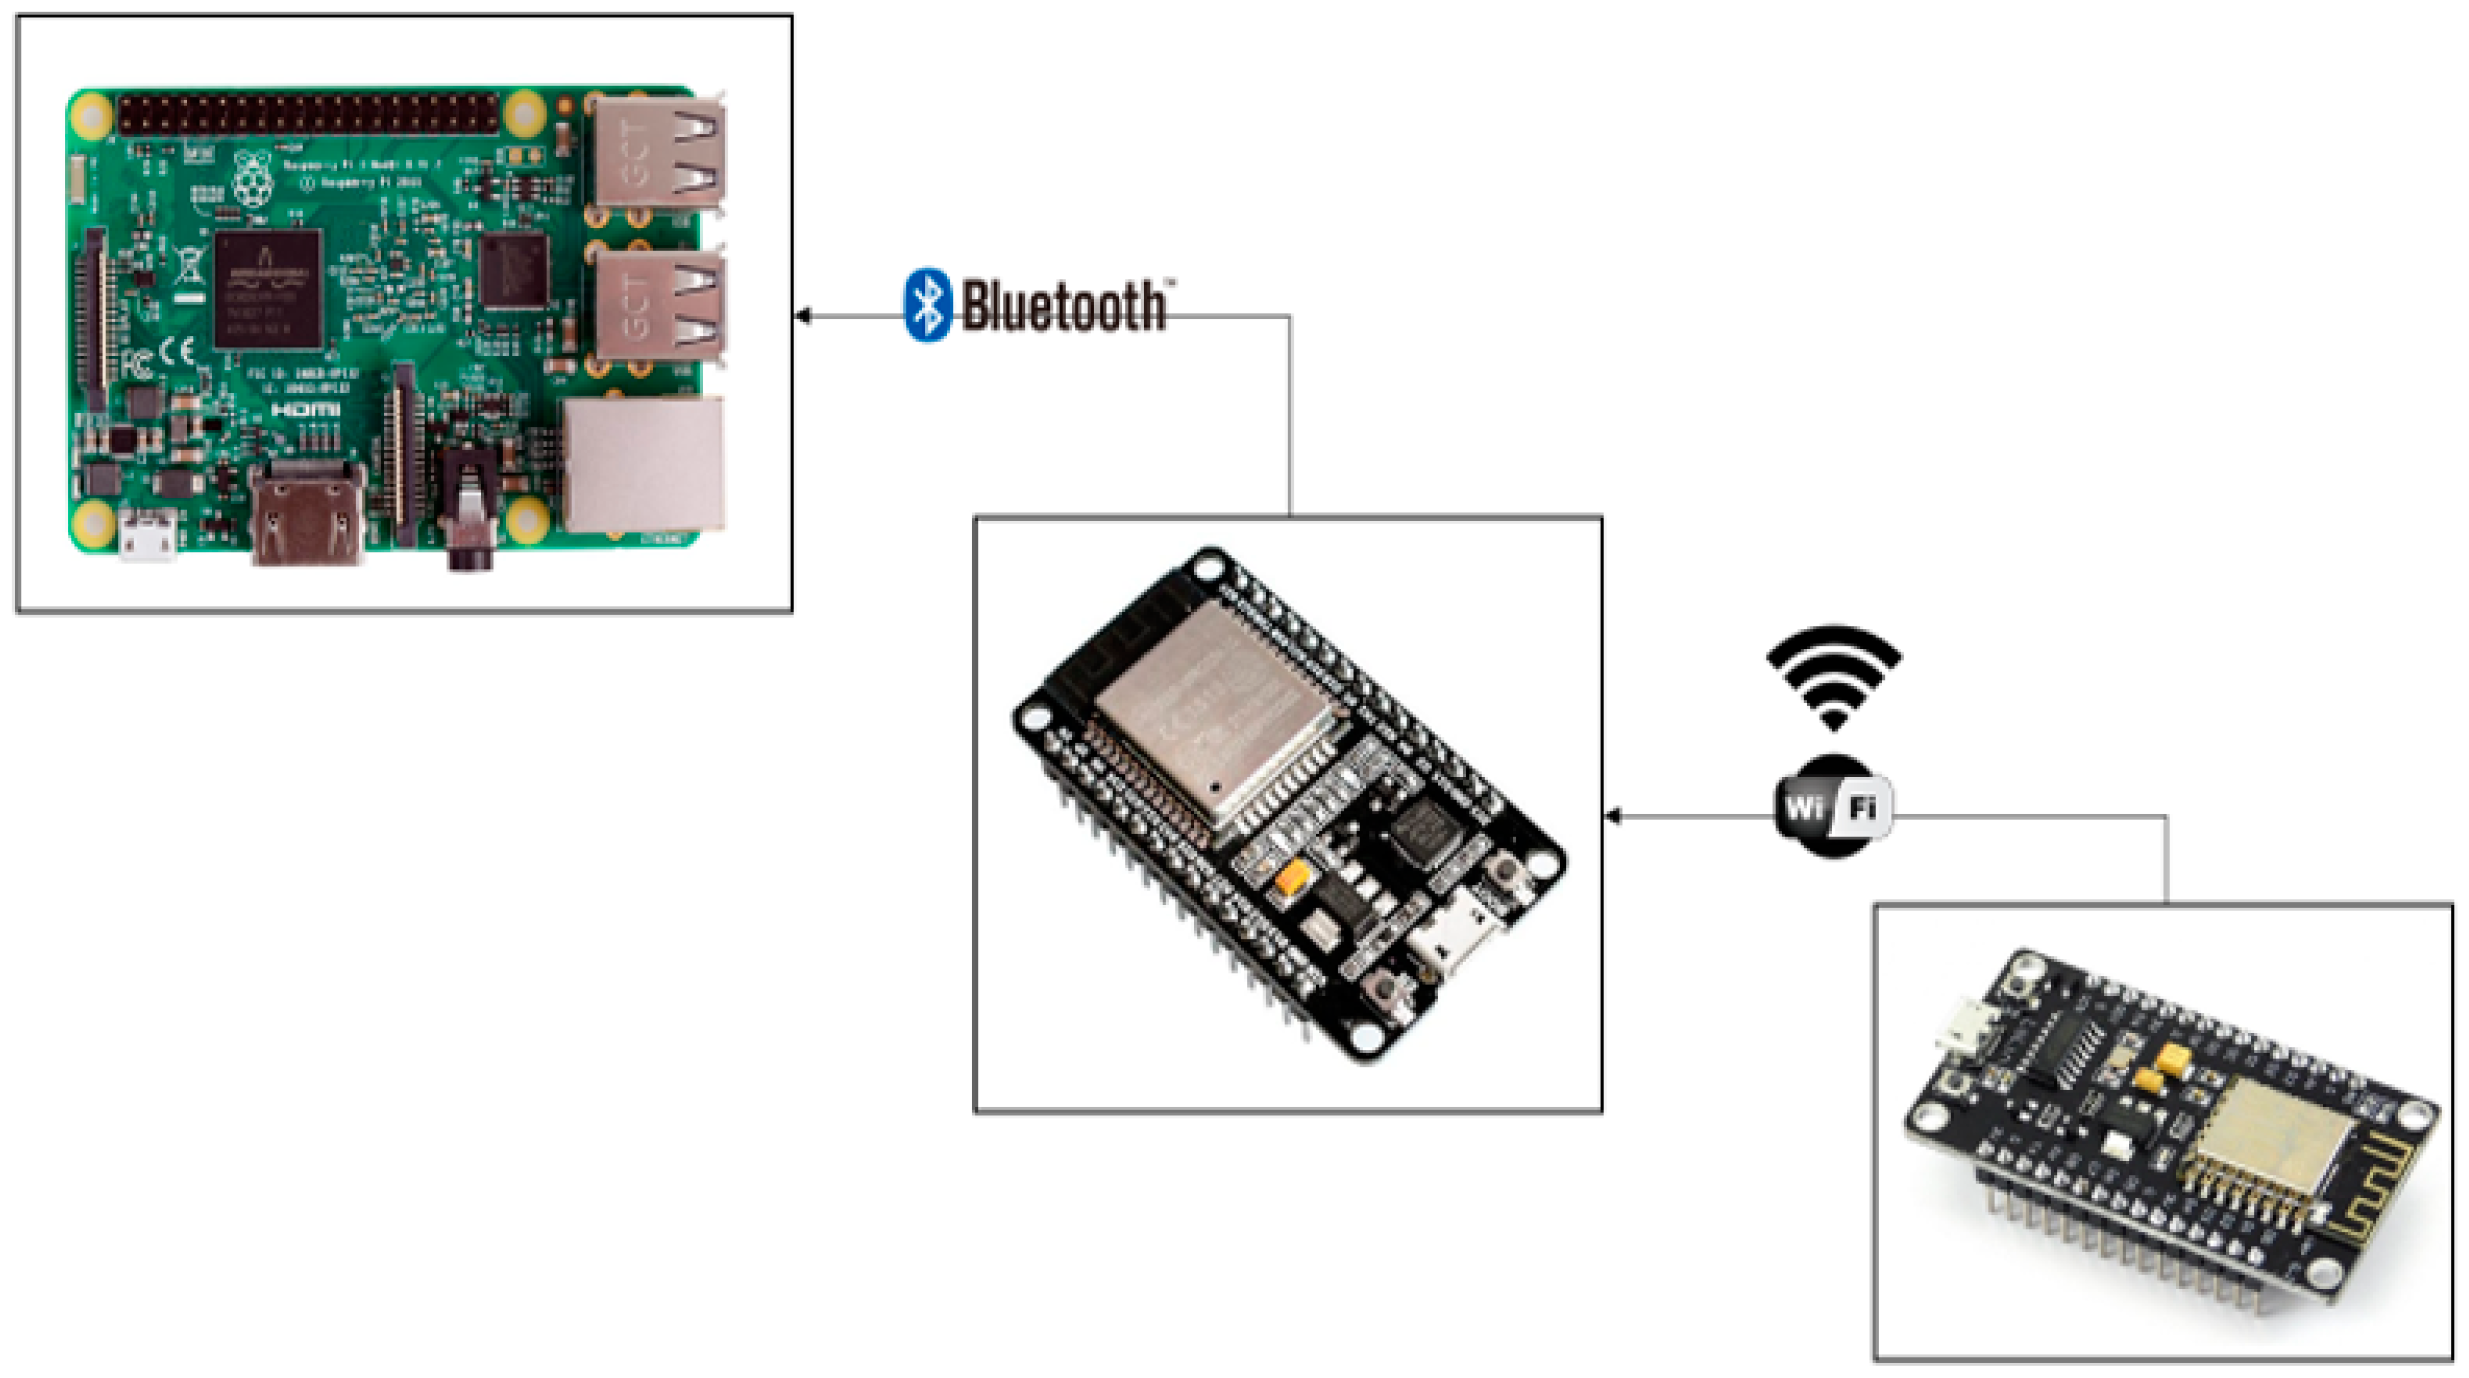
Third Module (Figure 11): The third module features an ESP32 Wi-Fi and Bluetooth module [30] and a Raspberry Pi 3 Model B [31], equipped with sensors and actuators.
Figure 11.
Third module.
5.2. Server Configuration
Figure 12.
Client / server architecture.
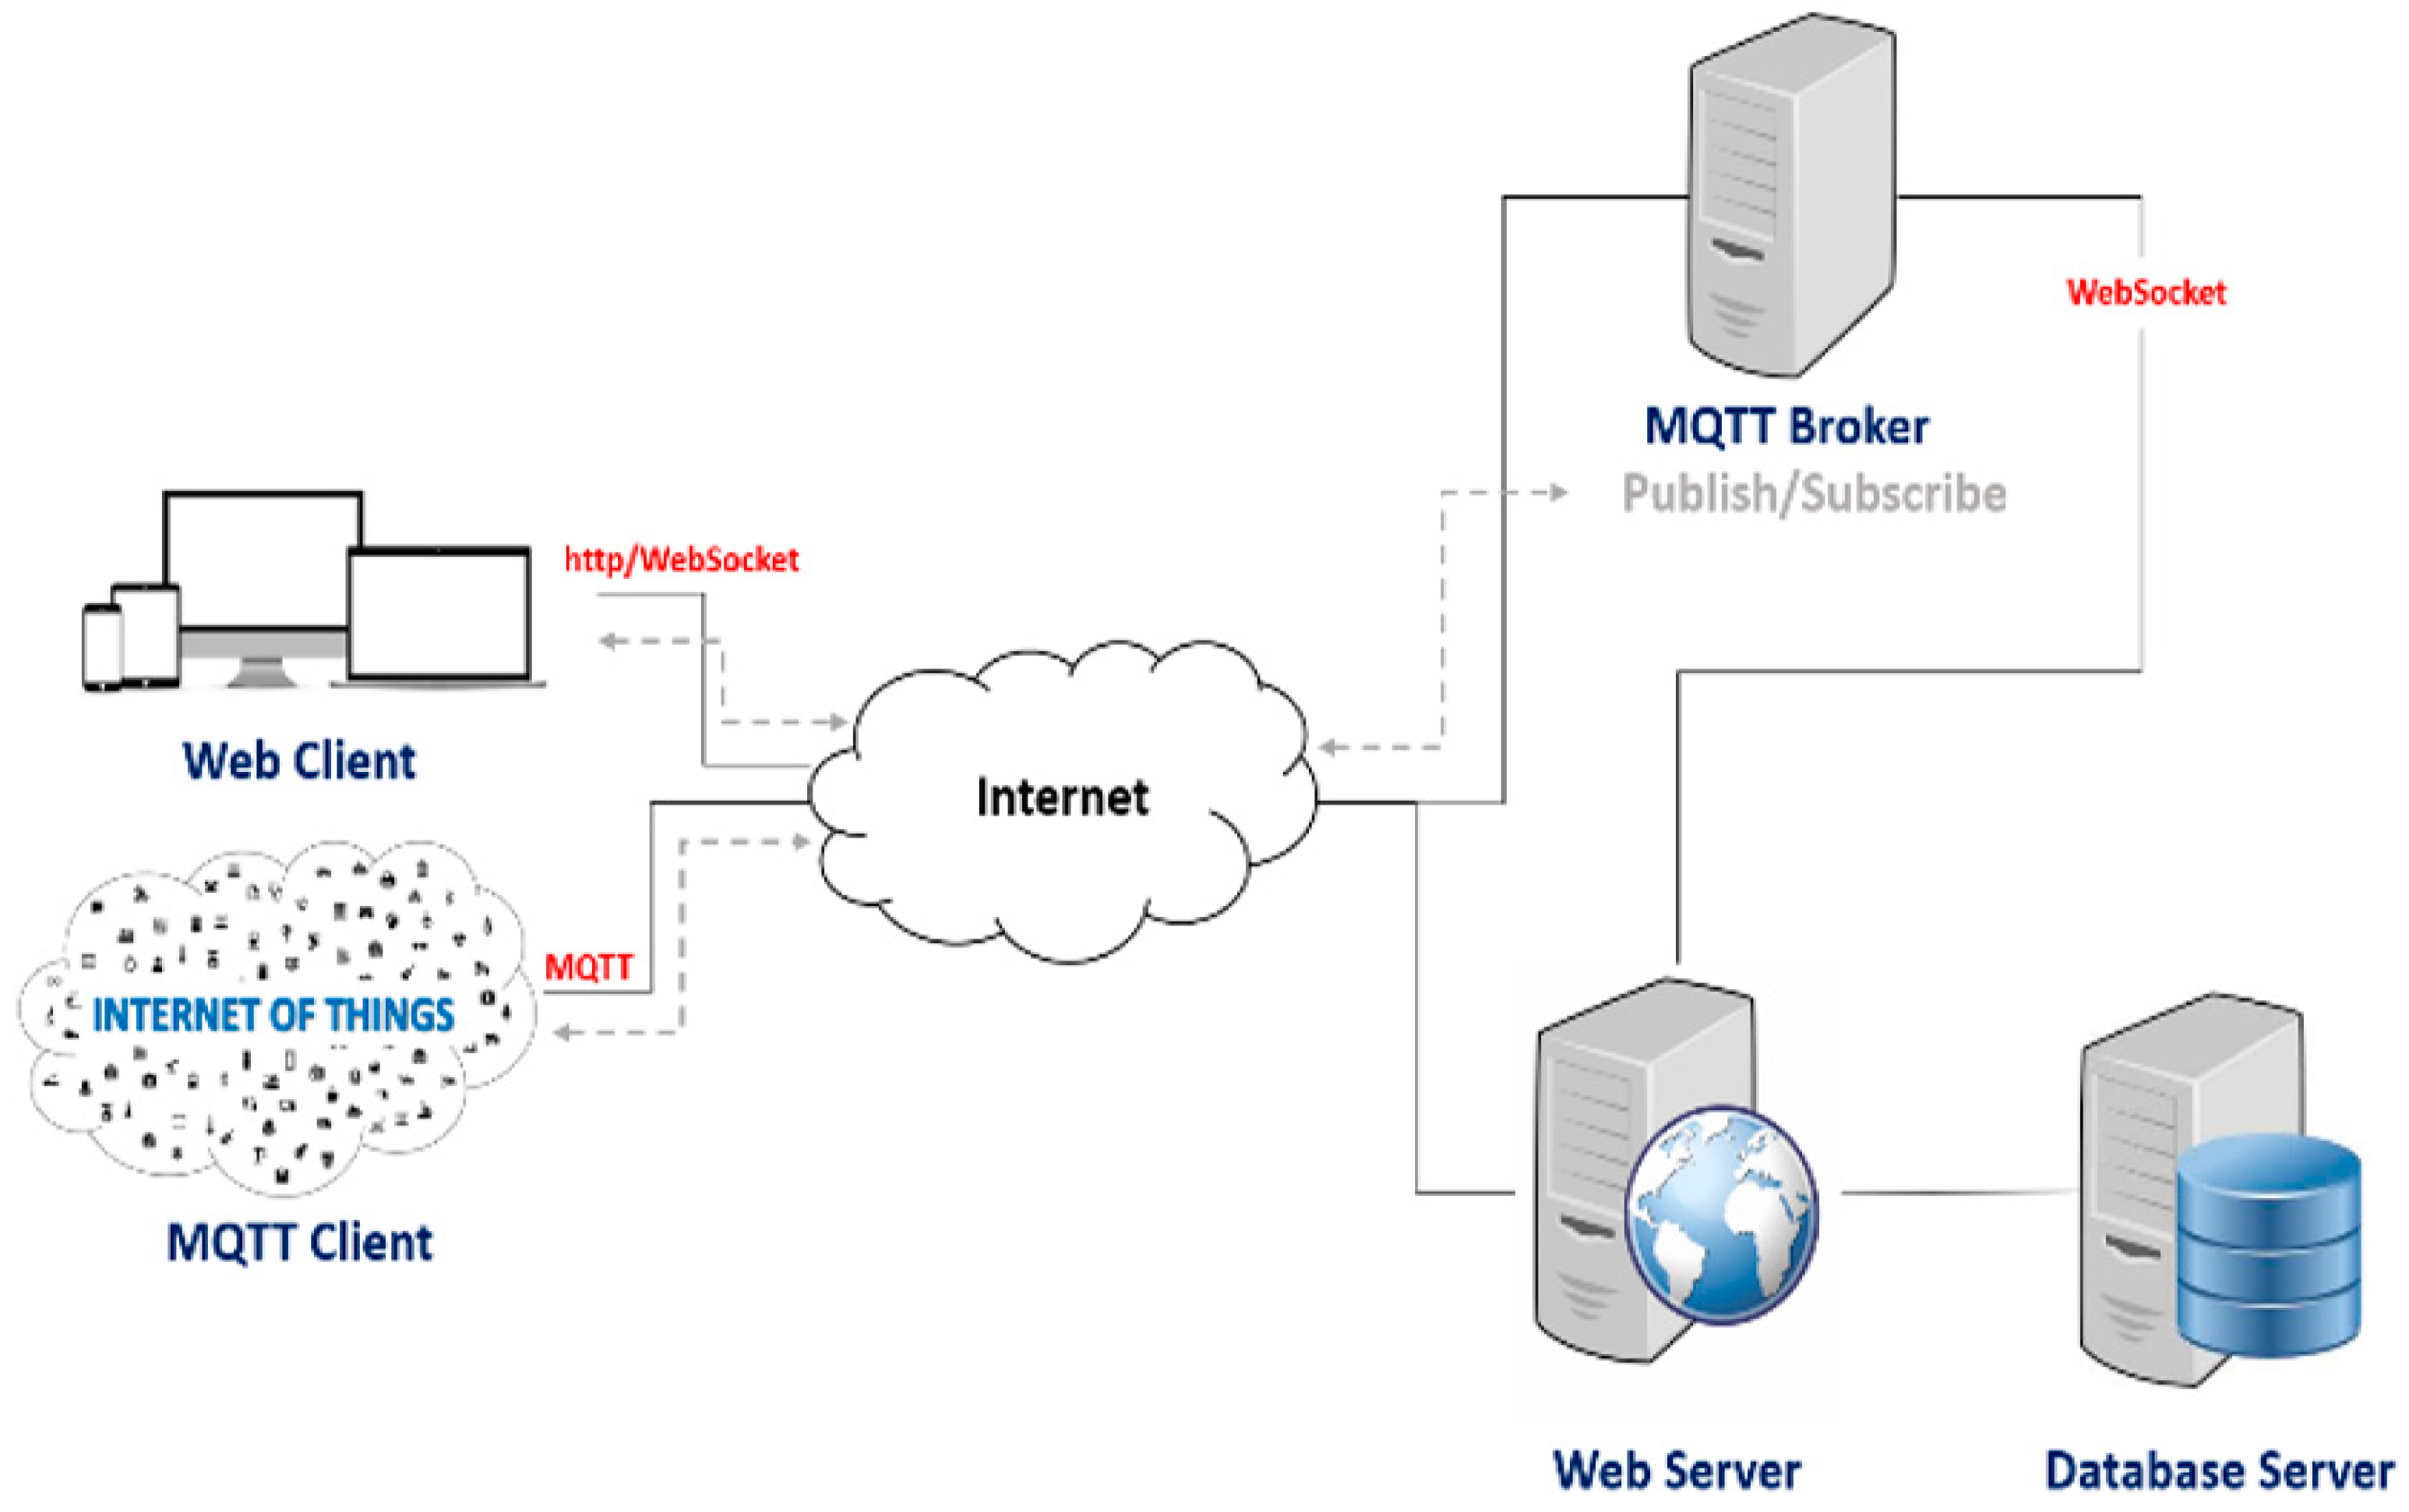
Apart from the circuits, the configuration and the development, we propose the installation of the servers. Indeed, we configure an MQTT broker [32] for the transmission of data between our system and web clients through WebSocket.
This communication method allows the user to follow the status in real time through a responsive web interface that will offer the ability to perform control and monitoring of data.
In addition, we will set up our web server and our database server, so that data that will be transferred can be collected, processed and stored in databases for later use for reporting. Indeed, reports and statistics will be made available to the user who will allow the prediction and the state analysis.
5.3. Proposed Solution Architecture
Figure 13.
Proposed Solution Architecture.
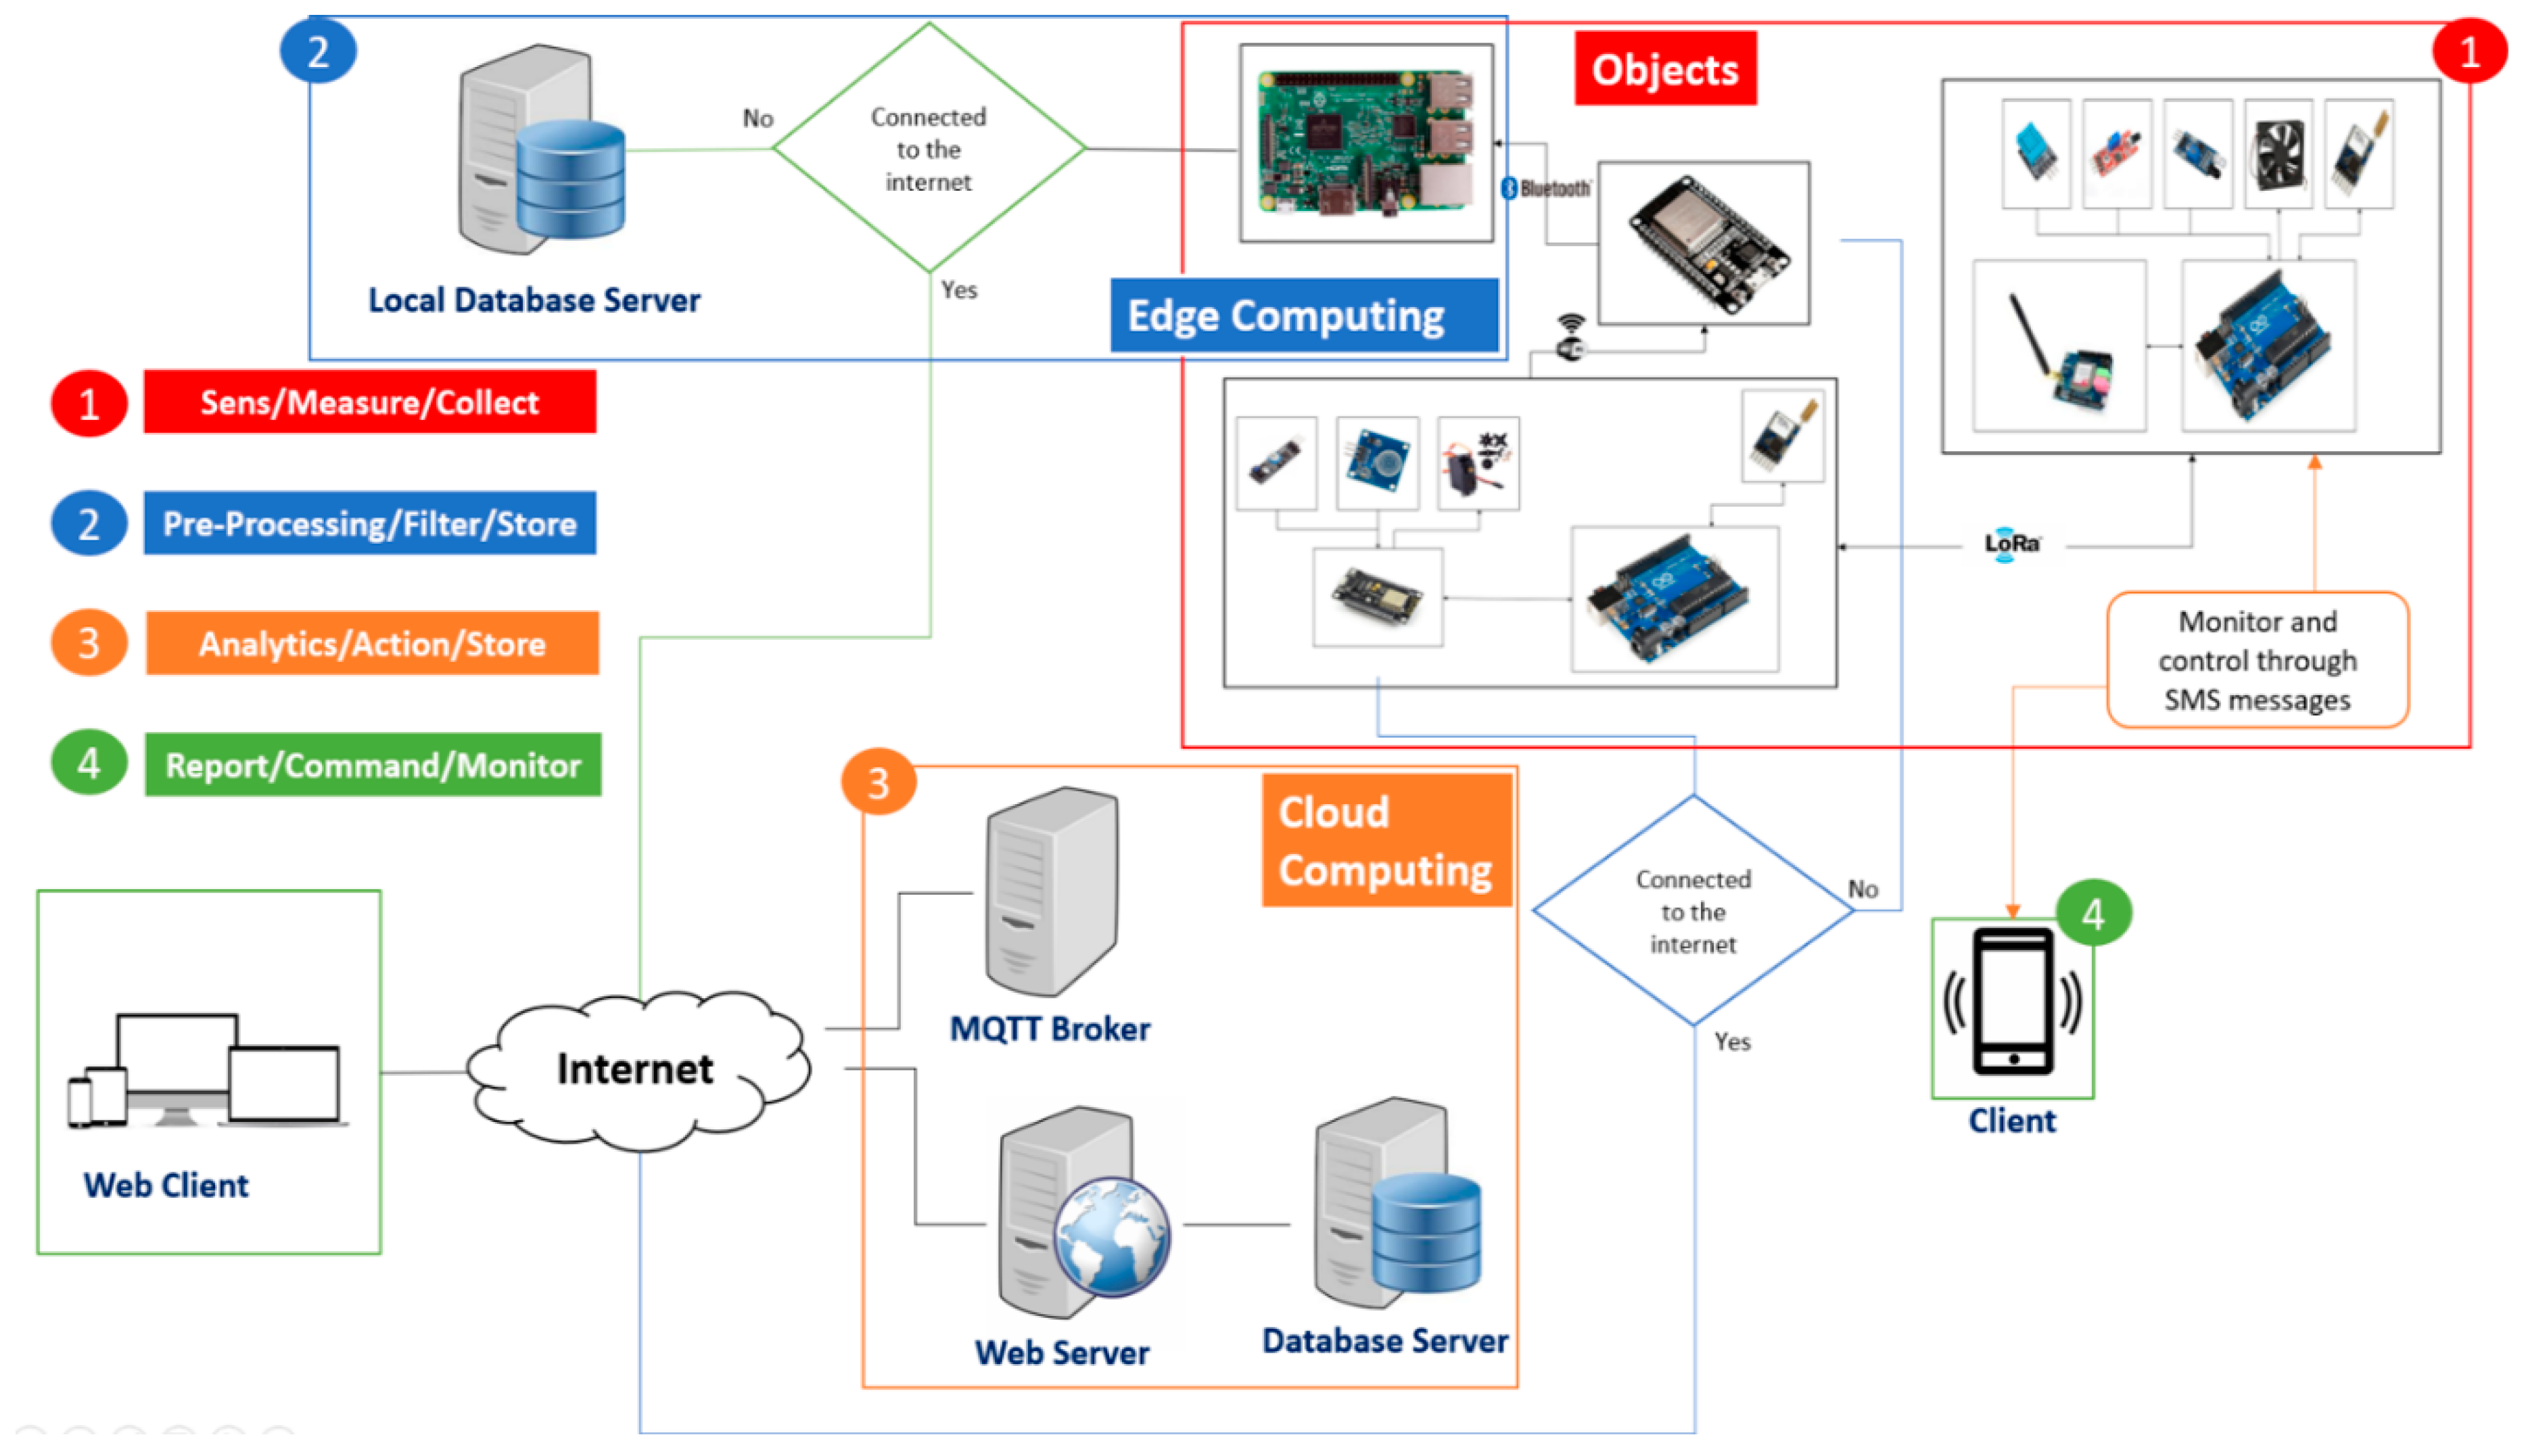
As shown in the fig. 13 above, we will deploy sensors and actuators on two groups.
The first group will be controlled by an Arduino Uno linked to a LoRa transmitter / receiver and has a SIM5320A card for cellular communication. The Arduino Uno, on one side, will control its first group of objects either by performing automatic actions or having received the order from the user who will be able to control the system through the web interface or through SMS, and on other side, will pass the data to the second group of objects.
The second group, controlled by the ESP8266, includes sensors/actuators connected to the network via Wi-Fi. It receives client requests for action through the web interface, facilitated by the MQTT broker. In addition to the reception of the actions, it will carry out the transmission of the received data either of the first group of objects, passing by an Arduino Uno integrating a transmitter / receiver LoRa which will communicate for the exchange of data with the Arduino Uno of the first group-through-the LoRa protocol, or the transmission of sensor data directly attached to it.
Initially, connected to the web thanks to its Wi-Fi module that will allow him to interact with the MQTT broker to which he will receive and transmit the data, in case of problems and loss of this communication he will switch for the transmission of data to the ESP32.
Indeed, playing the role of an access point, the ESP32 will offer a local network on which the ESP8266 can connect and transmit data. Subsequently, these data transmitted to the ESP32 will in turn be transferred to the Raspberry Pi through Bluetooth.
At the level of the Raspberry Pi, upon receipt of the data, they will be processed and stored in a database configured locally. Once the connection to the network is restored, synchronization with the remote database can be made, which will keep the compliance of the data and the continued smooth operation of the system and leading to high-level results for statistics and predictions.
The configuration of web, MQTT and database servers will allow interaction with the user and database storage.
Apart from interfacing the components of our system and the configuration and implementation of servers. We proceeded to the implementation on several levels.
Indeed, firmware have been developed and integrated to automate the processes of the various components of our system. Then we did the design and created database for remote storage and reproduced a copy of this database locally near the hardware. The latter will allow the temporary storage of transmitted data in case of problems.
After that, synchronization with the remote database will be performed when needed to allow updating the data collected and processed to maintain the compliance of the stored data to give better analytics results.
Finally, we proceeded to the development and implementation of a responsive web interface allowing system status monitoring, as well as the provision of reports and different graphical forms for statistics to users.
6. Experimental Validation
6.1. Experiment for LoRa data transmission

Table 3.
Experimental results for LoRa data transmission.
| Range (m) | Heat | Humidity | ||
|---|---|---|---|---|
| < 1 | Sample | Value | Sample | Value |
| 1 | 23,42 | 1 | 32 | |
| 2 | 23,42 | 2 | 32 | |
| 3 | 23,42 | 3 | 32 | |
| 4 | 23,35 | 4 | 32 | |
| 5 | 23,32 | 5 | 32 | |
| <= 5 | Sample | Value | Sample | Value |
| 1 | 23,56 | 1 | 32 | |
| 2 | 23,42 | 2 | 31 | |
| 3 | 23,56 | 3 | 32 | |
| 4 | 23,56 | 4 | 32 | |
| 5 | 23,56 | 5 | 32 | |
| <= 10 | Sample | Value | Sample | Value |
| 1 | 23,42 | 1 | 32 | |
| 2 | None | 2 | None | |
| 3 | 22,85 | 3 | 33 | |
| 4 | 23,56 | 4 | 33 | |
| 5 | 23,56 | 5 | 32 | |
| <= 15 | Sample | Value | Sample | Value |
| 1 | None | 1 | None | |
| 2 | 21,81 | 2 | 34 | |
| 3 | 22,55 | 3 | 33 | |
| 4 | 23,45 | 4 | 32 | |
| 5 | 23,45 | 5 | 32 | |
| Average | 23 | 32 | ||
The results in the table 3 show different samples of values for temperature and humidity taken at various distances for the LoRa transmission. These values demonstrate that despite the presence of obstacles in our test environment, LoRa remains able to transmit data between the two ends with an acceptable rate of precision. The only downside is that the longer the distance, the more you need to wait for the retransmission to have a reliable value.
6.2. Experiment for Our System Response to Alerts
Table 4.
Experimental results for our system response to alerts.
| Range (m) | Fire | Obstacle | ||
|---|---|---|---|---|
| < 1 | State | Alerts | State | Alerts |
| ON |
Web: Trigger in less than 10s SMS: Trigger in less than 5s |
ON |
Web: Trigger in less than 10s SMS: Trigger in less than 5s |
|
| OFF |
Web: Trigger in less than 10s SMS: Trigger in less than 5s |
OFF |
Web: Trigger in less than 10s SMS: Trigger in less than 5s |
|
| <= 5 | State | Alerts | State | Alerts |
| ON |
Web: Trigger in less than 10s SMS: Trigger in less than 5s |
ON |
Web: Trigger in less than 10s SMS: Trigger in less than 5s |
|
| OFF |
Web: Trigger in less than 10s SMS: Trigger in less than 5s |
OFF |
Web: Trigger in less than 10s SMS: Trigger in less than 5s |
|
| <= 10 | State | Alerts | State | Alerts |
| ON |
Web: Trigger in less than 10s SMS: Trigger in less than 5s |
ON |
Web: Trigger in less than 10s SMS: Trigger in less than 5s |
|
| OFF |
Web: Trigger in less than 10s SMS: Trigger in less than 5s |
OFF |
Web: Trigger in less than 10s SMS: Trigger in less than 5s |
|
| <= 15 | State | Alerts | State | Alerts |
| ON |
Web: Trigger in less than 15s SMS: Trigger in less than 5s |
ON |
Web: Trigger in less than 15s SMS: Trigger in less than 5s |
|
| OFF |
Web: Trigger in less than 15s SMS: Trigger in less than 5s |
OFF |
Web: Trigger in less than 15s SMS: Trigger in less than 5s |
|
The results in the table 4, show different reaction times of the system to the alerts, taken at different distances for the LoRa transmission. These values demonstrate that the longer the distance, the more time it takes to launch alerts on the web. In fact, given that information is transmitted from one point to another at the beginning through LoRa and then on the web, it is normal to notice this delay. By cons, given the SIM5320A card is attached directly to the Arduino managing the sensors, launching alerts by SMS is faster.
6.3. Experiment for Our System Data Flow
Table 5.
Experimental results for our system data flow.
| Time interval (s) | Data received |
|---|---|
| 0-60 | ✓ |
| 60-120 | ✓ |
| 120-180 | ✓ |
| When the Internet connection is lost, transfer data to the local database. | |
| 180-250 | None |
| 250-310 | ✓ |
| 310-370 | ✓ |
| Upon restoration of the Internet connection, synchronize the data with the remote server. | |
| 370-425 | None |
| 425-485 | ✓ |
| 485-545 | ✓ |
As shown in Table 5, the data flow through our system in both situations with and without an Internet connection. When the Internet connection is available, the data continues to be processed and stored in the remote machine (Cloud). Then we forced the loss of the Internet connection, which led our system to a total of more than 60 seconds of data loss for the time it took to move to local storage. Once the Internet connection was restored, data transmission returned to normal with a switching latency of 55 seconds of data loss. This delay could be improved with performing more optimization techniques.
6.4. Experiment on Interaction Between User/System Through SMS
Table 6.
Experimental results for interaction between user/system through SMS.
| Interaction | Send | Receive | Response time (s) | |
|---|---|---|---|---|
| Ask for a menu | User to system | ✓ | 1 - 5 | |
| Menu options | System to user | ✓ | 1 - 5 | |
| Choose option | User to system | ✓ | 1 - 5 | |
| React to choose option | System to user | ✓ | 5 - 10 | |
| Alerts | System to user | ✓ | 5 - 10 |
The table 6 shows the response time for interaction between the system and the user through text messages. The response time is around 1 and 10 seconds which is acceptable and can be improved and remains dependent on the Cellular service provider.
6.5. Summary of functionalities depending on both situations with and without an Internet connection
Table 7.
Summary of functionalities.
|
Available connection to Internet (data stored in a remote database) |
Not Available connection to Internet (data stored in a local database) |
|
| Data stored in database | ✓ | ✓ |
| Synchronization | ✓ move data from local to remote |
None |
| Web control/ monitor/alerts/analytic | ✓ | None |
| SMS control/monitor/alerts | ✓ | ✓ |
| Detect obstacle | ✓ | ✓ |
| Detect motion | ✓ | ✓ |
| Detect fire | ✓ | ✓ |
| Detect touch | ✓ | ✓ |
| Get temperature | ✓ | ✓ |
| Get humidity | ✓ | ✓ |
| Control Fan | ✓ | ✓ |
| Control motor | ✓ | None |
| Obstacle alerts | ✓ | ✓ |
| Touch alerts | ✓ | None |
| Motion alerts | ✓ | None |
| Fire alerts | ✓ | ✓ |
| Temperature exceeded threshold alerts | ✓ | ✓ |
The table 7 shows the different features available across the system and their availability depending on the existence of Internet connection or not. Indeed, the control through the web will be lost in case the Internet connection is lost while storing data will continue to perform in the local database as the system will continue to operate and will be available for consultation once the Internet connection is re-established thanks to our local storage strategy. As well as some monitoring and control related to the first module presented previously only will remain available through the exchange of SMS as the first module contains the SIM5320A card which allows users/system interactions through SMS in contrary to the second module which contains the ESP8266 card that allows users/system interactions through the web.
6.6. Monitoring and Control by SMS
Figure 14.
System control by SMS.
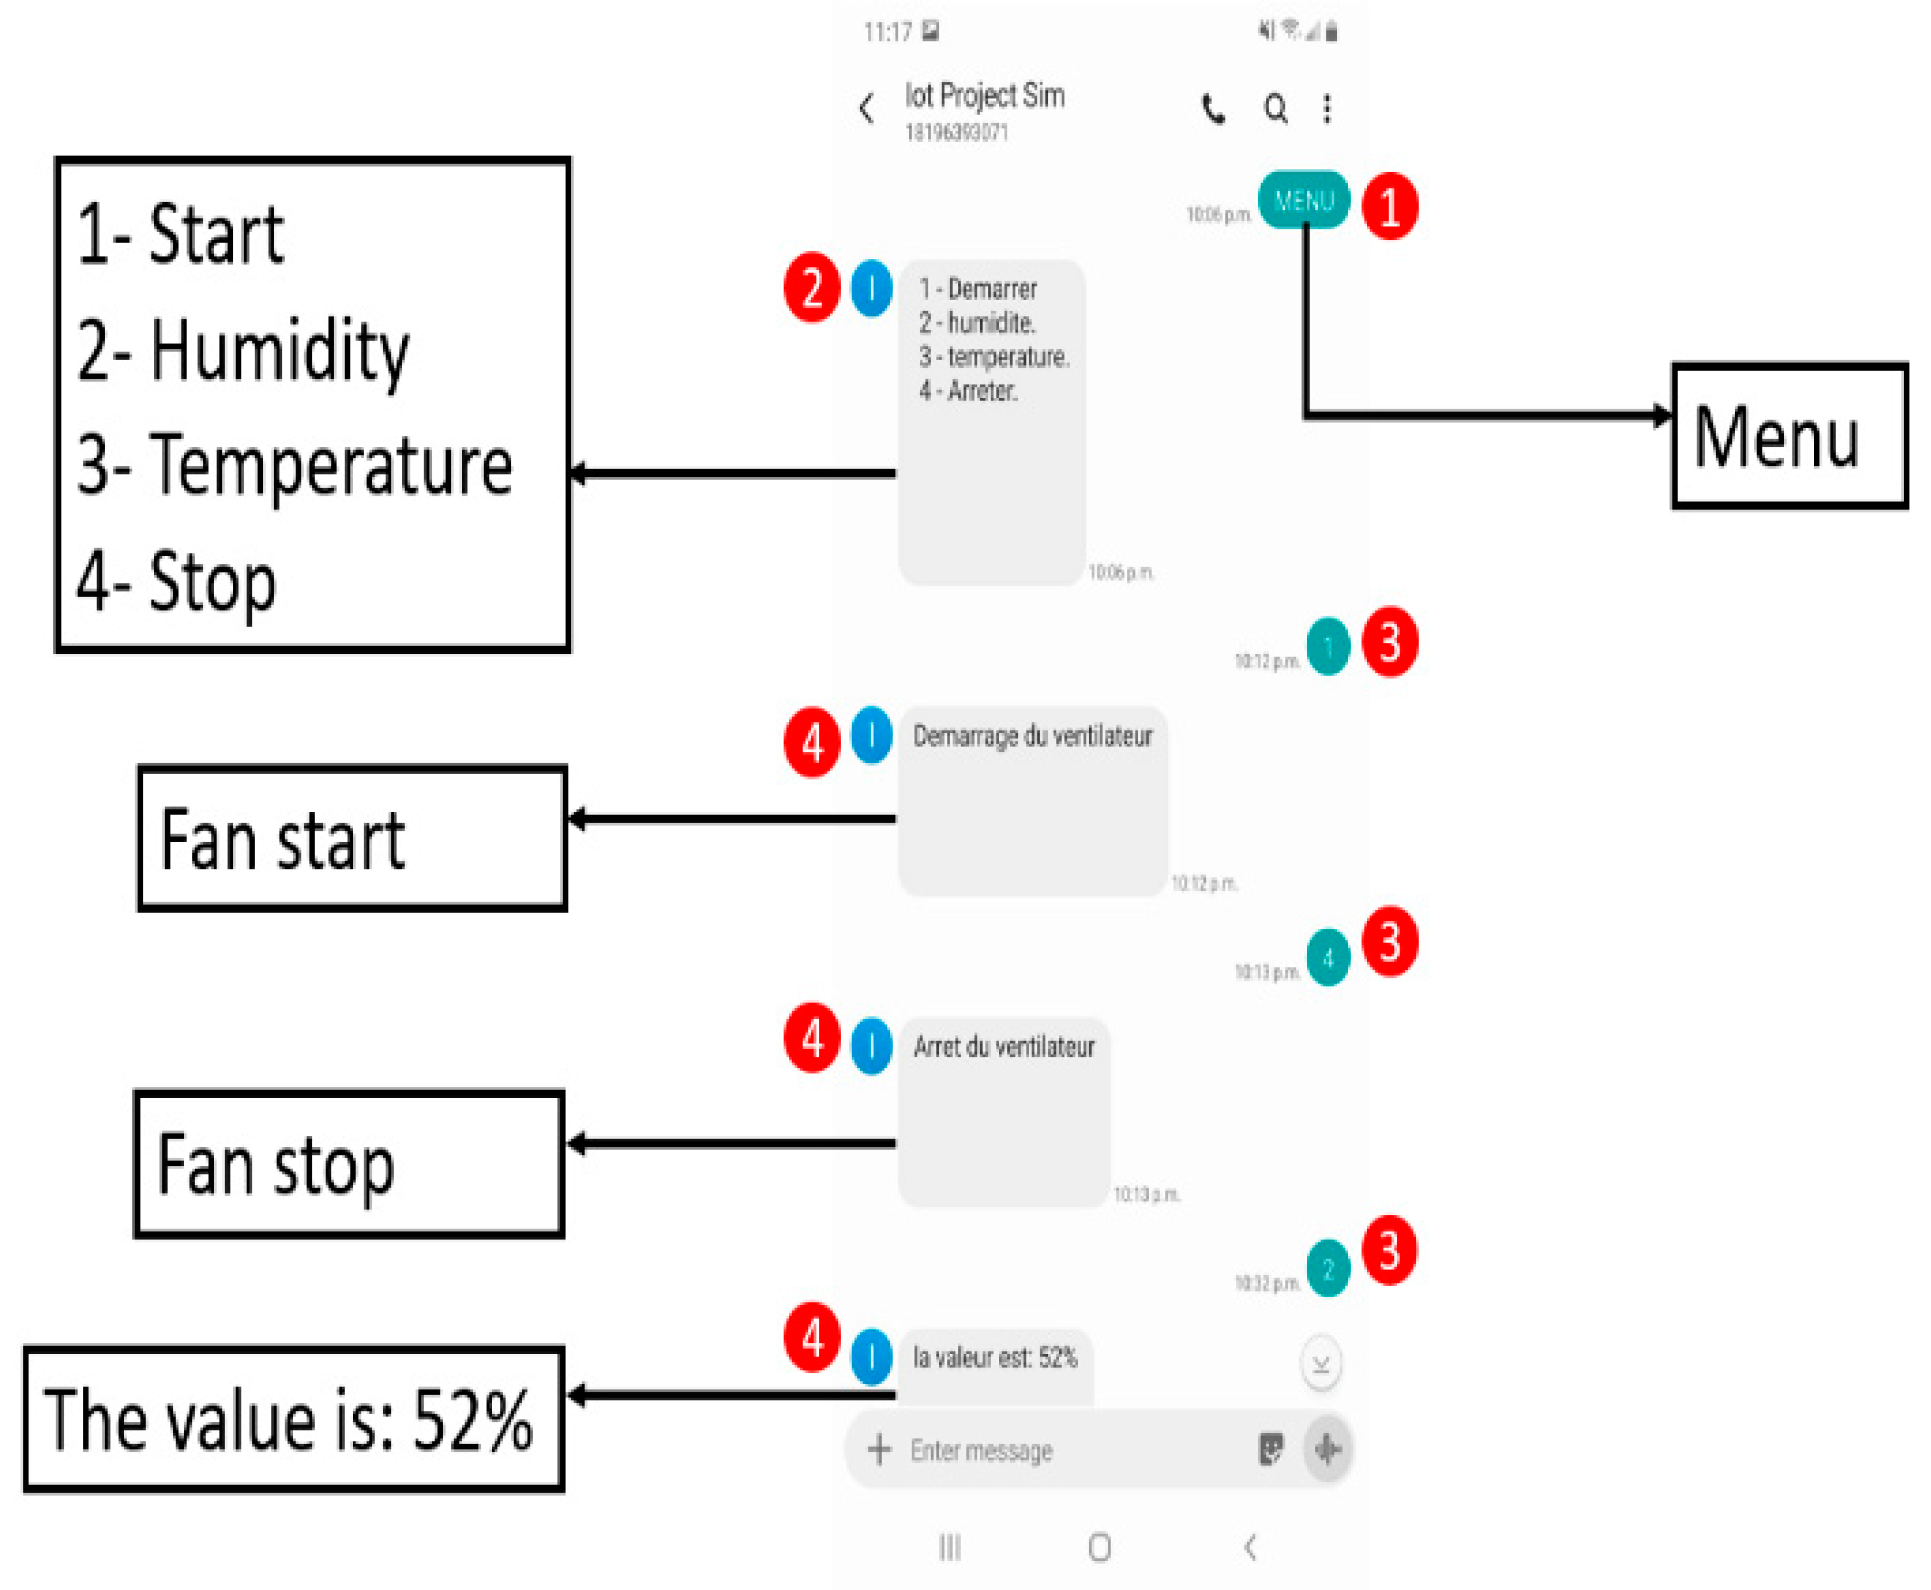
In figure 14 shows the interaction with the system through SMS to follow up as follows:
- The user sends an SMS with the keyword “MENU”.
-
The system will return a message containing 4 options with the code for each option like:
- Start: To start the fan.
- Humidity: To find out the humidity level.
- Temperature: To obtain the temperature.
- Stop: To stop the fan.
- The user replies with an SMS containing the number of the option chosen
- The system will return a response either the requested value or the confirmation of the start of an action
Figure 15.
System monitoring by SMS: (a) System monitoring by SMS; (b) Received alerts by SMS.
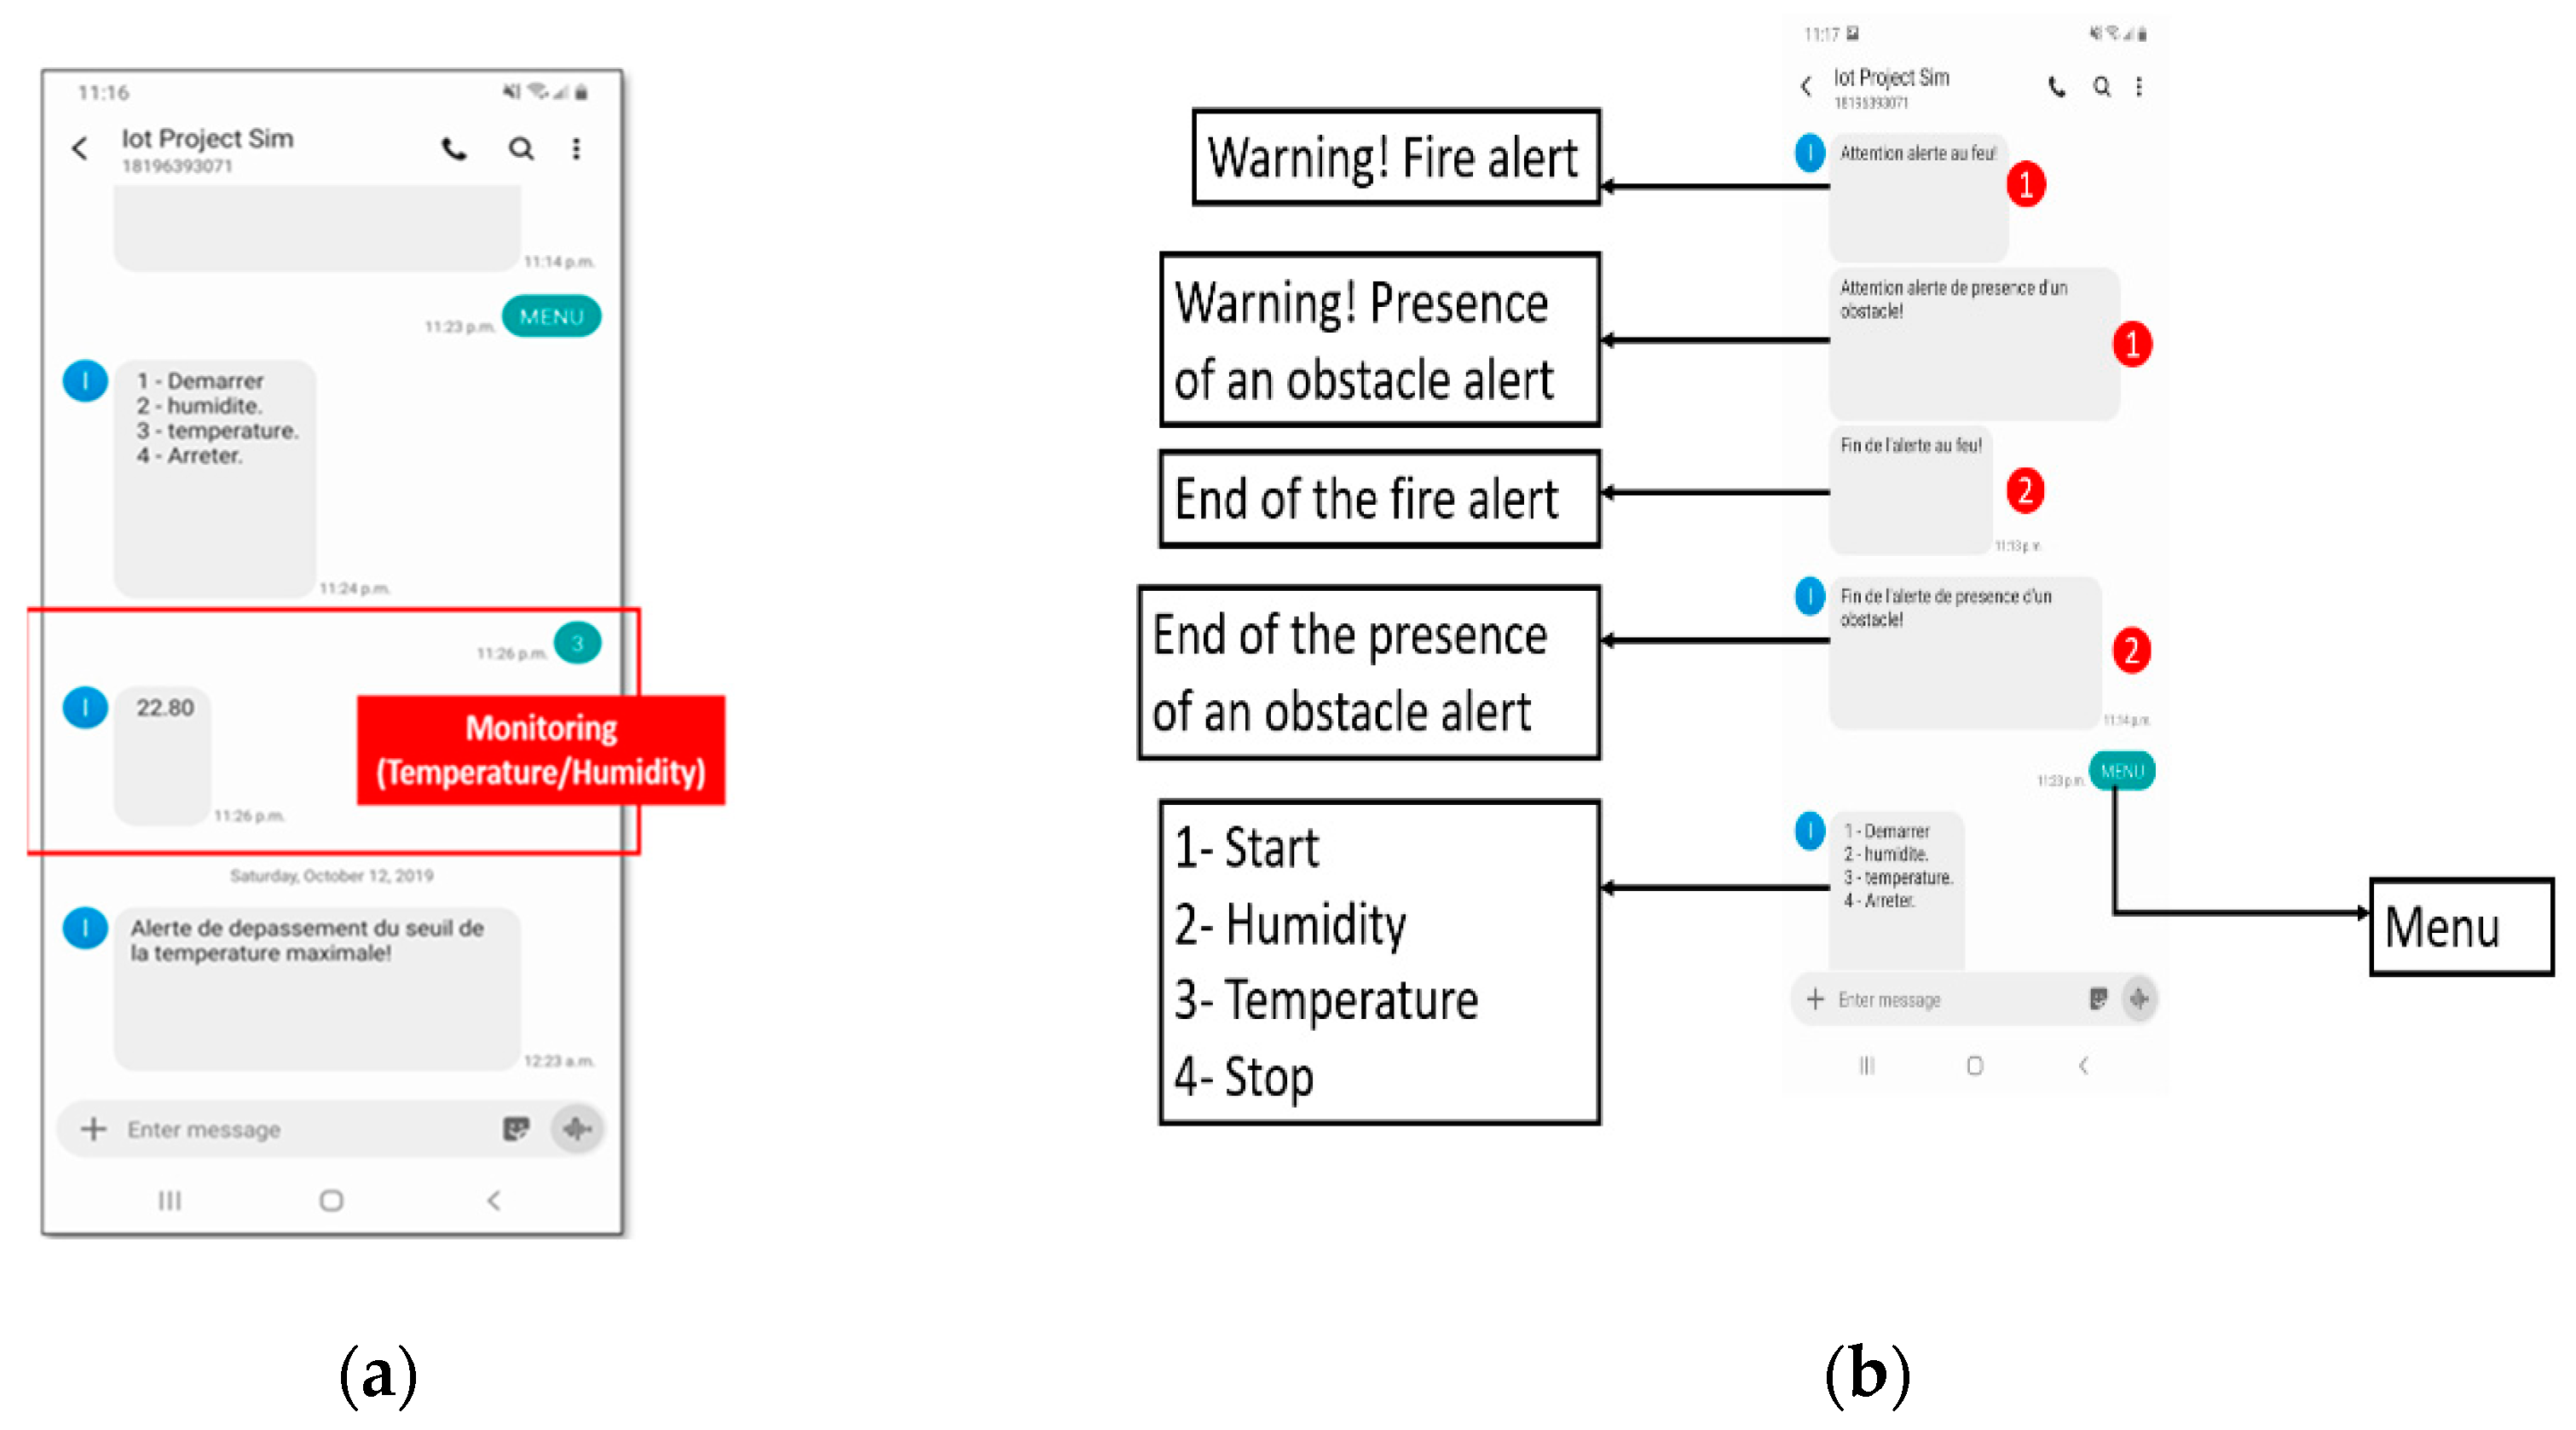
As presented in Fig. 15, our system allows the control and the follow-up by text messages. Indeed, thanks to the Sim5320A, we added the direct interaction with the system either for the follow-up of the temperature or the humidity or for the control of the fan.
In addition, we have programed our microcontroller to track the temperature and allow the automatic launch of the fan in the case where the temperature exceeds a threshold defined by users, as well as the transmission of alerts by text message to the user to notify him of any problem such as flame detection or the presence of obstacles.
The definition of the threshold of the temperature not to be exceeded may be modified by the user through the web interface.
6.7. Monitoring and control through web interface
Figure 16.
Reports through a web interface: (a) Total actions executed; (b) Heat and Humidity variations by month.
Figure 16.
Reports through a web interface: (a) Total actions executed; (b) Heat and Humidity variations by month.
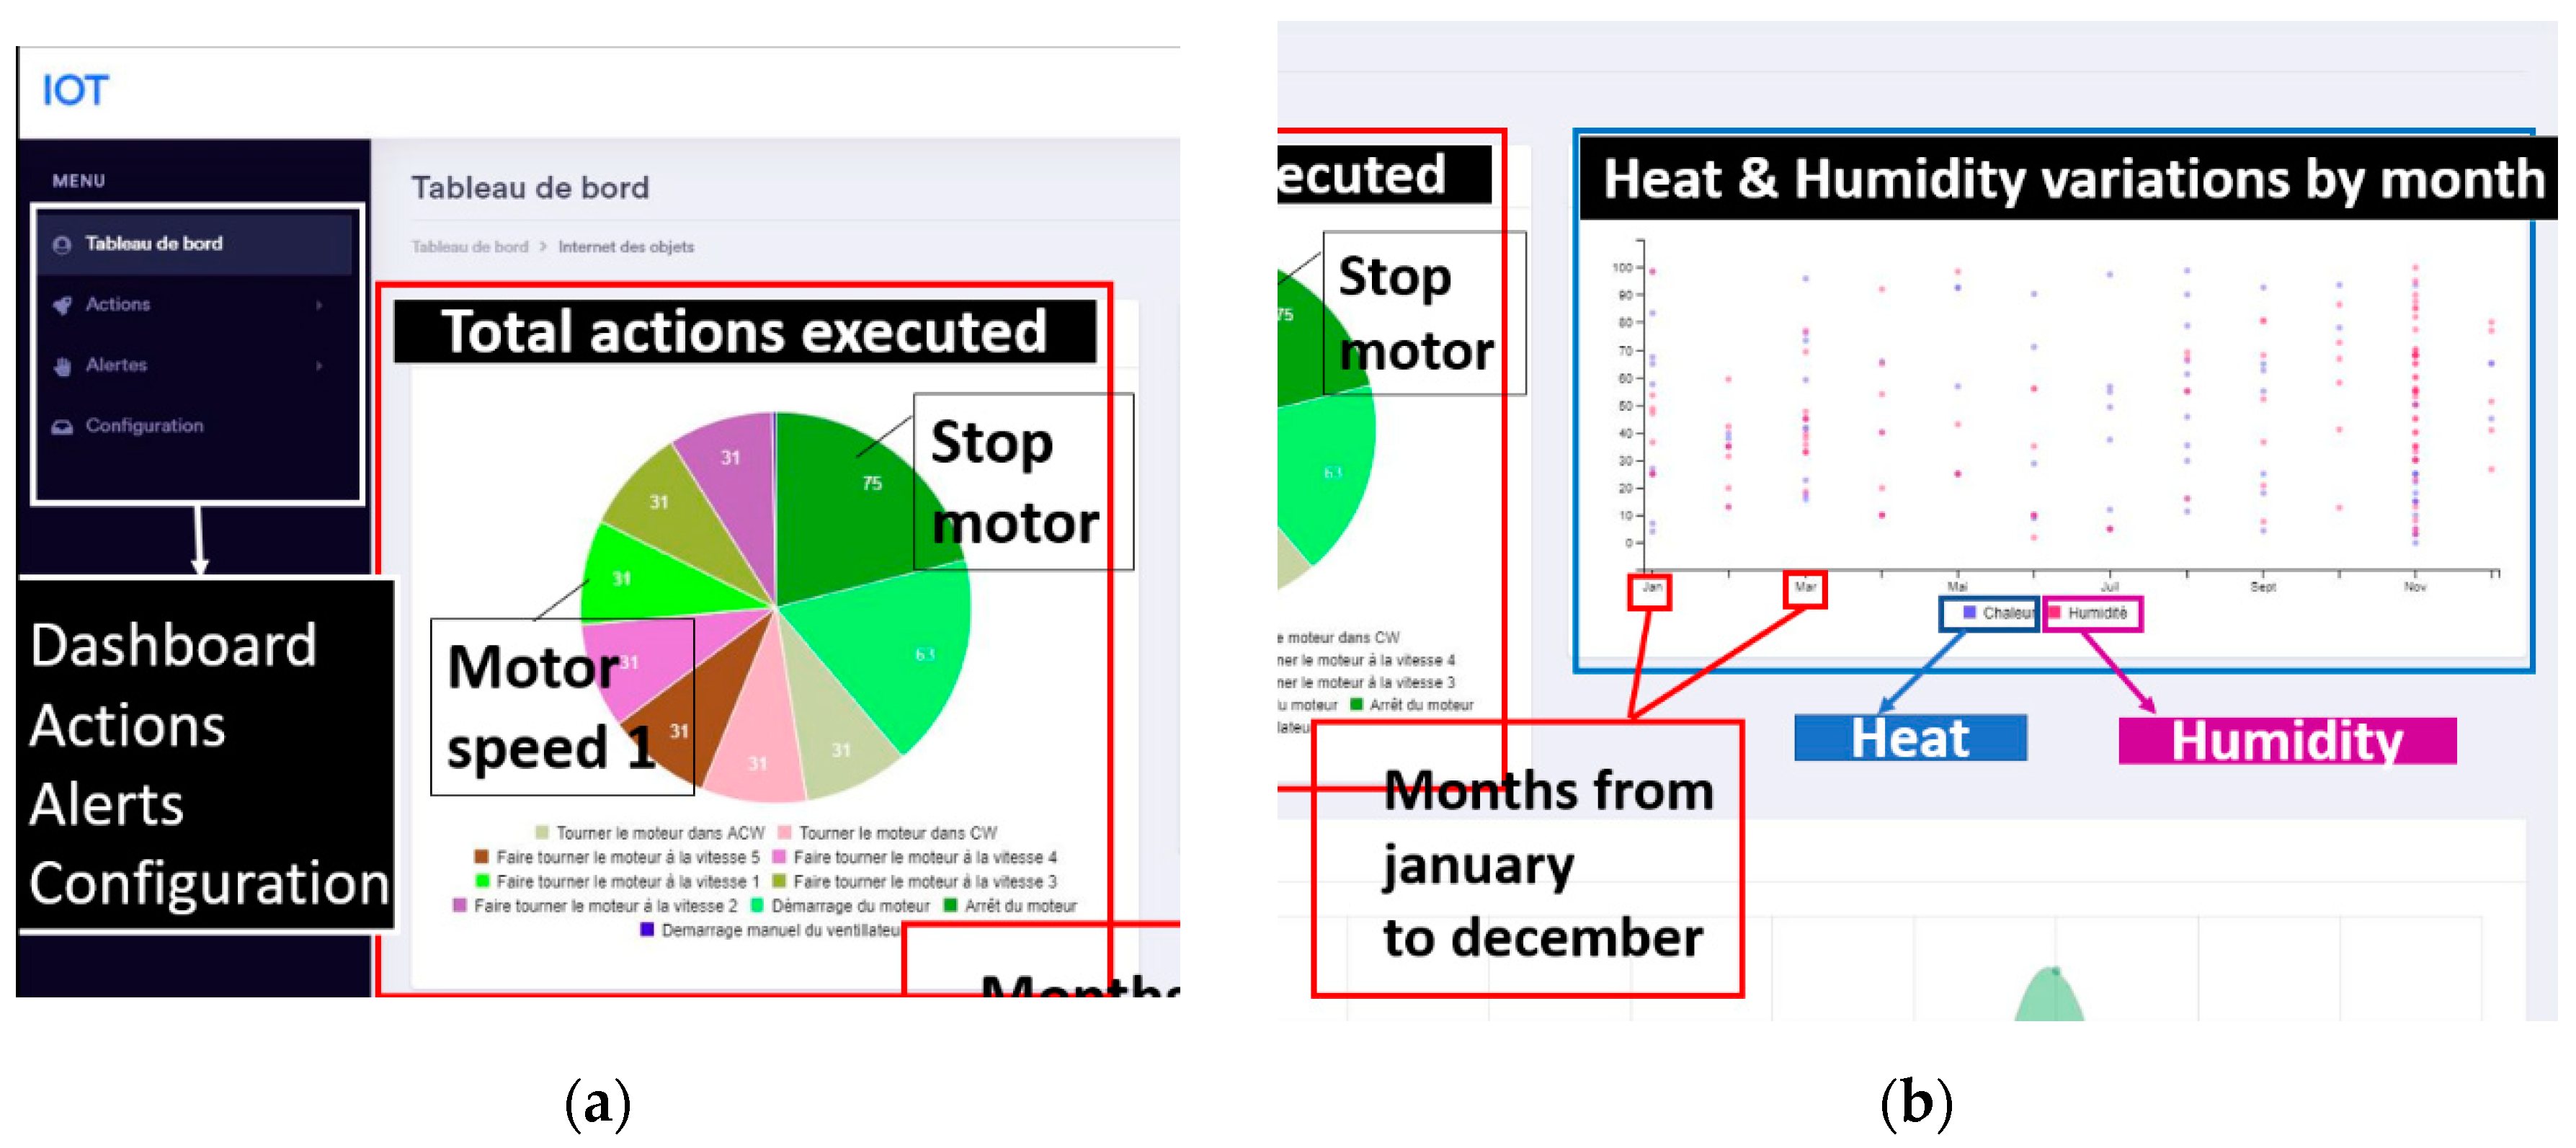
Figure 17.
Reports through a web interface: (a) Total alerts received; (b) Alerts received by month.
Figure 17.
Reports through a web interface: (a) Total alerts received; (b) Alerts received by month.

Figure 18.
Reports through a web interface.
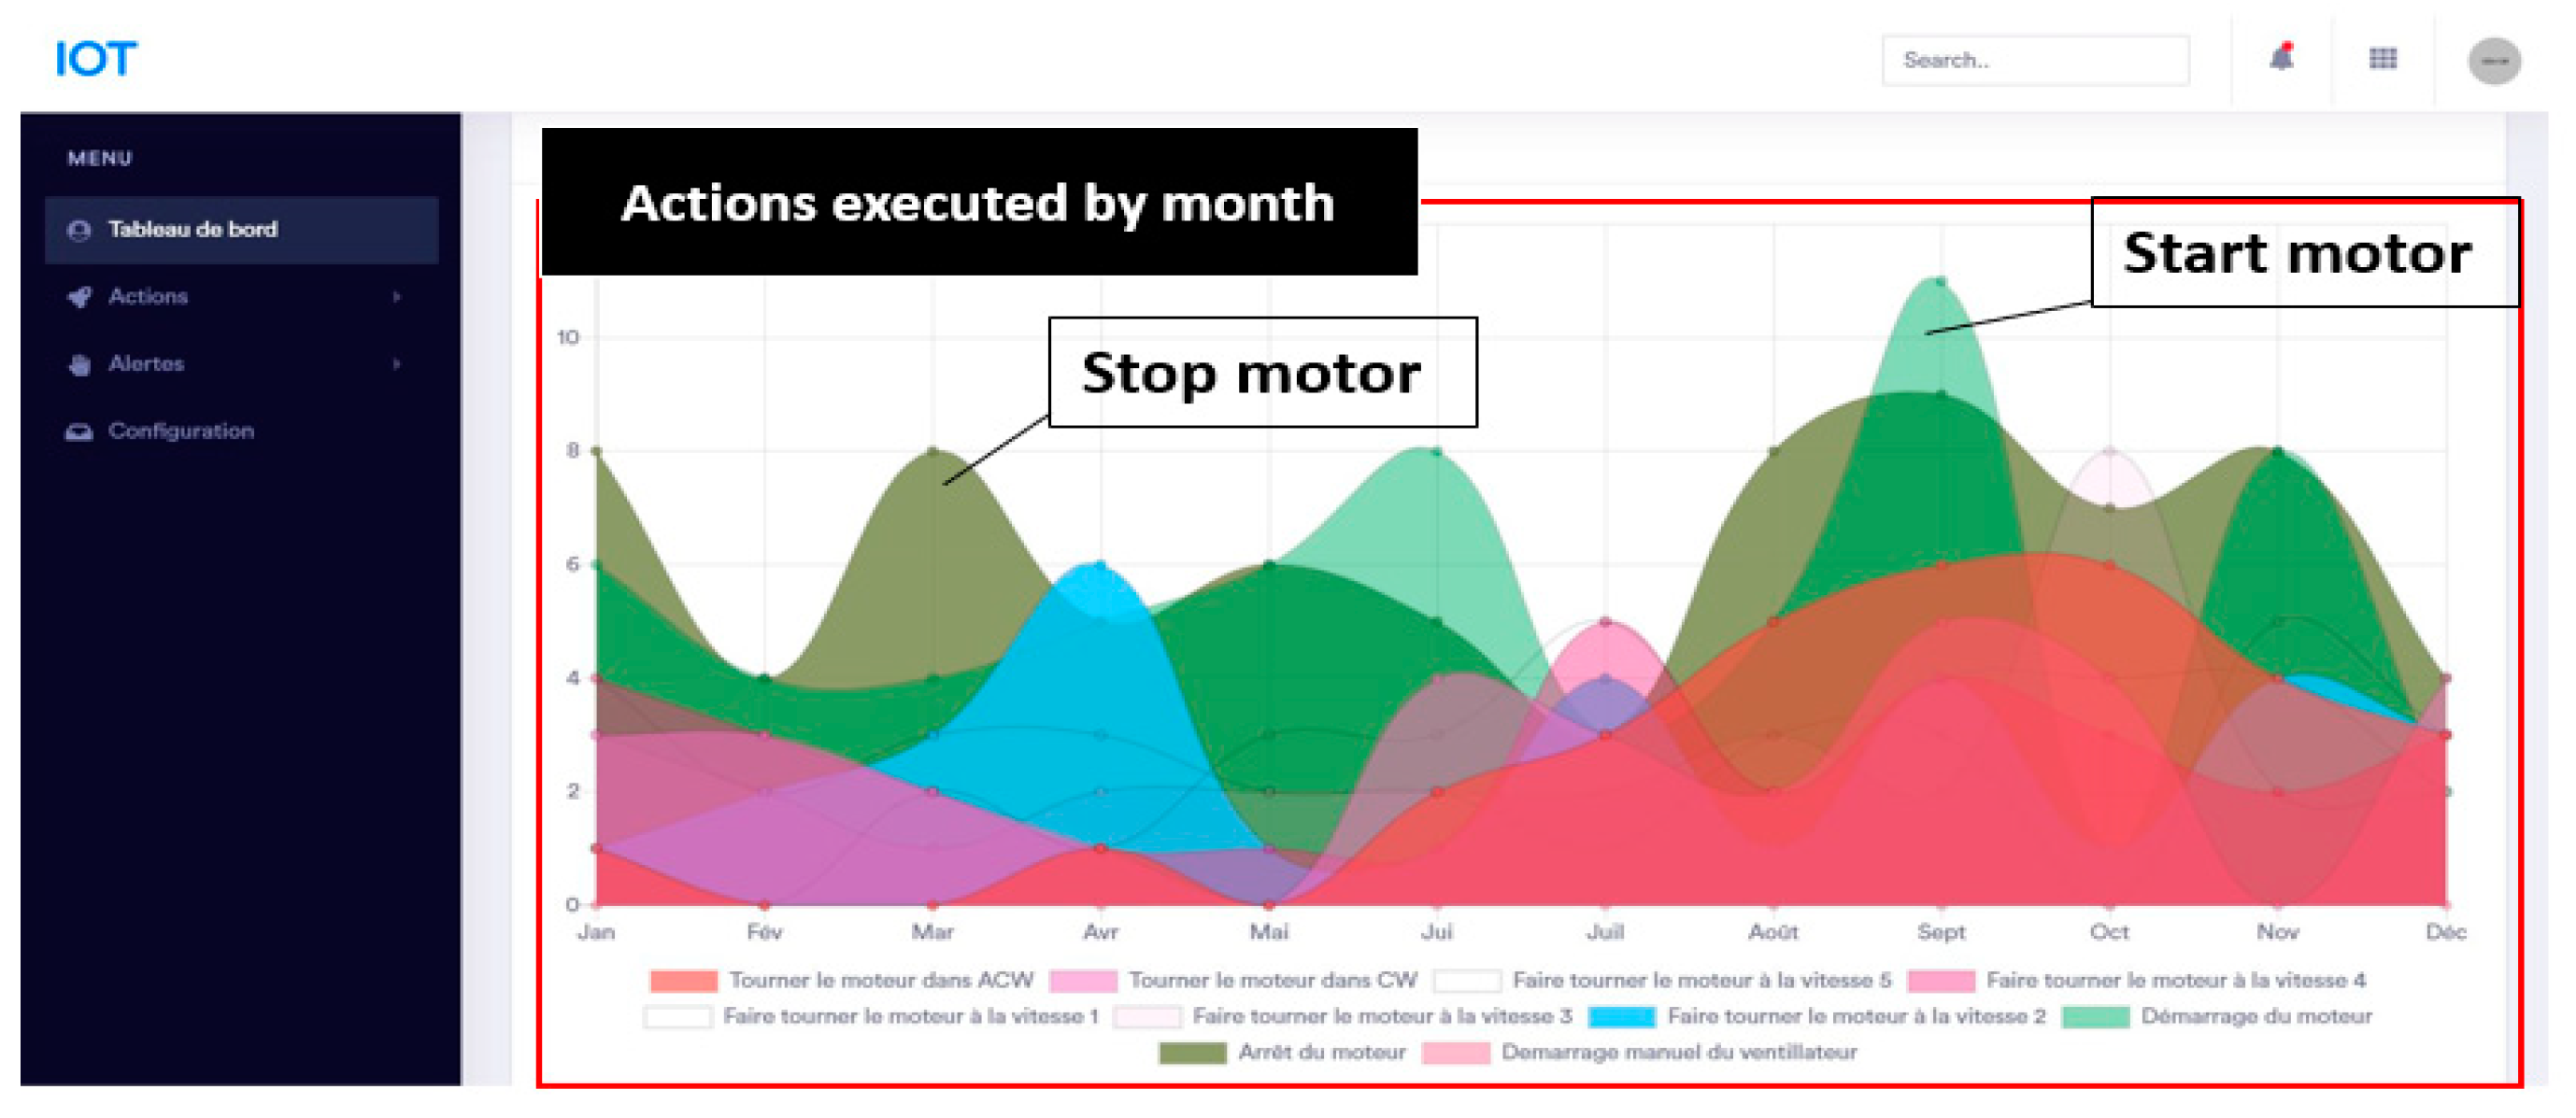
Through the web interface, Fig. 16, 17 and 18, we offer statistics and reports for the user such as variations in temperature or humidity over time, the number of actions runs either automatically launches or manually launch as well as alerts through the stored data based on the threshold setting.
Figure 19.
System monitoring and control through a web interface: (a) Real-time monitoring; (b) Real-time heat variations monitoring.
Figure 19.
System monitoring and control through a web interface: (a) Real-time monitoring; (b) Real-time heat variations monitoring.
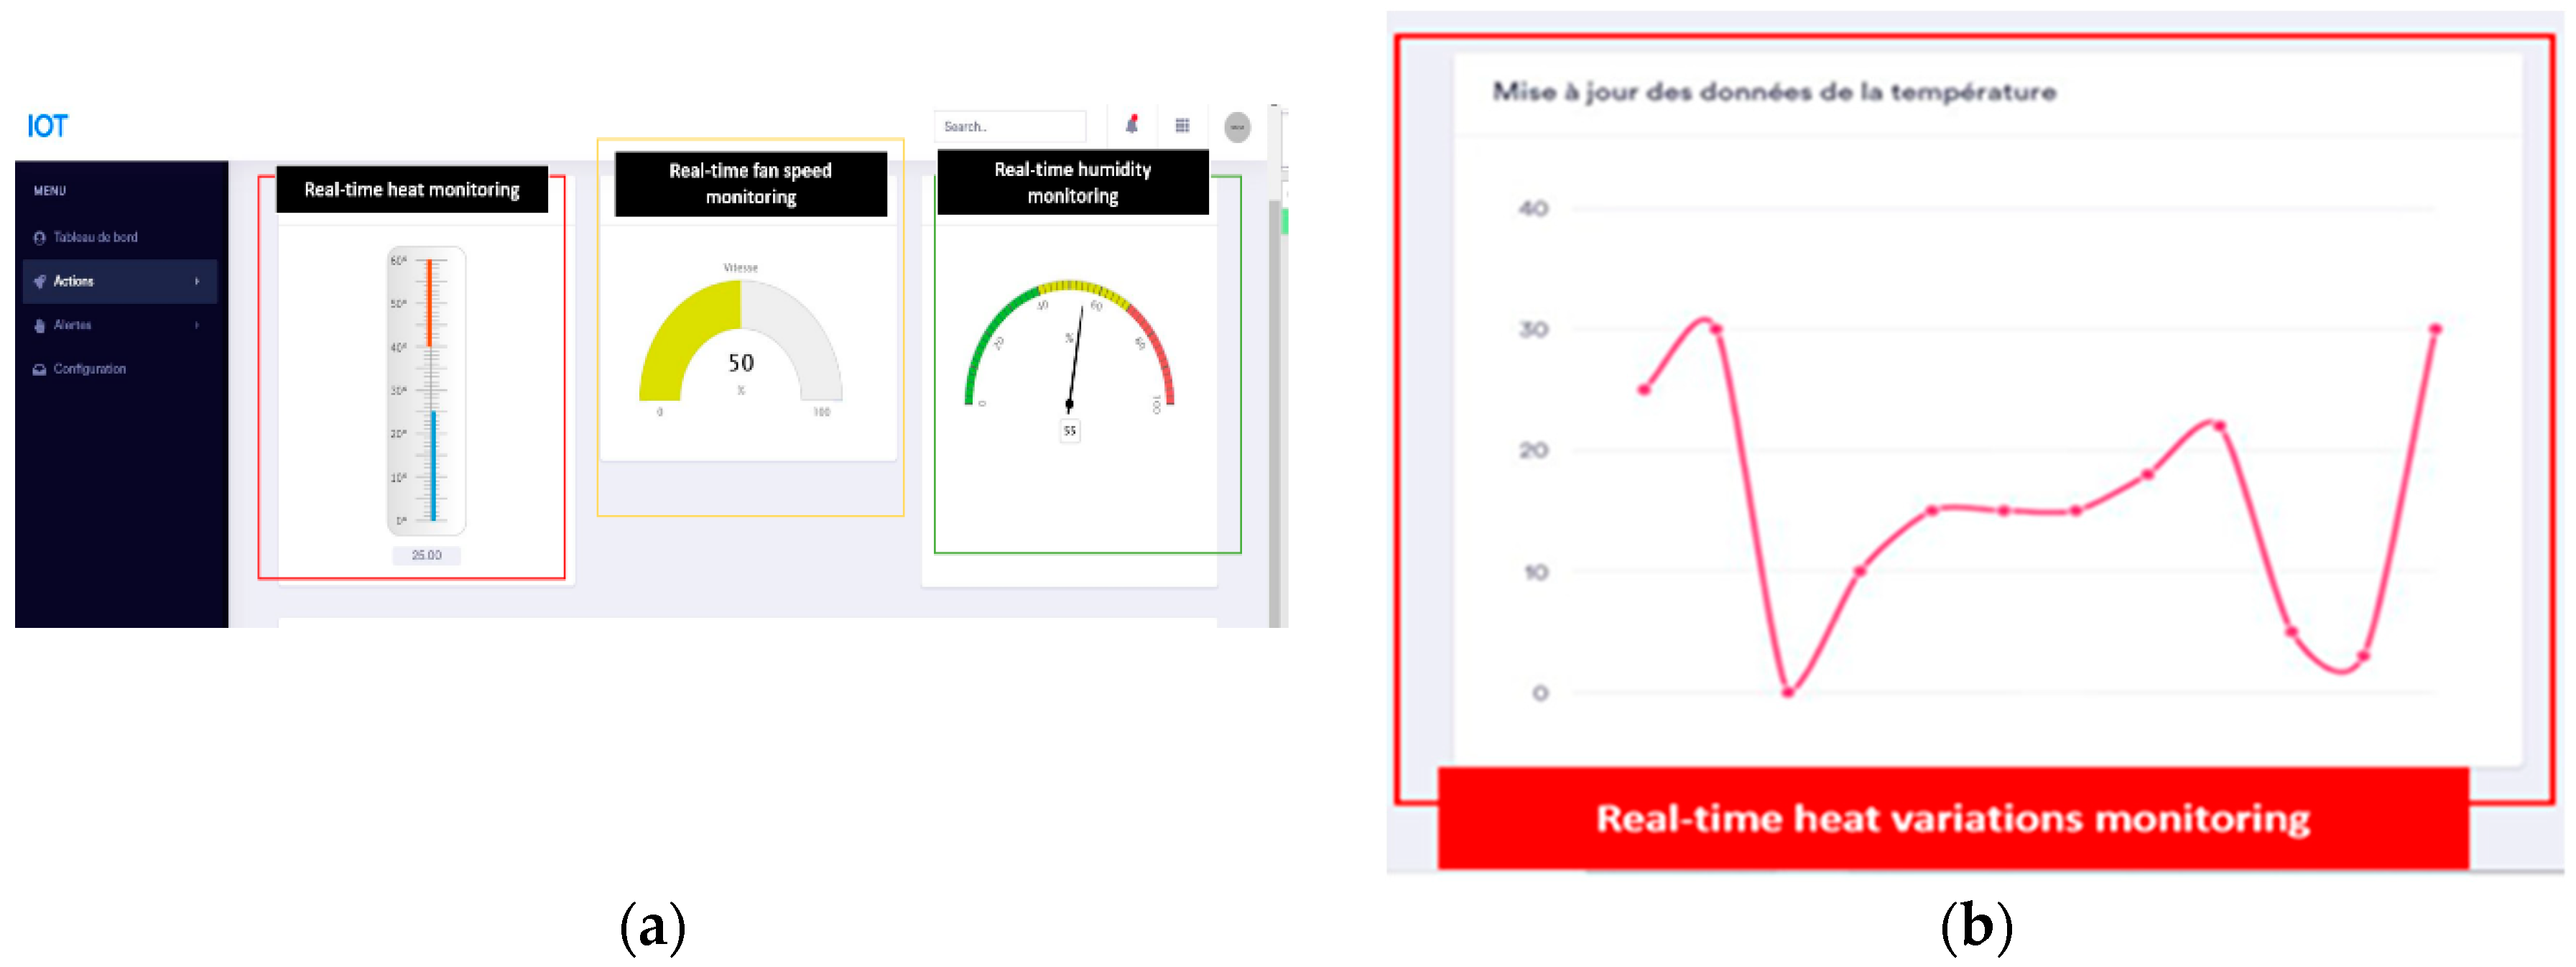
Figure 20.
System monitoring and control through a web interface: (a) Real-time humidity variations monitoring; (b) System control interface.
Figure 20.
System monitoring and control through a web interface: (a) Real-time humidity variations monitoring; (b) System control interface.
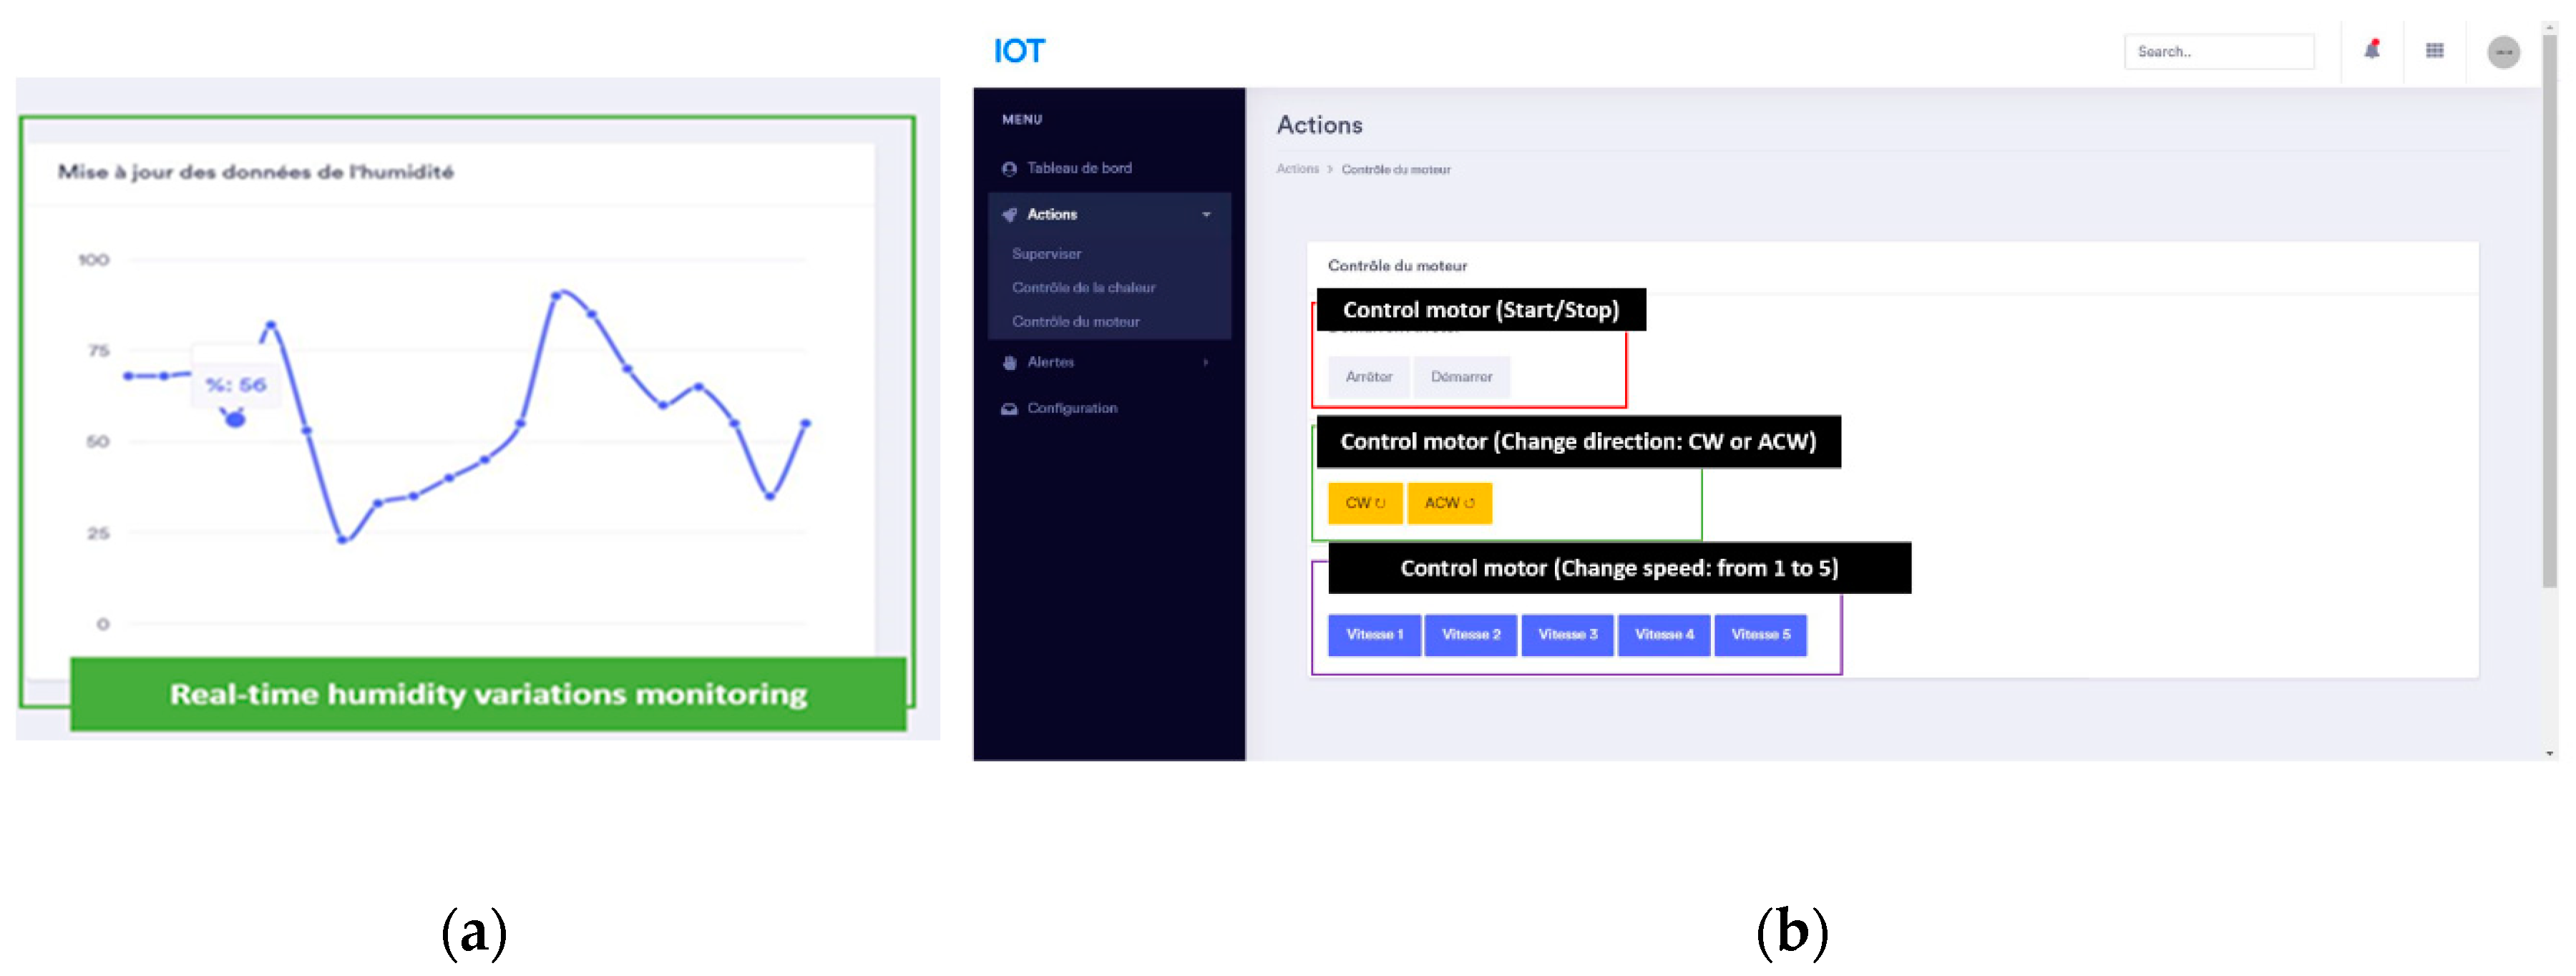
Figure 21.
System monitoring and control through a web interface: (a) Real-time fire alerts monitoring; (b) Real-time motion alerts monitoring.
Figure 21.
System monitoring and control through a web interface: (a) Real-time fire alerts monitoring; (b) Real-time motion alerts monitoring.
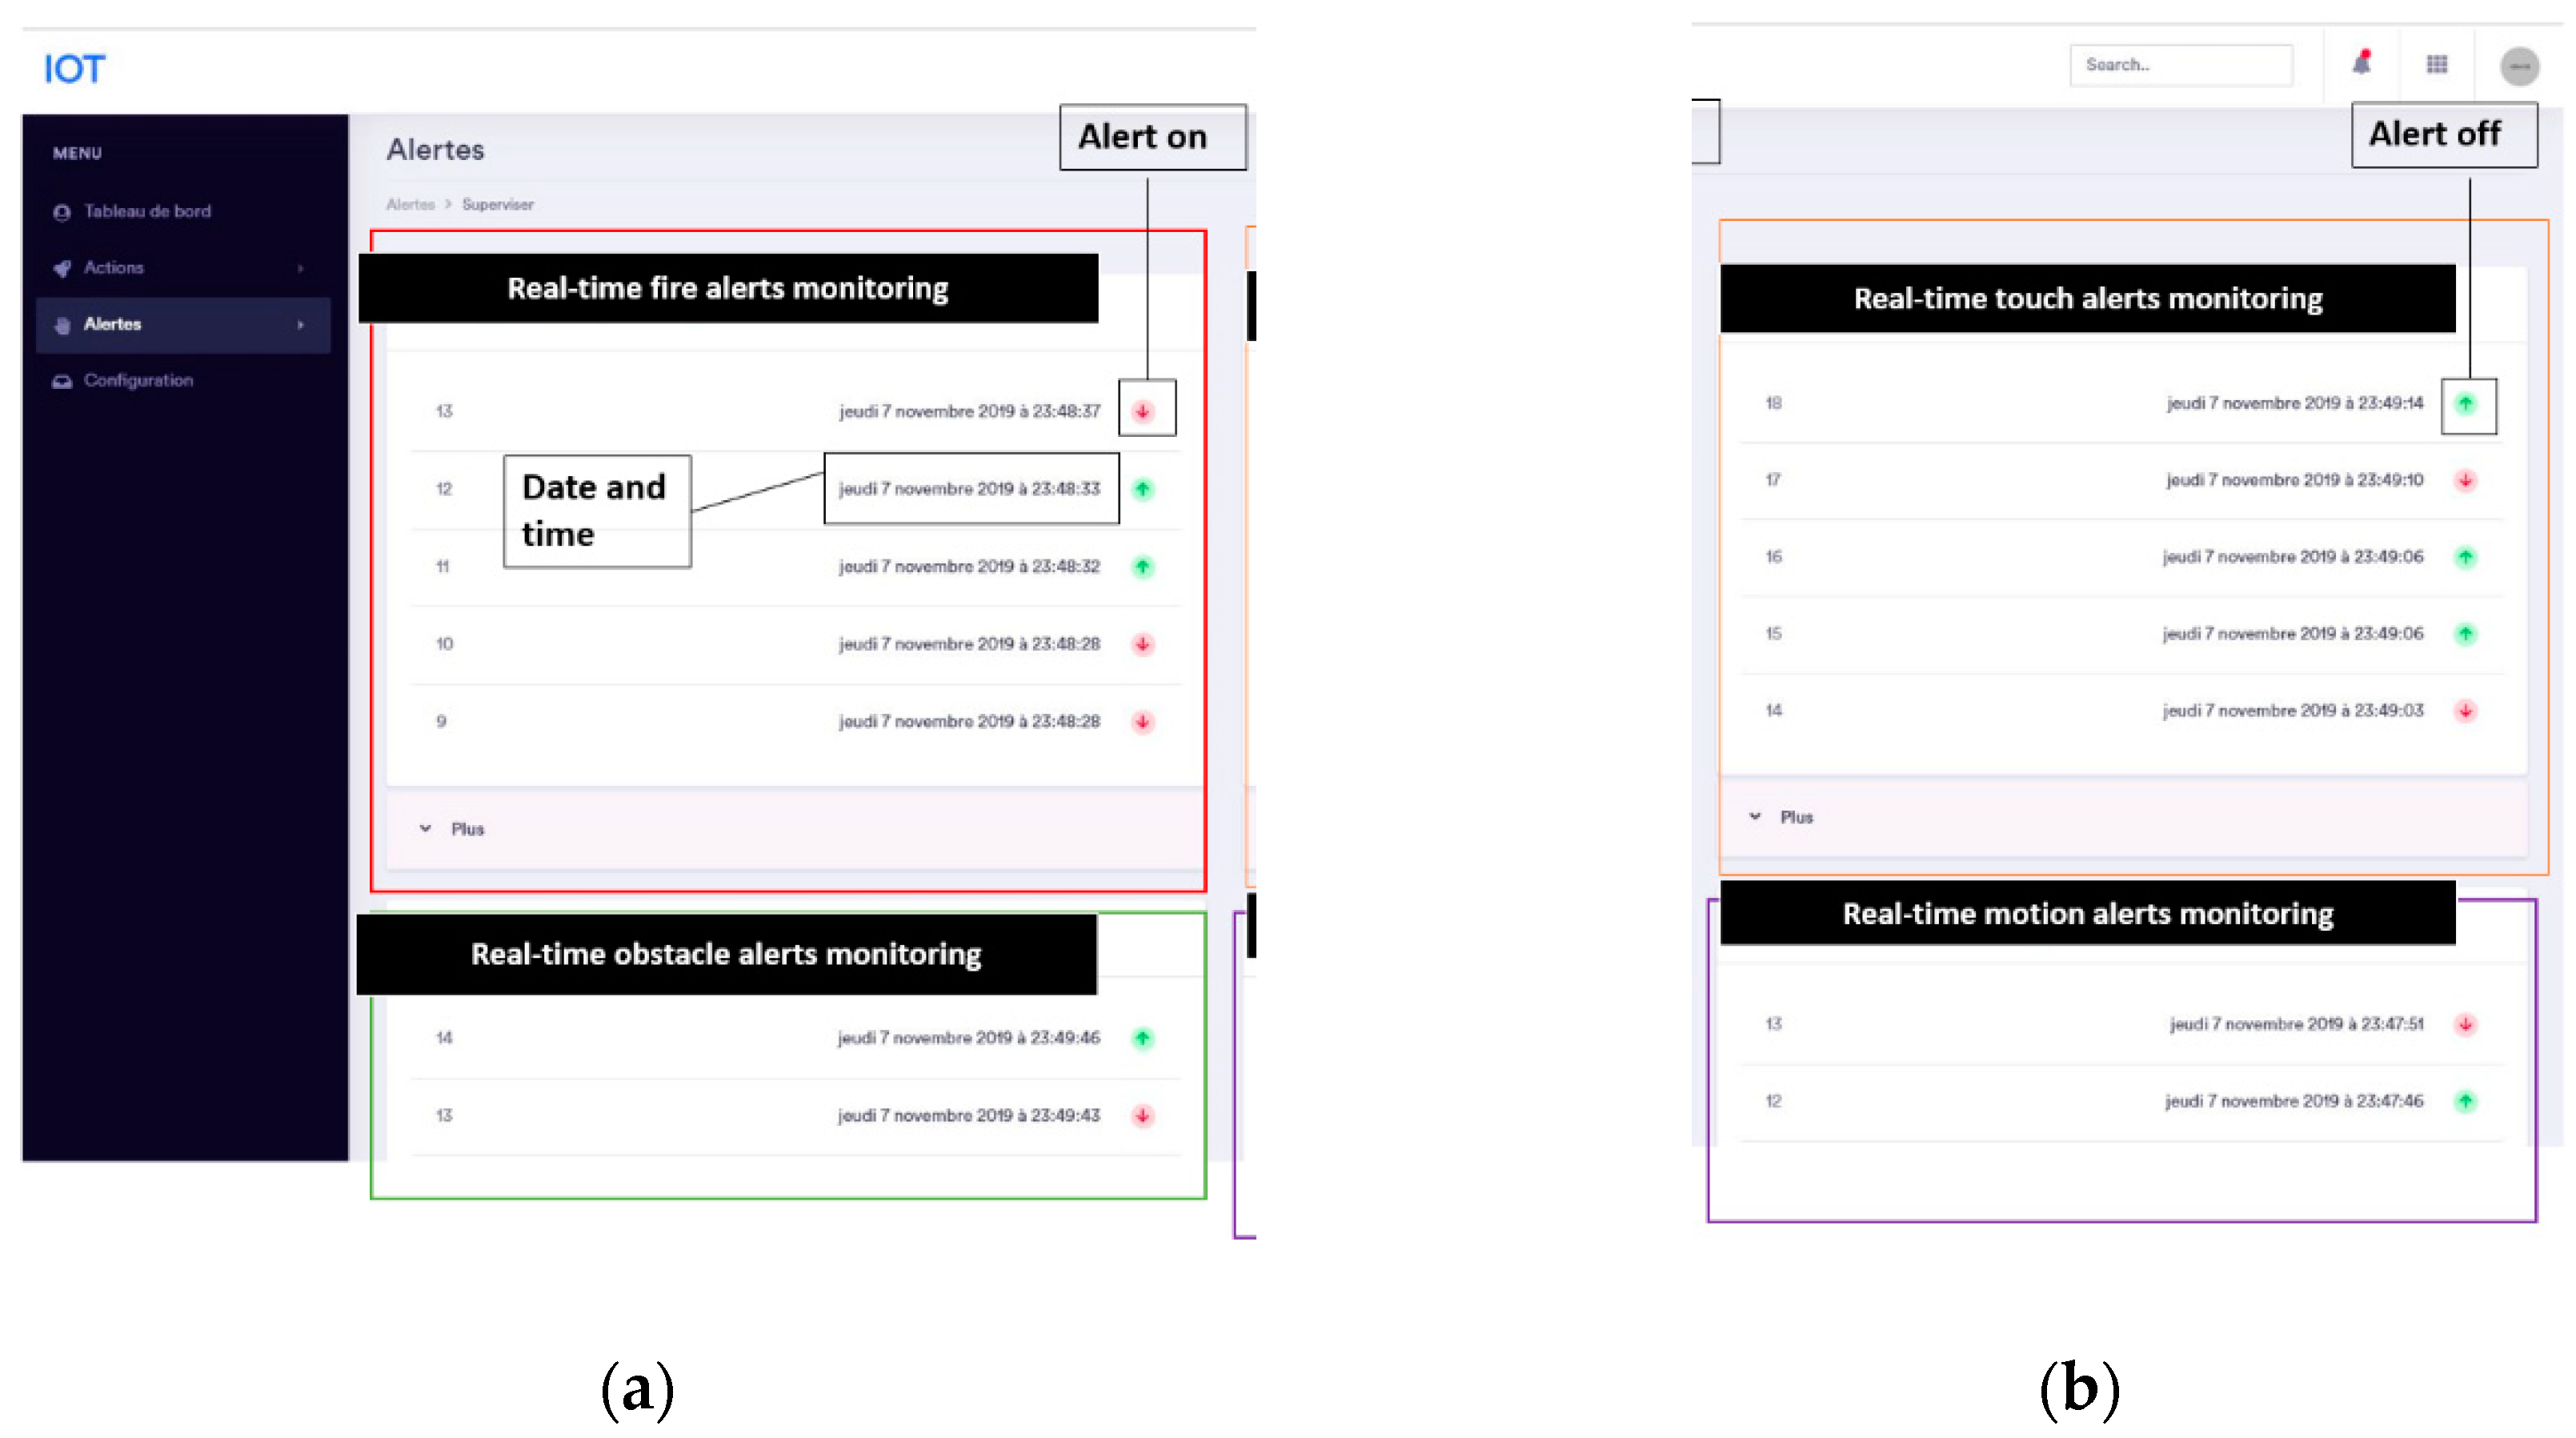
Figure 22.
System control through a web interface.
As shown in Fig. from 19 to 22, we also allow the user to get real-time tracking of temperature and humidity changes or alert tracking through communication with the MQTT broker.
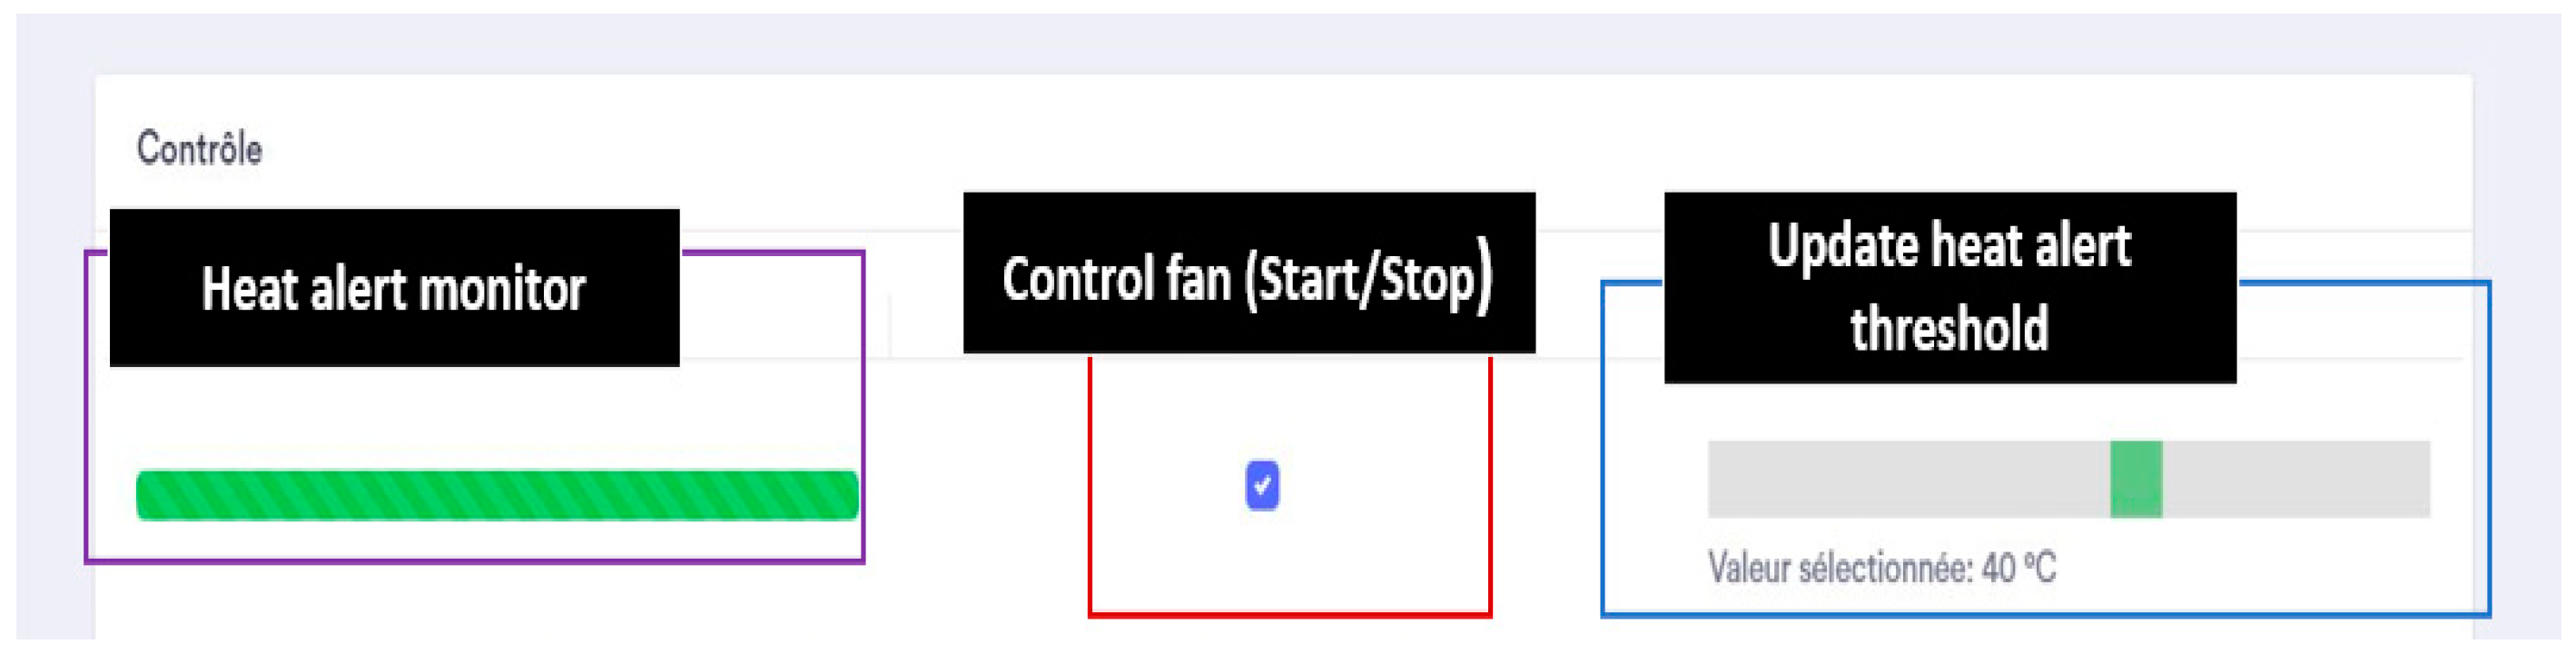
In addition, we offer remote control to initiate actions such as starting a servo motor or a fan. Plus, the possibility to update for example, alert threshold for temperature.
Figure 23.
System configuration through a web interface: (a) Check the connection to the MQTT Broker or begin storing data into the database; (b) Initiate synchronization from Edge to Cloud or halt data storage into the database.
Figure 23.
System configuration through a web interface: (a) Check the connection to the MQTT Broker or begin storing data into the database; (b) Initiate synchronization from Edge to Cloud or halt data storage into the database.
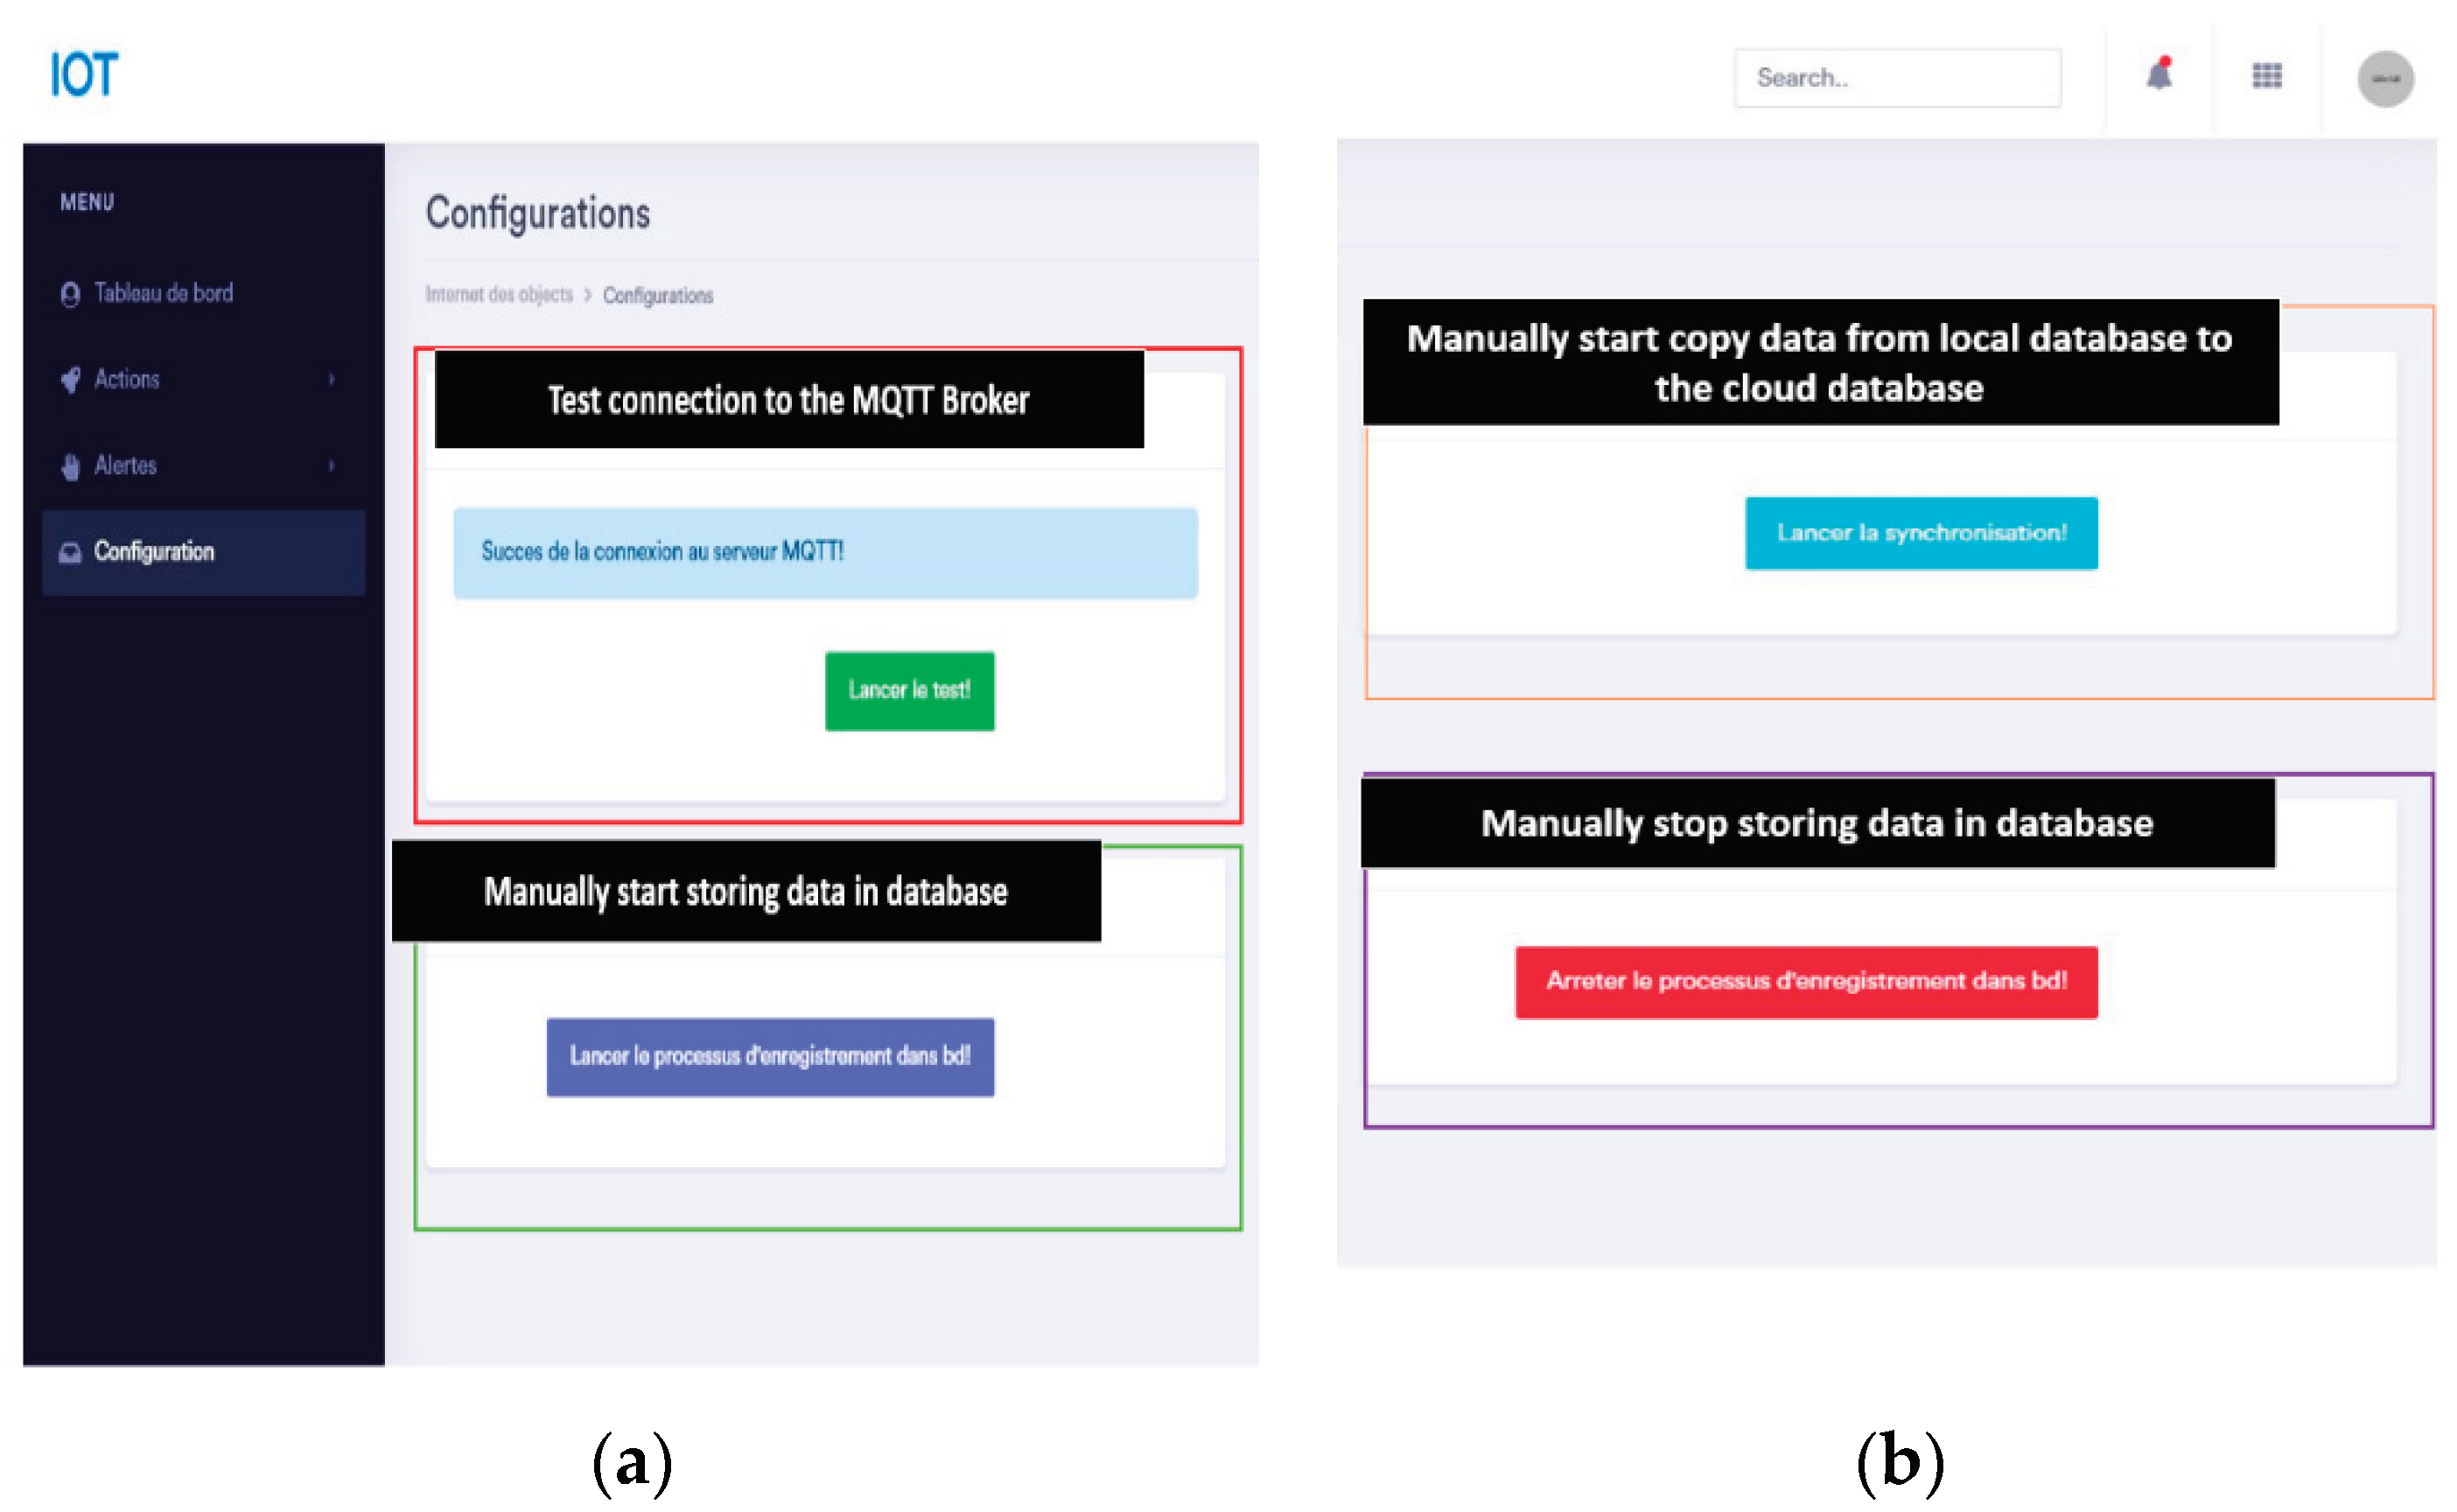
Finally, we give the possibility through a web page for the system configuration, the ability to choose to store the data in databases or not, test the connection with the MQTT broker and manually start synchronization to recover the data stored in the local database and the transmission to the remote database, shown in Fig 23.
7. Conclusion
The scientific contribution of this paper is, on the one hand, the presentation of the different parts of a typical Internet of Things Infrastructure in aim to understand the relationship between IoT, Cloud Computing and Big Data.
On the other hand, the implementation of a complete system able to face the challenges presented by the Internet of Things such as the amount of data generated and which must be managed more efficiently and by ensuring effective local and global communication for various heterogeneous devices through connectivity based on different protocols. Consequently, the proposed method is capable to prevent data loss, as data coming from IoT present the source for Big Data technologies to allow better analytics.
In this paper, we presented the implementation and efficient integration of multiple connectivity protocols into a single IoT system to ensure the continuity and reliability of data collection, processing and storage in aim to ensure data compliance for better analysis and interpretation.
In addition, this research proves the effectiveness of the integration of different technologies such as Edge Computing to manage and cope with the huge amount of data transmitted which will subsequently be processed to give users strong statistics and reports as well as monitoring of the state and forecasts.
In the future, we plan to integrate other features that revolve around Machine Learning, such as camera integration and the use of object recognition, as well as the implementation of voice control.
Author Contributions
Conceptualization, H.T., L.T. and Y.F.; methodology, H.T., L.T. and Y.F.; software, H.T.; validation. H.T., L.T. and Y.F.; formal analysis, H.T.; investigation, H.T., L.T. and Y.F.; data curation, H.T.; writing—original draft preparation, H.T.; writing—review and editing, L.T. and Y.F.; visualization, L.T. and Y.F.; supervision, L.T. and Y.F.; All authors have read and agreed to the published version of the manuscript.
Funding
This research received no external funding.
Institutional Review Board Statement
Not applicable.
Informed Consent Statement
Not applicable.
Data Availability Statement
Not applicable.
Acknowledgments
The authors are grateful to Sayyed Ahmad Khadem for useful discussions and comments on the manuscript.
Conflicts of Interest
The authors declare no conflicts of interest.
References
- J. Ding, M. Nemati, C. Ranaweera and J. Choi, “IoT Connectivity Technologies and Applications: A Survey,” in IEEE Access, vol. 8, pp. 67646-67673, 2020. [CrossRef]
- Y. Liu, C. Chi, Y. Zhang and T. Tang, “Identification and Resolution for Industrial Internet: Architecture and Key Technology,” in IEEE Internet of Things Journal, vol. 9, no. 18, pp. 16780-16794, Sept.15, 2022. [CrossRef]
- Aagaard, M. Presser and T. Andersen, “Applying Iot as a leverage for business model innovation and digital transformation,” 2019 Global IoT Summit (GIoTS), Aarhus, Denmark, 2019, pp. 1-5. [CrossRef]
- M. N. Alam and M. S. Kabir, “Forensics in the Internet of Things: Application Specific Investigation Model, Challenges and Future Directions,” 2023 4th International Conference for Emerging Technology (INCET), Belgaum, India, 2023, pp. 1-6. [CrossRef]
- Sharon Varghese (2016), Application of IoT to improve the lifestyle of differently abled people, IOSR Journal of Computer Engineering (IOSR-JCE), pages 29-34.
- Baksi, M. Bhattacharjee, S. Ghosh, S. K. Bishnu and A. Chakraborty, “Internet of Things (IOT) Based Ambulance Tracking System Using GPS and GSM Modules,” 2020 4th International Conference on Electronics, Materials Engineering & Nano-Technology (IEMENTech), Kolkata, India, 2020, pp. 1-4. [CrossRef]
- K. Jayaram, K. Janani, R. Jeyaguru, R. Kumaresh, N. Muralidharan, Forest Fire Alerting System With GPS Co-ordinates Using IoT, 2019, 5th International Conference on Advanced Computing & Communication Systems (ICACCS), pages 488-491, 2019.
- Ahmed Imteaj, Tanveer Rahman, Muhammad Kamrul Hossain, Mohammed Shamsul Alam and Saad Ahmad Rahat, An IoT based Fire Alarming and Authentication System for Workhouse using Raspberry Pi 3, 2017, International Conference on Electrical, Computer and Communication Engineering (ECCE), pages 899-904.
- K.M.Gaikwad, Ahmed Quadri, Shelar Akshada, Zagade Reshma, Fire Monitoring and Control System, 2016, International Research Journal of Engineering and Technology (IRJET).
- Mohd Faris Mohd Fuzi, Alif Faisal Ibrahim, Mohammad Hafiz Ismail, Nur Syakira Ab Halim, HOME FADS: A Dedicated Fire Alert Detection System Using ZigBee Wireless Network, 2014, IEEE, 5th Control and System Graduate Research Colloquium, pages 53-58.
- S. Tanwar_, P. Pately, K. Patelz, S. Tyagix, N. Kumar, M. S. Obaidat, An Advanced Internet of Thing based Security Alert System for Smart Home, 2017, International Conference on Computer, Information and Telecommunication Systems (CITS).
- Adil Hamid Malik, Aaqib jalal, Bilal Ahmed Parray, Meena kohli (2017), Smart City IoT Based Weather Monitoring System, 2017 International journal of Engineering Science and Computing (IJESC) Volume 7 Issue no.
- Karandeep Kaur (2018), A Survey on Internet of Things – Architecture, Applications, and Future Trends, IEEE, First International Conference on Secure Cyber Computing and Communication (ICSCCC), pages 581-583. [CrossRef]
- Deepti Sehrawat and Nasib Singh Gill (2019), Smart Sensors: Analysis of Different Types of IoT Sensors, IEEE, 3rd International Conference on Trends in Electronics and Informatics (ICOEI), pages 523-528. [CrossRef]
- Ray, P.P. (2016), A survey on Internet of Things architectures, Journal of King Saud University - Computer and Information Sciences (Vol.30). [CrossRef]
- Tommaso Polonelli, Davide Brunella, Alberto Girolami, Gerardo Nahuel Demmi, Luca Benini (2019), A multi-protocol system for configurable data streaming on IoT healthcare devices, IEEE, IEEE 8th International Workshop on Advances in Sensors and Interfaces (IWASI), pages 112-117. [CrossRef]
- Tara Salman and Raj Jain (2017), Networking Protocols and Standards for Internet of Things, Internet of Things and Data Analytics Handbook, pages 215-238. [CrossRef]
- R. Biswas and R. Giaffreda, “IoT and cloud convergence: Opportunities and challenges,” 2014 IEEE World Forum on Internet of Things (WF-IoT), Seoul, Korea (South), 2014, pp. 375-376. [CrossRef]
- H. Khodkari, S. Ghazi-Maghrebi and A. Asosheh, “Assurance of QoS in the integration of cloud services and internet of things,” 2017 International Symposium on Networks, Computers and Communications (ISNCC), Marrakech, Morocco, 2017, pp. 1-5. [CrossRef]
- S. Naveen and M. R. Kounte, “Key Technologies and challenges in IoT Edge Computing,” 2019 Third International conference on I-SMAC (IoT in Social, Mobile, Analytics and Cloud) (I-SMAC), Palladam, India, 2019, pp. 61-65. [CrossRef]
- Cisco Internet Business Solutions Group (IBSG) (2011), The Internet of Things How the Next Evolution of the Internet Is Changing Everything.
- Lubhna Kaul and R.H Goudar (2016), Internet of things and Big Data – challenges, IEEE, Online International Conference on Green Engineering and Technologies (IC-GET). [CrossRef]
- C. Zhang, “Intelligent Internet of things service based on artificial intelligence technology,” 2021 IEEE 2nd International Conference on Big Data, Artificial Intelligence and Internet of Things Engineering (ICBAIE), Nanchang, China, 2021, pp. 731-734. [CrossRef]
- S. F. Dietlmeier, R. J. Floetgen, J. Bock and F. Urmetzer, “IoT for Rail Transportation: The Case of Railigent,” 2022 IEEE International Conference on Big Data (Big Data), Osaka, Japan, 2022, pp. 3806-3813. [CrossRef]
- Thyssenkrup, Max The game-changing predictive maintenance service for elevators.
- Rolls Royce, Powering better performance and customer experience with the Internet of Engines.
- D. Petrov, K. Kroschewski and U. Hilleringmann, “Microcontroller Firmware Design for Industrial Wireless Sensors,” 2021 Smart Systems Integration (SSI), Grenoble, France, 2021, pp. 1-4. [CrossRef]
- Lukas Kaul, Practical Arduino Robotics: A hands-on guide to bringing your robotics ideas to life using Arduino, Packt Publishing, 2023.
- Reyax Technology corporation LTD (2018), RYLR896, UART Interface 868/915MHz Lora Antenna Transceiver Module, Datasheet.
- TinySine, 3G/GPRS/GSM Shield for Arduino with GPS - American version SIM5320A.
- S. M. Muzammal, R. K. Murugesan and N. Z. Jhanjhi, “A Comprehensive Review on Secure Routing in Internet of Things: Mitigation Methods and Trust-Based Approaches,” in IEEE Internet of Things Journal, vol. 8, no. 6, pp. 4186-4210, 15 March, 2021. [CrossRef]
- C. S. Rajora and A. Sharma, “IoT Based Smart Home with Cutting-Edge Technology for IDS/IPS,” 2022 Second International Conference on Advanced Technologies in Intelligent Control, Environment, Computing & Communication Engineering (ICATIECE), Bangalore, India, 2022, pp. 1-5. [CrossRef]
Table 1.
Summary table of communication protocols for IoT [27].
Table 1.
Summary table of communication protocols for IoT [27].
| Standard | Frequency | Range | Transmission speed | Advantages | Drawbacks | |
|---|---|---|---|---|---|---|
| Bluetooth | Bluetooth 4.2 | 2,4 GHz | 20 m | 1 Mbit/s | - Large capacity to stream large amounts of data. | - Short range. - Small portions of data. |
| Zigbee | IEEE802.15.4 | 2,4 GHz | 10-100 m | 20-250 Kbit/s | - Low energy consumption. - High security. |
- Limited network coverage. - Low transmission speed. |
| Z-Wave | Z-Wave Alliance ZAD12837/ITU-T G.9959 | 900 MHz | 30 m | 9,6/40/100 Kbit/s | - Low energy consumption. - Low latency. |
- Dependent to circuit manufacturer Sigma Designs. |
| Wi-Fi | 802.11n | 2,4 GHz 5 GHz |
50 m | 600 Mbit/s | - Good signal quality. - High Speed. |
- High energy consumption. |
| Cellular | GSM/GPRS/EDGE (2G) UMTS/HSPA (3G) LTE (4G) |
900 / 1 800 / 1 900 / 2 100 MHz | 35 km for GSM 200 km for HSPA |
35-170 Kbit/s (GPRS) 120-384 Kbit/s (EDGE) 384 Kbit/s-2 Mbit/s (UMTS) 600 Kbit/s-10 Mbit/s (HSPA) 3-10 Mbit/s (LTE) |
- High security. - Good signal quality. - High availability. - Good geographical coverage. - (4G) Broadband. |
- Low reach in rural areas - Operator dependence. - High energy consumption. - Too expensive. |
| NFC | ISO/CEI18000-3 | 13,56 MHz | 10 cm | 100–420 Kbit/s | - Simple and secure bidirectional interactions. | - Short range. |
| Sigfox | Sigfox | 900 MHz | 30-50 km (Rural) 3-10 km (Urban) |
10-1000 bit/s | - Long range. - Low energy consumption. |
- Low transmission speed. - Need subscription to use the Sigfox network. |
| LoRaWan | LoRaWAN | Variable | 15 km (Rural) 2-5 km (Urban) |
0,3-50 Kbit/s | - Low energy consumption. - Low prices. - Long range. |
- Low transmission speed. |
| Bluetooth | Bluetooth 4.2 | 2,4 GHz | 20 m | 1 Mbit/s | - Large capacity to stream large amounts of data. | - Short range. - Small portions of data. |
Table 2.
Summary table of data transmission protocols for IoT.
| Advantages | Drawbacks | |
|---|---|---|
| MQTT | - Lightweight. - Support publication / subscription and request / response model. - Reduced size of the header (two bytes). - Simplicity and speed of implementation. |
- No message queue support. - High power consumption thanks to the TCP-based connection. |
| CoAP | - Low consumption. - Has the same API verbs and templates as REST on UDP. - Speed of communication in UDP. - Very low consumption. |
- Has the same weaknesses as REST except for QoS levels. - Supports only the request-response message exchange model. |
| AMQP | - Support for most message exchange templates - Encoding of messages. - Support TCP and UDP protocols. - End-to-end encryption - Supports detailed header fields. |
- High-processing requirements. - Relatively high use of resources. - High energy and memory consumption. - Header fields are long. |
Disclaimer/Publisher’s Note: The statements, opinions and data contained in all publications are solely those of the individual author(s) and contributor(s) and not of MDPI and/or the editor(s). MDPI and/or the editor(s) disclaim responsibility for any injury to people or property resulting from any ideas, methods, instructions or products referred to in the content. |
© 2024 by the authors. Licensee MDPI, Basel, Switzerland. This article is an open access article distributed under the terms and conditions of the Creative Commons Attribution (CC BY) license (http://creativecommons.org/licenses/by/4.0/).
Copyright: This open access article is published under a Creative Commons CC BY 4.0 license, which permit the free download, distribution, and reuse, provided that the author and preprint are cited in any reuse.


