Submitted:
28 February 2024
Posted:
29 February 2024
You are already at the latest version
Abstract
Candida (C.) infections represent a serious health risk for people affected by inflammatory bowel disease. An important fungal virulence factor is the capacity to form biofilms on the colonized surface of the host. This research study aimed to determine the effect of C. tropicalis and C. albicans co-infection on dextran sodium sulfate (DSS)-induced colitis in mice. Colitis severity was evaluated using histology and colonoscopy. Mice were mono-inoculated with C. albicans, C. tropicalis or co-challenged with both species. Mice were administered 3% DSS to induce acute colitis. Biofilm activity was assessed using (2-methoxy-4-nitro-5-sulfophenyl)-5-[(phenylamino)carbonyl] 2H-tetrazoliumhydroxide (XTT) assay. Abundance of C. albicans in the colon tissues was assessed by immunohistochemistry. Co-challenged mice showed decreased colitis severity compared to mono-inoculated mice. The XTT assay demonstrated a marked decrease of C. albicans biofilm production in a C. albicans culture incubated with C. tropicalis supernatant. Immunohistochemical staining showed that C. albicans was more abundant in the mucosa of C. albicans mono-inoculated mice compared to the co-inoculated group. These data indicate an antagonistic microbial interaction between the two Candida species, where C. tropicalis may produce molecules capable of limiting the ability of C. albicans to adhere to the host intestinal surface leading to a reduction in biofilm formation.
Keywords:
C. albicans
; colitis
; C. tropicalis
; mycobiome
; biofilm
1. Introduction
Ulcerative colitis (UC) and Crohn’s disease (CD) are the two main forms of chronic inflammatory bowel diseases (IBD)s. CD can affect any part of the gastrointestinal system, and patients can present with multiple symptoms including abdominal pain, diarrhea, nausea, fatigue, cramping and blood in the stools [1,2].
CD is a chronic disease that cannot be fully cured, the main clinical therapies are focused on slowing down CD progression using anti-inflammatory approaches such as biological therapies and steroids [3,4].
Multiple factors contribute to the pathophysiology of IBD and the consequent manifestation of a wide range and severity of symptoms, including the intestinal microbial communities (microbiome), immune responses, psychological stress, and patient’s genetic susceptibility to the disease [5,6,7]. Specifically, genetically predisposed subjects can commonly experience an inappropriate immune response to intestinal commensal microbes [8].
Recently, several studies showed that the fungal community (mycobiome), an essential and integral component of the intestinal microbial population, can affect the pathogenesis of CD [9]. The mycobiome resides in any part of the digestive tract and mostly consists of commensal fungi. However, in some instances, intestinal fungal commensals can overgrow and become opportunistic pathogens, therefore contributing to the etiology of IBD, particularly in more susceptible individuals such as immunocompromised patients [10].
Clinical studies on immunocompromised individuals show that most fungal infections in CD patients are caused by Candida (C.) albicans and C. tropicalis, identifying these fungi as the most common pathogenic yeasts worldwide [11,12]. C. albicans and C. tropicalis are normal components of human microbiota commonly present in the gastrointestinal system, epidermis and genital tract [13].
C. tropicalis is characterized by high resistance to antifungal treatments, such as amphotericin B and azoles derivatives [14], and has been identified as the second most common pathogenic yeast in IBD patients, after C. albicans. It is significantly more abundant in CD patients compared to their non-CD relatives [15].
Candida species exist in both yeast and hyphal forms based on the surrounding environment, and have been the most commonly reported fungal species causing infections in IBD patients, particularly in the gastrointestinal tract [16]. One of the most important C. albicans virulence factors is its capacity to form polymicrobial biofilms (PMB)s on the colonized surface of the host, thereby promoting associations with several types of bacteria [17]. The ability of C. albicans to form polymicrobial associations indicates that crosstalk between the mycobiome and microbiome may negatively affect the host. The underlying mechanism/s for this detrimental effect is attributed to yeasts ability to form filaments and secrete extracellular enzymes (aspartic proteinase and phospholipases) [18,19] leading to apoptosis, oxidative damage, and significantly increased production of proinflammatory cytokines, eventually inducing an abnormal host inflammatory response [20], resulting in the breakdown of the epithelial cell lining and leaky gut.
Within PMBs, associations between fungi and bacteria, bacteria and bacteria, and fungi and fungi may be either commensal, mutualistic or antagonistic [21]. Numerous microbes have evolved to exhibit specific attraction to neighboring species in order to survive environmental challenges [22], leading to immune system evasion, metabolic cooperation and more efficient host colonization [23,24].
Since Candida-induced dysbiosis has been shown to be detrimental in both CD patients and CD-mouse models [25], understanding the molecular mechanisms by which fungi interact with the other gut-residing microorganisms may enlighten approaches to rebalance and maintain the microbiome and consequently help patients to prevent flare ups of symptoms. In this context, to gain insight into the mechanism/s underlying the interactions between the two pathogenic Candida species when present in the same environment, we evaluated the influence of C. tropicalis on the pathogenicity of C. albicans. Employing a dextran sulfate sodium (DSS)- induced colitis model in C57BL/6 (B6) mice, we assessed the susceptibility and pathogenicity in mice inoculated with only C. albicans, only C. tropicalis or a combination of both Candida species.
We report herein that C. tropicalis established antagonistic interactions with C. albicans affecting its virulence profile, as the mice co-colonized with both Candida species were less susceptible to DSS-induced colitis compared to mice inoculated with C. albicans only. Mechanistically, we showed that C. tropicalis competes with C. albicans for the growth in the gut, decreasing the capacity of C. albicans to produce biofilm and consequently adhere to the host.
Finally, we demonstrated that the production of multiple short-chain fatty acids (SCFA)s and the expression of genes involved in immune response were altered when the combined Candida species interacted in the co-colonized mice compared to mice inoculated with only single Candida species.
2. Materials and Methods
Experimental Animals
B6 mouse colony was bred at Case Western Reserve University (Cleveland, OH). The age of the mice used in the experiments was between 15 and 17 weeks. An equal number of males and females was used for the experiments. Micro-isolator cages (Allentown Inc, Allentown, NJ) with 1/8-inch corn bedding were used to house the mice. Mice consumed laboratory rodent diet P3000 (Harlan Teklad, Indianapolis, IN) during the experiments. Mice were randomized using a numerical code, so the experiments could be performed in a blinded manner. The numerical code was only revealed at the end of the experiment.
Fecal pellets homogenization
50 grams of corn bedding (including fecal pellets) were collected from each experimental cage a week before Candida inoculation and blended together. The total collected pellet was then homogenized for 2 minutes. Then, 50 grams of the homogenized pellet was redistributed to the experimental cages. This method was adopted to limit the variability between cages caused by bacterial changes.
Colitis induction
Mice were exposed to 3% DSS (TdB Labs AB, Uppsala, Sweden) for 7 days in drinking water to induce acute colitis. The DSS solution in drinking water was renewed every 4 days. Mice were monitored daily to assess body weight and intestinal bleeding
Yeast Strains and Growth Conditions
The C. albicans strain SC5314 and the C. tropicalis strain MRL32707 were the infecting fungi. Cells were propagated for 24 hrs at 37°C in Sabouraud Dextrose Broth containing 50 mM glucose. Cells were centrifuged, and the supernatant was decanted and filter sterilized to be used for biofilm experiments. Cell pellets were washed with phosphate-buffered saline (PBS, pH 7.2), and standardized to 1 x 10⁷ cells/mL.
Biofilm Formation
12 mm silicone elastomer discs were cut from a sheet of silicone sheeting (Invotec International, Jacksonville, FL) and used as scaffold for handling biofilms. 4 mL of inoculum of either C. tropicalis or C. albicans standardized to 1 x 10⁷ cells/mL was applied to each disc and left to incubate for 90 min at 37°C (adhesion phase). Discs were then placed into new wells containing 4 mL of either 100% Sabouraud Dextrose Broth or 50% (v/v) Sabouraud Dextrose Broth/cell-free supernatant of the other organism. Discs were incubated for 24 hrs at 37°C (biofilm growth phase).
Quantitative Measurement of Biofilms
Quantification of yeast biofilms was performed as described previously [26]. Briefly, dry-weight analysis determined the total biofilm mass (comprising extracellular matrix and fungal cells). Mitochondrial dehydrogenase activity was utilized as an indicator of the metabolic state of the Candida cells and quantified using a colorimetric method which involves the reduction of 2,3-bis (2-methoxy-4-nitro-5-sulfophenyl)-5-[(phenylamino)carbonyl] 2H-tetrazoliumhydroxide (XTT) to a formazan compound whose absorbance is subsequently read utilizing a spectrophotometer. In order to determine the dry-weight, the biofilms were incubated into new wells containing 4 mL of PBS with 1 mM menadione and 1 mg/mL of XTT at 37°C for 16 hours. Next, the biofilms were scrapped from the discs and placed into a conical tube, centrifuged for 7 minutes at 3500 x g. Then, 1 mL of the supernatant from each conical tube was loaded into a cuvette and a spectrophotometer was utilized to record the absorbance at 520 nm. The remaining fungal pellets were filtered using a previously weighted strainer (0.45 µm pore size), dried up for 24 hrs at 35°C, and then weighed.
Yeasts challenge and determination of CFUs
Candida strains were first plated on Sabouraud Dextrose Agar (SDA) and incubated at 37° C for 2 days and then harvested through centrifugation. Then, a hemocytometer was used to prepare a challenge inoculum of 1×10⁹/ml for each strain. All experimental mice were then inoculated with 1×10⁸ Candida cells in 100 μL of normal saline through gavage technique for three consecutive days. This process was performed four days before the 3% DSS administration in drinking water.
Quantification of colony-forming units (CFUs/ml) was determined by plating on SDA. CFUs were calculated as log CFUs per g of stools. As control, an additional cohort of mice was challenged with nonpathogenic yeast Saccharomycopsis (S.) fibuligera.
Histology
Colons from yeast-challenged mice were removed and fixed in Bouin’s solution for 24 hours. Then, tissues were embedded in paraffin and subjected to hematoxylin and eosin staining. Inflammation was assessed by a pathologist using a scoring system previously described [27]. Scores varying from 0 (normal) to 3 (maximum severity) were utilized to assess four individual histologic parameters: (1) percent ulceration, (2) chronic inflammation (macrophages and lymphocytes in the mucosal and submucosal layers), (3) percent ulceration and (4) acute inflammation (neutrophils).
Colonoscopy
Colonoscopy was conducted using a flexible ureteroscope (Olympus America, Center Valley, PA). Colonoscopy images were acquired on an Olympus BX41 microscope. Mice were subjected to colonoscopy the day after the end of DSS administration. Colonic inflammation was assessed using a scoring system previously described [28]. Scores varying from 0 (normal) to 3 (maximum severity) were utilized to evaluate four individual colonoscopic parameters: (1) intestinal bleeding, (2) wall transparency, (3) perianal findings (including rectal prolapse and diarrhea ) and (4) focal lesions (including ulcers and polyps). Isoflurane (Butler Schein Animal Health, Dublin, OH) was utilized to anesthetize the mice prior to colonoscopy procedure.
Flow Cytometry
Mesenteric lymph nodes (MLN)s were crushed using a 40-μm nylon mesh. In order to determine cell viability, cell suspensions of MLNs were incubated with live/dead Fixable Blue Dead Cell Stain Kit and live/dead Fixable Violet (Thermo Scientific, Waltham, WA). FACS buffer was then used to wash the cells. Next, cells were first incubated with fluorescently conjugated antibodies at 4 °C for 20 mins and then fixed in the dark with fixation/permeabilization buffer (eBioscience, San Diego, CA) at 4°C for 30 min. In order to detect intracellular proteins, cells were then stained with a mix of fluorescently conjugated antibodies at RT for 30 min. The detection of lymphocytes expressing cytokines was then performed by using the following antibodies: IL-17A (TC11-18H10.1, Sony, Bothell, WA), IFNγ (XMG1.2, Biolegend, San Diego, CA), antibody mix containing antibodies raised against CD3 (145-2C11, BD Biosciences, Mississauga, Canada), IL-4 (11B11, Sony, Bothell, WA) and TNF (MP6-XT22, Biolegend, San Diego, CA). FACSAria sorter was used to perform flow-cytometric acquisition. Data were then analyzed with FlowJo_V10 software (Tree Star, Inc.). Gating strategy for lymphocytes: T lymphocytes were determined by gating on CD3+ live cells, followed by gating on singlets utilizing height vs. forward scatter area and dead-cell exclusion. Finally, specific gating was performed for subsets positive for IFN, IL-4, TNF and IL-17.
Gas Chromatography Mass Spectrometry Analysis
Gas Chromatography Mass Spectrometry (GC/MS) technique was performed to evaluate SCFAs extracted from mouse stools through a previously described method [29]. In brief, 50 mg of stools were collected from each mouse and placed into a 1.5 mL tube containing 3.2 mm beads and 300 μL of water. Stools were then homogenized with a homogenizer (MP Biomedicals, Solon, OH).
After centrifugation for 10 min at 14,000 x g, the supernatant was placed into a new 1.5 mL tube.
100 μL of 172mM Pentafluorobenzyl Bromide in acetone was then added to each tube. After incubation at 60°C for 30 min, 250 μL of water and 500 μL of n-hexane were added to each tube. Next, 1 μL of each sample was inserted in the GC/MS instrument (Agilent Technologies, Santa Clara, CA). Methane was utilized as ionization gas. Ions acquired were detected in the negative mode utilizing selected ion monitoring. Linear regression was then performed to determine the slope for each SCFA. Finally, the concentration of each SCFA was determined by using the area ratios acquired from each stool sample and the slopes previously obtained.
Immunohistochemistry
In order to perform the immunohistochemical (IHC) staining, tissue samples were embedded in paraffin and then sectioned (thickness: 3-4 μm). Next, sections were placed on Plus slides (Thermo Scientific, Logan, UT) and then deparaffinized. Then, sections were incubated in normal serum for blocking non-specific binding. 1.75% H2O2 was utilized to block samples for endogenous peroxidase activity. Slides were then incubated first with polyclonal rabbit anti-C. albicans primary antibody at 1:100 (PA17206; Thermo Fisher Scientific, Waltham, MA, USA) at 4°C and then with an appropriate biotinylated secondary antibody (Vector Laboratories, Newark, CA). Next, slides were assayed utilizing a Vectastain ABC Kit (Vector Laboratories), and immunoreactive cells were detected using a diaminobenzidine substrate (Vector Laboratories). Finally, slides were counterstained using hematoxylin and then were mounted utilizing an 80% glycerol mount. Negative controls were prepared following the same procedure in the absence of the anti-C. albicans primary antibody.
NanoString Gene Expression Analysis
Colon tissues were homogenized using 100 mg of 1.4-mm beads at 4,000 rpm. Next, total RNA was isolated with a RNeasy Mini Kit (Qiagen, Hilden, Germany). Gene expression was determined using a previously described protocol [7]. Briefly, RNA was incubated with a panel presenting 785 bar-coded probes (NanoString Technologies, Seattle, WA) targeting specific genes associated with 50 cellular pathways involved in immune responses. Samples, hybridization solution and probes were subjected to hybridization for 24 hours at 65°C. Next, samples were processed in the NanoString Prep Station. The target/probe compounds were placed in a cartridge for data collection. Differential expression was determined using the following criteria: P < 0.05 and fold change >1.25. Data analysis was obtained using the ROSALIND® online platform (https://rosalind.onramp.bio). Heatmaps and volcano plots showing clustering of genes differently expressed between the experimental groups were obtained utilizing the “Partitioning Around Medoids” algorithm combined with the “Flexible Procedures for Clustering” R library and multiple database sources including WikiPathways [30] and NCBI [31]
Statistical Analysis
Each experiment was conducted in duplicate. Collective data from replicated experiments were utilized to conduct multivariate and univariate analyses. Continuous data of the experimental groups were compared using the Student’s unpaired t test. Data were expressed as means ± SEM. An alpha level of 0.05 was regarded as statistically significant. All the statistical analyses were conducted using GraphPad Prism software (San Diego, CA).
All authors had access to the study data and have reviewed and approved the final manuscript.
3. RESULTS
3.1. C. tropicalis Inoculation Decreases Susceptibility to DSS-induced Colitis in C. albicans Challenged-B6 Mice
Our initial hypothesis was that oral inoculation of C. tropicalis would modify the susceptibility to chemically (DSS) induced colitis in C. albicans-challenged mice. In order to test this hypothesis, we evaluated the severity of colitis induced by DSS administration in B6 mice pre-inoculated with C. albicans alone, C. tropicalis alone or a combination of C. albicans and C. tropicalis. Histological analysis of the colons showed a significant decrease in the severity of colitis in the co-inoculated mice (with both Candida species) compared to mono-inoculated mice (only C. albicans challenge) (P<0.05), as demonstrated by decreased cell infiltration and mucosal damage in the co-inoculated group (Figure 1A,B). Interestingly, mice inoculated with only C. tropicalis did not exhibit significantly increased colitis compared to the co-inoculated group (P=ns). Furthermore, the histological results were confirmed by the endoscopic analysis, showing that co-inoculated mice have significantly lower percentage of intestinal ulcers and erosions and decreased thickness of the intestinal mucosa compared to C. albicans-inoculated mice (P<0.05) (Figure 1C,D). A fourth group of mice was challenged with the nonpathogenic fungus (S.) fibuligera and used as a negative control to confirm whether the higher susceptibility to chemically-induced colitis was specifically caused by Candida species. Colonoscopy and histology results confirmed that S. fibuligera-inoculated mice showed a significant decrease in susceptibility to DSS-induced colitis compared to C. albicans- and C. tropicalis-challenged mice (P<0.05).
3.2. C. tropicalis alters the lymphocytic immunophenotype in C. albicans-challenged mice during DSS-induced colitis
Next, to determine if there was an immunological cause for the previously mentioned anti-inflammatory effect of C. tropicalis inoculation in C. albicans-challenged mice, we characterized the lymphocytic immunophenotype in the MLNs of Candida co-inoculated vs. mono-inoculated mice at the end of DSS treatment. Among the cytokines measured, we found a significant increase in the protein levels of interleukin (IL)-4, IL-17 and tumor necrosis factor (TNF) (P<0.05) in Candida co-challenged mice compared to mice inoculated with C. albicans or C. tropicalis alone (Figure 2A–C). Moreover, we found an increased production of interferon gamma (IFN)-γ in the Candida co-challenged group compared to C. tropicalis-inoculated mice (P<0.05), and the same trend was detected in relation to the single C. albicans-inoculated group, albeit this difference did not reach statistical significance (Figure 2D). These results collectively suggest that C. tropicalis inoculation renders C. albicans-challenged mice less susceptible to chemically induced colitis due to immune alterations associated with Th1, Th2 and Th17 lymphocytic responses.
3.3. C. tropicalis and C. albicans Co-Colonization Alters Production of SCFAs by Gut Microbiome
Next, to clarify the mechanism/s by which C. tropicalis and C. albicans co-inoculation effectively decreased acute colitis in the challenged mice compared to the mono-inoculated mice, we analyzed the metabolic basis for the anti-inflammatory effect of the Candida co-inoculation. We quantified SCFAs in the stools collected from the four experimental groups post-treatment. Our results showed a significant decrease of propionic acid (P<0.05) (Figure 3A) and valeric acid (P<0.02) (Figure 3B) in the fecal samples of Candida co-inoculated mice compared to the mice inoculated with C. albicans and C. tropicalis alone. Furthermore, heptanoic acid was significantly decreased in the co-challenged group compared to C. tropicalis-inoculated mice (P<0.02), but not compared to the C. albicans-inoculated group (P=ns) (Figure 3C). Additionally, there were no significant differences between groups in relation to butyric acid and hexanoic acid (Figure 3D,E). Overall, these data indicate that the microbiome alteration caused by C. tropicalis inoculation in C. albicans-challenged mice led to significant bacterial changes affecting SCFAs production in comparison with mice inoculated with C. albicans only.
3.4. C. tropicalis Negatively Affects the Virulence of C. albicans by Impairing Its Ability to Produce Biofilm and Adhere to the Surface of the Host
Next, to determine if C. tropicalis negatively affects the virulence of C. albicans and its capacity to increase susceptibility to DSS-induced colitis by impairing its ability to adhere and grow on the epithelial surface of the host, we assessed the ability of the two Candida species to produce biofilm in the co-inoculated vs. mono-inoculated groups. First, we measured the CFUs collected from fecal samples of the experimental groups inoculated with C. albicans alone, C. tropicalis alone or a combination of both fungi. Our results show that C. albicans CFUs (green) dramatically decrease in the group co-inoculated with both Candida species, compared to C. albicans CFUs in the group colonized by C. albicans only (P<0.0001) and the C. tropicalis CFUs (purple) in the co-inoculated group (P<0.02) (Figure 4A,B). Interestingly, we detected a trend related to increased C. tropicalis CFUs in the co-inoculated group compared to the C. tropicalis CFUs cultured from the experimental group infected with C. tropicalis alone. To further assess if the major cause of decreased C. albicans virulence was due to impaired adherence, we performed an IHC analysis to detect the presence and the location of C. albicans in the epithelium of mice mono-inoculated with C. albicans compared to co-inoculated mice. Our results unequivocally showed that C. albicans was less present in the co-inoculated group compared to the mice inoculated with C. albicans only. Moreover, C. albicans was able to penetrate deeper in the mucosal layer when present as the sole yeast, compared to the co-inoculated group (Figure 4C). Colons from the group inoculated with C. tropicalis alone stained with C. albicans antibody showed no clearly positive stain, demonstrating the specificity of the utilized primary antibody for C. albicans species. Finally, we examined the capacity of C. tropicalis-produced metabolites to decrease the biofilm production of C. albicans in vitro using a colorimetric XTT assay. The results show that the medium collected from C. tropicalis cultures were effective in reducing the ability of C. albicans to produce biofilm (P<0.05) (Figure 4D). Interestingly, the supernatant collected from the C. albicans culture failed to decrease the biofilm production activity when added to the C. tropicalis strain (P=ns). These data clearly indicate that C. tropicalis competes with C. albicans for growth in the same host, limiting the capacity of C. albicans to adhere to the host intestinal surface, affecting the microbiome differently and consequently decreasing the susceptibility to DSS-induced colitis in challenged mice.
3.5. C. tropicalis Altered the Expression of Genes Involved in Multiple Immune Responses in C. albicans-Challenged Mice
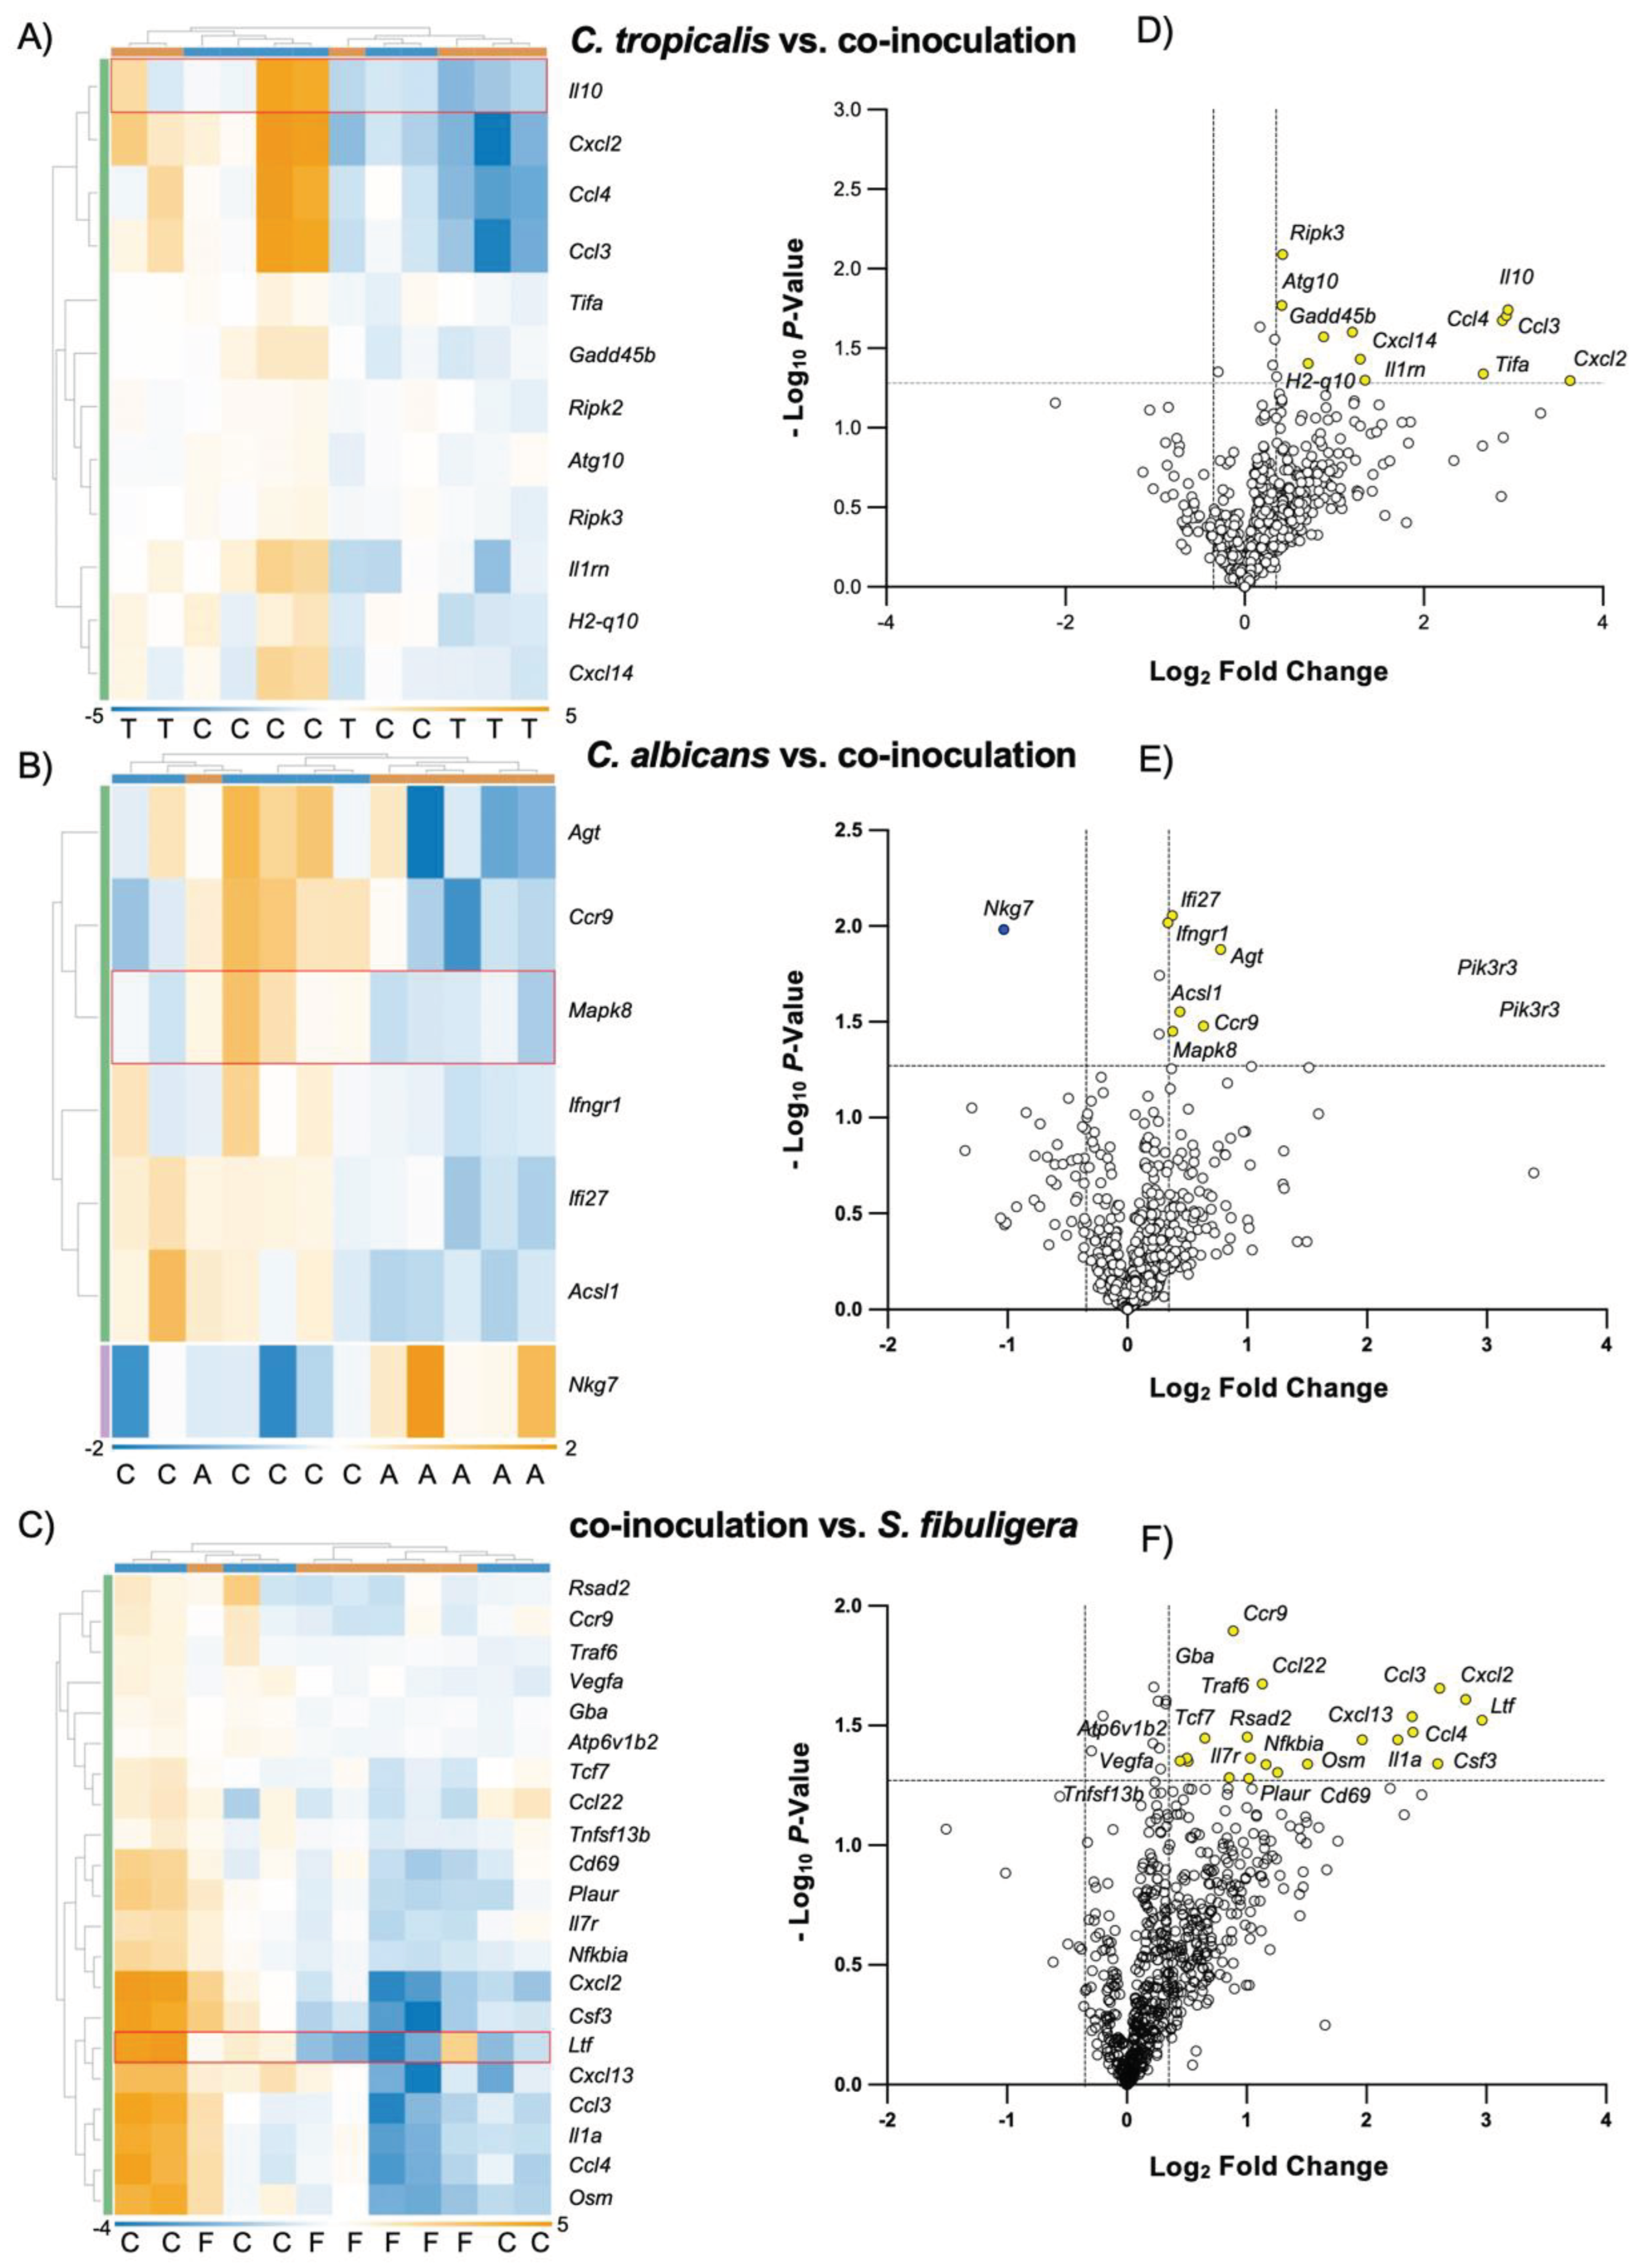
In order to analyze potential mechanism/s associated with a decreased level of colitis and possible immunologic alterations in mice inoculated with combined Candida species, we used a NanoString “Host Response” Panel targeting 785 genes involved in innate and adaptive immune response, interferon response and host susceptibility (NanoString Technologies, Seattle, WA). The acquired data are showed in the heatmap graphs (Figure 5A–C), which highlight the clusters of significantly altered genes in mice co-inoculated with both fungi in comparison with the other 3 experimental groups. Specifically, in co-inoculated mice, 12 genes were significantly up-regulated compared to mice inoculated with C. tropicalis alone, and the altered imputed pathways included IL-6 and IL-12 signaling, complement cascade, neutrophil degranulation and MHC class II antigen presentation, including Il10, Cxcl2, Ripk2, Ripk3 and Il1rn (P<0.05) (Figure 5D); moreover, co-inoculated mice had 6 up-regulated genes and one down-regulated gene compared to mice inoculated with C. albicans alone. The involved altered pathways included complement cascade, interferon signaling and response to TGF-β family members, including Acsl1, Ifngr, Mapk8, Ifi27 and Nkg7. (P<0.05) (Figure 5E). Finally, 21 genes were up-regulated in co-inoculated mice compared to the control group, and functional sorting of the altered genes showed that the majority belonged to families of genes involved in neutrophil migration, TNF-α effects on cytokine activity, chemokine signaling pathways, IL-1 regulation of extracellular matrix, MHC class II antigen presentation, production of antimicrobial peptides and macrophage activation, including specific genes such as; Tnfsf13b, Il1a, Ccl3, Il7r and Cxcl13 (P<0.05) (Figure 5F).
These results strongly indicate that C. tropicalis and C. albicans interactively compete in the same host niche leading to changes in the expression of genes involved in several immune response pathways, eventually resulting in decreased susceptibility to colitis in the combined condition.
4. Discussion
We report that inoculation with C. tropicalis is associated with decreased severity of DSS-induced colitis in B6 mice challenged with C. albicans. Decreased pathogenicity is indicated by decreased histological and colonoscopic scores, and result in a better physiological outcome. This result is likely to be mediated by close interactions between yeasts and beneficial bacteria which take place during chemically induced colitis, as indicated by changes in the production of certain bacterial SCFAs. These SCFAs, such as propionic and valeric acid, were found to be consistently decreased in stool samples of co-inoculated mice compared to Candida mono-inoculated mice.
Propionic acid is a metabolite produced by specific bacterial species, such as Escherichia (E.) coli, following fermentation of dietary fibers. Previous in vitro studies demonstrated a positive correlation between elevated levels of propionic acid and higher levels of virulence of E. coli (specifically its ability to penetrate and colonize phagocytes) isolated from CD patients [32]. In addition, the observed levels of valeric acid were significantly lower in the stools of co-inoculated mice compared to mice challenged with C. albicans only, suggesting a correlation between the dysbiosis obtained with C. albicans mono-inoculation and the growth of specific bacteria producing valeric acid. Valeric acid has previously been shown to increase the inflammatory response mediated by IL-17 signaling pathway in a recent study [33].
In the present work, we also defined the immunological aspects of the decreased colitis that occurred in the experimental group inoculated with C. albicans and C. tropicalis combined. First, we detected upregulation of Th-2 immunity in co-inoculated mice with significantly increased IL-4 production compared to the mice challenged with C. albicans alone. Our data agree with those of Mencacci et al. [34], who found that endogenous IL-4 is essential for stimulating CD4+ defensive responses against C. albicans through the activation of the adaptive and innate immune systems. Furthermore, levels of IL-4 measured in the co-inoculated group were similar to those of the control group. Interestingly, these data are consistent with our previous study [35], showing significantly decreased IL-4 expression in mice inoculated with a single Candida species compared to the control group. Second, we also detected significant downregulation of Th-17 immunity in mice challenged with C. albicans compared to the control group. These data are expected, given the well-known protective role of Th-17 cells in antifungal immune responses, where several genetic anomalies involving IL-17 signaling cascade have been proven to increase susceptibility to mucocutaneous candidiasis in multiple mouse models and human subjects [36,37]. Conversely, the level of IL-17 produced in the co-inoculated mice was significantly higher compared to mice inoculated with C. albicans only. This can be explained by the interesting theory that C. tropicalis and C. albicans, rather than having a mutualistic interaction, compete for adherence and growth in the same host niche, affecting the microbiome and the immune response differently compared to when they are present as the sole fungal source. This theory is supported by the observation that several microorganisms present in the gut have different effects based on their interaction with other microbial species. For example, published data have shown that C. albicans has a protective effect in DSS-treated germ-free mice, as well as antibiotic-treated specific-pathogen-free mice, two models used to study the effect of Candida species in the context of a depleted/absent gut microbial community [38]. By contrast, another study published by Jawhara et al. [39] has shown, in accordance with our results, that the decrease of C. albicans caused by Saccharomyces boulardii inoculation was positively correlated with decreased susceptibility to DSS-induced colitis. Our data indicate that the specific bacterial populations responsible for the increased susceptibility to chemically induced colitis are those microbes also affected by C. albicans inoculation, thus explaining the divergence in outcome between our own studies with those published previously. In support of our theory, CFU analyses show that the quantitative recovery of C. albicans from the fecal samples of the experimental group inoculated with both yeasts was significantly inferior compared to the colonies obtained from fecal material of mice inoculated with C. albicans alone. This observation strongly suggests that C. tropicalis was able to reduce the growth and the adherence capacity of C. albicans. To corroborate our hypothesis, the in vitro XTT assay highlighted a marked decrease of C. albicans biofilm production in C. albicans cultured in the presence of C. tropicalis supernatant, demonstrating that certain metabolites produced by C. tropicalis impair the adherence ability of C. albicans. Our data are in agreement with those of Santos et al. [40] who demonstrated that C. tropicalis was capable of limiting C. albicans metabolic activity and its capacity to form colonies in mixed biofilms. In contrast, quantification of C. tropicalis CFUs in the co-inoculated mice was similar to the level of CFUs quantified in the group inoculated with C. tropicalis alone, and in accordance with these data, the XTT assay showed that C. tropicalis biofilm production was not altered in C. tropicalis cultured with C. albicans supernatant. Our hypothesis was further supported by IHC staining specific for C. albicans, showing that this yeast was not only more abundant, but it was also able to penetrate deeper in the epithelium and into the lamina propria of mice mono-inoculated with C. albicans compared to the co-inoculated group, where C. albicans was mainly located on the epithelial surface.
Lastly, NanoString analysis showed that C. tropicalis inoculation not only drastically limited the virulence and the growth of C. albicans, but it also critically affected the expression of 7 genes implicated in interferon signaling, complement cascade and response to TGF- β family members in C. albicans-challenged mice, via genes such as Ccr9, Nkg7, Acsl1, Ifngr1, Mapk8, Agt and Ifi27. These results are corroborated by multiple studies indicating how various polymicrobial interactions [41] and adaptive and innate immune response [42] can ameliorate or worsen IBD symptoms. In particular, our data are in agreement with a study by Wurbel et al. [43] which highlighted a strong correlation between Ccr9 expression and amelioration of DSS-induced colitis symptoms. Specifically, their results showed that CCR9 knockout mice were more susceptive to DSS-induced colitis compared to wild type controls, and that a dysregulated Th-17 immune response involving different macrophage subsets was observed during their recovery period following DSS treatment.
Conversely, a previous study by Heimerl et al. [44] indicated that, in contrast to our data, the expression of the long chain acyl-CoA synthetase (ACSL) 1 protein was significantly upregulated in inflamed colon biopsies of IBD patients compared to biopsies collected from non-affected regions. This difference may be due to dissimilarities between human vs. mouse models, consequently reflecting diverse physiological functions.
5. Conclusions
In conclusion, these data strongly indicate an antagonistic microbial interaction between the two Candida species C. albicans and C. tropicalis, where C. tropicalis may produce molecules capable of limiting the capacity of C. albicans to adhere to the host intestinal surface, form polymicrobial associations and consequently negatively affect virulence factors, thus making the combined inoculation less harmful in DSS-treated mice. The fungal competitive interaction highlighted in this study may explain the reason why the incidence of invasive candidiasis in immunocompromised patients characterized by the detection of multiple Candida species is less than 10% compared to the incidence of candidiasis characterized by the detection of a single yeast [45].
This is the first study attempting to clarify the interactions between C. tropicalis and C. albicans in the context of chemically induced (DSS) colitis. However, the exact molecular mechanisms involved in the interactions between these two fungal species need to be further investigated in order to unequivocally identify the metabolic pathways associated with the described antagonistic effect and to discover novel molecules that can alter the pathogenicity of C. albicans.
Author Contributions
Kyle Roberts: Writing – Original Draft Preparation, Formal Analysis Abdullah Osme: Methodology, Formal Analysis Carlo De Salvo: Methodology, Formal Analysis Eleonora Zoli: Methodology, Formal Analysis Janet Herrada: Methodology, Formal Analysis Thomas McCormick: Writing – Review & Editing Mahmoud Ghannoum: Writing – Review & Editing Fabio Cominelli: Supervision, Funding Acquisition, Writing – Review & Editing Luca Di Martino: Conceptualization, Funding Acquisition, Writing – Review & Editing.
Funding
This research was funded by National Institutes of Health grants DK042191, DK055812, DK091222 and DK097948 to Fabio Cominelli, DK125526 to Luca Di Martino and AI145289 to Mahmoud Ghannoum.
Institutional Review Board Statement
All experiments were approved by the Institutional Animal Care and Use Committee at Case Western Reserve University (Protocol 2014-0158, Date: 05/17/2023) and conducted following the Association for Assessment and Accreditation of Laboratory Animal Care guidelines.
Data Availability Statement
The data that support the findings of this study are available from the corresponding author, LDM, upon reasonable request. Data will be stored for a long-term period (minimum 5 years) in the Box storage service (hosted in the cloud) that enables Case Western Reserve University to store, access and share files securely. Box is the only approved platform for storing restricted data in the cloud at Case Western Reserve University.
Acknowledgments
The authors thank Natalia Aladyshkina and Ashtyn Balasko for their technical support. Finally, authors acknowledge the services of the Histology/Imaging and Mouse Models Cores of the Cleveland Digestive Diseases Research Core Center.
Conflicts of Interest
Nothing to disclose.
References
- Weisman, M.H.; Oleg, S.; Seok Kim, H.; Hou, J.K.; Miller, F.W.; Dillon, C.F. Inflammatory Bowel Disease Prevalence: Surveillance data from the U.S. National Health and Nutrition Examination Survey. Prev Med Rep 2023, 33, 102173. [Google Scholar] [CrossRef]
- Spinelli, A.; Yanai, H.; Girardi, P.; Milicevic, S.; Carvello, M.; Maroli, A.; Avedano, L. The Impact of Crohn's Perianal Fistula on Quality of Life: Results of an International Patient Survey. Crohns Colitis 360 2023, 5, otad036. [Google Scholar] [CrossRef]
- D'Amico, F.; Tasopoulou, O.; Fiorino, G.; Zilli, A.; Furfaro, F.; Allocca, M.; Sileri, P.; Spinelli, A.; Peyrin-Biroulet, L.; Danese, S. Early Biological Therapy in Operated Crohn's Disease Patients Is Associated With a Lower Rate of Endoscopic Recurrence and Improved Long-term Outcomes: A Single-center Experience. Inflamm Bowel Dis 2023, 29, 539–547. [Google Scholar] [CrossRef] [PubMed]
- Farraj, K.L.; Pellegrini, J.R.; Munshi, R.F.; Russe-Russe, J.; Kaliounji, A.; Tiwana, M.S.; Srivastava, P.; Subramani, K. Chronic steroid use: An overlooked impact on patients with inflammatory bowel disease. JGH Open 2022, 6, 910–914. [Google Scholar] [CrossRef] [PubMed]
- Petagna, L.; Antonelli, A.; Ganini, C.; Bellato, V.; Campanelli, M.; Divizia, A.; Efrati, C.; Franceschilli, M.; Guida, A.M.; Ingallinella, S.; et al. Pathophysiology of Crohn's disease inflammation and recurrence. Biol Direct 2020, 15, 23. [Google Scholar] [CrossRef] [PubMed]
- Chen, Y.; Wang, Y.; Shen, J. Role of environmental factors in the pathogenesis of Crohn's disease: a critical review. Int J Colorectal Dis 2019, 34, 2023–2034. [Google Scholar] [CrossRef] [PubMed]
- Di Martino, L.; Osme, A.; Ghannoum, M.; Cominelli, F. A Novel Probiotic Combination Ameliorates Crohn's Disease-Like Ileitis by Increasing Short-Chain Fatty Acid Production and Modulating Essential Adaptive Immune Pathways. Inflamm Bowel Dis 2023. [Google Scholar] [CrossRef]
- Zhang, M.; Sun, K.; Wu, Y.; Yang, Y.; Tso, P.; Wu, Z. Interactions between Intestinal Microbiota and Host Immune Response in Inflammatory Bowel Disease. Front Immunol 2017, 8, 942. [Google Scholar] [CrossRef]
- Hsu, C.; Ghannoum, M.; Cominelli, F.; Martino, L.D. Mycobiome and Inflammatory Bowel Disease: Role in Disease Pathogenesis, Current Approaches and Novel Nutritional-based Therapies. Inflamm Bowel Dis 2022. [Google Scholar] [CrossRef]
- Mushtaq, K.; Khan, Z.; Aziz, M.; Alyousif, Z.A.; Siddiqui, N.; Khan, M.A.; Nawras, A. Trends and outcomes of fungal infections in hospitalized patients of inflammatory bowel disease: a nationwide analysis. Transl Gastroenterol Hepatol 2020, 5, 35. [Google Scholar] [CrossRef]
- Macias-Paz, I.U.; Perez-Hernandez, S.; Tavera-Tapia, A.; Luna-Arias, J.P.; Guerra-Cardenas, J.E.; Reyna-Beltran, E. Candida albicans the main opportunistic pathogenic fungus in humans. Rev Argent Microbiol 2023, 55, 189–198. [Google Scholar] [CrossRef] [PubMed]
- Dos Santos, M.M.; Ishida, K. We need to talk about Candida tropicalis: Virulence factors and survival mechanisms. Med Mycol 2023, 61. [Google Scholar] [CrossRef] [PubMed]
- Lopes, J.P.; Lionakis, M.S. Pathogenesis and virulence of Candida albicans. Virulence 2022, 13, 89–121. [Google Scholar] [CrossRef] [PubMed]
- Wang, D.; An, N.; Yang, Y.; Yang, X.; Fan, Y.; Feng, J. Candida tropicalis distribution and drug resistance is correlated with ERG11 and UPC2 expression. Antimicrob Resist Infect Control 2021, 10, 54. [Google Scholar] [CrossRef] [PubMed]
- Hoarau, G.; Mukherjee, P.K.; Gower-Rousseau, C.; Hager, C.; Chandra, J.; Retuerto, M.A.; Neut, C.; Vermeire, S.; Clemente, J.; Colombel, J.F.; et al. Bacteriome and Mycobiome Interactions Underscore Microbial Dysbiosis in Familial Crohn's Disease. mBio 2016, 7. [Google Scholar] [CrossRef] [PubMed]
- Li, X.V.; Leonardi, I.; Putzel, G.G.; Semon, A.; Fiers, W.D.; Kusakabe, T.; Lin, W.Y.; Gao, I.H.; Doron, I.; Gutierrez-Guerrero, A.; et al. Immune regulation by fungal strain diversity in inflammatory bowel disease. Nature 2022, 603, 672–678. [Google Scholar] [CrossRef] [PubMed]
- Chandra, J.; Kuhn, D.M.; Mukherjee, P.K.; Hoyer, L.L.; McCormick, T.; Ghannoum, M.A. Biofilm formation by the fungal pathogen Candida albicans: development, architecture, and drug resistance. J Bacteriol 2001, 183, 5385–5394. [Google Scholar] [CrossRef] [PubMed]
- Ghannoum, M.A. Potential role of phospholipases in virulence and fungal pathogenesis. Clin Microbiol Rev 2000, 13, 122–143. [Google Scholar] [CrossRef]
- Ghannoum, M.A.; Abu-Elteen, K.H. Pathogenicity determinants of Candida. Mycoses 1990, 33, 265–282. [Google Scholar] [CrossRef]
- Tsui, C.; Kong, E.F.; Jabra-Rizk, M.A. Pathogenesis of Candida albicans biofilm. Pathog Dis 2016, 74, ftw018. [Google Scholar] [CrossRef]
- Deveau, A.; Bonito, G.; Uehling, J.; Paoletti, M.; Becker, M.; Bindschedler, S.; Hacquard, S.; Herve, V.; Labbe, J.; Lastovetsky, O.A.; et al. Bacterial-fungal interactions: ecology, mechanisms and challenges. FEMS Microbiol Rev 2018, 42, 335–352. [Google Scholar] [CrossRef] [PubMed]
- Willems, H.M.; Xu, Z.; Peters, B.M. Polymicrobial Biofilm Studies: From Basic Science to Biofilm Control. Curr Oral Health Rep 2016, 3, 36–44. [Google Scholar] [CrossRef] [PubMed]
- Dixon, E.F.; Hall, R.A. Noisy neighbourhoods: quorum sensing in fungal-polymicrobial infections. Cell Microbiol 2015, 17, 1431–1441. [Google Scholar] [CrossRef] [PubMed]
- Itabangi, H.; Sephton-Clark, P.C.S.; Tamayo, D.P.; Zhou, X.; Starling, G.P.; Mahamoud, Z.; Insua, I.; Probert, M.; Correia, J.; Moynihan, P.J.; et al. A bacterial endosymbiont of the fungus Rhizopus microsporus drives phagocyte evasion and opportunistic virulence. Curr Biol 2022, 32, 1115–1130 e1116. [Google Scholar] [CrossRef] [PubMed]
- Panpetch, W.; Hiengrach, P.; Nilgate, S.; Tumwasorn, S.; Somboonna, N.; Wilantho, A.; Chatthanathon, P.; Prueksapanich, P.; Leelahavanichkul, A. Additional Candida albicans administration enhances the severity of dextran sulfate solution induced colitis mouse model through leaky gut-enhanced systemic inflammation and gut-dysbiosis but attenuated by Lactobacillus rhamnosus L34. Gut Microbes 2020, 11, 465–480. [Google Scholar] [CrossRef]
- Chandra, J.; Mukherjee, P.K.; Leidich, S.D.; Faddoul, F.F.; Hoyer, L.L.; Douglas, L.J.; Ghannoum, M.A. Antifungal resistance of candidal biofilms formed on denture acrylic in vitro. J Dent Res 2001, 80, 903–908. [Google Scholar] [CrossRef]
- Corridoni, D.; Kodani, T.; Rodriguez-Palacios, A.; Pizarro, T.T.; Xin, W.; Nickerson, K.P.; McDonald, C.; Ley, K.F.; Abbott, D.W.; Cominelli, F. Dysregulated NOD2 predisposes SAMP1/YitFc mice to chronic intestinal inflammation. Proc Natl Acad Sci U S A 2013, 110, 16999–17004. [Google Scholar] [CrossRef]
- Kodani, T.; Rodriguez-Palacios, A.; Corridoni, D.; Lopetuso, L.; Di Martino, L.; Marks, B.; Pizarro, J.; Pizarro, T.; Chak, A.; Cominelli, F. Flexible colonoscopy in mice to evaluate the severity of colitis and colorectal tumors using a validated endoscopic scoring system. J Vis Exp 2013, e50843. [Google Scholar] [CrossRef]
- Hoving, L.R.; Heijink, M.; van Harmelen, V.; van Dijk, K.W.; Giera, M. GC-MS Analysis of Short-Chain Fatty Acids in Feces, Cecum Content, and Blood Samples. Methods Mol Biol 2018, 1730, 247–256. [Google Scholar] [CrossRef]
- Slenter, D.N.; Kutmon, M.; Hanspers, K.; Riutta, A.; Windsor, J.; Nunes, N.; Melius, J.; Cirillo, E.; Coort, S.L.; Digles, D.; et al. WikiPathways: a multifaceted pathway database bridging metabolomics to other omics research. Nucleic Acids Res 2018, 46, D661–D667. [Google Scholar] [CrossRef] [PubMed]
- Geer, L.Y.; Marchler-Bauer, A.; Geer, R.C.; Han, L.; He, J.; He, S.; Liu, C.; Shi, W.; Bryant, S.H. The NCBI BioSystems database. Nucleic Acids Res 2010, 38, D492–496. [Google Scholar] [CrossRef] [PubMed]
- Pobeguts, O.V.; Ladygina, V.G.; Evsyutina, D.V.; Eremeev, A.V.; Zubov, A.I.; Matyushkina, D.S.; Scherbakov, P.L.; Rakitina, D.V.; Fisunov, G.Y. Propionate Induces Virulent Properties of Crohn's Disease-Associated Escherichia coli. Front Microbiol 2020, 11, 1460. [Google Scholar] [CrossRef]
- Zeng, X.; Li, J.; Shan, W.; Lai, Z.; Zuo, Z. Gut microbiota of old mice worsens neurological outcome after brain ischemia via increased valeric acid and IL-17 in the blood. Microbiome 2023, 11, 204. [Google Scholar] [CrossRef] [PubMed]
- Mencacci, A.; Del Sero, G.; Cenci, E.; d'Ostiani, C.F.; Bacci, A.; Montagnoli, C.; Kopf, M.; Romani, L. Endogenous interleukin 4 is required for development of protective CD4+ T helper type 1 cell responses to Candida albicans. J Exp Med 1998, 187, 307–317. [Google Scholar] [CrossRef] [PubMed]
- Di Martino, L.; De Salvo, C.; Buela, K.A.; Hager, C.; Ghannoum, M.; Osme, A.; Butto, L.; Bamias, G.; Pizarro, T.T.; Cominelli, F. Candida tropicalis Infection Modulates the Gut Microbiome and Confers Enhanced Susceptibility to Colitis in Mice. Cell Mol Gastroenterol Hepatol 2022, 13, 901–923. [Google Scholar] [CrossRef] [PubMed]
- Okada, S.; Puel, A.; Casanova, J.L.; Kobayashi, M. Chronic mucocutaneous candidiasis disease associated with inborn errors of IL-17 immunity. Clin Transl Immunology 2016, 5, e114. [Google Scholar] [CrossRef]
- Ifrim, D.C.; Bain, J.M.; Reid, D.M.; Oosting, M.; Verschueren, I.; Gow, N.A.; van Krieken, J.H.; Brown, G.D.; Kullberg, B.J.; Joosten, L.A.; et al. Role of Dectin-2 for host defense against systemic infection with Candida glabrata. Infect Immun 2014, 82, 1064–1073. [Google Scholar] [CrossRef]
- Jiang, T.T.; Shao, T.Y.; Ang, W.X.G.; Kinder, J.M.; Turner, L.H.; Pham, G.; Whitt, J.; Alenghat, T.; Way, S.S. Commensal Fungi Recapitulate the Protective Benefits of Intestinal Bacteria. Cell Host Microbe 2017, 22, 809–816. [Google Scholar] [CrossRef]
- Jawhara, S.; Poulain, D. Saccharomyces boulardii decreases inflammation and intestinal colonization by Candida albicans in a mouse model of chemically-induced colitis. Med Mycol 2007, 45, 691–700. [Google Scholar] [CrossRef]
- Santos, J.D.; Piva, E.; Vilela, S.F.; Jorge, A.O.; Junqueira, J.C. Mixed biofilms formed by C. albicans and non-albicans species: a study of microbial interactions. Braz Oral Res 2016, 30. [Google Scholar] [CrossRef]
- Nishino, K.; Nishida, A.; Inoue, R.; Kawada, Y.; Ohno, M.; Sakai, S.; Inatomi, O.; Bamba, S.; Sugimoto, M.; Kawahara, M.; et al. Analysis of endoscopic brush samples identified mucosa-associated dysbiosis in inflammatory bowel disease. J Gastroenterol 2018, 53, 95–106. [Google Scholar] [CrossRef] [PubMed]
- Huang, Y.; Chen, Z. Inflammatory bowel disease related innate immunity and adaptive immunity. Am J Transl Res 2016, 8, 2490–2497. [Google Scholar] [PubMed]
- Wurbel, M.A.; McIntire, M.G.; Dwyer, P.; Fiebiger, E. CCL25/CCR9 interactions regulate large intestinal inflammation in a murine model of acute colitis. PLoS One 2011, 6, e16442. [Google Scholar] [CrossRef] [PubMed]
- Heimerl, S.; Moehle, C.; Zahn, A.; Boettcher, A.; Stremmel, W.; Langmann, T.; Schmitz, G. Alterations in intestinal fatty acid metabolism in inflammatory bowel disease. Biochim Biophys Acta 2006, 1762, 341–350. [Google Scholar] [CrossRef]
- Montes, K.; Ortiz, B.; Galindo, C.; Figueroa, I.; Braham, S.; Fontecha, G. Identification of Candida Species from Clinical Samples in a Honduran Tertiary Hospital. Pathogens 2019, 8. [Google Scholar] [CrossRef]
Figure 1.
Candida (C.) tropicalis inoculation decreases susceptibility to chemical-induced colitis in C. albicans challenged- C57BL/6 mice. (A) Histological analysis shows decreased colonic inflammation in co-inoculated mice compared to mice challenged with C. albicans alone (unpaired t test, 13.75 ± 0.69 vs. 17.50 ± 1.36; P<0.05; N = 12/group), and increased colonic inflammation in C. albicans-challenged mice and C. tropicalis-challenged mice compared to the control group (unpaired t test, 17.50 ± 1.36 vs. 12.62 ± 0.93; P<0.02) (unpaired t test, 15.50 ± 0.95 vs. 12.62 ± 0.93; P<0.05). No statistical differences were found between co-inoculated mice and the control group (unpaired t test, 13.75 ± 0.69 vs. 12.62 ± 0.93; P = ns) and between co-inoculated mice and the C. tropicalis-inoculated group (unpaired t test, 13.75 ± 0.69 vs. 15.50 ± 0.95; P = ns). (B) Representative colonic histopathological sections of C. albicans- and C. tropicalis-inoculated mice show the presence of ulcers, active cryptitis, increased inflammatory cells in the lamina propria, and thicker intestinal mucosa compared to co-inoculated mice and the control group, showing minimal inflammatory cells and mild active cryptitis. (C) Colonoscopic evaluation shows increased colitis in the distal colon of mice challenged with C. albicans alone compared to co-inoculated mice (unpaired t test, 6.86 ± 0.22 vs. 6.27 ± 0.18; P < 0.05) and the control group (unpaired t test, 6.86 ± 0.22 vs. 5.87 ± 0.24; P < 0.02). No statistical differences were found between co-inoculated mice and the control group (unpaired t test, 6.27 ± 0.18 vs. 5.86 ± 0.24; P = ns) and between co-inoculated mice and the C. tropicalis-inoculated group (unpaired t test, 6.27 ± 0.18 vs. 6.67 ± 0.19; P = ns). (D) Narrow Band Imaging endoscopic pictures of the distal colon show higher presence of ulcers (red arrows) and colorectal bleeding (yellow arrows) in C. albicans-inoculated and C. tropicalis-inoculated mice compared to co-inoculated mice and the control group. Data are expressed as mean ± SEM, and are representative of 2 separate experiments; * P < 0.05, ** P < 0.02.
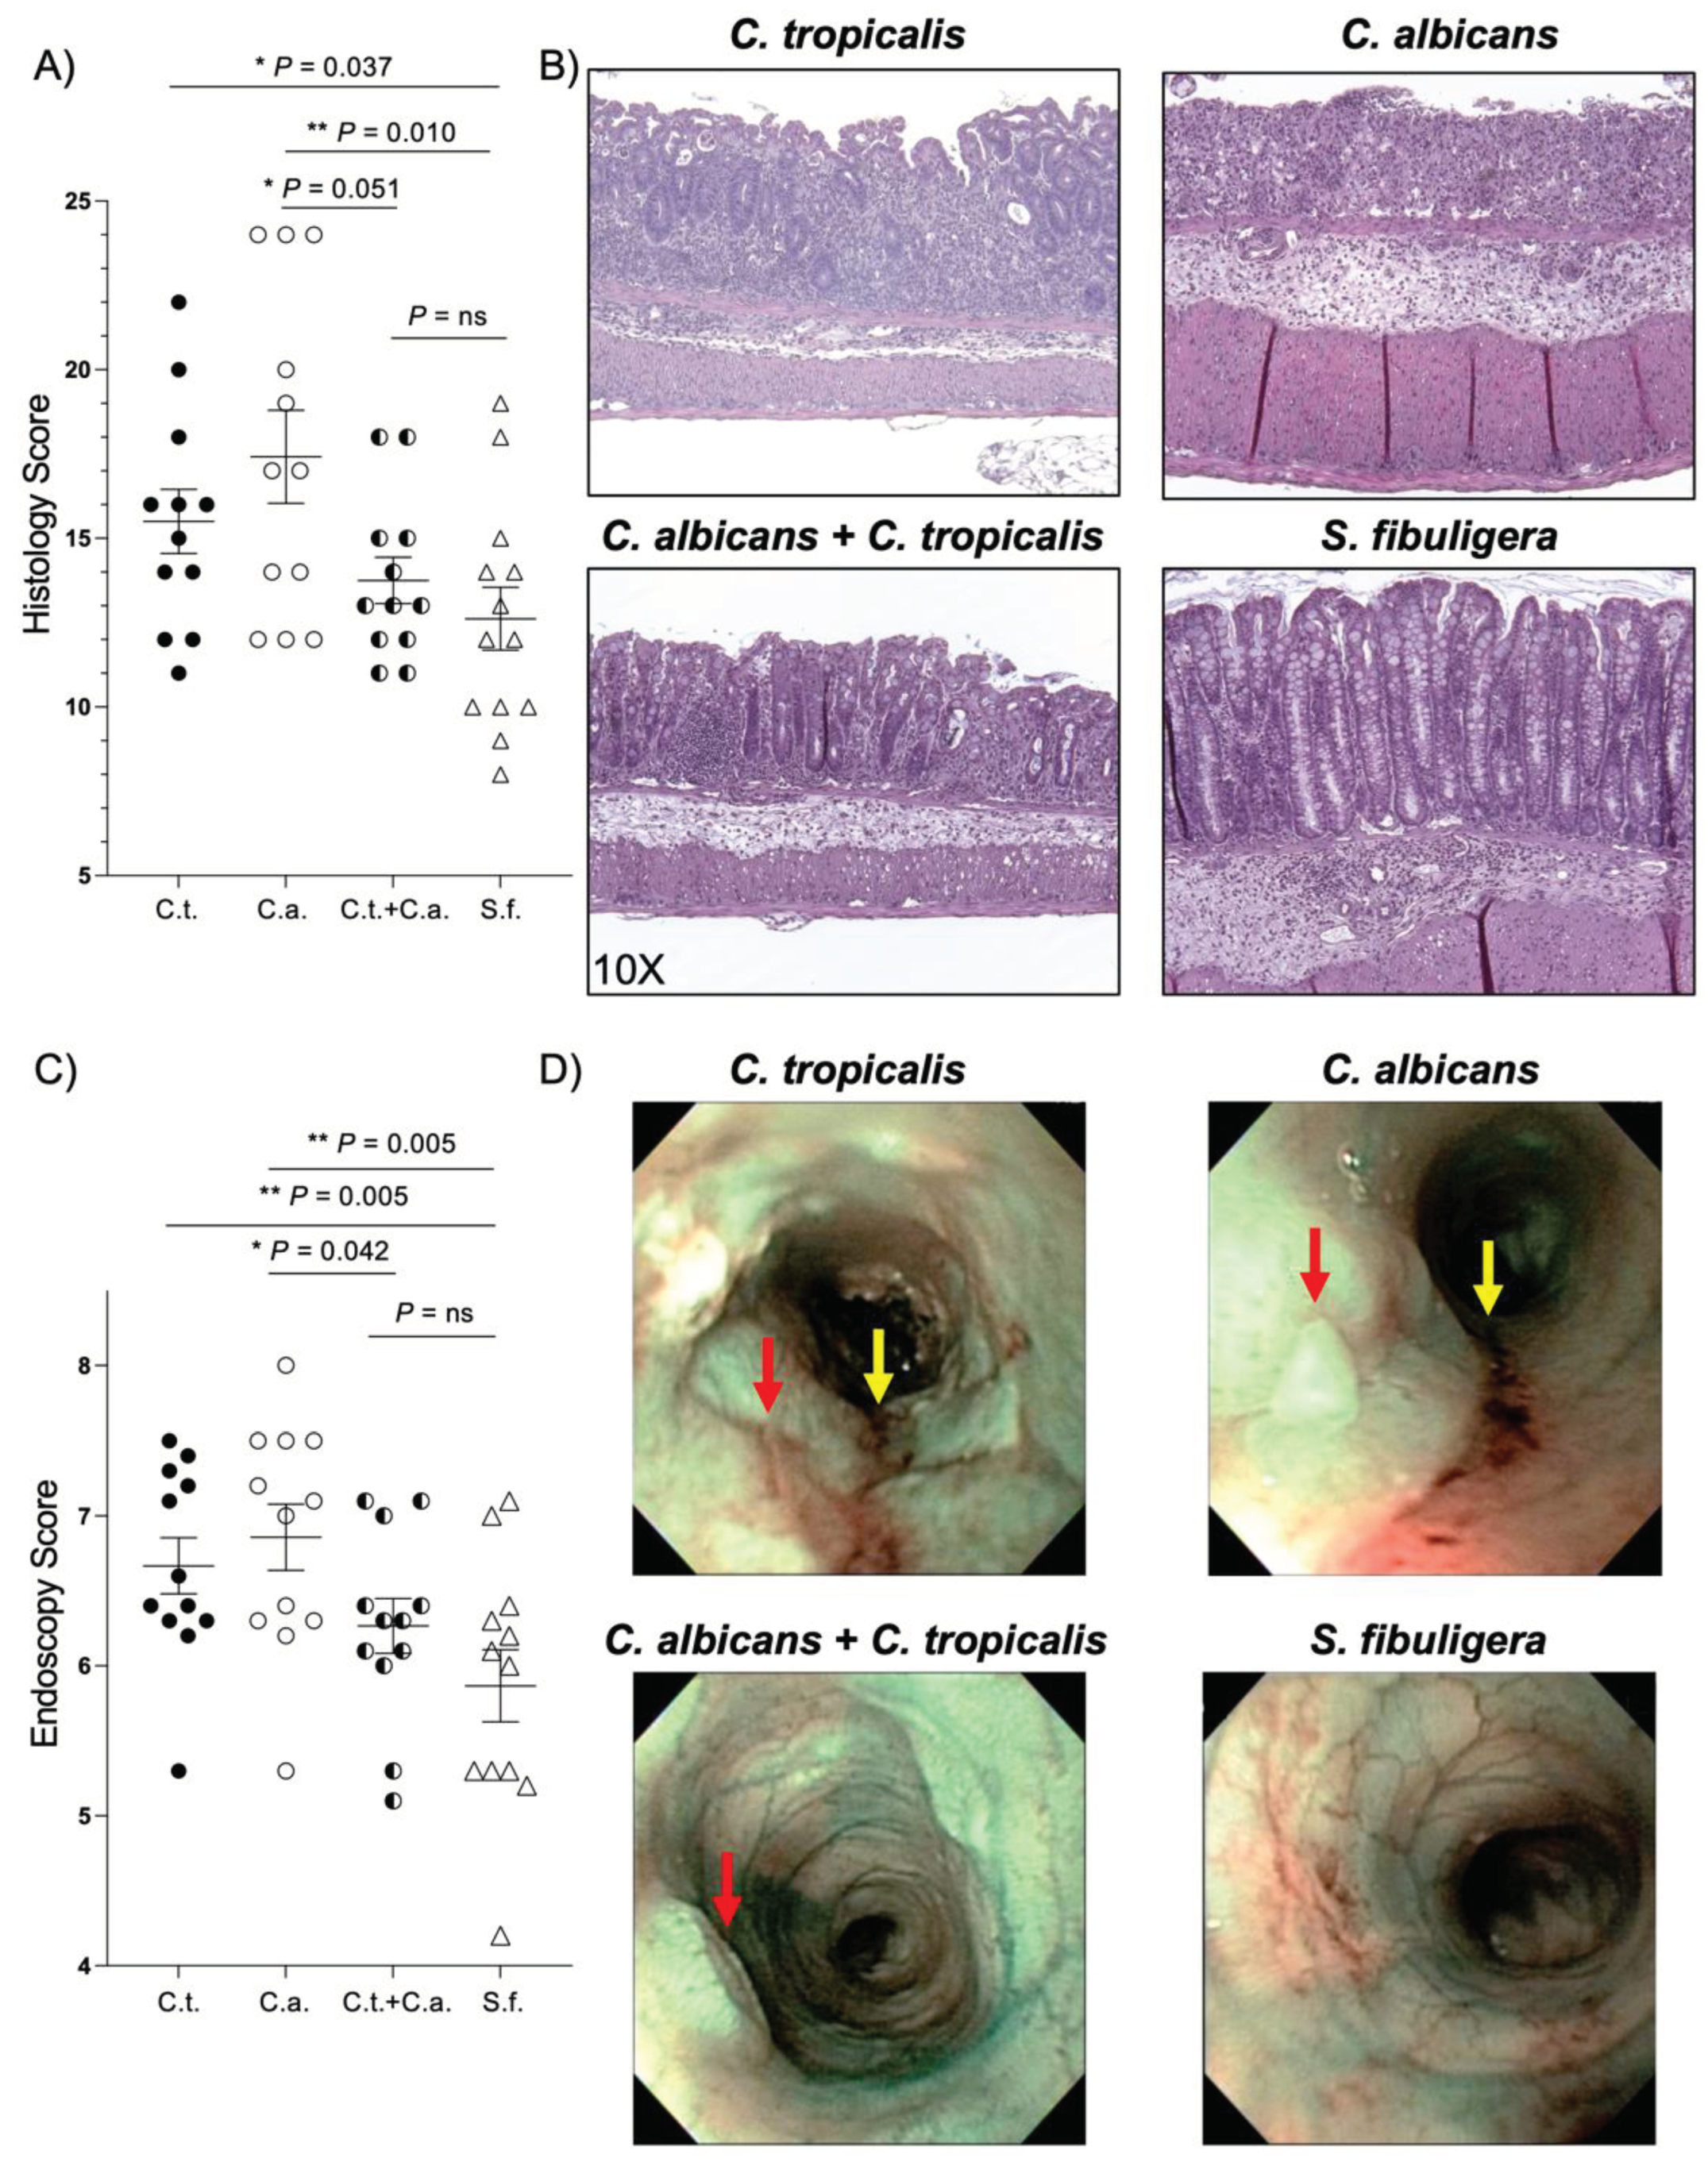
Figure 2.
C. tropicalis alters the lymphocytic immunophenotype in C. albicans-challenged mice during dextran sodium sulfate-induced colitis. Cultured lymphocytes collected from mesenteric lymph node displayed significant differences between C. albicans-inoculated mice, C. tropicalis-inoculated mice, co-inoculated mice and the control group: (A) decrease of interleukin (IL)-4 between C. albicans-inoculated mice and co-inoculated mice (unpaired t test, 0.072 ± 0.006 vs. 0.243 ± 0.068, P < 0.05) and the control group (unpaired t test, 0.072 ± 0.006 vs. 0.249 ± 0.060, P < 0.02); decrease of IL-4 between C. tropicalis-inoculated mice and co-inoculated mice (unpaired t test, 0.046 ± 0.009 vs. 0.243 ± 0.067, P < 0.02) and the control group (unpaired t test, 0.046 ± 0.009 vs. 0.249 ± 0.060, P < 0.02). (B) Decrease of IL-17 between C. tropicalis- and C. albicans-inoculated mice compared to co-inoculated mice (unpaired t test, 0.075 ± 0.022 vs. 0.532 ± 0.164, P < 0.02) (unpaired t test, 0.134 ± 0.014 vs. 0.532 ± 0.164, P < 0.05) and the control group (unpaired t test, 0.075 ± 0.022 vs. 0.550 ± 0.150, , P < 0.02) (unpaired t test, 0.134 ± 0.014 vs. 0.550 ± 0.150, P < 0.02). Lymphocytes do not display significant difference between co-inoculated mice and the control group in terms of IL-4 (unpaired t test, 0.243 ± 0.068 vs. 0.249 ± 0.060, P=ns) and IL-17 (unpaired t test, 0.532 ± 0.164 vs. 0.550 ± 0.150, P=ns). (C) Decrease of tumor necrosis factor (TNF) between C. albicans-inoculated mice and co-inoculated mice (unpaired t test, 0.833 ± 0.081 vs. 1.133± 0.107, P < 0.05); decrease of TNF between C. tropicalis-inoculated mice and co-inoculated mice (unpaired t test, 0.368 ± 0.044 vs. 1.133 ± 0.107, P < 0.001), C. albicans-inoculated mice (unpaired t test, 0.368 ± 0.044 vs. 0.833 ± 0.081, P < 0.001) and the control group (unpaired t test, 0.368 ± 0.044 vs. 0.980 ± 0.053, P < 0.001). (D) Decrease of interferon (IFN)γ between C. tropicalis-inoculated mice and co-inoculated mice (unpaired t test, 0.700 ± 0.216 vs. 1.236 ± 0.083 vs. 1.218 ± 0.070, P < 0.05); increase of IFNγ between C. albicans-inoculated mice and the control group (unpaired t test, 0.988 ± 0.088 vs. 1.150 ± 0.745 vs. 0.043 ± 0.064, P < 0.05); increase of IFNγ between co-inoculated mice and the control group (unpaired t test, 1.218 ± 0.070 vs. 1.150 ± 0.130 vs. 0.745 ± 0.043, P < 0.001). Data are expressed as mean ± SEM, and are representative of 2 separate experiments; * P < 0.05, ** P < 0.02, *** P < 0.001.
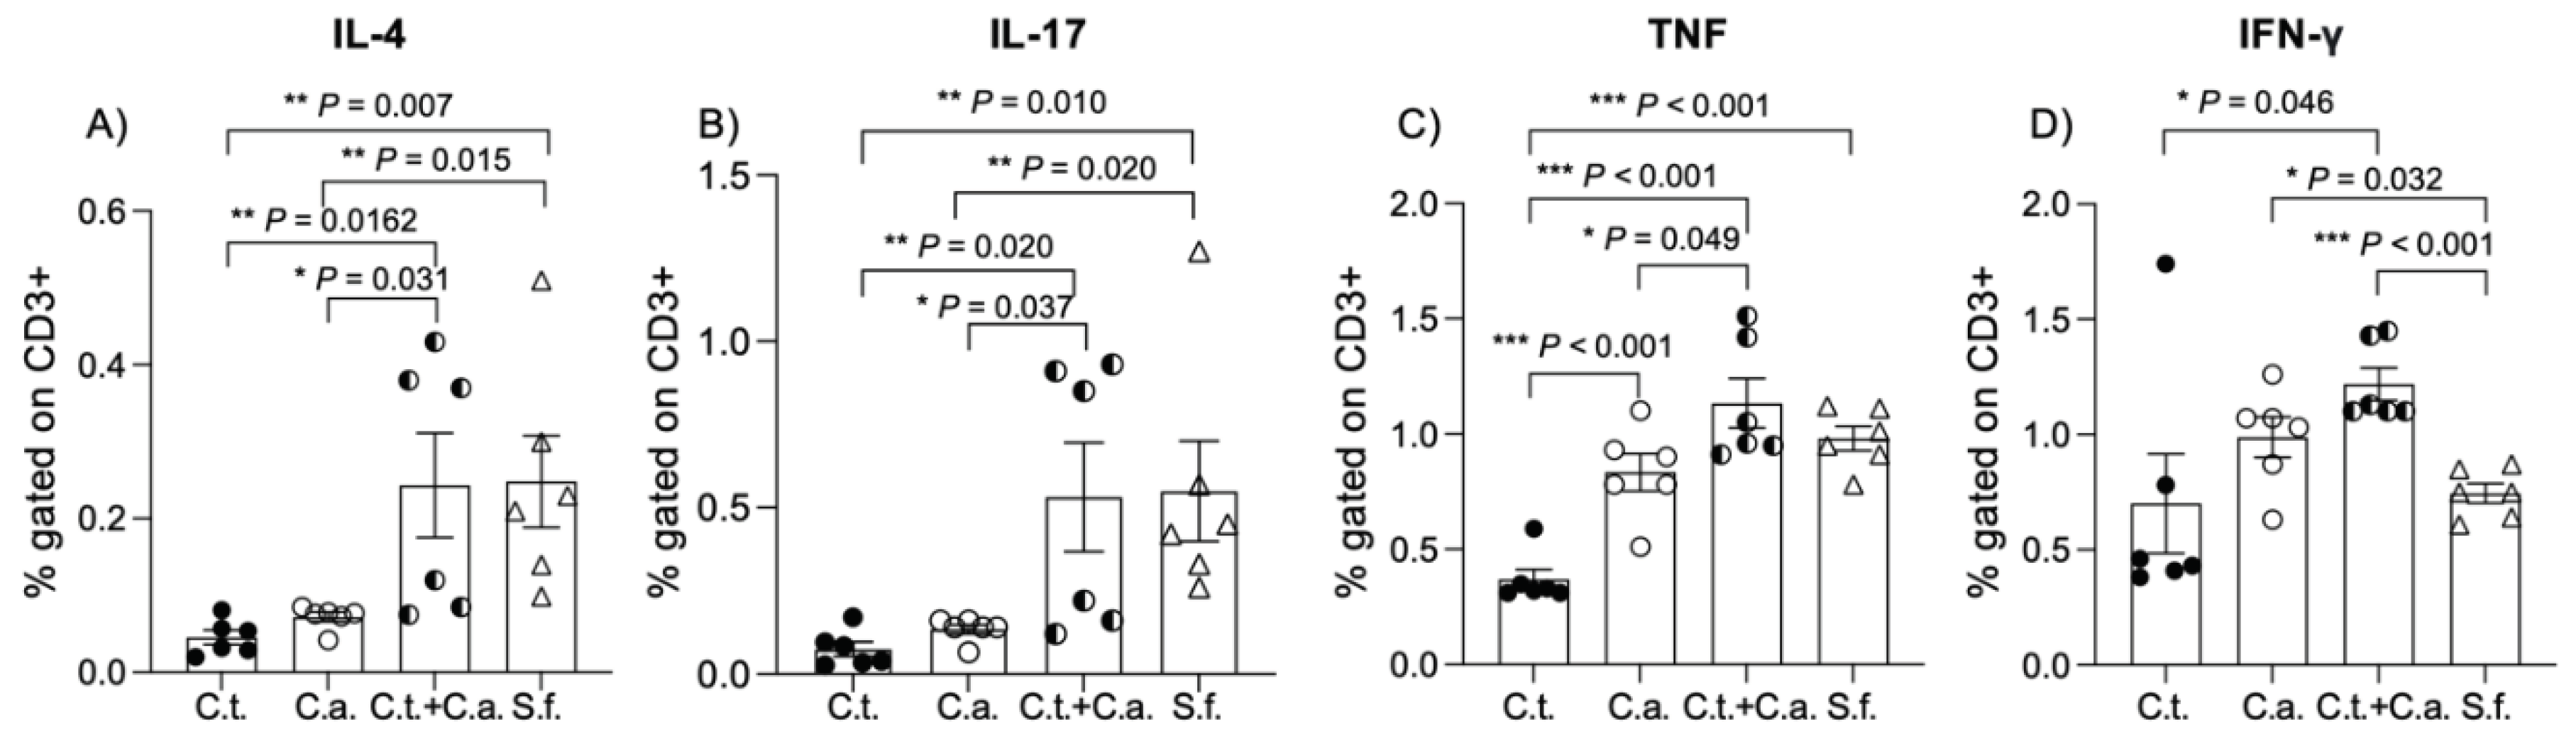
Figure 3.
C. tropicalis and C. albicans co-colonization alters production of short-chain fatty acids by gut microbiome. Gas chromatography/mass spectrometry (GC/MS) analysis indicates decreased levels of: (A) propionic acid in fecal samples of co-inoculated mice compared to mice challenged with C. albicans alone (unpaired t test: 259.6 ± 103.1 vs. 551.4 ± 78.18; P<0.05) or C. tropicalis only (unpaired t test: 259.6 ± 103.1 vs. 635.4 ± 55.45; P<0.02); no differences were found between co-inoculated mice and the control group (unpaired t test: 259.6 ± 103.1 vs. 533.8 ± 111.4; P=ns). (B) valeric acid in co-inoculated mice compared to mice challenged with C. albicans alone (unpaired t test: 5.653 ± 2.072 vs. 17.520 ± 4.983; P<0.05), C. tropicalis alone (unpaired t test: 5.653 ± 2.072 vs. 22.230 ± 3.480; P<0.02) or the control group (unpaired t test: 5.653 ± 2.072 vs. 27.060 ± 6.288; P<0.02). (C) heptanoic acid in co-inoculated mice compared to mice challenged with C. tropicalis alone (unpaired t test: 0.360 ± 0.023 vs. 0.540 ± 0.056; P<0.02). No differences were found between groups in terms of (D) butyric acid and (E) hexanoic acid (P = ns). Data are expressed as mean ± SEM, and are representative of 2 separate experiments; N > 6/group; * P<0.05, ** P<0.02.
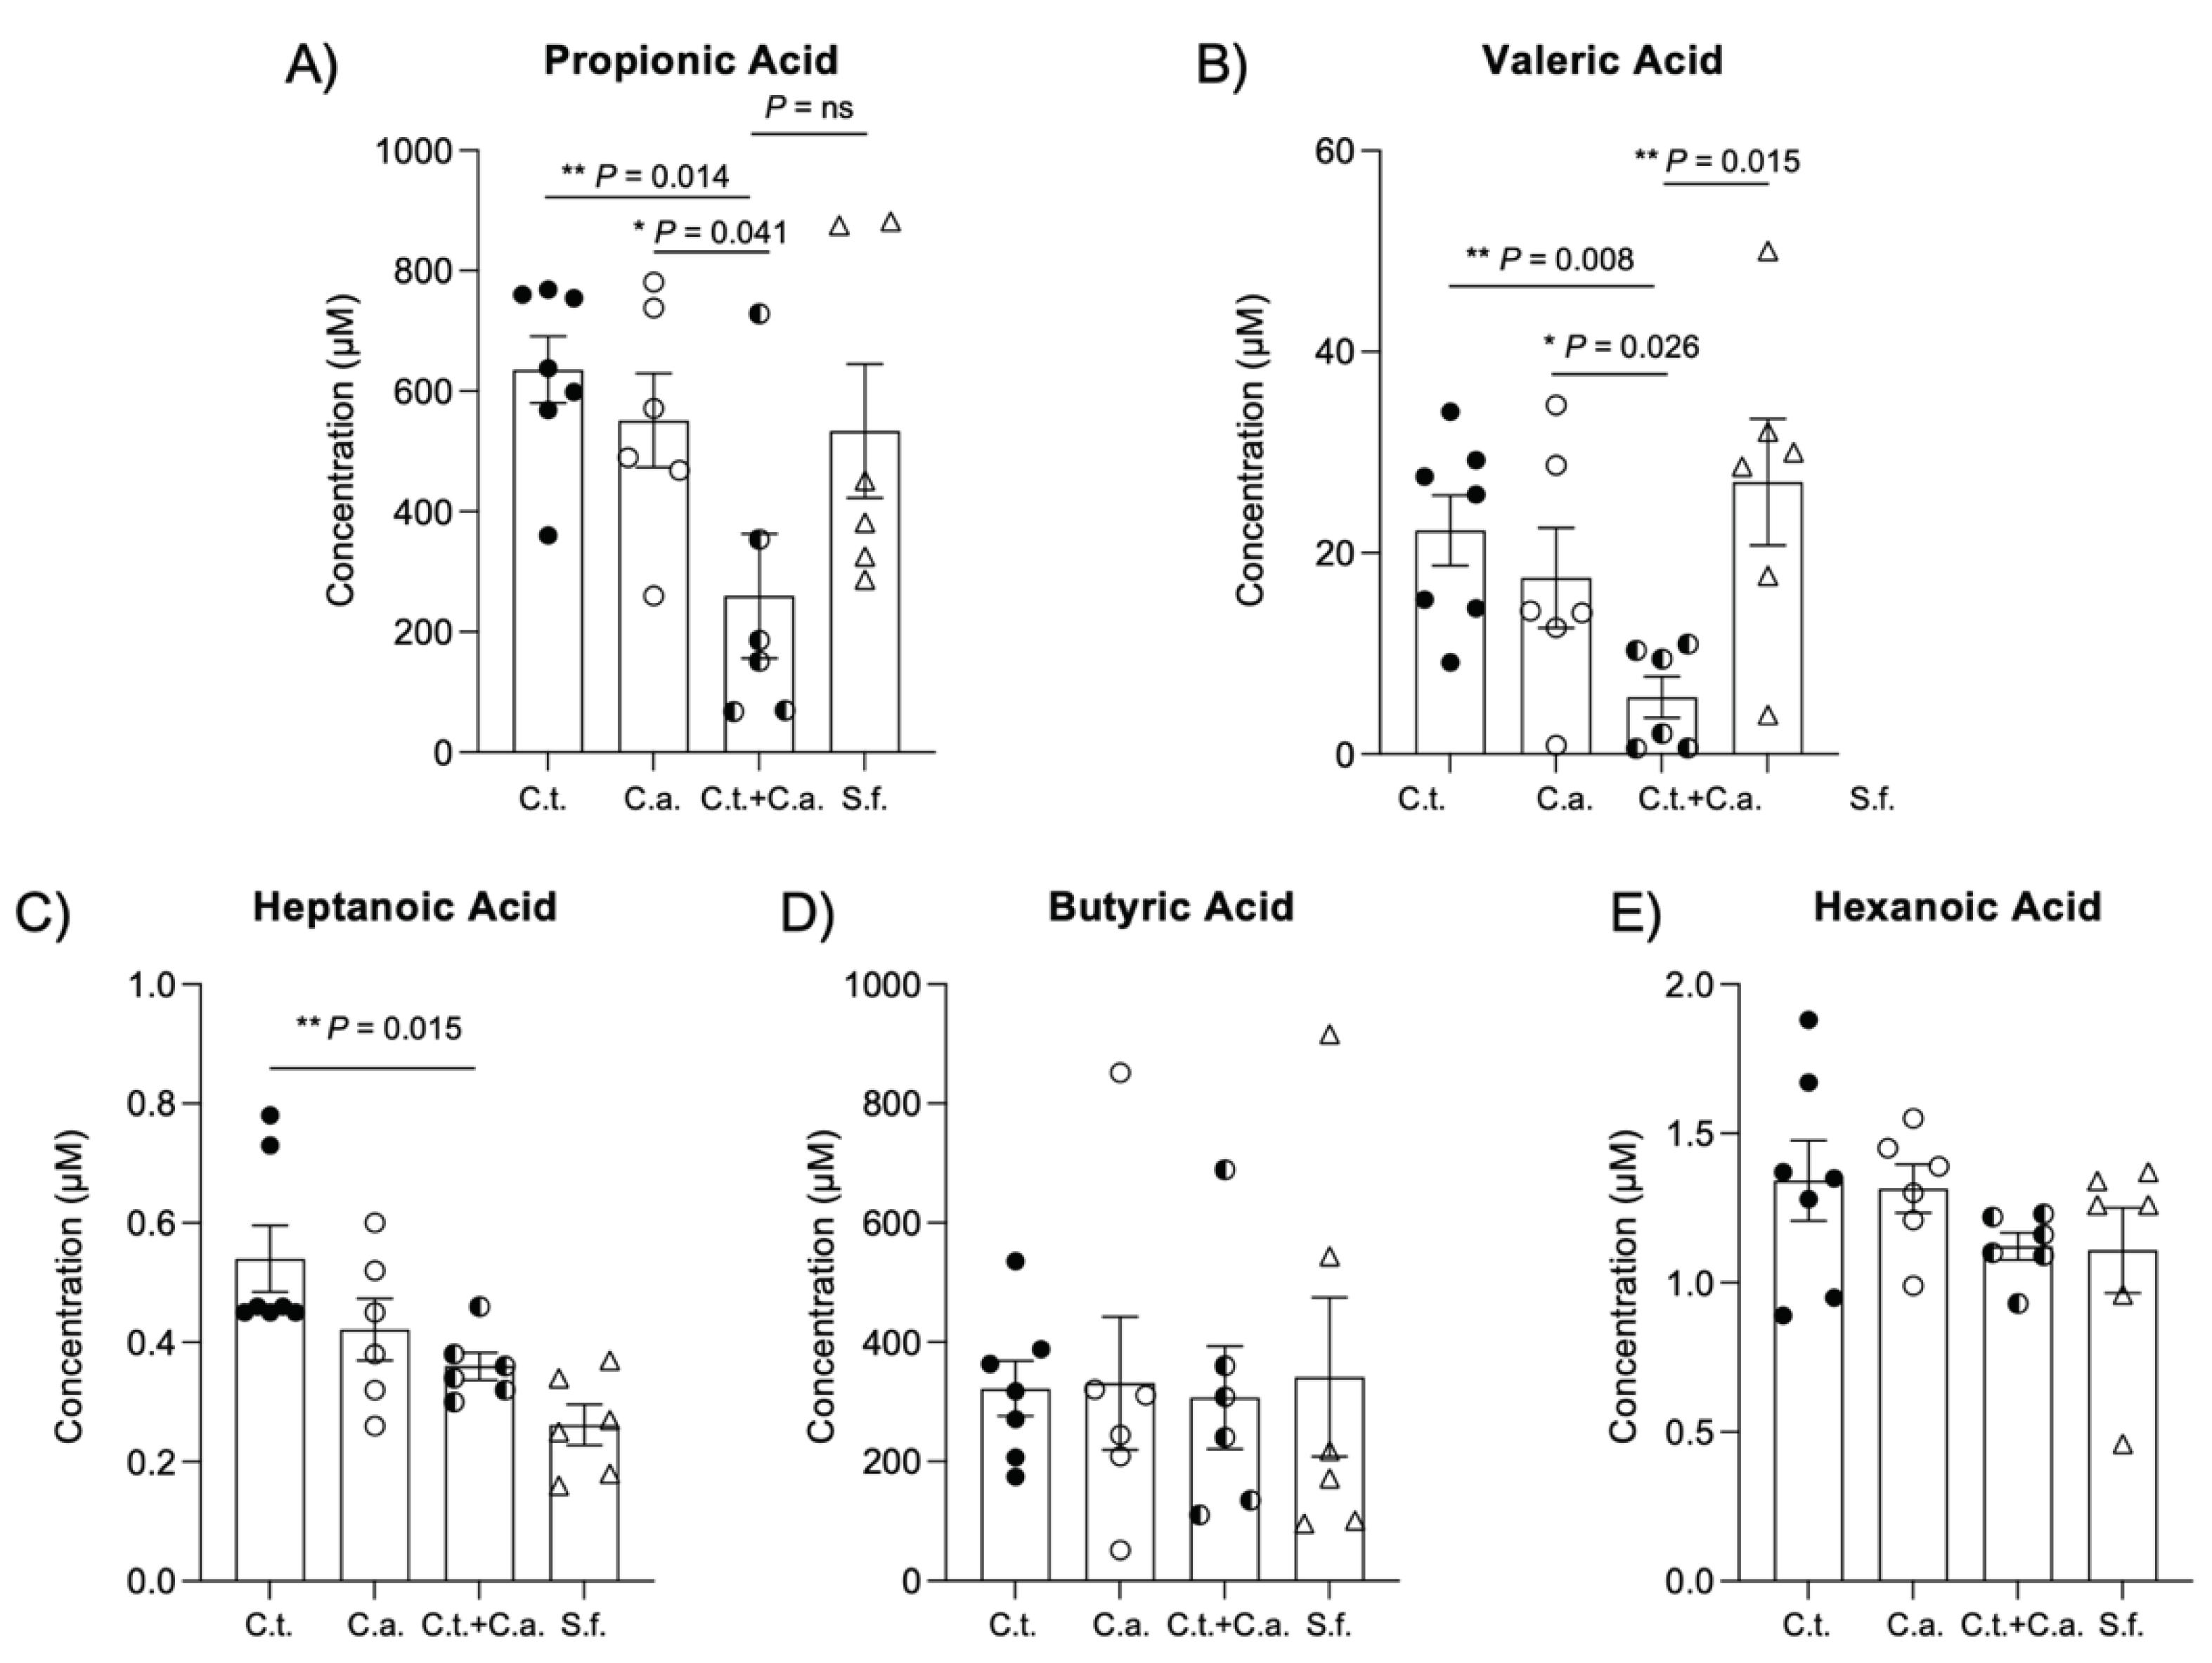
Figure 4.
C. tropicalis negatively affects the virulence of C. albicans by impairing its ability to produce biofilm and adhere to the surface of the host. (A) Recovery of C. albicans and C. tropicalis from fecal samples of the co-inoculated mice and mono-inoculated mice. Shown are colony-forming unit (CFU) counts from stools weighed, homogenized and plated for counts on Sabouraud dextrose agar. CFU assays showed that C. albicans burden significantly decreased in co-inoculated mice compared to mice inoculated with C. albicans alone (unpaired t test: 4.958 ± 0.267 vs. 6.164 ± 0.109; P<0.001) and compared to C. tropicalis CFUs in the co-inoculated group (unpaired t test: 4.958 ± 0.267 vs. 5.912 ± 0.144; P<0.02). (B) Representative pictures of C. albicans and C. tropicalis recovery 24 hours after the last inoculum. (C) Immunohistochemical staining for C. albicans shows that C. albicans is more abundant and it is able to penetrate deeper in the epithelium and in the lamina propria (black arrows) of colon tissues collected from mice mono-inoculated with C. albicans compared to the co-inoculated group. Colon tissues of mice inoculated with C. tropicalis present no clearly positive stain. Panels: 20X and 40X magnification. (D) Effects of supernatant collected from C. tropicalis culture on C. albicans biofilm formation. (2-methoxy-4-nitro-5-sulfophenyl)-5-[(phenylamino)carbonyl] 2H-tetrazoliumhydroxide assay results show that C. albicans treated with C. tropicalis-cultured supernatant produced less biofilm compared to untreated C. albicans (unpaired t test: 1.340 ± 0.111 vs. 1.810 ± 0.147; P<0.05), while C. tropicalis strain treated with C. albicans-cultured supernatant did not show any significant alteration related to biofilm production compared to untreated C. tropicalis (unpaired t test: 1.200 ± 0.374 vs. 1.300 ± 0.381; P=ns). Data are expressed as mean ± SEM, and are representative of 2 separate experiments; N > 10/group; * P<0.05, ** P<0.02, *** P<0.001.
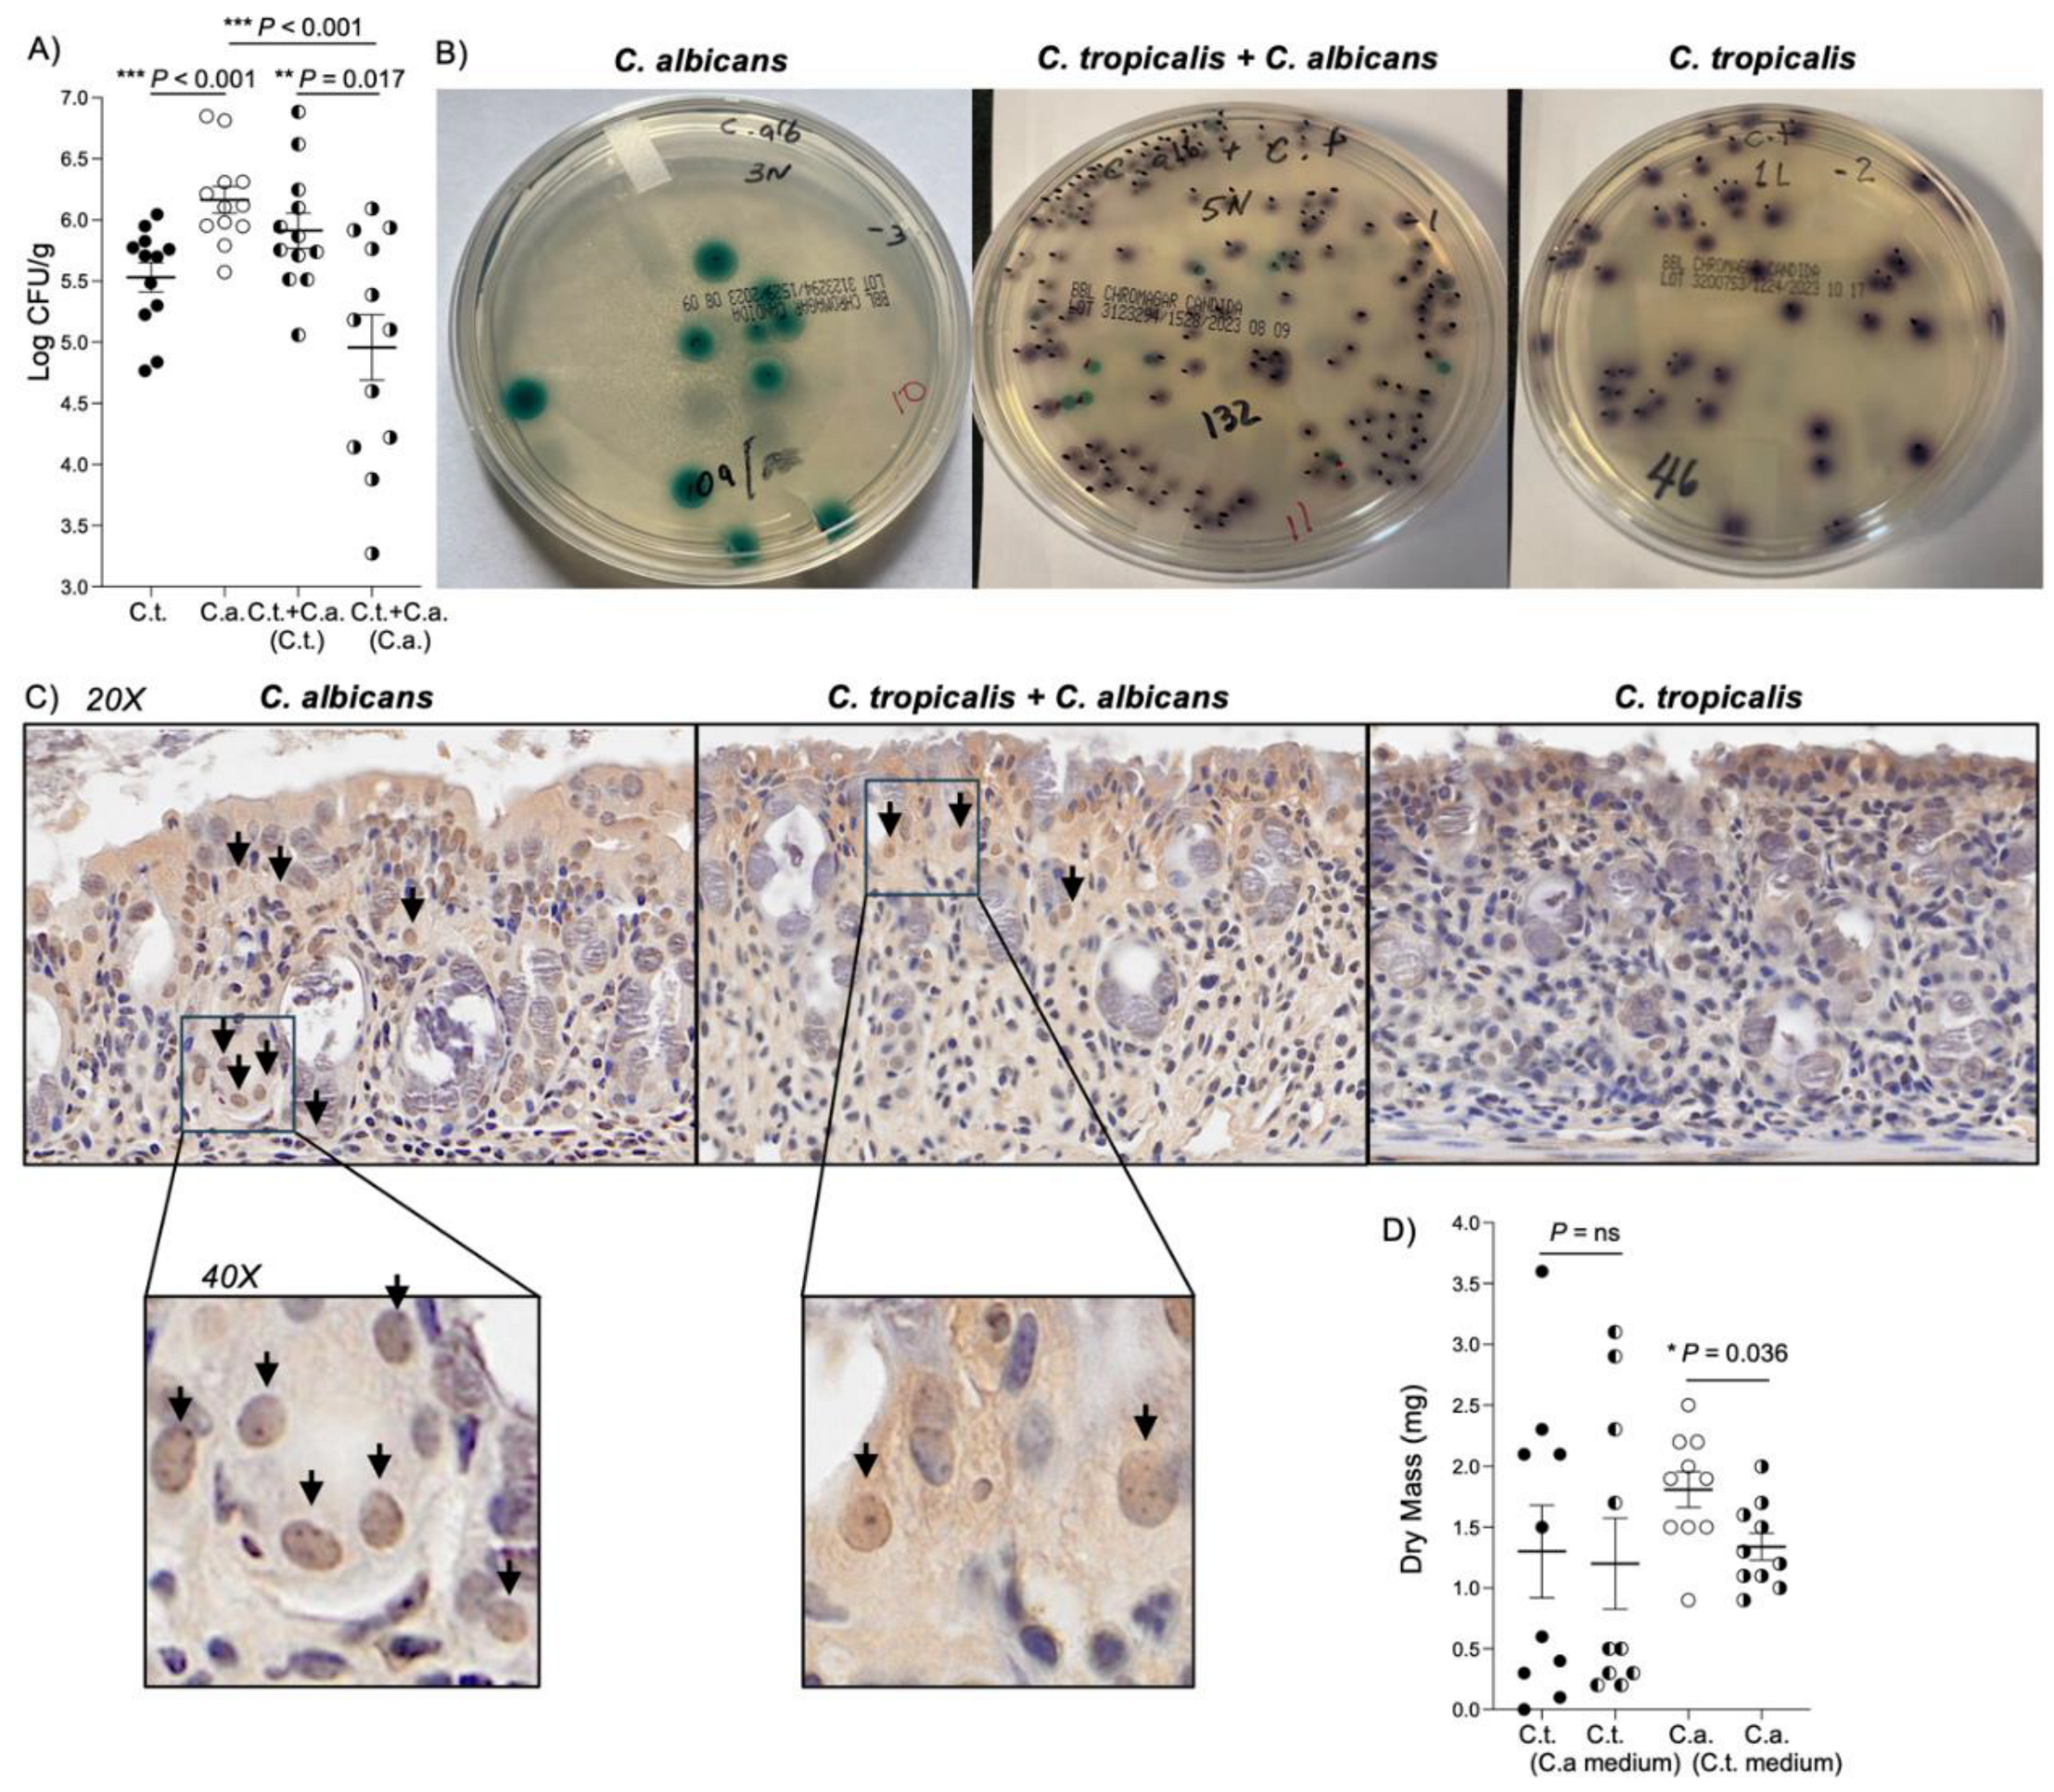
Figure 5.
C. tropicalis altered the expression of genes involved in multiple immune responses in C. albicans-challenged mice. Heatmaps of normalized data, indicating connections between genes differently expressed in colonic tissues of co-inoculated mice compared to mice mono-inoculated with A) C. tropicalis, B) C. albicans or C) the control group. Data are shown indicating associations between gene expression (gold, upregulation; blue, down regulation) and treatment. Each row corresponds to a specific probe and each column corresponds to a specific sample. Hierarchical clustering has been used to generate dendrograms. Volcano plots expressing NanoString data for 785 genes showed that colonic tissues of co-inoculated mice have (D) 12 genes upregulated compared to mice inoculated with C. tropicalis alone, (E) 1 gene down regulated and 6 genes upregulated compared to mice inoculated with C. albicans alone and (F) 21 genes upregulated compared to the control group. Data are representative of 2 separate experiments. * P < 0.05.
Disclaimer/Publisher’s Note: The statements, opinions and data contained in all publications are solely those of the individual author(s) and contributor(s) and not of MDPI and/or the editor(s). MDPI and/or the editor(s) disclaim responsibility for any injury to people or property resulting from any ideas, methods, instructions or products referred to in the content. |
© 2024 by the authors. Licensee MDPI, Basel, Switzerland. This article is an open access article distributed under the terms and conditions of the Creative Commons Attribution (CC BY) license (http://creativecommons.org/licenses/by/4.0/).
Copyright: This open access article is published under a Creative Commons CC BY 4.0 license, which permit the free download, distribution, and reuse, provided that the author and preprint are cited in any reuse.


