
Submitted:
28 February 2024
Posted:
29 February 2024
You are already at the latest version
Abstract
This is an exercise to explore the concentration of Lithium, Lithium-7 isotope and the possible presence of black dirty ice in the lunar surface using spectral data obtained from the Clementine mission. The main interest in tracing the lithium and presence of dark ice in the lunar surface are closely related to future human settlement missions in the Moon. We investigate the distribution of Lithium and 7 Li isotope on the Lunar surface, employing spectral data from the Clementine images. We utilized Visible (VIS-NIR) imagery at wavelengths of 450, 750, 900, 950, and 1000 nm, along with Near-Infrared (NIR-SWIR) at 1100, 1250, 1500, 2000, 2600, and 2780 nm, encompassing 11 bands in total. This dataset offers a comprehensive coverage of about 80% of the lunar surface, with resolutions ranging from 100 to 500 meters, spanning latitudes from 80°S to 80°N. In order to extract quantitative abundance of Lithium, ground truth sites were used to calibrate the Clementine images. Samples (12045, 15058, 15475, 15555, 62255, 70035, 74220 and 75075) returned from Apollo missions 12, 15, 16 and 17 have been correlated to the Clementine VIS-NIR bands and five spectral ratios. The 5 spectral ratios calculated synthesize the main spectral features of sample spectra that were grouped by their Lithium and 7 Li content using Principal Component Analysis. The ratios spectrally characterize substrates of anorthosite, silica-rich basalts, olivine-rich basalts and High-T mare basalts and Orange soils. Our findings reveal a strong linear correlation between the spectral parameters and the lithium content in the 8 Apollo samples. With the values of the 11 Clementine bands and the 5 spectral ratios for each of the 8 lunar soils we performed linear regression models to estimate the concentration of Lithium and 7 Li. Also, we calculated Digital Terrain Models (DTMs; Altitude, Slope, Aspect, DirectInsolation and WindExposition) from LOLA-DTM to discover relations between relief and spatial distribution of the extended models of lithium and 7 Li. The analysis was conducted in a mask polygon extracted from Lunar Orbiter Laser Altimeter (LOLA) and located around the Apollo 15 landing site. This analysis seeks to uncover potential 7 Li enrichment through spallation processes, influenced by varying exposure to solar wind. To explore the possibility of find ice mixed with regolithe (black ice) we used a spectral library (350-2500nm) form ices dirty with different concentration of volcanic particles.
Keywords:
Lithium
; Dirty ice
; Lunar surface
; Spectral data
; Clementine mission
1. Introduction
The main interest in tracing the lithium and presence of black ice in the lunar surface are closely related to future human settlement missions in the Moon. For long-term lunar bases or space missions, in-situ access to lithium for battery production could be crucial for energy sustainability. Mining lithium on the Moon could further spur technological advancements in space exploration. In the other side, the confirmation of water on the Moon has been a relatively recent. In 2009, NASA’s Lunar Crater Observation and Sensing Satellite (LCROSS) mission identified water in the form of ice within Cabeus crater near the lunar South Pole [1] identified and mapped surfaces with reflectance so high as to be unlikely to be part of an ice-free population. In this south, they found a similar distribution found by [2] based on UV properties. The majority of lunar water is found as ice in permanently shadowed craters at the poles, where temperatures are extremely low and sunlight is perpetually absent. However, there are also indications of water in other regions of the Moon, albeit in significantly lower concentrations [2]. This work represents an exercise in the exploration for these resources on the lunar surface using remote sensing and spectroscopy techniques together with the information available in the PSD Orbital Data Explorer from JPL of NASA. The research on the presence of lithium on the moon is not very abundant [3] analyzed lithium (ppm) and 7 Li (‰) isotope in several rock and regolithe samples from the solar system for astrophysical purposes, and eight of these samples were from the Moon. Lithium and 7 Li in basaltic and ultramafic rocks from the Earth, Moon samples (Apollo 12, 15, 16 and 17 mission samples), Mars and Vesta were analysed yielding Li stable isotope compositions more less consistent with earth mantle (7 Li≈+4‰). Martian meteorites give distinct 7 Li of 3.9‰ (Zagami) and 5.0‰ (Nakhla). Eucrites from Vesta shows substantially higher Li abundances (8.3–13.1 ppm) as do lunar rocks and glasses (6.0–13.3 ppm). In this way, 7 Li isotope concentration in the lunar samples reaches +8.89‰, measured in the 62255-moon sample, which is composed of anorthosite. Mare moon basalts exhibit a large range of Li isotope compositions (7 Li= +3.4‰to +6.4‰) predominating high concentrations (e.g. 9.2 ppm with 6.39‰of 7 Li in sample 72255 or 10.3 ppm and 5.48‰in sample 75075 both from High-Ti mare basalts). These concentrations are more than double of the 7 Li concentrations measured in samples of terrestrial basalts (MORB; Iceland and Hawaii basalts). Moreover, 74220 sample named as Orange and Glass from the four geological station of Apollo 17 mission, was considered a clod of friable material taken 6-8 cm deep in a trench from Station 4, on the rim of 120 meter Shorty crater. This sample is rich in lithium reaching 13.3 ppm but only 4.2‰are 7 Li, that defines a ratio of 7 Li of 0.32 (7 Li/Lithium ppm) (Table 1). On the other hand, Anorthosite sample (62255) shows the lowest concentration of lithium (0.8) but the highest concentration of 7 Li (8.89 ‰) that determines a value of 11.11 for the 7 Li/Lithium ratio (Table 1). However, oxygen isotopes provide evidence that the Earth and the Moon were created from the same raw material. The lithium concentrations measured in the lunar samples are in accordance with the Earth data, but the isotope 7 Li ratios do not. In the lunar samples, there are several orders of magnitude larger than in the Earth’s crust and more than twice than in the rocks of the terrestrial mantle. Therefore, the Li isotope compositions in the Earth and the Moon should be identical. We suspect that the apparent increments of 7 Li on the lunar surface could be related to possible surface exposure to solar wind particles. Spallation processes in cosmic rays is the primary means of nucleosynthesis for stable isotopes of lithium, beryllium, and boron. Throughout the long evolutionary history of the Moon, the composition of its most ancient substrates can be significantly altered by space weathering and impact processes compared to the source materials, such as crystalline rocks like anorthosite, which is the most abundant substratum in the lunar highlands [4,5]. Regarding the exploration of dirty ice, beyond ice, molecular water (H2O) and hydroxyl groups (OH) have been detected on the lunar surface. NASA’s Stratospheric Observatory for Infrared Astronomy (SOFIA) has played a pivotal role in identifying water molecules on the Sunlit lunar surface. One hypothesis suggests that water was formed through the interaction of solar wind with lunar minerals, yielding hydroxyl and subsequently water. Alternative theories propose that water was delivered via cometary and asteroidal impacts on the Moon [6]. Current and forthcoming missions, including NASA’s Artemis program, aim to further investigate lunar water. These studies will aid in better understanding the distribution, quantity, and potential extraction and utilization methods of lunar water.
1.1. Mapping the Mineral Composition of the Moon
Many groups have estimated the lunar surface composition, particularly oxide or elemental abundances, using reflectance data obtained from Earth-based telescopes (e.g., [7]), X-ray spectroscopy data gathered by Apollo 15 and Apollo 16 missions [8], Chandrayaan-1 [9,10], or Chang’E (CE)-3,4 [11,12]. Also, elemental mapping were performed with data from Gamma-ray spectroscopy (GRS) acquired by Apollo 15 and Apollo 16 [13], Lunar Prospector (LP) [14,15,16], or SELENE (Kaguya) [17], along with neutron spectroscopy data obtained by LP [18,19,20,21,22] have also been utilized. Reflectance spectral data obtained from missions such as Clementine [23,24,25,26], and more recently, Lunar Reconnaissance Orbiter (LRO) [27,28,29] and CE-1 [30,31,32,33,34] have provided further insights. At this point we would like to highlight the Christiansen Feature product(CF) and recognize it as a crucial spectroscopic tool in lunar mineralogy mapping. CF refers to a specific point in the infrared spectrum where reflectance peaks, occurring at a wavelength unique to each of the material’s properties. At this peak, the material’s refractive index is 1. The relationship between the wavelength of the CF and mineral composition was first established by Conel in 1969, and later connected to igneous rock types by [35,36]. More recently, CFs have been instrumental in mapping lunar surface mineralogy, as demonstrated in studies by [5,29]. The main goal of NASA’s Lunar Reconnaissance Orbiter’s Diviner mission is to conduct a comprehensive mapping of CFs across the lunar surface [29,37]. However, near-infrared spectral reflectance is not completely reliable to identify the relative abundance of low-weight elements, molecules, or minerals. Moreover, [38,39,40,41] have shown that the CF values measured under lunar-like conditions, or calculated by Diviner multispectral infrared measurements, shift to shorter wavelengths with the decrease of lunar sample maturity [25]. In addition, the effects of viewing geometry on the CF values accounting for the temperature and anisothermality (temperature variation in different directions) which can cause the CF values to shift toward short or long wavelengths especially in the high latitudes regions [38], are also worth considering. Other limitation arises because spectral features can be obscured by space weathering, a challenge noted by [5]. All these limitations to CF as a mapping tool have encouraged us to explore the ability of ViS_NIR_SWIR bands for lithium or black ice identification and mapping. The majority of optical data currently available for the Moon comes from much simpler sensors, namely multispectral imagers, which typically consist of a digital framing camera equipped with several filters. Examples for lunar applications are the Galileo SSI camera (6 broadband filters) or the VIS-NIR camera of Clementine (11 filters) [42,43,44]. The Clementine mission, launched in 1994, was a joint project of the U.S. Department of Defense’s Ballistic Missile Defense Organization (BMDO) and NASA. Its primary objective was to test sensors and space navigation technology in a real spaceflight environment, but it conducted significant lunar scientific research. Equipped with various instruments, including multi-spectral cameras, a laser altimeter, and a spectrometer, Clementine conducted numerous scientific experiments during its mission. Collected extensive data on lunar topography and mineral composition. The mission concluded in June 1994 after a computer malfunction prevented a planned flyby of asteroid Geographos. Clementine, albeit with filter technology, provided the most comprehensive collection of satellite optical images of the moon and could be useful for exploration works like the one we present here. To validate the Clementine data, could be convenient to collect reflectance spectra in situ with a calibration panel that can quantify the absolute reflectance and give more compositional detail to provide the ground truth. The first in situ reflectance spectra was measured at the end of 2013 when China’s Chang’E-3 (CE-3) spacecraft landed on the Moon [11]. In summary, various tools have been employed to map the resources of the Moon. However, as of now, no maps displaying the distribution of lithium or dark ice on the lunar surface in relation to relief patterns and geomophological units as crater rims have been published. With the aim to fill this gap, we have investigated the distribution of Lithium and 7 Li (‰) and black ice in the lunar surface (including rocks and regolith) using spectral data obtained from the Clementine mission combined with reflectance spectra obtained from the RELAB spectral library [45] or obtained in a laboratory using an ADS spectrophotometer (VIS-NIR-SWIR).
2. Materials and Methods
In our research, we utilized mosaics constructed from data collected by the Clementine mission’s VIS-NIR-SWIR experiment [42,43], spanning 11 distinct spectral channels. This imagery is publicly available from NASA and can be accessed through https://ode.rsl.wustl.edu/. Also, we used the digital elevation model derived from Lunar Orbiter Laser Altimeter (LOLA) experiment on board the Lunar Reconnaissance Orbiter (LRO) [27].
2.1. Lithium Exploration
To calibrate the Clementine images for lithium composition (ground trough), we used chemical analyses of samples returned from Apollo missions 12, 15, 16, and 17, specifically samples 12045, 15058, 15475, 15555, 62255, 70035, 74220, and 75075 analyzed by [3] (Table 1). Additionally, we used a spectral library RELAB (Reflectance Experiment Laboratory) from PDS Geosciences Node, which contains spectra of these eight lunar samples. We found a total of 18 spectra measured over the spectral range 300–2780 nm with 5 nm sampling resolution at a phase angle of 30°[45]. A key aspect of these data is that Clementine data and laboratory spectral measurements of lunar soils are took with the same photometric geometry and calibration [45].
We performed a Principal Component Analysis (PCA) to condense the 19 spectra, ranging from 300 to 2780 nanometers, of eight lunar samples into five distinct spectral types. To transfer the spectral information into Clementine image, spectral ratios for the five types of spectra (C1-C5) were defined and calculated according to:
Where ratio is defined as , and represents the corresponding wavelengths (Eq. 1). The specific wavelengths were identified in spectra using Spectroscopy Pro Tools 1.2 software. To carry out this work, we needed a GIS environment. We used QGis 3.34 and the first step was to create a georeferenced map of the eight lunar samples. To do this we rely on georeferenced information about the moon samples from the LPI-NASA and Google Moon. To explore the lithium presence on lunar surface we translated the 5 spectral ratios into the Clementine bands using the raster calculator of QGis. As the reflection and absorption peaks represent wavelengths of spectra taken at 5 nm of resolution (but the Clementine bands were obtained with photometric filters without wavelengths spectral resolution) we had to consider the central wavelength of Clementine bands to translate the spectral ratios into a Clementine image. The 11 Clementine bands (VIS-NIR-SWIR) plus the five spectral ratios were crossed with the eight georeferenced lunar samples using the QGis Point Sampling Tool and we obtained the values of bands and ratios, 16 variables in total, for each of the eight lunar samples. We have performed linear correlation analyses between the values of lithium and 7 Li and the spectral parameters for lunar soils extracted from bands 11 (450, 750, 900, 950, 1000, 1100, 1250, 1500, 2000, 2600, and 2780 nm) and the five spectral ratios. After that we tested the suitability of Multiple Linear Regression (forward stepwise) techniques to estimate lithium concentration using a statistics aplication. With these data we completed a large number of Linear Regression Models analyses. The linear models with the best fit were extended to the entire Clementine images via the raster calculator of QGis.
2.2. Lithium Distribution and Relief Patterns
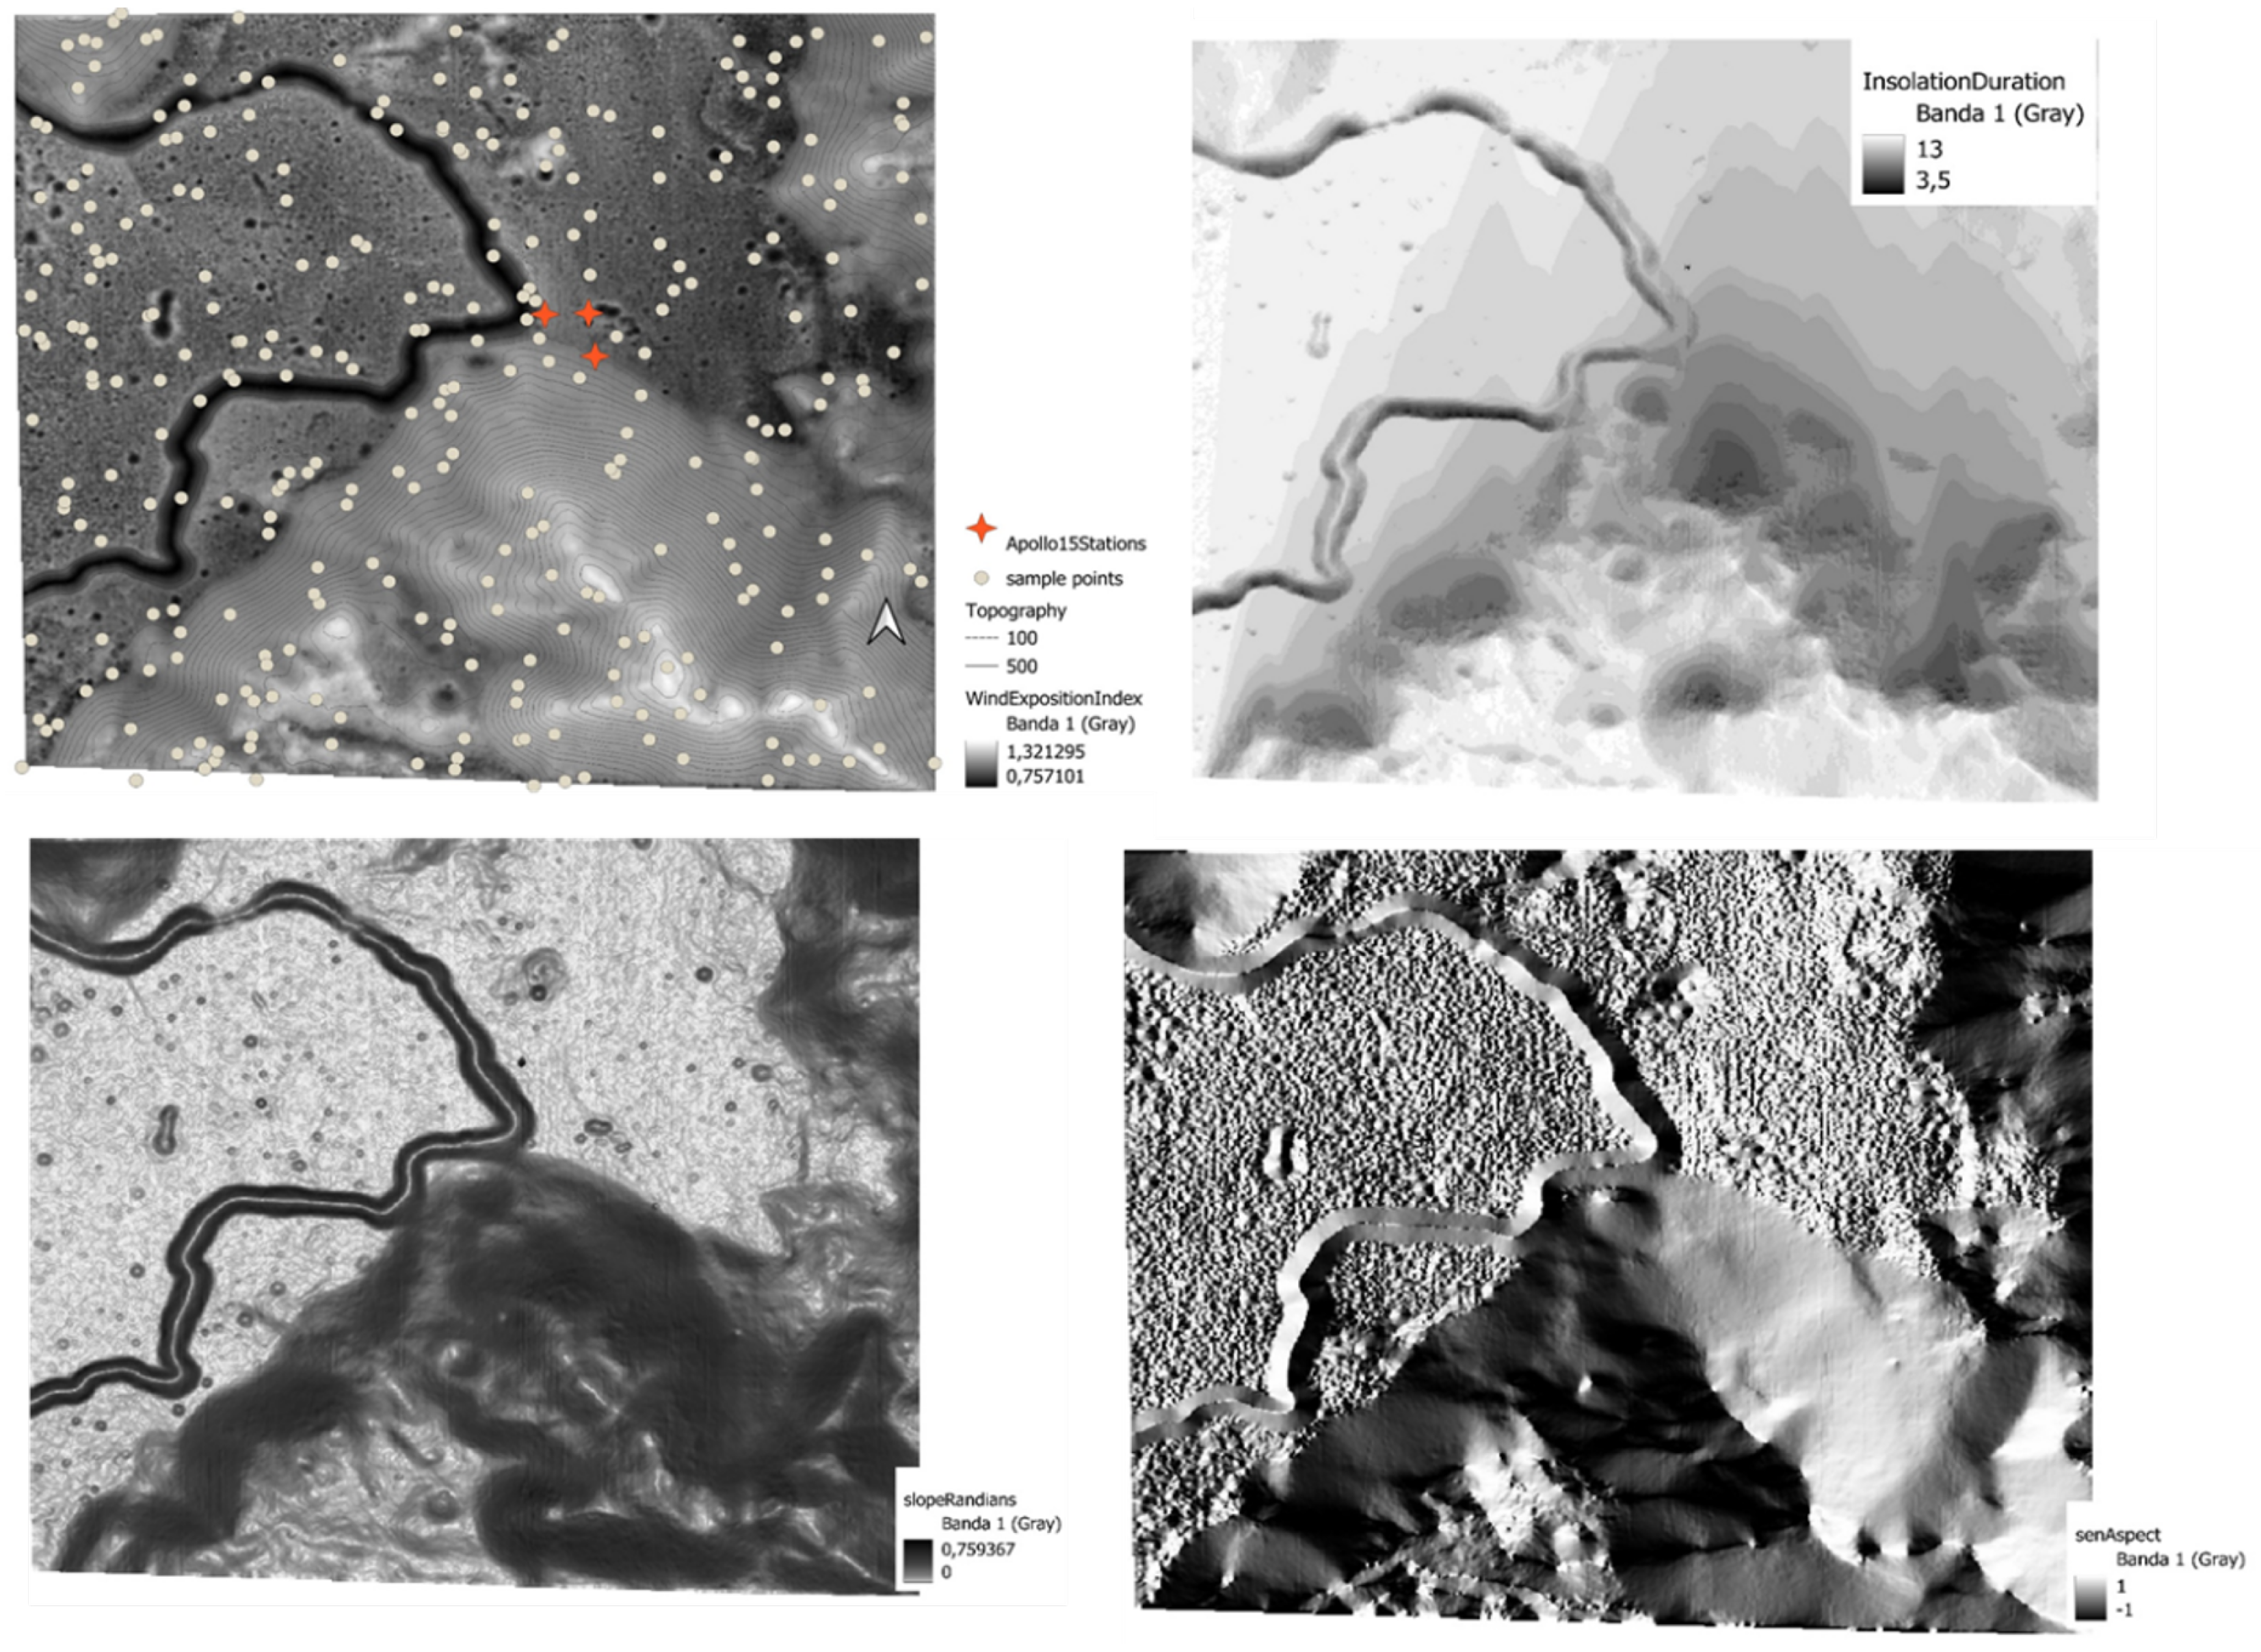
We also explored the existence of patters of lithium distribution related to different exposition of the terrains. Topographic shading controls surface solar insolation. Variations in altitude, slope, aspect, and local topographic horizon can cause substantial differences in solar radiation [46]. To obtain the MDT variables and topographic indexes we will use The System for Automated Geoscientific Analysis (SAGA). SAGA provides a set of tools ranging from the pre-processing of DEMs (e.g., filtering and filling procedures) through the generation of simple first- and second-order terrain derivatives, such as slope and curvature, to more sophisticated terrain parameters, e.g., Wind Exposition Index [47,48]. The Wind Exposition Index [49] calculates the average of wind effect from all directions using an angular step and it is a dimensionless index. The values below 1 indicate wind shadowed areas whereas those above 1 indicate areas exposed to wind. We used SAGA-Gis tool to perform a correlation analysis with Digital Terrain Models (DTMs; Altitude, Slope, Aspect, DirectInsolation and WindExposition) and values extracted from the extended models of lithium and 7 Li. The analysis was conducted in a mask polygon extracted from Lunar Orbiter Laser Altimeter (LOLA) and located around the Apollo 15 landing site. We explored the linear correlations between the Lithium and 7 Li values estimated in the models and the DTMs variables. This analysis was performed using ≈ 300 random points extracted of the polygon mask from the Apollo 15 station environment.
Figure 1.
Training area (around the Apollo 15 landing site) and points population used to test the influence of relief variables in lithium distribution
Figure 1.
Training area (around the Apollo 15 landing site) and points population used to test the influence of relief variables in lithium distribution
2.3. Dirty Ice
To explore the possibility of existence of black ice or ice mixed with regolithe with the same techniques, we used a spectral library (350-2500nm) form ices dirty with different concentration of volcanic particles (0, 2, 4 and 6 ppm of very fine, <2mm, lapilli with andesitic composition). The ice library was taken for us in laboratory with an ADS spectroradiometer. 30 ADS spectra have been taken for each of the types of ice.
Figure 2.
Setting of spectral library of ices (0, 2, 4 and 6 ppm of very fine, <2mm, lapilli with andesitic composition) In the case of dirty ices, we don’t have “ground truth” to compare or validate the results. The four ice ratios were regionalized to the entire Clementine image and visualize the results.
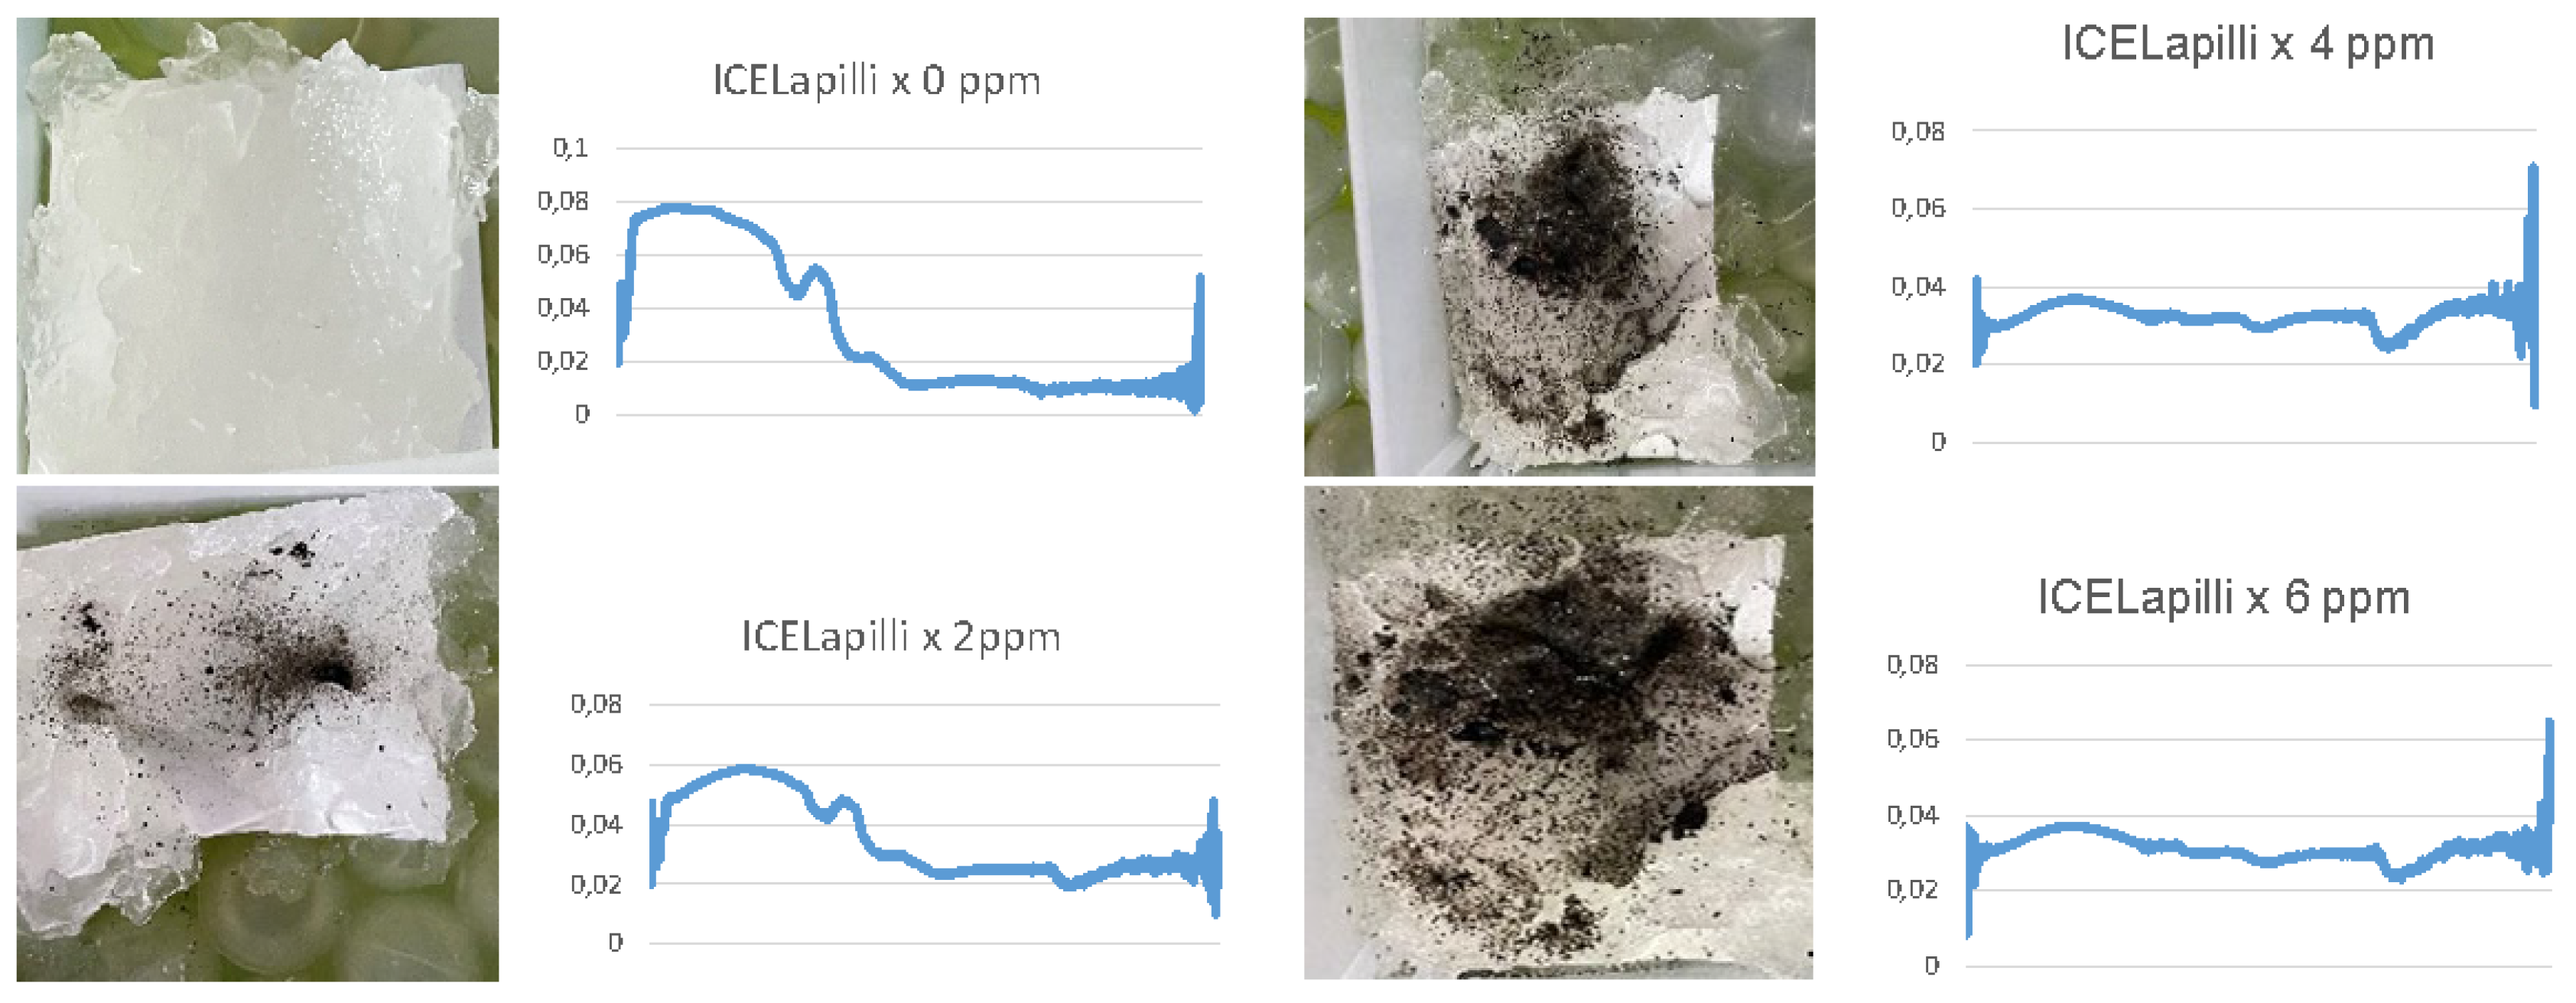
In the case of dirty ices, we did not have a “ground truth” for comparison or validation of the results. The four ice ratios were regionalized to the entire Clementine image and the results were then visualized.
3. Results and Discussion
3.1. Types of Materials and Geological Samples
By combining the RELAB spectra via Principal Component Analysis (PCA), we could identified five types of spectra (Figure 3), which presenting 5 types of lunar samples: C1_Olivine-rich basalts, C2_Silica-rich basalts, C3_High_T Mare Basalts, C4_Anorthosite and C5_Orange and glasses soils. These materials (C5) shows the highest concentrations of lithium (13.3 ppm) but lowest 7 Li (4.19‰). In the other hand we can found the Anorthosite samples with have the lowest concentration of Lithium (0.8 ppm) but the highest 7 Li ratio (8.89‰) more than double of 4‰ typical from the 7 Li of the Earth rocks.
The mineralogy of the Moon is relatively simple, most lunar rocks being dominated by mixtures of feldspar, pyroxene, olivine and ilmenite [50]. Regolith covers the main part of the surface of the Moon. The composition of the Moon’s regolithe varies depending on the area but in general is composed of a mixture of dust, small rocks, and larger boulders, and it is created from the constant bombardment of meteoroids onto the Moon’s surface over billions of years. The dust and small rocks are created by the impact of these meteoroids, which grinds the Moon’s surface into fine particles. Also, there are rock outcrops and in the highlands regions, which make up the Moon’s ancient crust, that are mmainly composed of anorthosite [4,36,51]. The younger volcanic regions known as Maria are mainly composed of basalts (high-Ti mare basalts) [52]. The lunar samples used in this study (Table 1) are compound of anorthosite, different types of basalts (high-Ti Mare basalts; basalts enrichment in Olivine and basalts with Silica) and regolith that is named as orange and glasses soil in our spectral classification. The Orange and glasses soils represents lunar regolith weathered originated and compound by impacts materials. The sample (74220) from this class shows the highest concentrations of lithium (13.3 ppm) but lowest 7 Li isotope concentration (4.19‰) (Table 1). The space weathering on the lunar surface is a continuous process and it is quite possible that these materials have formed recently and have been exposed to the solar wind for a short time [40]. On the other hand we can found the anorthosite sample (62255) with the lowest concentration of Lithium (0.8 ppm) but the highest 7 Li ratio (8.89‰) more than double of 4‰typical from the 7 Li of the Earth rocks (Table 1). It is important to highlight that anorthosite is the rock that predominates in the most ancient areas of the Moon with highest topography exposures; the vast majority of lunar feldspar is Ca-rich plagioclase [36]. The other samples compound by different types of basalts displays normal concentrations of lithium and 7 Li, similar than the basalts in the Earth.
Reflectance spectra is an important tool for exploring the Moon. These spectra are available in the form of laboratory measurements of lunar samples [45,53]. We performed a Principal Component Analysis with the 19 spectra downloaded from RELAB library (12045, 2_5058, 15475, 3_15555, 3_62255, 5_70035, 2_74220, and 2_75075). We found different number of spectra for each of the eight samples. The PCA classified the spectra into five types of spectra (Figure 1, C1-5; Table 1) presenting spectral features associated to five types of lunar substrata: C1_Olivine-rich basalts, C2_Silica-rich basalts, C3_High_Ti Mare Basalts, C4_Anorthosite and C5_Orange and glasses soils. The spectral signatures of these five types (C1-5) are characteristic for different types of substrata. Anorthosite shows two reflection peaks (at 650 and 150 nm) and two marked valleys at 1000 and 2000 nm, respectively. Orange and glasses soils do not show clear peaks or valleys, but the spectrum represent the highest coefficients with rounded values of 0.6 and 0.7 which indicate that the sample is light and bright in color. Contrary High_Ti_Mare Basalts shows reflection peaks (600 and 1700 nm), valley at 1000 nm, and the color is dark and bright. Olivine basalts displays the lowest coefficients, with a very dark color and a reflection peak found at 1000 nm, with valleys at 800 and 1500 nm, respectively.
The Orange soils (C5) seems to be related to space weathering processes. Space weathering here refers to the processes by which the optical properties of airless bodies change due to exposure to solar wind and micrometeoroid impacts. However, the difficulties of reproducing space-weathering conditions in the laboratory, or returning weathered samples to Earth, make it challenging to determine precisely how space weathering operates [53,54,55,56,57]. Remote sensing measurements, studies of lunar samples, and laboratory experiments have established that solar wind ions and micrometeoroid bombardment, weaken spectral absorption features and cause the lunar surface to darken and redden (increase in spectral continuum slope in the visible and near-infrared) overt time. These changes appear to be due to some combination of the formation of impact glasses and agglutinates [58], the regolith’s disintegration into increasingly finer soils [59], and the accumulation of nanophase iron [55,60,61]. The sample 74220 (Orange and glasses soil) was described as a clod of friable material taken 6-8 cm deep in a trench of the Shorty crater, Apollo 17 landing site. The Orange Soil was found to be enriched volatile elements (Zn, Pb, S, Cl etc) [62,63]. Generally contains significant amounts of highly-siderophile-elements (Re, Os) that seem to happen due to meteoritic contamination [64]. This information is available in the Lunar Sample Compendium compiled by Charles Meyer (https://curator.jsc.nasa.gov/lunar/lsc/index.cfm). This sample (74220) displays a relatively uniform spectra in the observed wavelength range (Figure 2). This can occur when the sample is uniform in texture and composition and does not have strongly defined absorption or reflection characteristics in the Visible-Near Infrared regions due to the lack of specific functional groups that interact significantly with that region of the spectrum. In addition, the sample shows high coefficients indicating that the sample has the property of reflecting light efficiently [40]. In order to obtain values of spectral indexes for the eight moon samples, we extended the indexes to entire Clementine image using raster calculator of QGis. In Figure 4, we can see the cartographic expression of C5 (Orange and glasses soils) index crossing with the Apollo sample 74220. The index reaches a value of 0.92 for the location of this sample. C5 index involves the ClemVis2 and ClemNir2 bands. This makes the mapping of the sensor manifest the contact between the passes of the sensor giving anomalous cartographic figures in the contact between passes. However, the value taken by the sample (74220) in the index is consistent with its geological nature.
Figure 4.
Detailed of cartographic expression of C5 (Orange and glasses soils) spectral index crossing with the Apollo sample 74220.
Figure 4.
Detailed of cartographic expression of C5 (Orange and glasses soils) spectral index crossing with the Apollo sample 74220.
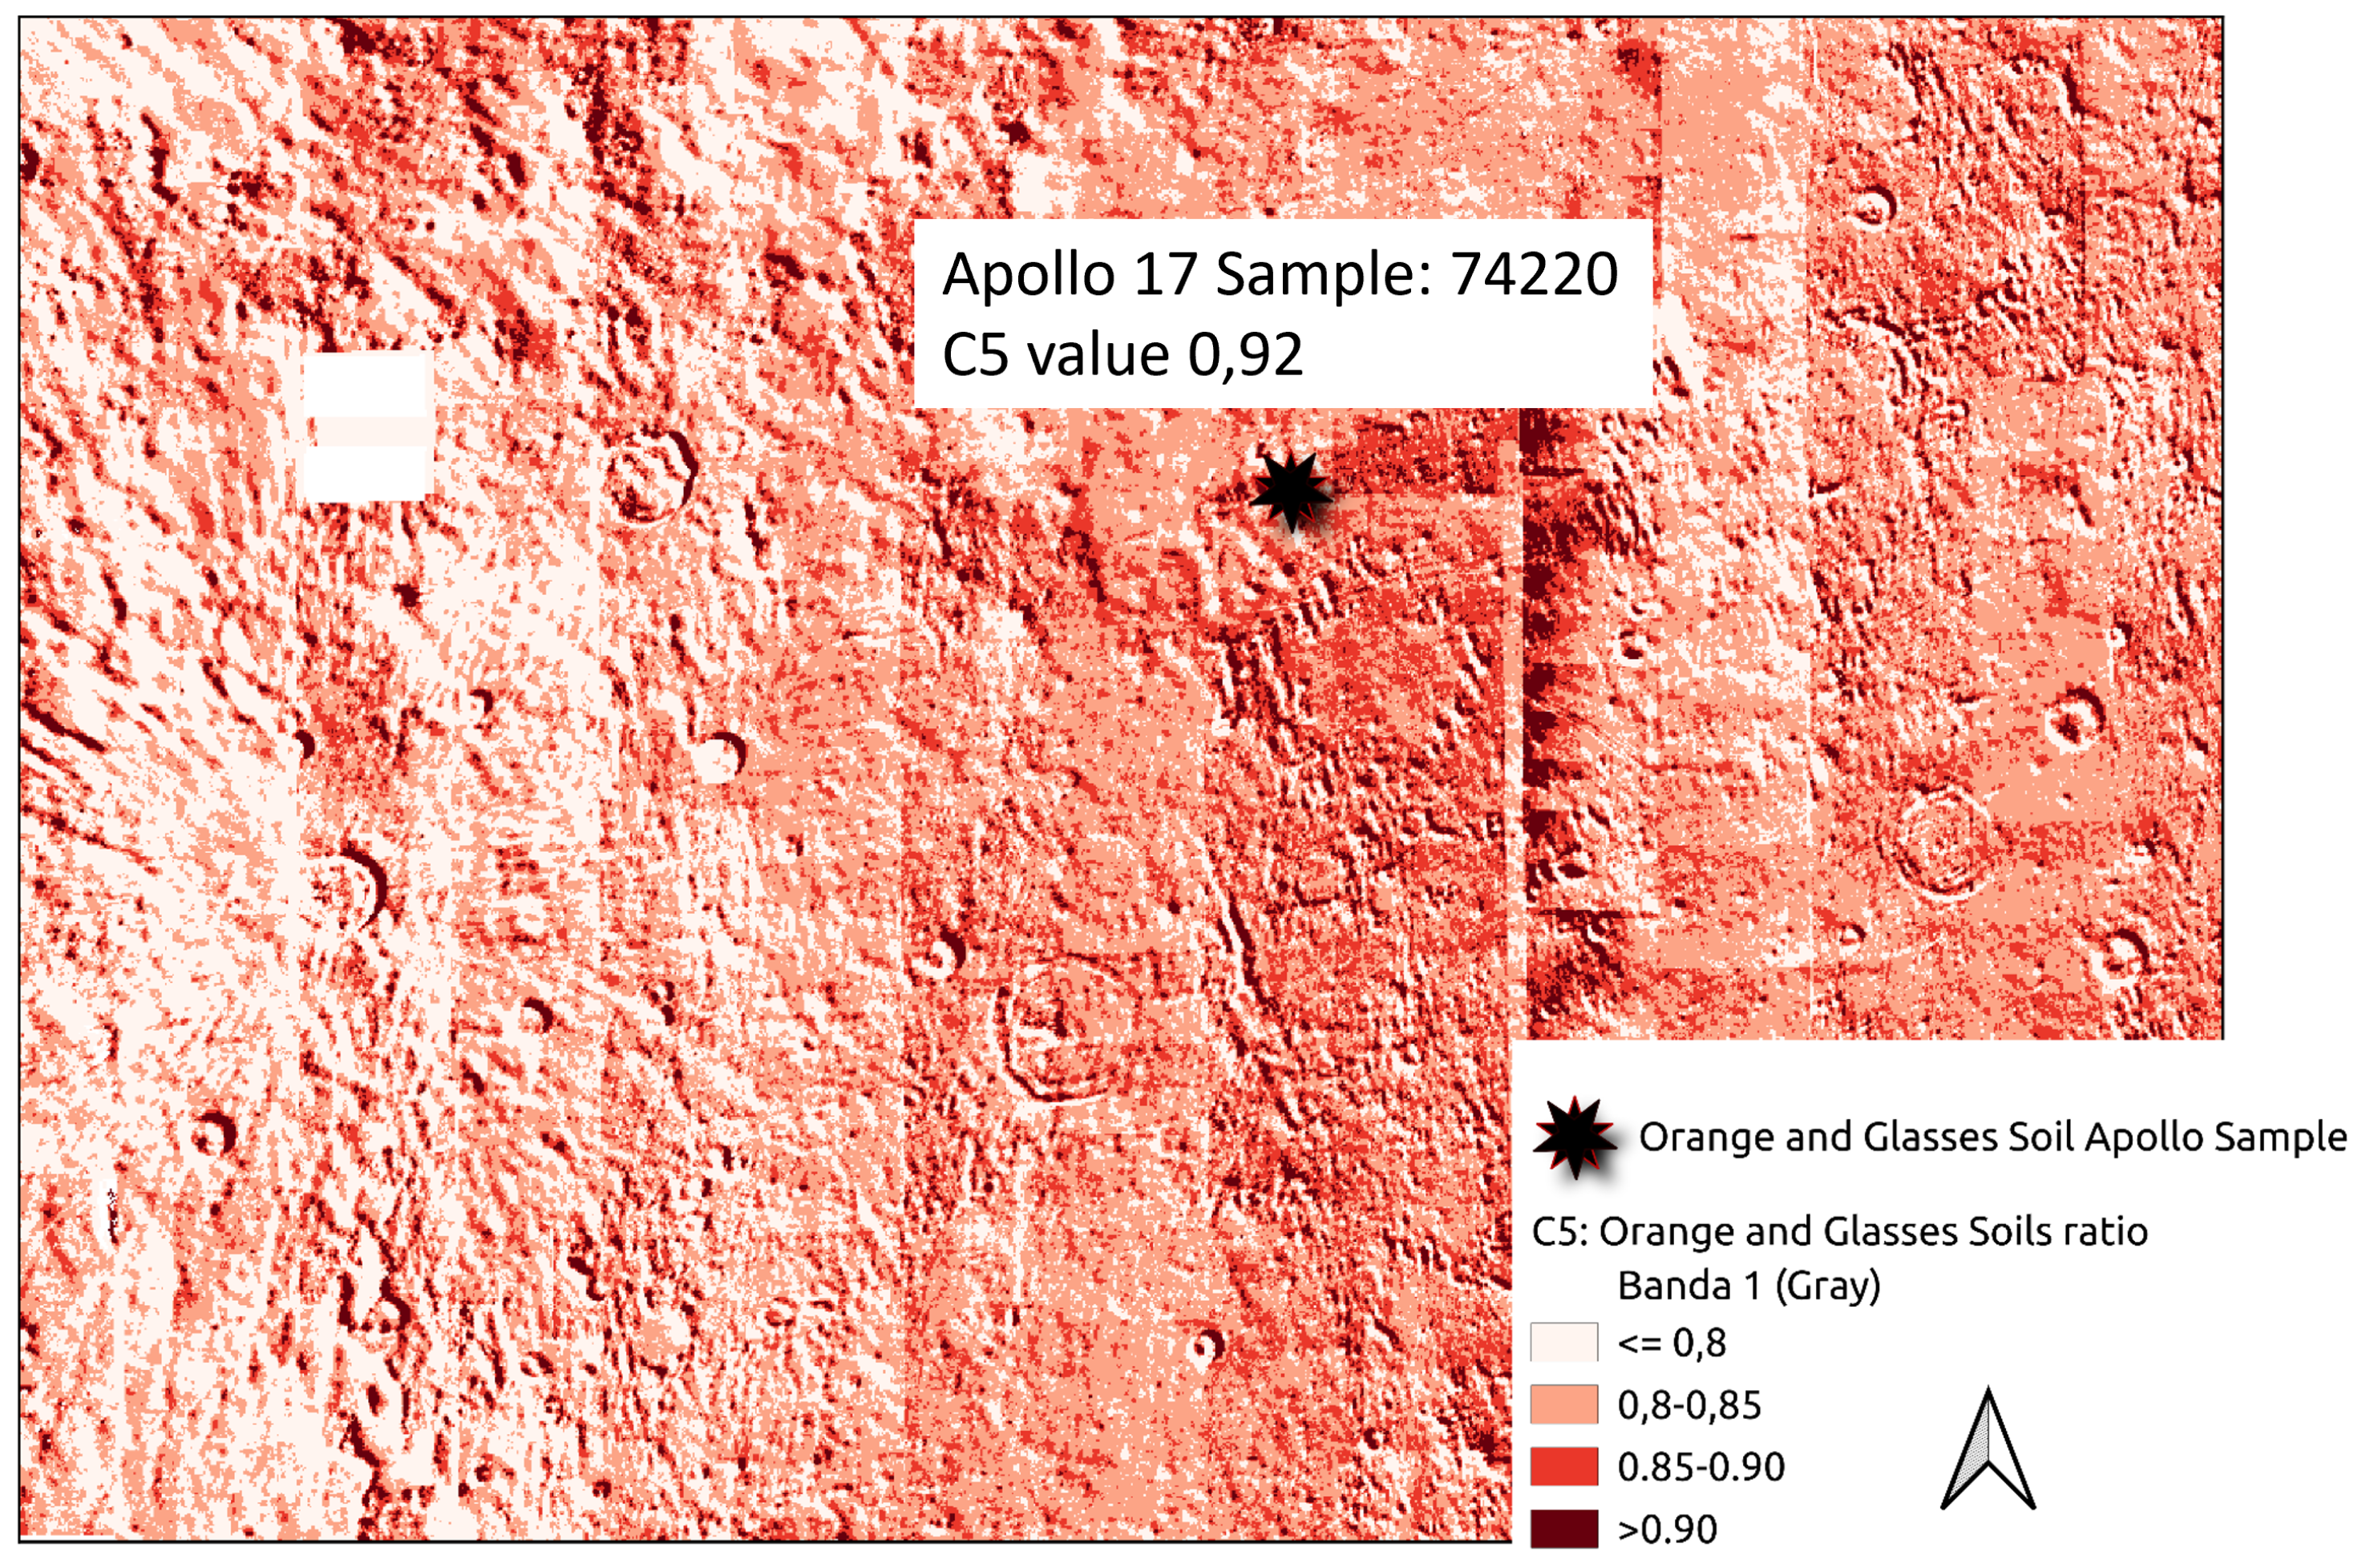

Table 2.
Correlations between variables, lithium and 7 Li.
| R Pearson | Lithium (ppm) | 7 Li (‰) |
|---|---|---|
| C1 | 0.47 | 0.23 |
| C2 | -0.41 | -0.27 |
| C3 | -0.44 | -0.24 |
| C4 | 0.21 | 0.57 |
| C5 | 0.45 | 0.18 |
| ClemVis1 | -0.64 | 0.92 |
| ClemVis2 | -0.73 | 0.87 |
| ClemVis3 | -0.69 | 0.88 |
| ClemVis4 | -0.68 | 0.87 |
| ClemVis5 | -0.69 | 0.87 |
| ClemNir1 | -0.89 | 0.57 |
| ClemNir2 | -0.89 | 0.59 |
| ClemNir3 | -0.87 | 0.49 |
| ClemNir4 | -0.80 | 0.27 |
| ClemNir5 | -0.60 | -0.11 |
| ClemNir6 | -0.79 | 0.25 |
Other authors have also used Clementine images to relate the color of minerals with the composition of the surface. The presence of the silicate minerals has been detected in the Clementine data set [65], and the presence of ilmenite was inferred from empirical relationships between lunar color and Ti-content of lunar basalts [66,67]. Maps of the mineralogy of the lunar surface derived from the analysis of about 400,000 lunar spectra obtained by Clementine mission were presented years ago. The analysis was based upon an inversion of a radiative transfer model that predicts spectral reflectance properties from the relative abundance of the lunar minerals, their major element chemistry, grain size and properties related to space weathering.
3.2. Linear Correlations between Clementine Bands, Spectral Ratios and Lithium Concentration
Our analysis revealed an excellent linear correlation between the spectral parameters and lithium content of the lunar samples. Although the sample population is very small (only 8 samples), the correlations are statistically significant (Table 2). The most noteworthy aspect of Table 2 is that the correlations have a negative sign for lithium concentrations and a positive one for the 7 Li isotope. The lithium concentration shows the highest correlations with NIR bands, in special with Nir1 (1100nm) and Nir2 (1250 nm) that determines a C1 of 0.47 (Olivine basalts) and a C5 of 0.48 (Orange and glasses soils index). On the other hand 7 Li shows the highest correlations to visible bands, in special with Vis1 (450nm) with R of 0.92. To respect the spectral indexes 7 Li have positive and significant correlation with C4 0.7) which represent the Anorthosite spectral index. While the sample size is small (only 8 samples), the study highlights statistically significant correlations. This is an important point to discuss as it implies a robust relationship despite of the limited data availability. These correlations have encouraged us to perform Linear Regression Analyses (LRM) with the idea of exploring the possibility of estimating lithium concentrations from spectral indexes and Clementine bands. However, the small sample size also suggests the need for caution in generalizing these findings without further research.
Moreover, the observation where the correlations have a negative sign for lithium concentrations but a positive sign for the 7 Li isotope is intriguing. This indicates different spectral behaviours for overall lithium versus its specific isotope, which could have implications for understanding lunar geology and the processes affecting lithium distribution. The high correlation of lithium concentration with NIR bands, especially Nir1 (1100 nm) and Nir2 (1250 nm), is noteworthy. This suggests that NIR spectroscopy could be a valuable tool in identifying lithium-rich areas on the Moon and perhaps is an indication of suitability for use the Christiansen Factor (CF) and the Diviner mission. The strong correlation of the 7 Li isotope with visible bands, particularly Vis 1 (450 nm), should be discussed. If we look at the C4 index (Anorthosite) in Figure 3, we can see that there is a very marked peak of reflection in the visible region. This substrate shows the highest concentrations of 7 Li. The strong correlation with this band could be related with the strong response of Anorthosite in the visible bands of spectrum or different surface processes or mineral compositions affecting 7 Li distribution, separate from overall lithium.
3.3. LRMs
We completed a large number of LRM analyses, with the most interesting results shown in Table 3. In summary, C4 spectral ratio that represent Anortosite 0.623), C5 spectral ratio corresponding to Orange and glasses soils (-0,495) and ClemVis1_450nm 0.736) are the variables that best explained the variability of the 7 Li‰ in a LRM (R2 → 0.9) with a standard error of 0.53. However, int the case of the lithium concentration the ClemNir1_1100nm band (-7.233), C5 (-0.539) and ClemNir2_1250 nm band (6.106) better explained the spatial variability. We think that these results, specially the importance of Anortosite ratio (C4) in the explanation of spatial variability of 7 Li and the importance of C5 in the lithium concentration model, could be related to the origin of the measured lithium concentration.
Table 3.
Summary of LRM for lithium and 7 Li selected to be extended to the entire Clementine image. The Adjusted represent the robustness of models.
Table 3.
Summary of LRM for lithium and 7 Li selected to be extended to the entire Clementine image. The Adjusted represent the robustness of models.
| (a) Regression Summary for Dependent Variable: 7 Li(%o); R= 0.97333231; = 0.94737579; Adjusted = 0.90790763; p<0.0051; Std.Err 0.526 | |||||
|---|---|---|---|---|---|
| Beta | Std.Err. | B | Std.Err | p-level | |
| Intercept | 2.615 | 2.010 | 0.263 | ||
| C4 | 0.623 | 0.226 | 8.924 | 3.243 | 0.051 |
| C5 | -0.495 | 0.204 | -7.468 | 3.082 | 0.073 |
| ClemVis1 | 0.736 | 0.137 | 60.845 | 11.337 | 0.006 |
| (b) Lithium(ppm) R= 0.95159092; = 0.90552528; Adjusted = 0.83466924; p<0.01620 Std.Err: 1.4782 | |||||
| Beta | Std.Err. | B | Std.Err | p-level | |
| Intercept | 64.760 | 20.821 | 0.036 | ||
| ClemNir1 | -7.233 | 3.581 | -672.392 | 332.918 | 0.114 |
| C5 | -0.539 | 0.251 | -74.410 | 34.623 | 0.098 |
| ClemNir2 | 6.106 | 3.501 | 536.480 | 307.561 | 0.156 |
The importance of the ClemNir2 band in various lunar basalts and its connection to the geogenetic origin of lithium is notable. This connection suggests that the spectral features might be indicative of the underlying geological processes influencing lithium distribution. The correlation of the C4 spectral ratio (Anorthosite) with 7 Li and the findings from [3] about the oldest anorthosite sample having the lowest lithium concentration but the highest 7 Li concentration are significant. This could indicate that spallation processes and weathering by the solar wind play a significant role in altering the isotopic composition of lithium in these lunar samples. While these results are promising, they underscore the need for more extensive research to understand the complex interactions between lunar geology, solar wind exposure, and the resulting chemical and isotopic composition of lunar materials.
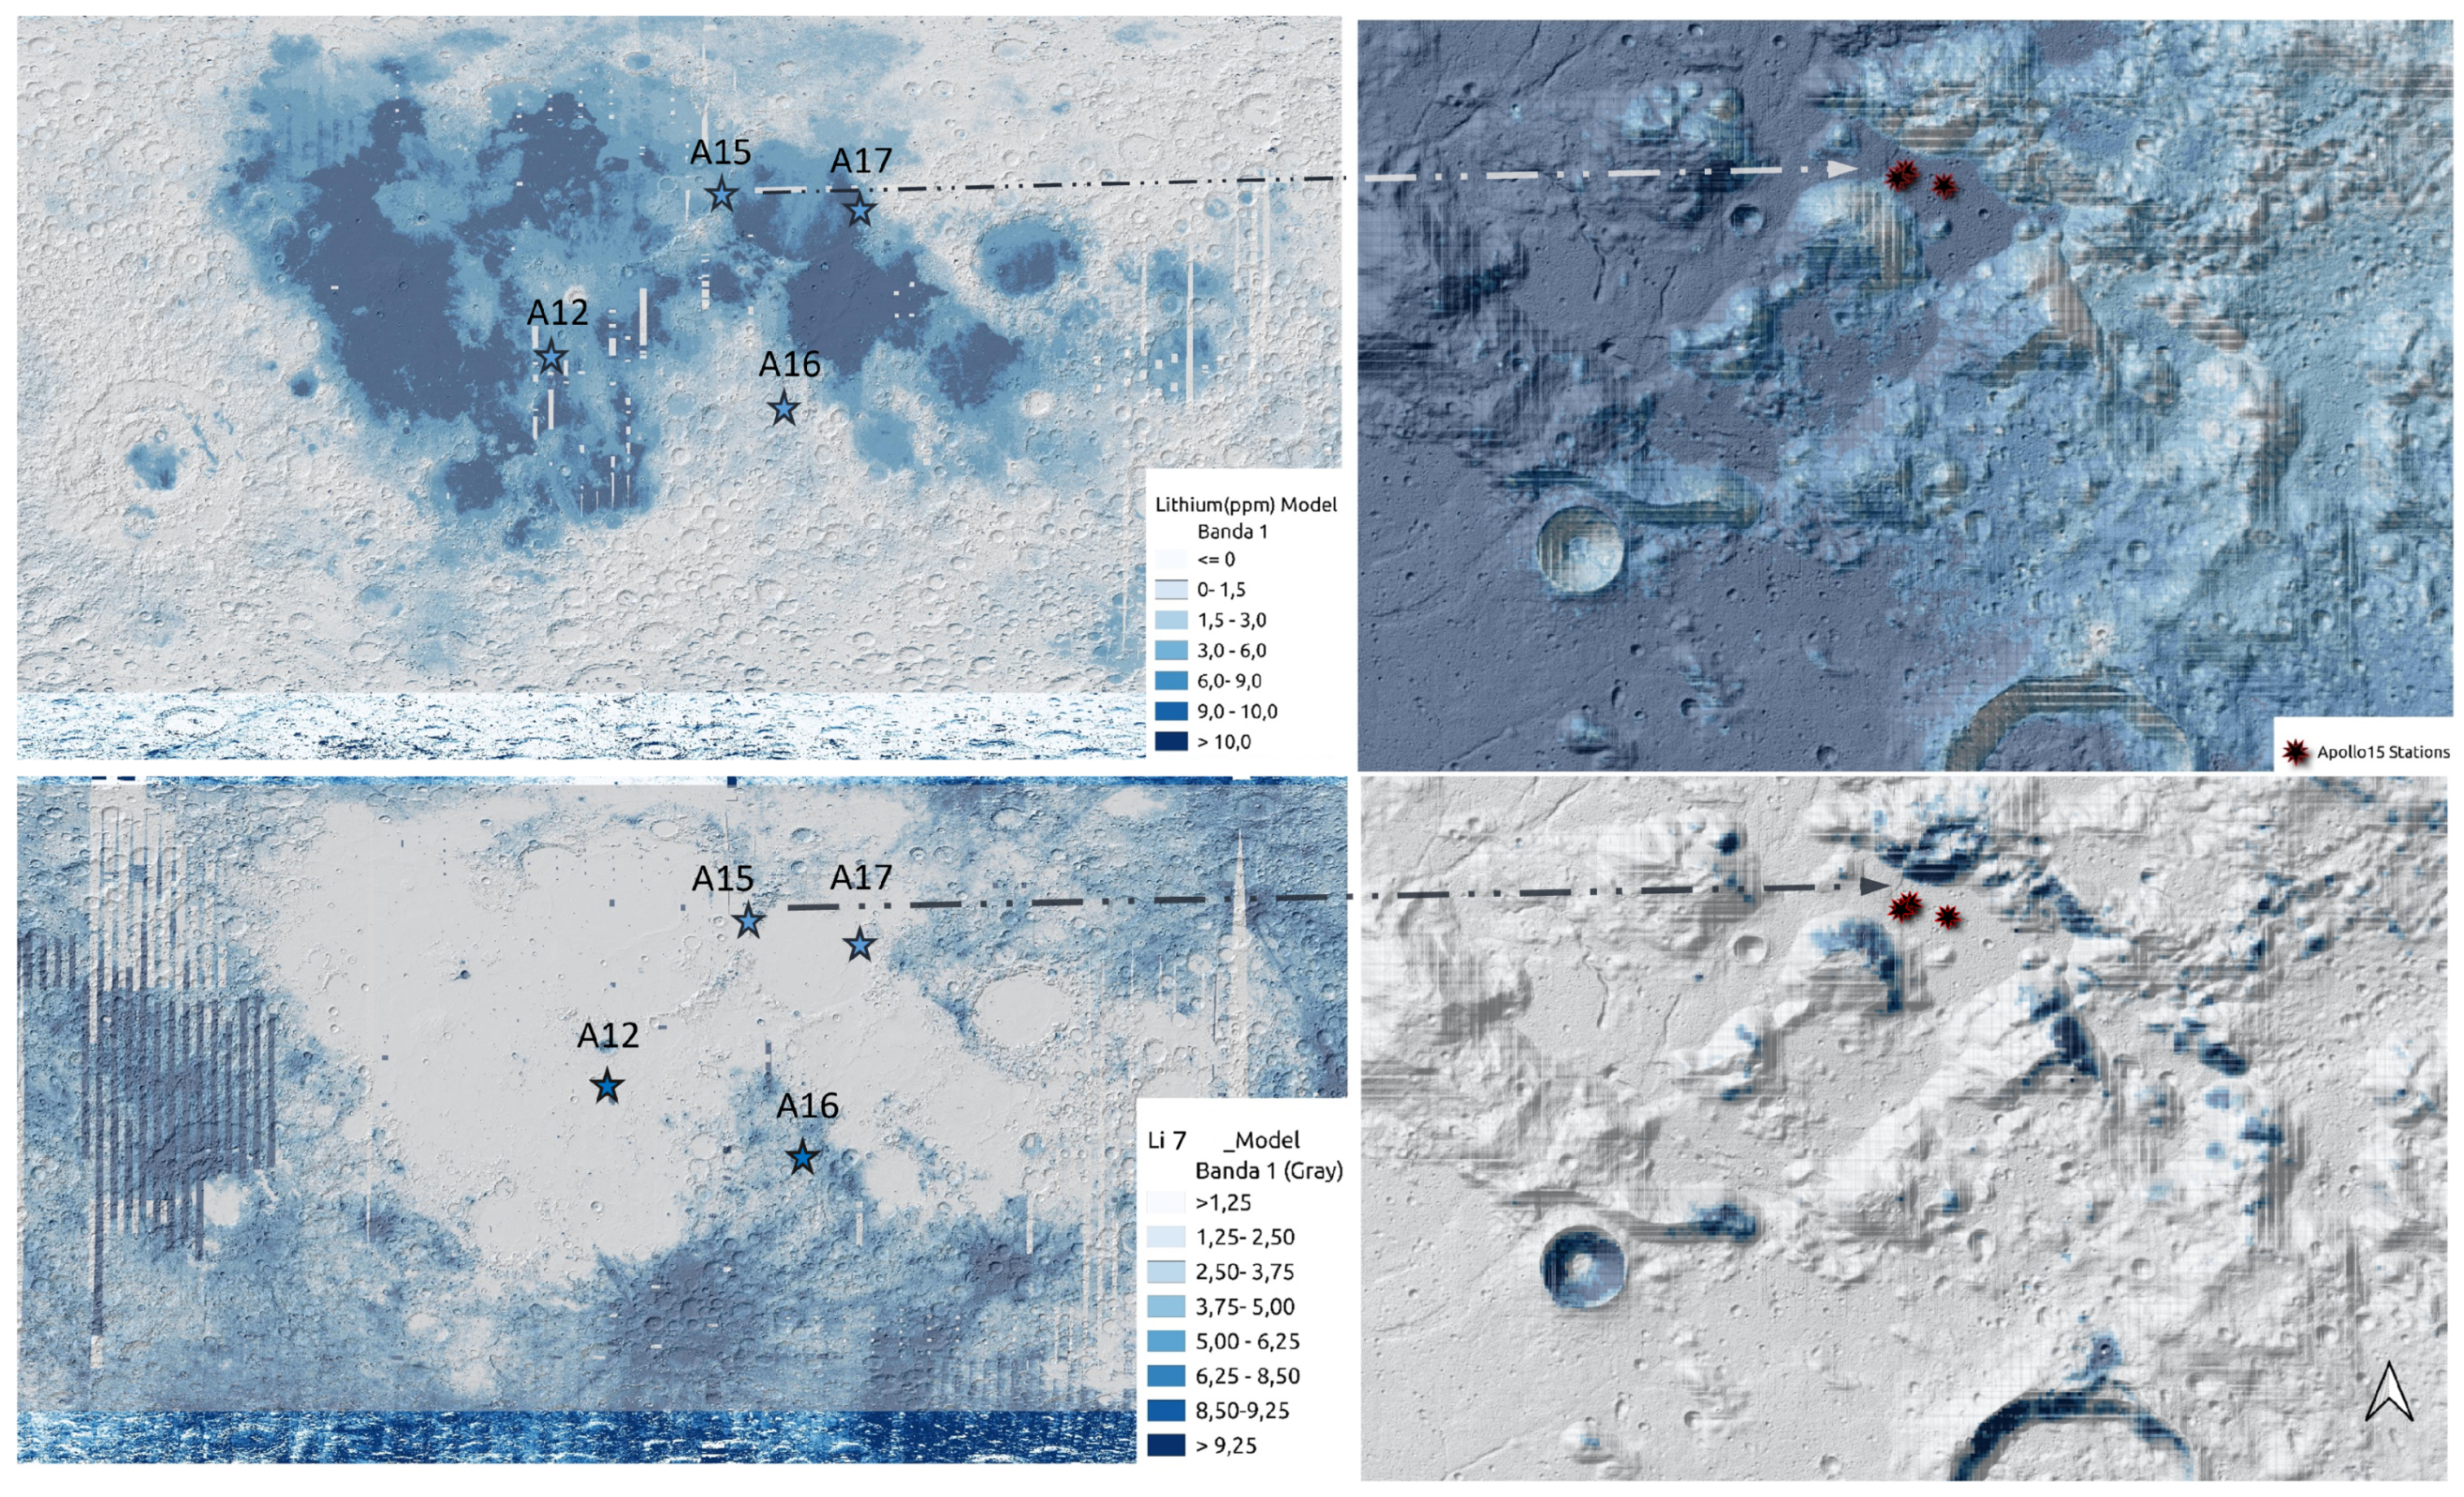
3.4. Maps of Lithium and 7 Li
The linear equations were translated into the Clementine image using QGis 3.34 raster calculator, resulting in two maps, one for lithium and another for 7 Li‰ (Figure 4). In this figure we can see details of the maps near the Apollo 15 landing zone, where the concentration of lithium is higher in relation to basaltic areas of the Moon. This distribution is consistent with a geogenetic origin of the lithium [3]. On the other side, putting together the extended models of 7 Li and the LOLA_DEM, the image reveals that 7 Li appears to be more concentrated in the highly cratered highlands. By analyzing the spatial patterns and their relationships with topography we have concluded that 7 Li may have a cosmogenic origin due to space weathering. Space weathering, involving changes in optical properties due to solar wind and micrometeoroid impacts [40], could significantly affect the isotopic composition of lunar materials. These processes could be behind the high correlations shown by 7 Li with the visible bands of the clementine images (Table 2). Analyzing the spatial patterns of 7 Li in relation to lunar topography could yield valuable insights into the Moon’s geological history and the impact of external factors like solar wind. The relationship between topography and isotope concentrations could reveal much about the Moon’s exposure to space weathering processes over time.
Figure 5.
Extended lithium (ppm) and 7 Li ‰estimation models. Detailed mapping in the area of Apollo 15 landing site. The base maps are Clementine image (500m/pixel) and LOLA (50m/pixel). The projection system is GCS_moon_2000.
Figure 5.
Extended lithium (ppm) and 7 Li ‰estimation models. Detailed mapping in the area of Apollo 15 landing site. The base maps are Clementine image (500m/pixel) and LOLA (50m/pixel). The projection system is GCS_moon_2000.
In Figure 6, we can see an attempt to validate the extended models with the 8 samples we have analysed. The model of 7 Li seems to be more accurate (R2→0.866) than the model of lithium (R2→0.75). The lithium model tends to overestimate the values. These findings may have implications for future lunar exploration, particularly in identifying areas of interest for resource utilization or further geological study. The spatial distribution of elements such as lithium and their isotopes is crucial for scientific understanding and practical applications.
3.5. Relations with the DTMs
To further analyze the possible influence of the solar wind on the distribution of 7 Li, we performed a GIS analysis in the environment of the Apollo 15 landing zone. This area was selected because it contains 3 moon samples of basalts (15058, 15475, 15555) that display very homogeneous values of lithium and 7 Li between them and the highest accuracy models (e.g. 15058: 7.5; 15475: 6.8; 15555: 6.5 ppm of lithium). The study analyzed a random population of approximately 300 samples and examined the correlations between relief variables derived from DEM_LOLA and lithium and 7 Li concentrations. The results are shown in Figure 7. It is observed that relief variables have a negative correlation with lithium concentrations, indicating that lithium is more concentrated in flat, depressed, and underexposed areas. Additionally, 7 Li exhibits low but statistically significant positive correlations with the wind exposition index, slope, and sine of the aspect.
Analyzing a random population of about 300 samples can provide a substantial dataset for a more comprehensive understanding of the spatial distribution and environmental factors affecting lithium and 7 Li concentrations. It is significant that relief variables are negatively correlated with lithium concentrations. Areas of the lunar surface that are flatter, lower in elevation, or less exposed to external elements tend to have higher lithium concentrations. These areas coincide with the depressed zones occupied by the Maria (Figure 4), thus lithium appears to be closely related to geological processes on the Moon. The correlation of 7 Li with variables related to wind exposure supports the hypothesis that the solar wind may play a role in the distribution and creation of this isotope on the lunar surface. This finding has significant implications for our understanding of lunar geology and the impact of extraterrestrial factors, such as solar wind, on lunar materials. This result is consistent with the theory proposed by [46] regarding topographic solar radiation, which suggests that areas more exposed to solar wind exhibit a different isotopic composition. The GIS analysis provides valuable insights into the spatial distribution of lithium and the 7 Li isotope on the Moon, indicating a significant influence of topographical features and solar wind exposure.
3.6. Dirty ice
In Figure 8 we can see the types of Vis_ Nir (350_2500nm) spectra obtained for the dirty ices found in Figure 2. Six spectral ratios were obtained according to Eq. 1 and extended to the entire clementine image using QGis raster calculation.
Only one index has shown any cartographic pattern that can be interpreted with geomorphological criteria regarding the possibility of finding ice in the lunar regolith. The index corresponds to ice with 6 ppm of lapilli.
Figure 9.
Example of regolithe with ice probability distribution.
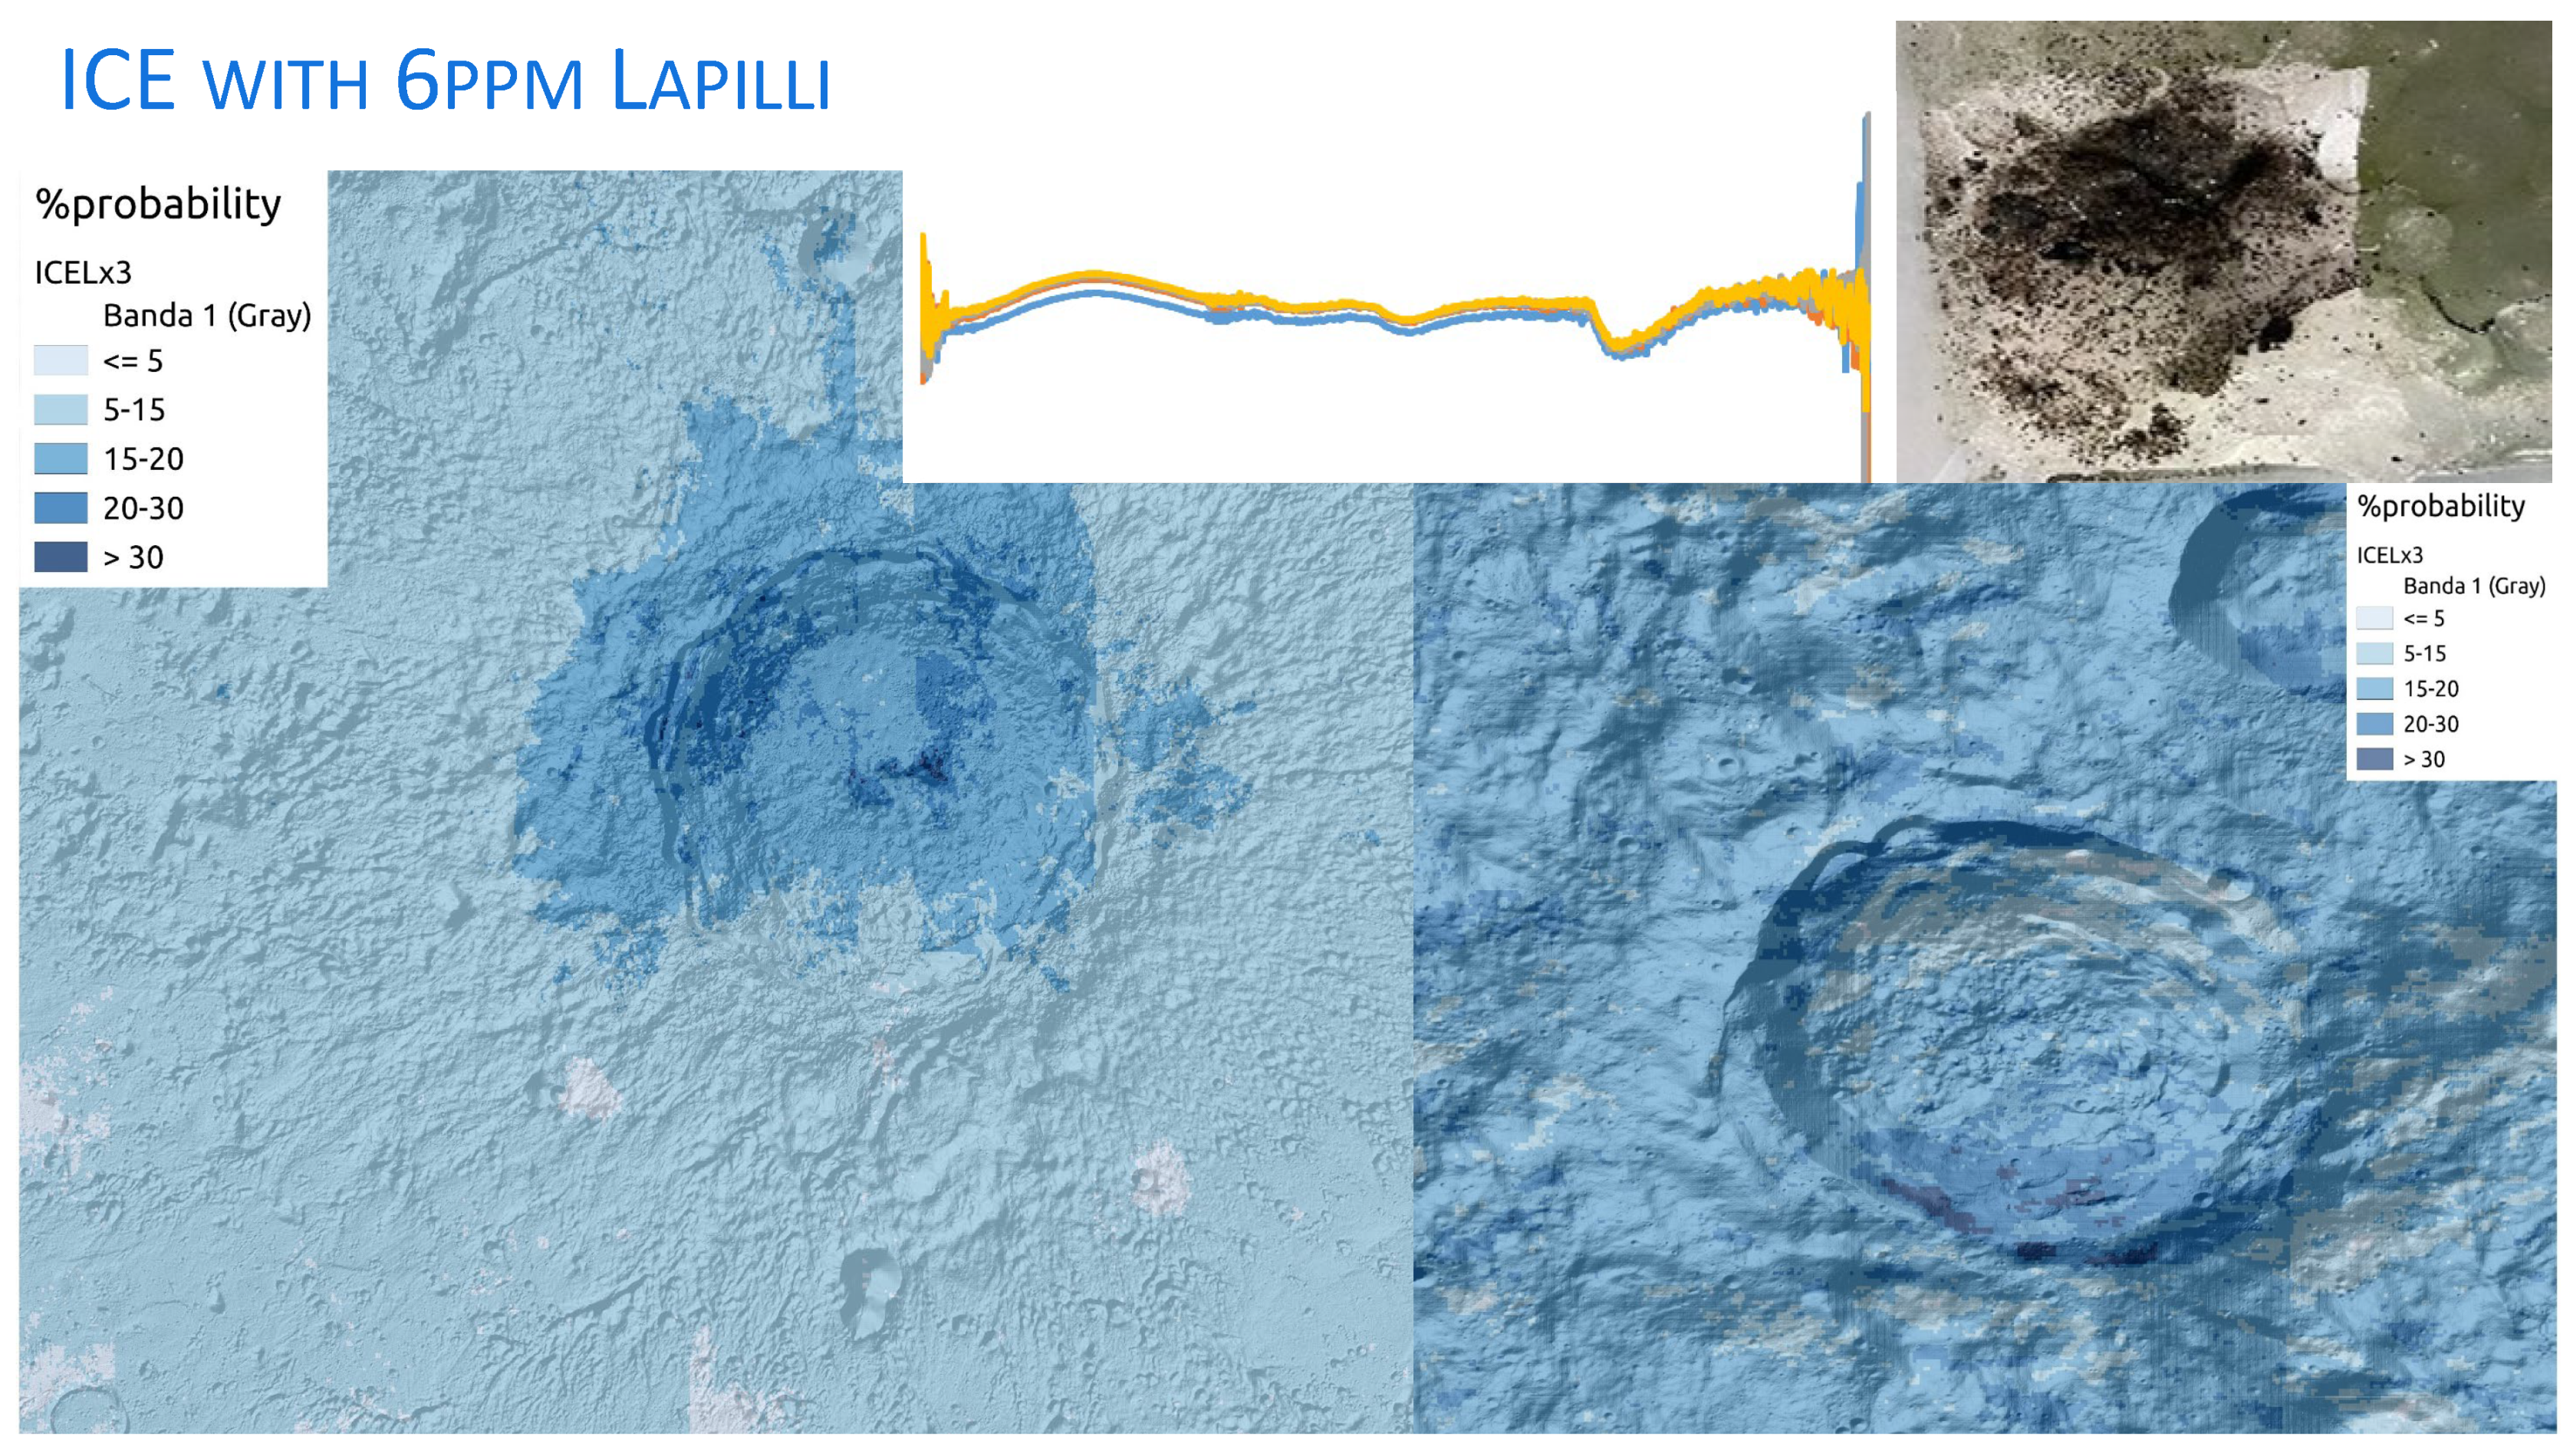
Based on the initial screening, it appears that areas near the South Pole of the Moon, specifically crater rims and impact-ejected material, are most likely to contain ice mixed with regolith. This proposition will be further explored using high-resolution images from China’s missions such as Lunar Reconnaissance Orbiter (LRO) [29], Chandrayaan-1 [68], or Chang’e Program [12].
4. Conclusions
Linear regression models, GIS analysis, and spectral data interpretation are powerful tools in lunar research. They provide a deeper understanding of the distribution of elements and minerals on the Moon, leading to important conclusions about lunar geology Several important conclusions can be drawn about lunar geology and the distribution of lithium and its isotopes on the Moon’s surface based on the results. The presence of lithium on the Moon appears to have a geogenetic origin, with higher concentrations in basaltic areas. This suggests that lithium has accumulated in these regions due to specific geological processes of the Moon’s past. The findings also suggest that the isotope 7 Li may have a cosmogenic origin, influenced by space weathering. The conclusion that long-term exposure to extraterrestrial factors has affected the distribution of lithium is supported by the positive correlation of 7 Li with areas exposed to solar wind. The distribution of lithium and 7 Li is clearly related to the Moon’s topographical features. Lithium concentrates in flatter, less exposed areas, while 7 Li is more prevalent in the highly cratered highlands. These findings are important for future lunar exploration missions as they provide valuable insights into the potential locations of resources such as lithium. This is especially relevant for long-term human settlement missions where local access to resources like lithium could be crucial. Although these results are significant, further studies are needed to fully understand the geological and cosmogenic processes that affect the composition of the Moon’s surface. In summary, the results present a comprehensive view of the distribution and potential origins of lithium and its isotopes on the Moon, highlighting the influence of both geological and extraterrestrial factors. These findings enhance our understanding of lunar geology and offer new opportunities for exploring and utilizing lunar resources. However, this is only a preliminary exploration, as this approach cannot be directly validated and applied to map the lithium of the lunar surface due to the limited number of samples (8) with measured lithium concentration. This limitation is common in geological planetary exploration. The use of the spectral library RELAB could serve to improve this point. In regards to the presence of dirty ice in rims and ejected material of craters located near the South Pole, it is a proposition that we will continue to explore with high-resolution images from Lunar Reconnaissance Orbiter (LRO), Chandrayaan-1, Kaguya (SELENE), or the Chang’e Program from China missions.
Author Contributions
Conceptualization, SC.F.; methodology, SC.F and J.R.; software, R.M.; validation, SC.F., E.D. and JF.C.; formal analysis, SC.F. and JM.F; investigation, SC.F. and R.M.; resources, FJ.C.; data curation, E.D. and JF.C.; writing—original draft preparation, SC.F.; writing—review and editing, R.M.; visualization, SC.F. and R.M.; supervision, JM.F, J.R. and JF.C; project administration, SC.F.; funding acquisition, FJ.C. All authors have read and agreed to the published version of the manuscript.
Funding
This research and the APC were funded by the Principality of Asturias, Spain, grant number AYUD/2021/51301.
Informed Consent Statement
Not applicable.
Data Availability Statement
Publicly available datasets were analyzed in this study. These data can be found here: https://sispec.cnr.it/index.php.
Acknowledgments
We gratefully acknowledge the open-access data provided by the Orbital Data Explorer and RELAB. This valuable resource has significantly contributed to the research findings presented in this paper.
Conflicts of Interest
The authors declare no conflicts of interest.
References
- Fisher, E.A.; Lucey, P.G.; Lemelin, M.; Greenhagen, B.T.; Siegler, M.A.; Mazarico, E.; Aharonson, O.; Williams, J.P.; Hayne, P.O.; Neumann, G.A.; others. Evidence for surface water ice in the lunar polar regions using reflectance measurements from the Lunar Orbiter Laser Altimeter and temperature measurements from the Diviner Lunar Radiometer Experiment. Icarus 2017, 292, 74–85. [Google Scholar] [CrossRef] [PubMed]
- Hayne, P.O.; Hendrix, A.; Sefton-Nash, E.; Siegler, M.A.; Lucey, P.G.; Retherford, K.D.; Williams, J.P.; Greenhagen, B.T.; Paige, D.A. Evidence for exposed water ice in the Moon’s south polar regions from Lunar Reconnaissance Orbiter ultraviolet albedo and temperature measurements. Icarus 2015, 255, 58–69, Lunar Volatiles. [Google Scholar] [CrossRef]
- Magna, T.; Wiechert, U.; Halliday, A.N. New constraints on the lithium isotope compositions of the Moon and terrestrial planets. Earth and Planetary Science Letters 2006, 243, 336–353. [Google Scholar] [CrossRef]
- Ohtake, M.; Matsunaga, T.; Haruyama, J.; Yokota, Y.; Morota, T.; Honda, C.; Ogawa, Y.; Torii, M.; Miyamoto, H.; Arai, T.; others. The global distribution of pure anorthosite on the Moon. Nature 2009, 461, 236–240. [Google Scholar] [CrossRef]
- Lucey, P.G. Mineral maps of the Moon. Geophysical Research Letters 2004, 31. [Google Scholar] [CrossRef]
- Colaprete, A.; Schultz, P.; Heldmann, J.; Wooden, D.; Shirley, M.; Ennico, K.; Hermalyn, B.; Marshall, W.; Ricco, A.; Elphic, R.C.; others. Detection of water in the LCROSS ejecta plume. science 2010, 330, 463–468. [Google Scholar] [CrossRef] [PubMed]
- Charette, M.P.; McCord, T.B.; Pieters, C.M.; Adams, J.B. Application of Remote Spectral Reflectance Measurements to Lunar Geology Classification and Determination of Titanium Content of Lunar Soils. Journal of Geophysical Research 1974, 79, 1605–1613. [Google Scholar] [CrossRef]
- Adler, I.; Trombka, J.; Gerard, J.; Lowman, P.; Schmadebeck, R.; Blodget, H.; Eller, E.; Yin, L.; Lamothe, R.; Osswald, G.; others. Apollo 16 geochemical X-ray fluorescence experiment: Preliminary report. Science 1972, 177, 256–259. [Google Scholar] [CrossRef]
- Swinyard, B.; Joy, K.; Kellett, B.; Crawford, I.; Grande, M.; Howe, C.; Fernandes, V.; Gasnault, O.; Lawrence, D.; Russell, S.; others. X-ray fluorescence observations of the Moon by SMART-1/D-CIXS and the first detection of Ti Kα from the lunar surface. Planetary and Space Science 2009, 57, 744–750. [Google Scholar] [CrossRef]
- Athiray, P.; Narendranath, S.; Sreekumar, P.; Dash, S.; Babu, B. Validation of methodology to derive elemental abundances from X-ray observations on Chandrayaan-1. Planetary and Space Science 2013, 75, 188–194. [Google Scholar] [CrossRef]
- Fa, W.; Zhu, M.H.; Liu, T.; Plescia, J.B. Regolith stratigraphy at the Chang’E-3 landing site as seen by lunar penetrating radar. Geophysical Research Letters 2015, 42, 10–179. [Google Scholar] [CrossRef]
- Li, C.; Zuo, W.; Wen, W.; Zeng, X.; Gao, X.; Liu, Y.; Fu, Q.; Zhang, Z.; Su, Y.; Ren, X.; others. Overview of the Chang’e-4 mission: Opening the frontier of scientific exploration of the lunar far side. Space Science Reviews 2021, 217, 1–32. [Google Scholar] [CrossRef]
- Metzger, A. Composition of the Moon as determined from orbit by gamma-ray spectroscopy, in Remote Geochemical Analysis: Elemental and Mineralogical Composition. Cambridge Univ. Press, New York 1993.
- Lawrence, D.; Feldman, W.; Barraclough, B.; Binder, A.; Elphic, R.; Maurice, S.; Thomsen, D. Global elemental maps of the Moon: The Lunar Prospector gamma-ray spectrometer. Science 1998, 281, 1484–1489. [Google Scholar] [CrossRef] [PubMed]
- Lawrence, D.; Feldman, W.; Barraclough, B.; Binder, A.; Elphic, R.; Maurice, S.; Miller, M.; Prettyman, T. Thorium abundances on the lunar surface. Journal of Geophysical Research: Planets 2000, 105, 20307–20331. [Google Scholar] [CrossRef]
- Prettyman, T.H.; Hagerty, J.; Elphic, R.; Feldman, W.; Lawrence, D.; McKinney, G.; Vaniman, D. Elemental composition of the lunar surface: Analysis of gamma ray spectroscopy data from Lunar Prospector. Journal of Geophysical Research: Planets 2006, 111. [Google Scholar] [CrossRef]
- Naito, M.; Hasebe, N.; Nagaoka, H.; Shibamura, E.; Ohtake, M.; Kim, K.; Wöhler, C.; Berezhnoy, A. Iron distribution of the Moon observed by the Kaguya gamma-ray spectrometer: Geological implications for the South Pole-Aitken basin, the Orientale basin, and the Tycho crater. Icarus 2018, 310, 21–31. [Google Scholar] [CrossRef]
- Elphic, R.; Lawrence, D.; Feldman, W.; Barraclough, B.; Maurice, S.; Binder, A.; Lucey, P. Lunar Fe and Ti abundances: comparison of Lunar Prospector and Clementine data. Science 1998, 281, 1493–1496. [Google Scholar] [CrossRef]
- Elphic, R.; Lawrence, D.; Feldman, W.; Barraclough, B.; Maurice, S.; Binder, A.; Lucey, P. Lunar rare earth element distribution and ramifications for FeO and TiO2: Lunar Prospector neutron spectrometer observations. Journal of Geophysical Research: Planets 2000, 105, 20333–20345. [Google Scholar] [CrossRef]
- Elphic, R.; Lawrence, D.; Feldman, W.; Barraclough, B.; Gasnault, O.; Maurice, S.; Lucey, P.; Blewett, D.; Binder, A. Lunar Prospector neutron spectrometer constraints on TiO2. Journal of Geophysical Research: Planets 2002, 107, 8–1. [Google Scholar] [CrossRef]
- Feldman, W.; Barraclough, B.; Maurice, S.; Elphic, R.; Lawrence, D.; Thomsen, D.; Binder, A. Major compositional units of the Moon: Lunar Prospector thermal and fast neutrons. Science 1998, 281, 1489–1493. [Google Scholar] [CrossRef] [PubMed]
- Feldman, W.; Lawrence, D.; Elphic, R.; Barraclough, B.; Maurice, S.; Genetay, I.; Binder, A. Polar hydrogen deposits on the Moon. Journal of Geophysical Research: Planets 2000, 105, 4175–4195. [Google Scholar] [CrossRef]
- Lucey, P.G.; Taylor, G.J.; Malaret, E. Abundance and distribution of iron on the Moon. Science 1995, 268, 1150–1153. [Google Scholar] [CrossRef] [PubMed]
- Lucey, P.G.; Blewett, D.T.; Hawke, B.R. Mapping the FeO and TiO2 content of the lunar surface with multispectral imagery. Journal of Geophysical Research: Planets 1998, 103, 3679–3699. [Google Scholar] [CrossRef]
- Lucey, P.G.; Blewett, D.T.; Jolliff, B.L. Lunar iron and titanium abundance algorithms based on final processing of Clementine ultraviolet-visible images. Journal of Geophysical Research: Planets 2000, 105, 20297–20305. [Google Scholar] [CrossRef]
- Lucey, P.G. Radiative transfer modeling of the effect of mineralogy on some empirical methods for estimating iron concentration from multispectral imaging of the Moon. Journal of Geophysical Research: Planets 2006, 111. [Google Scholar] [CrossRef]
- Bandfield, J.L.; Hayne, P.O.; Williams, J.P.; Greenhagen, B.T.; Paige, D.A. Lunar surface roughness derived from LRO Diviner Radiometer observations. Icarus 2015, 248, 357–372. [Google Scholar] [CrossRef]
- Sato, H.; Robinson, M.S.; Lawrence, S.J.; Denevi, B.W.; Hapke, B.; Jolliff, B.L.; Hiesinger, H. Lunar mare TiO2 abundances estimated from UV/Vis reflectance. Icarus 2017, 296, 216–238. [Google Scholar] [CrossRef]
- Ma, M.; Li, B.; Chen, S.; Lu, T.; Lu, P.; Lu, Y.; Jin, Q. Global estimates of lunar surface chemistry derived from LRO diviner data. Icarus 2022, 371, 114697. [Google Scholar] [CrossRef]
- Ling, Z.; Zhang, J.; Liu, J.; Zhang, W.; Bian, W.; Ren, X.; Mu, L.; Liu, J.; Li, C. Preliminary results of FeO mapping using Imaging Interferometer data from Chang’E-1. Chinese Science Bulletin 2011, 56, 376–379. [Google Scholar] [CrossRef]
- Yan, B.; Xiong, S.Q.; Wu, Y.; Wang, Z.; Dong, L.; Gan, F.; Yang, S.; Wang, R. Mapping Lunar global chemical composition from Chang’E-1 IIM data. Planetary and Space Science 2012, 67, 119–129. [Google Scholar] [CrossRef]
- Wu, Y.; Xue, B.; Zhao, B.; Lucey, P.; Chen, J.; Xu, X.; Li, C.; Ouyang, Z. Global estimates of lunar iron and titanium contents from the Chang’E-1 IIM data. Journal of Geophysical Research: Planets 2012, 117. [Google Scholar] [CrossRef]
- Sun, L.; Ling, Z.; Zhang, J.; Li, B.; Chen, J.; Wu, Z.; Liu, J. Lunar iron and optical maturity mapping: Results from partial least squares modeling of Chang’E-1 IIM data. Icarus 2016, 280, 183–198. [Google Scholar] [CrossRef]
- Xia, W.; Wang, X.; Zhao, S.; Jin, H.; Chen, X.; Yang, M.; Wu, X.; Hu, C.; Zhang, Y.; Shi, Y.; others. New maps of lunar surface chemistry. Icarus 2019, 321, 200–215. [Google Scholar] [CrossRef]
- Logan, L.M.; Hunt, G.R.; Salisbury, J.W.; Balsamo, S.R. Compositional implications of Christiansen frequency maximums for infrared remote sensing applications. Journal of Geophysical Research 1973, 78, 4983–5003. [Google Scholar] [CrossRef]
- Salisbury, J.W.; Basu, A.; Fischer, E.M. Thermal infrared spectra of lunar soils. Icarus 1997, 130, 125–139. [Google Scholar] [CrossRef]
- Paige, D.; Foote, M.; Greenhagen, B.; Schofield, J.; Calcutt, S.; Vasavada, A.; Preston, D.; Taylor, F.; Allen, C.; Snook, K.; others. The lunar reconnaissance orbiter diviner lunar radiometer experiment. Space Science Reviews 2010, 150, 125–160. [Google Scholar] [CrossRef]
- Greenhagen, B.T.; Lucey, P.G.; Wyatt, M.B.; Glotch, T.D.; Allen, C.C.; Arnold, J.A.; Bandfield, J.L.; Bowles, N.E.; Hanna, K.L.D.; Hayne, P.O.; Song, E.; Thomas, I.R.; Paige, D.A. Global Silicate Mineralogy of the Moon from the Diviner Lunar Radiometer. Science 2010, 329, 1507–1509, [https://www.science.org/doi/pdf/10.1126/science.1192196]. [Google Scholar] [CrossRef] [PubMed]
- Hanna, K.D.; Greenhagen, B.; Patterson Iii, W.; Pieters, C.; Mustard, J.; Bowles, N.; Paige, D.; Glotch, T.; Thompson, C. Effects of varying environmental conditions on emissivity spectra of bulk lunar soils: Application to Diviner thermal infrared observations of the Moon. Icarus 2017, 283, 326–342. [Google Scholar] [CrossRef]
- Lucey, P.G.; Greenhagen, B.T.; Song, E.; Arnold, J.A.; Lemelin, M.; Hanna, K.D.; Bowles, N.E.; Glotch, T.D.; Paige, D.A. Space weathering effects in Diviner Lunar Radiometer multispectral infrared measurements of the lunar Christiansen Feature: Characteristics and mitigation. Icarus 2017, 283, 343–351. [Google Scholar] [CrossRef]
- Lucey, P.G.; Hayne, P.O.; Costello, E.; Green, R.; Hibbitts, C.; Goldberg, A.; Mazarico, E.; Li, S.; Honniball, C. The spectral radiance of indirectly illuminated surfaces in regions of permanent shadow on the Moon. Acta Astronautica 2021, 180, 25–34. [Google Scholar] [CrossRef]
- Nozette, S.; Rustan, P.; Pleasance, L.; Kordas, J.; Lewis, I.; Park, H.; Priest, R.; Horan, D.; Regeon, P.; Lichtenberg, C.; others. The Clementine mission to the Moon: Scientific overview. Science 1994, 266, 1835–1839. [Google Scholar] [CrossRef]
- McEwen, A.; Robinson, M. Mapping of the Moon by Clementine. Advances in Space Research 1997, 19, 1523–1533, Proceedings of the BO.1 Symposium of COSPAR Scientific Commission B. [Google Scholar] [CrossRef]
- Pieters, C.; Shkuratov, Y.; Kaydash, V.; Stankevich, D.; Taylor, L. Lunar soil characterization consortium analyses: Pyroxene and maturity estimates derived from Clementine image data. Icarus 2006, 184, 83–101. [Google Scholar] [CrossRef]
- Pieters, C.M.; Hiroi, T. RELAB (Reflectance Experiment Laboratory): A NASA multiuser spectroscopy facility. Lunar and Planetary Science Conference, 2004, p. 1720.
- Dubayah, R.; Rich, P.M. Topographic solar radiation models for GIS. International journal of geographical information systems 1995, 9, 405–419. [Google Scholar] [CrossRef]
- Wilson, J.P.; Gallant, J.C.; others. Digital terrain analysis. Terrain analysis: Principles and applications 2000, 6, 1–27. [Google Scholar]
- Olaya, V.; Conrad, O. Geomorphometry in SAGA. Developments in soil science 2009, 33, 293–308. [Google Scholar]
- Böhner, J.; Antonić, O. Land-surface parameters specific to topo-climatology. Developments in soil science 2009, 33, 195–226. [Google Scholar]
- Papike, J.; Taylor, L.; Simon, S. Lunar minerals. Lunar sourcebook: A user’s guide to the Moon 1991, pp. 121–181.
- Blewett, D.T.; Hawke, B.R.; Lucey, P.G. Lunar pure anorthosite as a spectral analog for Mercury. Meteoritics & Planetary Science 2002, 37, 1245–1254. [Google Scholar]
- Warren, P.H.; Shirley, D.N.; Kallemeyn, G.W. A potpourri of pristine Moon rocks, including a VHK mare basalt and a unique, augite-rich Apollo 17 anorthosite. Journal of Geophysical Research: Solid Earth 1986, 91, 319–330. [Google Scholar] [CrossRef]
- Pieters, C.; Pratt, S. Earth-based near-infrared collection of spectra for the Moon: A new PDS data set. Lunar and Planetary Science Conference, 2000, p. 2059.
- Pieters, C.M.; Ammannito, E.; Blewett, D.T.; Denevi, B.W.; De Sanctis, M.C.; Gaffey, M.J.; Le Corre, L.; Li, J.Y.; Marchi, S.; McCord, T.B.; McFadden, L.A.; Mittlefehldt, D.W.; Nathues, A.; Palmer, E.; Reddy, V.; Raymond, C.A.; Russell, C.T. Distinctive space weathering on Vesta from regolith mixing processes. Nature 2012, 491, 79–82. [Google Scholar] [CrossRef]
- Hapke, B. Space weathering from Mercury to the asteroid belt. Journal of Geophysical Research: Planets 2001, 106, 10039–10073, [https://agupubs.onlinelibrary.wiley.com/doi/pdf/10.1029/2000JE001338]. [Google Scholar] [CrossRef]
- Vernazza, P.; Binzel, R.; Rossi, A.; Fulchignoni, M.; Birlan, M. Solar wind as the origin of rapid reddening of asteroid surfaces. Nature 2009, 458, 993–995. [Google Scholar] [CrossRef]
- Domingue, D.L.; Chapman, C.R.; Killen, R.M.; Zurbuchen, T.H.; Gilbert, J.A.; Sarantos, M.; Benna, M.; Slavin, J.A.; Schriver, D.; Trávníček, P.M.; others. Mercury’s weather-beaten surface: Understanding Mercury in the context of lunar and asteroidal space weathering studies. Space Science Reviews 2014, 181, 121–214. [Google Scholar] [CrossRef]
- Adams, J.B.; McCord, T.B. Optical properties of mineral separates, glass, and anorthositic fragments from Apollo mare samples. Proceedings of the Lunar Science Conference, vol. 2, p. 2183, 1971, Vol. 2, p. 2183.
- Pieters, C.M.; Head, J.; Sunshine, J.; Fischer, E.; Murchie, S.; Belton, M.; McEwen, A.; Gaddis, L.; Greeley, R.; Neukum, G.; others. Crustal diversity of the Moon: Compositional analyses of Galileo solid state imaging data. Journal of Geophysical Research: Planets 1993, 98, 17127–17148. [Google Scholar] [CrossRef]
- Sasaki, S.; Nakamura, K.; Hamabe, Y.; Kurahashi, E.; Hiroi, T. Production of iron nanoparticles by laser irradiation in a simulation of lunar-like space weathering. Nature 2001, 410, 555–557. [Google Scholar] [CrossRef]
- Noble, S.K.; Pieters, C.M.; Keller, L.P. An experimental approach to understanding the optical effects of space weathering. Icarus 2007, 192, 629–642. [Google Scholar] [CrossRef]
- Meyer, C., Jr.; McKay, D.; Anderson, D.; Butler, P., Jr. The source of sublimates on the Apollo 15 green and Apollo 17 orange glass samples. In: Lunar Science Conference, 6th, Houston, Tex., March 17-21, 1975, Proceedings. Volume 2.(A78-46668 21-91) New York, Pergamon Press, Inc., 1975, p. 1673-1699., 1975, Vol. 6, pp. 1673–1699.
- Butler, J., Jr.; Meyer, C., Jr. Sulfur prevails in coatings on glass droplets-Apollo 15 green and brown glasses and Apollo 17 orange and black/devitrified/glasses. Lunar and Planetary Science Conference Proceedings, 1976, Vol. 7, pp. 1561–1581.
- Day, J.M.; Walker, R.J.; James, O.B.; Puchtel, I.S. Osmium isotope and highly siderophile element systematics of the lunar crust. Earth and Planetary Science Letters 2010, 289, 595–605. [Google Scholar] [CrossRef]
- Tompkins, S.; Pieters, C.M. Mineralogy of the lunar crust: Results from Clementine. Meteoritics & Planetary Science 1999, 34, 25–41. [Google Scholar]
- Blewett, D.T.; Lucey, P.G.; Hawke, B.R.; Jolliff, B.L. Clementine images of the lunar sample-return stations: Refinement of FeO and TiO2 mapping techniques. Journal of Geophysical Research: Planets 1997, 102, 16319–16325. [Google Scholar] [CrossRef]
- Giguere, T.A.; Taylor, G.J.; HAWKE, B.R.; Lucey, P.G. The titanium contents of lunar mare basalts. Meteoritics & Planetary Science 2000, 35, 193–200. [Google Scholar]
- Bhatt, M.; Wöhler, C.; Dhingra, D.; Thangjam, G.; Rommel, D.; Mall, U.; Bhardwaj, A.; Grumpe, A. Compositional studies of Mare Moscoviense: New perspectives from Chandrayaan-1 VIS-NIR data. Icarus 2018, 303, 149–165. [Google Scholar] [CrossRef]
Figure 3.
Five spectra types of lunar samples obtained in PCA analysis.
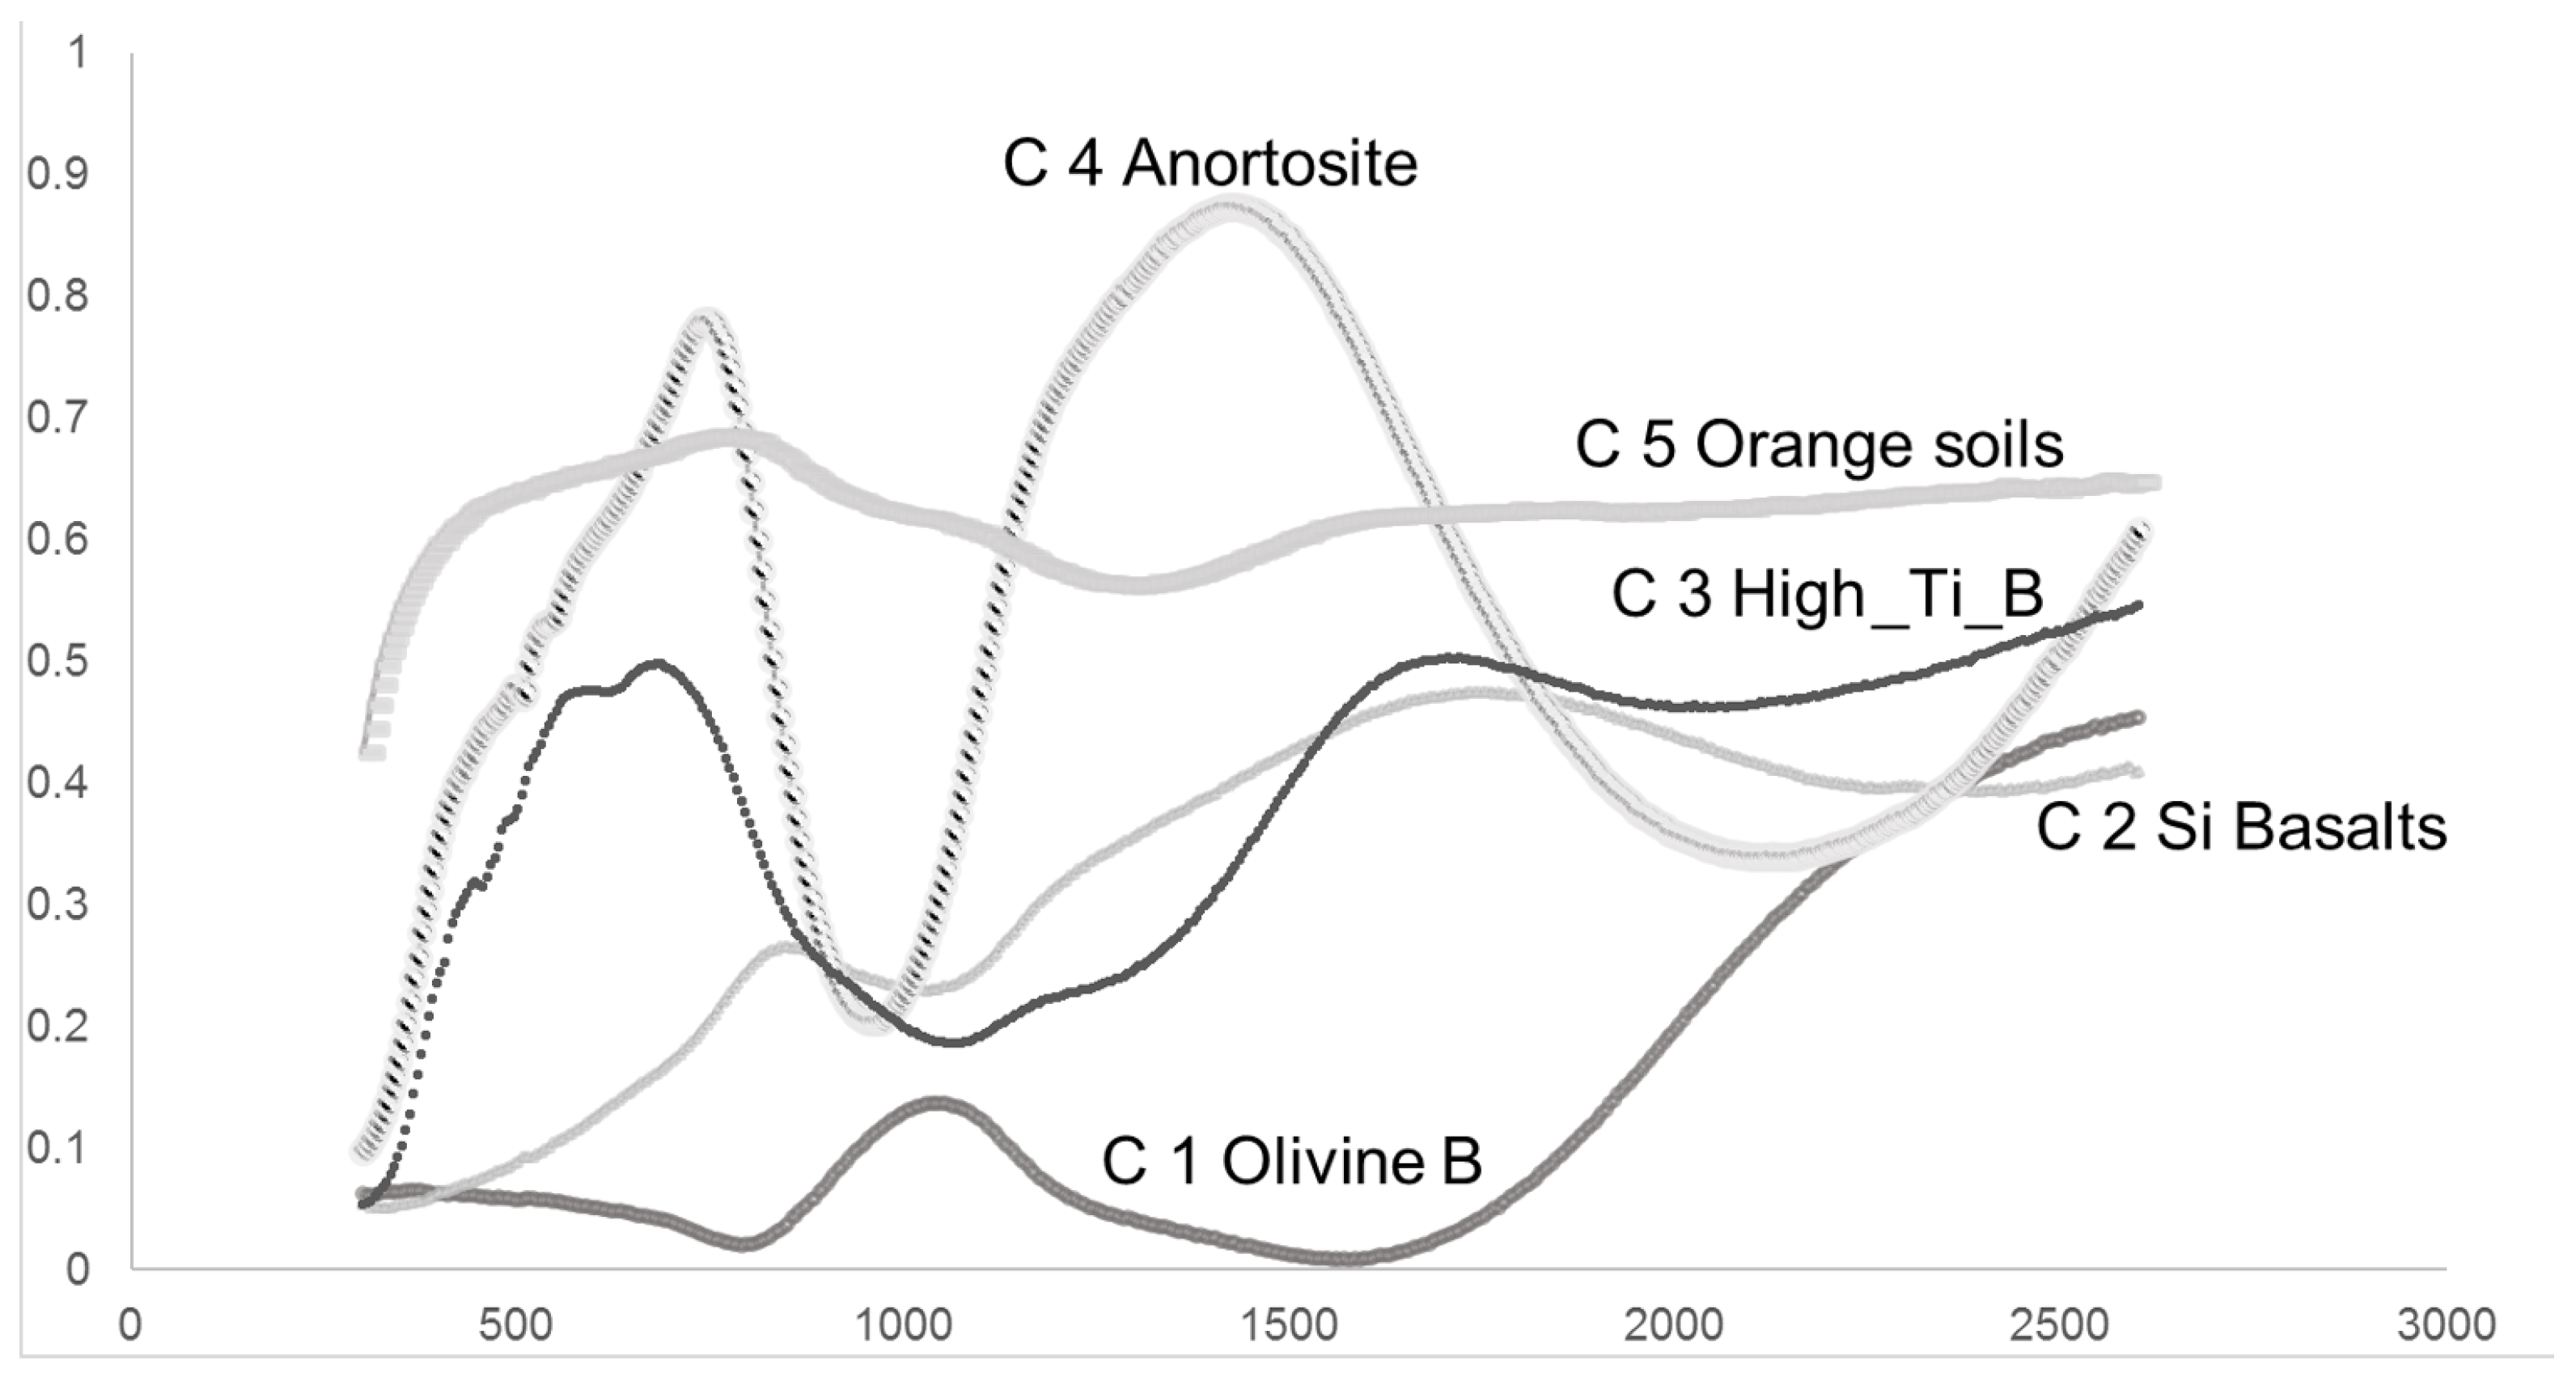
Figure 6.
Attempt to validate the extended models with the eight lunar samples.
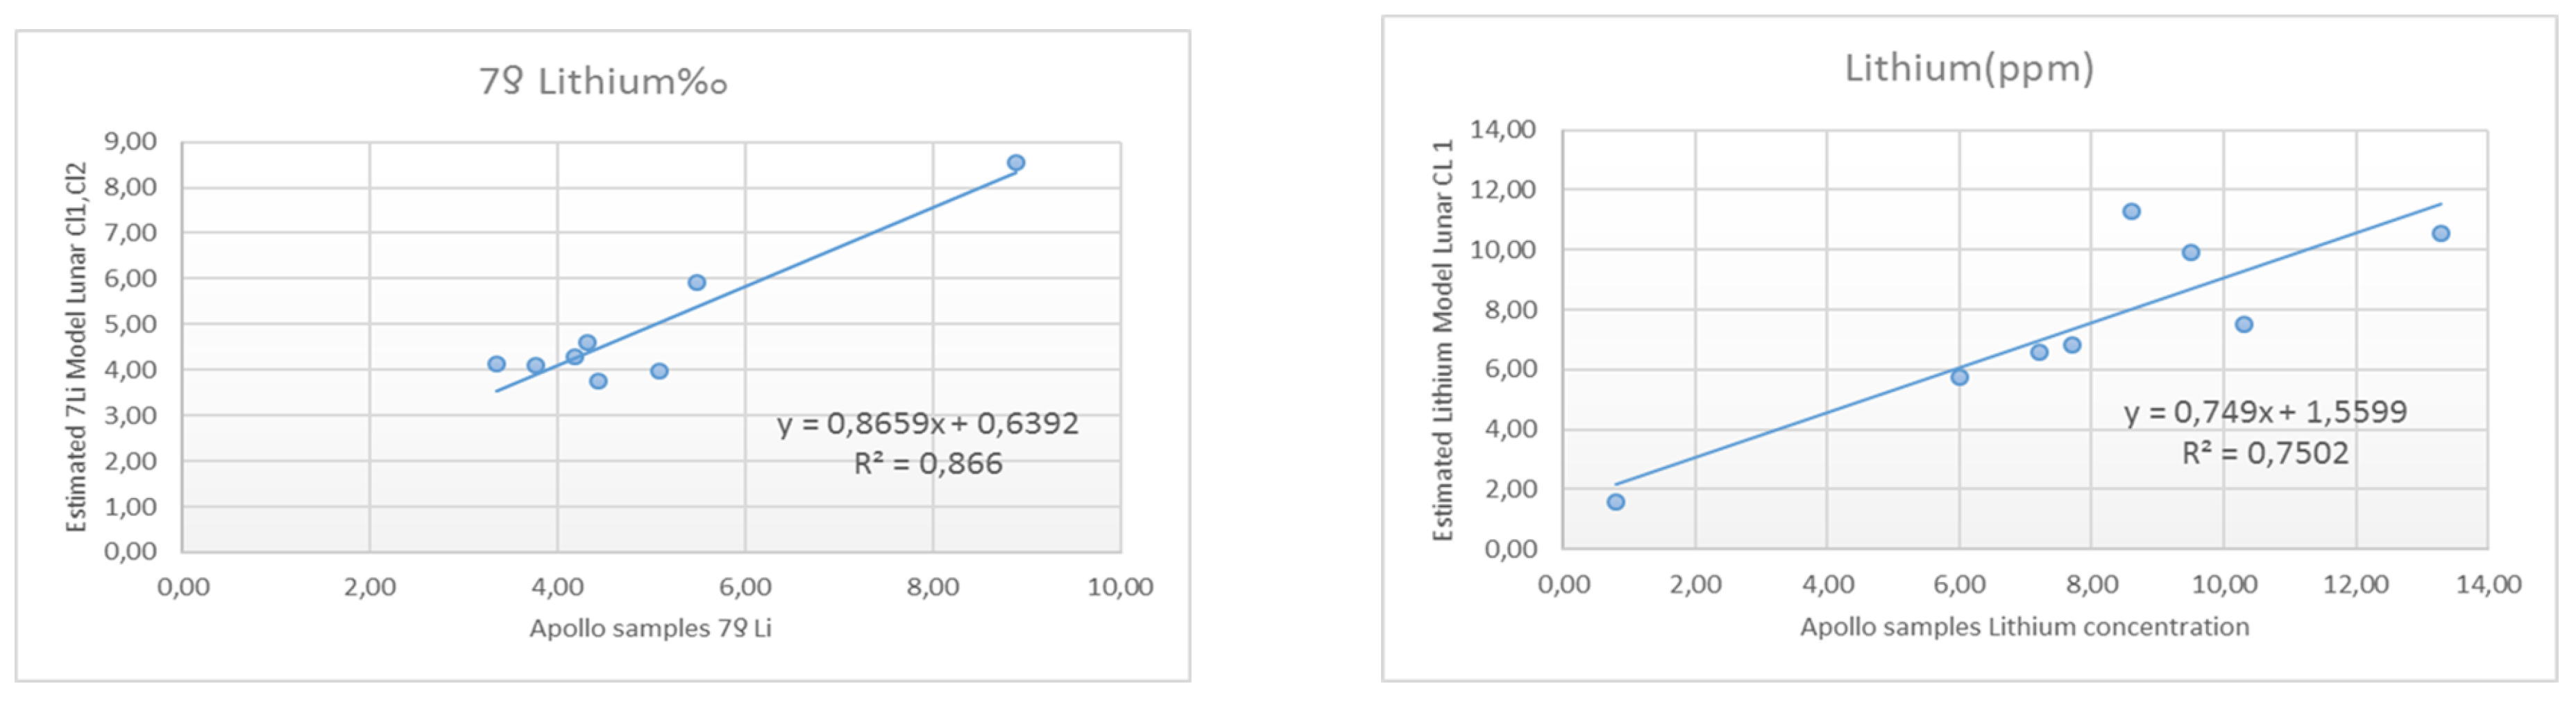
Figure 7.
Correlations between values of relief variables derived from DEM_LOLA and lithium and 7 Li concentrations. The analysis were performed with a simulated population of 296 samples concentrated in the area of Apollo 15 landing site.
Figure 7.
Correlations between values of relief variables derived from DEM_LOLA and lithium and 7 Li concentrations. The analysis were performed with a simulated population of 296 samples concentrated in the area of Apollo 15 landing site.
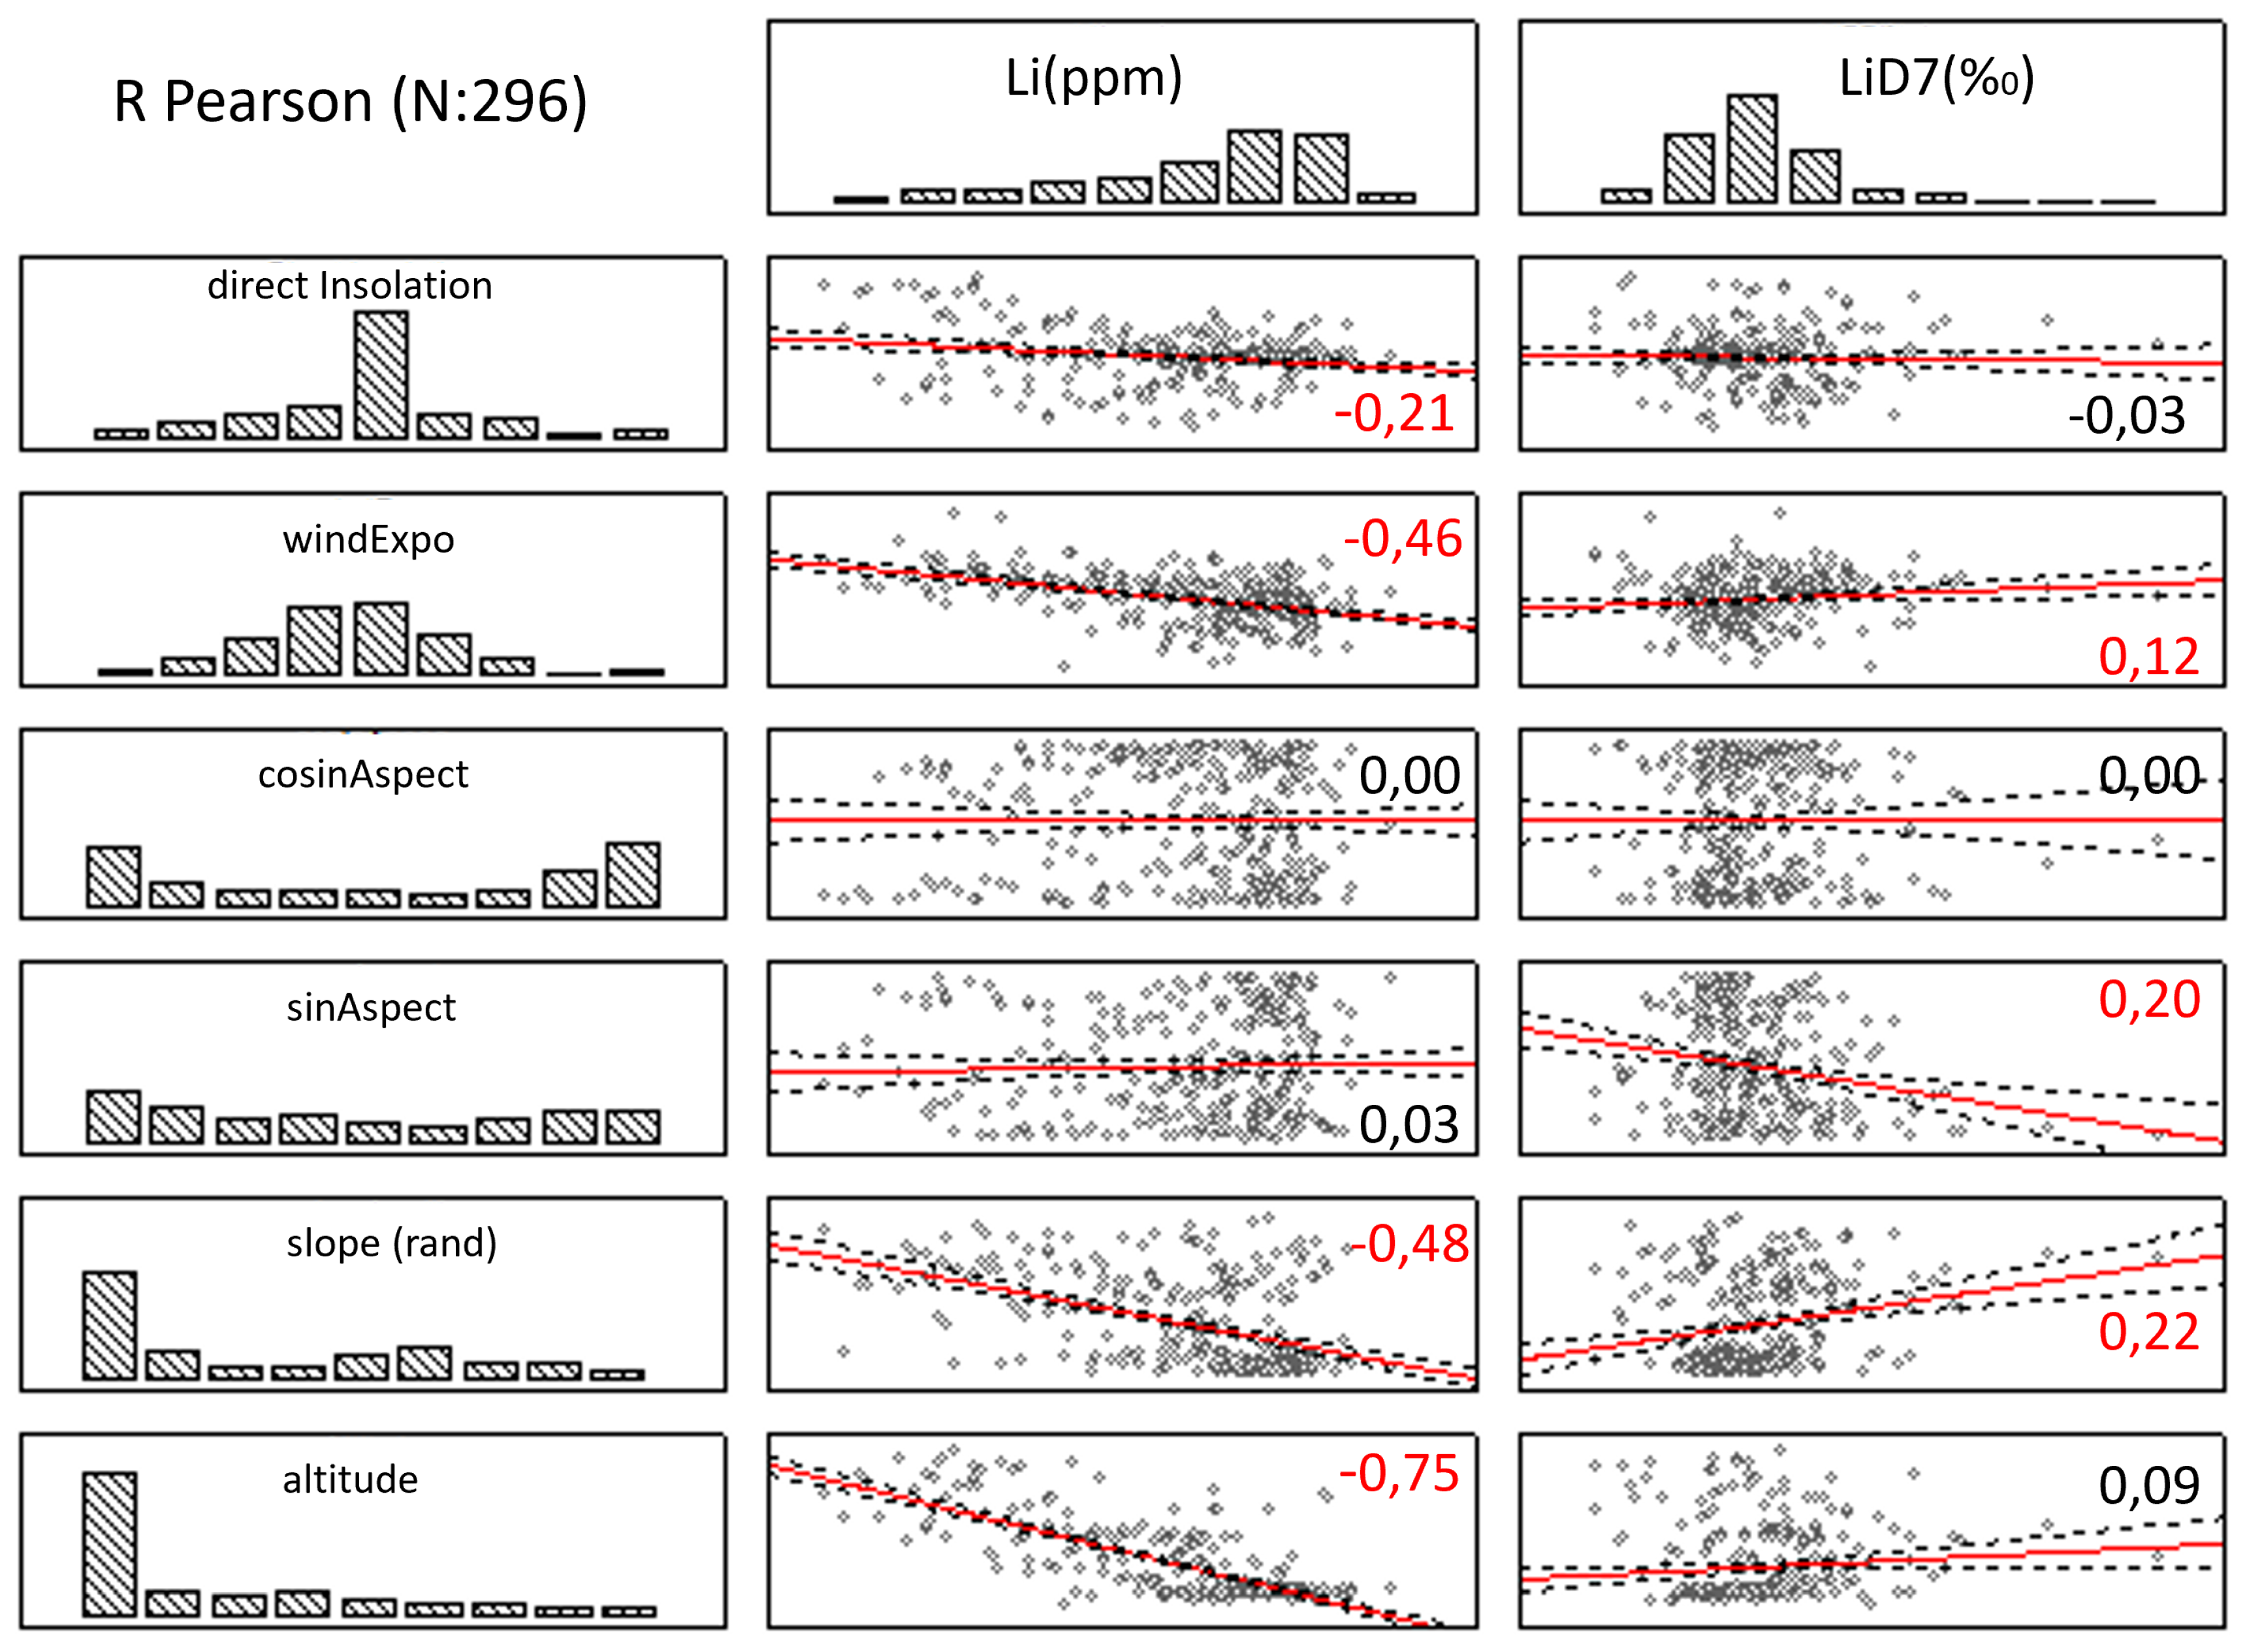
Figure 8.
ADS Vis_Nir spectral library for ices.
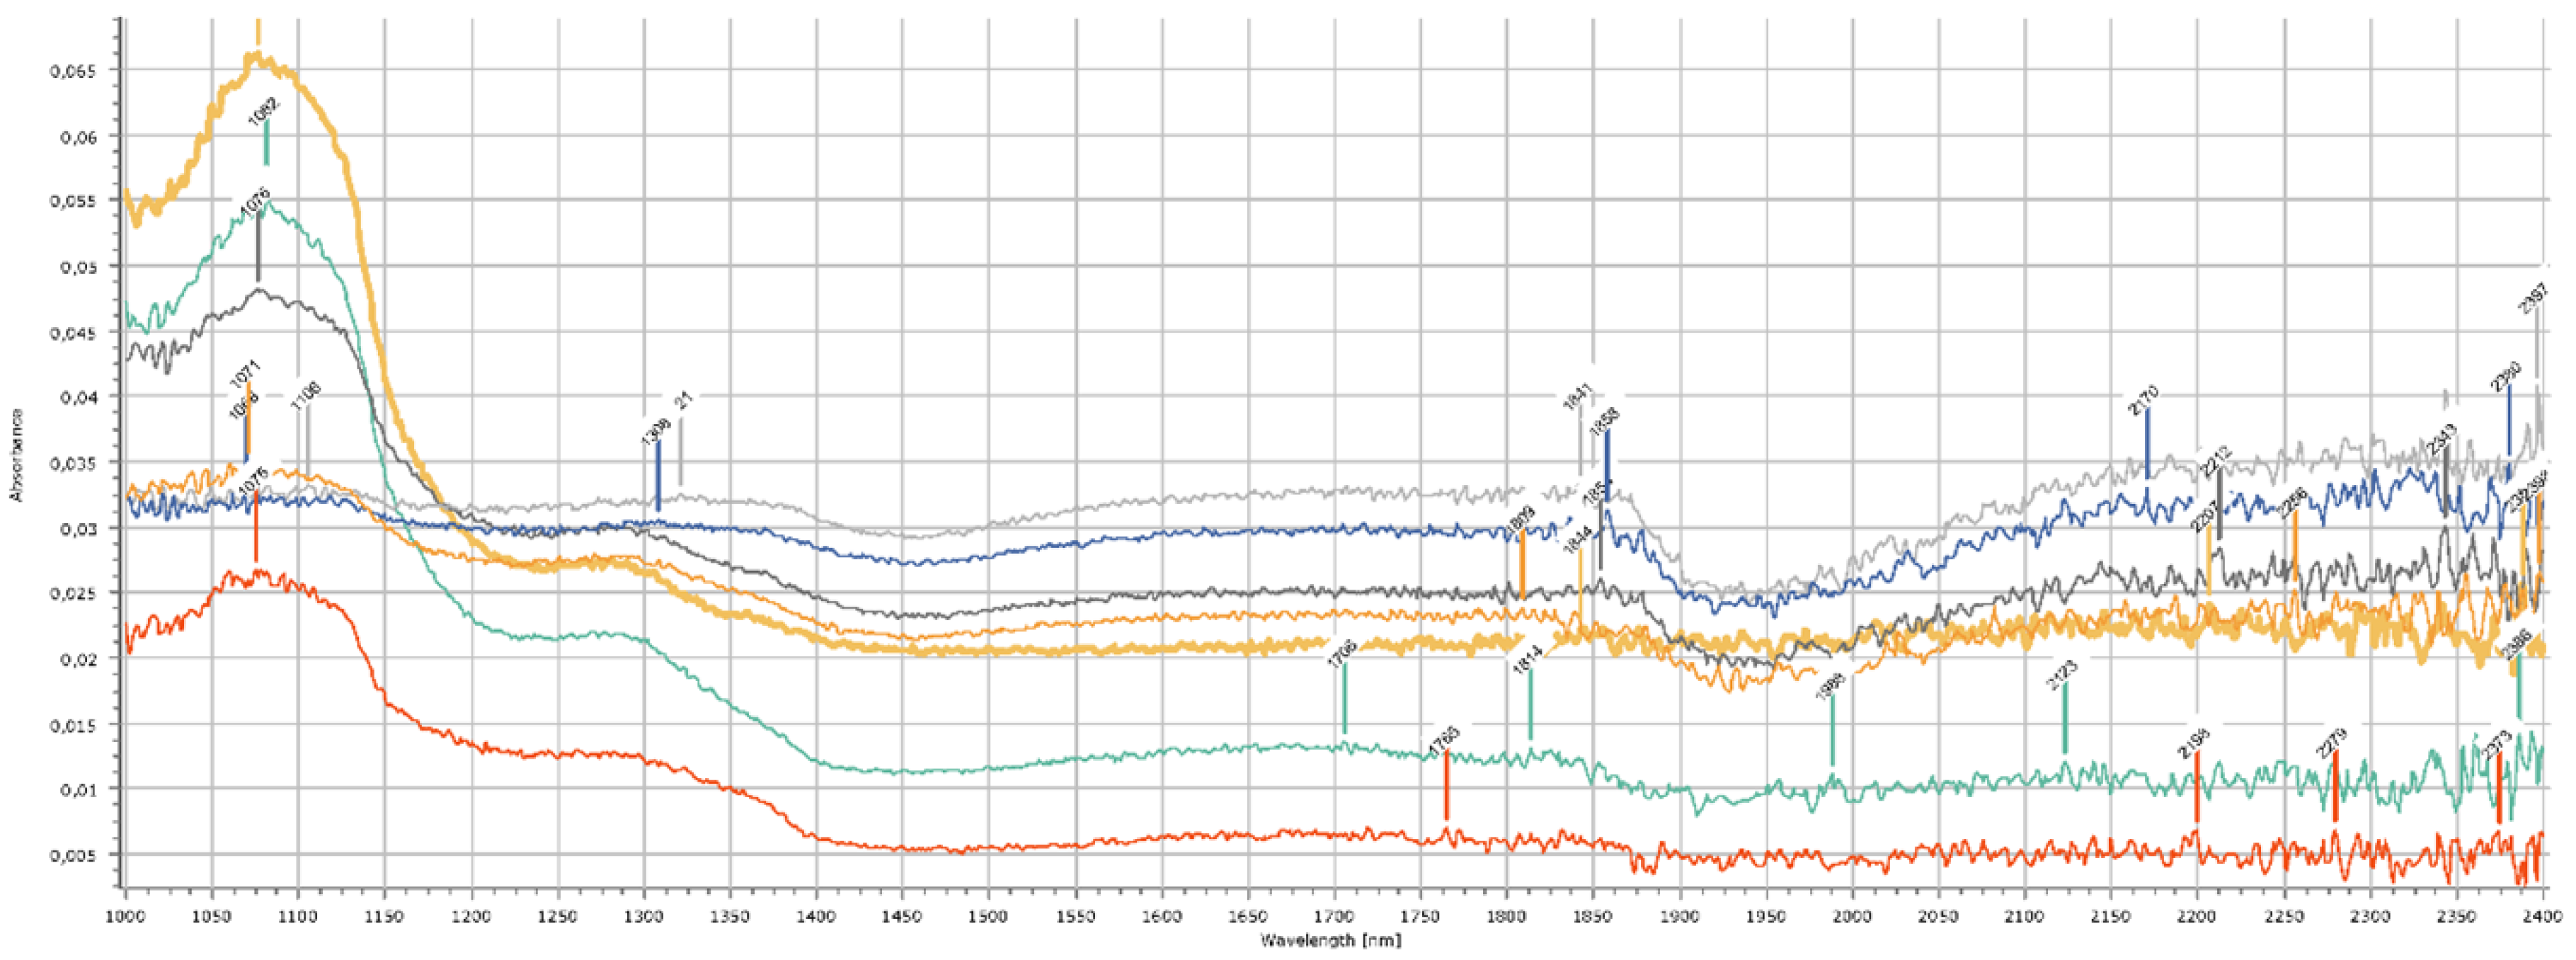
Table 1.
Samples used, concentration of lithium and 7 Li isotope and corresponding spectral index. Modified from [3].
Table 1.
Samples used, concentration of lithium and 7 Li isotope and corresponding spectral index. Modified from [3].
| subtrata | sample | Lithium(ppm) | 7 Li | Li ratio (7/ppm) | spectral index |
|---|---|---|---|---|---|
| Anortosite | 62255 | 0.8 | 8.89 | 11,11 | C4 |
| Basalt | 15058 | 7.7 | 3.76 | 0.49 | C2 |
| Basalt | 12045 | 9.5 | 4.43 | 0.47 | C2 |
| Basalt | 15475 | 7.2 | 3.35 | 0.47 | C2 |
| High-Ti Mare Basalt | 70035 | 8.6 | 5.09 | 0.59 | C3 |
| High-Ti Mare Basalt | 75075 | 10.3 | 5.48 | 0.53 | C3 |
| OlivineBasalt | 15555 | 6.0 | 4.32 | 0.72 | C1 |
| Orange and GlassesSoil | 74220 | 13.3 | 4.19 | 0.32 | C5 |
Disclaimer/Publisher’s Note: The statements, opinions and data contained in all publications are solely those of the individual author(s) and contributor(s) and not of MDPI and/or the editor(s). MDPI and/or the editor(s) disclaim responsibility for any injury to people or property resulting from any ideas, methods, instructions or products referred to in the content. |
© 2024 by the authors. Licensee MDPI, Basel, Switzerland. This article is an open access article distributed under the terms and conditions of the Creative Commons Attribution (CC BY) license (http://creativecommons.org/licenses/by/4.0/).
Copyright: This open access article is published under a Creative Commons CC BY 4.0 license, which permit the free download, distribution, and reuse, provided that the author and preprint are cited in any reuse.


