
Submitted:
06 July 2024
Posted:
08 July 2024
You are already at the latest version
Abstract
Coaches are the main people who have an impact on the mental and psychological performance of athletes as well as their physical performance. The purpose of this study is to investigate the effect of perceived coaching behaviors on the anger and aggression levels of male athletes. This study was conducted with 748 male athletes with an active license who are over 18 years of age and participate in individual and team sports branches. In this study, the "Coaching Behavior Assessment Ques-tionnaire" and the “Competitive Aggressiveness and Anger Scale" were used as data collection tools. The study results showed that athletes’ levels of evaluation of the coaching behaviors were high, while the levels of aggressiveness and anger in sports were low. It was determined that there is a negative low-level relationship between the athletes’ evaluation levels of the coaching be-haviors and the aggressiveness and anger levels in sports and that the coach’s behaviors predict the anger and aggressiveness levels of the athletes by 9% and 6%, respectively. The results of this study show that the attitudes and behaviors of coaches can affect the emotional states of male athletes and have the potential to increase or decrease their anger and aggressiveness levels. Coaches who exhibit positive, supportive, and modeling behaviors help create a healthy sports environment and help male athletes maintain emotional balance.
Keywords:
trainer
; athlete
; anger
; aggressiveness
; male
1. Introduction
In the field of sports, coaches and athletes are related to each other for individual sports or team sports, and this relationship can be one of the most important factors de-termining the success or failure of an athlete or team [1]. Coaches should not only plan training programs and prepare the team for competitive competitions but also motivate the athletes, develop an emotional environment within the team, and maintain a learning environment that facilitates growth and the achievement of goals [2]. In this learning en-vironment, there is a coach-athlete relationship, a relationship between the athlete and the coach in which emotions, thoughts, and behaviors affect each other. This relationship in-cludes the interaction, communication, and dynamics of the relationship between the athlete and the coach. The coach’s leadership style, communication skills, guidance, and approach have direct effects on the athlete [3]. Mallet [4] stated that the sports environment basically consists of the relationship between the coach, the athlete, the competition, and the training environment. Coaches who are engaged in individual and team sports not only increase the performance of the athletes but also have the motivation to enable the athletes to positively improve their behaviors, such as anger and aggressiveness, in com-petitions [5]. Some negative behaviors of coaches may reduce athlete satisfaction and cause disappointment and fear of failure. Such a case can lead the athlete to avoid taking risks and increase the possibility of making mistakes by increasing the anxiety level. Likewise, undesirable behaviors in such situations can lead to feelings of anger and ag-gressiveness and trigger discipline problems [6]. Danilewicz [7] argues he pressure exert-ed on the athlete by the family and/or coach is an important factor behind anger and ag-gression in sports. [7]. Athletes with high levels of anger and aggressiveness also tend to exhibit behaviors contrary to sporting rules, such as cheating or harming another player [8]. Predominantly, male athletes express their anger more frequently in the form of verbal and physical aggressiveness. Another reason for anger and aggressiveness in sports is at-tributed to the learning process that occurs during participation in sports [9], which is why anger and aggressiveness can be tolerated in sports, which is a social phenomenon. It has been observed that some behaviors exhibited by athletes can turn into acts of anger and aggression during competitions. Moreover, studies show that anger and aggressive behaviors differ according to the type of sport. Athletes participating in individual sports generally exhibit lower levels of aggressiveness than those participating in team sports [9]. Athletes, in particular, may resort to verbal or physical aggression to intimidate their weaker opponents. If such behavior goes unpunished [7], it can cause them to lose focus on their goal or to be disqualified [10].
While anger and aggression can be seen at every stage of sports, they can also affect athletes of all age categories [11]. Factors such as technical and tactical abilities, psycho-logical state, training time, and efficiency of athletes in this age category play a role in achieving success. However, the most important factor is that the coaches know the ath-letes and their needs. Coaches strive to understand the deficiencies and needs of athletes and provide appropriate conditions. In this way, negative behaviors such as anger and aggressiveness are prevented [12]. The coach guides athletes to achieve high levels of physical and emotional (psychological) performance with their own knowledge and ex-perience, in cooperation with sports physicians, scientists and psychologists. In this pro-cess, the coach is in direct contact with the athlete throughout a long training process and facilitates the management of emotional factors such as anger and aggressiveness [13]. Coaches have both positive and negative effects on their athletes [14]. Therefore, coaches should encourage their athletes to adopt sports as a philosophy of life and support the lifelong continuation of sports [12].
In summary, examining coach-athlete anger and aggression levels shows whether they have a decisive effect on the performance of athletes. Therefore, investigating coach-athlete relationships is important in controlling negative risk factors such as anger and aggression. In this context, the aim of the study was to examine the effects of per-ceived coaching behavior on athletes’ anger and aggression levels in athletes from differ-ent sports branches in Turkiye.
2. Materials and Methods
2.1. Research Model
This study aimed to accurately describe an existing situation by using a relational screening model. A relational screening model is a model used to determine the relation-ship between variables and the degree of change [15]. The purpose of the study is to ex-amine the relationship between anger and aggressiveness levels and coaching behaviors. This model makes it possible to understand and evaluate the relationship between these variables.
2.2. Participants
The population of the study consisted of male athletes who are over the age of 18, have an active license, and engage in olympic individual and team sports in 14 provinces (Kars, Erzurum, Ardahan, Ağrı, Muş, Bingöl, Bitlis, Erzincan, Tunceli, Van, Malatya, Elazığ, Hakkari and Iğdır) in the East Anatolia region in Turkiye. Although the smallest sample (with a 95% confidence level and a 5% confidence interval) to reach in the infinite popula-tion of athletes was calculated to be 384, as many individual and team athletes as possible were reached, and the data were collected from 748 athletes. The research sample con-sisted of a total of 748 male athletes. All participants were in-formed about the research before the study and signed informed consent forms were ob-tained.
2.3. Data Collection Tool
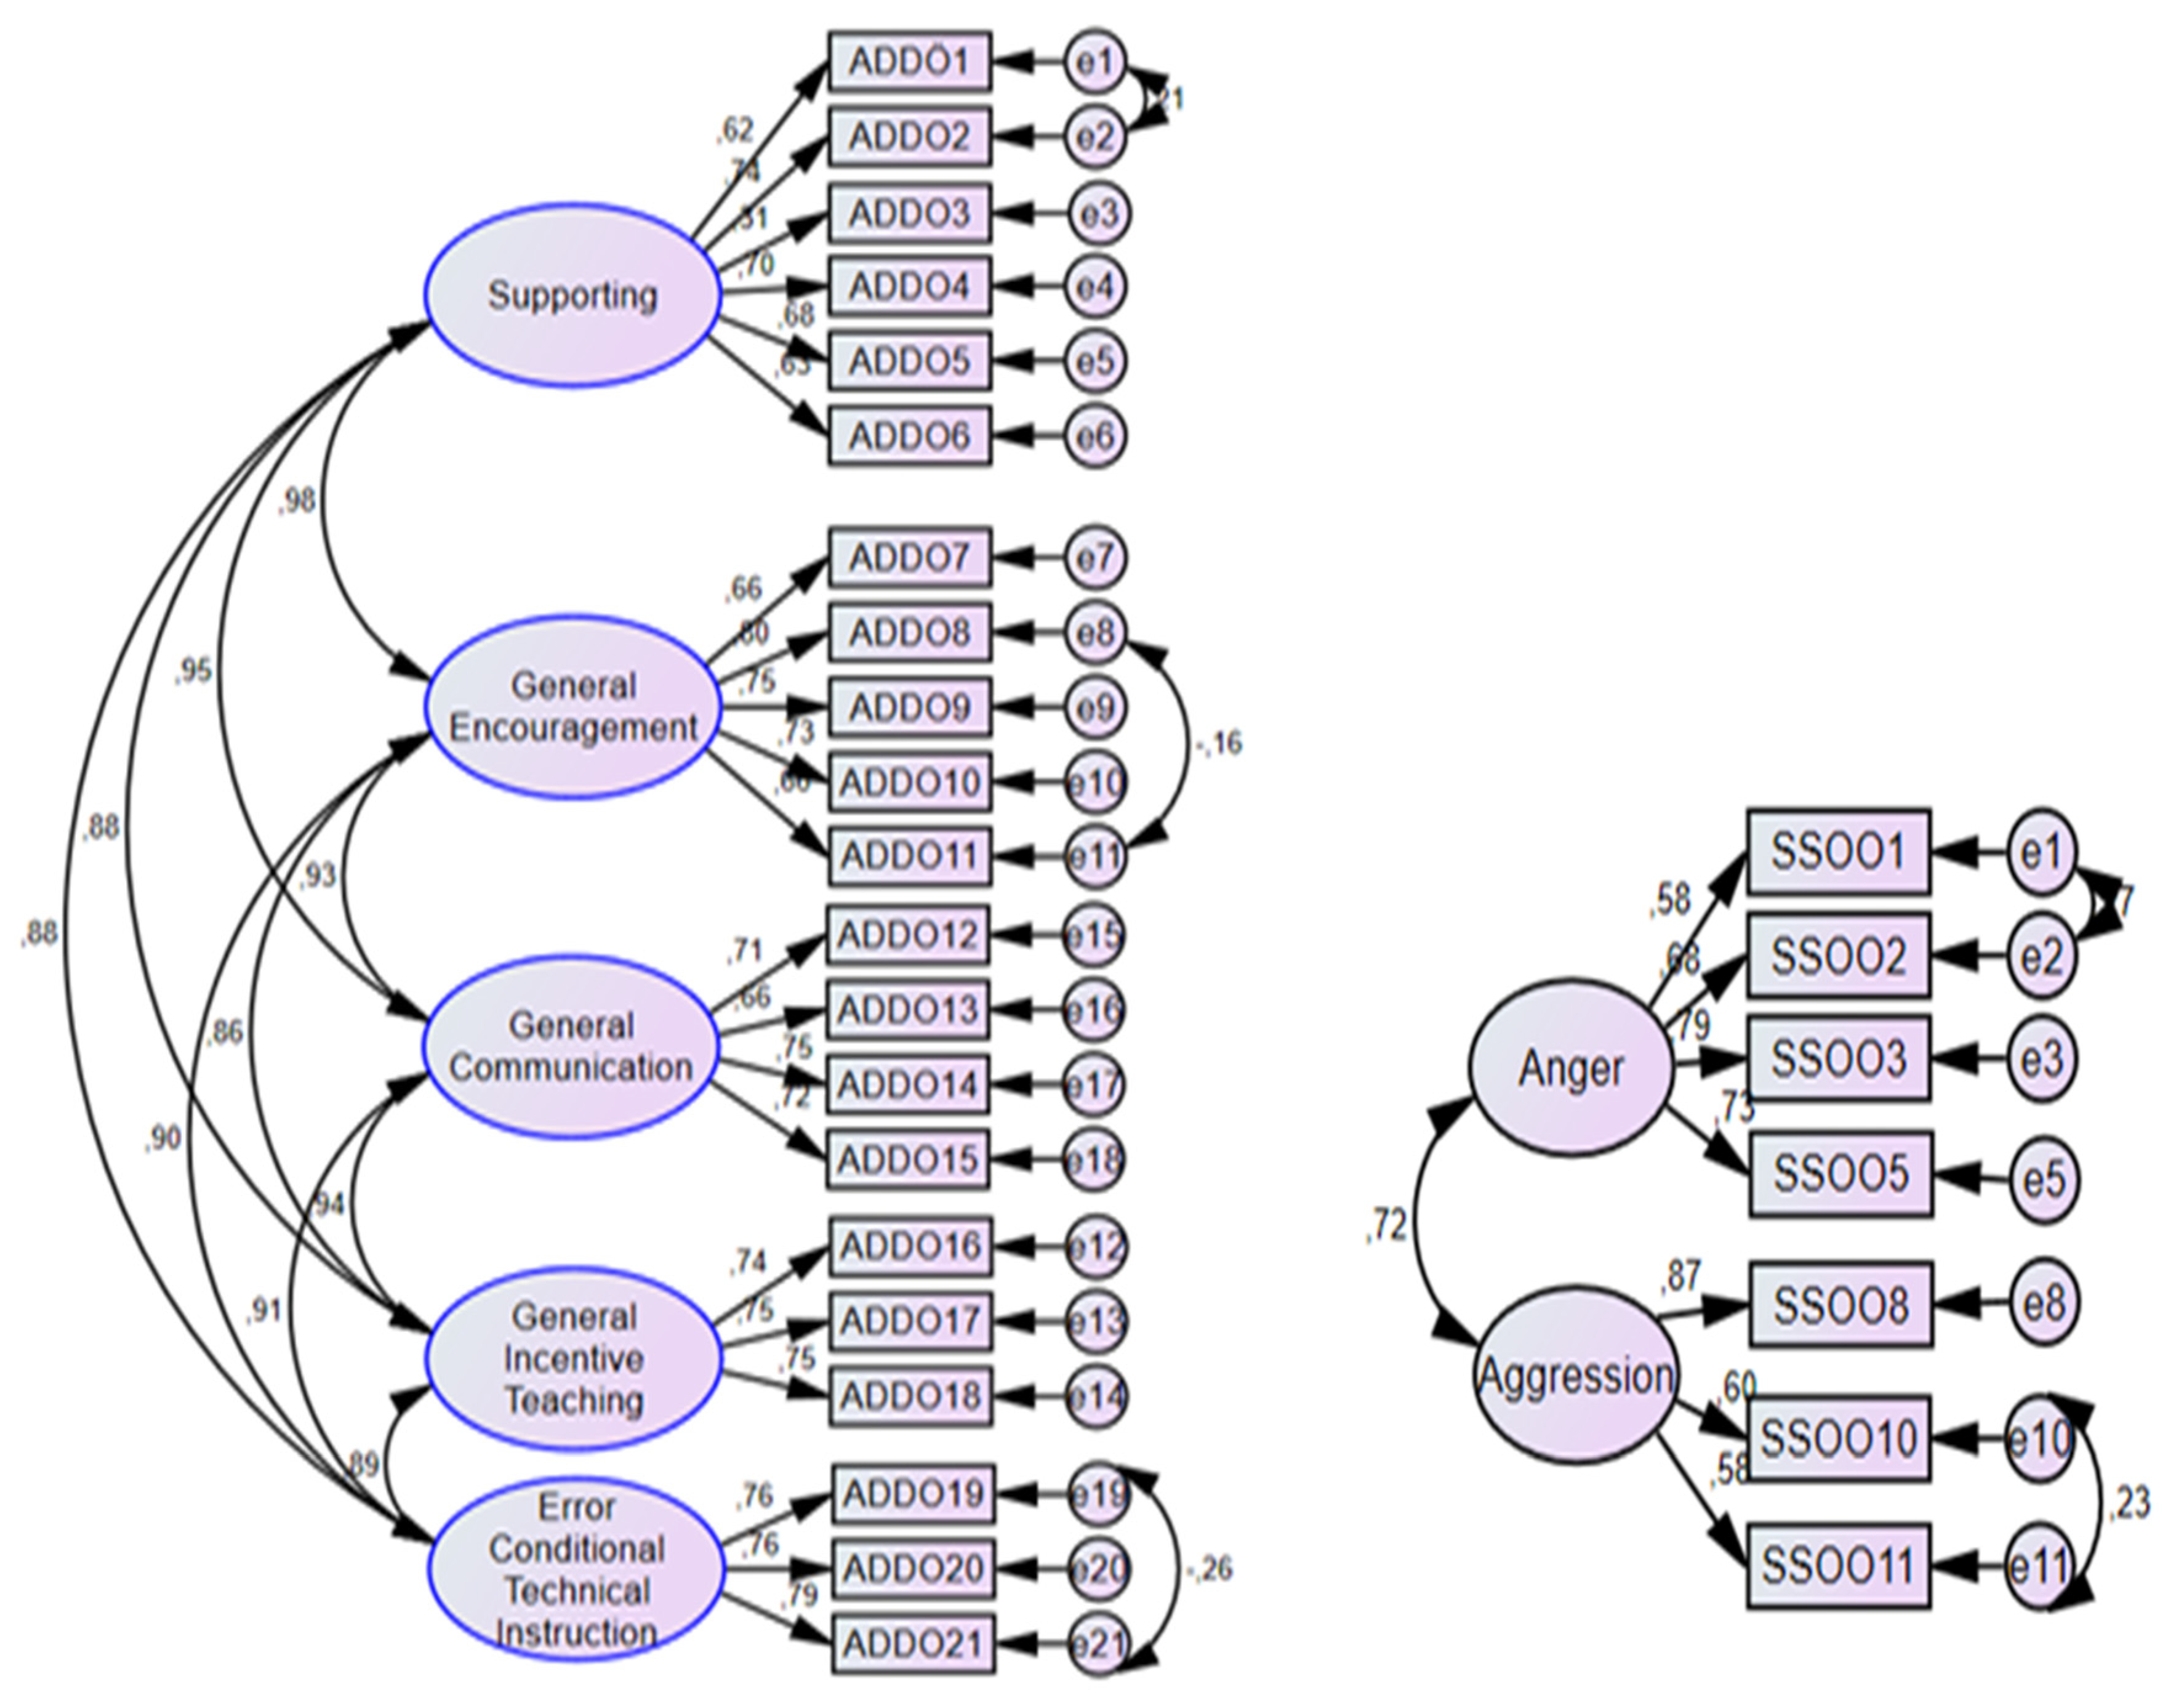
The data were collected using the Coaching Behavior Assessment Questionnaire (CBAQ) and the Competitive Aggressiveness and Anger Scale (CAAS). While the CBAQ was adapted to Turkish by Filiz and Demirhan in 2019 [17], the CAAS was adapted to Turkish by Gürbüz, Kural and Özbek in 2017 [16]. The CAAS has a two-dimension struc-ture (1-6:Anger Dimension and 7-12: Aggressiveness Dimension), while CBAQ has a five-dimension structure (1-6:Encouragement-E, 7-11: General Encouragement-GE, 12-14: General Encouragement Instruction-GEI, 15-18: General Communication-GC, and 19-21:Mistake-Contingent Technical Instruction-MCTI). The scales were designed as 5-point Likert scales. Each statement in the scale is scored on 5-point Likert scales, from “Never (1)” to “Always (5)” in CBAQ and “Strongly Disagree (1)” to “Strongly Agree (5)” in CAAS. Although the validity and reliability levels of the scales were measured in previ-ous studies, necessary tests were performed in this study as well to determine the validity and reliability levels of the scales. Thus, expert opinions were sought from experts in sports sciences and educational sciences regarding the content and face validity of the scales. A confirmatory factor analysis (CFA) was completed for construct validity, and the Cronbach’s alpha internal consistency coefficient (α) was calculated for reliability. The CFA diagrams of the scales are presented in Figure 1, and the goodness of fit indices are presented in Table 1.
Harrington [20] stated that item factor loads should be above .30. Therefore, during the CFA process, items 4, 6, 7, 9, 12 in CAAS were excluded from the scale as their factor loads were lower than .30. According to the CFA diagrams, the factor loads of the other items are greater than .30. Additionally, modifications were made between items 1-2 and 10-11 in the CBAQ and items 1-2, 8-11 and 19-21 in the CAAS. Finally, it was determined that the fit index values obtained in the CFA and presented in Table 1 were within the ref-erence ranges. Furthermore, it was determined that a high level of reliability was achieved with CAAS- α=.83 and CBAQ-α=.95. These results indicate that the CAAS and CBAQ scales, which are the data collection tools used in the study, have high reliability.
2.4. Data Analysis
This study aims to reveal the current situation in an unbiased manner. For this pur-pose, the researcher performed the data analysis process upon completion of data collec-tion by using statistical methods. SPSS 26.0 and AMOS 24 statistical package programs were used in analyzing the data. The significance level (significance level) was accepted as p=0.05. During data analysis, the validity and reliability of the data collection tools were first tested. According to Büyüköztürk [21], the Cronbach’s alpha value was calcu-lated for the reliability of the measurement tool, and two semi-tests were applied to the measurement tool. A confirmatory factor analysis (CFA) was completed to determine the construct validity of the measurement tool. To evaluate whether the data is normally dis-tributed, mean-mode-median, skewness-kurtosis values, Q-Q plots, box plot, histogram graphs, and Kolmogorov-Smirnov and Shapiro-Wilk normality tests can be used [22]. The Pearson correlation analysis was used to determine the level of correlation between scales. In this analysis, p≤0.05 was accepted as the level of significance. “Although this value shows that there are significant differences between the groups, it may not be a definite value” [23]. Therefore, prior to determining the statistical methods to use in analyzing the data in this study, graphs, skewness-kurtosis values, and normality tests were evaluated.
For the data to be considered normally distributed, the skewness- kurtosis values should be between (-1) and (+1), and the p values of the Kolmogorov-Smirnov and Shapiro-Wilk normality tests should be greater than 0.05 (p > 0.05). Likewise, Levene’s test value (p > 0.05) should be considered for homogeneity of variances (24). A Levene’s test value greater than 0.05 indicates a homogenous distribution [22].
3. Results
The skewness, kurtosis, mean, and standard deviation values of the scale and sub-dimensions of the Coaching Behavior Assessment Questionnaire and the Competitive Aggressiveness and Anger Scale” are presented in Table 2.
Correlation coefficients were calculated in the multiple regression analysis to deter-mine whether there was a linear relationship between the predictive variables of the CBAQ (E, GE, GEI, GC, and MCTI) sub-dimensions and the predicted variables of the CAAS (AD, AGD) sub-dimensions. The results of the Pearson correlation analysis per-formed to determine the possible relationship between the sub-dimensions of both scales are presented in Table 3.
The results of the multiple regression analysis performed to answer the question ‘Do the variables of trainer behaviors -E, GE, GEI, GC, and MCTI- together predict athletes’ anger (AA) significantly?’ are presented in Table 4 and Table 5. Table 4 shows the results of the ANOVA performed to determine if the regression model of the relationship between the predictor variables and the predicted variable was significant.
The results of the multiple regression analysis completed to answer the question ‘Do the E, GE, GEI, GC, and MCTI variables of coaching behavior significantly predict athletes’ aggressiveness (AAG)?’ are presented in Table 6 and Table 7. Table 6 presents the results of the ANOVA completed to determine whether the regression model accounted for the rela-tionship between the predictor and predicted variables.
According to Table 2, the mean scores of the five sub-dimensions of the “Coaching Behavior Assessment Questionnaire” vary between 4.02-4.14, and the standard deviations vary between .88-.99, while the mean scores of the sub-dimensions of the “Aggressiveness and Anger in Sports Scale” are 2.09 and 2.68, and the standard deviations are .87 and 1.03. The decrease between the mean scores and the standard deviation in both scales indicates a homogeneous structure has formed and the data are close to the mean. When the skew-ness and kurtosis values in Table 2 are examined, it can be said that the values calculated for the sub-dimensions of both scales range from 3 to -3, indicating a normal distribution [25]. These findings show that there is no abnormality in the distribution of the data, meaning there is a normal distribution in the scores of the scales and their sub-dimensions used in the study. In other words, the E, GE, GEI, GC, and MCTI scores are assumed to be normally distributed in multiple regression.
Table 3 shows a negative relationship between the mean scores of the CBAQ and CAAS. As the correlation coefficient is -0.255**, this is a weak but significant relationship. This indicates that as the CBAQ mean scores increase, the CAAS mean scores decrease. However, this is not a strong relationship. Based on the results presented in Table 3, there is a positive and moderate relationship between athlete’s anger (AA) and (AAG) (r =.640, p<.01), a negative and weak relationship between AA and E (r = -.223, p<.01), a negative and weak relationship between AA and GE (r=-.276, p<0.01), a negative and weak relationship between AA and GEI (r = -.185, p<0.01), a negative and weak relationship with CG (r = -.247, p<0.01), and a negative and weak relationship with MCTI (r = -.224, p<0.01). Similarly, the athlete’s aggressiveness (AAG), which is another dimension of coaching behavior, has a negative and weak relationship with E (r = -.122, p<.01),a negative and weak relationship with GE (r = -.205, p<0.01), a negative and weak relationship with GEI (r = -.100, p<0.01), a negative and weak relationship with GC (r = -.172, p<0.01), and a negative and weak relationship with MCTI (r = -.185, p<0.01). In terms of the correlations between the dimensions of the coaching behavior scale, there is a positive and strong relationship between E and GE (r =.758, p<0.01), a positive and strong relationship between E and GEI (r =.712, p<0.01), a positive and moderate relationship between E and GC (r =.691, p<0.01), and a positive and moderate relationship between E and MCTI (r =.670, p<0.01). It was also determined that there is a positive and moderate relationship between GE and GEI (r =.674, p<0.01), a positive and moderate relationship between GE and GC (r =.661, p<0.01), and a positive and strong relationship between GE and MCTI (r =.701, p<0.01). Additionally, there was a positive and moderate relationship between the GEI variable and GC (r =.675, p<0.01) and a positive and moderate relationship between GEI and MCTI (r =.637, p<0.01). Lastly, there is a positive and moderate relationship between GC and MCTI (r =.696, p<0.01).
According to the ANOVA results presented in Table 4, the multiple regression model for predicting the athlete’s anger dimension of the CAAS according to the encouragement, general encouragement, general encouragement instruction, general communication, and mistake-contingent technical instruction dimensions of the CBAQ is statistically significant (F (5, 742)=13.859.
Based on the results presented in Table 5, the variables E, GE, GEI, GC, and MCTI to-gether show a weak but significant relationship with the athletes’ anger (AA) dimension in terms of trainer behaviors (R=0.292, R2=0.085, p< .01). The five variables together ex-plain approximately 9% of the total variance in athletes’ anger (AA). According to the standardized regression coefficient (β), the relative significance of the predictor variables on job satisfaction is GE, GC, GEI, MCTI, and E, respectively. When the t-test results re-garding the significance of the regression coefficients are examined, it is found that only the “General Encouragement (GE) variable is a significant predictor of athletes’ anger (t(747)=3.66, p<.01). The E, GE, GEI, GC, and MCTI do not have any significant effect. The regression equation for the prediction of athletes’ anger according to the results of the re-gression analysis is given below.
| Athlete’s Anger (AA) = [3.264 + 0.005 Encouragement (E) + 0.060 General Encouragement Instruction (GEI)] – [0.207 General Encouragement (GE) + 0.125 General Communication (GC) + 0.018 Mistake-Contingent Technical Instruction (MCTI)] |
According to the ANOVA results presented in Table 6, the multiple regression model for the prediction of AAG according to E, GE, GEI, GC, and MCTI is statistically significant (F (5, 742) = 9.010).
According to the results shown in Table 7, the variables E, GE, GEI, GC, and MCTI together show a low and significant relationship with athletes’ aggressiveness (AAG) (R = 0.239, R2 = 0.057, p< .01). These five variables together explain approximately 6% of the total variance in athletes’ aggressiveness (AAG). The relative order of significance of the predictor variables on job satisfaction according to the standardized regression coefficient (β) is GE, E, GEI, GC, and MCTI, respectively. The t-test results regarding the significance of the regression coefficients indicate that only the general encouragement (GE) variable is a significant predictor of athletes’ aggressiveness (SD) t(747)=3.61, p<.01. On the other hand, it is seen that E, GEI, GC, and MCTI do not have a significant effect on athletes’ aggressiveness (AAG). The regression equation for the prediction of athletes’ aggressiveness (AAG) based on the results of the regression analysis is given below.
| Athlete’s Aggressiveness (AAG) = [3.593+ 0.127 Encouragement (E) + 0.118 General Encouragement Instruction (GEI)] – [0.247 General Encouragement (GE) + 0.116 General Communication (GC) + 0.101 Mistake-Contingent Technical Instruction (MCTI)] |
* According to these results, the hypothesis that only GE is a significant predictor of AA and AAG (H2) in the established model can be accepted. The other hypotheses that E is a significant predictor of AA and AAG (H1), that GEI is a significant predictor of AA and AAG (H3), that GC is a significant predictor of AA and AAG (H4), and that MCTI is a significant predictor of AA and AAG (H5) are refuted.
4. Discussion
In this study, the CBAQ and CAAS scales were used to examine the effects of per-ceived coaching behaviors on the anger and aggressiveness levels of male athletes. The CBAQ scale generally reflects moderate encouragement behaviors with a mean value of 3.99, while the CAAS scale reflects a low level of aggressiveness and anger with a mean value of 2.38. Correlation analysis results show that there are relationships at different levels between CBAQ and CAAS dimensions. These results show that coaching behaviors are effective in affecting the emotional reactions of athletes and show different relationships according to sub-dimensions.
In the study, ANOVA results show the degree to which CBAQ dimensions predict CAAS dimensions. The results of this analysis show that the predictor variables (CBAQ dimensions) have a significant effect on the CAAS dimensions. In the study, ANOVA re-sults show the degree to which CBAQ dimensions predict CAAS dimensions. The results of this analysis show that the predictor variables (CBAQ dimensions) have a significant effect on the CAAS dimensions. These results show that coaching behaviors affect male athletes’ anger and aggression levels.
In the study, the results of multiple regression analysis and the degree to which CBAQ dimensions predicted CAAS dimensions were examined in more detail. Analysis results reveal that encouragement and general encouragement dimensions significantly predict CAAS dimensions. These results revealed that coaches can influence athletes’ anger and aggression levels by encouraging them and displaying positive incentive behaviors.
Coaches have a great influence on athletes. Their guidance and leadership skills can directly affect the performance of athletes. Factors such as providing motivation, develop-ing technical skills, and creating team unity are just some of the areas where coaches are effective. Moreover, the behaviors and attitudes of coaches can affect the morale, motiva-tion, and general psychological state of the athletes. Therefore, the subjective influence of coaches on athletes can significantly affect their success and performance [26]. A study by Moiratidou [27], on the other hand, found the moral competence of individual athletes to be higher than that of team athletes. These results show that individual athletes attach more importance to moral values and have a higher level of moral competence. A study by Karayılmaz [28] examined the psychosocial factors affecting the aggression tendencies of amateur male football players. While the results of the study showed that various factors affect the aggressiveness levels of male football players, Tutkun et al. [29] concluded that the passive aggressiveness scores of athletes in individual sports are statistically significantly higher than those who engage in team sports.
The results of the correlation analysis revealed relationships between coaching behaviors and levels of anger and aggression. A certain level of correlation was observed between the dimensions of the CBAQ (Coaching Behavior Assessment Questionnaire) and the CAAS (Competitive Aggressiveness and Anger Scale) (Table 3). These findings show that coaching behaviors can influence the anger and aggressiveness levels of male athletes.
Multiple regression analysis results reveal the role of coaching behaviors in predict-ing the anger and aggression levels of male athletes. In the analyses performed based on the dimensions of the CBAQ, it was determined that certain dimensions affected the anger and aggressiveness levels of the athletes. These results show that the positive and supportive behaviors of coaches can play an important role in reducing the anger and aggression levels of male athletes.
The results of the ANOVA analysis explain in more detail the effects of coaching be-haviors on directing the anger and aggression levels of male athletes. In the analyses that were done based on the CAAS dimensions, there were differences in how well certain dimensions could predict the CBAQ dimensions. These results show that certain behav-iors of coaches can determine and direct the anger and aggression levels of athletes.
The results of this study highlight the impact of coaches on the anger and aggression levels of athletes. It is important to emphasize strategies for coping with anger and ag-gression in the training and development of coaches. Positive, supportive, and communi-cative coaching behaviors can increase the emotional well-being of athletes and positively affect their sporting performance.
This study had some limitations, as in scientific research. The research sample was carried out with male athletes from 14 provinces. Subgroup analyzes such as age, gender and sports branch were not performed. Athletes under the age of 18 are excluded from the scope.
5. Conclusions
In conclusion, the findings of this study can help coaches understand the emotional needs of athletes and provide support for them. At the same time, a positive sports environment can be created by protecting the emotional well-being of the male athletes, and their performance and personal development can be promoted. Sports clubs and federations should support the training and development of coaches. Training programs should aim to strengthen coaches’ emotional management skills, communication skills, and leadership abilities.
The following recommendations were made based on the results of this study:
- Training programs for coaches should aim to improve their emotional intelligence and communication skills. Coaches should be trained in emotional management strategies and stress coping techniques and transfer these skills to athletes.
- Coaches should set an example by supporting athletes and creating an environment of trust. Focusing on the personal development of athletes, they should consider individual differences and provide them with appropriate support.
- Coaches should actively communicate with athletes and try to understand their emotional needs. They should show empathy and provide open communication channels to protect athletes’ emotional well-being and increase their motivation.
- Sports clubs and federations should support the training and development of coaches. Training programs should aim to strengthen the leadership skills, communication skills, and psychological counseling competencies of coaches.
- Coaches should emphasize sport’s ethical values and support the spirit of fair play.
- It will be beneficial for the athletes if the coach stays away from attitudes that will put the athletes under excessive pressure and statements that will increase their aggression.
It will be beneficial for athletes to pay attention to the behavioral perceptions of their athletes during training and competitions, and to stay away from attitudes that will put their athletes under excessive pressure based on scores or expectations and statements that will increase their aggression.
Author Contributions
Conceptualization, A.K. and T.H.; methodology, G.Ö.; software, T.H. and G.Ö.; validation, A.K.; formal analysis, T.H.; investigation, T.H. and G.Ö.; resources, A.K.; data curation, T.H.; writ-ing—original draft preparation, T.H., A.K. and G.Ö; writing—review and editing, A.K. and G.Ö; visualization, T.H.; supervision, A.K. All authors read and approved the final manuscript.
Funding
This research received no external funding.
Ethics Approval and Consent to Participate
The study was conducted in accordance with the Declaration of Helsinki, and approved by the Scientific Research Ethics Committee of Kafkas University Social and Human Sciences Publication Ethics Committee (protocol code 2023/47 and date 05 July2023).
Availability of Data and Materials
The data presented in this study are available on request from the corresponding author.
Acknowledgment
We would like to thank all participants who contributed to the research.
Conflict of Interest
The authors declare no conflicts of interest.
References
- Sagar, S.S.; Jowet, S. Communicative acts in coach–athlete interactions: When losing competitions and when making mistakes in training. Western Journal of Communication. 2012, 76, 148–174. [Google Scholar] [CrossRef]
- Jaakkola, T.; Ntoumanis, N.; Liukkonen, J. Motivational climate, goal orientation, perceived sport ability, and enjoyment within. Scand J Med Sci Sports. 2016, 26, 109–115. [Google Scholar] [CrossRef] [PubMed]
- Avcı, K.S.; Çepikkurt, F.; Kale, E.K. Examination of the relationship between coach-athlete communication levels and perceived motivational climate for volleyball players. Universal Journal of Educational Research. 2018, 6, 346–353. [Google Scholar] [CrossRef]
- Mallett, C.J. Modelling the Complexity of the coaching process: A commentary. International Journal of Sports Science and Coaching. 2007, 2, 407–409. [Google Scholar]
- Jowett S, Poczwardowski A. Understanding the coach-athlete relationship. In Social Psychology in Sport, 1st ed.; Jowett, S, Lavallee, D, Human Kinetics: Champaign. 2007.
- Albrecht R. Positive Cooaching, Motivation and Communication. Research Study For The Study of Young Sports. Michigan State University. 2003.
- Danilewicz, C. Violence in Youth Sport: Potential Preventative Measures and Solutions. UNLV Theses, Dissertations, Professional Papers, and Capstones, University of Nevada, Las Vegas, 2012. [CrossRef]
- Kavussanu, M.; Stanger, N.; Boardley, I.D. The Prosocial and Antisocial Behaviour in Sport Scale: Further evidence for construct validity and reliability. Journal of Sports Sciences 2013, 31, 1208–1221. [Google Scholar] [CrossRef] [PubMed]
- Maxwell, J. Anger rumination: an antecedent of athlete aggression? Psychologist. Sports Exercise. 2004, 5, 279–289. [Google Scholar]
- İkizler C, Karagözoğlu C. Psychology of Success in Sports (In Turkish: Sporda Başarının Psikolojisi). 3rd ed.; Alfa Basım Yayım Dağıtım: İstanbul. 1997.
- Fields, S.; Collins, C.L.; Comstock, R.D. Violence in youth sports: Hazing, brawling and foul play. British Journal of Sports Medicine. 2010, 44, 32–37. [Google Scholar] [CrossRef] [PubMed]
- Gönen, M. The Effect of Coach-Athlete Relationship on Athletes’ State Anxiety, Anger and Subjective Well-Being Levels: Taekwondo and Protective Football Example. Doctoral Thesis, T.C. Gazi University Institute of Health Sciences, Ankara. 2019.
- Sevim, Y. Training Science (In Turkish; Antrenman Bilgisi). Nobel Yayın Dağıtım: Ankara. 2002.
- Dosil, J. The Sport Psychologist’s Handbook: A Guide for Sport-Specific Performance Enhancement, John Wiley Press: San Francisco. 2005.
- Karasar, N. Scientific Research Method (In Turkish: Bilimsel Araştırma Yöntemi). Nobel: Ankara. 2012.
- Filiz, B.; Demirhan, G. Adaptation of the coaching behavior assessment questionnaire into the Turkish culture. Spormetre. 2017, 15, 1–10. [Google Scholar] [CrossRef]
- Gürbüz, B.; Kural, S.; Özbek, O. Competitive aggressiveness and anger scale: validity and reliability study. Sportif Bakış: Spor ve Eğitim Bilimleri Dergisi. 2019, 6, 206–217. [Google Scholar] [CrossRef]
- Coughan, J.; Mullen, M.R. Structural equation modelling: guidelines for determining model fit. Electronic Journal of Business Research Methods. 2008, 6, 53–60. [Google Scholar]
- Korucuk, M. A distance education attitude scale: A validity and reliability study. Millî Eğitim Dergisi. 2023, 52, 1133–1156. [Google Scholar] [CrossRef]
- Harrington, D. Confirmatory factor analysis. Oxford University Press: United Kingdom. 2009. [CrossRef]
- Büyüköztürk, Ş. Manual of data analysis for social sciences (In Turkish: Sosyal Bilimler için Veri Analizi El Kitabı). Pegem Akademi Yayınları: Ankara. 2010.
- Korucuk, N. Consumer purchasing behavior on green products in the context of green marketing. Master Thesis, Kafkas University, Institute of social sciences, Department of business of administration. Kars. 2019. [Google Scholar]
- Hung, H.M.J.; O’neıl, R.T.; Bauer, P.; Kohne, K. The behavior of the p-value when alternative hypothesis is true? Biometrics. 1997, 53, 11–22. [Google Scholar] [CrossRef] [PubMed]
- Pallant, J. SPSS Survival Manual. Anı Yayıncılık: Ankara. 2020.
- Tabachnick BG, Fidell LS. Using Multivariate Statistics (6th ed.), Allyn and Bacon: Boston. 2013.
- Kalkan, T.; Sarı, İ. Coaching behaviors: theoretical approaches, coaches’ effect on athletes and recommendations. Review Article Journal of Exercise and Sport Sciences Research. 2021, 1, 38–49. [Google Scholar]
- Mouratidou, K. Determinants of athletes’ moral competence: The role of demographic characteristics and sport-related perceptions. Sport in Society 2017, 20, 802–815. [Google Scholar] [CrossRef]
- Karayılmaz, A. Psychological and Social Reasons That Make The Amateur Players of Show Agressive Behaviours (Zonguldak Super Amateur League Sample). Master Thesis. Sakarya University Insitute of Social Sciences, Sakarya. 2006.
- Tutkun, E.; Güner, B.Ç.; Ağaoğlu, S.A.; Soslu, R. Evaluation of aggression levels of individuals participating in team and individual sports. Spor ve Performans Araştırmaları Dergisi. 2010, 1, 23–29. [Google Scholar]
Figure 1.
CFA Diagrams.

| Fit Indices | Reference Range | Results | Evaluation | |||
|---|---|---|---|---|---|---|
| Good | Acceptable | CAAS | CBAQ | CAAS | CBAQ | |
| CMIN/DF | 0<χ2/sd≤3 | 3<χ2/sd≤5 | 3.600 | 4.815 | Acceptable | Acceptable |
| RMSEA | 0≤RMSEA≤.05 | .05≤RMSEA≤ .08 | .059 | .071 | Acceptable | Acceptable |
| GFI | .90<GFI≤1 | .85<GFI≤.90 | .985 | .904 | Good | Good |
| AGFI | .90<GFI≤1 | .85<GFI≤.90 | .962 | .874 | Good | Acceptable |
| CFI | .95<CFI≤1 | .90<CFI≤.94 | .984 | .922 | Good | Acceptable |
| RMR | 0≤RMR≤.05 | 0.05≤SRMR≤.10 | .039 | .042 | Good | Good |
| TLI | .95<TLI≤1 | .90<TLI≤.94 | .970 | .907 | Good | Acceptable |
| DF | 11 | 176 | ||||
| CMIN | 39.595 | 847.366 | ||||
| Cronbach’s Alfa-α | .83 | .95 | Highly Reliable | |||
CMIN/DF: Minimum Discrepancy Function by Degrees of Freedom divided, RMSEA: Root Mean Squared Error of Approximation, GFI: Goodness of Fit Index, AGFI: Adjusted Goodness of Fit Index, CFI: Comparative Fit Index, RMR: Root Mean Square Residual, TLI: Tucker-Lewis Index, DF: Degree of freedom, CMIN: Goodness-of-Fit indices, CAAS: Competitive Aggressiveness and Anger Scale, CBAQ: Coaching Behavior Assessment Questionnaire.
Table 2.
Skewness-Kurtosis, Mean, and Standard Deviation Values of the Scales/Dimensions.
| Variables | n | M | sd | Skewness | Kurtosis |
|---|---|---|---|---|---|
| CBAQ | 748 | 3.99 | 0.73 | -0.471 | -0.907 |
| CAAS | 748 | 2.38 | 0.86 | 0.306 | -0.331 |
| CBAQ Encouragement dimension | 748 | 4.02 | 0.88 | -0.527 | -0.689 |
| CBAQ General Encouragement dimension | 748 | 4.14 | 0.92 | -0.883 | 0.197 |
| CBAQ General Encouragement Instruction | 748 | 4.11 | 0.91 | -0.806 | 0.063 |
| CBAQ General Communication dimension | 748 | 4.07 | 0.92 | -0.826 | -0.137 |
| CBAQ Mistake-Contingent Tech. Inst. | 748 | 4.06 | 0.99 | -0.886 | 0.083 |
| CAAS Anger Dimension | 748 | 2.09 | 0.87 | 0.797 | 0.485 |
| CAAS Aggressiveness Dimension | 748 | 2.38 | 1.03 | 0.070 | -0.944 |
Table 3.
Correlation Analysis of the Mean Scores of CBAQ and CAAS.
| Scales/Sub-Dimensions | 1 | 1.a | 1.b | 1.c | 1.d | 1.e | 2. | 2.a | 2.b |
|---|---|---|---|---|---|---|---|---|---|
| 1.CBAQ | 1 | ||||||||
| 1.a- E | 0.894** | 1 | |||||||
| 1.b-GE | 0.869** | 0.758** | 1 | ||||||
| 1.c-GET | 0.814** | 0.712** | 0.674** | 1 | |||||
| 1.d-GC | 0.849** | 0.691** | 0.661** | 0.675** | 1 | ||||
| 1.e-MCTI | 0.827** | 0.670** | 0.701** | 0.637** | 0.696** | 1 | |||
| 2.CAAS | -0.255** | -0.185** | -0.262** | -0.153** | -0.227** | -0.223** | 1 | ||
| 2.a. AA | -0.279** | -0.223** | -0.276** | -0.185** | -0.247** | -0.224** | 0.887** | 1 | |
| 2.b-AAG | -0.191** | -0.122** | -0.205** | -0.100** | -0.172** | -0.185** | 0.922** | 0.640** | 1 |
Table 4.
The results of the ANOVA regarding the prediction of the anger in sports dimension of the CBAA according to the CAAS dimensions of encouragement, general encouragement, general encouragement instruction, general communication, and mistake-contingent technical instruction.
Table 4.
The results of the ANOVA regarding the prediction of the anger in sports dimension of the CBAA according to the CAAS dimensions of encouragement, general encouragement, general encouragement instruction, general communication, and mistake-contingent technical instruction.
| Model | Sum of Squares | df | Mean Square | f | p |
|---|---|---|---|---|---|
| Regression | 48.390 | 5 | 9.678 | 13.859 | 0.00a |
| Residual | 518.160 | 742 | 0.698 | ||
| Total | 566.550 | 747 | |||
| a. Predictor variables: The E, GE, GEI, GC, and MCTI dimensions of CBAQb. Predicted variables: AA dimension of CAAS | |||||
Table 5.
Multiple regression analysis results to predict the anger dimension of the CAAS according to the encouragement, general encouragement instruction, general communication, and mistake-contingent technical instruction dimensions of the CBAQ.
Table 5.
Multiple regression analysis results to predict the anger dimension of the CAAS according to the encouragement, general encouragement instruction, general communication, and mistake-contingent technical instruction dimensions of the CBAQ.
| Variable | B | Standard ErrorB | Standardized (β) | t | p |
|---|---|---|---|---|---|
| Fixed | 3.264 | .159 | - | 20.486 | 0.00 |
| E dimension | .005 | .061 | .005 | .075 | 0.94 |
| GE dimension | -.207 | .057 | -.220 | -3.663 | 0.00 |
| GEI dimension | .060 | .053 | .063 | 1.145 | 0.25 |
| GC dimension | -.125 | .053 | -.133 | -2.365 | 0.01 |
| MCTI dimension | -.018 | .049 | -.020 | -.365 | 0.71 |
| R = 0.292, R2 = 0.085 F (5, 742)=13.859, p = .000 | |||||
E: Encouragement, GE: General Encouragement, GEI: General Encouragement Instruction, GC: General Communication, MCTI: Mistake-Contingent Technical Instruction.
Table 6.
ANOVA results for predicting the athlete’s aggressiveness (AAG) dimension of CAAS according to the CBAQ dimensions of encouragement, general encouragement, general encouragement instruction, general communication, and mistake-contingent technical instruction.
Table 6.
ANOVA results for predicting the athlete’s aggressiveness (AAG) dimension of CAAS according to the CBAQ dimensions of encouragement, general encouragement, general encouragement instruction, general communication, and mistake-contingent technical instruction.
| Model | Sum of Squares | df | Mean Square | F | Sig. |
| Regression | 46.115 | 5 | 9.223 | 9.010 | 0.00a |
| Residual | 759.537 | 742 | 1.024 | ||
| Total | 805.652 | 747 | |||
| a. Predictor variables: The E, GE, GEI, GC, and MCTI dimensions of CBAQb. Predicted variables: Athlete’s anger dimension of CAAS | |||||
Table 7.
Multiple regression analysis results for the prediction of athletes’ aggressiveness dimension of CAAS according to the encouragement, general encouragement, general encouragement instruction, general communication, and mistake-contingent technical instruction dimensions of CBAQ.
Table 7.
Multiple regression analysis results for the prediction of athletes’ aggressiveness dimension of CAAS according to the encouragement, general encouragement, general encouragement instruction, general communication, and mistake-contingent technical instruction dimensions of CBAQ.
| Variable | B | Standard Error B | Standardized (β) | t | p |
| Fixed | 3.593 | .193 | - | 18.626 | 0.00 |
| E dimension | .127 | .074 | .108 | 1.723 | 0.08 |
| GE dimension | -.247 | .069 | -.220 | -3.607 | 0.00 |
| GEI dimension | .118 | .064 | .104 | 1.846 | 0.06 |
| GC dimension | -.116 | .064 | -.103 | -1.807 | 0.07 |
| MCTI dimension | -.101 | .059 | -.097 | -1.717 | 0.08 |
| R =0.239 R2 = 0.057 F (5. 742)= 9.010 p = .000 | |||||
E: Encouragement, GE: General Encouragement, GEI: General Encouragement Instruction, GC: General Communication, MCTI: Mistake-Contingent Technical Instruction.
Disclaimer/Publisher’s Note: The statements, opinions and data contained in all publications are solely those of the individual author(s) and contributor(s) and not of MDPI and/or the editor(s). MDPI and/or the editor(s) disclaim responsibility for any injury to people or property resulting from any ideas, methods, instructions or products referred to in the content. |
© 2024 by the authors. Licensee MDPI, Basel, Switzerland. This article is an open access article distributed under the terms and conditions of the Creative Commons Attribution (CC BY) license (http://creativecommons.org/licenses/by/4.0/).
Copyright: This open access article is published under a Creative Commons CC BY 4.0 license, which permit the free download, distribution, and reuse, provided that the author and preprint are cited in any reuse.


