Submitted:
28 February 2024
Posted:
28 February 2024
You are already at the latest version
Abstract
The development of biofuels and biodiesel industry specifically, has resulted in the generation of large amounts of glycerol as a surplus. The conversion of glycerol, into chemicals with indus-trial interest, through anaerobic fermentation using E. coli as a biocatalyst is an attractive alter-native to improve economic performance in the biodiesel industry, for example through the bi-otransformation of residual glycerol into ethanol. For 2019, the size of the global ethanol market was valued at $ 89.1 billion US dollar. Biodiesel can be produced from several materials like rapeseed, palm, soya, corn, palm kernel, frying oil or olive-pomace oil (OPO). The last, can be extracted from alperujo, byproduct of olive oil process. However, olive-pomace oil converting into biodiesel is not enough established to achieve a global olive-oil/biodiesel derived process with minimized waste generation. Traditionally biodiesel production process produces an equivalent of 10% by mass of glycerol as a waste or by-product. This work explores the conver-sion of residual glycerol into chemicals like ethanol and hydrogen with a focus on projecting raw material potential availability from OPO, contributing to the promotion of the use of biofu-els and biodegradable compounds.
Keywords:
Glycerol
; Pilot scale
; olive pomace oil
; Fed-batch culture
; Escherichia coli MG1655
; Ethanol
1. Introduction
Under the term biofuel it is possible to group those liquid and gaseous fuels derived from organic matter IEA [1] that can play an important role in reducing CO2 emissions in both the public and private transport sectors. Biofuels being more recognized, and with the greatest presence in the global energy market, are ethanol (or bioethanol) and biodiesel. The first is produced from sugars, starches (sugar cane, beet, corn, etc.) or lignocellulosic materials (forest residues, agricultural residues, etc.) through a fermentation process and a later stage distillation/dehydration. Biodiesel is produced, generally, from oils of vegetable origin through a process which key step corresponds to a transesterification reaction where lipids react with an alcohol (generally methanol) in the presence of an alkaline catalyst (usually NaOH or KOH), generating a mixture of fatty acid methyl esters (biodiesel) and glycerol as a by-product, in an approximate proportion of 10 kg of glycerol for every 100 kg of biodiesel produced. According to Grand View Research Inc., by 2019 the global glycerol market was valued at USD 2.6 billion and is expected to grow at a compound annual growth rate (CAGR) of 4.0% from 2020 to 2027.
Glycerol has some characteristics such as its high solubility in aqueous medium or a greater degree of reduction compared to sugars (glycerol = 4.67; glucose = 4; xylose = 4 [2], and it offers the opportunity to obtain reduced chemical compounds such as succinate, ethanol, xylitol, propionate, hydrogen, among others [3]. This has resulted in glycerol being considered an attractive carbon source to produce reduced chemical compounds such as 1,2 propanediol, lactic acid or ethanol. Glycerol is used in various applications within the cosmetic, paint, automobile, food, pharmaceutical, paper pulp and textile industries. It also finds applications as a raw material in the production of various chemical compounds and, new applications continue to appear, mainly in the food industry, in the polyurethane industry and in the production of molecules such as dihydroxyacetone, glyceric acid, hydroxypyruvic acid and glycerol carbonate [3]. The use of glycerol for biotransformation processes with microorganisms can face barriers when considering a commercial application, for example, in relation to the degree of pathogenicity of the microorganism used or the existing lack of knowledge regarding its metabolism and its genome [4]. Escherichia coli presents differences, compared to other microorganisms, that enhance its industrial use and that are related to its versatility in the use of different carbon sources [5] or the complete knowledge of its genome [6]. The ability of E. coli to use glycerol as a carbon source and, under anaerobic conditions, produce ethanol and hydrogen [7] has opened an attractive field of application for glycerol from the biodiesel industry.
Alternatives sources for biodiesel production must be evaluated, where fatty byproducts can be found. For example, olive oil is produced from olive trees, yielding between 15 and 40kg of olives per year, and it is an important agro-industrial sector in the Mediterranean region, with approximately 3.3 million olive growers (one-third of EU farmers) and average production near 16 million metric tons of olives and more than 3 million tons of olive oil annually [8]. Worldwide olive oil production for the year 2002 was about 2.5 million tons produced from approximately 750 million productive olive trees, the majority of which are in the Mediterranean region. There are about 25000 olive mills worldwide. Mediterranean countries alone produce 97% of the total olive oil production and the biggest olive oil-producing countries are Spain, Italy, Greece, and Turkey (∼0.9, 0.6, 0.4, and 0.2 million t in 2002, respectively), followed by Tunisia, Portugal, Morocco, and Algeria [9], in the 2011/12–2015/16, the EU accounted for 70% of production, 56% of consumption and66% of olive oil exports worldwide [10].
Olive pomace is the most important by-product in the olive oil extraction industry [11], has a high moisture (>50% by weight), rapidly fermentable by-product, which is usually disposed of by spreading on land. However, owing to its high content in phenolic compounds, the disposal of such a polluting material poses a risk to the environment [12]. Using olive pomace as low-cost support material and pomace oil as cheap raw material also its renewable characteristics make a promising one for biodiesel applications [13,14].
This work focuses the use of crude glycerol, from industrial biodiesel production, as main carbon source for a fermentation process that explores its transformation into ethanol and hydrogen in a pilot reactor. Additionally, an estimate of the coverage and potential impact that this technology could have on the management of OPO (olive pomace oil) derived from the production of olive oil and its use as a raw material for the biodiesel industry, is made.
2. Materials and Methods
2.1. Microorganism and Glycerol Source
E. coli wild-type MG1655, CGSC#6300, was obtained from the E. coli Genetic Resource Center (Coli Genetic Store Center, Department of Molecular, Cellular & Developmental Biology at Yale University) and Crude glycerol (CG) was obtained from a biodiesel production plant (Abengoa Bioenergy S.A.) located in San Roque (Cádiz, Spain) as described in Cofré et al. [15].
2.2. Bioreactors
A pilot-scale closed loop mixed reactor with 200 L of working volume (PR) with a gas diffusion membrane, was utilized [15].
2.3. Fermentation Conditions
Pilot reactor (PR), under a fed-batch fermentation mode, was inoculated with 5.5 L of culture at an optical density ≈ 0.6 (600 nm), previously cultured in a reactor 5 L working volume (R5). The culture medium used during batch step corresponded to an optimized culture medium as described in Cofré et al. [16]. Once the discontinuous phase was completed a feeding step, under an exponential function, began up to a final volume of fermentation as described in Cofré et al. [15].
2.4. Analytical Methods
Biomass, glycerol, hydrogen and ethanol concentrations were determined according to same protocol described in Cofré et al. [16].
The coefficient of variation (CV) for concentration measurements of biomass, glycerol, ethanol and H2 were 4.39, 9.90, 20.03 and 4.78%, respectively (obtained by replicate of 100 experiments working with 2 mL of culture medium at a fermentation time of 48 h (data not published).
2.5. Kinetic Parameters
Specific growth rate (µ; h-1) was estimated by plotting total cell concentration against fermentation time in a log-linear plot, for a batch fermentation. The slope of the curve so obtained during exponential growth was used as the specific growth rate. Yields (YX/S, YP/S) expressed as g g-1 of cell or ethanol per glycerol, respectively, were calculated as the increase in cell mass or ethanol per glycerol consumed once the cultures reached the stationary phase (data not published).
2.6. Mathematical Modeling of RP
The experimental data obtained during the development of PR were treated and adjusted by means of mathematical simulation. The theoretical mathematical model used describes, in a general way, a fed-batch type fermentation by means of a system of three differential equations according to:
where:
F: feed volumetric flow rate (L h-1)
S: crude glycerol concentration (CG) (g L-1)
Sf: CG concentration in the feed stream (g L-1)
V: reaction volume (L)
X: biomass concentration (g biomass L-1)
YX/S: nutrient yield in biomass (gbiomass gglycerol-1)
µ: specific growth rate of the microorganism (h-1)
3. Results
3.1. Pilot Scale Fed-Batch Fermentation
The results obtained show that the CG fermentation process withstood the scale change, being possible to reach final values of ethanol and biomass concentration higher than those obtained in R5, as described in Cofré et al [15]. This experience was divided chronologically into three stages: a batch stage (stage I, 63.5 hour), a fed-batch stage (stage II, 96 hour) and a post-batch stage (stage III, 92 hour) and a summary of them are presented in Table 1.
During stage II, the biomass yield with respect to the CG consumed YX/S was equal to 0.03 g g-1 and for the case of ethanol YP/S reached a value of 0.43 g g-1 for a concentration of ethanol on the order of 5.4 g L-1. This final ethanol concentration value is within the order of magnitude of the results obtained in R5, being 14% lower. At the end of stage II, a CG consumption of 52.7% had been achieved, reaching a concentration value in the medium of 10.6 g L-1. On the other hand, the biomass reached the steady state after 155 h of fermentation and remained at a constant concentration value equal to 0.65 g L-1 until 250 h. At the end of stage III, all the CG had been consumed, reaching the maximum concentration of ethanol at the same time. Indeed, during stage III the remaining CG was completely consumed after 68 h (≈75% of the total time), a time that coincided with the maximum ethanol concentration that was reached and that corresponded to 8.15 g L-1.
The global behavior of PR was like that obtained in previously experiments at smaller scales (R5-5.5L batch fermentation), regarding the consumption of CG and production of ethanol during the post batch (stage III) the maximum concentration of ethanol reached in was equal to 7.58 g LO while in RP the maximum concentration was higher and equal to 8.51 g L-1, CG accumulation profile was remarkably similar except for the decrease registered in R5 at 68.5 h of fermentation time.
3.2. Mathematical Modeling
The considerations and assumptions made for the development of the mathematical model used correspond to an exponential variation of the feed flow rate over time and, in addition, it was considered that the specific population growth rate could be described according to the Monod model. (Monod, 1949). Thus, we have then:
where:
µm: maximum specific growth rate (h-1)
KS: saturation constant (g L-1)
The kinetic parameters for the Monod equation were obtained from two sources. First, the value of the maximum specific growth speed (µm) was assumed equal to 0.044 h-1 according to the value indicated by Murarka et al. (2008) [7]. Second, the value of the mean saturation constant (KS) was considered equal to 6.5645 g L-1. In the literature [17] it is possible to find a KS value for E. coli, under anaerobic conditions with glycerol as substrate, equal to 14.6464 g L-1, this value was evaluated during the adjustment of the experimental data to the theoretical model for fed-batch and the result obtained will be discussed later. The time interval chosen for the numerical integration, using the 4th order Runge-Kutta method, required to solve the system of equations was between 63.5 and 159.5 h, corresponding to the beginning and end of the feeding stage, respectively. Therefore, the initial values of reaction volume (V), substrate concentration (S) and biomass concentration (X) were chosen according to the experimental values for a fermentation time t = 63.5 h, which then corresponded to V0 = 50 L, S0 = 0.06 g L-1 and X0 = 1.19 g L-1. It must be considered that PR fermentation was carried out considering a design value for F0 equal to 0.25 L h-1 which corresponds to a feeding time of 97 h. The fit of the theoretical model against the experimental data was carried out based on three scenarios, described in Table 2. In a preliminary way, other alternative scenarios were considered, considering as a restriction, when discriminating between one result and another, the physical meaning of each parameter. The result of the adjustment for each of them was not satisfactory since the numerical values found did not comply with the proposed restriction.
The resolution of the system of equations was carried out by means of the 4th order Runge-Kutta method and the result of the parameter adjustment with respect to the theoretical model is presented in Table 3, where it is possible to observe that the E1 scenario predicts a value for F0 that corresponds to the one furthest from the design value.
For both E2 and E3, the F0 value obtained from the numerical adjustment is closer to the design value. In the last case (E3), the parameter Ks was left free to obtain a value from the numerical adjustment. The volume variation profiles (V), CG consumption (SV) and biomass production (XV) were graphically represented with respect to the fermentation time corresponding to the experimental data and were compared with the simulated profiles from the numerical resolution of the model. Figure 1a, 1b and 1c show the experimental data for PR contrasted with the curves obtained for the simulation of E2 and E3.
The existing discrepancy for biomass (XV) may be related to the µm value that was used with the same value (0.044 h-1) for all the cases presented. Apparently, the value of Ks does not present a significant influence for XV since the curves obtained for E2 and E3 are practically the same. Moreover, during the actual process, despite the accumulation of CG within the system, there is substrate consumption, but the biomass grows at a slower rate than the rate of volume increase and ethanol production, a fact that is evident when there is an observed negative variation of the biomass concentration compared to the positive variation of the ethanol concentration during fermentation. Taken to cell mass and product mass, a rate of increase for XV can be estimated approximately equal to 0.897 g h-1 and in the case of ethanol this rate could be set at 14.25 g h-1 so it can be deduced that the observed CG consumption is more related to ethanol production than to biomass growth. However, this condition is not considered in the proposed model and the accumulation of CG translated as an increase in the value of S, provides a value of µ greater than the real one, which results in an oversized prediction of the cell mass within the reactor.
With respect to the adjustment corresponding to the substrate (SV), as described in Cofré et al. [15], for the experimental points corresponding to 130 h and 140 h it is where the greatest discrepancy occurs with respect to the E2 simulation, while the initial zone of points included between 63.5 and 115 hours is reasonably described by the model. When the comparison with the E3 simulation is made, a contrary behavior can be observed since the curve corresponding to the simulation passes precisely through the experimental value. In fact, the value provided by the model corresponds to 496.88 g while the experimental value is 497.35 g. Figure 2 compares the residuals obtained for E2 and E3, defined as the difference between the real response value (y) and the response value predicted by the model (ŷ) [18].
The influence of the value that Ks takes is notorious when analyzing the variation of the substrate where the final curvature of the SV profile is better described with an estimated Ks equal to 10.7703 g L-1, which is 64.1% greater than the value obtained in this work, while the value of F0 corresponding to the E3 adjustment is 12.18% greater than that obtained from the E2 adjustment. On the other hand, an extra scenario was evaluated leaving the corresponding values for F0, µm and Ks free. However, the values obtained for µm and Ks (0.0242 h-1 and 1.7217 g L-1, respectively) did not make sense according to what was observed throughout the development of this work and in the consulted literature, the explanation can be based on the compensation that must be created, between the values assigned to each parameter, when solving and minimizing the difference between the values delivered by the model and the real data.
From the above, E2 is the scenario chosen to describe the fed-batch zone of RP, because the value of F0 obtained by means of the numerical adjustment, and equal to 0.302 L h-1, is the closest to the value design (0.25 L h-1) with a difference of 20%. Although it is true, this difference can be debatable and a lower value for it would be desirable, the model under E2 allows us to adequately describe RP as a fermentation in fed-batch mode with exponential feeding. In addition, it should be noted that under E2 the weight of the adjustment fell only on F0 while µm was obtained from the literature and agreed with the µ values observed during the development of this work (approximately 0.03 h-1); while the value of Ks was obtained from the adjustment of real data generated in batch conditions at a smaller scale (reactor R5), which in a certain way would allow a validation of the value of this parameter.
3.3. Olive Pomace Oil Projections
In recent years, global interest in the production of renewable energy from biomass has increased significantly because it can be considered as a tool to help reduce global warming, due to its potential to replace the use of fossil fuels [19]. However, for it to be considered as a competitive alternative to energy obtained from oil, the energy required for biomass production must not exceed the amount of energy that can be extracted from biomass. Edible vegetable oils such as canola, soybeans and corn have been used to produce biodiesel as a substitute for diesel, impacting other productive areas such as food production, agriculture, and land use, among others. Additionally, in the literature [20], it has been reported that a major obstacle in the commercialization of biodiesel production from edible vegetable oil is its high production cost, which is due to the high cost of edible oil. In this sense, the above has boosted the search for alternative sources to obtain oil for biodiesel production [21,22], where it is possible to detach recovered cooking oil, microalgae, or agro-industrial waste such as olive pomace.
Rajaeifar et al. [23] compared, through LCA (Life Cycle Assessment), the environmental impacts of biodiesel derived from Olive pomace oil (OPO) for B100, B20 and petroleum diesel No. 2, identifying the existence of environmental trade-offs between the categories of climate change and damage to resources. Furthermore, it was found that biodiesel required some remedial practices (in view of the agricultural and combustion stages) to be more environmentally friendly in all the mentioned damage categories. The results obtained showed that the B100 mixture was the worst in the Human Health and Ecosystem Quality damage categories due to the significant amount of emissions in the agricultural stage and the increase, of approximately 15%, in the amount of emissions of NOx during combustion compared to diesel. In contrast, in the Climate Change and Resources damage categories, the B100 mixture was the best and the No.2 petroleum diesel was the worst. Considering the results, authors suggested to adopt changes in agricultural practices to optimize the consumption of fertilizers and manure, as well as in the stage of use of biodiesel derived from OPO. An economic analysis presented in the same study showed a benefit / cost ratio of 1.45 revealing the economic viability of the production of biodiesel derived from OPO.
According to literature [24], olive pomace has a proximal composition corresponding to: moisture (% in wet base) 6.86, ashes (% in dry base) 5.55, fixed carbon (% in dry base) 17.28 and volatile matter (% in dry base) 77.18, in addition to a higher heating value (HHV) of 22,032.95 kJ kg-1 (dry base) 33.8% lower compared to petroleum coke 33,280.37 kJ kg-1 (dry basis) [25]. Olive pomace contains 2 to 12% oil, depending on the olive oil production technology[26]. Regarding the use of OPO as raw material to produce biodiesel, it has been reported [27] that it is possible to obtain a product with the same yields as other primary sources for the production of biodiesel, such as soybean oil or rapeseed oil [23].
Each year, one million tons of olives are used in the production of olive oil and about 450,000 t of olive pomace are obtained [26]. OPO is extracted from solid waste called two-phase pomace or “alperujo”. Alperujo is readily available (Spain generates about 4-6 million t per year) and is a low-cost raw material, but other important aspects must be considered such as its high humidity (50-70%) and low content of oil [27,28]. Specifically, with respect to OPO, as an example, in Greece the annual production of OPO is equivalent to 40,000 t [29] and in Spain, for the 2005-2006 season, this value reached 56,000 t [27]. Ten to twenty-seven kilograms of olive oil and 35 to 45 kg of olive pomace are obtained on average from 100 kg of olives; From 6 to 7.5 kg of olive pomace oil and 60 to 70 kg of dry olive pomace are obtained from 100 kg of olive pomace [26].
From the results obtained in this work, it is possible to present a projection of the existing theoretical potential for the use of the generated OPO, taking Spain as an example, from the conversion of OPO to biodiesel, the obtaining of glycerin as a by-product of the previous process to the biotransformation of the latter through a fermentation process to produce ethanol and hydrogen. Taking into consideration the parameters contained in Table 4, it is possible to estimate a production, expressed in (t year-1), equivalent to: 53312 (biodiesel), 2968 (glycerol), 979.44 (ethanol) and 36.13 (hydrogen).
4. Conclusions
After studying the biotransformation process of crude glycerol on a pilot scale reactor, under a fed-batch mode with an exponential type feeding function, it can be concluded that the biotransformation process of CG is viable and reproducible against to the one carried out in R5, registering final values for the consumption of CG and final concentration of ethanol that are comparable to those obtained on a smaller scale. Fermentation in RP could be adequately modeled, by means of a system of differential equations that describe the behavior of a bioreactor operating in fed-batch mode with exponential feeding. Furthermore, fed-batch mode under an exponential feeding regime is a promising strategy to produce ethanol and hydrogen from crude glycerol and OPO utilization for biodiesel production gives new opportunities to achieve a global process with minimized waste generation.
Funding
Research funded by Consejeria de Economia, Innovación, Ciencia y Empleo, Junta de Andalucia (P09-TEP-4830M) through project “Utilization of glycerol by fermentation: feasibility alternative biodiesel industry”. Fundación Carolina (Spain)-Universidad de Cádiz (Spain)-Universidad de Valparaíso (Chili) Doctorate Scholarship.
References
- IEA, Technology Roadmap Biofuels for transport. 2011, International Energy Agency: Paris, France.
- Villadsen, J.; Nielsen, J.; Lidén, G. Bioreaction Engineering Principles. 3 ed. 2011, New York: Springer US. 561.
- da Silva, G.P.; Mack, M.; Contiero, J. Glycerol: a promising and abundant carbon source for industrial microbiology. Biotechnol Adv 2009, 27, 30–39. [Google Scholar] [CrossRef]
- Yazdani, S.; Gonzalez, R. Engineering Escherichia coli for the efficient conversion of glycerol to ethanol and co-products. Metab Eng 2008, 10, 340–351. [Google Scholar] [CrossRef] [PubMed]
- Murarka, A. Metabolic flux analysis of fermentative carbon metabolism in Escherichia coli. 2008, Rice University.
- Blattner, F.R. The Complete Genome Sequence of Escherichia coli K-12. Science 1997, 277, 1453–1462. [Google Scholar] [CrossRef] [PubMed]
- Murarka, A., et al. Fermentative utilization of glycerol by Escherichia coli and its implications for the production of fuels and chemicals. Applied and Environmental Microbiology 2008, 74, 1124–1135. [Google Scholar] [CrossRef] [PubMed]
- Abu Tayeh, H.N.; Azaizeh, H.; Gerchman, Y. Circular economy in olive oil production – Olive mill solid waste to ethanol and heavy metal sorbent using microwave pretreatment. Waste Management 2020, 113, 321–328. [Google Scholar] [CrossRef] [PubMed]
- Souilem, S., et al. Chapter 1 - Olive oil production sector: environmental effects and sustainability challenges, in Olive Mill Waste, C.M. Galanakis, Editor. 2017, Academic Press. p. 1-28.
- Gonzalez-Fernandez, I., et al. A critical review on the use of artificial neural networks in olive oil production, characterization and authentication. Critical Reviews in Food Science and Nutrition 2019, 59, 1913–1926. [Google Scholar] [CrossRef]
- Giuffrè, A.M., et al. Volatile profiles of extra virgin olive oil, olive pomace oil, soybean oil and palm oil in different heating conditions. LWT 2020, 117, 108631. [Google Scholar] [CrossRef]
- Volpe, M.; Fiori, L. From olive waste to solid biofuel through hydrothermal carbonisation: The role of temperature and solid load on secondary char formation and hydrochar energy properties. Journal of Analytical and Applied Pyrolysis 2017, 124, 63–72. [Google Scholar] [CrossRef]
- Yücel, Y. Biodiesel production from pomace oil by using lipase immobilized onto olive pomace. Bioresource Technology 2011, 102, 3977–3980. [Google Scholar] [CrossRef]
- Yücel, Y. Optimization of biocatalytic biodiesel production from pomace oil using response surface methodology. Fuel Processing Technology 2012, 99, 97–102. [Google Scholar] [CrossRef]
- Cofré, O., et al. Pilot scale fed-batch fermentation in a closed loop mixed reactor for the biotransformation of crude glycerol into ethanol and hydrogen by Escherichia coli MG1655. Biomass and Bioenergy 2016, 91, 37–47. [Google Scholar] [CrossRef]
- Cofré, O., et al. Optimization of culture media for ethanol production from glycerol by Escherichia coli. Biomass and Bioenergy 2012, 37, 275–281. [Google Scholar] [CrossRef]
- Cintolesi, A., et al. Quantitative analysis of the fermentative metabolism of glycerol in Escherichia coli. Biotechnol Bioeng 2012, 109, 187–98. [Google Scholar] [CrossRef]
- Montgomery, D.C., ed. Design and analysis of experiments. 5 ed. 2001, John Wiley & Sons, Inc.
- Leiva-Candia, D.E., et al. The potential for agro-industrial waste utilization using oleaginous yeast for the production of biodiesel. Fuel 2014, 123, 33–42. [Google Scholar] [CrossRef]
- Mohammadshirazi, A., et al. Energy and cost analyses of biodiesel production from waste cooking oil. Renewable and Sustainable Energy Reviews 2014, 33, 44–49. [Google Scholar] [CrossRef]
- Yuste, A.J.; Dorado, M.P. A Neural Network Approach to Simulate Biodiesel Production from Waste Olive Oil. Energy & Fuels 2006, 20, 399–402. [Google Scholar] [CrossRef]
- Çaynak, S., et al. Biodiesel production from pomace oil and improvement of its properties with synthetic manganese additive. Fuel 2009, 88, 534–538. [Google Scholar] [CrossRef]
- Rajaeifar, M.A., et al. Environmental impact assessment of olive pomace oil biodiesel production and consumption: A comparative lifecycle assessment. Energy 2016, 106, 87–102. [Google Scholar] [CrossRef]
- Miranda, T., et al. Characterization and combustion of olive pomace and forest residue pellets. Fuel Processing Technology 2012, 103, 91–96. [Google Scholar] [CrossRef]
- Tillman, D.A.; Duong, D.N.B.; Harding, N.S. Chapter 4 - Blending Coal with Biomass: Cofiring Biomass with Coal, in Solid Fuel Blending, D.A. Tillman, D.N.B. Duong, and N.S. Harding, Editors. 2012, Butterworth-Heinemann: Boston. p. 125-200.
- Özçelik, A.E.; Acaroğlu, M.; Köse, H. Determination of combustion characteristics of olive pomace biodiesel – Eurodiesel fuel mixtures. Energy Sources, Part A: Recovery, Utilization, and Environmental Effects. 2020, 42, 1476–1489. [Google Scholar] [CrossRef]
- Lama-Muñoz, A., et al. Biodiesel production from olive–pomace oil of steam-treated alperujo. Biomass and Bioenergy 2014, 67, 443–450. [Google Scholar] [CrossRef]
- Ouachab, N.; Tsoutsos, T. Study of the acid pretreatment and biodiesel production from olive pomace oil. Journal of Chemical Technology & Biotechnology 2013, 88, 1175–1181. [Google Scholar] [CrossRef]
- Che, F., et al. Exploring a promising feedstock for biodiesel production in Mediterranean countries: A study on free fatty acid esterification of olive pomace oil. Biomass and Bioenergy 2012, 36, 427–431. [Google Scholar] [CrossRef]
- Hernández, D., et al. Biodiesel production from an industrial residue: Alperujo. Industrial Crops and Products 2014, 52, 495–498. [Google Scholar] [CrossRef]
Figure 1.
Comparison for RP under E2 and E3. Experimental data (○), model for E2 (─), model for E3 (─ ─): (a) variation of V over time; (b) XV variation modeling over time; (c) SV variation modeling over time.
Figure 1.
Comparison for RP under E2 and E3. Experimental data (○), model for E2 (─), model for E3 (─ ─): (a) variation of V over time; (b) XV variation modeling over time; (c) SV variation modeling over time.
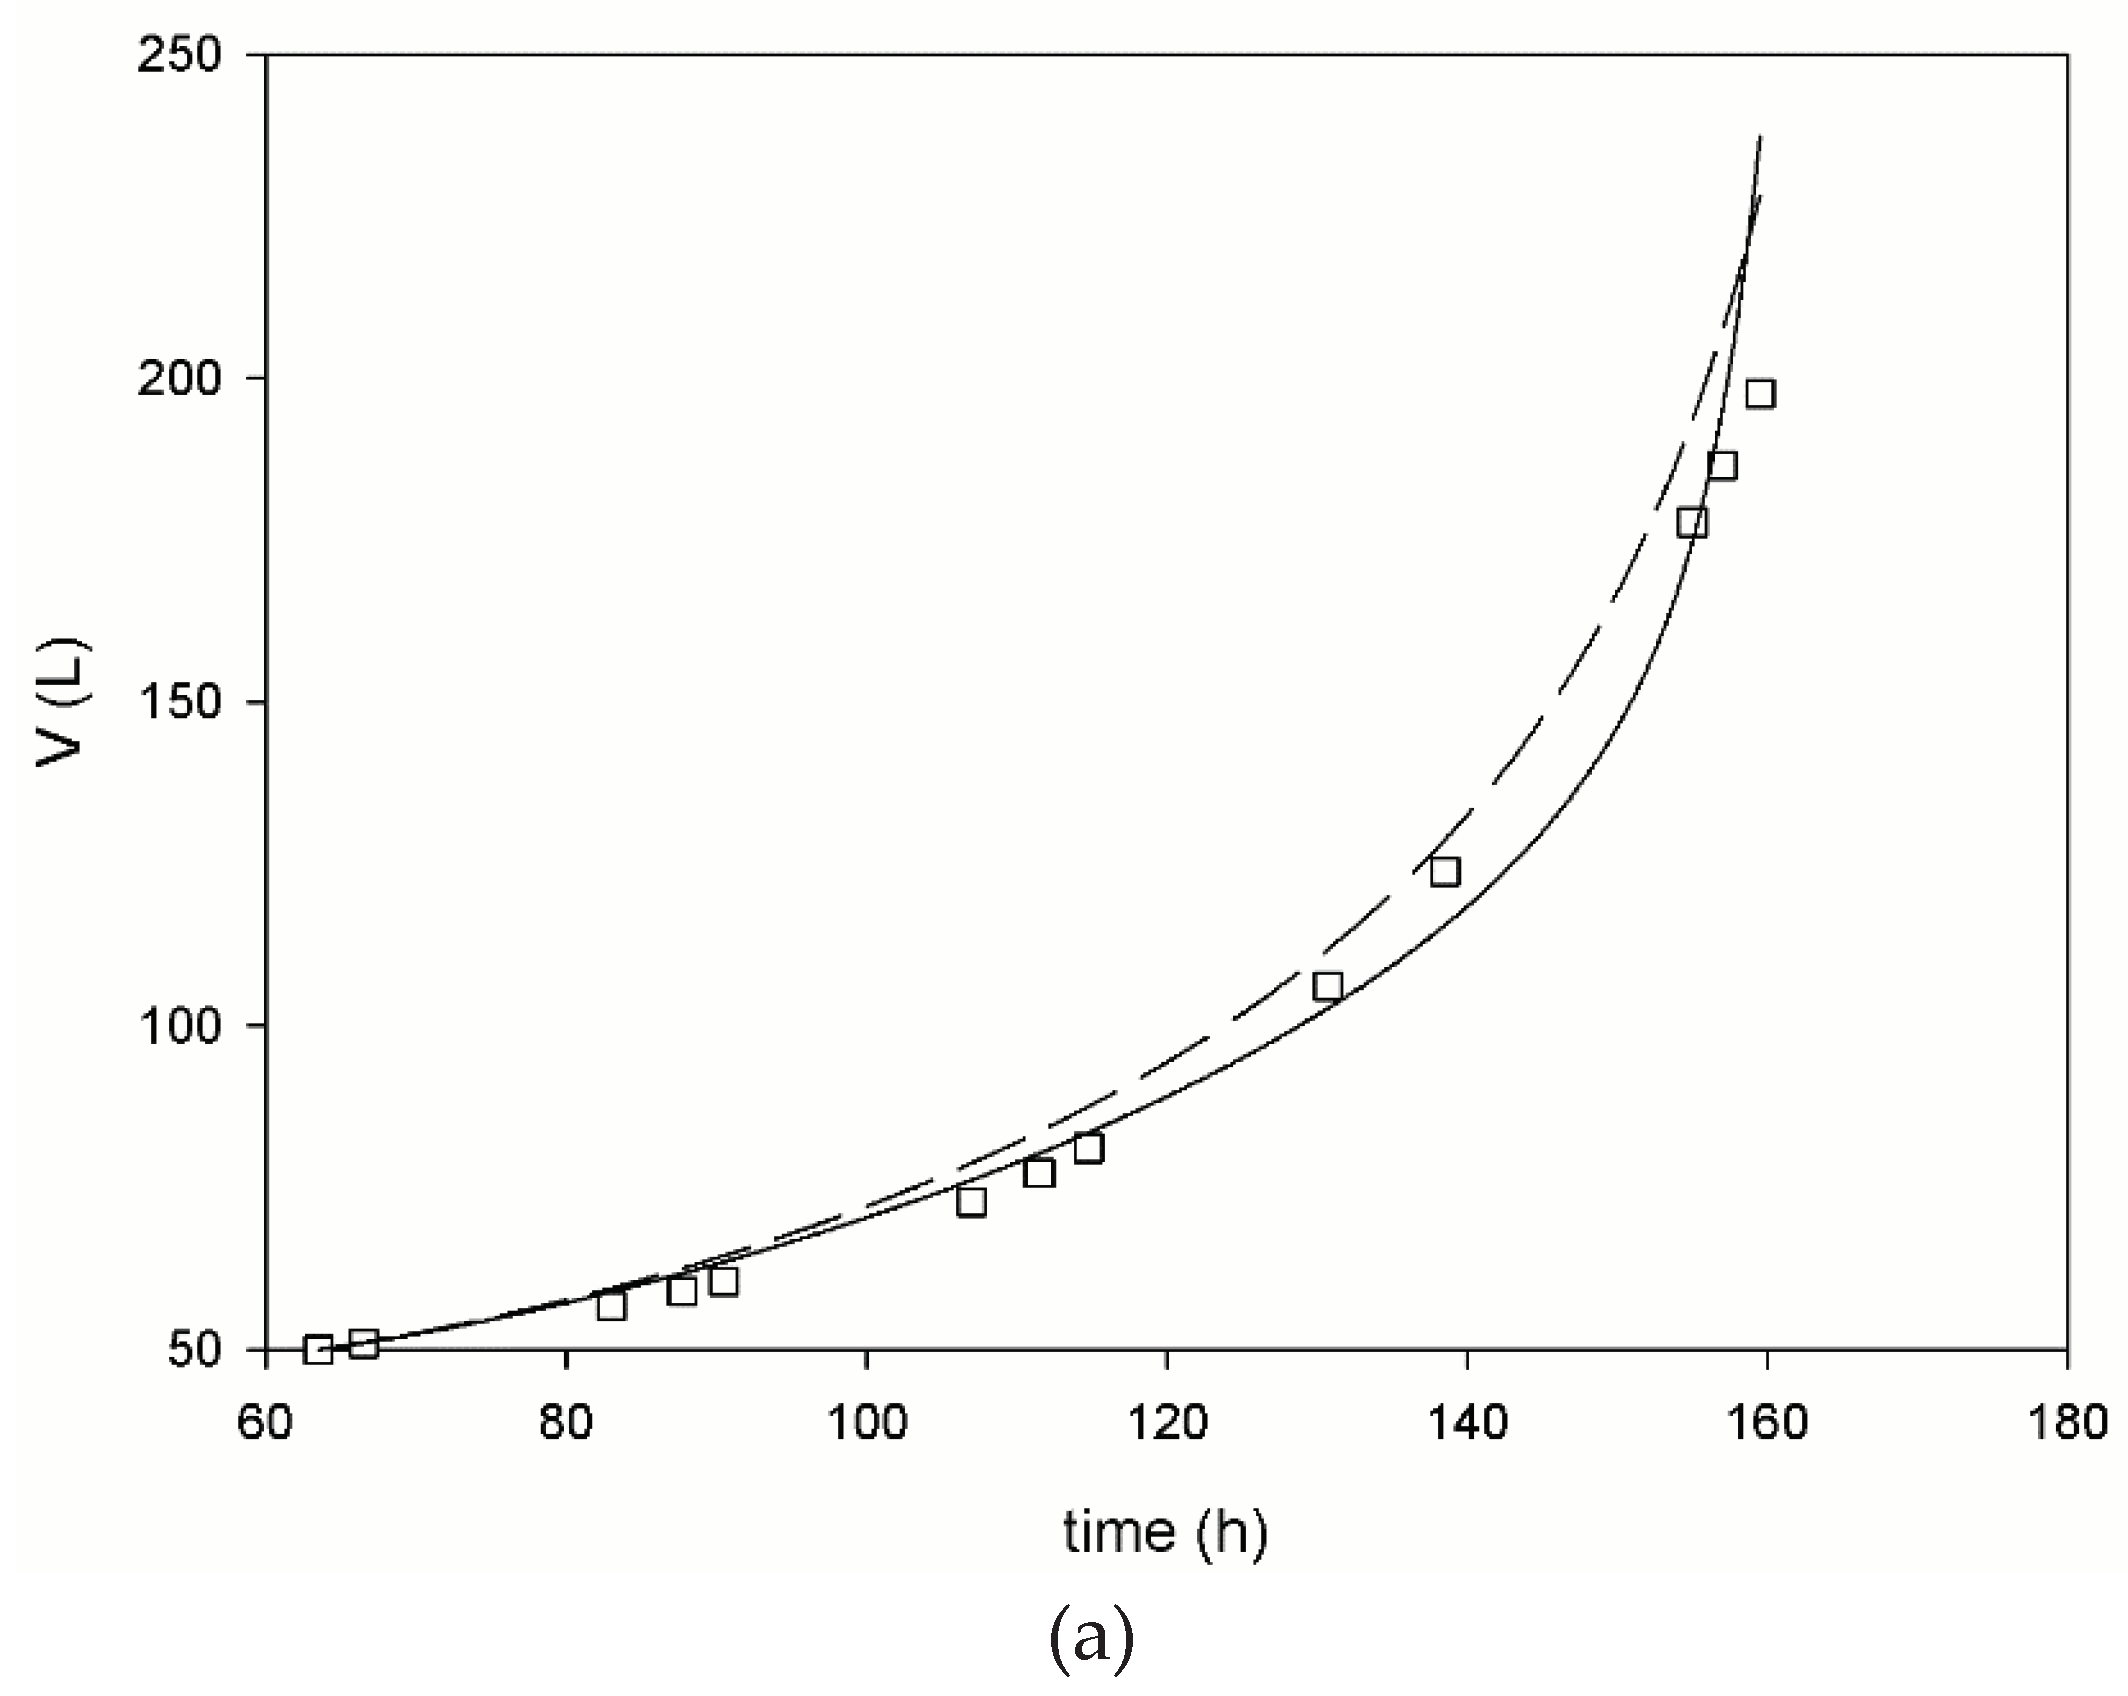
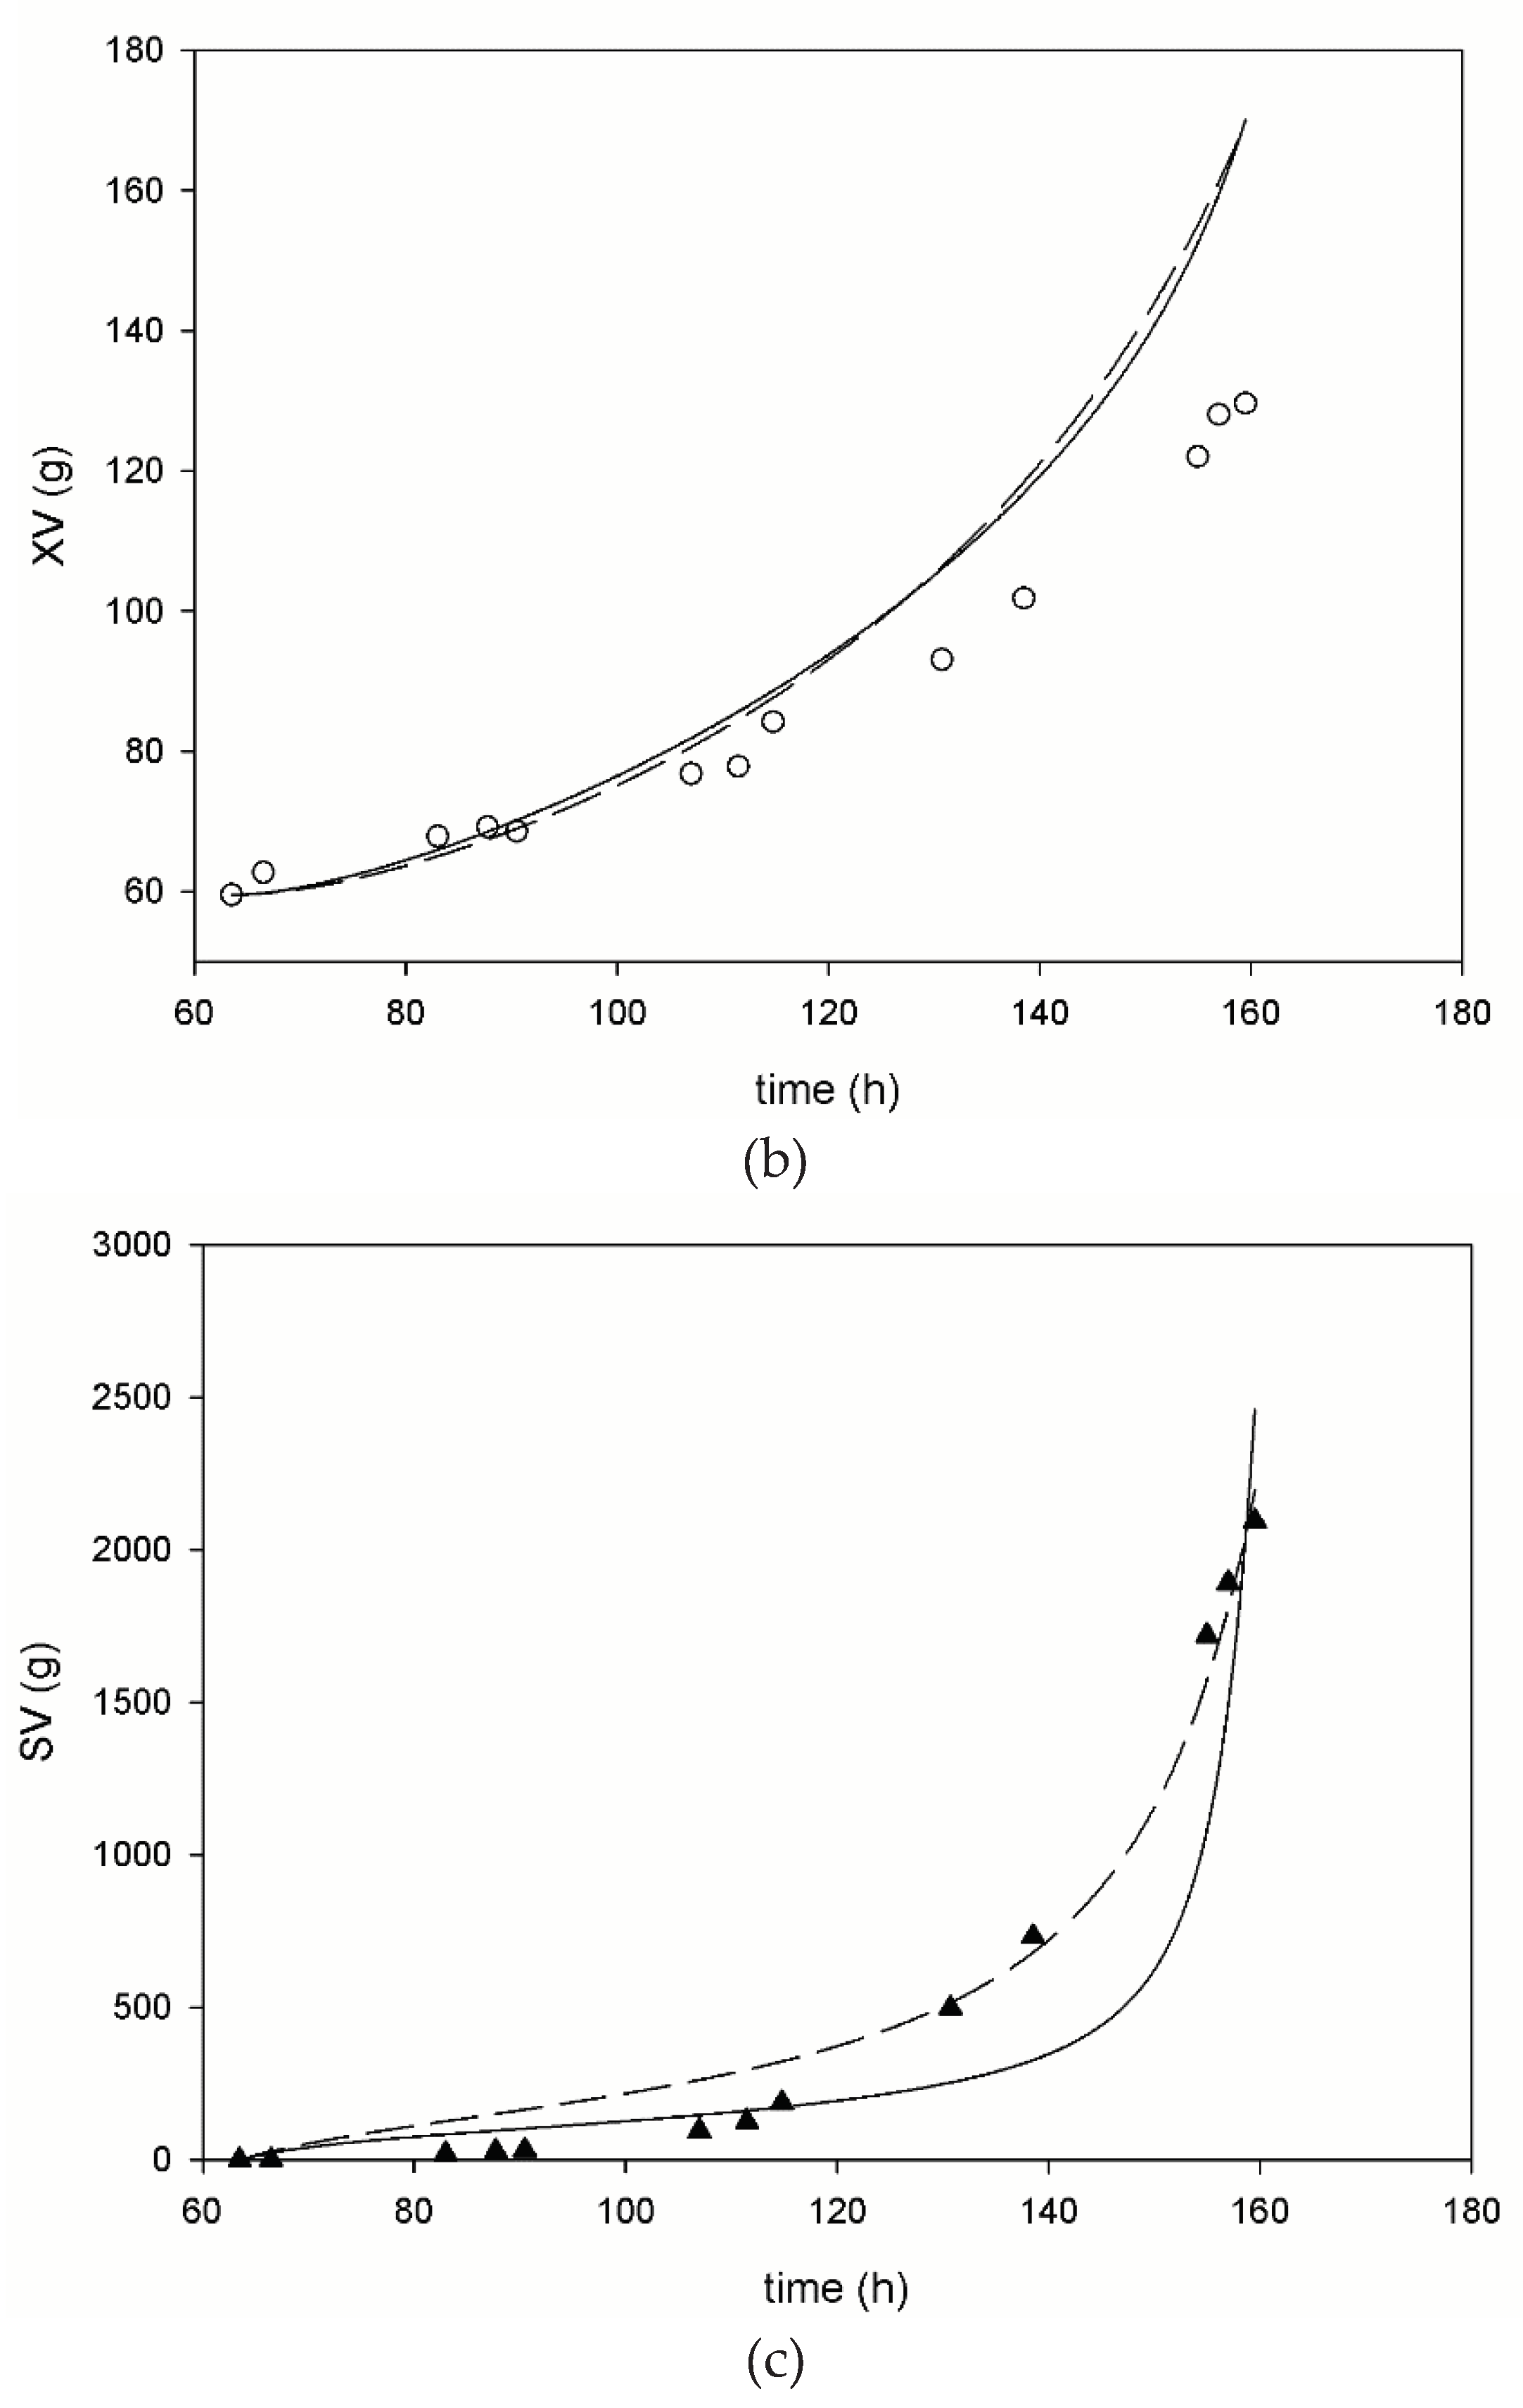
Figure 2.
Comparison of residuals for SV in RP during fed-batch stage, values expressed in mass, the segmented line is presented as a guide. (■) E2, (□) E3.
Figure 2.
Comparison of residuals for SV in RP during fed-batch stage, values expressed in mass, the segmented line is presented as a guide. (■) E2, (□) E3.
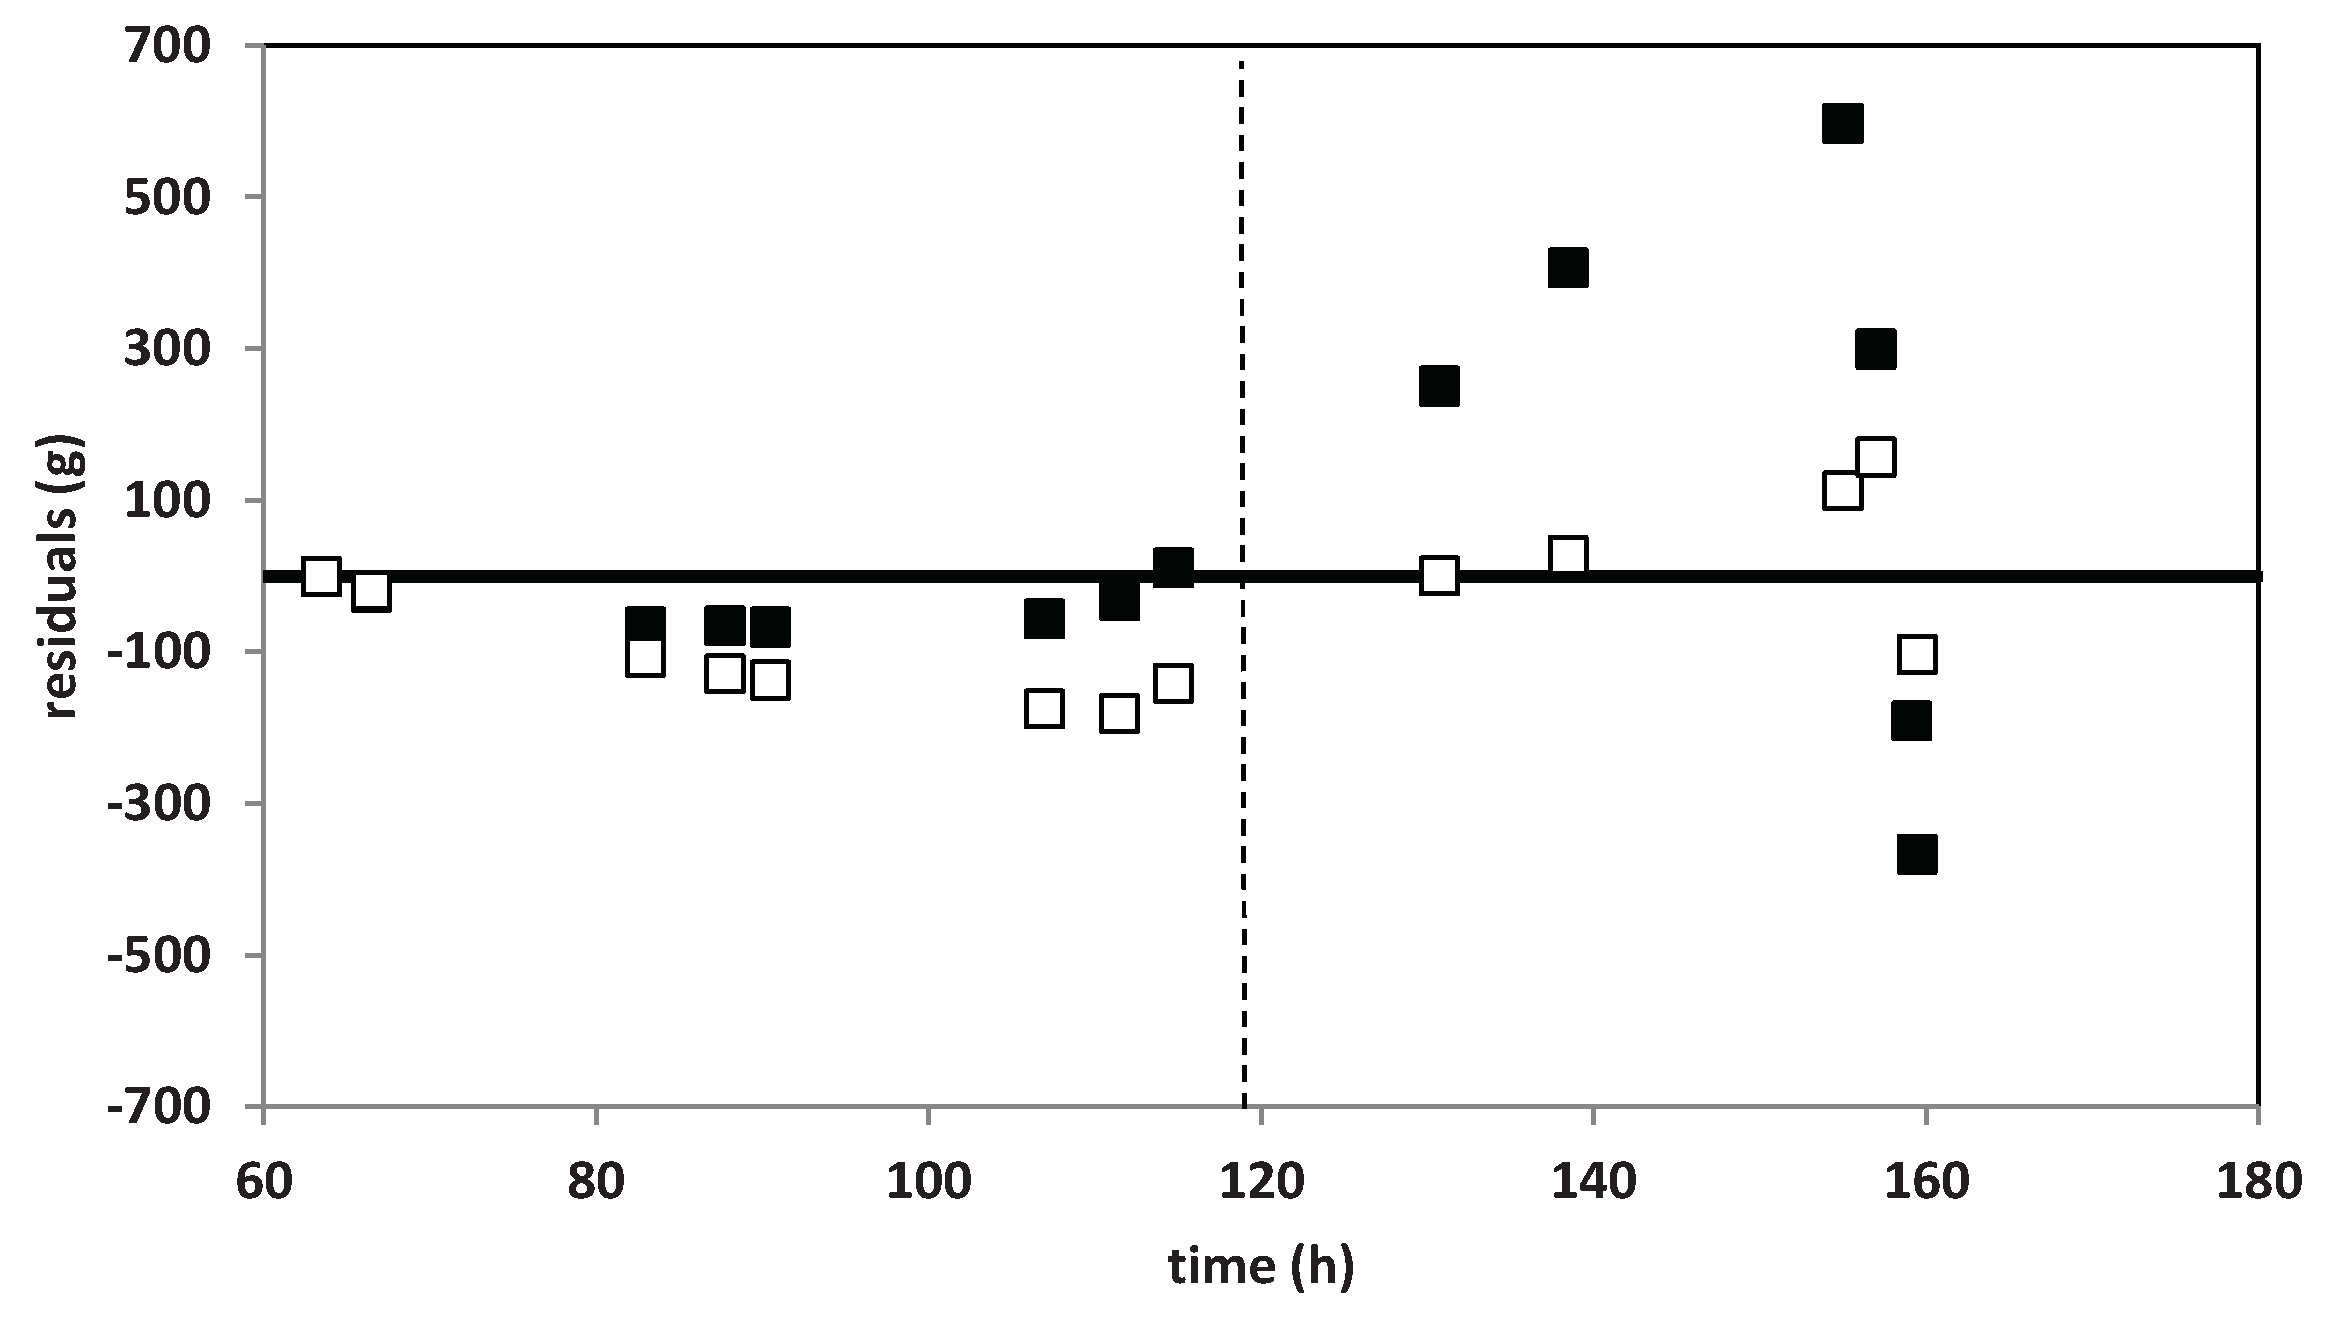

Table 1.
Summary of main results for pilot scale fed-batch fermentation.
| Fermentation | Duration (h) |
Glycerol consumed (%) | Final Ethanol (g L–1) |
H2 Produced (mmol) |
H2 produced (mmol/g glycerol consumed–1) |
|---|---|---|---|---|---|
| PR | 160 | 52.7 ± 5.2 | 5.4 ± 1.08 | 449.18 ± 21.47 | 0.2 ± 0.01 |
| PR1 | 250 | 100 ± 9.9 | 8.5 ± 1.70 | - | - |
PR: Pilot Reactor. 1Considering feeding step and post-batch step.
Table 2.
Scenarios considered for fitting the theoretical model to the experimental data.
| Scenario | Ks (g L-1) | F0 (L h-1) | Note |
|---|---|---|---|
| E1 | 14.6464a | Determined by adjustment | a: bibliographic data |
| E2 | 6.5645b | Determined by adjustment | b: experimental data |
| E3 | Determined by adjustment | Determined adjustment |
Table 3.
Values obtained for each parameter after adjusting the theoretical model according to the scenario considered.
Table 3.
Values obtained for each parameter after adjusting the theoretical model according to the scenario considered.
| Scenario | Ks (g L-1) | F0 (L h-1) | Note |
|---|---|---|---|
| E1 | 14,6464a | 0,3691 | a: bibliographic data |
| E2 | 6,5645b | 0,302 | b: experimental data |
| E3 | 10,7703 | 0,3388 |
Disclaimer/Publisher’s Note: The statements, opinions and data contained in all publications are solely those of the individual author(s) and contributor(s) and not of MDPI and/or the editor(s). MDPI and/or the editor(s) disclaim responsibility for any injury to people or property resulting from any ideas, methods, instructions or products referred to in the content. |
© 2024 by the authors. Licensee MDPI, Basel, Switzerland. This article is an open access article distributed under the terms and conditions of the Creative Commons Attribution (CC BY) license (http://creativecommons.org/licenses/by/4.0/).
Copyright: This open access article is published under a Creative Commons CC BY 4.0 license, which permit the free download, distribution, and reuse, provided that the author and preprint are cited in any reuse.


