Submitted:
28 February 2024
Posted:
28 February 2024
You are already at the latest version
Abstract
Electric torque wrenches play a crucial role in the assembly of high-strength bolts. This study focuses on three assembly processes for high-strength bolts and introduces a statistical analysis method to assess the quality of the bolt assembly. To enhance the performance, a novel, fully digital, Internet of Things (IoT) electric torque wrench is designed, incorporating a smart meter chip. This wrench achieves integration between the current sensor control method and the torque sensor control method using a simplified hardware circuit, ensuring high precision and stability. Additionally, this study employs the AC voltage self-stabilization method and Savitzky–Golay filtering method to enhance the accuracy and robustness of the wrench. Simulation experiments using Simulink and Matlab validate the effectiveness of these two methods. Furthermore, a cloud platform is utilized to enable rapid IoT access for the wrench, facilitating seamless connectivity and data transmission.
Keywords:
Electric Torque Wrench
; Bolt
; Smart Meter Chip
; Savitzky–Golay
; Simulink
; IoT
1. Introduction
Electric torque wrenches have become indispensable tools for precise torque control in various applications. They play a vital role in automobile manufacturing, machinery assembly, and other processes that require accurate bolt torque control. Specifically, in the construction of steel bridges and wind power generation, electric torque wrenches are extensively utilized for the tightening of high-strength bolts. This study aims to explore the torque accuracy and stability of the electric torque wrench control system from a new perspective. By incorporating a smart meter chip, a fully digital IoT electric torque wrench is designed. This innovative design achieves seamless integration between the current sensor control mode and the torque sensor control mode through a simplified hardware circuit and software algorithm. The resulting wrench exhibits exceptional precision, stability, and simplicity in its circuitry.
In recent years, a large number of researchers have obtained results from in-depth studies on electric torque wrenches. Ren et al [1]. reported a laser ultrasonic system for the indirect evaluation of the preload forces of piezoelectric bolts at different frequencies. The results showed that the proposed system based on surface-mounted piezoelectric transducers could effectively evaluate the changes in the axial preload of connectors and bolts. Sun et al [2]. developed a smart piezoelectric bolt that enabled more accurate measurements than ultrasound probes by embedding a piezoelectric ceramic transducer at a predetermined location in the bolt head to eliminate the effects of coupling agents. In the work of Yang et al [3], the authors embedded a fiber Bragg grating FBG sensor into a bolt and experimentally verified the effect of changes in bolt elongation caused by torque on the FBG wavelength. The results showed that the fiber optic grating sensor was suitable for bolt torque measurement and long-term monitoring, offering an ideal solution for the long-term monitoring of bolts. Grabon et al [4]. found that complex tribological phenomena occurred at the interfaces of threaded fasteners, resulting in variable values of torque during tightening. A measurement method for the accurate metering of the clamping force of a bolt when applying torque was presented and discussed in accordance with the ISO 16047 assembly instructions and the DIN 933 standard for threaded fasteners. Zhang et al [5]. invented a novel tightening tool that could directly control the preload force with high precision during the tightening of bolts. This new tightening tool consisted of an improved intelligent wrench and a signal processing system. In the signal processing system, a waveform tracking strategy based on a phase-locked loop was proposed to obtain a stable phase difference and improve the robustness of echo time calculation. Xu et al [6]. developed a digital display wrench and described two methods to improve the measurement accuracy of a torque wrench. One involved using a torque transducer. The other aimed to linearly correct the sensor through circuitry and software. Tangnan et al [7]. designed a remote monitoring system to monitor the construction quality of electric wrenches in real time. The system adopted a Bluetooth module to achieve the wireless transmission of data, and it realized an app based on an Android system to obtain the wrench working data and upload them to the database for storage. Nishino et al [8]. developed a torque standard machine based on a lever self-weight system, i.e., a method that utilized gravity to generate torque. An electromagnetic force-based torque standard machine was designed to successfully realize SI traceable torque using methods other than gravity-based methods. The Chinese Academy of Measurement Sciences [9] has established a number of torque standard devices for the calibration of various torque tools. The standard devices include lever counterweight systems, torque wrench calibration devices, multifunctional torque standard devices, reference torque standard devices, reference torque wrenches, and on-line torque calibration systems. They are used for the periodic or on-site calibration of set-up torque wrenches, indicator torque wrenches, and manual torque screwdrivers between 0.1 N.m and 4000 N.m.
The current research predominantly emphasizes bolt torque theory and the implementation of IoT technology in wrenches. However, there is a notable lack of comprehensive research addressing the assurance of torque accuracy and robustness in electric torque wrenches. In practical applications, these wrenches frequently encounter complex working environments and conditions, including varying temperatures and humidity, voltage fluctuations, and electromagnetic interference, all of which can significantly affect the wrench’s torque accuracy and stability. Therefore, it is imperative to conduct an in-depth study of these influential factors to ensure the reliability and effectiveness of electric torque wrenches in real-world scenarios.
Furthermore, the hardware circuit implementations provided in existing studies are overly complex, which may increase the points of failure in electric torque wrenches and thus reduce their reliability. Therefore, there is a need to simplify the hardware circuit design to improve the reliability. Filter technology is a key measure to improve the accuracy of the wrench and should be thoroughly researched. At the same time, existing IoT implementation solutions are also overly cumbersome and can be simplified by utilizing mature IoT platforms for quick development.
In response to the above problems, this study applies a new design concepts and distinctive and simple hardware circuits to propose a new method of wrench design, and the contributions can be summarized as follows.
- A comprehensive description of three assembly methods for bolt tightening is provided, along with the introduction of a torque-angle cross-verification technique.
- The limitations of existing technological approaches are analyzed. A high-precision control scheme that integrates current-controlled and torque sensor-controlled wrenches through the application of a smart meter chip is developed, achieving a “minimalist” hardware design.
- An AC voltage self-stabilization method is proposed to ensure that the torque accuracy remains unaffected by external voltage fluctuations, with its effectiveness validated through simulations in Simulink.
- Various filtering methods impacting the wrench accuracy are simulated and compared in Matlab, with a detailed analysis and application of the Savitzky–Golay filtering technique to enhance the wrench’s torque precision.
- The wrench is rapidly integrated into the Internet of Things using the GIZWITS cloud platform, achieving the information management of the wrench through cloud transmission and a mobile app.
- Calibration methods for the wrench are introduced, with experimental data analyzed using multiple statistical approaches.
The remainder of the paper is organized as follows. Section 2 provides an in-depth description of the processes involved in bolt tightening, introduces the principles behind current-controlled and torque sensor-controlled wrenches, and analyzes the limitations of existing technological solutions. Section 3 summarizes the smart meter chip ADE7953, presents the hardware circuit of the wrench designed with the new concepts, introduces the principle of the AC voltage self-stabilization method, and provides the Simulink simulation programs and results. Section 4 analyzes and compares common digital filters, with a focus on an in-depth study of the Savitzky–Golay filter. Section 5 presents the software and hardware implementation solutions for IoT, while Section 6 introduces the calibration methods for the wrench, as well as statistical methods for data analysis. Section 7 concludes the work.
2. Materials and Methods
This section describes three assembly processes for high-strength bolts [10] and the realization principles of current-controlled and sensor-controlled wrenches, and it analyzes the limitations of existing wrenches.
2.1. Bolt Tightening Process
In engineering practice, it is critical to ensure the reliability of the bolted connections and the accuracy of the preload [11]. A variety of torque control processes have been developed for this purpose, including torque tightening, angle tightening, and yield-point tightening [12]. This study provides an overview of these three processes and proposes a technical solution for the mutual verification and protection of the tightening process through the torque angle.
2.1.1. Torque Control Tightening
The torque method, as the earliest applied bolt tightening control scheme, has become one of the most widely used schemes due to its simplicity in realization and the possibility of using economical fastening tools. It utilizes the bolt in the elastic region; the preload force F is proportional to the applied torque T to realize the bolt tightening control [13]. The formula is as in 1.
where T is the applied torque, F is the bolt preload, is the pitch diameter, is half of the thread angle, is the frictional coefficient of the screw threads, P is the pitch, is the equivalent friction diameter of the support surface of the nut, and is the frictional coefficient of the interface between the nut and support surface.
In addition to the controlled variable torque, the angle of rotation arising between the exceedance of the threshold torque and the achievement of the set torque is often measured to monitor the fastening operation. This is shown in the left of Figure 1.
2.1.2. Angle Control Tightening
The accuracy of the preload is improved by adding an angular rotation step to the initial torque tightening. The method starts by applying a threshold torque to the bolt to bring the bolt to the point of engagement, which is typically around 25% of the required tightening torque, to overcome the frictional resistance caused by poor surface finishing, workmanship imperfections, etc. The bolt is then rotated at a specific angle to further stretch the bolt, creating an additional preload. This method effectively compensates for changes in the coefficient of friction and provides a more consistent and reproducible preload.
The bolt preload F is proportional to the bolt rotation angle in the elastic range. The formula is as in 2.
where is the connector stiffness, is the bolt stiffness, C is the system stiffness, and p is the pitch. The angle of rotation is not measured until the threshold moment is exceeded. In addition to the controlled variable of the angle of rotation, the moments are often measured to monitor the fastening operation. This is shown in the right of Figure 1
2.1.3. Yield Point Control Tightening
Yield point control tightening is a method of controlling the preload force that has been developed based on the torque angle technique, utilizing the phenomenon of the material yield limit. Within the elastic region of the bolt, there exists a constant relationship between the tightening torque and the angle of rotation. However, when entering the yield stage, the tightening torque decreases significantly with the angle of rotation, resulting in a nonlinear relationship between the tightening torque and the angle. The bolt tightened to falls to a value of , and the bolt reaches its own yield point, indicating the end of the tightening process. This is shown in Figure 2.
This method requires the use of precise measuring tools and experienced operators, as the exceedance of the yield point may result in damage to the bolt, while failure to reach the yield point does not allow the required preload to be realized. In critical applications, the yield point tightening method is used when extreme reliability is required, while, in general industrial applications, the torque and angle tightening methods are preferred because they are easy to use and less expensive.
2.1.4. Torque Angle Ratio—TAR
In China, electric wrenches are widely used in the construction of steel bridges. A bridge usually requires hundreds of thousands of high-strength bolts, all of which are constructed by the torque method [14] and are usually realized via the two-step process of initial tightening and final tightening [15]. In this study, the concept of the Torque Angle Ratio (TAR) is proposed to reflect the quality of the bolt group by measuring the relationship between the rotation angle and torque of the bolts in the process of final tightening, The formula is as in 3. A batch of bolts of similar quality should have a similar TAR. By calculating the STD and MAD values of the TAR, the construction quality of bridge bolts can be evaluated.
Here, is the rotation angle of the final tightening bolt, is the final tightening torque value, and is the initial tightening torque value.
2.2. Realization Principle of Torque Control for Electric Wrenches
Electric torque wrenches generally realize torque control in two ways: current control and torque sensor control.
2.2.1. Working Principle of Current-Controlled Electric Torque Wrench
An electric torque wrench is driven by a universal motor, which is coupled with a multi-stage planetary gear reducer to achieve a low speed and high torque for bolt tightening. The universal motor is named for its operation with the series connection of the field winding and the armature winding. It is characterized by a high speed, compact size, light weight, and convenient speed regulation, making it widely used in the electric tool industry.
A typical universal motor’s mechanical and electrical characteristics are shown in Figure 3: from the red curve in the figure, it can be seen that, in the case of a constant voltage, the motor load torque and current present an approximately linear relationship. Through the measurement of the motor current, the desired torque output can be obtained; this is the principle of the current-controlled torque wrench.
Its advantages are its simple structure, low cost, and easy control. Its disadvantages are that the torque is indirectly obtained through the current and it is affected by factors such as friction, wear, and the temperature, resulting in relatively low control accuracy and a susceptibility to drift. As the mechanical parts of the wrench wear over time, the control points of the current can drift, leading to changes in torque. In practical engineering, in order to eliminate these effects, a torque tester should be used to calibrate the wrench on-site before and after use, to ensure accuracy during operation [9].
2.2.2. Working Principle of Torque Sensor-Controlled Electric Torque Wrench
The operating principle of the torque sensor is to utilize the resistance strain effect of the resistance strain gauges. Four strain gauges are attached to the torque output shaft or reaction sleeve of the wrench at a fixed angle, forming a Wheatstone bridge. When the elastic shaft is subjected to torque, it generates slight deformation, causing a change in the bridge’s resistance. By measuring the voltage difference at the output of the bridge, the torque value can be obtained, thereby enabling torque control. Due to the inevitable influence of axial stress on the cross-section where the resistance strain gauges are attached, in order to eliminate the impact of stress on torque measurement [6], the resistance strain gauges should be attached to the elastic shaft at a 45-degree angle to the axis to counteract the axial stress. This is shown in Figure 4.
Regarding its advantages, it has high precision, high linearity, and long-term stability and can directly reflect the torque value. The control accuracy is not affected by mechanical wear and can be regularly calibrated. In terms of disadvantages, the cost is relatively high, and it requires additional torque sensors and conditioning circuits.
It should be noted that the sensor-controlled wrench can form dual protection with current control.
2.2.3. Limitations of Existing Wrench Control Systems
The typical design of current-controlled wrenches currently involves passing the drive motor’s current through a current sensor for attenuation and isolation. Subsequently, it undergoes bridge rectification to convert it into a pulsating DC, followed by RC filtering, with the ADC performing low-speed sampling on this DC signal. However, the nonlinearity of the rectifying diodes and the large time constant of the RC filter circuit can lead to significant sampling errors, poor linearity, and significant delays. When the wrench encounters faults such as jamming or stalling during operation, the response speed is slow, which can easily result in damage to the motor and mechanical components.
The existing literature generally treats current-controlled wrenches and sensor-controlled wrenches as two separate subjects for research and does not combine the two. A well-designed torque sensor wrench achieves torque control through the torque sensor. The current control method can serve as secondary protection when the torque sensor fails.
3. Design of the New Wrench Control System
To address the shortcomings of traditional wrenches, this study applies a new concepts to design a control system. In the hardware, a smart meter chip [16] is used for fully digital high-speed and high-precision AC sampling. The chip is utilized to acquire current, voltage, and torque sensor signals, offering the advantages of a simple and reliable circuit. Through an IoT platform, rapid access to IoT is achieved. Voltage self-stabilization technology is employed to ensure that the torque control accuracy of the wrench is not affected by voltage fluctuations. In the software, a Savitzky–Golay filter is applied to digitally filter the torque signal, significantly improving the precision and robustness of the wrench through these measures.
3.1. Smart Energy Meter Chip to Realize Digital AC Sampling
Digital AC sampling refers to the process whereby the current and voltage signals, after being isolated and attenuated by transformers, are fed into a high-precision ADC for rapid sampling [17]. Discrete digital algorithms are utilized to determine the root mean square (RMS) values of the current and voltage. The benefit of this approach is that it eliminates all the drawbacks of previous DC sampling methods, such as the need for rectification and RC filtering. In the event of overcurrent or overvoltage faults, the thyristor can be rapidly turned off within the next AC cycle, protecting the motor and mechanical components of the wrench from damage.
To improve the accuracy and simplify the circuitry, the ADE7953 single-phase smart meter chip from Analog Devices is utilized. This is a highly precise energy measurement IC that is widely used to measure the effective values of the line voltage and current [16]. The device has three ADCs and a high-precision energy measurement core. These features make the chip highly suitable for use in the design of electric wrenches [18].
Figure 5 provides a detailed description of this chip [19]. Due to the relatively large number and complexity of the chip’s registers, the registers used in this project are organized and marked in blue in the figure for ease of understanding. Only these registers need to be accessed in the program to obtain relevant data, while the other registers can remain at their default values on the chip [20].
3.2. Principle of RMS Measurement
The RMS value measures the amplitude of an AC signal. The effective value of an AC signal is equal to the DC quantity required to produce the same amount of power on the same load. The mathematical representation of the effective value is shown in Equation 4.
The process of calculating the effective value in the chip is illustrated by the green box in Figure 5. First, the input signal is squared and then low-pass-filtered, followed by taking the square root of the result. The results of the effective value measurement are provided through the IRMS and URMS registers. Since the LPF used in the effective value signal path is not an ideal filter, it is necessary to access these registers synchronously with the zero-crossing signal to eliminate the ripple effect in the effective value measurement. This helps to stabilize the differences between the readings.
The chip’s ZX pin provides a zero-crossing detection output, which should be connected to the CPU interrupt pin. When a zero-crossing interrupt occurs, the relevant registers are read to obtain stable voltage and current RMS values. The zero-crossing signal is also used for thyristor triggering.
3.3. Hardware Circuit Implementation
With the utilization of the smart meter chip [17], the overall hardware circuit is highly streamlined, comprising a current control unit, a torque sensor control unit, and an independent IoT component, which will be elaborated upon in Section 5.
3.3.1. Current-Controlled Wrench Circuit
As shown in Figure 6, a current sensor and a voltage sensor are used to achieve the isolation and attenuation of the current and voltage signals. The I/V conversion is carried out by , while form an anti-aliasing filter. The filtered signal is directed to the differential current–voltage input pins of the meter chip. The chip connects to the CPU via the SPI interface, with the ZX pin linking to the CPU’s interrupt line. W1 is the torque set potentiometer.
3.3.2. Torque Sensor Analog Front End Circuit
By utilizing the high-precision 24-bit ADC within the ADE7953, the high-precision acquisition of torque sensor signals can be conveniently achieved. By accessing the instantaneous value register of current channel IB, as shown in Figure 5, the output value of the torque sensor can be obtained.
To drive the Whetstone bridge-type torque sensor, a precise and stable voltage source is required. Here, a voltage follower is used to amplify the 1.2Vref output of the ADE7953, obtaining an accurate 3V voltage for strain bridge driving. The T1 transistor is employed for current expansion to enhance the current driving capability of the op-amp. It is worth noting that the maximum differential voltage that can be applied to the IBP and IBN pins of the chip is . It is recommended to use a common-mode voltage of less than . Common-mode voltages exceeding this recommended value may limit the available dynamic range. As the bridge torque sensor outputs a common-mode voltage of 1.5V, which cannot be directly connected to the IC, the classic 3-op-amp amplification circuit is utilized to eliminate the impact of the common-mode voltage. Upon introducing a 1.2Vref voltage through R17, the circuit becomes capable of measuring positive and negative torque. This is shown in Figure 7.
3.3.3. Realization of Angle Measurement
Angle monitoring and control are of great significance for bolt assembly. In this study, angle measurement is achieved by embedding magnets in the second-stage mechanical reduction gear and detecting them with Hall sensors. There is a significant reduction ratio from the measuring point to the output stage. The "initial torque" eliminates the influence of gear clearance, and satisfactory accuracy can be obtained with a simple Hall angle sensor. The output of the Hall sensor is connected to the CPU’s counter.
In summary, the application of this smart meter chip enables us to accurately measure the current and voltage and provides over-zero signals, but it also can easily realize the torque sensor signal’s high-precision measurement. As demonstrated by the electric torque wrench control system’s "minimalist" design, a simple circuit design can greatly improve the reliability of such tools, and it could also enable the successful application of advanced meter chips in the traditional power tool industry [21].
3.4. Self-Stabilizing Method for Electric Torque Wrench Voltage
From Figure 3, it can be observed that voltage fluctuations have an impact on the torque and speed. To ensure that the current-controlled wrench operates under ideal conditions, a stable operating voltage needs to be provided to the motor, a point that is currently overlooked in tool designs. Within the normal voltage fluctuation range of (from 175V to 265V), AC phase control technology [22] can be utilized to provide the motor with a stable operating voltage.
Taking a torque wrench with a torque range of 400Nm–1000Nm as an example, when tightening to 1000Nm, the motor outputs the maximum torque. The motor is designed to output the maximum torque at 170V. Therefore, upon adjusting the voltage through phase control, when the input voltage ranges from 175V to 265V, the motor can obtain a stable operating voltage.
According to the principles of power electronics, in the case of sinusoidal AC electricity, changing the trigger angle of the thyristor can alter the output voltage. This method is called phase control for voltage regulation. The formula is as follows:
output voltage;
input voltage;
voltage regulation factor;
trigger angle.
By measuring the input voltage of the current AC cycle and calculating the voltage regulation coefficient based on the desired output voltage , the trigger angle can be determined. By adjusting the trigger angle of the thyristor in the next AC cycle, dynamic voltage regulation can be achieved, thus ensuring voltage stability.
3.4.1. Simulink Simulation
When the motor starts, the minimum voltage required is 100V, and the maximum input voltage is 265V. Therefore, the voltage regulation range is . Due to the nonlinear nature of Equation 5, it is difficult to directly solve for the trigger angle . To overcome this issue, a lookup Table 1 consisting of 284 data points is used to calculate the trigger angle and achieve a voltage regulation range of 2.65.
The voltage regulation resolution is , which is less than 1%. For an AC power supply with a frequency of 50Hz, each half-cycle period is 10ms. Here, a time resolution of is used to trigger the thyristor, which is also the minimum time resolution for Simulink simulations. The thyristor is triggered every 10ms, resulting in a trigger angle resolution of . This trigger angle needs to be converted into a trigger delay. Simulink requires the lookup table to be arranged in ascending order. Therefore, the lookup table is organized as follows: the first column represents the voltage regulation factor k, and the second column represents the corresponding delay pulse count. Multiplying this pulse count by 25us gives the actual trigger delay time.
As shown in Figure 8, a simulation is constructed using a variable voltage source and a triggering module. Both modules are written in the C language. The adjustable voltage source built into the program allows the voltage to rise from 175V to 260V within 1 second to simulate voltage fluctuations. The triggering module calculates the k value for the current cycle at the zero-crossing point of the AC power supply. It then uses a lookup table to obtain the trigger delay value for the next cycle, which is used to trigger the thyristor. The simulation uses RMS components to calculate the RMS value for each cycle with the assistance of a zero-order hold. The waveform is output by an oscilloscope.
3.4.2. Simulation Conclusions
Figure 9 is a simulation output graph. In the top graph, the peak value of the input voltage gradually increases, and the blue curve represents the RMS value of the input voltage, which follows the increase in the input voltage. The middle graph reflects the gradual increase in the input voltage peak value after phase adjustment stabilization. The yellow curve represents the RMS value of the output voltage, which remains stable around the set value of 160V. The bottom graph clearly shows the process of voltage stabilization achieved by changing the triggering angle of the thyristor. The sawtooth wave represents the accumulation process of the timer, the yellow pulse represents the positive half-cycle trigger pulse, and the blue pulse represents the negative half-cycle trigger pulse. It can be observed that as the input voltage increases, the triggering pulse gradually shifts backward, achieving the goal of dynamic voltage stabilization.
Voltage self-stabilization technology ensures the torque accuracy of the wrench during voltage fluctuations, enhancing the robustness of the tool. This technology is primarily implemented through software methods, benefiting from the application of smart meter chips. This solution does not require additional hardware.
3.5. Voltage Regulation Circuits of Tools
The universal motor has a larger rotor diameter, resulting in higher rotational inertia during high-speed rotation. Therefore, it is prone to torque overshoot during low-torque tightening. Based on the voltage–speed linear relationship shown in the motor’s characteristic curve in Figure 5, it is recommended to use a lower voltage to drive the motor at a lower speed when performing low-torque bolt tightening to avoid torque overshoot. The voltage value can be calculated using a simple linear formula. We take a wrench with a torque range of 400–1000 Nm as an example, with , the minimum operating voltage of , and the maximum operating voltage of . The formula for the calculation of the corresponding motor voltage V for a given set torque is
3.6. Soft Start for Tools
When the universal motor is started directly at the rated voltage, the large surge current will shorten the life of the commutator and brushes. It is advisable to achieve the soft start of the tool by gradually increasing the voltage. A soft start has a significant effect in terms of extending the life of the commutator and brushes. In the event of a gearbox failure causing a motor stall, as the voltage and current increase slowly, when the current exceeds the set value of the tool, the tool will automatically shut down, providing protection for the thyristor and gearbox and reducing the tool’s failure rate, making this a very practical technology. The specific implementation is achieved by slowly reducing the trigger angle of the thyristor at startup.
4. Improving Torque Accuracy with Savitzky–Golay Filtering Technology
Accurate torque measurement is essential during the bolt tightening process. The torque of the bolt exhibits a nonlinear increase as it tightens, and, regardless of whether it is an electric current-controlled or torque sensor-controlled tool, the measured torque data can be affected by electromagnetic interference and mechanical disturbances. Additionally, tiny burrs on the bolts, nuts, and washers can also cause torque disturbances. Experiments have found that when using the RMS value of the current read every 20ms in the AC cycle or the torque value output by the torque sensor directly for tool torque control, the torque dispersion is quite large, leading to low control precision. Secondary filtering should be performed to eliminate the aforementioned interferences. The correct application of filtering technology is key to improving the control precision. This study, through the analysis and comparison of three types of digital filters, proposes a technical scheme to improve the torque accuracy by applying Savitzky–Golay filtering technology [23].
4.1. Inertial Filters
The first-order lag filter is also known as a first-order low-pass filter or inertia filter [24]. It is a simple filtering method whose mathematical principle is based on a first-order difference equation. It calculates the output signal by taking the weighted average of the current input signal and the previous filtered output signal .
The main idea of the algorithm is to smooth the signal and remove high-frequency noise by introducing a delay and feedback. Here, a is the lag factor, which controls the weight of new and old information in the filtering process. The value of a is typically between 0.1 and 0.9; for rapidly changing signals, the filtering effect is relatively weaker.
This type of filter can be implemented in circuits through an RC low-pass filter. The RC integration circuit of the traditional DC sampling wrench mentioned previously implicitly includes this filtering stage. This issue is discussed in depth here: in the AC acquisition part of this study, an RC anti-aliasing filter is used at the circuit input to prevent spectral aliasing, and an FIR digital filter is built into the ADE7953 chip. These filters have short time constants; thus, they can promptly capture fault currents to rapidly protect the motor. The main role of the filters discussed in this section is to eliminate the interference caused by mechanical disturbances and the tiny burrs on bolt assemblies. Since the wrench outputs at a lower speed after deceleration, the time constant of this filter is large. The flaw in traditional tools is that, to ensure torque accuracy and circuit simplicity, only this large-time-constant RC filter is used, resulting in excessive delays and slow response times, resulting in the failure to promptly address motor faults.
4.2. Moving Average Filter
Moving average filtering is used to remove noise and outliers while preserving the trend information of the signal. The basic principle is to take the average of the data at the current moment and over a period of time before it as the value after filtering. The formula is as follows:
The filtering process is based on a sliding window [25] in which, each time that a new data point is entered, the data points in the window buffer are first moved forward to overwrite the old data; then, the new data point is placed at the end of the buffer; and the average of the N data points in the window is calculated as the value of the current output point. The calculation only considers the current moment and previous data points, and it does not consider the effect of subsequent data points. This filter has better real-time performance, but it cannot predict future data. It does not respond well to rapidly changing signals or signals that contain high-frequency components. It also introduces a delay effect due to the use of the average of multiple data points.
4.3. Savitzky–Golay Filter
The Savitzky–Golay Filter represents an enhancement of the moving average algorithm, also known as least squares polynomial smoothing within a moving window. It was originally proposed by Savitzky and Golay in 1964 and published in the Journal of Analytical Chemistry. The core idea is to perform polynomial fitting to the data within a given window using the least squares method, and then replace the central point in the window with the fitting result as the smoothed output value [23]. This approach allows for the removal of noise and outliers while preserving the overall trend of the data.
4.3.1. Calculation of Filter Convolution Coefficients
The convolution coefficients of the SG filter can be obtained through the least squares fitting method [26]. Suppose that the input signal is t, and it is required to perform nth-order differentiation at . This necessitates the construction of a window of length L, encompassing all , and performing an nth-order polynomial fitting for the data within this window. Let the fitting result be ; then, the nth-order differentiation at would be as follows:
To achieve this, it is necessary to find an nth-order polynomial that closely approximates both the function values at the L points within the window and the nth-order derivative values of the original signal . To accomplish this objective, the nth-order polynomial can be expressed as a linear combination of its coefficients at various orders:
The coefficients can be solved using the least squares method. The function values and derivative values at each time point can be expressed in vector form as
Here, , and, similarly, , and so forth. By stacking the vectors of all time points, an -dimensional matrix A can be obtained, along with an -dimensional column vector y:
The coefficient vector is then solved by least squares:
Finally, a convolutional coefficient vector with length L can be obtained by arranging the solved coefficient vectors according to a certain regularity:
4.3.2. Determination of Savitzky–Golay Filter Parameters
The SG Filter can be adapted to different signal characteristics by adjusting the window size and the polynomial order. The window size N [27] represents the number of consecutive data points used for fitting and is determined based on the characteristics of the signal that needs smoothing and the noise conditions. A smaller window can more sensitively capture the detailed changes in the signal but is also more sensitive to noise; a larger window can smooth more data points and better remove noise but may lead to the loss of signal features or produce a larger delay. To ensure that there is a central point in the window, N is set as an odd number. This allows the fitted polynomial to better approximate the original data around the center of the window. Common choices for the window size include 3, 5, 7, etc.
When choosing the order of the polynomial, it is necessary to consider the trend of signal changes: typically, higher-order polynomials can better preserve the detailed features of the signal, while lower-order polynomials are more suitable for overall smoothing. Generally, a polynomial of the 2nd to 4th order can fulfil most smoothing requirements. Figure 10 shows a comparison of SG filters with different parameters.
4.3.3. Savitzky–Golay Filter Matlab Implementation
In Matlab, the SG filter can be directly implemented using the function, where order represents the polynomial order, and winsize represents the window width. In embedded programming, it can be implemented using convolution, and the filter coefficients can be obtained through , which is a frame-by-frame matrix. In the implementation of smoothing filters, such as , during the startup transient period, the last row is applied to the signal; during the terminal transient period, the first row is applied to the signal. The right diagram in Figure 11 plots the aforementioned signal using a filter with order=3 and winsize=5. is the center row, used for signals in a steady state [28]. Here, a table of convolution coefficients for the construction of filters with order=2-4 and winsize=5-13 is provided; see Table 2.
4.3.4. Comparison of Several Filtering Methods
The left graph in Figure 11 compares the effects of first-order lag filtering, moving average filtering, and the SG filter. It can be seen that when using the same window width, the SG filter exhibits higher sensitivity in tracking the signal and a lower delay. Furthermore, it effectively removes noise and outliers while preserving the overall trend of the data. Applying the Savitzky–Golay filter can enhance the accuracy and stability of the measurement data for electric torque wrenches, which is of significant importance in ensuring the assembly quality of the bolts.
5. Realization of IoT Access
IoT technology serves as a crucial support and foundation for Industry 4.0, enabling interconnectedness between devices [21,29]. By transmitting real-time data from the torque wrench’s working process to the cloud, relevant personnel are able to remotely monitor and manage the tools through mobile phones or computers, eliminating the need for a physical presence and significantly improving the work efficiency [30]. Simultaneously, the cloud-based data analysis platform stores the construction data of the bolts in a database and evaluates the construction quality through data analysis. This allows for the timely identification of potential issues and optimization improvements. The application of IoT technology drives the digital transformation and intelligent upgrade of the manufacturing industry. IoT modules are an essential component of new concepts tools, and their implementation is relatively straightforward. Here, we present a quick implementation method using the Gizwits IoT platform.
5.1. Hardware Implementation of IoT
As shown in Figure 12, the control system of the tool consists of two main parts: the main controller and the IoT-HMI [6]. These two parts are connected via USART communication and interact using the Modbus protocol. The IoT-HMI section includes the STM32F105 microcontroller, which is connected to the ESP-Wifi module; an OLED display module, the RX8010RTC; WQ2500 flash memory; and an infrared receiver to receive commands from an infrared remote control.
In large construction projects such as bridges, to ensure the traceability of the construction, laser engraving is used to apply two-dimensional codes to the bolts. In China, the most commonly used format is the Quick Response Code (QR), which was invented by the Japanese company Denso Wave in 1994. QR codes can store more information than traditional barcodes, with the capacity to hold up to several thousand characters. They also possess strong error correction capabilities, allowing for the retrieval of valid information even if there is partial damage. These features of QR codes ensure the long-term effectiveness of bolt identification. We use a commercial Bluetooth barcode scanner, and, on the hardware side, the USB interface of the F105 is connected to the receiver of the Bluetooth barcode scanner. On the software side, we achieve the wireless connection between the barcode scanner and the wrench through the USB middleware library provided by MX-Cube.
5.2. Gizwit Platform IoT Transmission
Building an IoT platform is a rather complex task. The use of a mature IoT platform can significantly simplify this process. This study utilizes the mature Gizwits platform [31], and, with the following simple steps, the construction of the IoT data transmission cloud platform can be quickly completed.
- Define the product in the Gizwits platform and enter the relevant data points.
- Obtain the key code for platform authorization.
- Select platform-recommended data modules (WiFi 4G, etc.)
- Obtain the source code of the stm32 keil C program to generate gizwits by selecting a suitable CPU.
- Download the corresponding app (Android, iOS, Wechart) on the mobile terminal and connect the corresponding devices by scanning the code.
- Connects with Gizwits via http and winsock, and store the acquired real-time data in the database for further analysis by the data analysis platform.
Figure 13 below shows the creation of data points through Gizwits, the generation of the Stm32 code, and its display on a mobile device.
By utilizing Gizwits, the technical threshold and the research and development costs of IoT hardware development can be minimized [32], thereby enhancing the speed of product development and deployment.
6. Experiments
6.1. Calibration Session
The electric torque wrench needs to be calibrated [33] before leaving the factory, with the purpose of converting the torque value into the corresponding current value, . This process is achieved through the torque testing instrument shown in Figure 14. Taking a wrench with a torque range of 400–1000Nm as an example, calibration can be completed in two steps.
- For the low-end calibration with , adjust the torque adjustment potentiometer W1 to the lowest position. The tested wrench is tightened on the torque testing instrument, and, when the torque reaches the set value of 400Nm, the wrench automatically stops. At this point, the wrench automatically records the current value at the stoppage, while the torque value is manually read from the torque testing instrument. Input the torque value into the wrench using an infrared remote control.
- For the high-end calibration with , adjust the torque adjustment potentiometer W1 to the highest position. The tested wrench is tightened on the torque testing instrument, and when the torque reaches the set value of 1000Nm, the wrench automatically stops. At this point, the wrench automatically records the current value at the stoppage, while the torque value is manually read from the torque testing instrument. Input the torque value into the wrench using an infrared remote control.
By using the formula , the calibration coefficient k can be obtained to achieve the conversion from torque to current. In the experiment, if there is a significant difference between the set torque value and the displayed value on the instrument, the above process should be repeated until the deviation between the set value and the displayed value is less than 5%.
The calibration method for torque sensor-controlled wrenches is similar to that of current-controlled wrenches and will not be reiterated here.
It should be noted that some studies have involved complex multipoint calibration and curve fitting for the torque. However, in the actual process of using the tool, as mechanical wear occurs, the corresponding torque current values may also change, causing variations in the entire torque–current curve. This renders complex calibration meaningless. More importantly, even with quadratic curve fitting calibration, when the curve drifts, the error will further increase. Only by performing on-site verification before and after the work can the influence of drift be effectively eliminated. In fact, this is also the calibration process specified in the Chinese bridge construction standards for torque wrenches.
6.2. Statistical Method of Bolt Torque
During the bolt tightening process, due to the influence of various factors, such as the lubrication level of the bolt [34], the friction coefficient of the nuts and washers, etc., outliers in the torque data may occur. The use of only the conventional method of relative error statistics is not sufficient. Therefore, two statistical methods are introduced here to comprehensively assess the quality of bolt tightening.
6.2.1. Standard Deviation Statistics
The sample standard deviation is a statistical measure that describes the degree of dispersion of a set of data [35], commonly used to assess the variability of the data. In statistics, if there is a sample containing n observations, then their sample standard deviation S can be calculated using the following formula:
where denotes the ith observation, denotes the average of all observations, ∑ denotes the summation sign, and sqrt denotes the square root. When S is small, it means that the dispersion of the data is small and the data tend to be concentrated; when S is large, it means that the dispersion of the data is large and the data tend to be scattered.
6.2.2. Median Absolute Deviation—MAD
The calculation method for the median absolute deviation (MAD) is as follows: first, calculate the median of the data; then, compute the absolute deviation of each data point from the median; finally, take the median of these absolute deviations as the MAD. The formula for the calculation of the MAD is as follows:
where denotes the ith data point, x denotes all data, and denotes the median. Compared to the sample standard deviation, the MAD has better robustness. In the calculation process, the MAD uses the median instead of the mean; it is based on absolute deviations rather than squared deviations, which helps to prevent extreme values from excessively influencing the calculation results.
6.3. Experimental Device Data
To test the effectiveness of the comparative filtering algorithm, we use a standard torque testing system for torque experiments on high-strength bolts. The experimental setup is shown in the figure: high-strength bolts are tightened using a torque experiment device, and the torque values of the bolts are displayed on a standard instrument. In this case, 6 bolts are tightened, and each bolt is subjected to 5 tightening experiments at 600Nm to test the torque accuracy. The experimental results obtained without filtering and those obtained using an SG filter with a window size of 11 and a 3rd order are provided in Table 3.
From the data in the table, it can be observed that the relative error of the unfiltered data is relatively large, with a relative accuracy error exceeding . However, after filtering, the torque data obtained show an accuracy error within .
Table 4 displays the data obtained using the STD and MAD statistical methods. It can be observed that both the standard deviation and MAD values decrease after SG filtering, indicating a reduction in the torque fluctuation range and a significant improvement in the torque accuracy.
Here, due to the relatively small number of samples, the advantages of these two statistical methods cannot be fully demonstrated. However, in practical engineering applications, when statistical analysis is performed on the “TAR” data for a large number of bolts, these two methods will show significant advantages.
7. Conclusions
This study develops an IoT electric torque wrench based on smart meter chips and a mature cloud platform, characterized by high control precision and a simplified circuit design. The implementation of AC voltage self-stabilization technology ensures that the wrench’s control precision is unaffected by voltage fluctuations at construction sites. The application of Savitzky–Golay filtering technology to optimize the control algorithm effectively reduces the torque fluctuations, enhancing the tool’s robustness through these combined measures. Integrating traditional tools with IoT technology significantly improves the work efficiency and data management capabilities. In practical engineering applications, the wrench demonstrates stable performance and reliable tightening effects, adequately meeting the construction requirements for high-strength bolts in projects such as power grids and bridges.
Author Contributions
Meng, Z. did the research, wrote and edited the paper. Zhang, P. provided article writing ideas and data collection. Zhang, H. and Wang, H. provided the experiment conditions and gave many important suggestions on article. All authors have read and agreed to the published version of the manuscript.
Funding
This research received no external funding.
Institutional Review Board Statement
Not Applicable.
Informed Consent Statement
Not Applicable.
Data Availability Statement
Not Applicable.
Conflicts of Interest
The authors declare that they have no known competing financial interests or personal relationships that could have appeared to influence the work reported in this paper.
References
- Ren, G.; Zhan, H.; Liu, Z.; Jiang, W.; Li, R.; Liu, S. Evaluation of Axial Preload in Different-Frequency Smart Bolts by Laser Ultrasound. Sensors 2022, 22. [Google Scholar] [CrossRef] [PubMed]
- Sun, Q.; Yuan, B.; Mu, X.; Sun, W. Bolt preload measurement based on the acoustoelastic effect using smart piezoelectric bolt. Smart Materials and Structures 2019, 28, 055005. [Google Scholar] [CrossRef]
- Yang, W.S.; Chiang, C.C.; Hsu, H.C. Monitoring torque in bolts using an embedded fiber Bragg grating sensor. Optik 2023, 291, 171294. [Google Scholar] [CrossRef]
- Grabon, W.; Osetek, M.; Mathia, T. Friction of threaded fasteners. Tribology International 2018, 118, 408–420. [Google Scholar] [CrossRef]
- Zhang, Z.; Liu, J.; Gong, H.; Huang, J.; Du, C.; Liu, K.; Cao, L. Invention of smart tightening tool for directly controlling the preload of bolted joints. Smart Materials and Structures 2023, 32, 027001. [Google Scholar] [CrossRef]
- Xu, J.; Zhao, Y.; Chen, K. Development of a High-precision Digital Display Torque Wrench. Journal of Physics: Conference Series 2020, 1626, 012138. [Google Scholar] [CrossRef]
- Tangnan, Wangxiaowu, X.F. Design of fixed torque electric wrench remote monitoring system based on Android. Manufacturing automation 2023, 45, 61–64,105.
- Nishino, A.; Ueda, K.; Fujii, K. Design of a new torque standard machine based on a torque generation method using electromagnetic force. Measurement Science and Technology 2016, 28, 025005. [Google Scholar] [CrossRef]
- Meng, F.; Jiao, J.P.; Zhang, Z.M.; Zhang, D.L. Various torque tools calibration at NIM. Measurement: Sensors 2021, 18, 100177. [Google Scholar] [CrossRef]
- Shaikh, R.; Datta, S.; Gawture, M.M. Assessment of Real-World Bolted Joints by Combining FEA With VDI Guidelines. Symposium on International Automotive Technology. SAE International, 2021. [CrossRef]
- Abid, M.; Khan, A.; Hussain, M.; Wajid, H.A. Optimized bolt tightening procedure for different tightening strategies—FEA study. Proceedings of the Institution of Mechanical Engineers, Part E: Journal of Process Mechanical Engineering 2017, 231, 236–249. [Google Scholar] [CrossRef]
- Persson, E.; Roloff, A. Ultrasonic tightening control of a screw joint: A comparison of the clamp force accuracy from different tightening methods. Proceedings of the Institution of Mechanical Engineers, Part C: Journal of Mechanical Engineering Science 2016, 230, 2595–2602. [Google Scholar] [CrossRef]
- Miao, R.; Shen, R.; Zhang, S.; Xue, S. A Review of Bolt Tightening Force Measurement and Loosening Detection. Sensors 2020, 20. [Google Scholar] [CrossRef]
- Kong, Q.; Li, Y.; Wang, S.; Yuan, C.; Sang, X. The influence of high-strength bolt preload loss on structural mechanical properties. Engineering Structures 2022, 271, 114955. [Google Scholar] [CrossRef]
- Coria, I.; Abasolo, M.; Aguirrebeitia, J.; Heras, I. Study of bolt load scatter due to tightening sequence. International Journal of Pressure Vessels and Piping 2020, 182, 104054. [Google Scholar] [CrossRef]
- Bin, S.; Wei-Zhong, F.; Shan-Jing, S.; Chen-Yan, H. Design and Research of Smart Meter Based on ADE7953. Instrument Technique and Sensor 2012. [Google Scholar]
- Sousa, E.L.d.; Marques, L.A.d.A.; Lima, I.d.S.F.d.; Neves, A.B.M.; Cunha, E.N.; Kreutz, M.E.; Neto, A.J.V. Development a Low-Cost Wireless Smart Meter with Power Quality Measurement for Smart Grid Applications. Sensors 2023, 23. [Google Scholar] [CrossRef] [PubMed]
- Zhou, J.; Wu, Z.; Yu, Z. Research on the Reliability Allocation Method of Smart Meters Based on DEA and DBN. Applied Sciences 2021, 11. [Google Scholar] [CrossRef]
- Muralidhara, S.; Hegde, N.; PM, R. An internet of things-based smart energy meter for monitoring device-level consumption of energy. Computers & Electrical Engineering 2020, 87, 106772. [Google Scholar] [CrossRef]
- Munoz, O.; Ruelas, A.; Rosales, P.; Acuña, A.; Suastegui, A.; Lara, F. Design and Development of an IoT Smart Meter with Load Control for Home Energy Management Systems. Sensors 2022, 22. [Google Scholar] [CrossRef] [PubMed]
- Pawar, P.; Vittal K, P. Design and development of advanced smart energy management system integrated with IoT framework in smart grid environment. Journal of Energy Storage 2019, 25, 100846. [Google Scholar] [CrossRef]
- Islam, T.; Fayek, H.H.; Rusu, E.; Rahman, F. Triac Based Novel Single Phase Step-Down Cycloconverter with Reduced THDs for Variable Speed Applications. Applied Sciences 2021, 11. [Google Scholar] [CrossRef]
- Niedźwiecki, M.J.; Ciołek, M.; Gańcza, A.; Kaczmarek, P. Application of regularized Savitzky–Golay filters to identification of time-varying systems. Automatica 2021, 133, 109865. [Google Scholar] [CrossRef]
- Sun, B.; Teng, Z.; Hu, Q.; Lin, H.; Tang, S. Periodic Noise Rejection of Checkweigher Based on Digital Multiple Notch Filter. IEEE Sensors Journal 2020, 20, 7226–7234. [Google Scholar] [CrossRef]
- Tanji, A.K.; de Brito, M.A.G.; Alves, M.G.; Garcia, R.C.; Chen, G.L.; Ama, N.R.N. Improved Noise Cancelling Algorithm for Electrocardiogram Based on Moving Average Adaptive Filter. Electronics 2021, 10. [Google Scholar] [CrossRef]
- Ouyang, J.; Chi, C. The Prediction of Residual Electrical Life in Alternating Current Circuit Breakers Based on Savitzky-Golay-Long Short-Term. Sensors 2023, 23. [Google Scholar] [CrossRef]
- Sadeghi, M.; Behnia, F.; Amiri, R. Window Selection of the Savitzky–Golay Filters for Signal Recovery From Noisy Measurements. IEEE Transactions on Instrumentation and Measurement 2020, 69, 5418–5427. [Google Scholar] [CrossRef]
- Niedźwiecki, M.; Ciołek, M. Generalized Savitzky–Golay filters for identification of nonstationary systems. Automatica 2019, 108, 108477. [Google Scholar] [CrossRef]
- Albița, A.; Selișteanu, D. A Compact IIoT System for Remote Monitoring and Control of a Micro Hydropower Plant. Sensors 2023, 23. [Google Scholar] [CrossRef]
- Mishra, R.; Pandey, A.; Savariya, J. Application of Internet of Things: Last meter smart grid and smart energy efficient system. 2020 First International Conference on Power, Control and Computing Technologies (ICPC2T), 2020, pp. 32–37. [CrossRef]
- Yan, R.; Zhang, H. Design and implementation of elderly assistant & custody system based on Kinect and Gizwits. Journal of Physics: Conference Series 2019, 1345, 052003. [Google Scholar] [CrossRef]
- Chromik, J.; Kirsten, K.; Herdick, A.; Kappattanavar, A.M.; Arnrich, B. SensorHub: Multimodal Sensing in Real-Life Enables Home-Based Studies. Sensors 2022, 22. [Google Scholar] [CrossRef]
- Justification for a New Industry Standard for Torque Wrench Calibration, Vol. Volume 3: Design and Analysis, Pressure Vessels and Piping Conference, 2012, [https://asmedigitalcollection.asme.org/PVP/proceedings-pdf/PVP2012/55027/191/4436009/191_1.pdf]. [CrossRef]
- Eccles, W.; Sherrington, I.; Arnell, R. Frictional changes during repeated tightening of zinc plated threaded fasteners. Tribology International 2010, 43, 700–707. [Google Scholar] [CrossRef]
- Chen, J.; Zhang, K.; Wang, L.; Yang, M. Design of a High Precision Ultrasonic Gas Flowmeter. Sensors 2020, 20. [Google Scholar] [CrossRef] [PubMed]
Figure 1.
Torque control tightening and angle control tightening.
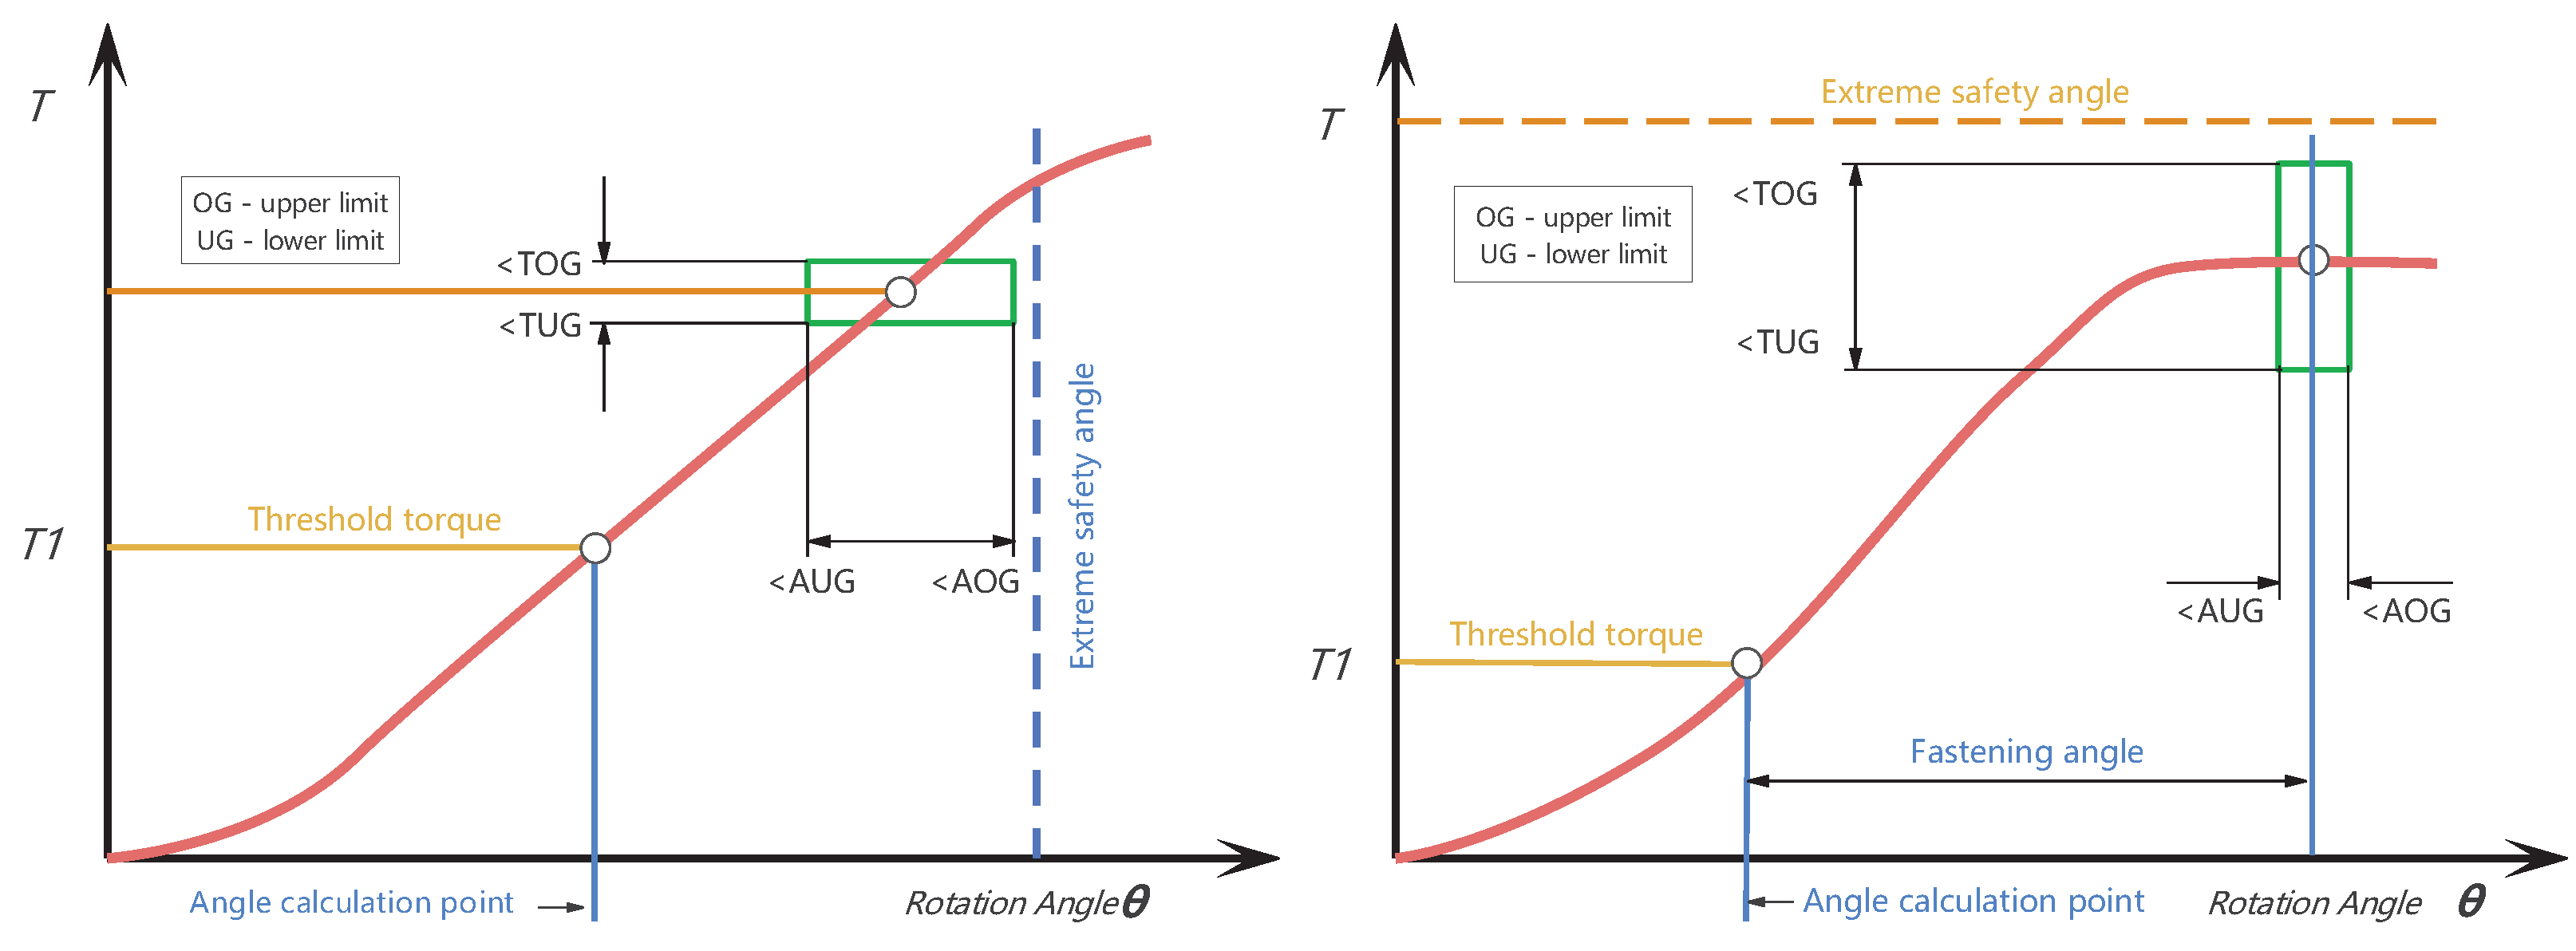
Figure 2.
Yield point control tightening.
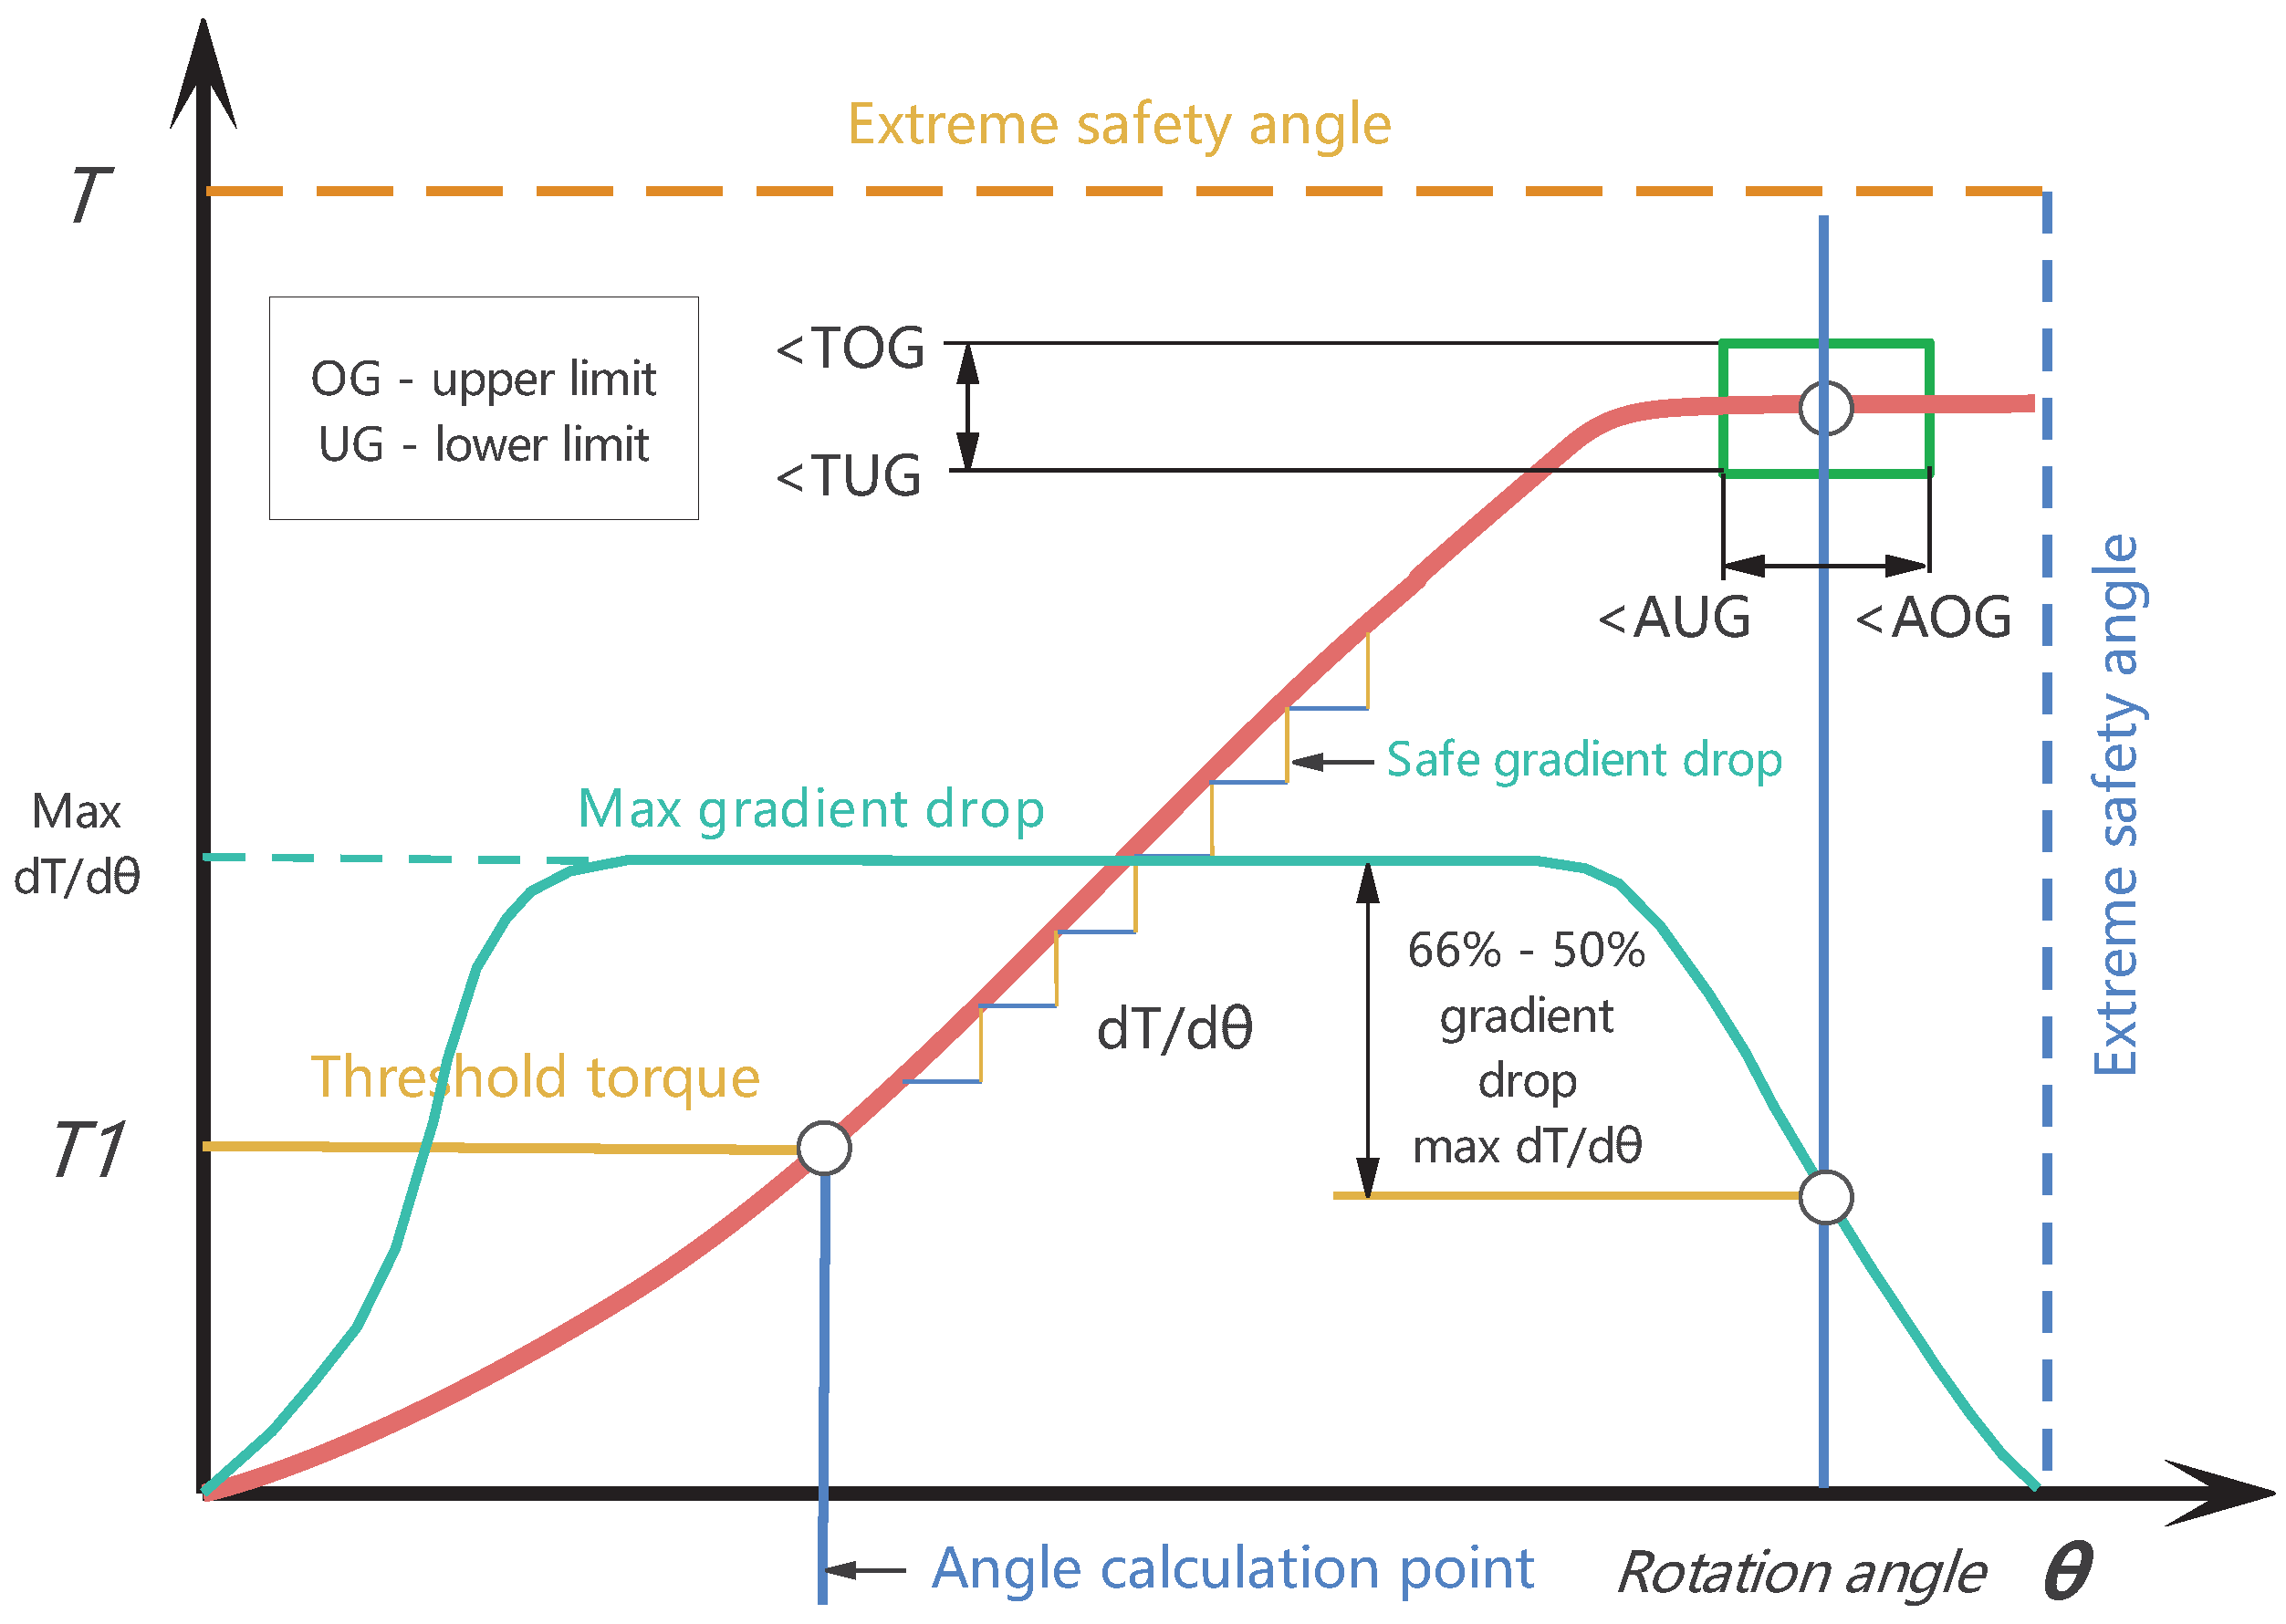
Figure 3.
Universal motor characteristic curve.
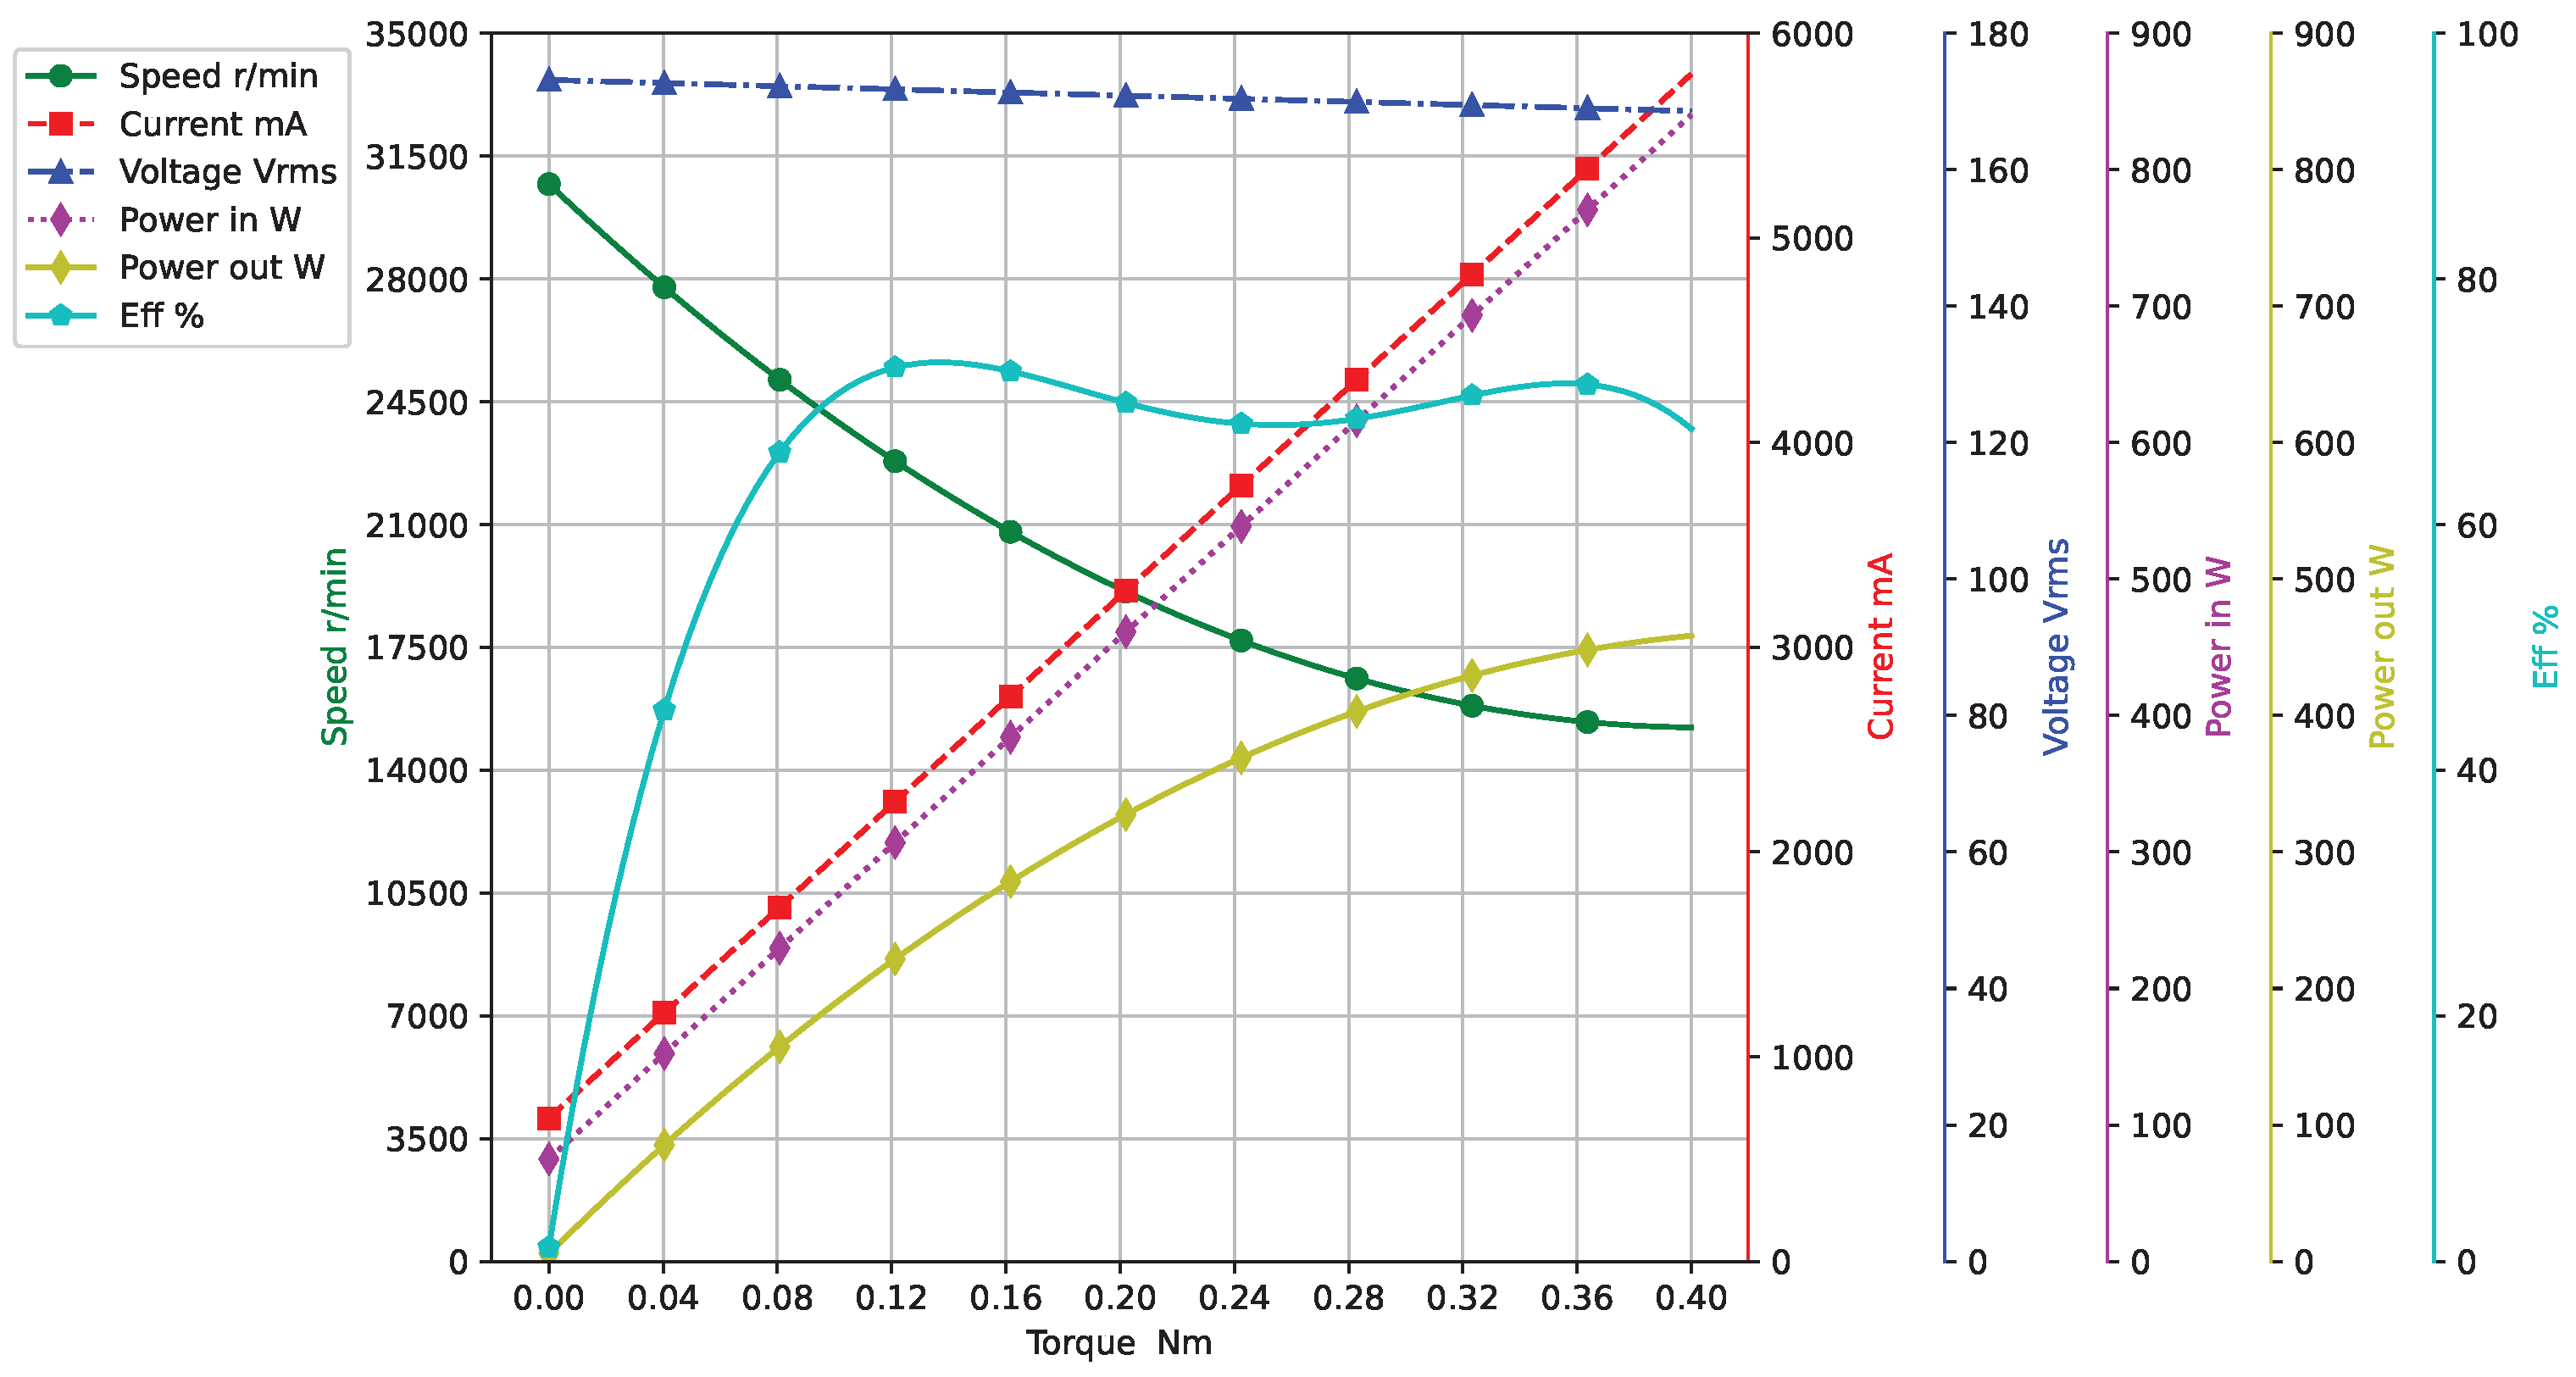
Figure 4.
Strain gauge mounting method: three-dimensional drawing and unfolding drawing.
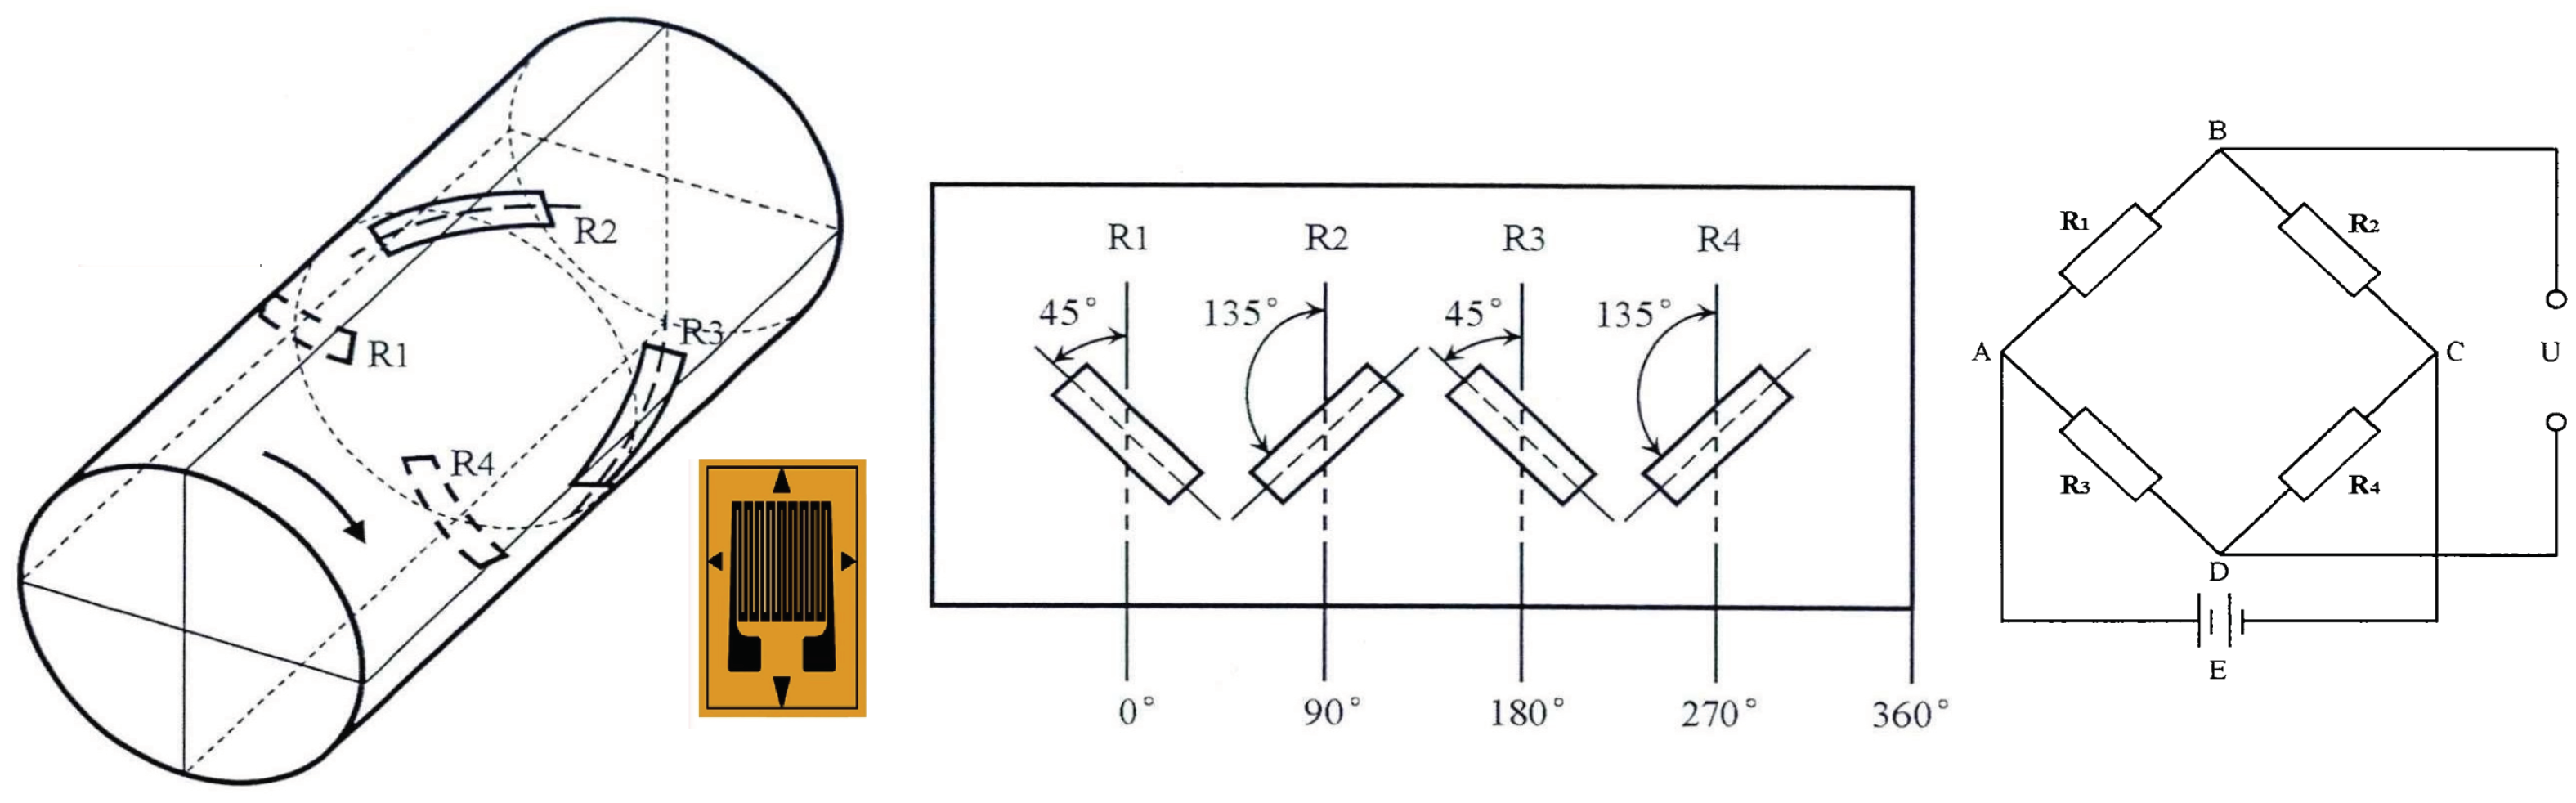
Figure 5.
ADE7953 block diagram and register organization used in this study.
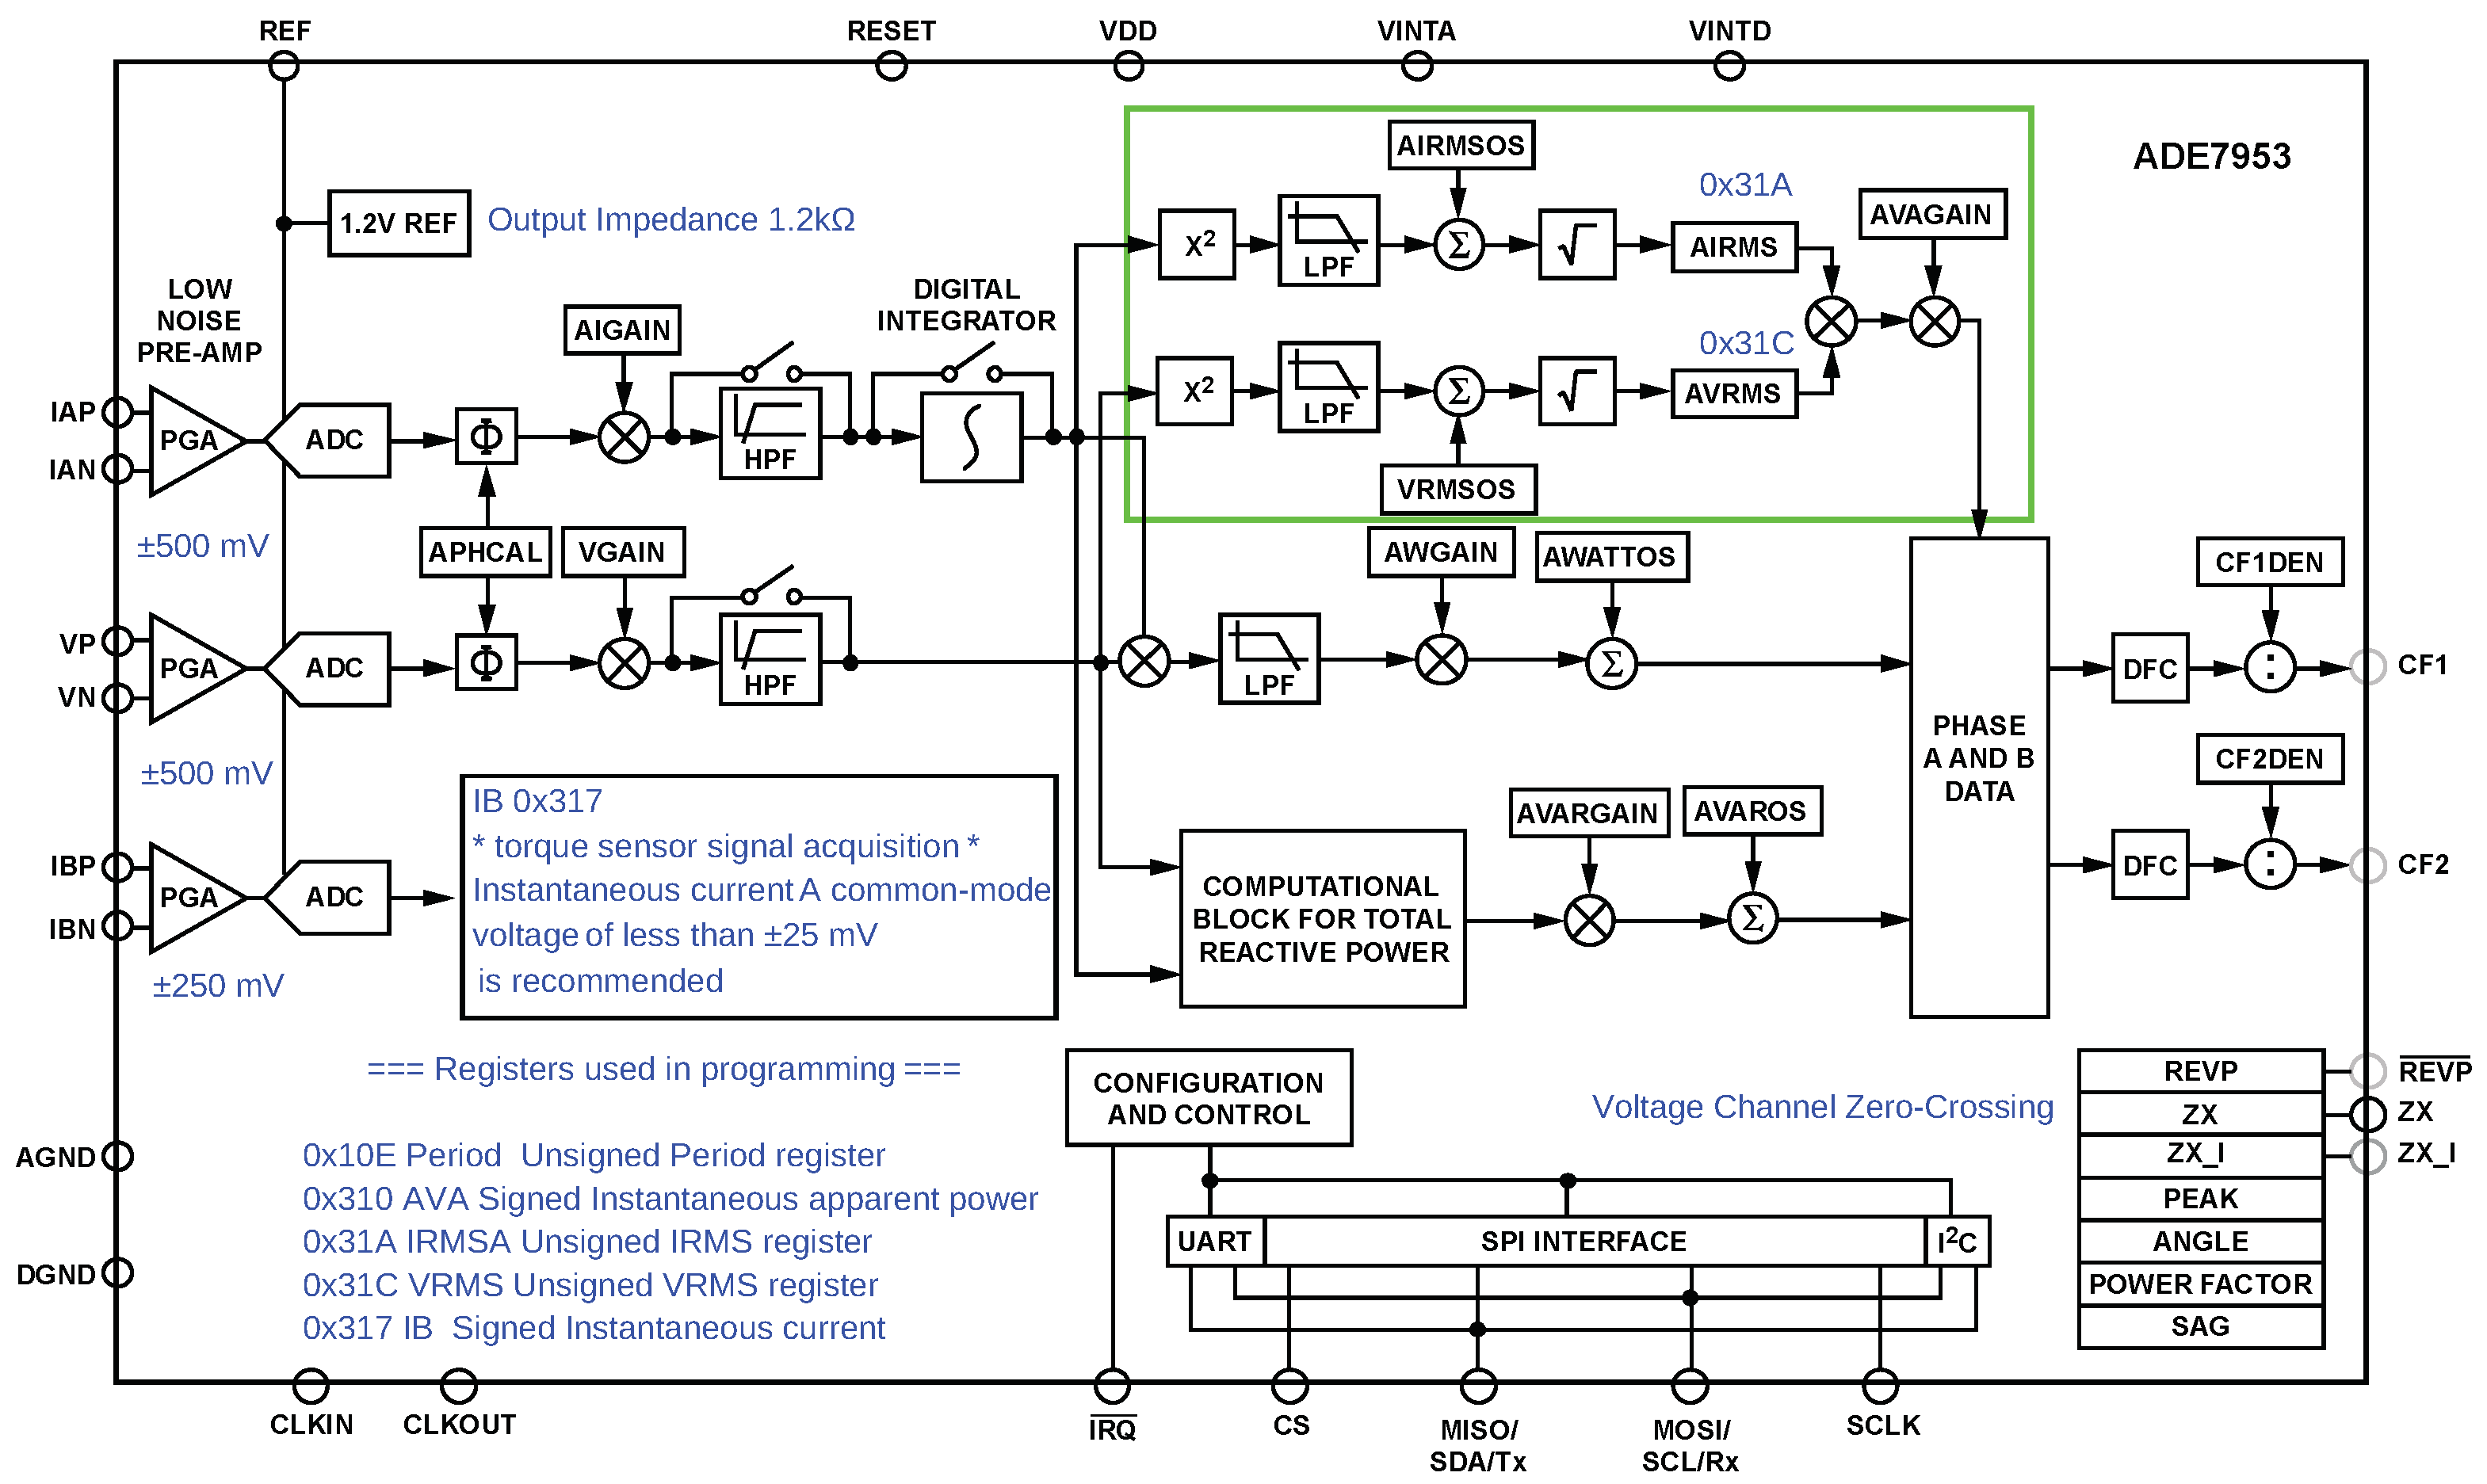
Figure 6.
ADE7953 current-controlled type wrench circuit.
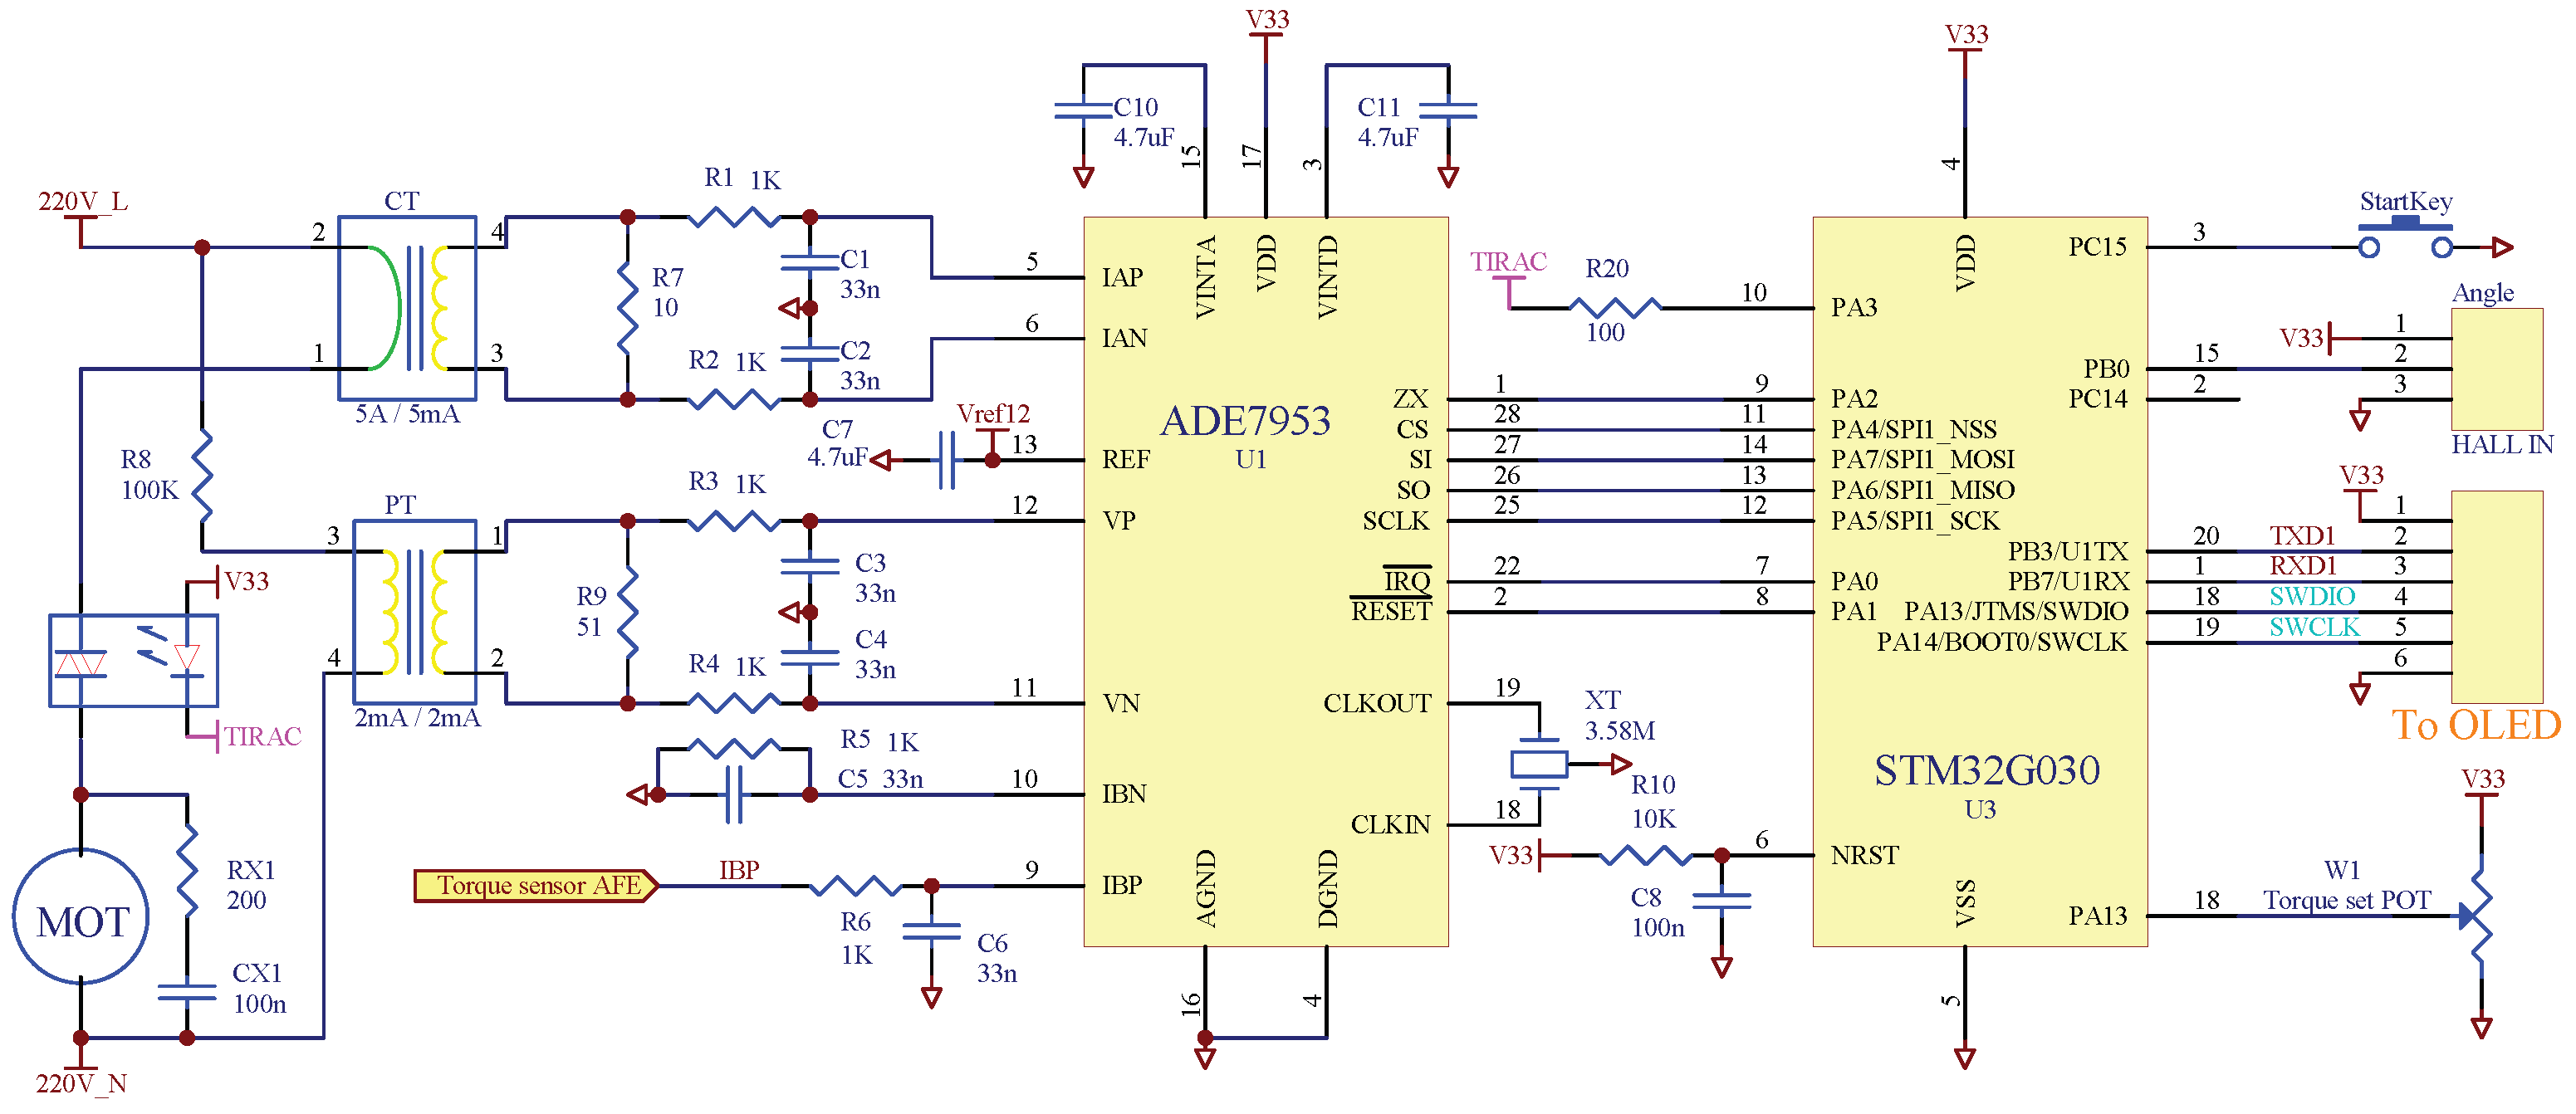
Figure 7.
Torque sensor analog front end circuit.
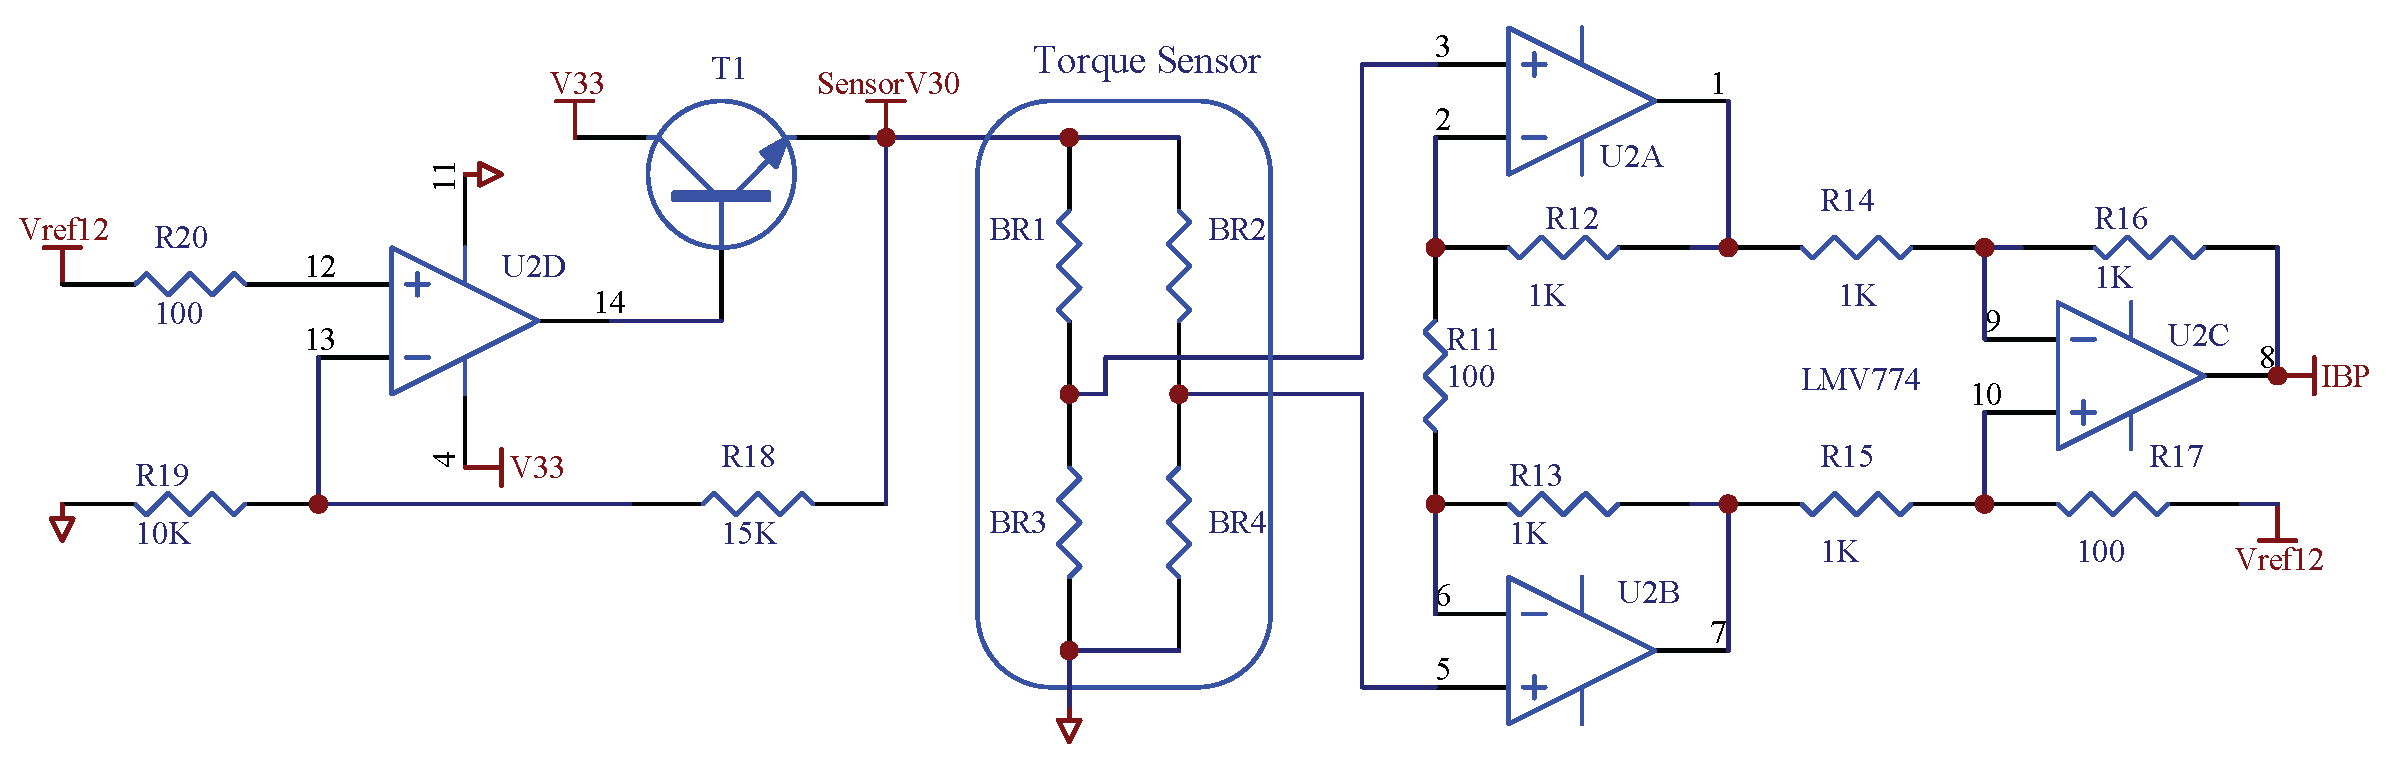
Figure 8.
Simulink simulation diagram and C program.
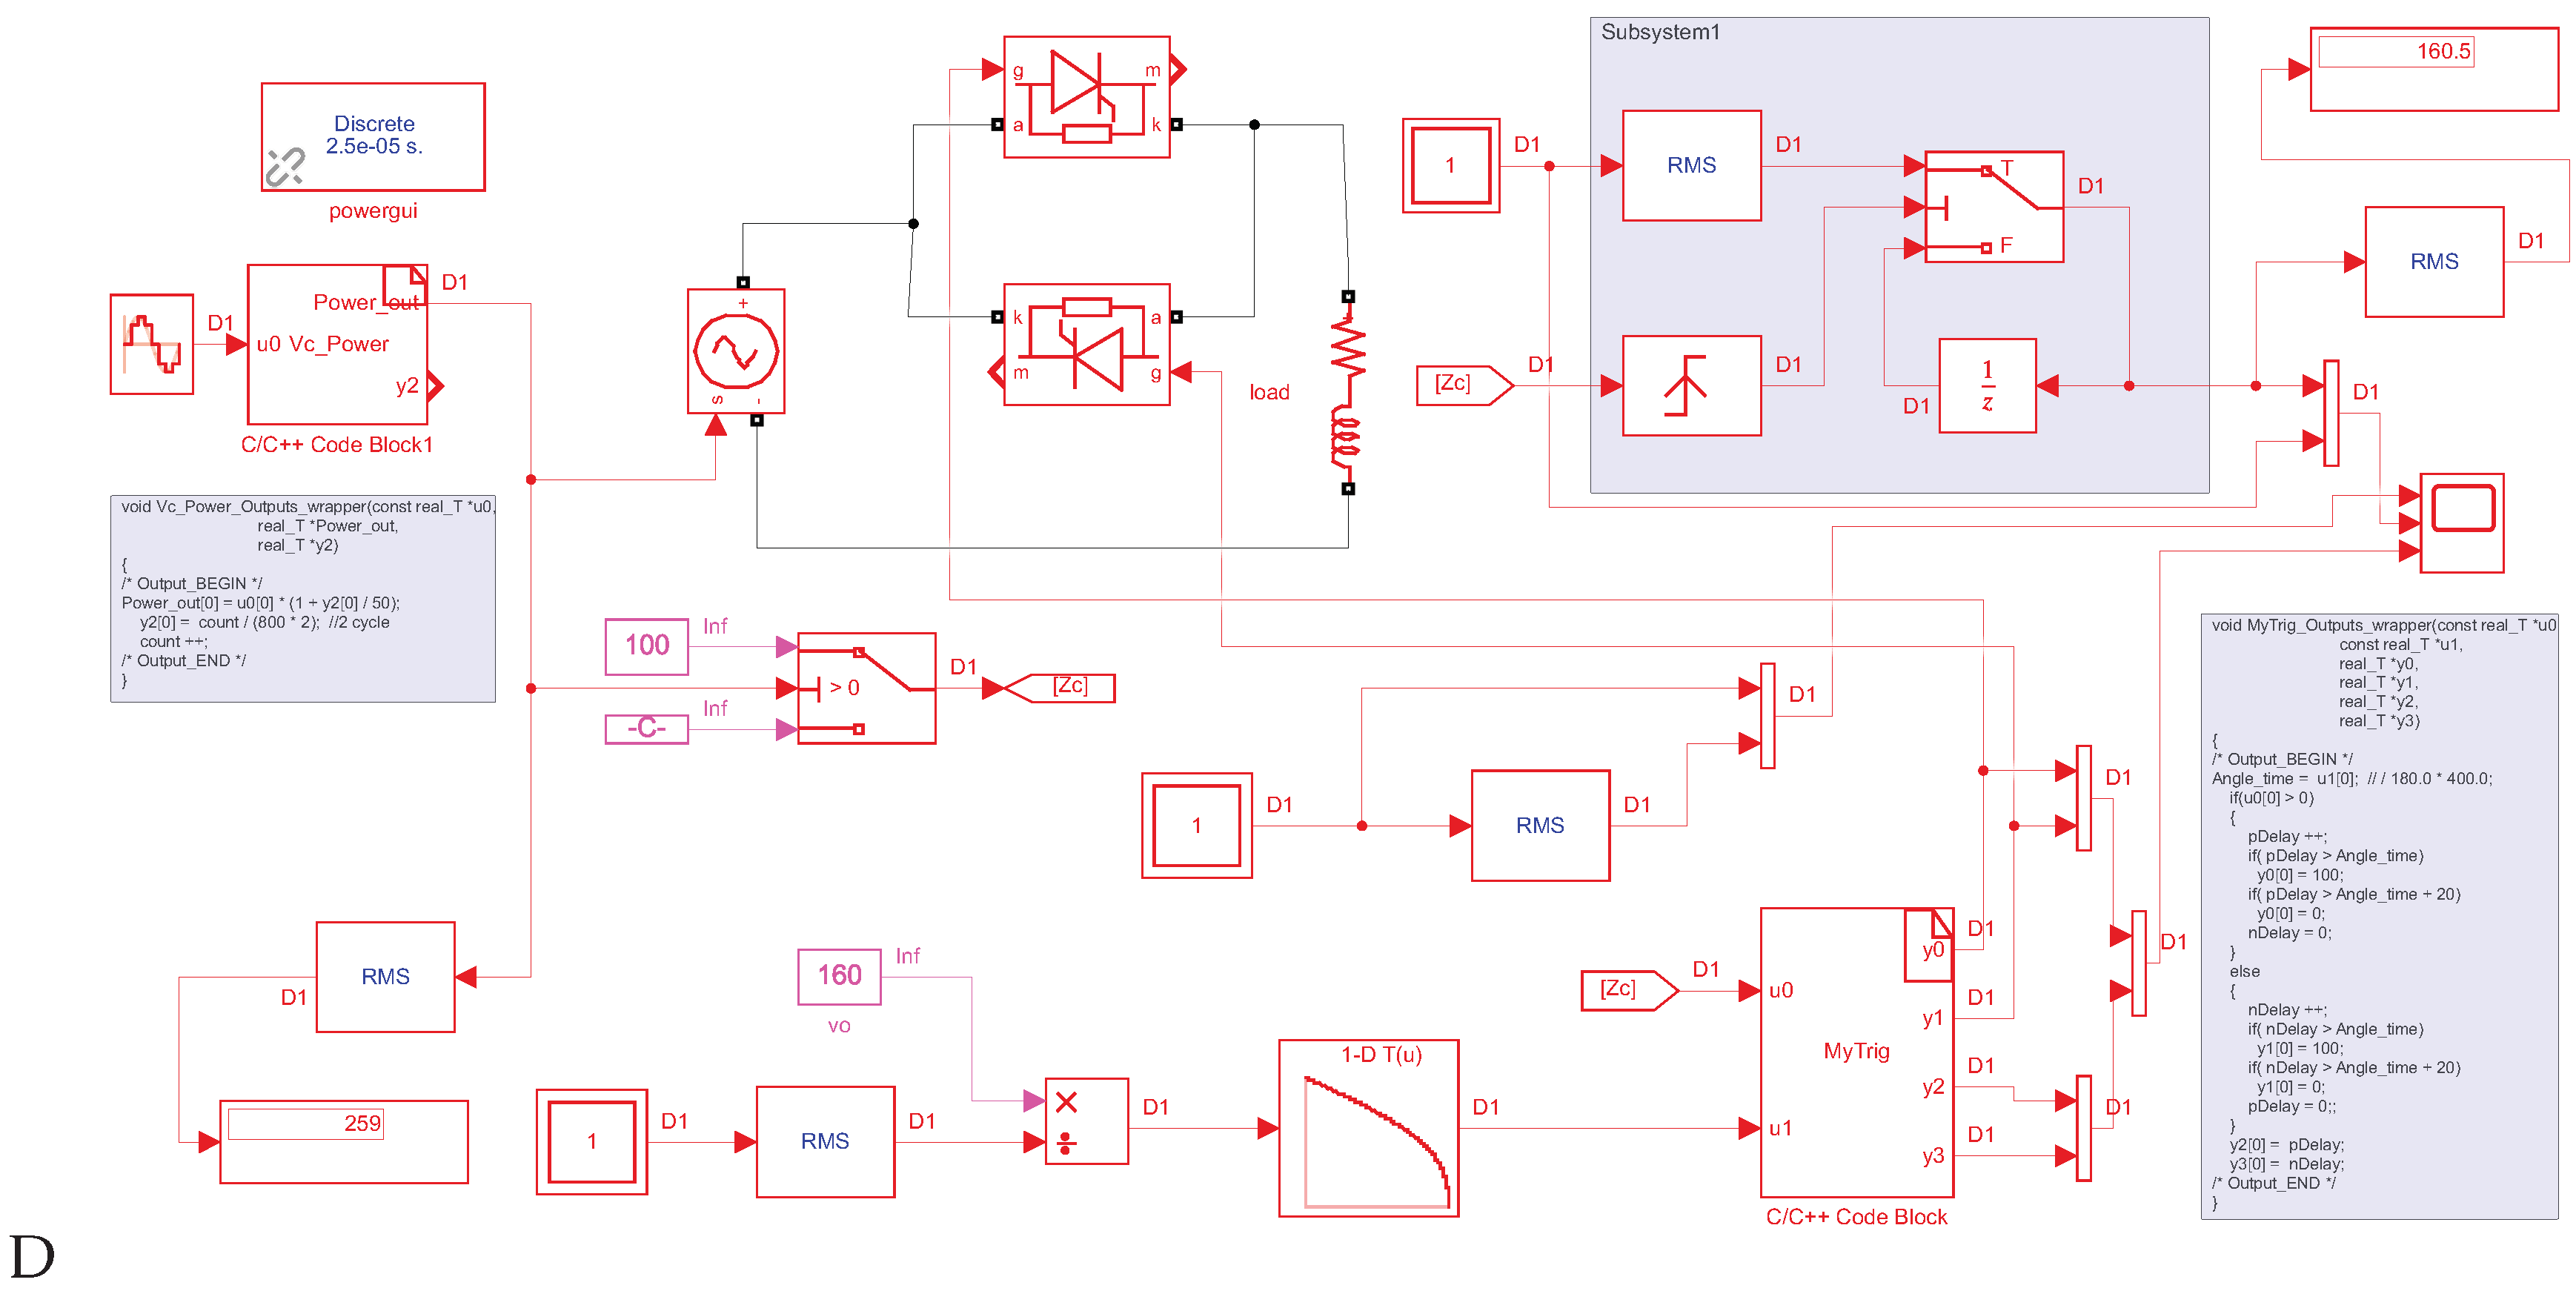
Figure 9.
Simulink simulation results.
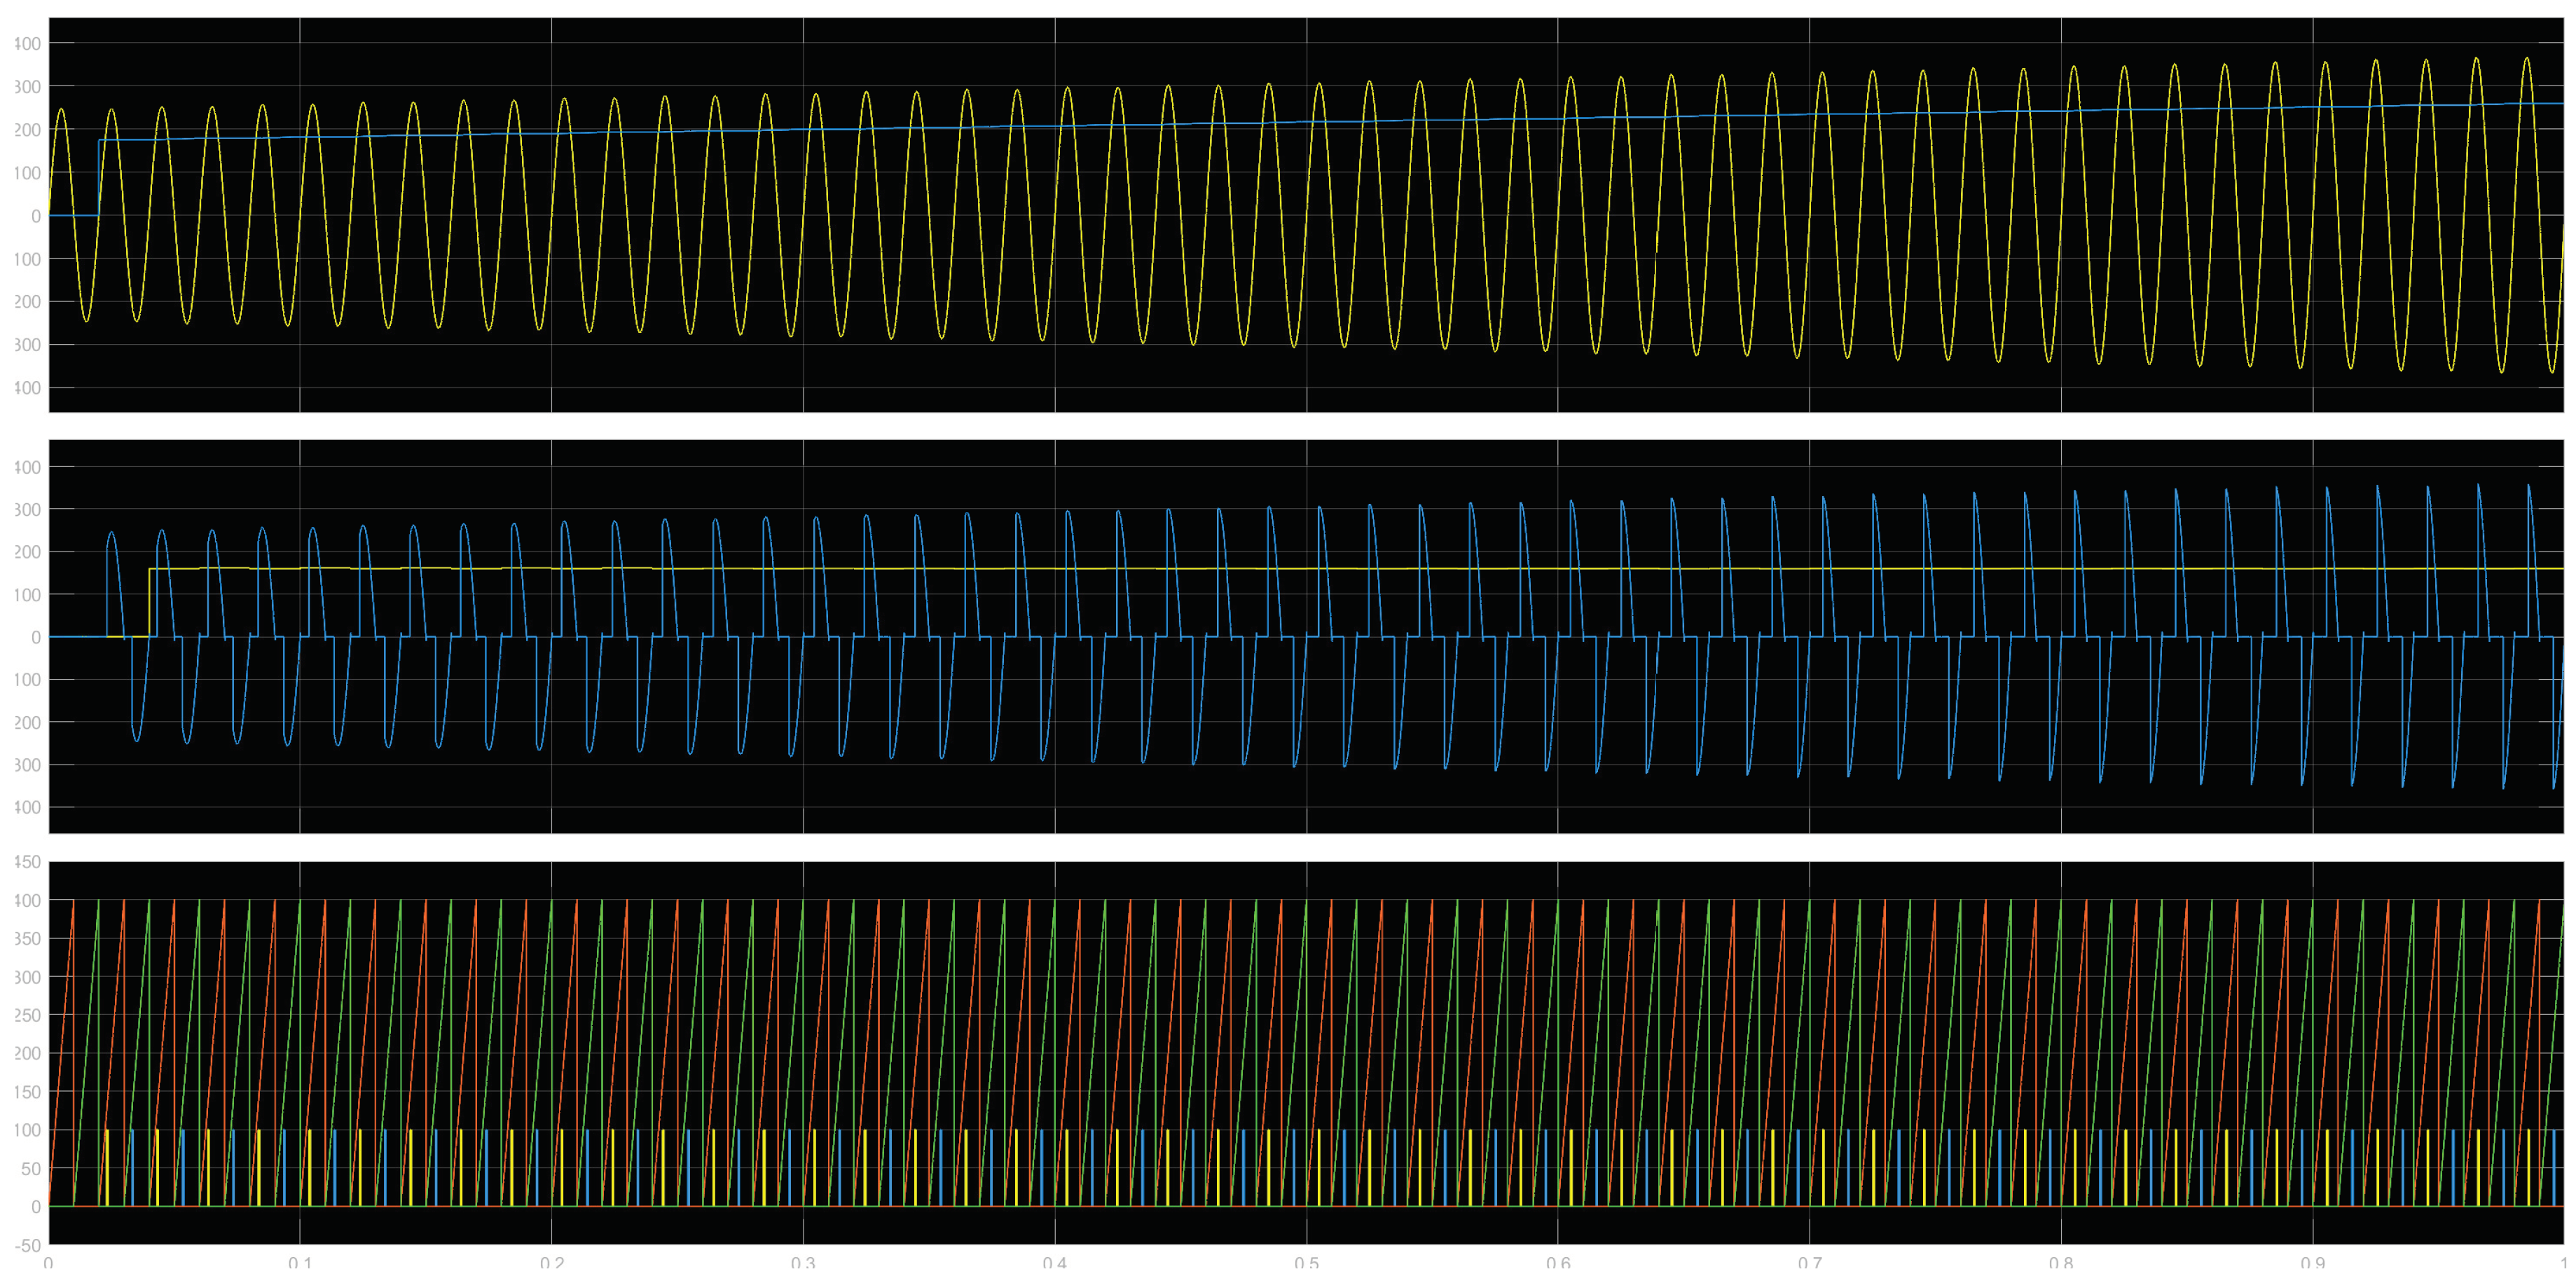
Figure 10.
Savitzky–Golay filters with different parameters.
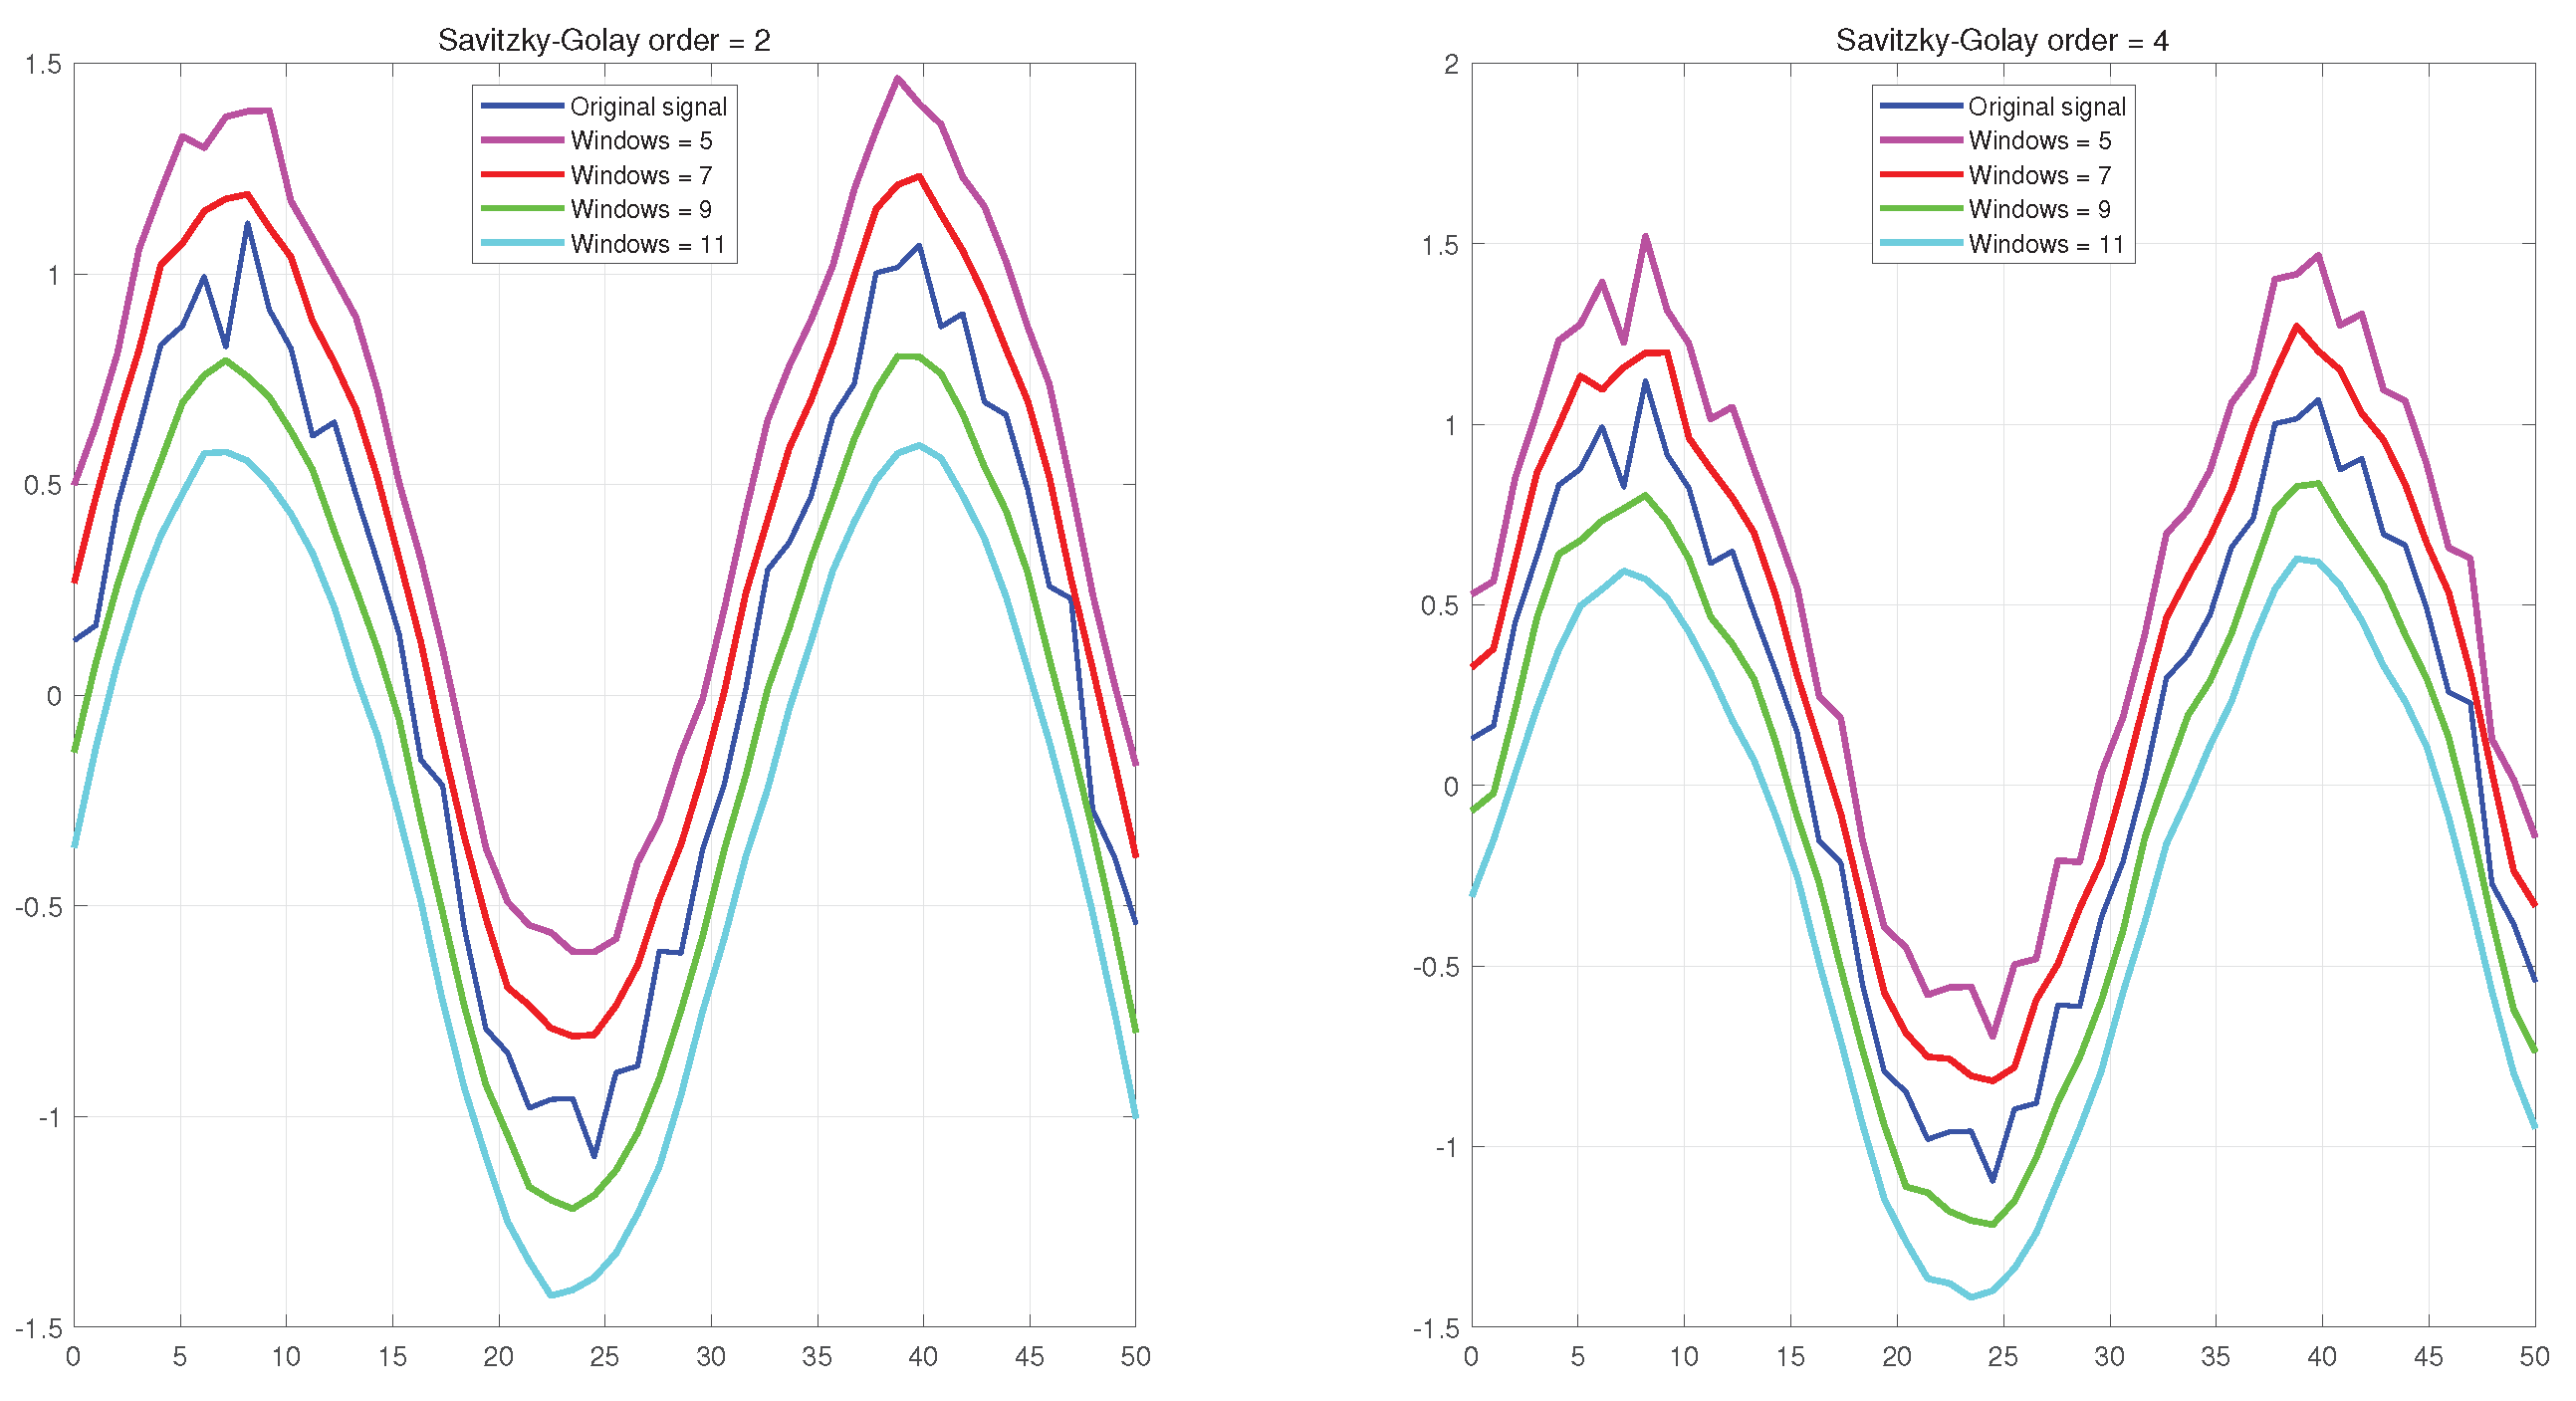
Figure 11.
Comparison of several filtering methods.
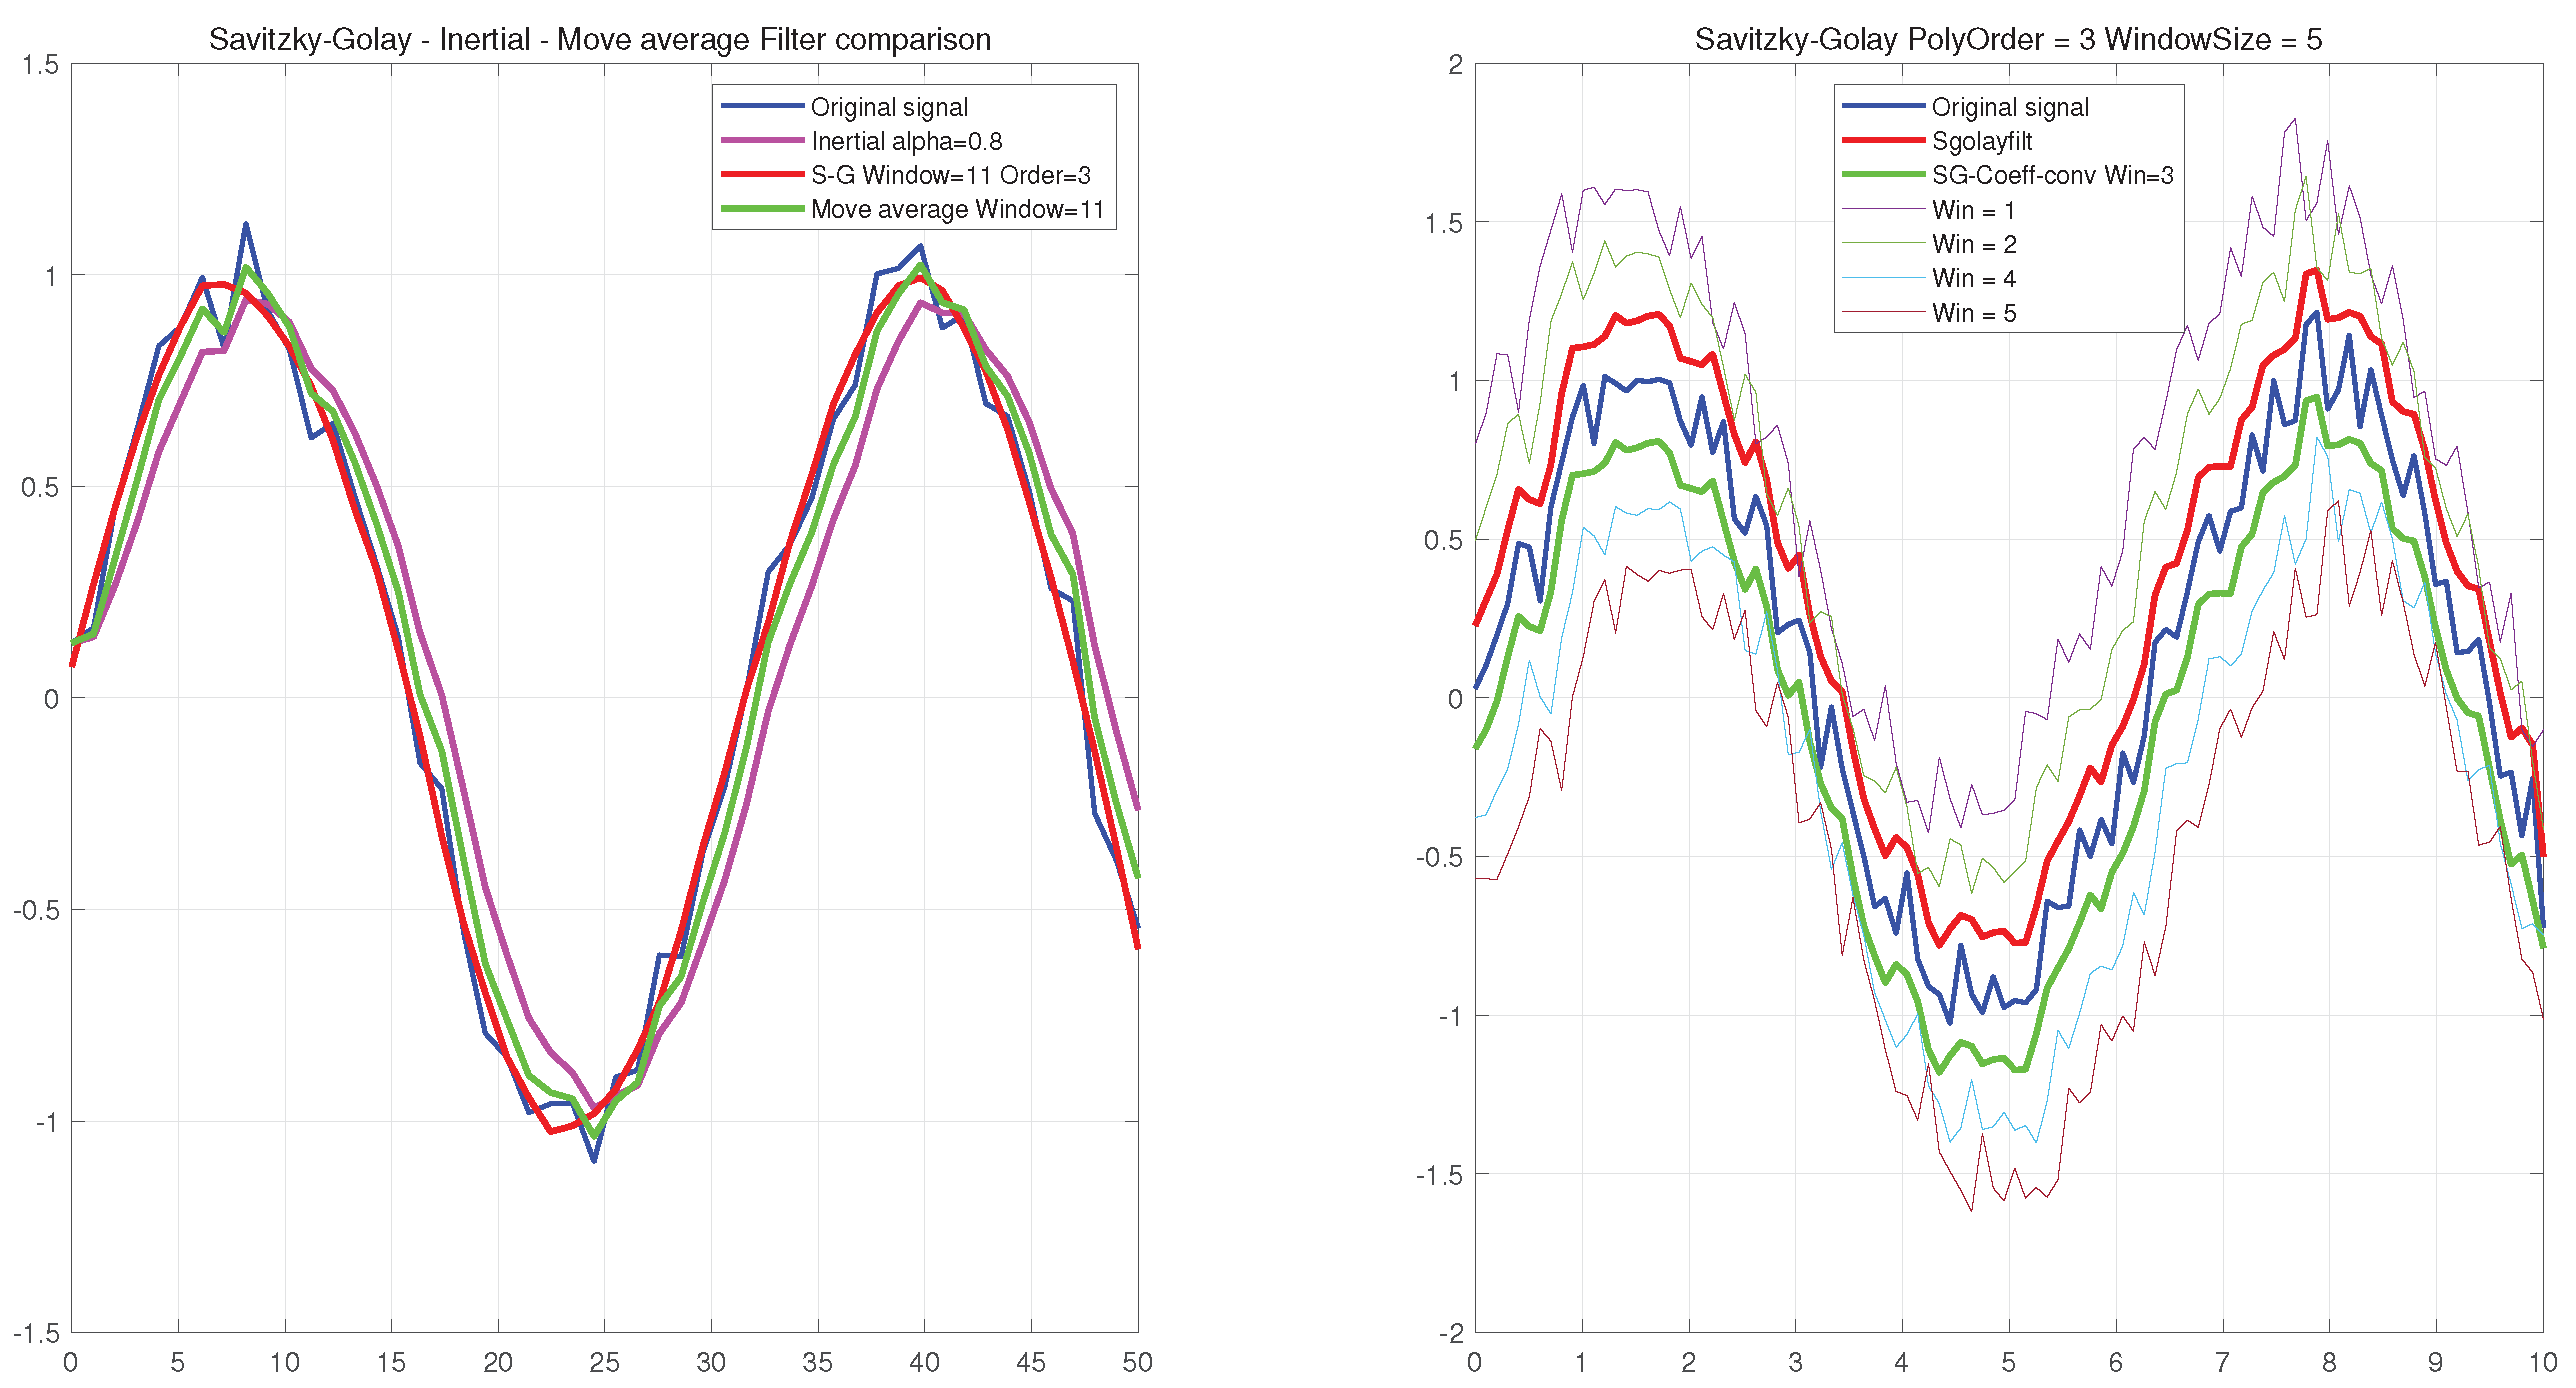
Figure 12.
IoT and HMI.
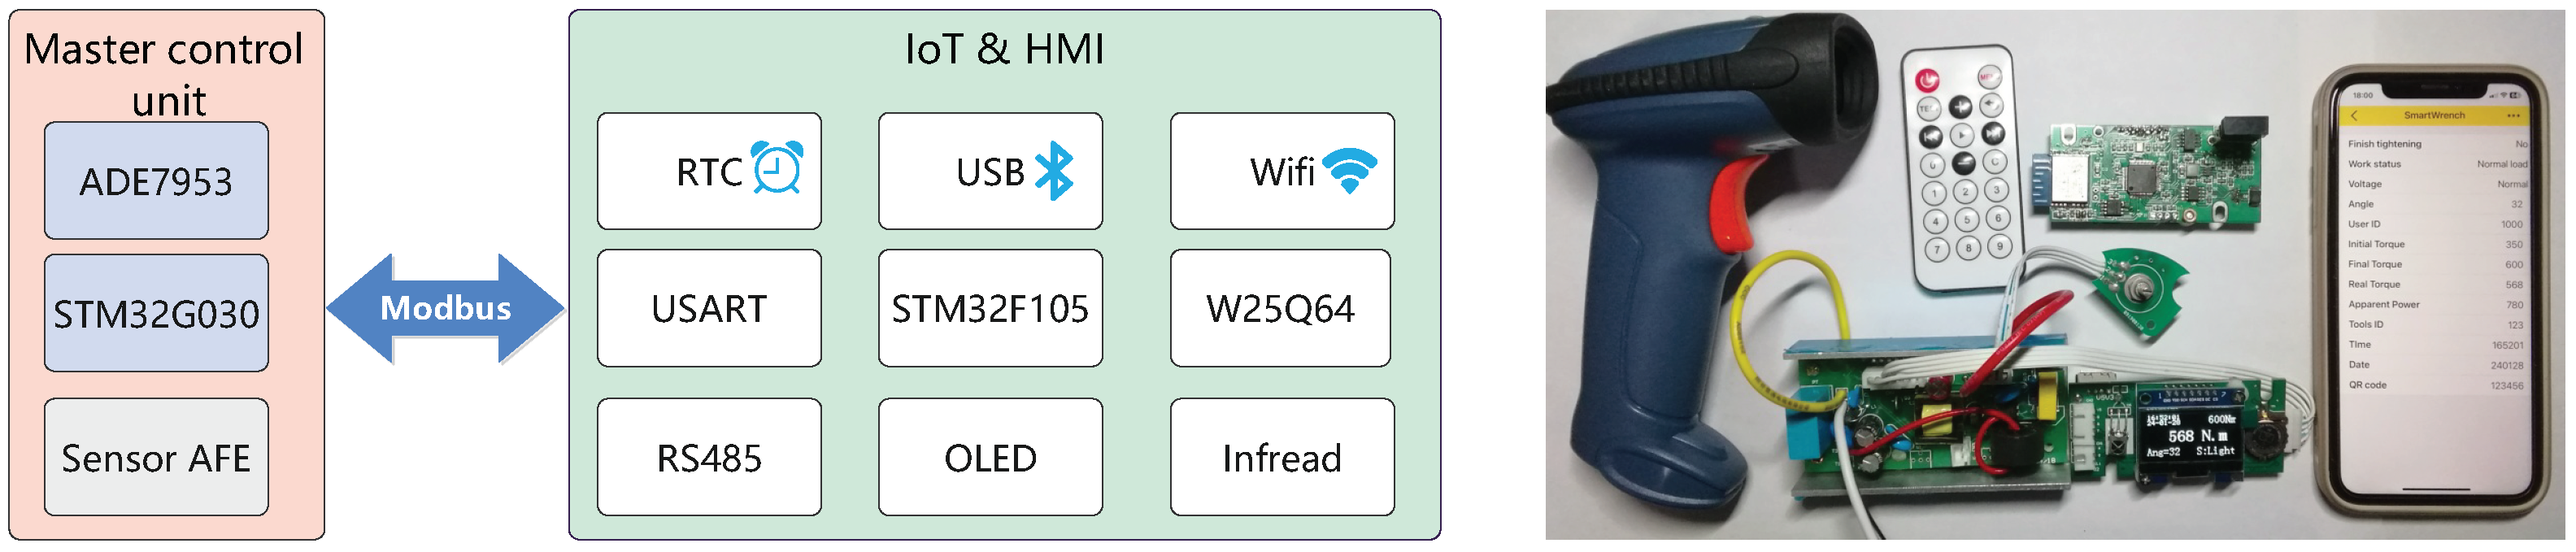
Figure 13.
Gizwit IoT platform, data points, MCU development, and mobile phone display.
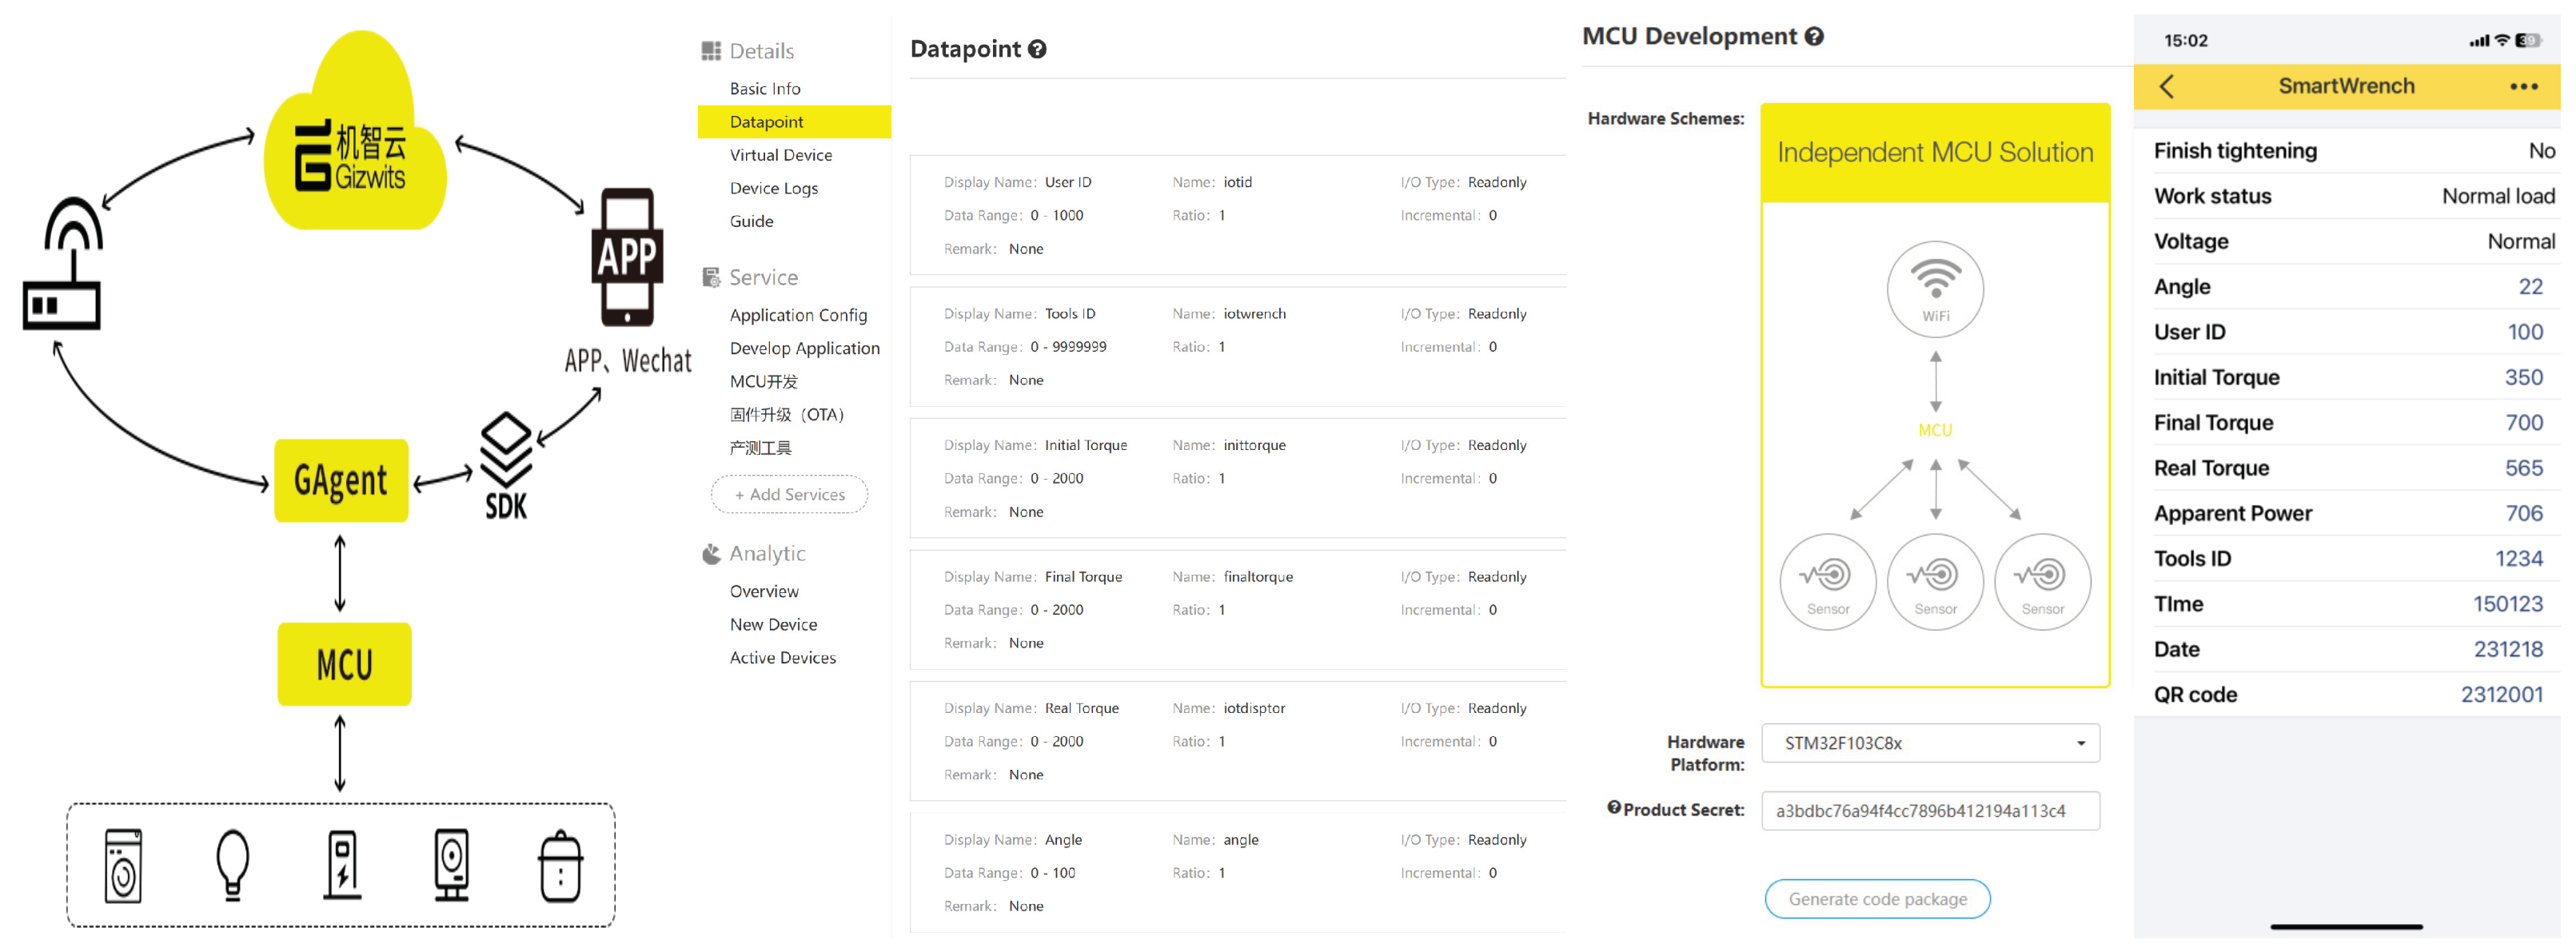
Figure 14.
Torque testing instrument and bolt construction.
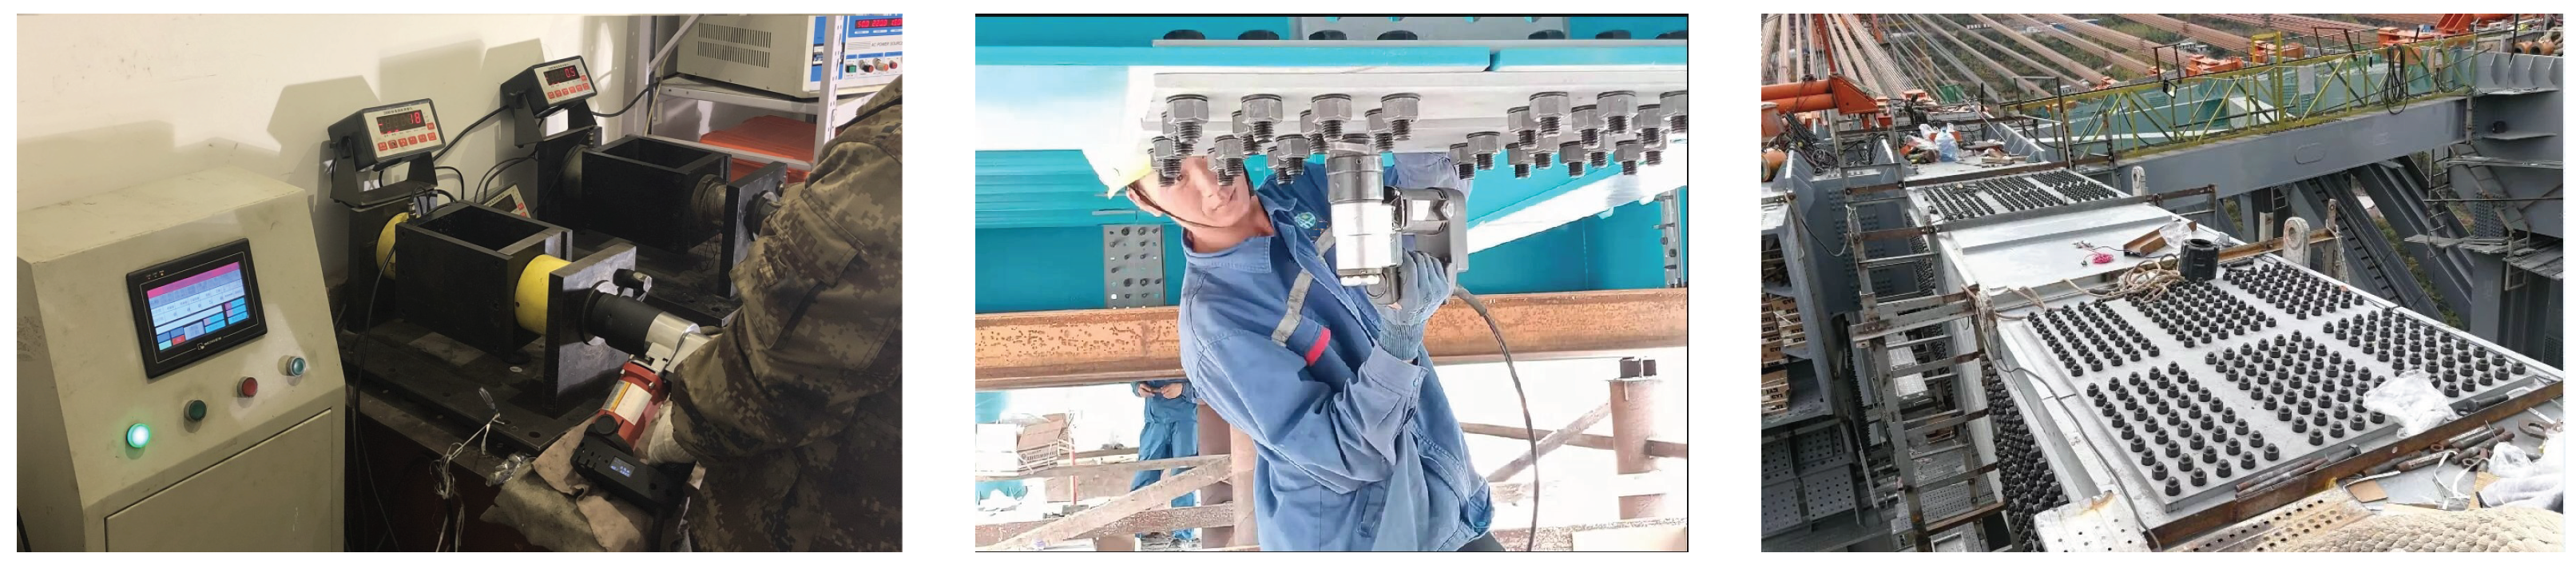

Table 1.
Trigger delay lookup table.
| k | Delay | k | Delay | k | Delay |
|---|---|---|---|---|---|
| 0.377047097 | 282 | 1.429424657 | 182 | 0.377047097 | 282 |
| 0.381288365 | 281 | 1.421570676 | 181 | 0.609747448 | 226 |
| 0.385531651 | 280 | 1.413716694 | 180 | 0.807448663 | 169 |
| 0.389776652 | 279 | 1.405862712 | 179 | 0.936128128 | 112 |
| 0.394023064 | 278 | 1.398008731 | 178 | 0.991277454 | 56 |
| ... | ... | ... | ... | 1 | 0 |
Table 2.
Convolution coefficients for order = 2-4, winsize = 5-13.
| Winsize | Polynomial order | ||||||||
| 2,3 | 2,3 | 4 | 2,3 | 4 | 2,3 | 4 | 2,3 | 4 | |
| 1 | -0.0769 | 0.0452 | |||||||
| 2 | -0.0839 | 0.0420 | 0.0000 | -0.0814 | |||||
| 3 | -0.0909 | 0.0350 | 0.0210 | -0.1049 | 0.0629 | -0.0555 | |||
| 4 | -0.0952 | 0.0216 | 0.0606 | -0.1282 | 0.1026 | -0.0233 | 0.1119 | 0.0452 | |
| 5 | -0.0857 | 0.1429 | -0.1299 | 0.1688 | 0.0699 | 0.1608 | 0.1399 | 0.1469 | 0.1604 |
| 6 | 0.3429 | 0.2857 | 0.3247 | 0.2338 | 0.3147 | 0.1958 | 0.2797 | 0.1678 | 0.2468 |
| 7 | 0.4857 | 0.3333 | 0.5671 | 0.2554 | 0.4172 | 0.2075 | 0.3333 | 0.1748 | 0.2785 |
| 8 | 0.3429 | 0.2857 | 0.3247 | 0.2338 | 0.3147 | 0.1958 | 0.2797 | 0.1678 | 0.2468 |
| 9 | -0.0857 | 0.1429 | -0.1299 | 0.1688 | 0.0699 | 0.1608 | 0.1399 | 0.1469 | 0.1604 |
| 10 | -0.0952 | 0.0216 | 0.0606 | -0.1282 | 0.1026 | -0.0233 | 0.1119 | 0.0452 | |
| 11 | -0.0909 | 0.0350 | 0.0210 | -0.1049 | 0.0629 | -0.0555 | |||
| 12 | -0.0839 | 0.0420 | 0.0000 | -0.0814 | |||||
| 13 | -0.0769 | 0.0452 | |||||||
Table 3.
The 600Nm 30 times torque test data.
| Unfiltered | Savitzky–Golay filter | |||||||
| 1-15 | 15-30 | 1-15 | 15-30 | |||||
| Value | err% | Value | err% | Value | error % | Value | err% | |
| 587.9 | 2.02 | 575.3 | 4.12 | 594.6 | -0.90 | 603.9 | 0.65 | |
| 596 | 0.67 | 624.1 | -4.02 | 598.6 | -0.23 | 594.8 | -0.87 | |
| 573.5 | 4.42 | 578.8 | 3.53 | 607.6 | 1.27 | 593.4 | -1.10 | |
| 588 | 2.00 | 598.4 | 0.27 | 606.7 | 1.12 | 599.7 | -0.05 | |
| 574 | 4.33 | 610.7 | -1.78 | 590.2 | -1.63 | 604.6 | 0.77 | |
| 578.2 | 3.63 | 609.8 | -1.63 | 614.2 | 2.37 | 586 | -2.33 | |
| 578.1 | 3.65 | 601.6 | -0.27 | 613.9 | 2.32 | 608.2 | 1.37 | |
| 598.8 | 0.20 | 619.5 | -3.25 | 593.6 | -1.07 | 588.5 | -1.92 | |
| 605.4 | -0.90 | 585.8 | 2.37 | 602.1 | 0.35 | 615 | 2.50 | |
| 624.1 | -4.02 | 576.6 | 3.90 | 606.6 | 1.10 | 611.7 | 1.95 | |
| 611.8 | -1.97 | 604.3 | -0.72 | 601 | 0.17 | 602.1 | 0.35 | |
| 620.2 | -3.37 | 580.4 | 3.27 | 613.4 | 2.23 | 614.6 | 2.43 | |
| 611.3 | -1.88 | 610.7 | -1.78 | 610.3 | 1.72 | 603.5 | 0.58 | |
| 622.7 | -3.78 | 591.8 | 1.37 | 609 | 1.50 | 588.7 | -1.88 | |
| 605.8 | -0.97 | 580.9 | 3.18 | 598.1 | -0.32 | 603.2 | 0.53 | |
Table 4.
Torque test data analysis.
| Std | Median | |||||
| Unfiltered | 573.5 | 624.1 | 4.42 | 2.81 | 14.2 | |
| S-G filter | 586 | 615 | 2.5 | 1.42 | 4.45 |
Disclaimer/Publisher’s Note: The statements, opinions and data contained in all publications are solely those of the individual author(s) and contributor(s) and not of MDPI and/or the editor(s). MDPI and/or the editor(s) disclaim responsibility for any injury to people or property resulting from any ideas, methods, instructions or products referred to in the content. |
© 2024 by the authors. Licensee MDPI, Basel, Switzerland. This article is an open access article distributed under the terms and conditions of the Creative Commons Attribution (CC BY) license (http://creativecommons.org/licenses/by/4.0/).
Copyright: This open access article is published under a Creative Commons CC BY 4.0 license, which permit the free download, distribution, and reuse, provided that the author and preprint are cited in any reuse.


