Submitted:
05 September 2025
Posted:
08 September 2025
You are already at the latest version
Abstract
In this article electromagnetic waves are assumed to be one-dimensional mechanical waves,and delves into the intricate relationships among the constituent elements, wave speed, and energy of both mechanical waves and electromagnetic waves. By establishing connections with the string vibration equation, a compelling revelation emerges. Upon equating the energy and constituent element mass of one wave cycle of a homogeneous string with those of a single wave cycle of electromagnetic waves, it is evident that the wave speed derived from the string vibration equation consistently matches the constant speed of light. From this, a hypothesis takes root: electromagnetic waves manifest as waves resulting from the vibration of a uniform, elongated string-like material. Building on this inference, if the theory holds true, under boundary-free conditions, higher-frequency electromagnetic waves would exhibit larger amplitudes. For electromagnetic waves with a 355 nm wavelength under boundary-free conditions, the amplitude would exceed m, and the average speed of mass points moving between the equilibrium position and the antinode would exceed times the speed of light. When measuring the time difference for vibration traveling from the equilibrium position to the antinode position using equipment with a time-resolution limit of s, no time difference is displayed by the equipment. The measurement result should be instantaneous—thus under such measurement precision and boundary-free conditions, electromagnetic wave energy can instantaneously reach any position within the transverse amplitude range from the vibration equilibrium position. Although air contains numerous molecules that collide with vibrating strings, intermolecular gaps exist, making it possible to detect instantaneous energy arrival phenomena within a certain lateral deviation range from the vibration equilibrium position. In experiments conducted in air using 355 nm pulsed laser light, instantaneous electromagnetic energy arrival was discovered within a 10 cm lateral deviation from the central light spot path, validating the theory.
Keywords:
Electromagnetic Waves
; String Vibration
; Dark Matter
; Planck Constant
; Superluminal
1. Introduction
The concept of "ether" in classical physics has a central idea: the refusal to accept that a vacuum is entirely devoid of substance [1]. The realms of dark matter and dark energy present enigmatic challenges in modern physics, their confirmed objective existence underscoring the notion that a vacuum is not devoid of substance [2]. Huygens proposed in the wave theory of light that light is a mechanical wave propagated by the continuous motion of a medium, grounded in the existence of 'ether' particles [3,4]. However, with the decline of the ether theory, which did not experience significant development, what underlying 'mechanism' guarantees the consistent speed of light for electromagnetic waves in a vacuum? What is the essence of electromagnetic waves? Departing from the premise that the propagation of electromagnetic waves necessitates a medium, the paper introduces a hypothesis: Electromagnetic waves arise from the vibrations of an extremely fine, continuous, homogeneous, and elongated string-like material. Through the correlation between electromagnetic waves and the string vibration equation, along with the analysis of superluminal experimental results, it is demonstrated that electromagnetic waves conform to the properties of string vibration waves, thereby validating the hypothesis. In contrast to Huygens' proposal of "ether" particles as a medium for mechanical wave propagation, this paper posits a continuous homogeneous long string material as the medium for electromagnetic waves. Unlike string theory, which suggests photons are the transverse vibration of a small segment of an 'open string' [5]. This discovery provides a new perspective for further understanding electromagnetic waves.
2. Deductive Process
2.1. Mechanical Waves and Electromagnetic Waves
In the realm of unbounded conditions, one-dimensional mechanical waves reach an equilibrium where potential and kinetic energies are ultimately equal, resulting in the equal distribution of system energy [6]. To elaborate, the total energy within one wave cycle equals twice the kinetic energy of the constituent elements of the wave. In the context of wave propagation, when considering the entire constituent element of the wave collectively, it can be inferred that, given a constant wave speed, the total kinetic energy in one wave cycle equals the kinetic energy of the entire constituent element moving in the direction of the wave. This relationship is expressed as follows:
where represents the total mass of constituent elements in one wave cycle, and denotes the wave speed.
Consequently, when the wave speed remains constant, the total energy = of one wave cycle of unbounded one-dimensional mechanical waves equals:
Now, let's consider the hypothesis that the individual electromagnetic waves require a medium for propagation and can be treated as one-dimensional mechanical waves. Due to the constant speed of electromagnetic waves in vacuum, which is the speed of light (in the following chapters, only individual electromagnetic waves in vacuum were discussed), So the total energy of an electromagnetic wave in one wave cycle is:
By combining equation (2), it can be deduced that in equation (3) corresponds to the constituent element mass of one wave cycle of electromagnetic waves.
Considering the energy of a photon, where is the Planck constant, and is the frequency of the electromagnetic wave [7], it is evident that the energy change of each photon is completely dependent on the frequency of the electromagnetic wave. Therefore, it can be inferred that the energy value of the Planck constant corresponds to the energy value of one wave cycle of a single electromagnetic wave, denoted as. is also a constant. is also the total energy of one wave cycle of electromagnetic waves. Following the mass-energy equation, we have:
where corresponds to the relativistic mass linked to the energy value in the Planck constant.
Combining equation (3), it can be deduced that corresponds to the constituent element mass of one wave cycle of a single electromagnetic wave.
2.2. String Vibration Waves and Electromagnetic Waves
The wave speed of a homogeneous string is determined by
where is the tension in the string, and is the linear density of the string.
Rearranging equation (5) yields
Substituting into equation (6) and simplifying gives
where is the mass of the string of length L for one wave cycle of string vibration, also the constituent element mass of one wave cycle of string vibration, and is the length of the string for one wave cycle.
Since string vibration waves are one-dimensional mechanical waves, the total energy of one wave cycle with no boundaries is likewise equal to twice the total kinetic energy of the entire constituent element moving in the direction of the wave during one wave cycle. Due to the constant velocity of homogeneous chord waves of the same material. Additionally, due to the tension in the string being always tangent to the string and constant in magnitude during the string vibration process [8], the source of vibration consistently performs work against the tension, over a distance equal to the length of the string. Consequently, it can be deduced that, when the wave speed is constant, the total energy of one wave cycle of the string vibrational wave is.
When string vibration waves and electromagnetic waves have equal total energy for one wave cycle, and when the total mass of constituent elements for both waves, and , each representing one oscillation cycle, is equal:
Simplifying equation (9) gives
The results indicate that if electromagnetic waves are assumed to be one-dimensional mechanical waves, under boundary-free conditions, upon equating the energy and constituent element mass of one wave cycle of a homogeneous string with those of a single wave cycle of electromagnetic waves, it is evident that the wave speed derived from the string vibration equation consistently matches the constant speed of light. This theoretical self-consistency leads to the proposition that electromagnetic waves are formed by homogeneous string vibrations.
3. Experiment
3.1. Experimental Principle
If the theory holds, expanding upon the previously posited theory that electromagnetic waves originate from the vibrational motion of a homogeneous string and integrating it with the intrinsic properties of electromagnetic waves, one can deduce that the energy associated with one oscillation cycle of an electromagnetic wave is a constant value. Considering equation (9), which represents the constant tension T in the string, it follows that the length of the string for one oscillation cycle, denoted as 'L,' is also constant. In the state of transverse vibration, the length of the string must surpass the wavelength. The bending speed of the string must be greater than the wave speed. Consequently, when generating transverse vibrations for electromagnetic waves, the bending speed of the string must exceed the speed of light. As the frequency of electromagnetic waves increases, the bending speed of the string inevitably increases, and the amplitude will also increase in the absence of boundaries.
Based on the wavelength of electromagnetic waves , where is the speed of light and is the frequency, when the frequency is 2HZ, the wavelength , and is the distance light travels per second (approximately 3×10⁸ meters). Therefore, the string length for one vibration cycle of an electromagnetic wave must be greater than and fixed. Taking an electromagnetic wave with a wavelength of 355 nm as an example, under boundary-free conditions, its quarter-period is approximately , corresponding to a quarter of the string length m and an amplitude . Calculations show that the time required for a mass point to move from the equilibrium position to the antinode over a distance is less than , and the smaller the deviation from the equilibrium position, the shorter this time. The average speed of movement already exceeds times the speed of light. If equipment with a time-resolution limit of s is used to measure the time difference for the vibration to reach this equilibrium position and the antinode, the equipment cannot display any time difference. Detailed calculations and explanations are provided in Appendix A.1. The time difference for completing the entire vibration cycle is also indistinguishable and can be considered instantaneous. For descriptive convenience, the phenomenon where electromagnetic wave energy instantaneously reaches positions within the transverse amplitude range from the vibration equilibrium position—under measurement equipment with a time-resolution limit of s—is hereafter termed the transverse instantaneous phenomenon. Here, "instantaneous" refers to the illusory instantaneity resulting from insufficient time resolution of the equipment.
3.2. Experimental Design
Figure 1a is a top-view schematic diagram. A pulsed laser emits 355nm wavelength pulsed laser light propagating in the direction of the arrow. AB represents the path of the vibration equilibrium position, and CE⊥AB. If electromagnetic waves are waves formed by string vibration, under boundary-free conditions, they will generate the string vibration wave shown in the diagram. Point C is the area where the photodetector (PMT) receives the optical signal, and the length CE is less than the amplitude of the string vibration wave. When the electromagnetic wave propagates from point A to point E, the vibration will reach point C in less than s, at which point the photodetector will receive the optical signal. If a light-blocking plate is added between the detector and AB as shown in Figure 1b, the string vibration will collide with the plate, resulting in a reduced amplitude. In this case, the detector will not receive the optical signal. Since the string length is fixed within one vibration cycle, a string of fixed length will be compressed within one wavelength. The closer the collision is to the equilibrium position, the denser the string lines become at the equilibrium position, and the corresponding energy density should increase. Observing a laser beam in air reveals that the light spot is the brightest. If the spot diameter is reduced and the divergence angle is controlled, treating the spot as a point and its path as a line in the experiment, then the light spot path can represent the equilibrium position path of the light spot’s path light vibration.
Since boundary-free conditions correspond to a perfect vacuum in the real universe, which is difficult to achieve artificially, the experiment was conducted in air at room temperature and pressure. Due to the gaps between air molecules, this space can approximate a perfect vacuum environment when no other microscopic particles are present. If electromagnetic waves are waves formed by string vibration, when the single-pulse energy is sufficiently large, after experiencing energy attenuation, some vibrating string lines should be able to avoid a portion of the air molecules, pass through the intermolecular gaps, and generate a transverse instantaneous phenomenon within a certain range deviating from the equilibrium position.
This article only studies one-dimensional plane waves. The experimental setup is connected as shown in Figure 2a (top-view schematic). The pulsed laser can emit 355nm pulsed laser light in the direction of the arrow. Detector PD1 and Detector PMT2 are two photodetectors that convert received optical signals into electrical signals transmitted via BNC cables to a digital storage oscilloscope (DSO) (with a measurement time resolution limit of s). The DSO can display electrical signal waveforms: the signal from detector 1 connected to channel CH1 produces waveform 1, and the signal from detector 2 connected to channel CH2 produces waveform 2. With fixed cable lengths, comparing changes in the rising edge time difference between the two signal waveforms can reflect changes in the time difference of the optical signals arriving at detectors 1 and 2. EC⊥AB, AD=AC. Points B and C are the optical signal reception areas for detectors 1 and 2, respectively. Point A is the light exit aperture, and AB is the central path of the light spot.
Since the laser emits multiple photons simultaneously, and pulsed laser propagation in air experiences divergence and scattering (light exhibiting the transverse instantaneous phenomenon will be specifically mentioned later; otherwise, light follows conventional theory by default), it is impossible to produce light propagating in only one direction. Under real experimental conditions in air, the emitted light should appear as shown in Figure 2b, m. Triangle AFG represents a portion of the divergent light region, and rectangle LMNO represents a portion of the scattered light region. After emission in these multiple directions, during propagation without collisions, theoretically, light in all directions should exhibit the transverse instantaneous phenomenon. Figure 2b depicts several representative light ray directions: AJ and AN are scattered light, AF and AG are divergent light, and AB is the central beam of the light spot. When light in the scattered light region along direction AJ propagates to point J, detector 2 can capture the optical signal (a time difference less than s is considered instantaneous). Similarly, detector 2 can capture the optical signal when light along directions AF, AB, AG, and AN propagates to points I, E, H, and K, respectively.
However, air contains numerous molecules, and emitted light collides with them. Observing the laser beam reveals that light deviating from the spot path experiences significant energy attenuation, with brightness decreasing as deviation increases. The observed laser spot diameter in this experiment is 2mm with a clear contour. If the hypothesis that electromagnetic waves are waves formed by string vibration holds, then after emission in air, most energy should be concentrated within 2mm around the vibration equilibrium position. Light forming the transverse instantaneous phenomenon with amplitudes exceeding 2mm should also be significantly attenuated. Furthermore, because greater deviation requires the vibrating string to avoid more molecules, the density of string lines penetrating intermolecular gaps decreases with increasing distance from the equilibrium position, leading to lower energy density. Scattered and divergent light should follow the same pattern. Scattered light has already undergone one significant attenuation relative to light on the spot path, and forming the transverse instantaneous phenomenon requires a second substantial attenuation. Light on the spot path forming the transverse instantaneous phenomenon only undergoes one significant attenuation. Therefore, by controlling the sensitivity of detector 2 and the voltage trigger threshold of the oscilloscope, the low-energy light components attenuated twice can be filtered out, only retaining scattered light and transverse instantaneous phenomenon light formed by spot path light, both of which have undergone only a single attenuation. Transverse instantaneous phenomenon light generated by divergent light can be filtered by controlling the divergence angle to reduce its intensity and adjusting the detector position to increase the deviation distance. Thus, with the equipment arranged as shown in Figure 2a, waveform 2 can be formed solely by the combined effect of the transverse instantaneous phenomenon light from the central spot path and scattered light (the original emitted light spot width in this experiment was 2 mm, with a divergence angle less than 1°,within the allowable error tolerance, the original light spot path can be regarded as a straight line, hereinafter, it will be uniformly referred to as the central light spot path). The shortest time for the optical signal to reach detector 2 is , and to reach detector 1 is , where is the distance and c is the speed of light. The rising edge time difference between waveforms 1 and 2 detected by the oscilloscope is recorded as . If, as shown in Figure 2c, light-blocking plates are added between detector 2 and AB, and above AB, causing the vibrating string to collide prematurely, then the transverse instantaneous phenomenon light cannot reach detector 2. All other conditions remain unchanged. The shortest time for the optical signal to reach detector 2 becomes (most scattered light energy should be concentrated within 2mm deviation from the equilibrium position; within the experimental error tolerance of this paper, the effect of a 2mm deviation on the signal arrival time at detector 2 is negligible). The time for the optical signal to reach detector 2 is delayed, while the time to reach detector 1 remains . The rising edge time difference between waveforms 1 and 2 detected by the oscilloscope is now recorded as . The change in time difference after adding the plates compared to before adding them should be
3.3. Experimental Results
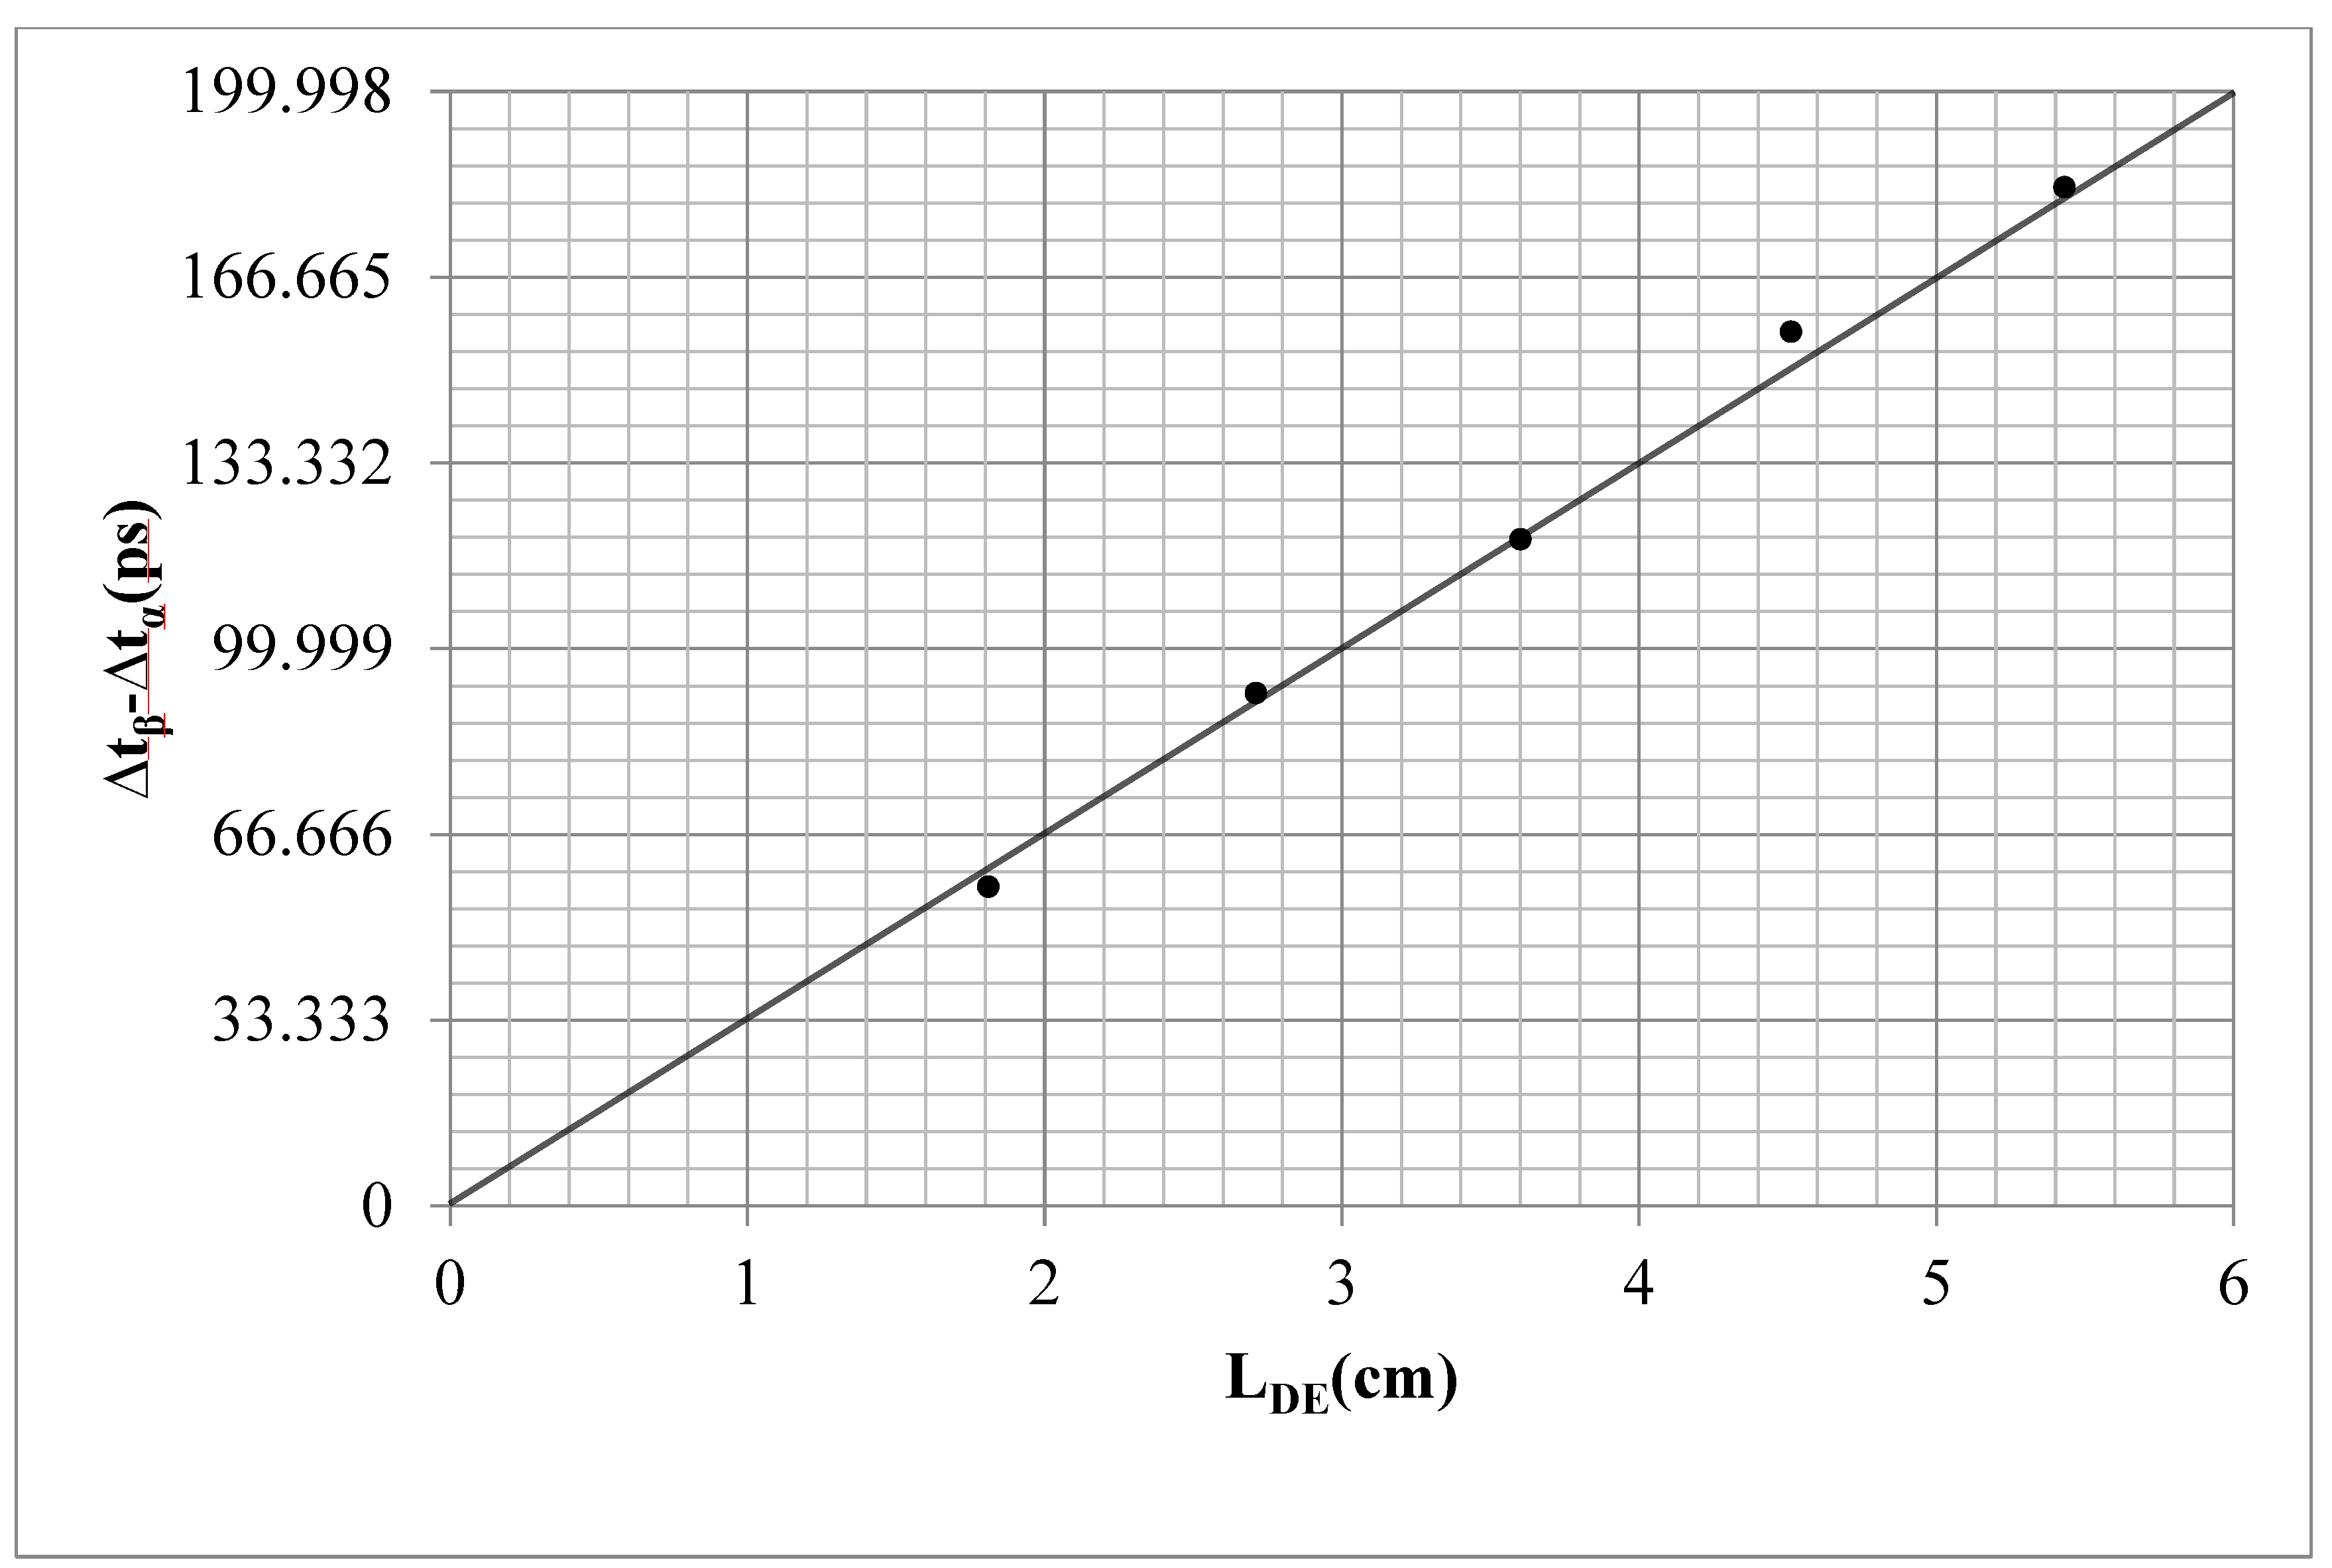
During measurements with EC distance less than 10 cm and ∠EAC between 30°–65°, changes in time difference were observed. Processed results are shown in Figure 3. Detailed values of ∠EAC, , and are provided in Attached Table A1; the experimental procedure is described in Appendix A.2.2; equipment specifications are listed in Appendix A.2.1; data acquisition and processing methods are detailed in Appendix A.3.
Figure 3 indicates that the relationship between the time difference change and follows the linear equation (11), with an average error below 5.1%. The inherent equipment error is less than 3.5%. Based on this inherent error, changes in time difference greater than 21.9ps are defined as statistically significant in this experiment. The error measurement process is documented in Appendix A.4. The results align with theoretical predictions, confirming the existence of the transverse instantaneous phenomenon within a specific range perpendicular to the central light spot path. Additionally, the observed change in time difference due to light-blocking plates is consistent with the theory that string vibration wave collisions reduce amplitude. After adding any light-blocking plate at the position shown in Figure 2c, a decrease in pulse width was detected by Detector 2. This reduction occurs because the light-blocking plate attenuates the amplitude of the transverse instantaneous light, preventing its detection by Detector 2. Consequently, early-arriving signals vanish, narrowing the pulse width—further validating the theory. These results demonstrate the correctness of the proposed theory.
3.4. Supplementary Experiments
3.4.1. Supplementary Experiment 1
As shown in Figure 2c, adding a light-blocking plate between Detector 2 and AB reduces the optical energy received by Detector 2, thereby decreasing the vertical amplitude value of the waveform on the oscilloscope. After removing both plates, a light-blocking plate was added on the opposite side of Detector 2 (Figure 2d), which similarly reduced the waveform’s vertical amplitude value. Under these conditions, no statistically significant change in time difference was observed. This confirms that the time difference change is not an artifact of reduced vertical amplitude value.
3.4.2. Supplementary Experiment 2
Placing the light-blocking plate at the position shown in Figure 2e, the optical energy received by Detector 2 was controlled such that the vertical amplitude value of the waveform on the oscilloscope remained unchanged without adjusting the vertical sensitivity after moving the detector. Detector 2 was moved perpendicular to the central light spot path as depicted. Within a range where the EC distance is less than 10cm, altering the EC distance will consequently change the AC distance. Experimental results show that when the AE distance remained constant, changes in AC distance did not produce a statistically significant change in time difference (detailed explanation in Appendix A.5). This indicates that within the measurement precision of this experiment, the arrival time of the optical signal at Detector 2 is consistent at any position along the EC direction within 10 cm of EC distance, confirming the existence of the transverse instantaneous phenomenon in this range, consistent with the theory. When the light-blocking plate position was adjusted to Figure 2f and Detector 2 was moved, an effective increase in time difference was observed as the EC distance increased. This aligns with the previously deduced theory that collisions of string vibration waves reduce amplitude, and detectors beyond the amplitude deviation cannot receive optical signals, further proving that electromagnetic waves exhibit string vibration wave properties.
3.4.3. Supplementary Experiment 3
As shown in Figure 2g, no light-blocking plates were added. Detector 1 was fixed, and Detector 2 was positioned at a fixed distance from the light exit aperture. Within a deviation of less than 10 cm perpendicular to the central light spot path, only ∠CAB was varied. With the oscilloscope at the same vertical sensitivity setting and no occurrence of low amplitude value or positive clipping, moving Detector 2 revealed that when ∠CAB ranged between 30°–45°, the rising edge time difference between waveforms 1 and 2 decreased as the angle increased. The AC distance remained fixed, while the AE distance decreased with increasing angle, causing Detector 2 to receive the optical signal earlier and thus reducing the time difference. This also demonstrates that superluminal phenomena inherently exist and are not induced by light-blocking plates. The results are consistent with theoretical predictions.
4. Discussion
The hypothesis that electromagnetic waves are formed by homogeneous string vibration is both theoretically and experimentally self-consistent, proving the validity of the theory. The process of electromagnetic wave formation through homogeneous string vibration ensures the consistent propagation speed of light in a vacuum. The distortion of the string can cause the propagation path of light to bend, aligning seamlessly with observational phenomena and providing additional support for the theory's validity. Considering the nature of long-distance transmission, the constant speed of electromagnetic waves in a vacuum, and their capacity to bend in a vacuum, we conjecture that electromagnetic waves arise from continuous, long string vibrations. The Michelson-Morley experiment, which refuted the Earth's motion relative to the ether [9], led to the demise of the theory of ether particles. The underlying reason lies in the independence of ether particles from the Earth's existence, as they do not move with the Earth. In contrast, the long strings proposed in this paper, when connected to particles, move in synchrony with the Earth, adhering to the principle of the constancy of the speed of light [10]. Given the limited scope of this study, subsequent discussions on particle formation, forces, black holes, dark matter, dark energy, cosmic accelerated expansion, and inertia—based on electromagnetic waves as vibrations of homogeneous long strings—may refer to literature 10.
5. Conclusion
Theory and experiments demonstrate that electromagnetic waves are waves formed by continuous long-string vibrations. This provides a foundation for further exploration of hot topics in physics such as dark matter and dark energy. The experiments in this study were conducted in air; future work may seek additional evidence in artificial vacuum and space environments.
Appendix A
A.1. Experimental Principle
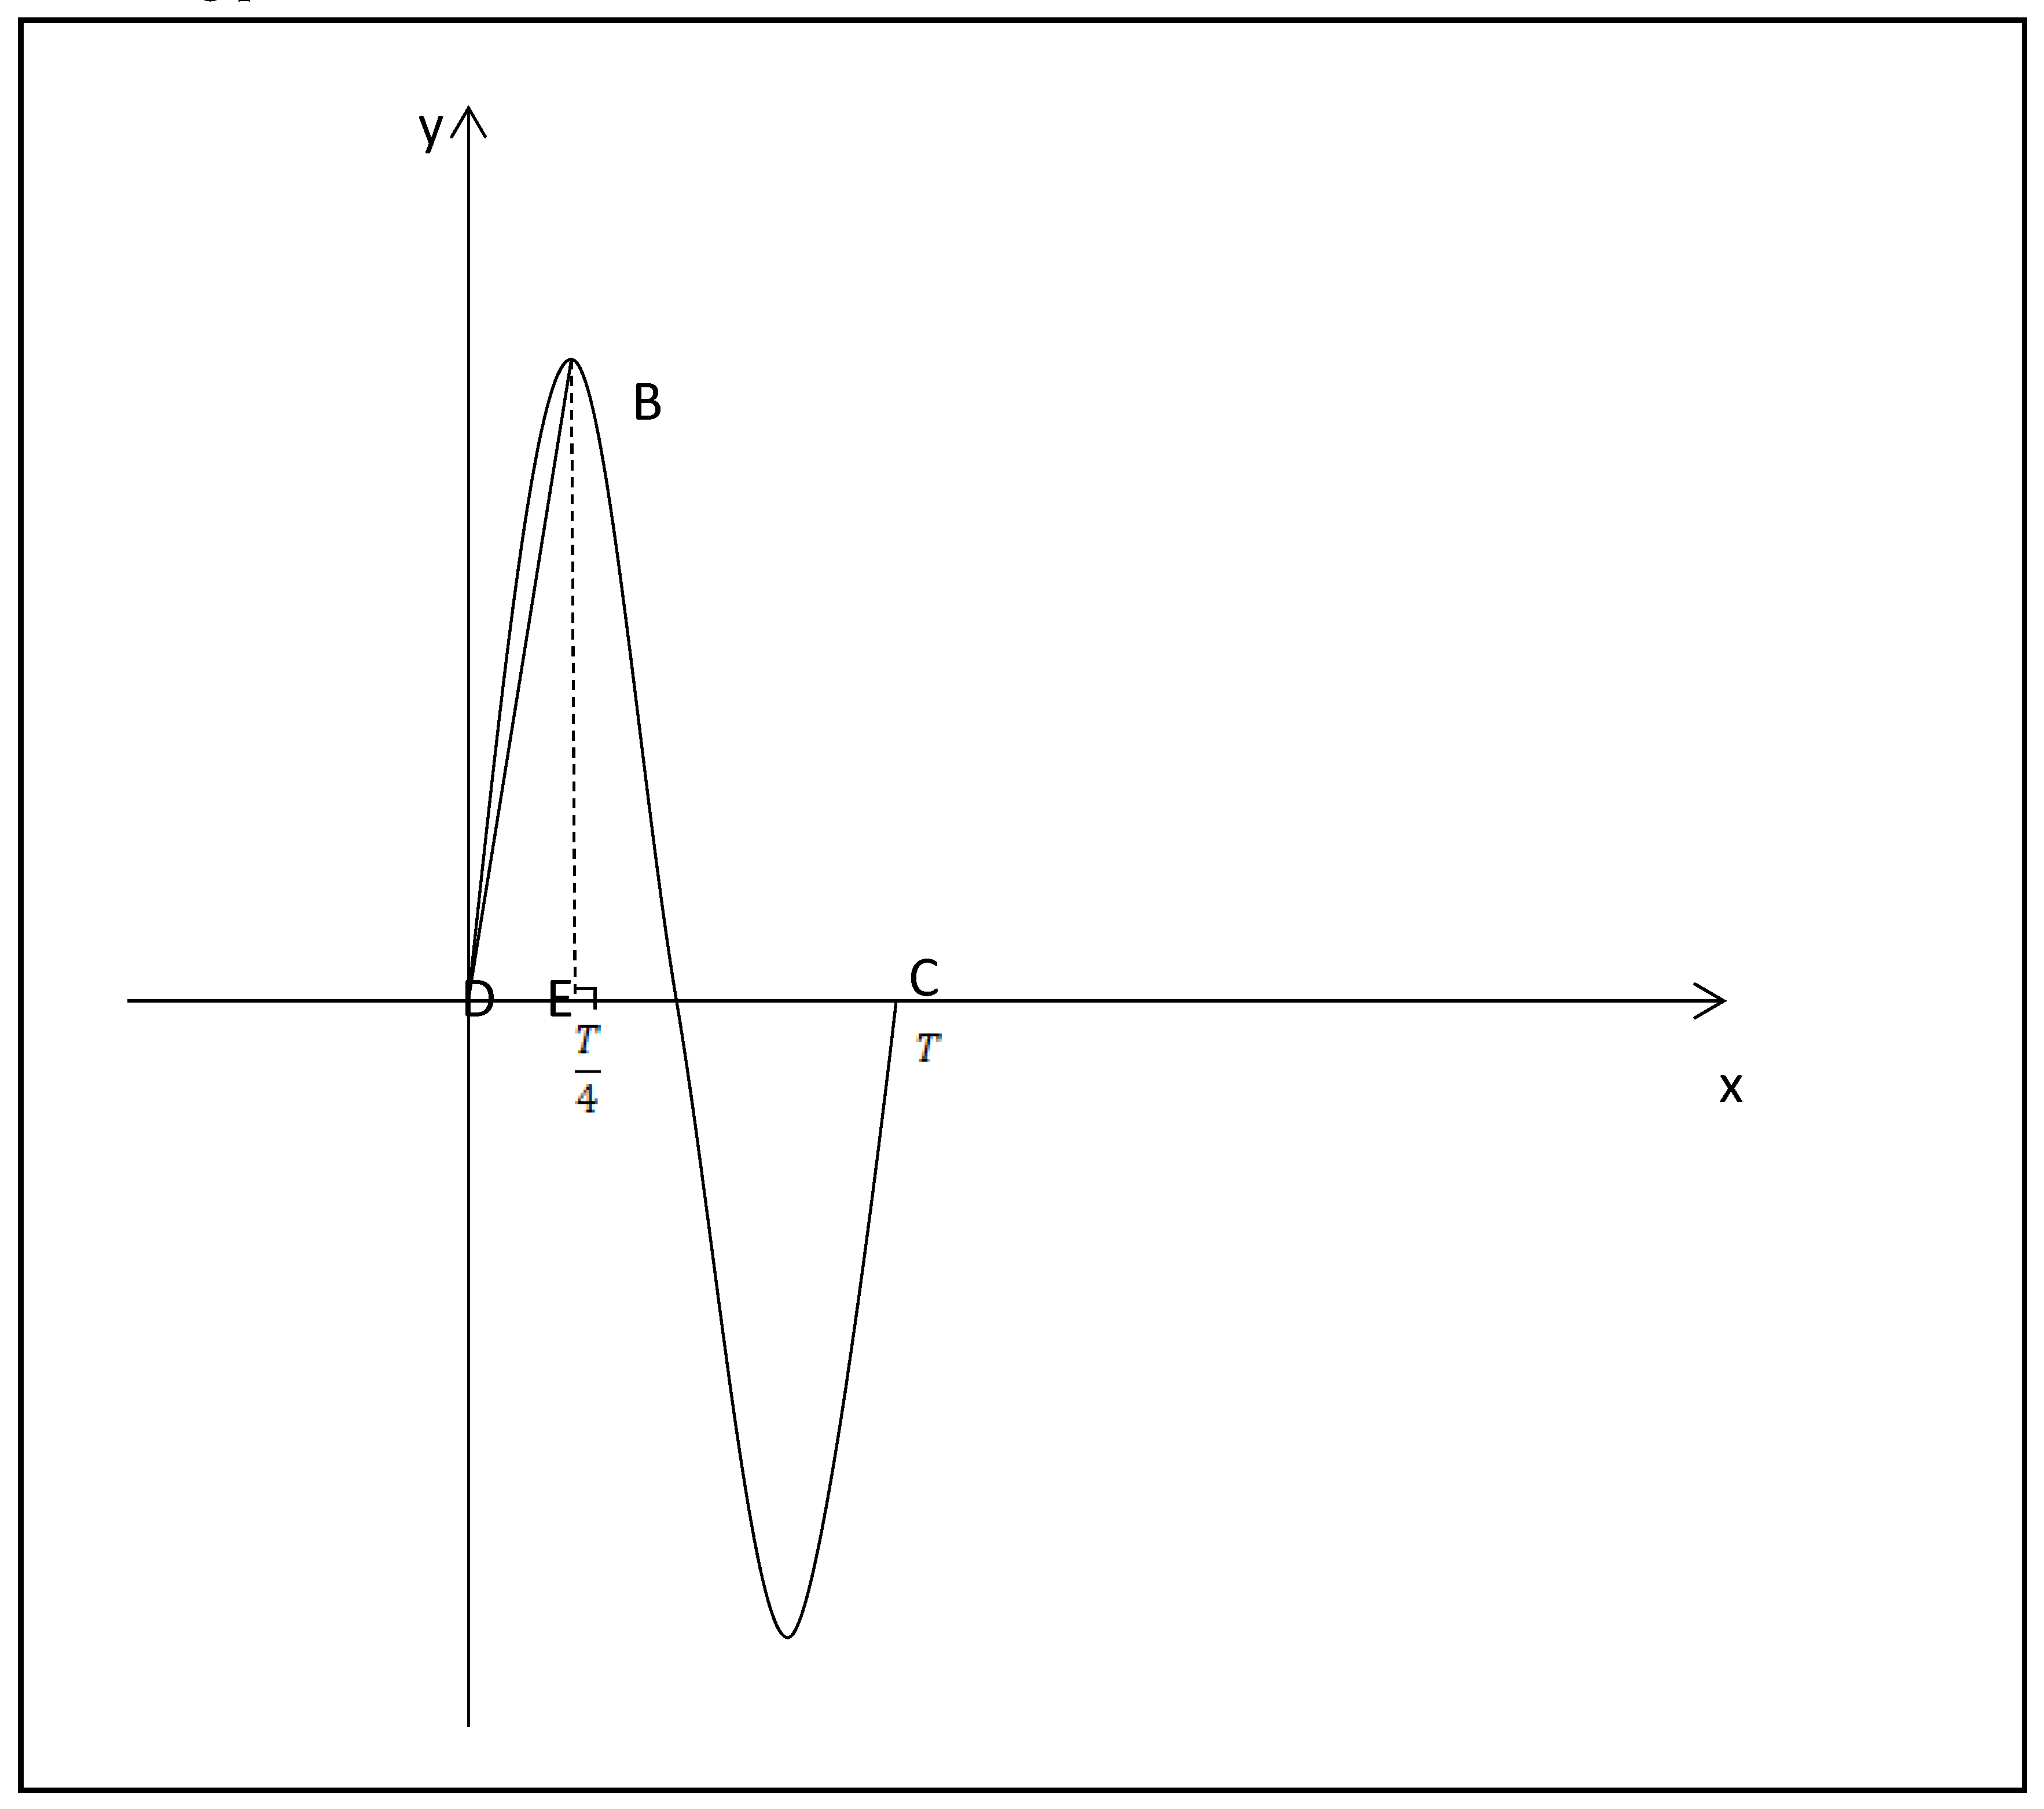
If electromagnetic waves are waves formed by string vibration, the string length of a vibration cycle is fixed and greater than . Figure 4 illustrates a schematic diagram of one complete vibration cycle for an electromagnetic wave and its fundamental one-dimensional planar string vibration wave under boundary-free conditions. Arc length is one-quarter of the string length of a vibration cycle; ; DC is the wavelength; the period is T; points D and C are nodes; point B is the antinode; BE⊥DC; . Taking 355 nm ultraviolet light as an example, the frequency , , . Based on the arc length , the fact that is approximately equal to is calculated, and ∠BDC approaches a right angle, and . Given the amplitude , under boundary-free conditions, a mass point at equilibrium position E can reach antinode B within . The average speed exceeds times the speed of light. If equipment with a time-resolution limit of s measures the time difference between vibration arrival at points E and B, no time difference is displayed. At this measurement precision, energy transfer from E to B and to all points along path EB is considered instantaneous.
Figure 4.
Schematic diagram of Electromagnetic Waves.
A.2. Experimental Equipment and Procedure
A.2.1. Experimental Equipment
The experiment utilized a nanosecond pulsed laser emitting 355 nm wavelength pulses with a pulse width of 9.5 ns, spot diameter of 0.7 mm, divergence angle <1°, and repetition rate of 200 Hz. The laser exit aperture was covered with a frosted plastic sheet. After passing through the plastic sheet, the laser traversed a 1 cm-thick circular aperture (diameter: 1.3 cm). A light-blocking sheet covered the aperture exit, leaving a 2 mm-wide slit perpendicular to the experimental platform. This configuration concentrated most energy along the original spot path while increasing divergent and scattered light intensity. The slit controlled divergence, enabling Detector 2 to stably receive scattered light signals while avoiding high-energy divergent light. The exit slit also narrowed the emission zone for precise source positioning. Detector 2 (PMT) was a Hamamatsu H11901-110 photomultiplier tube module with rise time of 520 ps. Due to its high sensitivity, the photosensitive area was partially blocked with light-blocking tape, leaving a micron-scale narrow slit parallel to the platform (around 2 mm wide). This can reduce the amount of scattered light and other interfering light entering, prevented signal saturation from dominant background energy, ensured measurable rising edge contributions from transverse instantaneous signals, and minimized experimental error by precisely defining the detection zone. The slit, laser exit, and Detector 1 were the same horizontal plane. An opaque plate beneath Detector 2 minimized light beyond the horizontal plane. All light-blocking plates used low-reflectivity materials to avoid excessive reflected light that may interfere with the experiment. In Figure 2c, the plate above AB must exceed length AE. The detector perimeter (2 m radius) was kept clear apart from the experimental equipment. The oscilloscope (DSO) was a Tektronix TDS3054B. Detector 1 (PD) had a rise time of 500 ps.
A.2.2. Experimental Procedure
With the oscilloscope vertical sensitivity set at 10 mv, stable waveforms without positive clipping or low amplitude value distortion were obtained by adjusting the slit width on Detector 2 and controlling the voltage between 0.5 V–0.6 V. When the light reception area of Detector 2 deviated laterally within 10 cm of the central light spot path (i.e., distance EC in Figure 2a < 10 cm) and ∠EAC ranged between 30°–65°, changes in time difference were observed after adding light-blocking plates per Figure 2c compared to the no-plate configuration in Figure 2a. For ∠EAC > 50°, an additional plate was added above Detector 2 to reduce interference from overhead light. Within the EC < 10 cm range, DE length was adjusted by varying AC distance and ∠EAC. Time difference between the rising edges of signals from Detectors 1 and 2 were recorded without plates (Figure 2a configuration). For the Figure 2c configuration, a light-blocking plate was added between Detector 2 and central light spot path AB. An additional plate was added on the opposite side of the central light spot path. Adding either plate resulted in decreased pulse width for Detector 2’s waveform (no change for Detector 1). After adding the light-blocking plate between AB and Detector 2, the vertical amplitude value of Detector 2’s waveform decreased.. The plate between Detector 2 and AB was positioned to maximally block light, bringing the vertical amplitude value close to the critical low amplitude value threshold. Data were recorded when the waveform amplitude value was at or within one division above this critical threshold. Time difference between the rising edges of Detectors 1 and 2 were measured, and value was calculated. Average of was derived from repeated trials.
A.3. Experimental Data and Data Processing Methods

Table A1.
Experimental data.
| ∠EAC, | 30°,13.5cm | 40°,11.6cm | 45°,12.3cm | 57°,9.9cm | 65°,9.4cm |
| 1.81cm | 2.71cm | 3.60cm | 4.51cm | 5.43cm | |
| 57.298ps | 92.017ps | 119.604ps | 156.902ps | 182.799ps | |
| ()theoretical value | 60.333ps | 90.332ps | 119.999ps | 150.332ps | 180.998ps |
Both and represent averages of 50 consecutive rising edge time difference values displayed by the oscilloscope in "Avg 512" mode after waveform stabilization, with data for and collected within intervals under 5 minutes per experiment. Figure 3 and in Attached Table A1 present averaged values from repeated experiments.
A.4. Error
The inherent equipment error was measured from three aspects.
First, the frosted plastic sheet at the light exit was removed, and a beam splitter was added outside the emission slit to generate two light spots. Detector 1 remained fixed facing the center of one light spot. After attaching a neutral density (ND) filter, the light reception area of Detector 2 was aligned with the center of the other light spot and moved along the spot path (with zero angular deviation from the central light spot path), away from or toward the light source. The change in rising edge time difference corresponding to Detector 2's displacement was recorded and compared against the reference value to calculate the error. Here, denotes the time difference variation, represents Detector 2's displacement distance, and c is the speed of light. Repeated experiments were conducted for Detector 2 displacements of 1 cm, 2 cm, 3 cm, 4 cm, 6 cm, 9 cm, and 12 cm. Results showed an average error below 3.5%, with a maximum error under 6 ps. All data acquisition for each experiment was completed within five minutes.
Second, after both detectors were processed identically to Step 1, Detector 2 was fixed on the central light spot path with zero angular deviation and fixed distance from the light source. The time difference fluctuated over time, which was measured by the oscilloscope at this fixed distance was assessed. In repeated experiments, values recorded commencing one minute after waveform stabilization were compared against those recorded commencing five minutes after stabilization. Results showed time difference fluctuations below 7.1 ps.
Third, the frosted plastic sheet was reinstalled at the light exit, the beam splitter was removed, and detectors were repositioned per Figure 2a. Detector 1 remained fixed, while Detector 2 was fixed at ∠EAC = 30°, 40°, and 50° within EC < 10 cm. That the time difference fluctuated over time, which was measured by the oscilloscope was evaluated under fixed distances and angles. Similarly, values recorded commencing one minute after waveform stabilization were compared against those recorded commencing five minutes after stabilization. Results showed time difference fluctuations below 2.6 ps.
Error measurement step 1 demonstrates the reliability of the equipment. Steps 2 and 3 confirm that with both Detectors 1 and 2 fixed, the measured rising edge time difference values exhibit no fluctuations exceeding the measurement error within a 5-minute period. Neglecting measurement errors, any change in the measured time difference must be accompanied by actual variations in the optical signal arrival time at the detectors. All time difference calculations in this paper represent averages of 50 consecutive time difference values displayed by the oscilloscope in "Avg 512" mode, further affirming the reliability of the data processing method. Based on Steps 2 and 3, to eliminate the influence of baseline error on experiments, all experimental designs in this study ensure theoretical time difference changes exceed 29ps (corresponding to a displacement >0.87 cm at corresponding light speed). Concurrently, measured changes must surpass 21.9ps to be considered statistically significant. All spans of variable in Attached Table A1 exceed 0.87 cm.
A.5. Supplementary Experiment 2
When the lateral deviation of Detector 2 from the central light spot path changes significantly, it leads to a large variation in the received energy, causing large vertical amplitude value changes in the waveform. This easily induced positive clipping under the same vertical sensitivity setting. Thus, a light-blocking plate was used to control the optical energy received by Detector 2, thereby regulating the waveform’s vertical amplitude value. Positioned as shown in Figure 2e, Detector 2 was moved perpendicular to the central light spot path within a deviation range of <10 cm (away from or toward the central light spot path). In Figure 2e, AE⊥EC with EC < 10 cm. The plate controlled the optical energy received by Detector 2 such that equal vertical amplitude value was maintained without oscilloscope vertical sensitivity adjustment during positional changes. With Detector 1 fixed and Detector 2 moved to alter deviation distance, no statistically significant change in time difference was observed. However, AC distance clearly increased with larger EC. Three datasets were measured. When AE=6 cm, EC changed from 8.2 cm to 4.2 cm (AC change: 2.84 cm). When AE=9.7 cm, EC changed from 10 cm to 4 cm (AC change: 3.44 cm). When AE=20 cm, EC changed from 8 cm to 4 cm (AC change: 1.14 cm). AC was calculated via AC2 = EC2 + AE2. Time difference changes all remained below the 21.9 ps significance threshold.
References
- de Andrade E M P, Faber J, Pinguelli Rosa L. A spontaneous physics philosophy on the concept of ether throughout the history of science: birth, death and revival. Foundations of science 2013, 18, 559–577. [Google Scholar] [CrossRef]
- Spergel D, N. "The dark side of cosmology: Dark matter and dark energy. Science 2015, 347, 1100–1102. [Google Scholar] [CrossRef] [PubMed]
- Huygens, C. Treatise on Light: In which are Explained the Causes of that which Occurs in Reflection, & in Refraction. And Particularly in the Strange Refraction of Iceland Crystal. MacMillan and Company, limited, 1912.
- Shapiro A, E. Huygens’ Traité de la lumière and Newton’s Opticks: Pursuing and eschewing hypotheses. Notes and Records of the Royal Society of London 1989, 43, 223–247. [Google Scholar]
- Schwarz J, H. Introduction to superstring theory. Techniques and Concepts of High-Energy Physics; Dordrecht: Springer Netherlands, 2001; pp. 143–187. [Google Scholar]
- Dassios, G. "Equipartition of energy in elastic wave propagation. Mechanics Research Communications 1979, 6, 45–50. [Google Scholar] [CrossRef]
- Franklin, A. Millikan’s measurement of Planck’s constant. The European Physical Journal H 2013, 38, 573–594. [Google Scholar] [CrossRef]
- Tikhonov A N, Samarskii A A. Equations of mathematical physics. Courier Corporation, 2013.
- Consoli M, Pluchino A. Michelson-Morley Experiments: An Enigma for Physics and the History of Science. World Scientific, 2018.
- Zhang, Z. (2024). The Hypothesis of 'Long String Enwind Forming Particles': Exploring Forces, Black Holes, Dark Matter, Dark Energy, the Accelerating Universe, and Inertia. Preprints. [CrossRef]
Figure 1.
Schematic diagram of Electromagnetic Waves.
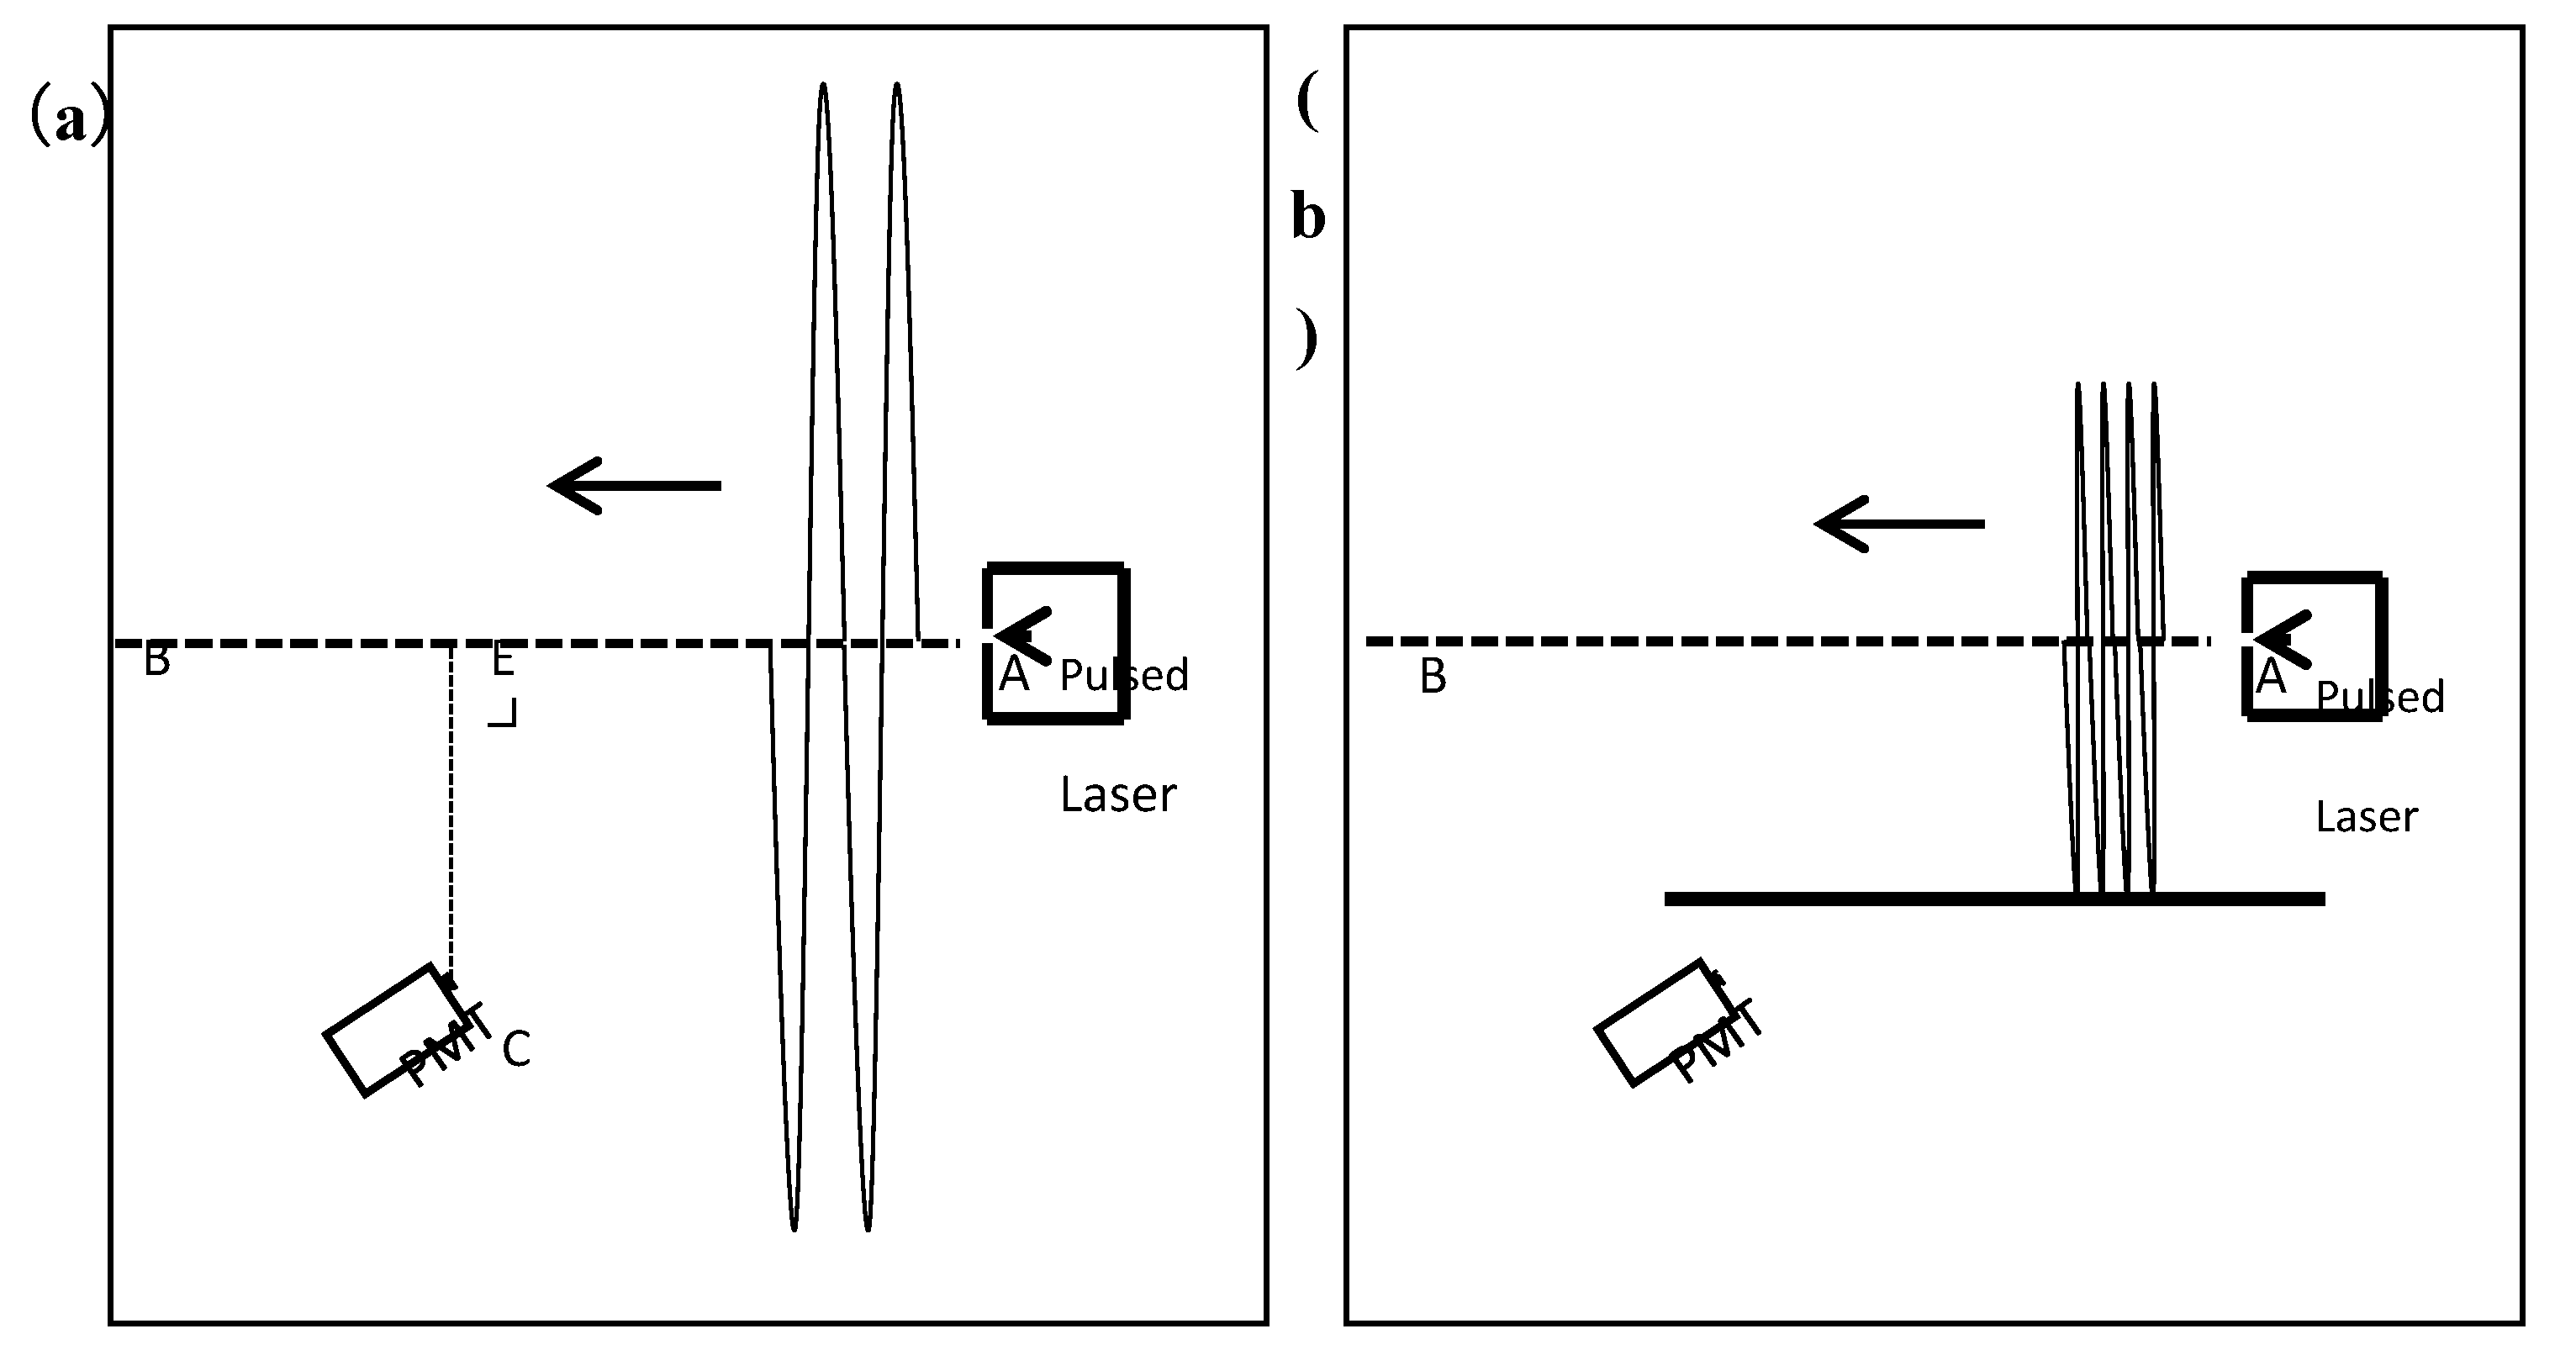
Figure 2.
Experimental procedure.
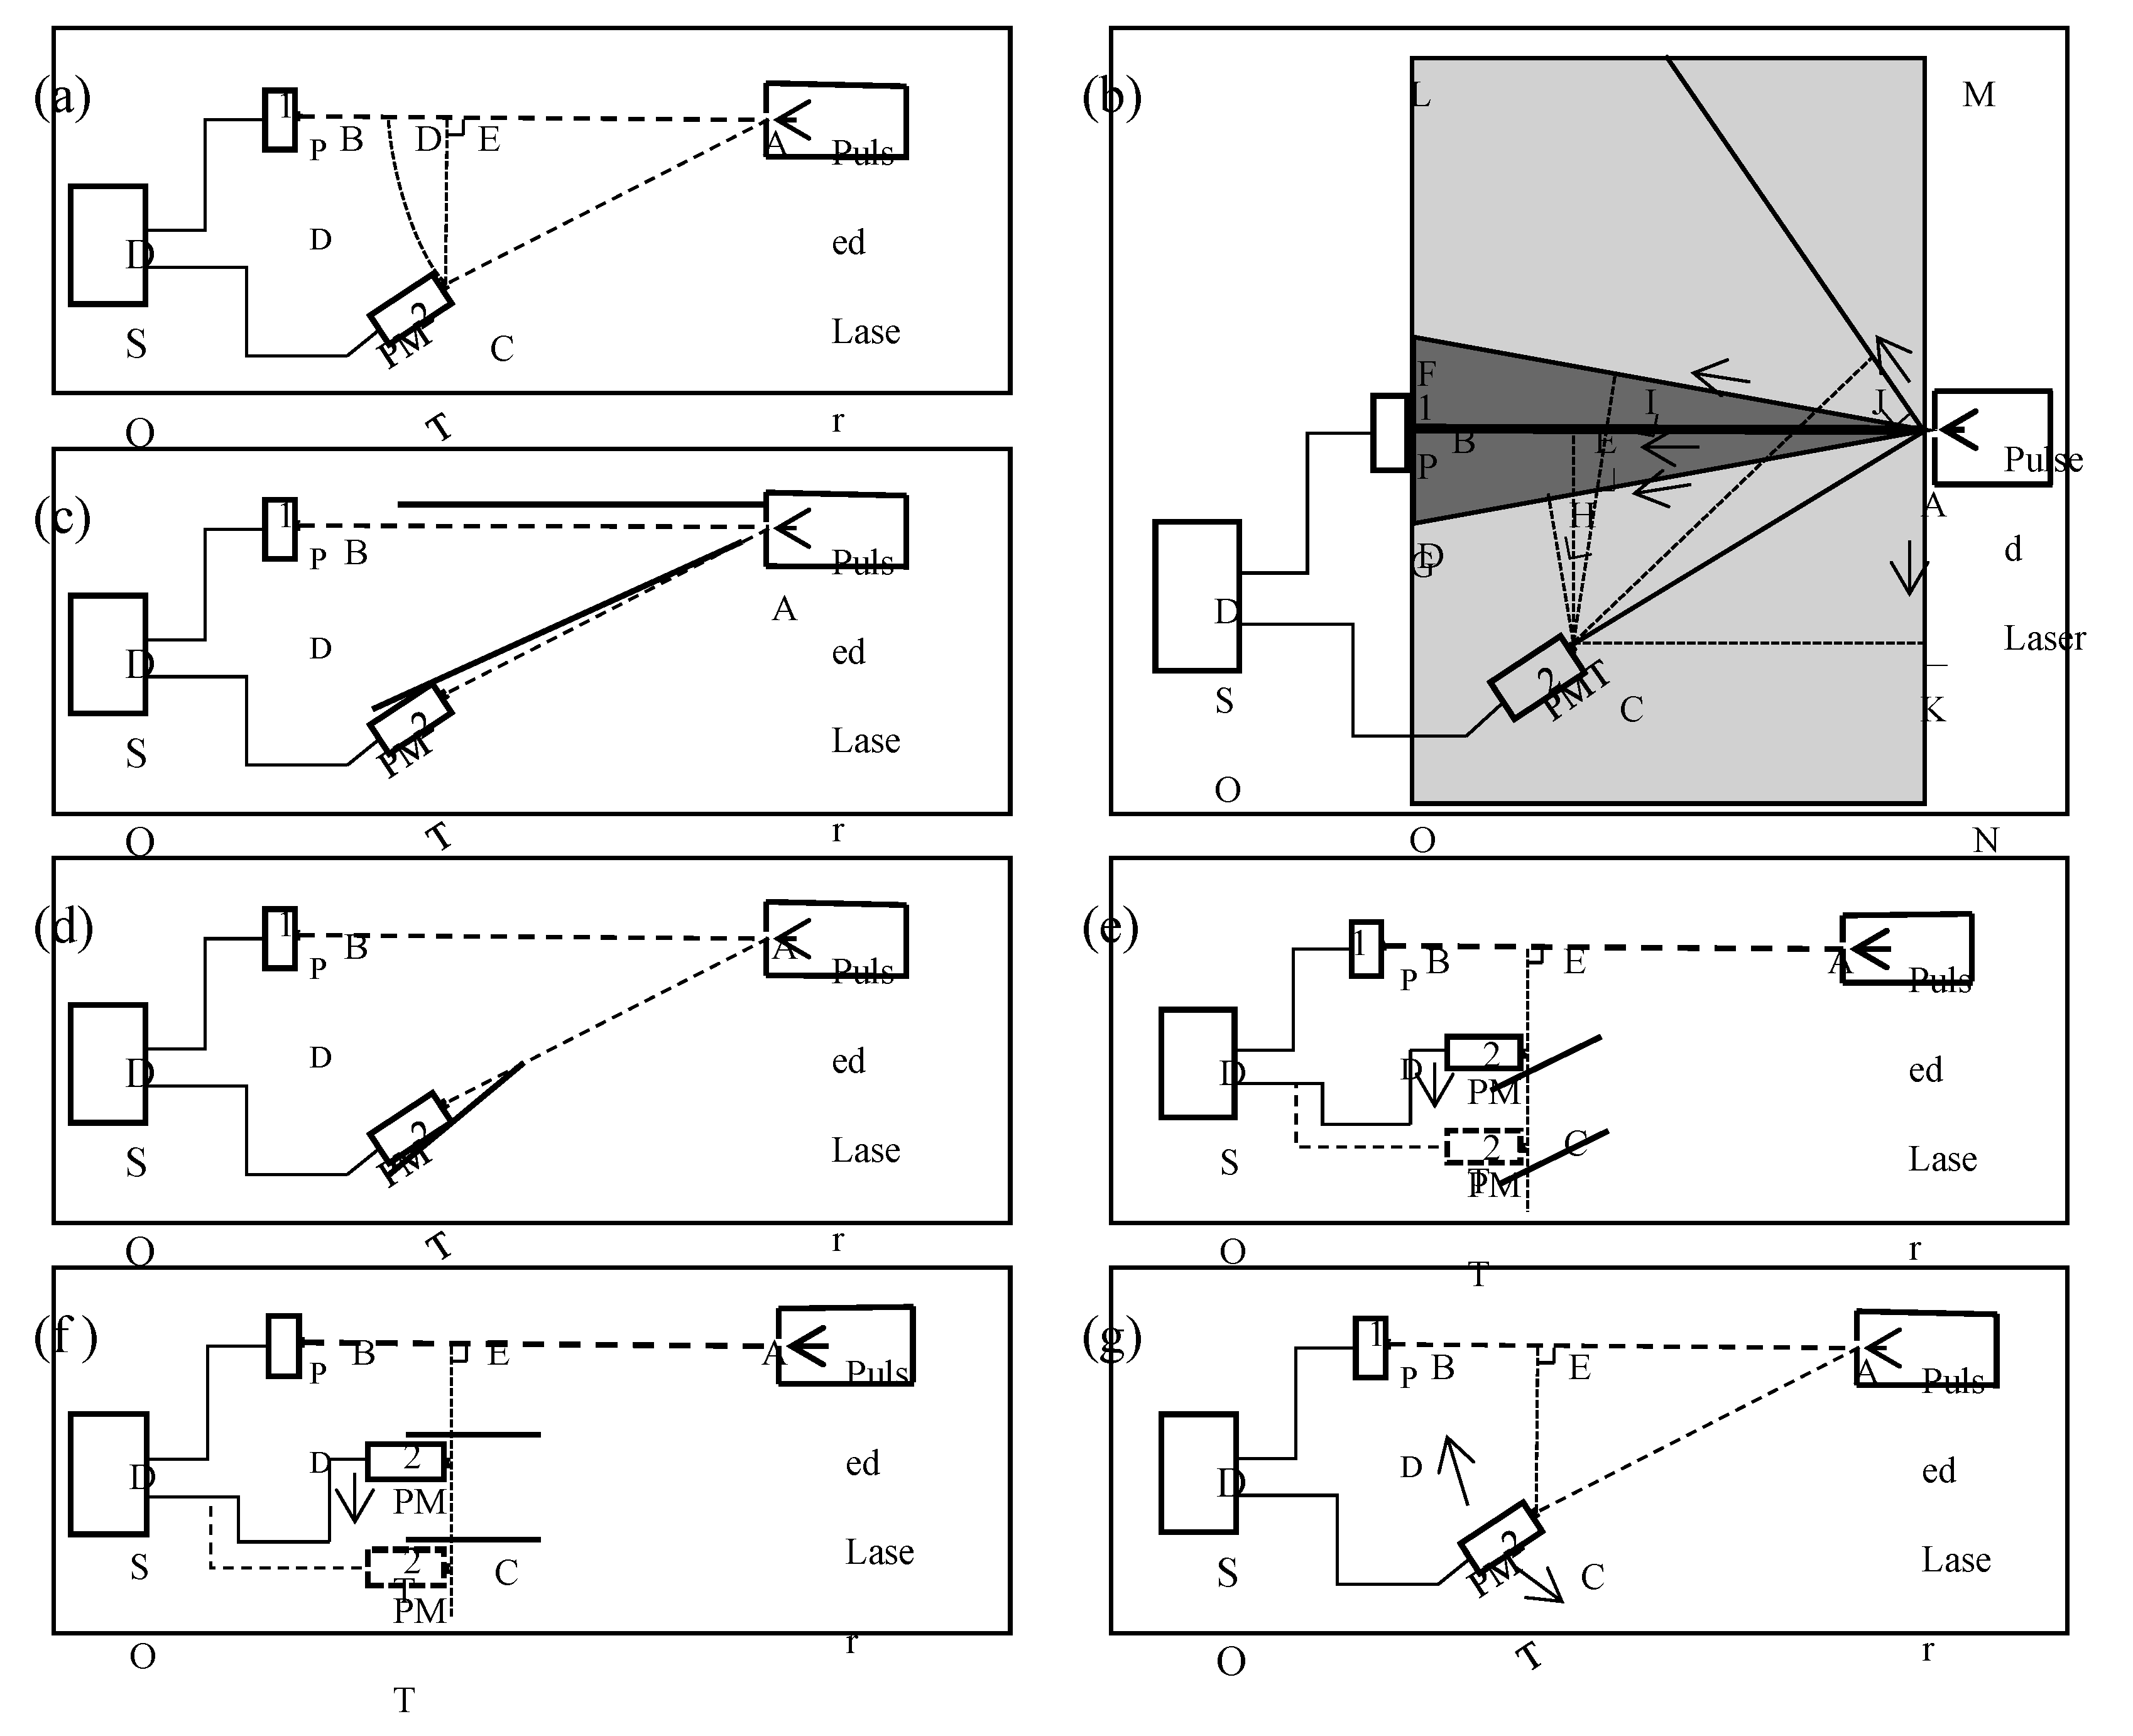
Figure 3.
Experimental results.
Disclaimer/Publisher’s Note: The statements, opinions and data contained in all publications are solely those of the individual author(s) and contributor(s) and not of MDPI and/or the editor(s). MDPI and/or the editor(s) disclaim responsibility for any injury to people or property resulting from any ideas, methods, instructions or products referred to in the content. |
© 2025 by the authors. Licensee MDPI, Basel, Switzerland. This article is an open access article distributed under the terms and conditions of the Creative Commons Attribution (CC BY) license (http://creativecommons.org/licenses/by/4.0/).
Copyright: This open access article is published under a Creative Commons CC BY 4.0 license, which permit the free download, distribution, and reuse, provided that the author and preprint are cited in any reuse.


