Submitted:
26 February 2024
Posted:
26 February 2024
You are already at the latest version
Abstract
The study of the impact of polyQ expansion driven proteotoxicity on cell metabolism has evi-denced NAD molecule as a central player in regulating metabolic response and cell repair in neurodegeneration. The decline in NAD intracellular levels represents a hallmark of ageing aris-ing from a dysregulation between NAD-consuming and biosynthetic enzymatic reactions in which NMNAT plays a key role.
By an integrated bioanalytical and proteomic experimental design, the derangement of NAD metabolism deriving from the accumulation of polyQ-Htt protein has been analysed in Saccha-romices cerevisiae harbouring a 103Q-Htt and compared with wild-type Htt, in absence and in presence of a phenolic extract from EVOO, as a source of antioxidant bioactive compounds. Quantification of NAD and its precursors and proteomic analysis of the differential protein ex-pression has been performed by LC-DAD-MS.
Chronological lifespan and NAD homeostasis was strongly impaired by proteotoxic polyQ-Htt, eliciting a depletion of NAD levels and accumulation of NaMN. In parallel a downregulation of Sirt2 expression levels has been observed. Phenolic extract administration had no meaningful ef-fects on NAD replenishment to prevent proteotoxicity. NaMN can represent a biomarker of accel-erated aging, and/or a signaling molecule for cell repair.
Keywords:
NAD
; NMNAT
; NaMN
; yeast
; ageing
; polyQ prototoxicity
; Huntingtin
; Sirt2
; EVOO
; polyphenols.
1. Introduction
Saccharomyces cerevisiae has long been recognized as a model system for the study of eukaryotic cell metabolism, mechanisms of ageing, as well as lifetime extension [1,2,3]. Despite the multifactorial causes of aging, all eukaryotes present conserved longevity pathways and molecular mechanisms involved in this process. Yeast cells summarize fundamental aspects of eukaryotic biology, that have allowed to identify cellular and environmental mechanisms involved in lifespan [4]. Gene manipulation’s or the environmental factor’s effects on the extension of the chronological lifespan of yeast have proven to be helpful to understand the mechanisms involved in promoting resistance to oxidative stress and other age-related cumulative cell damages, such as protein misfolding. Numerous cellular pathways relevant to neurodegeneration are conserved in yeast. According to several studies in Saccharomyces cerevisiae, ROS (reactive oxygen species) metabolism, ubiquitin-mediated protein degradation, mitochondrial homeostasis, vesicular trafficking, and lipid metabolism play an important role in the toxicity of polyQ (polyglutamine) expansion and protein aggregation. It is well assessed a direct link between aggregation of expanded polyQ domain and its toxicity, which can be associated with several causative factors, including prion Rnq1 that is required for 103Q-Huntingtin (103Q-Htt) toxicity and aggregation [5]. On the other hand, the overexpression of genes associated with the NAD (nicotinamide adenine dinucleotide) salvage pathway, such as nicotinamide/nicotinic acid mononucleotide adenylyl transferase (NMNAT), suppresses the proteotoxicity of 103Q-Htt by eliciting refolding and/or clearance of misfolded proteins without requiring the activation of mitochondrial oxidative phosphorylation, proteasome degradation or autophagy [6]. Furthermore, this mechanism appears to not involve the NAD-dependent histone deacetylase Sir2, which represents a major key regulator of aging in yeast, through deacetylation of the amino-terminal tails of histones H3 and H4, and production of O-acetyl-ADP-ribose and nicotinamide.
NAD intracellular levels are maintained stable by constantly balanced synthesis, catabolism, and recycling processes. However, during ageing, catabolic, and anabolic processes can be deranged, and NAD consumption cannot be effectively counteracted by de novo NAD biosynthesis or nicotinamide/nicotinic acid recycling or salvage [7,8,9]. Nicotinamide/nicotinic acid mononucleotide adenylyl transferase (NMNAT) is a key enzyme in both de novo and salvage pathways for NAD biosynthesis. Furthermore, NMNAT, in synergy with other enzymes of the NAD salvage pathway, can function as a stress chaperone performing holdase and foldase activity at no expense of the NAD intracellular pool [10]. Despite the numerous research works on the impact of NAD de novo and salvage pathways regulation in polyQ toxicity suppression, many aspects remain unclear about the fluctuations of NAD precursors and metabolites in yeast chronological aging, in response to polyQ-induced toxicity. Recently, several studies have highlighted the ability of extra-virgin olive oil (EVOO) polyphenols to delay protein misfolding and amyloid aggregation in age-associated disease and neurodegeneration models [11,12].
Oleuropein and oleuropein aglycone, a metabolic product deriving from the action of endogenous β-glucosidases on oleuropein, have been reported to inactivate toxic amyloid oligomers [13].
In the present study, we have evaluated NAD metabolism alterations during the stationary phase or chronological aging of budding yeast S. cerevisiae under expression of the huntingtin protein characterized by polyQ expansion, and possible protection by extra-virgin olive oil phenolics extract. We have focused our investigation on two timeframes of the chronological lifespan: the young phase and the adult pre-late phase, to identify potential early markers of neurodegenerative aging and possible target pathways for pro-healthy aging intervention.
Together with NAD we have quantified nicotinamide mononucleotide (NMN), nicotinate mononucleotide (NaMN), nicotinic acid (Na), and nicotinamide (Nam), which represent the most relevant precursors in the biosynthetic routes leading to NAD.
In addition, the proteome response to the polyQ proteotoxicity and EVOO polyphenols mitigating action has been explored during the progression of yeast aging phases.
2. Results
2.1. Quantification of Phenolic Content of Raggia EVOO
The total polyphenol content of the methanol extracts was evaluated colorimetrically using the Folin-Ciocalteau reagent. A diluted extract or phenolic standard was mixed with Folin-Ciocalteau reagent and aqueous Na2CO3 and the total polyphenols were determined colorimetrically at 765 nm. Gallic acid standard solutions were used to calibrate the method, as described in Materials and Methods. The phenolic content of Raggia EVOO has been estimated as the mean of in triplicate determination equal to 905 ± 219 mg/Kg equivalents of gallic acid. According to this result, the amount of phenolic extract to be added to the culture medium to reach a final concentration of 10 mg/mL has been estimated.
2.2. Raggia EVOO Polar Phenolic Substances
The obtained and reported results by Pacetti et al., 2020 [14] have been considered for the choice of Raggia cultivar EVOO as the best oil sample, given the high content of phenolic compounds. According to the cited study, the Raggia resulted as the cultivar with the highest total polar phenolic compounds content with a total concentration average of 663.8 mg kg-1, consistent with the total phenolic content reported in paragraph 2.1.
2.3. Chronological Aging of Yeast Cells: Effect of 103Q-Huntingtin Expression and Phenolic Extract from EVOO
Chronological lifespan, measured with the time of survival in the stationary phase, is considered a model for studying the long-term maintenance of nondividing cells and cellular aging [1]. The effects of 103Q-Huntingtin mutant protein on yeast chronological ageing can be informative about the events leading to neuronal cell dysfunction with age. In Figure 1-A the time dependence of the logarithm of colony-forming units is reported for the yeast strain containing the vector where the first 17 aminoacids of Huntingtin protein are fused with GFP tag (namely GFP ctrl) and the yeast strain containing the vector where the first 17 aminoacids of Huntingtin protein plus 103 glutamine residues are fused with GFP tag (namely 103Q ctrl). It is possible to observe that the expression of 103Q-Htt causes a decrease in cell survival during chronological aging in the yeast cells. The yeast cell viability as a function of age is modeled by a sigmoidal Boltzmann function (as described in the Materials and Methods section) with best-fit parameters reported in Table 1 for all the monitored strains. Compared to the wild-type yeast cells (GFP ctrl), the presence of the 103Q-Htt protein causes a strong effect on the decrease in cell survival during aging, and on the velocity of decrease, as represented by the observed more than threefold values of ΔCV and the slope parameters. The presence of the phenolic extract from EVOO appears to attenuate the effect of the toxic 103Q-Htt by slightly reducing all the measured aging parameters. The described behavior can be observed in the plots of Figure 1 panel A, and Figure 2. In Figure 1-B and C, the fluorescence microscopy images clearly show the presence of bright flashes produced by aggregation of 103Q-Htt.
2.4. NAD Metabolism Alterations Analysis
Quantification of NAD-related metabolites was obtained by previous separation of the analyte molecules by HPLC and comparison with the relative calibration curves, as reported in Materials and Methods.
Data, expressed as nanomoles of metabolite in 1 mg of yeast cells pellet (nmoles/mg), were determined as the average of three measurements and grouped in the young phase (until day 7 after re-inoculation) and adult phase (from day 9 to day 15 after re-inoculation). Furthermore, data have been expressed as the relative percentage of each analyte in the whole nucleotide pool. In Figure 3 the levels of nicotinamide adenine dinucleotide (NAD), nicotinic acid (NA), nicotinamide (Nam), nicotinic acid mononucleotide (NaMN), and nicotinamide mononucleotide (NMN) are plotted both as nmoles/mg of cells pellet (wet weight) and relative percentage (%), sub-grouped in the young phase and adult phase, in yeast strains harbouring only GFP or 103Q-Htt, both as control and with the addition of polyphenolic extract from Raggia EVOO in the growth medium.
2.4.1. Impact of polyq-Htt on NAD Homeostasis
As already reported by several authors the intracellular levels of NAD decline with aging in yeast as well as in other organisms. The results reported in Figure 3-A indicate a similar trend between the young and adult phase, even though not statistically significant, for all the yeast cells under study. On the other hand, when data are expressed in terms of relative nanomolar fraction calculated as the percentage of the nanomolar content with respect to the entire pool of the analysed metabolites, the observed trend becomes more descriptive and informative about the NAD metabolic status in the different groups of yeast cells. In fact, we can observe that the fraction (as a relative percentage) of NAD is significantly different between the GFP ctrl strain and the 103Q ctrl strain both in the young and in the adult phase, while there are no significant differences between the young and adult phases. The presence of the neurotoxic polyQ-Htt appears to determine an unbalance of the NAD biosynthesis/consumption mechanisms resulting in a lower relative fraction of NAD with respect to its precursors metabolites.
NAD biosynthesis can start from nicotinic acid (NA), one of the salvage pathways precursors; in Figure 3-C and 3-D the values of NA are reported, and their relative values are highly significantly lower in the 103Q control strain with respect to the GFP control one, both in the young and in the adult phase. Nicotinamide (Nam) is another salvage pathways precursor, that from our determinations resulted to be very low in all samples, and its determination is affected by very high standard deviations which did not allow a precise determination. We can hypothesize that either Nam is rapidly converted into NMN or converted to NA by a nicotinamidase [15]. Even though Nam fractional levels seem to be higher in the 103Q strain (Figure 3-E and 3-F), there is no significant difference with respect to the other yeast cells groups. On the contrary, nicotinic acid mononucleotide (NaMN) levels resulted to be a benchmark of 103Q cells, with relative fractional levels (%) higher than the ones in GFP strains, at both young and adult age phase (in Figure 3-G and 3-H). The results reported in Figure 3-H display a situation in which NaMN represents the most abundant NAD related metabolite in yeast cells reaching a relative abundance near 80%, compared to the ~40% in GFP strain. The situation is completely different with NMN, as can be observed by the significantly lower relative fractional values in 103Q strains with respect to the GFP strains displayed in Figure 3-I and 3-L. NMN can be directly converted into NAD by the enzyme nicotinamide mononucleotide (NMN) adenylyltransferase (EC 2.7.7.1) which catalyzes the transfer of the adenylyl moiety of ATP to NMN to form NAD. Considering that NMNAT has dual specificity for NMN and NaMN in the adenylation to NAD, the homeostasis of NAD in the 103Q strain seems to mainly depend on the relative ratio between NMN and NaMN intracellular levels, and on the activity of the enzyme NAD synthetase which amidates NaAD to generate NAD [16].
2.4.2. Impact of Phenolic Extract from EVOO on NAD Metabolism on Polyq-Htt Proteotoxicity
The results of NAD metabolism reported in Figure 3 do not allow to infer a relevant beneficial effect of phenolic extract from Raggia EVOO on the levels of NAD and its precursors in the 103Q yeast strain. In general, the presence of the phenolic extract did not entail a significant difference in the levels of NAD and its metabolites in both the yeast strains groups GFP and 103Q; it is only possible to observe a slight increase in the levels of NMN and nicotinic acid in the 103Q strain + polyphenolic extract when expressed in nmoles/mg of cells (wet weight). Nevertheless, these results are both not statistically significant and not supported by an equivalent effect of the polyphenolic extract on the relative distribution of NAD and its precursor metabolites in the yeast cell groups.
2.4. Proteomic Analysis
The proteomic profile has been investigated in a yeast model of neurodegeneration that expresses a 103Q domain of the huntingtin protein (103Q) where the polyglutamine residues (polyQ) in huntingtin give rise to a neurotoxic protein that tends to aggregate. This model was compared to a control yeast (GFP) and both were treated with appropriately selected quantities of an olive oil polyphenol extract obtained from a monovarietal oil from the cultivar Raggia as described in the Materials and Methods section.
First, the total protein content was determined in each cell lysate and the result is shown in Figure 4.
As shown in Figure 4, no significant difference was observed between the total protein content of control GFP in the young and adult stages while a significative increment was observed in the young-phase GFP cells after the administration of the polyphenol extracts (GFP vs GFP+PPh, p<0.01). Another difference was found between the young-phase and adult phase GFP with polyphenols where in the latter the total protein content is significantly lower.
On the contrary, the total protein content in the 103Q yeast cells (expressing huntingtin) both in young or adult-late phases, with or without the addition of polyphenols did not show any significative differences. The young-phase GFP and 103Q yeast cells, showed a similar total protein content whereas considering the adult phase there is a slight increment of protein amount in the 103Q cell compared to the GFP, although this difference is not statistically significant.
The results obtained seem to indicate that the addition of polyphenols in the culture medium causes an increase in total proteins only in in young phase of GFP controls. However, the same effect does not occur in the case of 103Q yeast cells where the total protein content was not affected by polyphenols addition. The protein expression profile of the healthy GFP and 103Q yeast cells withdrawn in the young and adult late phases, treated or not with polyphenols, was examined by 2-DE in the pH range 3-10, and the electrophoretic maps are shown in Figure 5-A (GFP yeast cells) and 5-B (103Q yeast cells).
By mass spectrometry analysis it was possible to identify spot A as the NAD-dependent histone deacetylase, Sirt2 (Species: Saccharomyces cerevisiae; Score: 19, Sequence: TIPHMKYAVSK), the spot K as the YOR012W isoform 1 (Species: Saccharomyces cerevisiae; Score: 6, Sequence: FFHIPITEKVSR) which is a protein that belongs to the acetyltransferase (GNAT) family protein, and the spots M and R as a putative uncharacterized protein YBR126W-B (Species: Saccharomyces cerevisiae; Score: 21, Sequence: MQVYCNVLCRCGRGADVL).
In Figure 6 (Heatmap), the protein expression level of GFP yeast cells Figure 6-A) and 103Q cells (Figure 6-B) is compared according to the age (young and adult phase) and the treatment with polyphenolic extract.
The heatmap indicated that in the GFP yeast cells spot A, identified as the NAD-dependent histone deacetylase Sirt2, had the same expression pattern in the young and adult phase and that its expression increased in the young phase GFP cells that have been supplemented with the polyphenol extract in the culture medium. However, when the GFP cells reached the adult phase, the effect of the polyphenol supplementation was less evident. In the 103Q cells, the expression pattern of the NAD-dependent histone deacetylase did not show remarkable differences related to age or polyphenol supplementation. Spot A1, A2, A3, and A4 showed the same molecular weight of spot A (30 kDa,) but different pI (A, 5.7; A1, 5.9; A2, 5.5; A3, 5.2; A4, 5.1) calculated by the PDQuest software (see also Figure 5, 2DE map). Since from the literature, it is known that about 60 sirtuin isoforms have been characterized in different organisms [17], the spots A1, A2, A3, and A4 are likely to be isoforms of the NAD-dependent histone deacetylase
Spot K, a protein that belongs to the acetyltransferase (GNAT) family protein, showed a low expression pattern in the GFP cells independently from age, however, its expression increased when GFP cells were supplemented with polyphenols in the culture medium (Figure 6). The same occurred in the 103Q cells.
3. Discussion
In this study, an S. cerevisiae model of human polyQ-proteinopathy has been used to evaluate the impact of a neurotoxic protein such as 103Q-Htt on the NAD metabolic response, and the protein expression profile by proteomic mapping. In addition, we wanted to verify the potential effect of a polyphenolic extract from a specific cultivar of EVOO, characterized in terms of phenolic composition (Raggia cultivar), on the metabolic and proteomic response. NAD and its precursors metabolites pool balance was strongly deranged by the presence of the polyQ-Htt determining a substantial increase in the levels of NaNM, at the expense of NMN and eventually NAD.
NaMN can be generated by the transfer of the phosphoribosyl moiety of phosphoribosylpyrophosphate to NA by the nicotinic acid phosphoribosyltransferase. Then, NaMN is adenylated by nicotinic acid/nicotinamide mononucleotide adenyltransferases (NMNAT) producing nicotinic acid adenine dinucleotide (NaAD), which is amidated by the glutamine-dependent NAD synthetase, generating NAD. The high levels of NaMN relative to the entire pool of metabolites that we have observed in the 103Q strain groups can be considered as indicators of an impairment in the adenylyl transferase catalytic efficiency of the yeast NMNAT homologues, in response to the proteotoxic effect of polyQ-Htt [6], have reported that overexpression of NMNAT can protect against polyQ-proteotoxicity without an essential role of NAD levels but rather exerting protein misfolding clearance by chaperone-like function. In the present work, we have not induced NMNAT overexpression, while instead we have attempted to obtain a snapshot of the events triggered by the proteotoxic 103Q-Htt just before and after the switching time V50(~ 10th-12th day, as shown in Table 1) in the chronological lifespan timeframe. At the proteome level, we could observe downregulation of Sirt2 expression in the 103Q control groups with respect to the GFP control strains, representing “normal aging”. The NAD-consuming yeast histone deacetylation pathway, driven by glucose restriction during chronological aging [16], appears to be impaired in the presence of proteotoxic polyQ-Htt. Based on this observation we can assess that the proteotoxic effects of polyQ-Htt manifests as lower fractional levels of NMN and NAD, higher levels of NaMN, and downregulation of NAD-dependent sirtuins machinery. By NMNAT enzymatic activity determination at day 0 of chronological lifespan by using both NMN and NaMN substrates (preliminary data not shown), we could observe a higher amount of the enzyme in the 103Q (0.041 ±0.039 EU/mg) with respect to the GFP control group (0.016 ±0.009 EU/mg); the fact that NAD levels are kept low despite the presence of an active form of NMNAT supports the hypothesis of an alternative chaperone-like role of the enzyme essential for protein misfolding and proteotoxicity suppression [10]. Considering the prominent role of NAD in cell metabolism and mitochondrial activity, maintaining low NAD levels as a response to misfolding-driven cellular stress appears as a biochemical solution to slow down the metabolic flux, and instead fostering cellular protection mechanisms through the clearance of proteotoxic protein species [18].
The administration of the polyphenolic extract at the concentration of 10 mg/ml in the culture medium did not result in a strong effect on the cell viability during the chronological lifespan, even though a mild delay of the aging parameters has been observed (Table I). From the NAD metabolism point of view, there were no meaningful differences in the 103Q strains which could be ascribed to a NAD biosynthesis enhancement. An effective healthy aging action from EVOO polyphenols could have been prevented by the lack of an efficient encapsulation system which could have improved cellular uptake. The chemical nature of the phenolic extract components could explain their easy solubilization in the culture medium, but at the same time, their polarity could make difficult the passage through the cell membrane.
4. Materials and Methods
4.1. Chemicals
All reagents and solvents were analytical and HPLC grade. NaMN, NMN, nicotinate adenine dinucleotide (NaAD), NAD, Na, Nam, benzamide, ammonium acetate, HPLC-grade methanol and SUPELCO Discovery® C18 HPLC Column (250 mm × 4.6 mm ID, 5 μm), equipped with Discovery® C18 Supelguard™ Guard Cartridge, were purchased from Sigma-Aldrich (St. Louis, MO, USA). Ultra-pure water was prepared using a Milli-Q water system equipped with a 0.22 μm point-of-use membrane filter cartridge (Millipore-Waters, Milford, MA, USA). Minisart® RC4 Syringe Filters 0.2 μm were purchased from Sartorius Stedim Biotech (Goettingen, Germany).
4.2 Yeast Strains and Culture Conditions
The S. cerevisiae strains INVSc1 (Invitrogen), were transformed to express the mutant huntingtin protein 103Q, by using pYES2/103Q plasmid and pYES2.1-GFP as previously reported by Solans et al. 2006 [19]. Briefly, exon1 sequences containing the first 17 amino acids of huntingtin protein followed or not by 103 glutamines, were fused in frame with a GFP tag at the COOH terminus of each construct, and a FLAG tag was attached to their NH2 termini (resulting in103Q or GFP). Such constructs were subcloned into the pYES2 vector (Invitrogen), for the expression of the resulting proteins under control of the Gal1 promoter.
Yeast cells were cultured in a Synthetic Complete Medium (SC medium) with 2% glucose at 30 °C; after O.N. growth, the cultured cells were centrifuged, and the pellet was washed with sterile water for five times and inoculated in SC minimal medium with 2% galactose for induction of the 103Q and GFP gene expression. The absorbance (OD600) was monitored until the stationary phase was reached, and the culture was diluted in 50 mL falcons paying attention that does not exceed more than 20% of the total volume of the flask, for optimal growth and aeration, and maintained in a shaking incubator at 30°. The cultured cells were divided into an equal number of flasks for GFP and 103Q, half of them were added EVOO polyphenolic extract at the concentration of 10 mg/ml and observed in their stationary phase. From each culture, 1 mL aliquots were collected and stored at -80 °C for further investigation.
4.3 Fluorescence Microscopy
Nikon inverted fluorescence microscope (Diaphot-TMD) with Apoplan 603 objective was used to see the emitted light from GFP for monitoring the presence of the recombinant GFP and 103Q-GFP proteins in transformed yeast cells.
4.4 Polyphenols Extraction
The yield of the extraction depends on polyphenolic characteristics the process involves the use of solvents such as methanol often mixed with water in relation to the molecular weight of the polyphenols that we need to extract.
The extraction method has been adapted according to the method used for the polar phenol extraction reported by Caprioli et al. 2019 [20]. We used a local extra virgin olive oil from Raggia cultivar following the following protocol based on liquid-liquid extraction: 5 g of EVOO were added to 5 ml of hexane in a separatory funnel, then four extraction steps with MeOH/H2O mixture at a ratio of 60:40 were performed; 10 ml of hexane were added to the methanolic extract solution; the methanolic phase was collected in a flask and evaporated under nitrogen; the methanolic solution was recovered and evaporated to dryness with Rotavapor at 30°; the dried extract was then dissolved in 1.5 ml of EtOH/H2O at a ratio of 80:20. The extract was diluted in MeOH/ H2O at a ratio of 1:10 for colorimetric analysis.
4.5 Extract Colorimetric Determination
A portion (e.g. 750 ml) of 5 ml of the hydro-alcoholic extract was added to 250 µl of Folin-Ciocâlteu reagent, 250 µl of 7.5% solution of Na2CO3 in a 5 ml tube reaching the final volume with purified water. The reaction forms a blue chromophore constituted by a phosphotungstic-phosphomolybdenum complex, where the maximum absorption of the chromophores depends on the alkaline solution and the phenolic compound concentration [21]. For the calibration curve four solutions with a gallic acid concentration of 0.007 mg/ml, 0.175 mg/ml, 0.350 mg/ml, and 0.700 mg/ml respectively, were prepared in 5 ml tubes adding: 100 µl of gallic acid, 600 µl of methanol, 250 µl of Folin-Ciocâlteu reagent, 250 µl of 7.5% solution of Na2CO3. A final volume of 5 ml was reached by adding ultrapure water. Two blank solutions were prepared by substitution of the extract with EtOH: H2O 80:20. After four hours, the spectrophotometric analysis was performed by measuring the absorbance at 765 nm.
The polyphenolic concentration was measured using the equation derived by the calibration curve obtained with gallic acid.
4.6. Raggia Cultivar Phenolic Compounds Analysis by HPLC-DAD-MS.
The procedure starts with 0.5 g of oil dissolved in 0.5 mL of hexane. A volume of 20 µL of the internal standard (IS), (20 µL of 100 mg L−1 syringic acid in methanol) was added and extracted with 4 × 0.5 mL of methanol: water (60:40, v/v). The solutions obtained were collected. Before the analysis, the collected solutions were washed with 1 mL of hexane (to remove acylglycerols left), evaporated to dryness, and reconstituted with 0.25 mL of methanol. Analyses were performed following the method described by Ricciutelli et al., 2016 [22], using an HPLC Agilent 1100 (Santa Clara, CA, USA) equipped with a diode–array detector (DAD), and a mass spectrometer detector (ion trap G2445D SL) equipped with an electrospray ionization (ESI). A Synergi Polar reverse phase (250 × 4.6 mm, 4 m) analytical column from Phenomenex (Chesire, UK) was used with a mobile phase composed of water (A) and methanol/IPA 90:10 v/v (B), both containing 0.1% formic acid and injecting 10 µL of sample extract solution. A gradient mode has been chosen. The flow rate has been set at 1 mL min−1. The gradient used was: 0 min, 30% B, 0–40 min, 60% B, 40–50 min 95% B. In HPLC-ESI–MS, a negative ionization (NI) mode has been used for the ion source and a full scan mode for the mass analyzer (range m/z 70–1100). The calibration curve of tyrosol has been used to quantify secoiridoid derivatives. Acetoxypinoresinol was quantified with the calibration curve of pinoresinol, while all the other phenolics were quantified each with their proper calibration curve, as reported in [20].
4.6 Nucleotide Extraction and Quantification
Metabolites were extracted from frozen yeast cells aliquots according to Gonzalez et al., 1997 [23], based on a 75% ethanol (volume/final volume) buffered with 70 mM Hepes, pH 7.5 boiling solution. For each mg of pellet 30 µl of 25 µM Benzamide were added as Internal Standard.
After the extraction step, yeast lysed cells were centrifuged at 15000 xg for 5 minutes, supernatant was dried by Speedvac and stored it at -80 °C until use. Before RP-HPLC analysis, samples were resuspended in 300 µl of ammonium acetate 5mM pH 3.
Separation and quantification of endogenous NAD-related nucleotides were carried out using an Agilent 1100 combined with a DAD detector. The column was a SUPELCO Discovery® C18 HPLC Column (25 cm × 4.6 mm, 5μm particle size) equipped with Discovery® C18 Supelguard™ Guard Cartridge at 15°C. The mobile phase was composed of 5 mM ammonium acetate pH 3 (solvent A) and methanol containing 5 mM ammonium acetate pH 3 (solvent B). The conditions used for separation started with 100% of solvent A for 7 minutes at a flow rate of 0.8 ml/min. The gradient volume of solvent B was 0-100% at 7-25 min, 100% at 25-30 min, and 100-0% at 30-35 min. The signal detection was through a Diode Array Detector (DAD) and the chromatograms were recorded at a wavelength of 254 nm.
4.7 Two-Dimensional Electrophoresis (2-DE)
Before performing 2-DE, cell cultures from each sample (GFP, 103Q, GFP+PPh, 103Q+PPh) were withdrawn in the young phase (5,6,7 days after re-inoculum), and in the adult late phase (15, 16, 17 days after re-inoculum). Cells were centrifuged at 13000 rpm with a microfuge (Heraeus Biofuge Pico Centrifuge), and each cell pellet was resuspended in 500 µL lysis buffer (8M urea, thiourea, triton X-100, 1% SDS, pH 7.6) and sonicated for 1 min three times with 1 min pauses in ice. After sonication, samples were centrifuged at 13000 rpm for 15 min with the microfuge. On the supernatants, the total protein content was determined by Bradford’s method, 1976 [24].
Before being loaded into the 2-DE, 300 µg of the samples were separately treated with the 2DClean-Up Kit (GE-Healthcare Life Sciences, Uppsala, Sweden) to remove interfering contaminants and improve the electrophoretic run. Each resulting pellet was dissolved in a 350 µl rehydration solution containing: 8 M urea; 2% (w/v) 3-[(3-Cholamidopropyl) dimethylammonium]-1-propanesulfonate (CHAPS); 65 mM dithiothreitol (0.007g DTT); 0.001% (w/v) bromophenol blue; 0.5% (v/v) IPG buffer, pH range 3–11. 2DE has been carried out as previously described [9]: the 1st dimension (isoelectrofocusing) has performed using a pre-cast immobilized pH gradient gel strip (Immobiline DryStrip, IPGstrip, length 18 cm, pH range of 3–11) using an IPGphor isoelectric focusing cell, GE-Healthcare); the 2nd dimension consisted of a 13% SDS-PAGE, carried out by a Protean II apparatus (Bio-Rad, Hercules, CA, USA). The gels (180 x 200 x 1.5 mm) were run at 30 mA per gel for 6-7 hours and after the electrophoresis were silver stained. In this procedure, the gels were firstly incubated in a fixing solution (40% ethanol, 10% acetic acid, 50% H2O) for 1 hour, subsequently were washed in ultrapure water for 30 min, and treated with 0.02% sodium thiosulfate for 1 min. The gel was rinsed three times in ultrapure water and then incubated in a 0.1% silver nitrate solution containing 35% formaldehyde for 20 min at 4°C. After staining the gel was rinsed again in ultrapure water and the development was performed by incubation the gel in 3% sodium carbonate containing 35% formaldehyde. The reaction was stopped by washing the gel in ultrapure water and subsequently in 5% acetic acid for 5 min. Before MS analysis the gel was extensively washed in ultrapure water to ensure complete removal of acetic acid. After silver staining, the gels were scanned at 600 dpi and analyzed using PDQuest software (Version 7.1.1; Bio-Rad Laboratories), and the isoelectric point (pI), the molecular mass, and the normalized quantity of each spot in the gel was determined.
The pIs values were calculated using a linear 3-10 distribution, whereas molecular mass determinations were based on the markers Bio-Rad low range (phosphorylase-b, 97.4 kDa; bovine serum albumin, 66.2 kDa; ovalbumin 45.0 kDa; carbonic anhydrase, 31.0 kDa; soybean trypsin inhibitor, 21.5 kDa; lysozyme, 14.4 kDa).
4.8 Mass Spectrometry for Proteomic Analysis
The spots of interest were excised from the 2-DE gels and extracted according to a procedure described by Shevchenko and co-workers, 2006 [25]. The tryptic peptides coming from the in-gel digestion process were resuspended in 100 µL of 0.1% (v/v) trifluoroacetic acid, incubated for 2-5 min in a sonication bath, and centrifuged for 15 min at 10000 rpm (on a microfuge). 80 µl of each sample was subjected to a reversed-phase chromatography (RP-HPLC), using a C18 Gemini-NX column (5𝜇m particle size, 110 Å pore size, 250x4.6 mm, Phenomenex, Torrance, CA) connected to an HPLC Agilent Technologies 1100 Series (Agilent Technologies, Santa Clara, CA). The flow rate was 1 mL/min and the 45 min linear gradient was from 90:10% A:B to 10:90% A:B (A: water 0.1% formic acid; B: Acetonitrile 0.1% formic acid; temperature column 40°C). The column eluate was subsequently analyzed by mass spectrometry using an electrospray ion trap mass spectrometer (Agilent Technologies LC/MSD Trap SL) operating in positive ion mode over the mass range 300-2200 amu (atomic mass units). MS spray voltage was 3.5 kV, and the capillary temperature was maintained at 300°C and the MS spray voltage was 3.5 kV. The resulting MS spectra were analyzed by the MASCOT software (www.matrixscience.com). The search parameters were the following: database, SwissProt; taxonomy, Saccharomyces cerevisiae; enzyme, trypsin; peptide tolerance, 1.2 Da; MS/MS tolerance, 0.6 Da and allowance of one missed cleavage.
4.9 Statistical Analysis and Data Fitting Modeling
The significance of differences was evaluated by one-way analysis of variance (ANOVA) followed by Turkey’s post hoc test for multiple comparisons, by the GraphPad Prism8 software (adjusted p-value < 0.05). For chronological aging data, the Boltzmann sigmoidal nonlinear regression model in the GraphPad Prism8 software was used and adapted to time as an independent variable:
In which A is the cell viability at the stationary phase, B is the cell viability at the end of the monitoring time, V50 is the halfway time between A and B, and the slope is the steepness of the curve describing the rate of cell viability decrease upon aging. We can report the (A-B) difference as the ΔCV (Delta cell viability).
5. Conclusions
The complex NAD biosynthetic network represents an example of an efficient and flexible system to cope with the multifunctional role of this molecule, from cofactor in cellular bioenergetics and metabolism to key regulator of vital biological processes like epigenetic modifications, cell damage, and aging [26]. The plasticity of this biosynthetic network relies on the de novo and salvage alternative pathways, that can efficiently supply precursor metabolites in case of excessive consumption of NAD and avoid metabolic arrest and cell death [27]. NAD-consuming enzymes including sirtuins, NADases (like CD38), and poly-ADP-ribose polymerases (PARPs) are strongly involved in physiological aging and cellular stress repair [28]. When the cellular stress rises above physiological levels the response in NAD biosynthesis could be inefficient to keep a well-regulated balance between anabolic and catabolic processes. Understanding the nodal points of this regulation would be pivotal to designing protective strategies against accelerated aging and neurodegeneration, conditions associated with an age-dependent decline of NAD levels.
The results obtained in this work have underlined the accumulation of NaMN as a possible marker of accelerated aging due to proteotoxicity, representing a possible signal for cell repair and metabolic flux arrest, typical of low NAD levels as in senescence [29,30,31], to allow NMNAT and other proteins to exert chaperone function and induce autophagy [8,18,32,33].
Author Contributions
Conceptualization, S.P., S.V., V.P., D.F.; Methodology, S.P., S.V., D.F., M.R., V.P.; Software, Y.R., S.V., M.R., S.P.; Formal Analysis, Y.R., D.M., M.R.; Data Curation, S.V., M.R., S.P., S.R., D.F.; Writing – Original Draft Preparation, S.P., S.V., S.R., Writing – Review & Editing, S.R., S.P.; Supervision, S.P., S.V.; Funding Acquisition: D.F. All authors have read and agreed to the published version of the manuscript.
Funding
The University of Camerino (Fondo di Ateneo per la Ricerca 2014–2015) financially supported this work.
Acknowledgments
The authors are grateful to Patrizia Ballarini for fluorescence microscopy imaging assistance.
Conflicts of Interest
The authors declare no conflict of interest.
References
- Piper, P.W. Long-Lived Yeast as a Model for Ageing Research. Yeast 2006, 23, 215–226. [Google Scholar] [CrossRef]
- Pereira, C.; Bessa, C.; Soares, J.; Leo, M.; Saraiva, L. Contribution of Yeast Models to Neurodegeneration Research. J Biomed Biotechnol 2012, 2012, 1–12. [Google Scholar] [CrossRef]
- Hofer, S.; Kainz, K.; Zimmermann, A.; Bauer, M.A.; Pendl, T.; Poglitsch, M.; Madeo, F.; Carmona-Gutierrez, D. Studying Huntington’s Disease in Yeast: From Mechanisms to Pharmacological Approaches. Front Mol Neurosci 2018, 11, 1–20. [Google Scholar] [CrossRef]
- Sampaio-Marques, B.; Burhans, W.C.; Ludovico, P. Yeast at the Forefront of Research on Ageing and Age-Related Diseases. In Progress in Molecular and Subcellular Biology; Springer Science and Business Media Deutschland GmbH, 2019; Vol. 58, pp. 217–242. [Google Scholar] [CrossRef]
- Meriin, A.B.; Zhang, X.; He, X.; Newnam, G.P.; Chernoff, Y.O.; Sherman, M.Y. Huntingtin Toxicity in Yeast Model Depends on Polyglutamine Aggregation Mediated by a Prion-like Protein Rnq1. Journal of Cell Biology 2002, 157, 997–1004. [Google Scholar] [CrossRef]
- Ocampo, A.; Liu, J.; Barrientos, A. NAD+ Salvage Pathway Proteins Suppress Proteotoxicity in Yeast Models of Neurodegeneration by Promoting the Clearance of Misfolded/Oligomerized Proteins. Hum Mol Genet 2013, 22, 1699–1708. [Google Scholar] [CrossRef] [PubMed]
- Carmona-Gutierrez, D.; Büttner, S. The Many Ways to Age for a Single Yeast Cell. Yeast 2014, 31, 289–298. [Google Scholar] [CrossRef] [PubMed]
- Covarrubias, A.J.; Perrone, R.; Grozio, A.; Verdin, E. NAD+ Metabolism and Its Roles in Cellular Processes during Ageing. Nat Rev Mol Cell Biol 2021, 22, 119–141. [Google Scholar] [CrossRef]
- Lautrup, S.; Hou, Y.; Fang, E.F.; Bohr, V.A. Roles of NAD + in Health and Aging. Cold Spring Harb Perspect Med 2023, 14, 1–27. [Google Scholar] [CrossRef] [PubMed]
- Pinkerton, M.; Ruetenik, A.; Bazylianska, V.; Nyvltova, E.; Barrientos, A. Salvage NAD+ Biosynthetic Pathway Enzymes Moonlight as Molecular Chaperones to Protect against Proteotoxicity. Hum Mol Genet 2021, 30, 672–686. [Google Scholar] [CrossRef] [PubMed]
- Leri, M.; Bertolini, A.; Stefani, M.; Bucciantini, M. Evoo Polyphenols Relieve Synergistically Autophagy Dysregulation in a Cellular Model of Alzheimer’s Disease. Int J Mol Sci 2021, 22, 7225–7240. [Google Scholar] [CrossRef]
- Salis, C.; Papageorgiou, L.; Papakonstantinou, E.; Hagidimitriou, M.; Vlachakis, D. Olive Oil Polyphenols in Neurodegenerative Pathologies. In Advances in Experimental Medicine and Biology; Springer, 2020; Vol. 1195, pp. 77–91. [Google Scholar] [CrossRef]
- Ladiwala, A.R.A.; Mora-Pale, M.; Lin, J.C.; Bale, S.S.; Fishman, Z.S.; Dordick, J.S.; Tessier, P.M. Polyphenolic Glycosides and Aglycones Utilize Opposing Pathways to Selectively Remodel and Inactivate Toxic Oligomers of Amyloid β. ChemBioChem 2011, 12, 1749–1758. [Google Scholar] [CrossRef]
- Pacetti, D.; Boarelli, M.C.; Giovannetti, R.; Ferraro, S.; Conti, P.; Alfei, B.; Caprioli, G.; Ricciutelli, M.; Sagratini, G.; Fedeli, D.; et al. Chemical and Sensory Profiling of Monovarietal Extra Virgin Olive Oils from the Italian Marche Region. Antioxidants 2020, 9, 330–347. [Google Scholar] [CrossRef]
- Rongvaux, A.; Andris, F.; Van Gool, F.; Leo, O. Reconstructing Eukaryotic NAD Metabolism. BioEssays 2003, 25, 683–690. [Google Scholar] [CrossRef]
- Orlandi, I.; Alberghina, L.; Vai, M. Nicotinamide, Nicotinamide Riboside and Nicotinic Acid—Emerging Roles in Replicative and Chronological Aging in Yeast. Biomolecules 2020, 10, 604–618. [Google Scholar] [CrossRef]
- Trapp, J. The Role of NAD+ Dependent Histone Deacetylases (Sirtuins) in Ageing. Curr Drug Targets 2012, 7, 1553–1560. [Google Scholar] [CrossRef] [PubMed]
- Wilson, N.; Kataura, T.; Korsgen, M.E.; Sun, C.; Sarkar, S.; Korolchuk, V.I. The Autophagy–NAD Axis in Longevity and Disease. Trends Cell Biol 2023, 33, 788–802. [Google Scholar] [CrossRef] [PubMed]
- Solans, A.; Zambrano, A.; Rodríguez, M.; Barrientos, A. Cytotoxicity of a Mutant Huntingtin Fragment in Yeast Involves Early Alterations in Mitochondrial OXPHOS Complexes II and III. Hum Mol Genet 2006, 15, 3063–3081. [Google Scholar] [CrossRef]
- Caprioli, G.; Boarelli, M.C.; Ricciutelli, M.; Sagratini, G.; Fiorini, D. Micro-Scaled Quantitative Method to Analyze Olive Oil Polyphenols. Food Anal Methods 2019, 12, 1133–1139. [Google Scholar] [CrossRef]
- Blainski, A.; Lopes, G.C.; De Mello, J.C.P. Application and Analysis of the Folin Ciocalteu Method for the Determination of the Total Phenolic Content from Limonium Brasiliense L. Molecules 2013, 18, 6852–6865. [Google Scholar] [CrossRef]
- Ricciutelli, M.; Marconi, S.; Boarelli, M.C.; Caprioli, G.; Sagratini, G.; Ballini, R.; Fiorini, D. Olive Oil Polyphenols: A Quantitative Method by High-Performance Liquid-Chromatography-Diode-Array Detection for Their Determination and the Assessment of the Related Health Claim. J Chromatogr A 2017, 1481, 53–63. [Google Scholar] [CrossRef]
- Gonzalez, B.; François, J.; Renaud, M. A Rapid and Reliable Method for Metabolite Extraction in Yeast Using Boiling Buffered Ethanol. Yeast 1997, 13, 1347–1355. [Google Scholar] [CrossRef]
- Bradford, M.M. A Rapid and Sensitive Method for the Quantitation of Microgram Quantities of Protein Utilizing the Principle of Protein-Dye Binding. Anal Biochem 1976, 72, 248–254. [Google Scholar] [CrossRef]
- Shevchenko, A.; Tomas, H.; Havliš, J.; Olsen, J. V.; Mann, M. In-Gel Digestion for Mass Spectrometric Characterization of Proteins and Proteomes. Nat Protoc 2007, 1, 2856–2860. [Google Scholar] [CrossRef]
- Imai, S.I.; Guarente, L. NAD+ and Sirtuins in Aging and Disease. Trends Cell Biol 2014, 24, 464–471. [Google Scholar] [CrossRef]
- Ruggieri, S.; Orsomando, G.; Sorci, L.; Raffaelli, N. Regulation of NAD Biosynthetic Enzymes Modulates NAD-Sensing Processes to Shape Mammalian Cell Physiology under Varying Biological Cues. Biochim Biophys Acta Proteins Proteom 2015, 1854, 1138–1149. [Google Scholar] [CrossRef]
- Verdin, E. NAD + in Aging, Metabolism, and Neurodegeneration. Science 2015, 350, 1208–1213. [Google Scholar] [CrossRef]
- Chini, C.; Hogan, K.A.; Warner, G.M.; Tarragó, M.G.; Peclat, T.R.; Tchkonia, T.; Kirkland, J.L.; Chini, E. The NADase CD38 Is Induced by Factors Secreted from Senescent Cells Providing a Potential Link between Senescence and Age-Related Cellular NAD+ Decline. Biochem Biophys Res Commun 2019, 513, 486–493. [Google Scholar] [CrossRef] [PubMed]
- Nacarelli, T.; Lau, L.; Fukumoto, T.; Zundell, J.; Fatkhutdinov, N.; Wu, S.; Aird, K.M.; Iwasaki, O.; Kossenkov, A. V.; Schultz, D.; et al. NAD+ Metabolism Governs the Proinflammatory Senescence-Associated Secretome. Nat Cell Biol 2019, 21, 397–407. [Google Scholar] [CrossRef] [PubMed]
- Loreto, A.; Antoniou, C.; Merlini, E.; Gilley, J.; Coleman, M.P. NMN: The NAD Precursor at the Intersection between Axon Degeneration and Anti-Ageing Therapies. Neurosci Res 2023, 197, 18–24. [Google Scholar] [CrossRef] [PubMed]
- Ma, X.; Zhu, Y.; Lu, J.; Xie, J.; Li, C.; Shin, W.S.; Qiang, J.; Liu, J.; Dou, S.; Xiao, Y.; et al. Nicotinamide Mononucleotide Adenylyl Transferase Uses Its NAD+ Substrate-Binding Site to Chaperone Phosphorylated TAU. Elife 2020, 9, 1–26. [Google Scholar] [CrossRef]
- Katsyuba, E.; Romani, M.; Hofer, D.; Auwerx, J. NAD+ Homeostasis in Health and Disease. Nat Metab 2020, 2, 9–31. [Google Scholar] [CrossRef]
Figure 1.
PolyQ-Htt protein aggregates impacts on chronological lifespan of S. cerevisiae. A) The expression of 103Q-Htt in yeast cells (black squares) causes a faster decrease of viable cell with respect to GFP strain (blue circles). Data have been fitted by the Boltzmann sigmoidal nonlinear regression model, as explained in 4.11 paragraph of Materials and Methods. B) Fluorescence microscopy image of the GFP cells before reinoculation (Day 0) from which we can observe a semi-homogeneous distribution of green fluorescence. C) Fluorescence microscopy image of the 103Q cells before reinoculation (Day 0) from which we can observe bright spots of fluorescence due to polyQ-driven protein misfolding and aggregation.
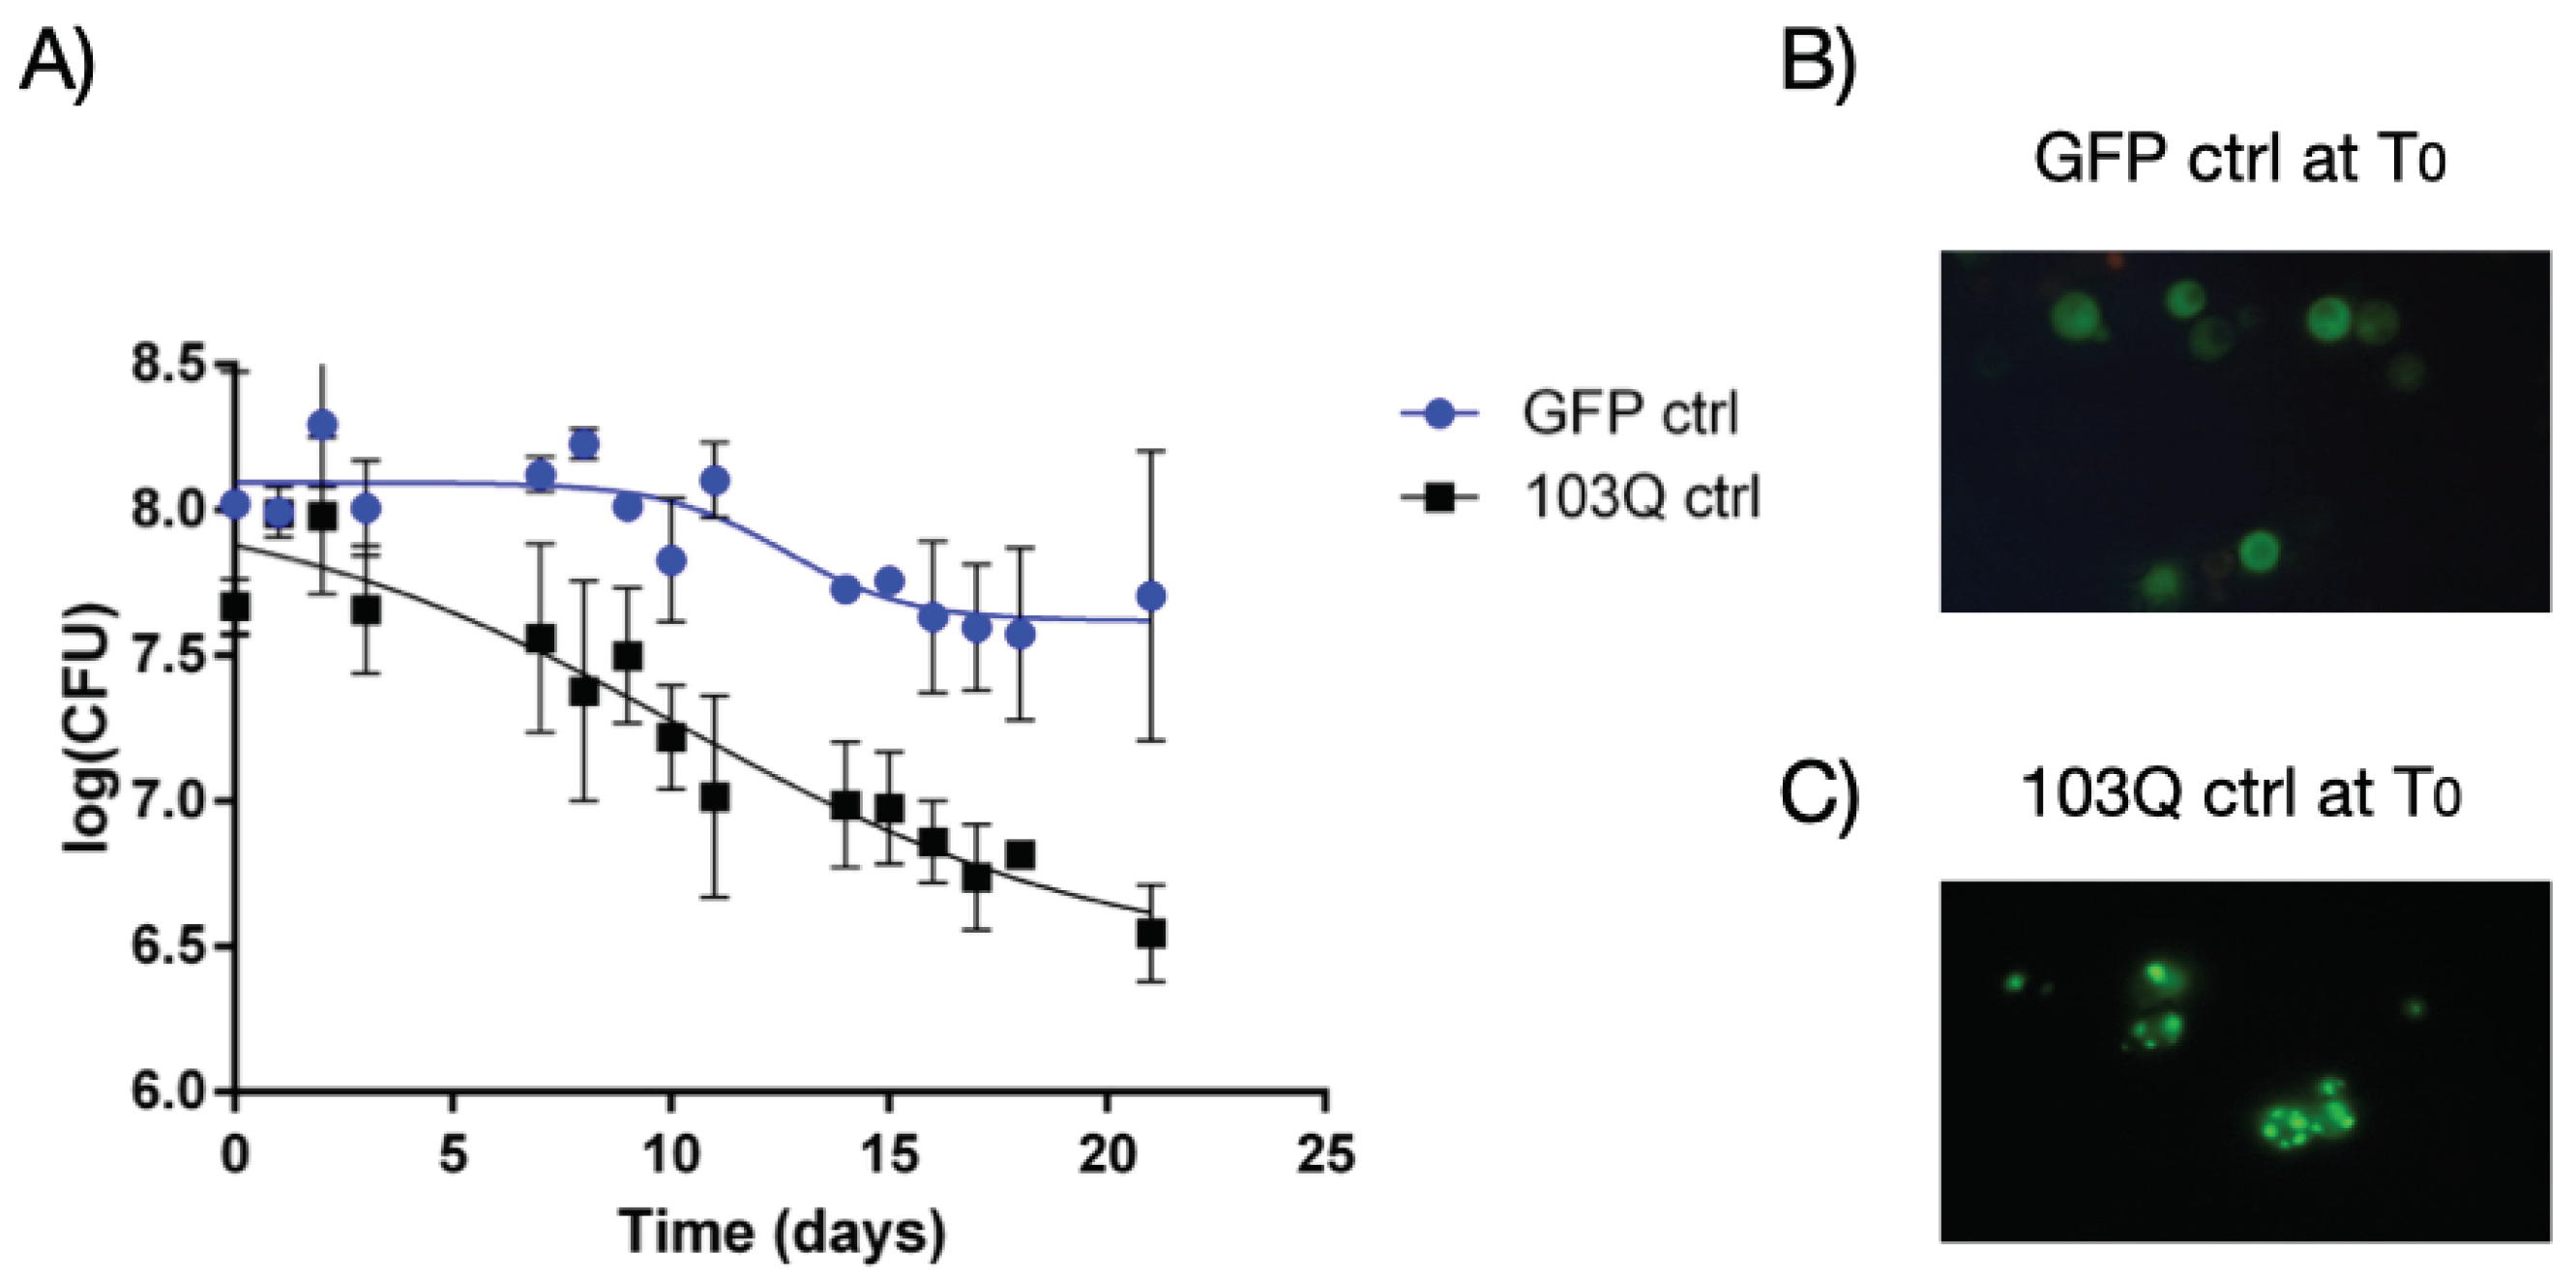
Figure 2.
Polyphenolic extract effect on chronological lifespan of polyQ-Htt S. cerevisiae. The administered polyphenols extracted from EVOO slightly affects the aging parameters of yeast strain expressing 103Q-Htt (red squares) compared to 103 control strain (black circles). Data have been fitted by the Boltzmann sigmoidal nonlinear regression model, as explained in 4.11 paragraph of Materials and Methods.
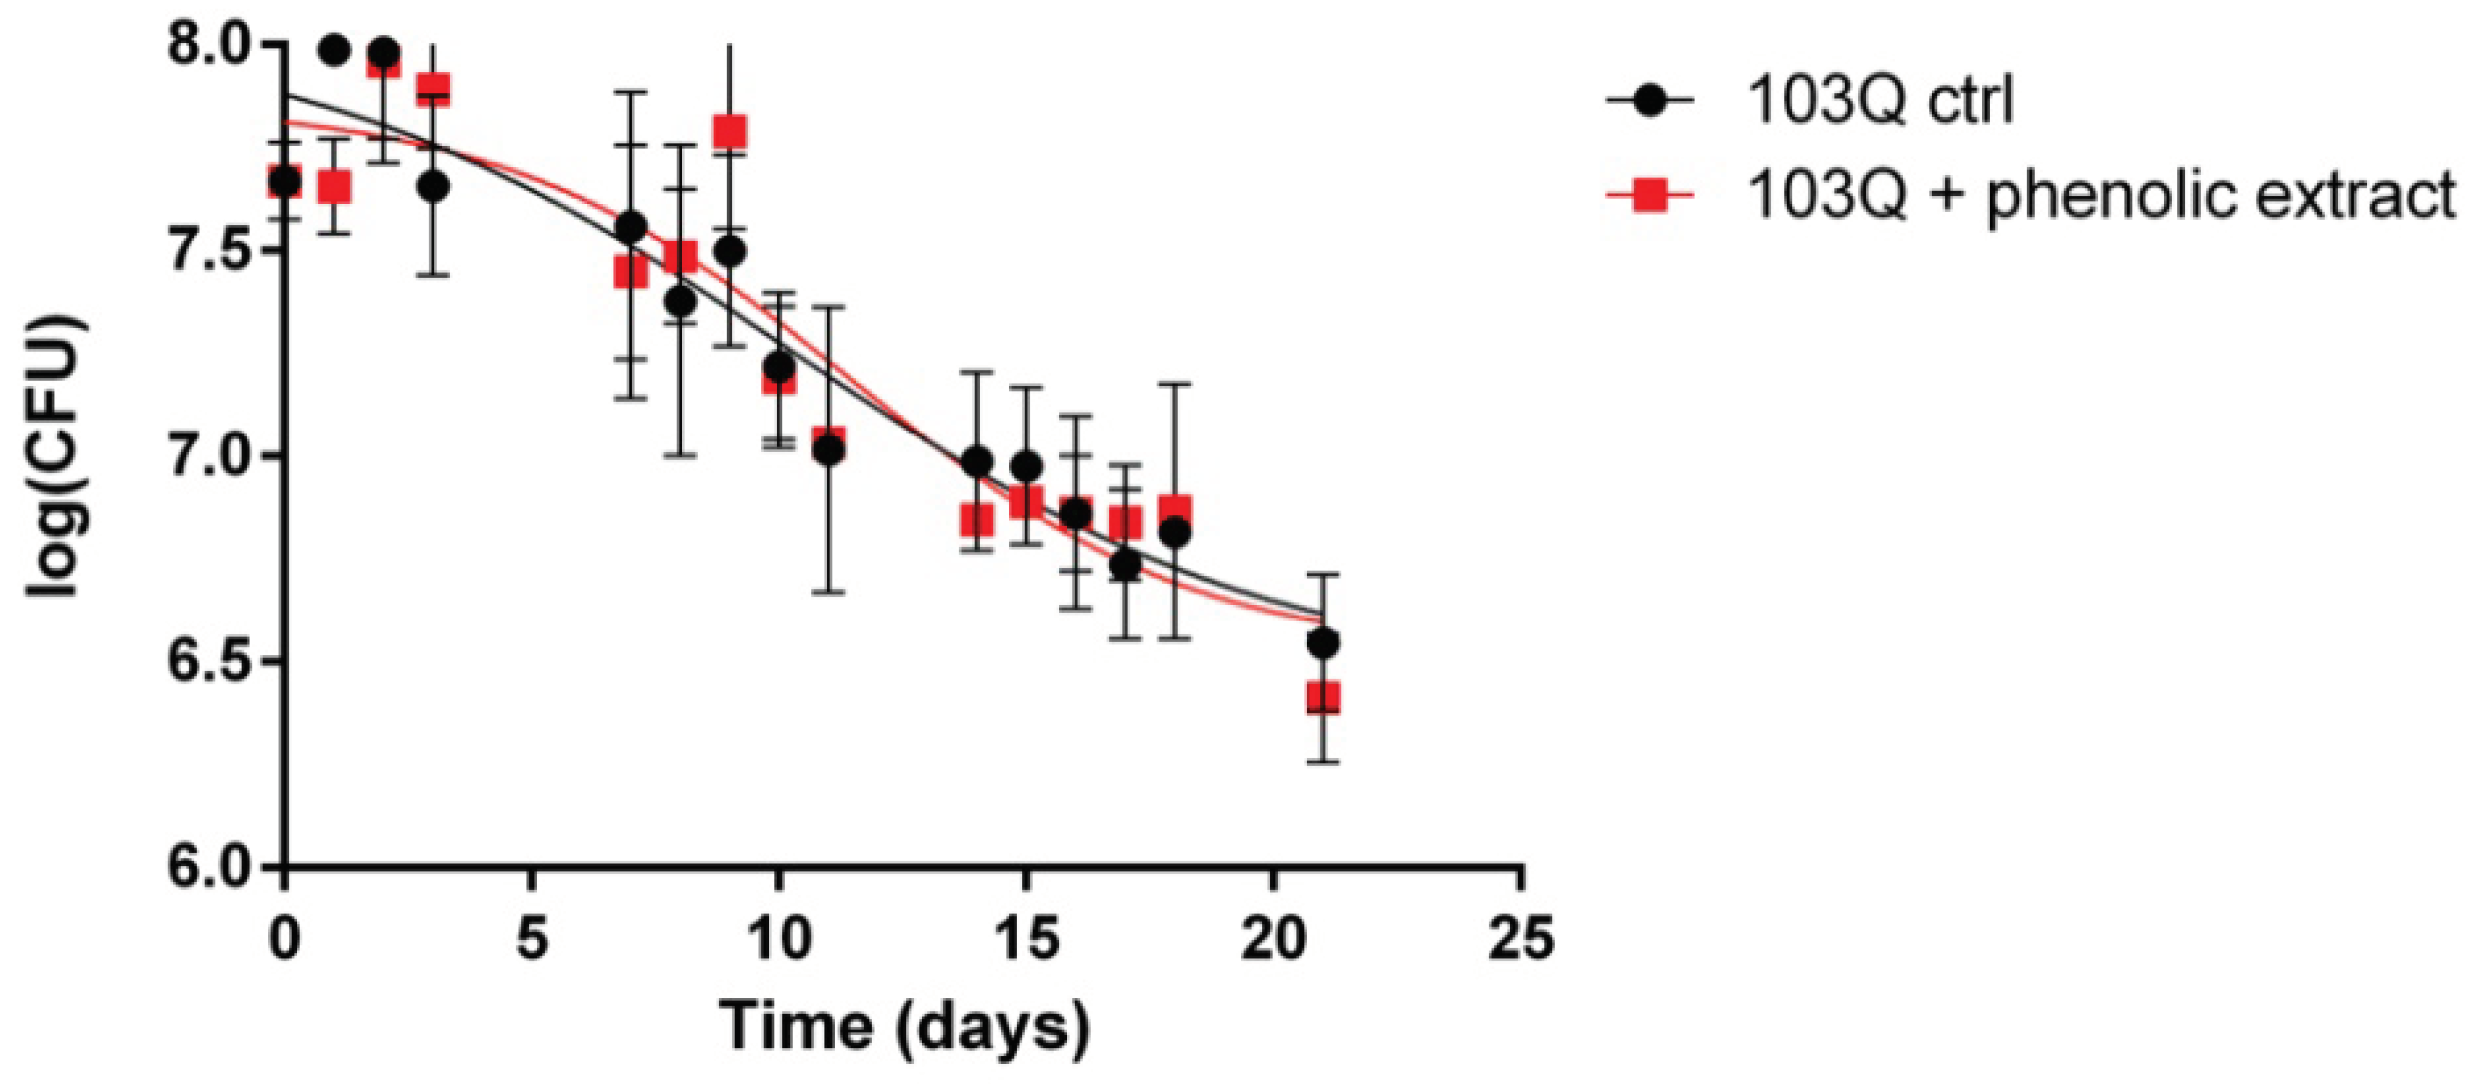
Figure 3.
NAD metabolic profile is deranged by polyQ-proteotoxicity. A) levels of NAD expressed as nmoles/mg of yeast cells in the young and adult phase, in all the panels black columns represent GFP control, red columns GFP strain in presence of polyphenolic extract from EVOO, blue columns 103Q control, and green columns 103Q strain in presence of polyphenolic extract from EVOO, as described in the Legend; B) levels of NAD expressed as relative fraction with respect to the whole pool of quantified metabolites, in the young and adult phase; C) levels of NA expressed as nmoles/mg of yeast cells in the young and adult phase; D) levels of NA expressed as relative fraction with respect to the whole pool of quantified metabolites, in the young and adult phase; E) levels of Nam expressed as nmoles/mg of yeast cells in the young and adult phase; F) levels of Nam expressed as relative fraction with respect to the whole pool of quantified metabolites, in the young and adult phase; G) levels of NaMN expressed as nmoles/mg of yeast cells in the young and adult phase; H) levels of NaMN expressed as relative fraction with respect to the whole pool of quantified metabolites, in the young and adult phase; I) levels of NMN expressed as nmoles/mg of yeast cells in the young and adult phase; L) levels of NMN expressed as relative fraction with respect to the whole pool of quantified metabolites, in the young and adult phase. *, p < 0.05; **, p < 0.005, ***, p < 0.001, ****, p < 0.0001.
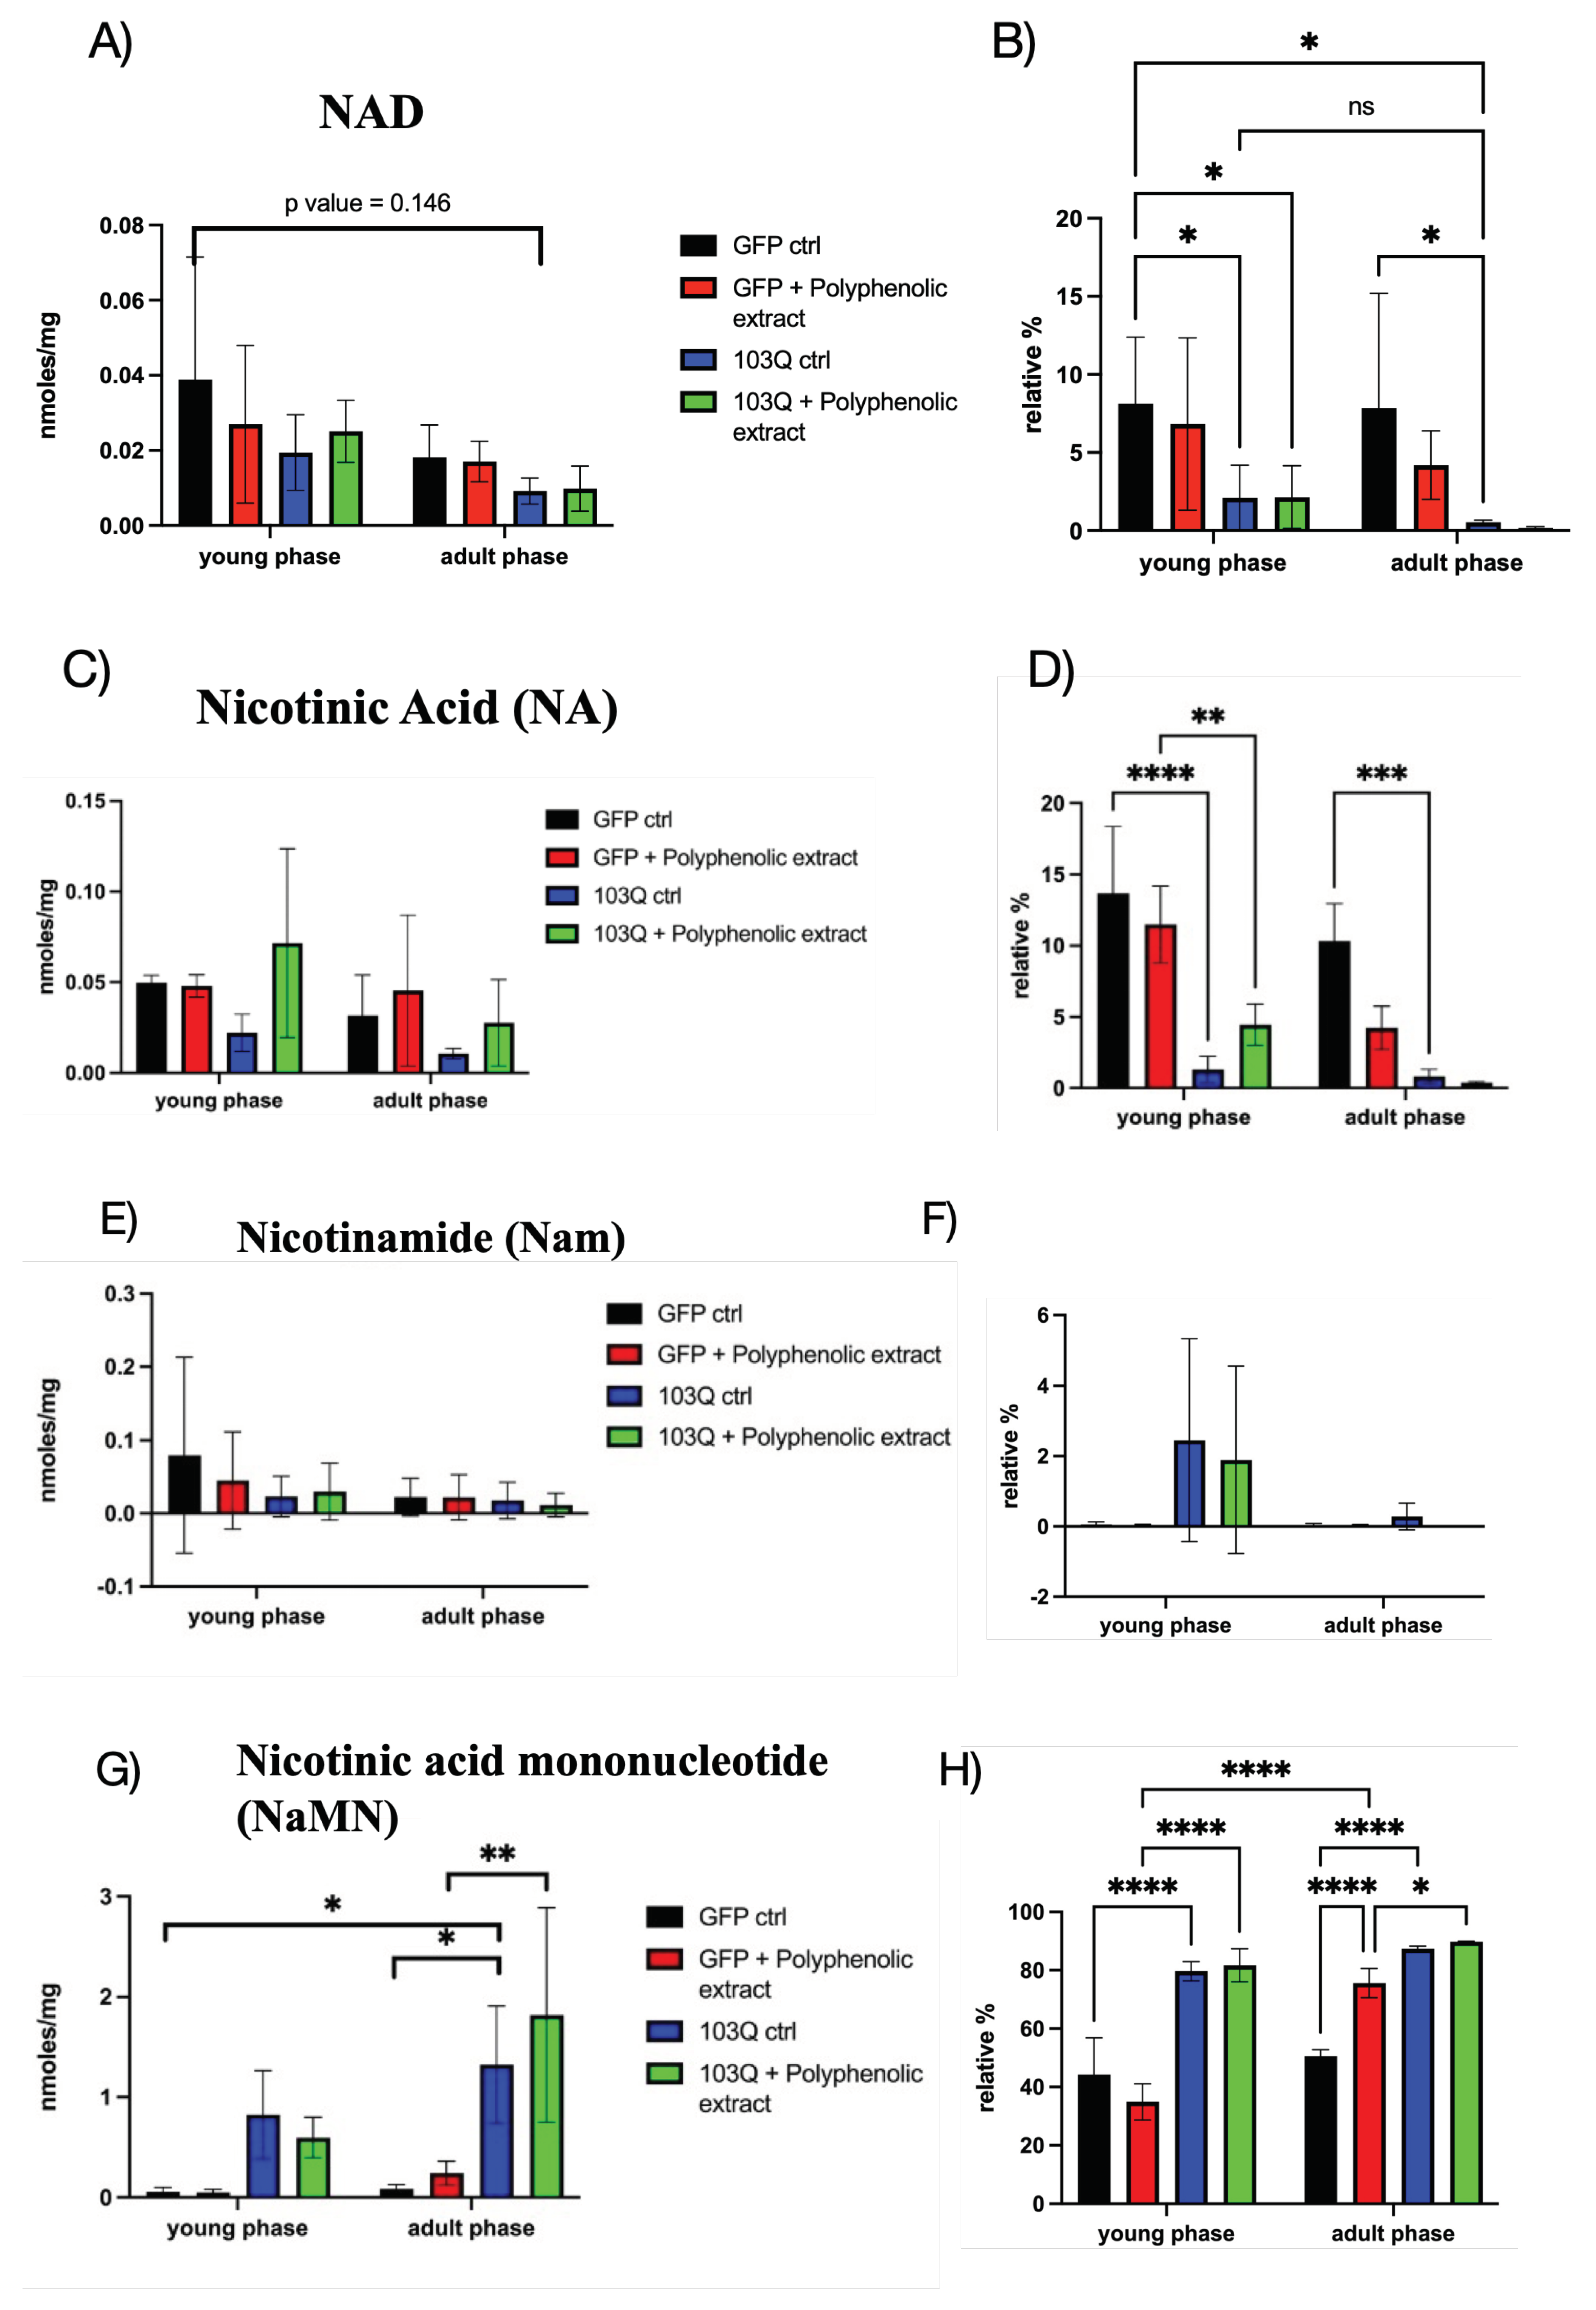
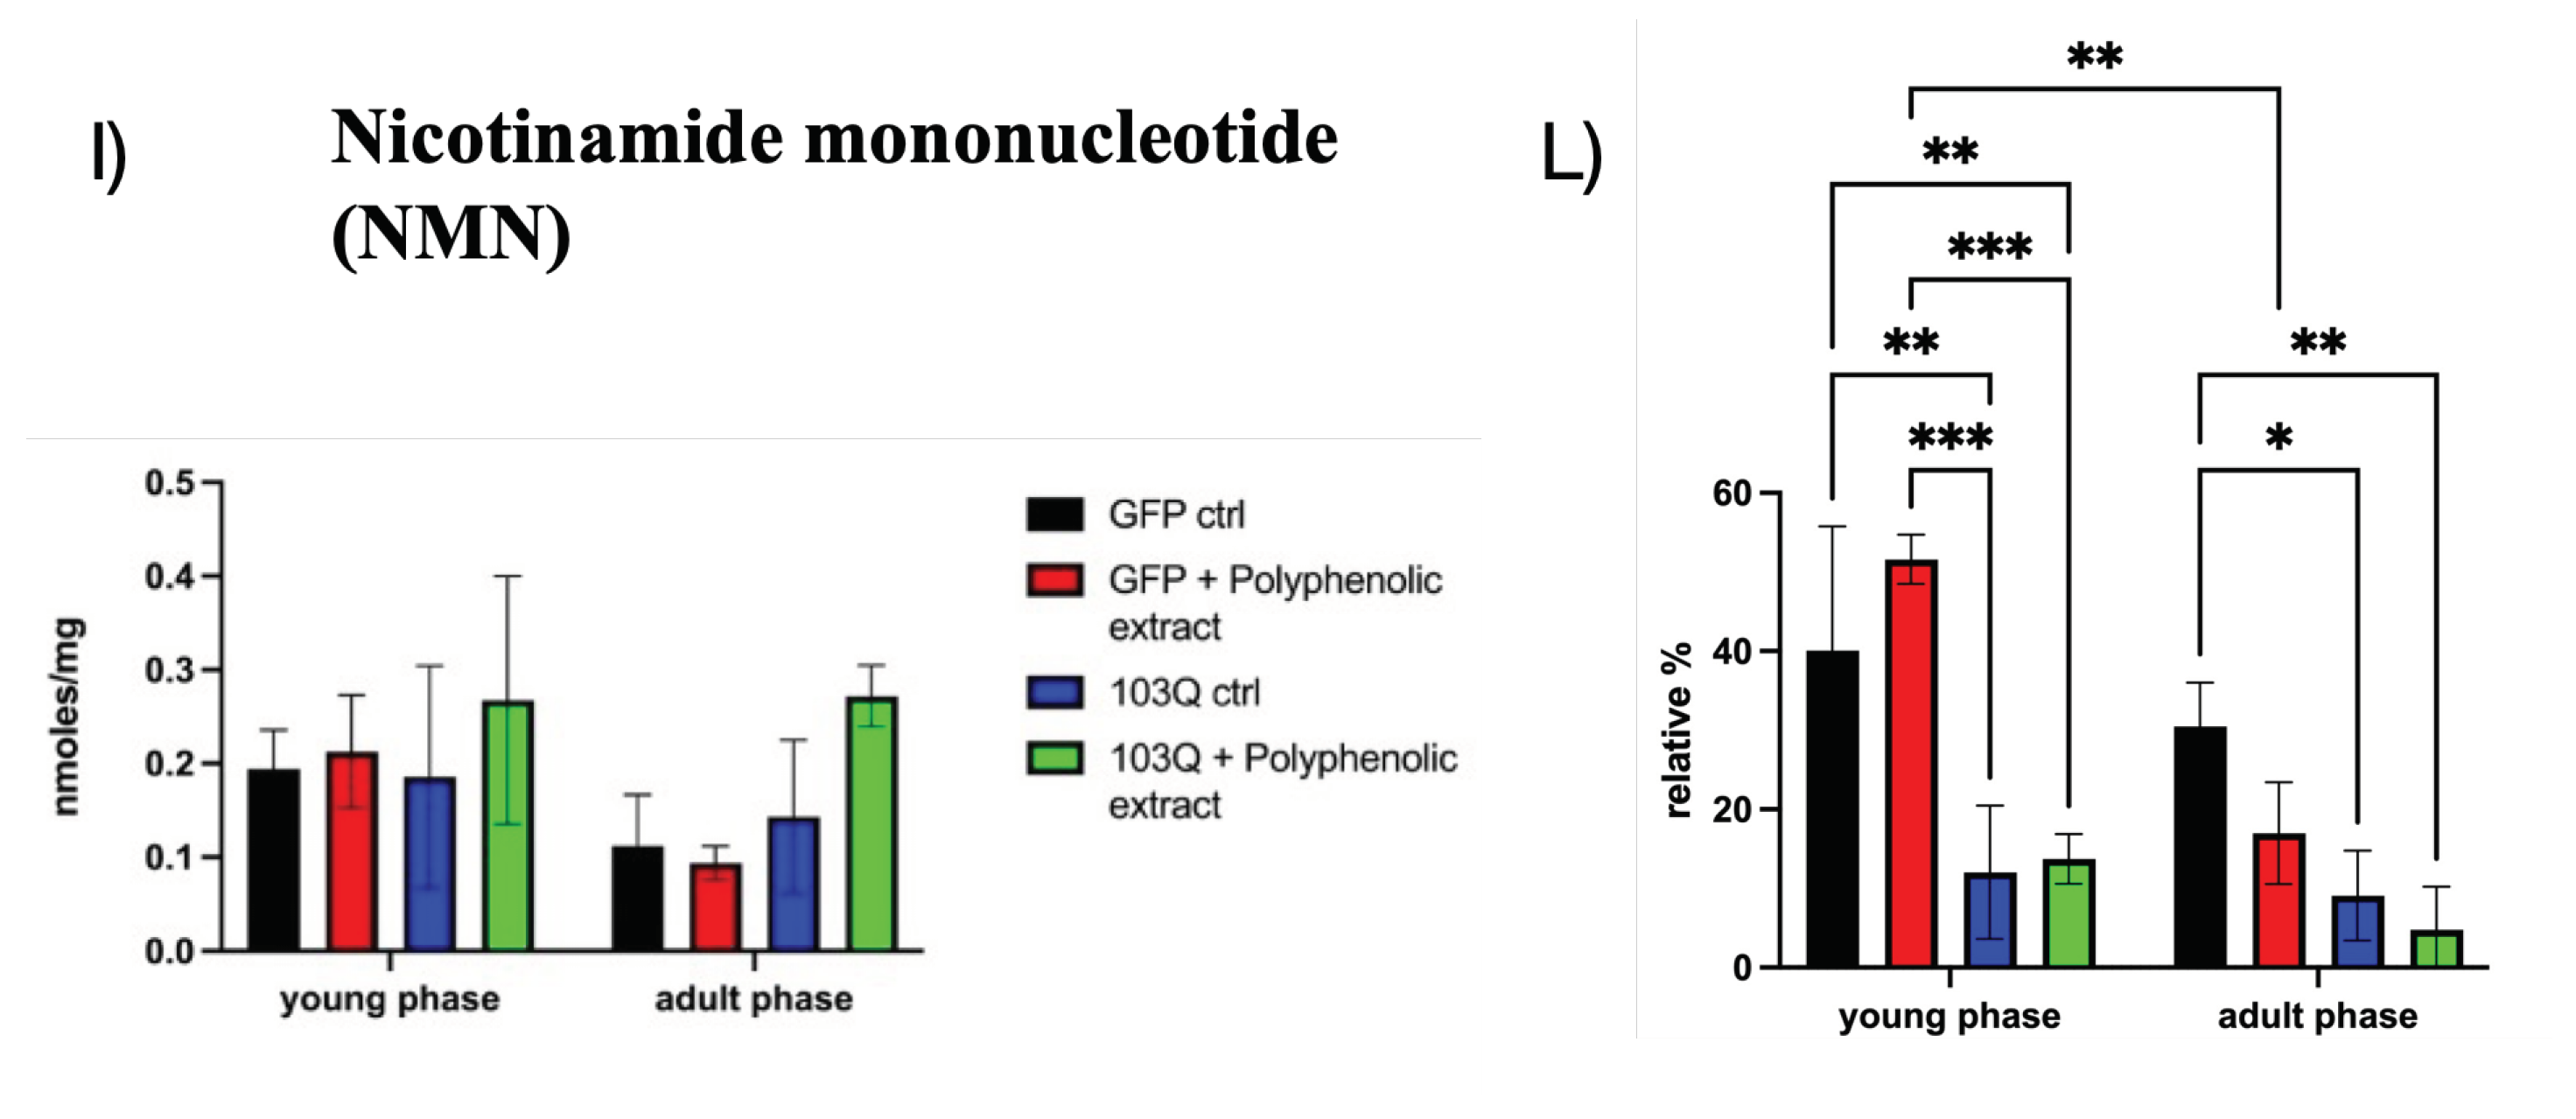
Figure 4.
Total protein content determined in the GFP and 103Q cell lysates with or without polyphenols (PPh) in the young phase or in the adult-late phase. Grey: young phase; Black: adult-late phase. ** p<0.01.
Figure 4.
Total protein content determined in the GFP and 103Q cell lysates with or without polyphenols (PPh) in the young phase or in the adult-late phase. Grey: young phase; Black: adult-late phase. ** p<0.01.
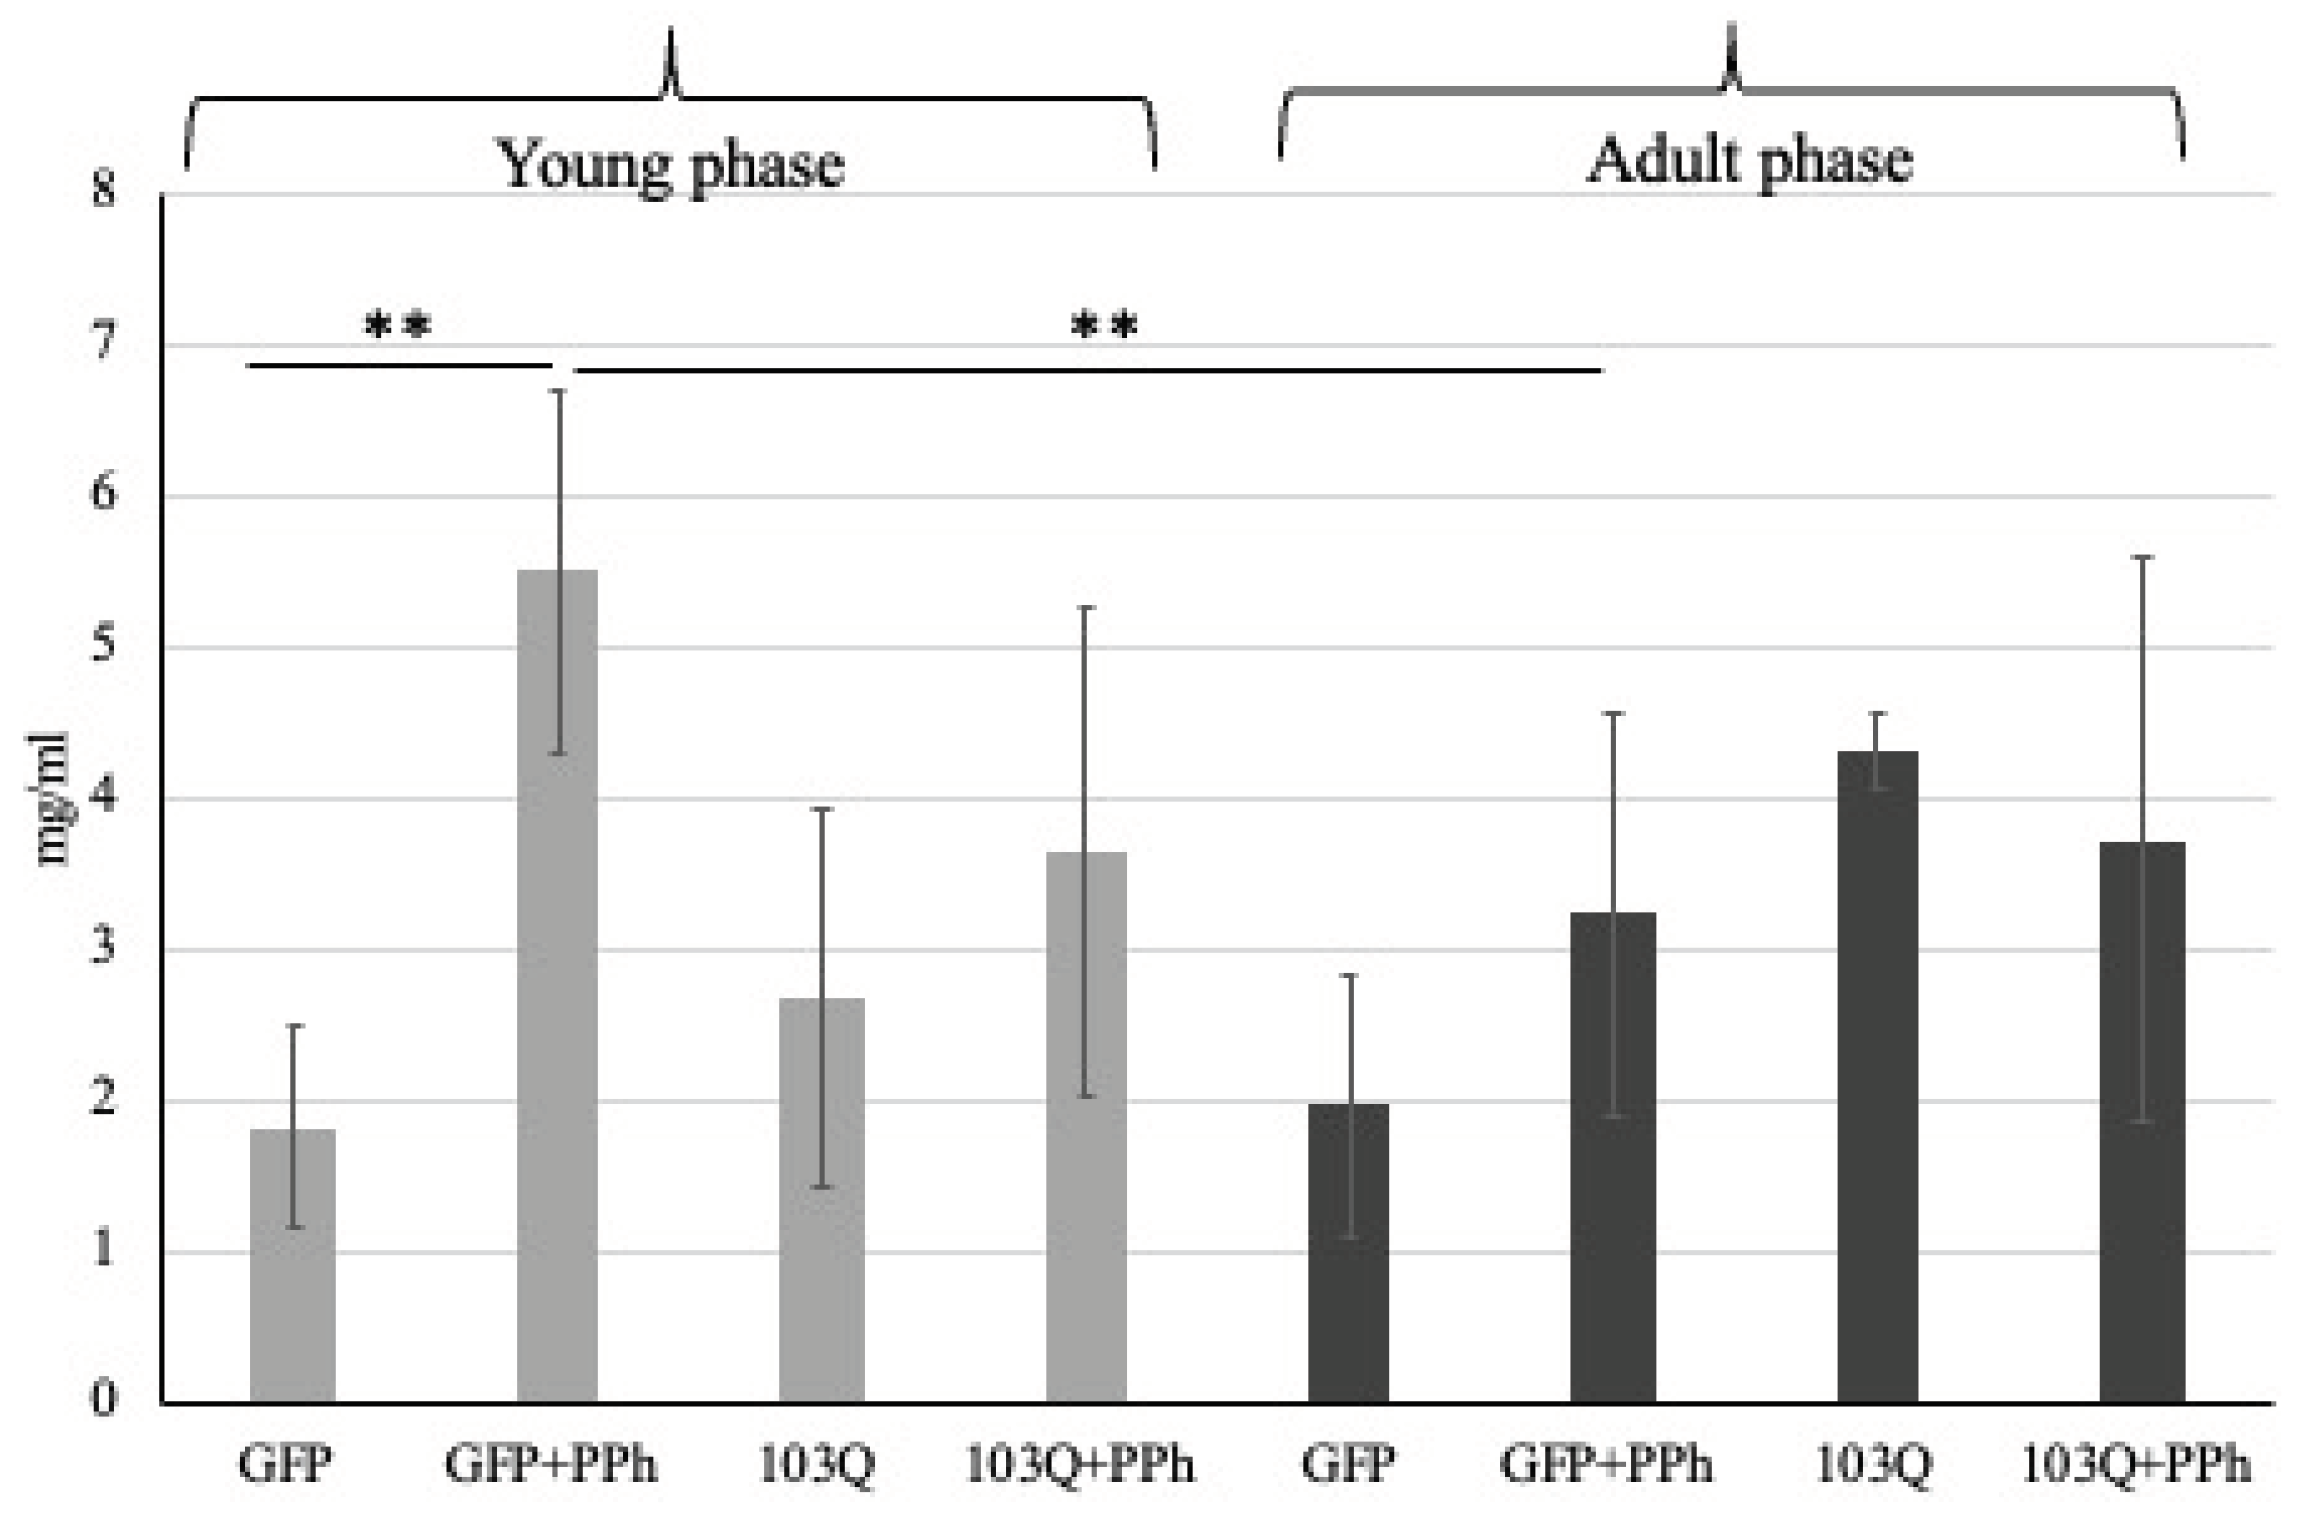
Figure 5.
Representative protein expression map of A) GFP (control) yeast cells and B) 103Q yeast cells both withdrawn at the young and adult-late phase in the presence or absence of added polyphenol extracts (PPh). Proteins were first separated on an immobilized pH 3-1 linear gradient strip followed by a 15% SDS-PAGE. Gels were silver stained. The standards were Bio-Rad low molecular weight (phosphorylase b, 97.4 kDa; bovine serum albumin, 66.2 kDa; ovalbumin 45.0 kDa; carbonic anhydrase, 31.0 kDa; soybean trypsin inhibitor, 21.5 kDa; lysozyme, 14.4 kDa).
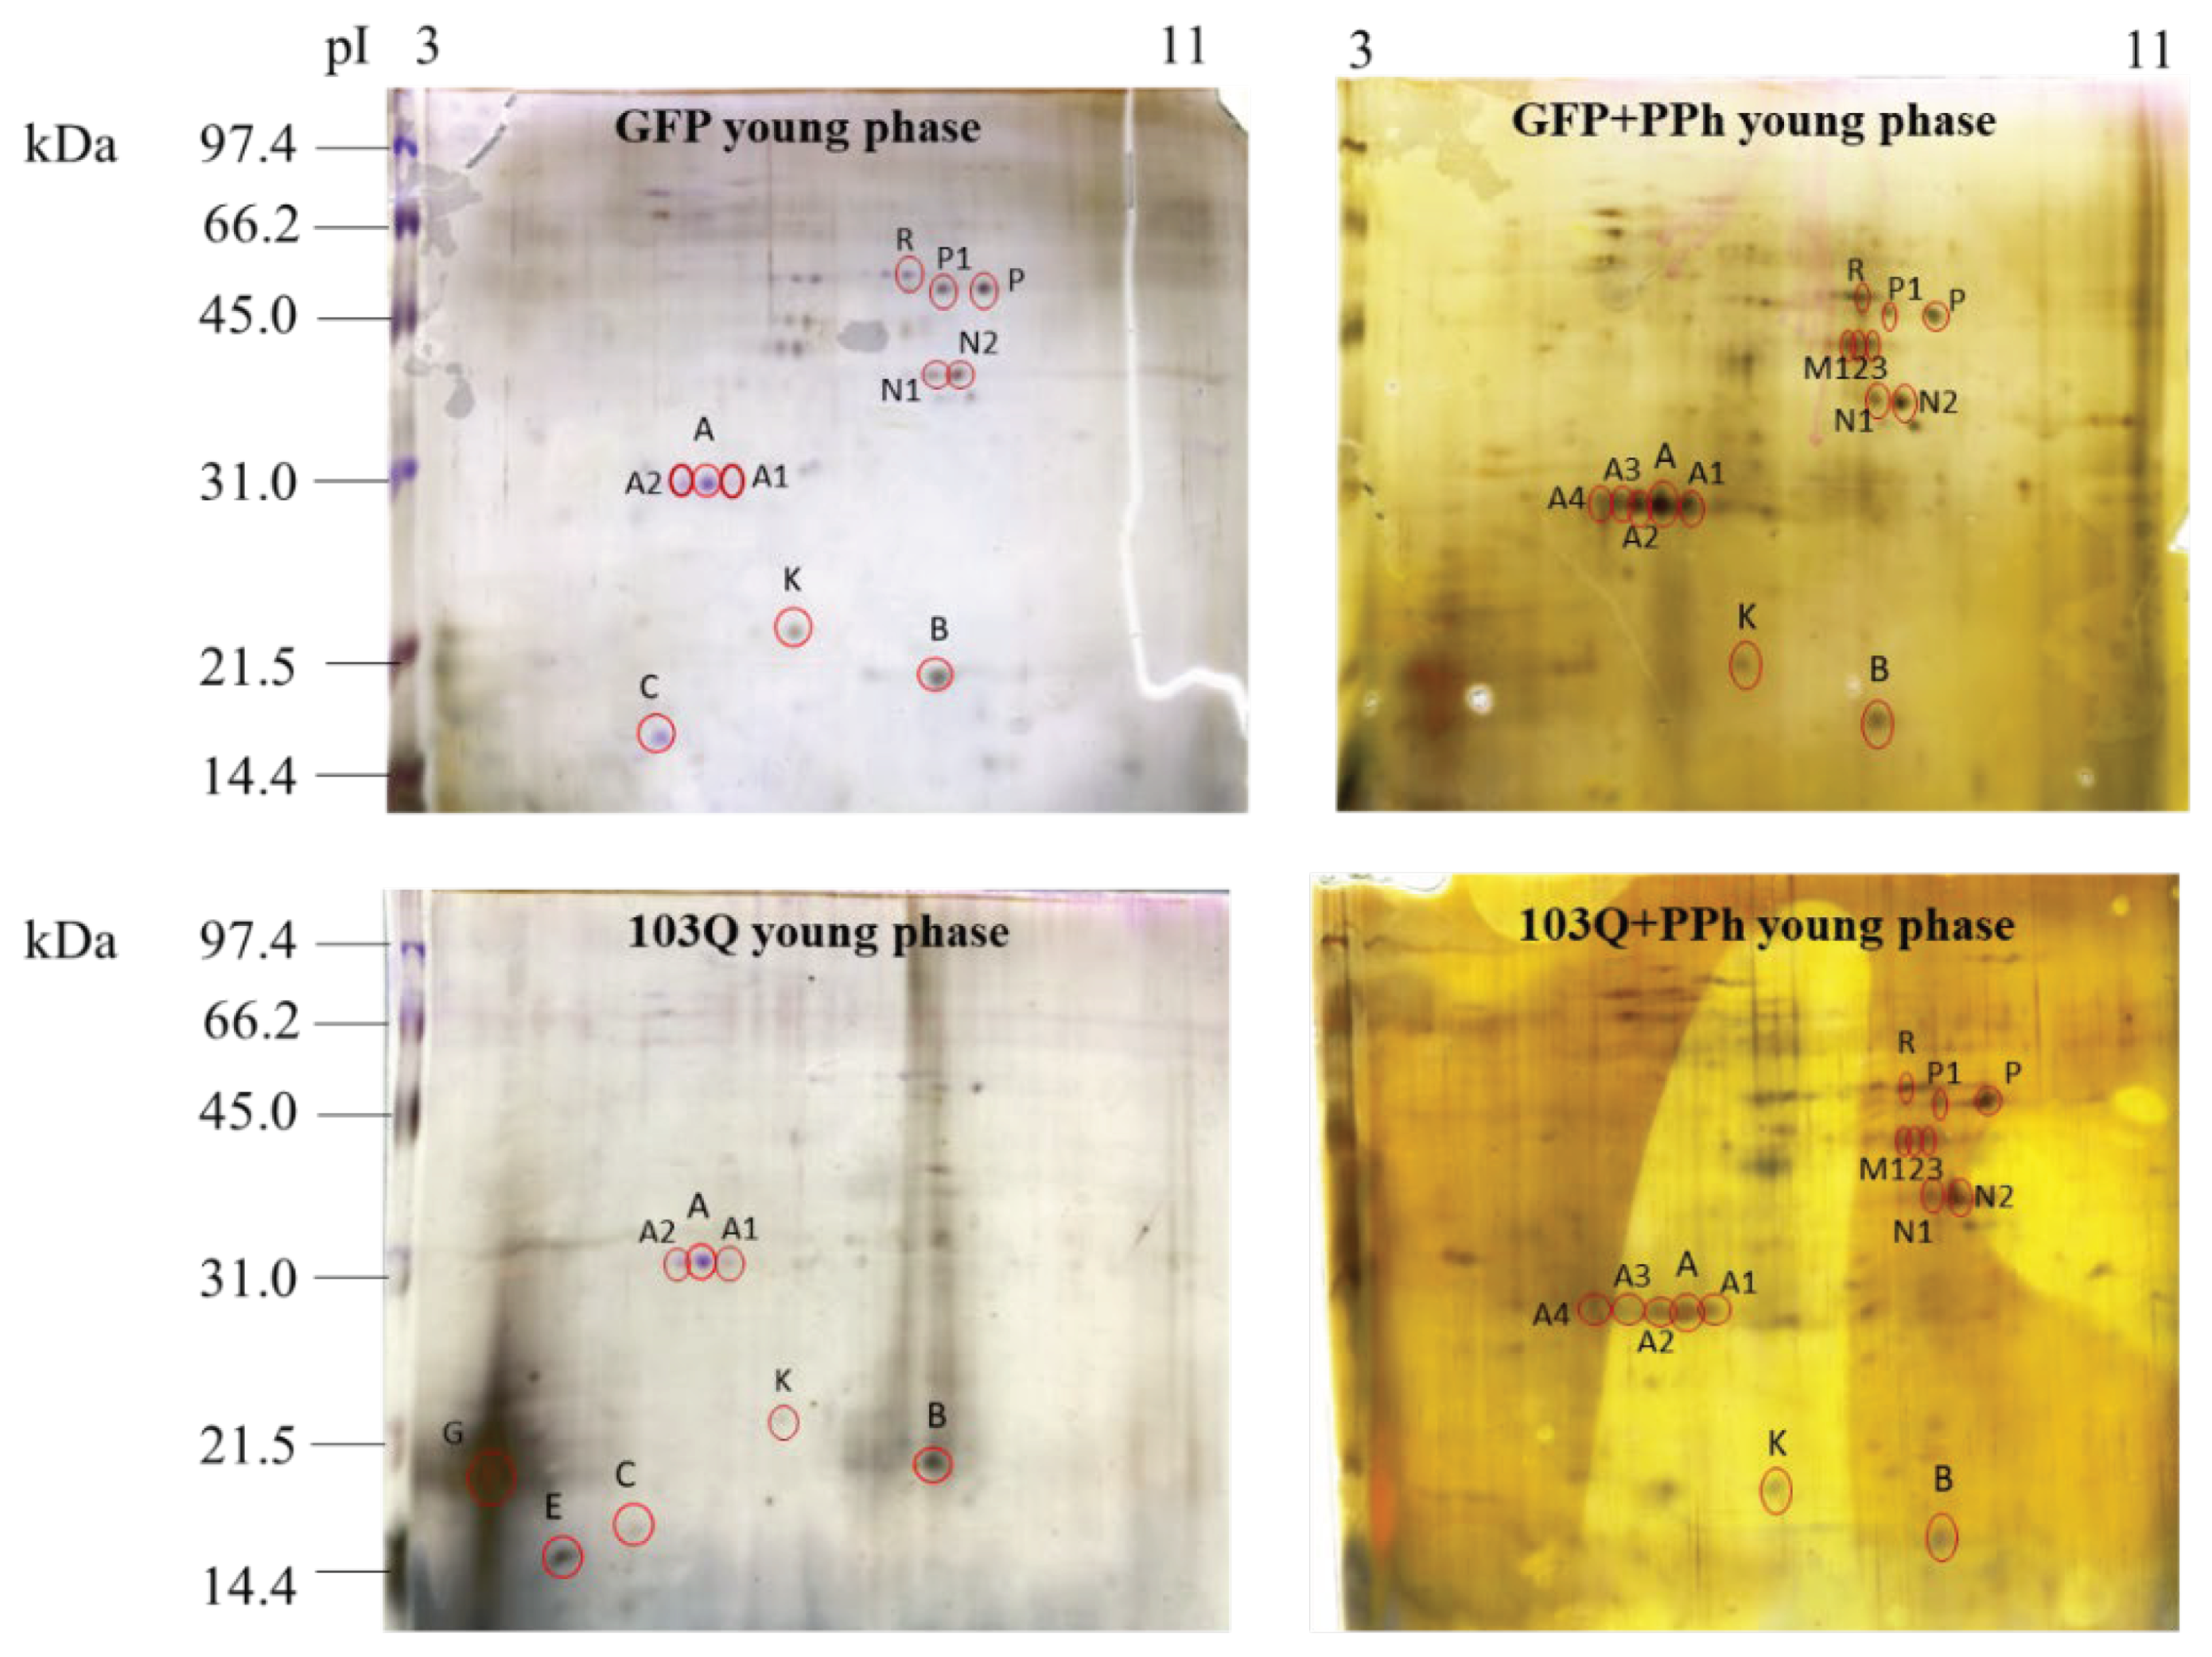
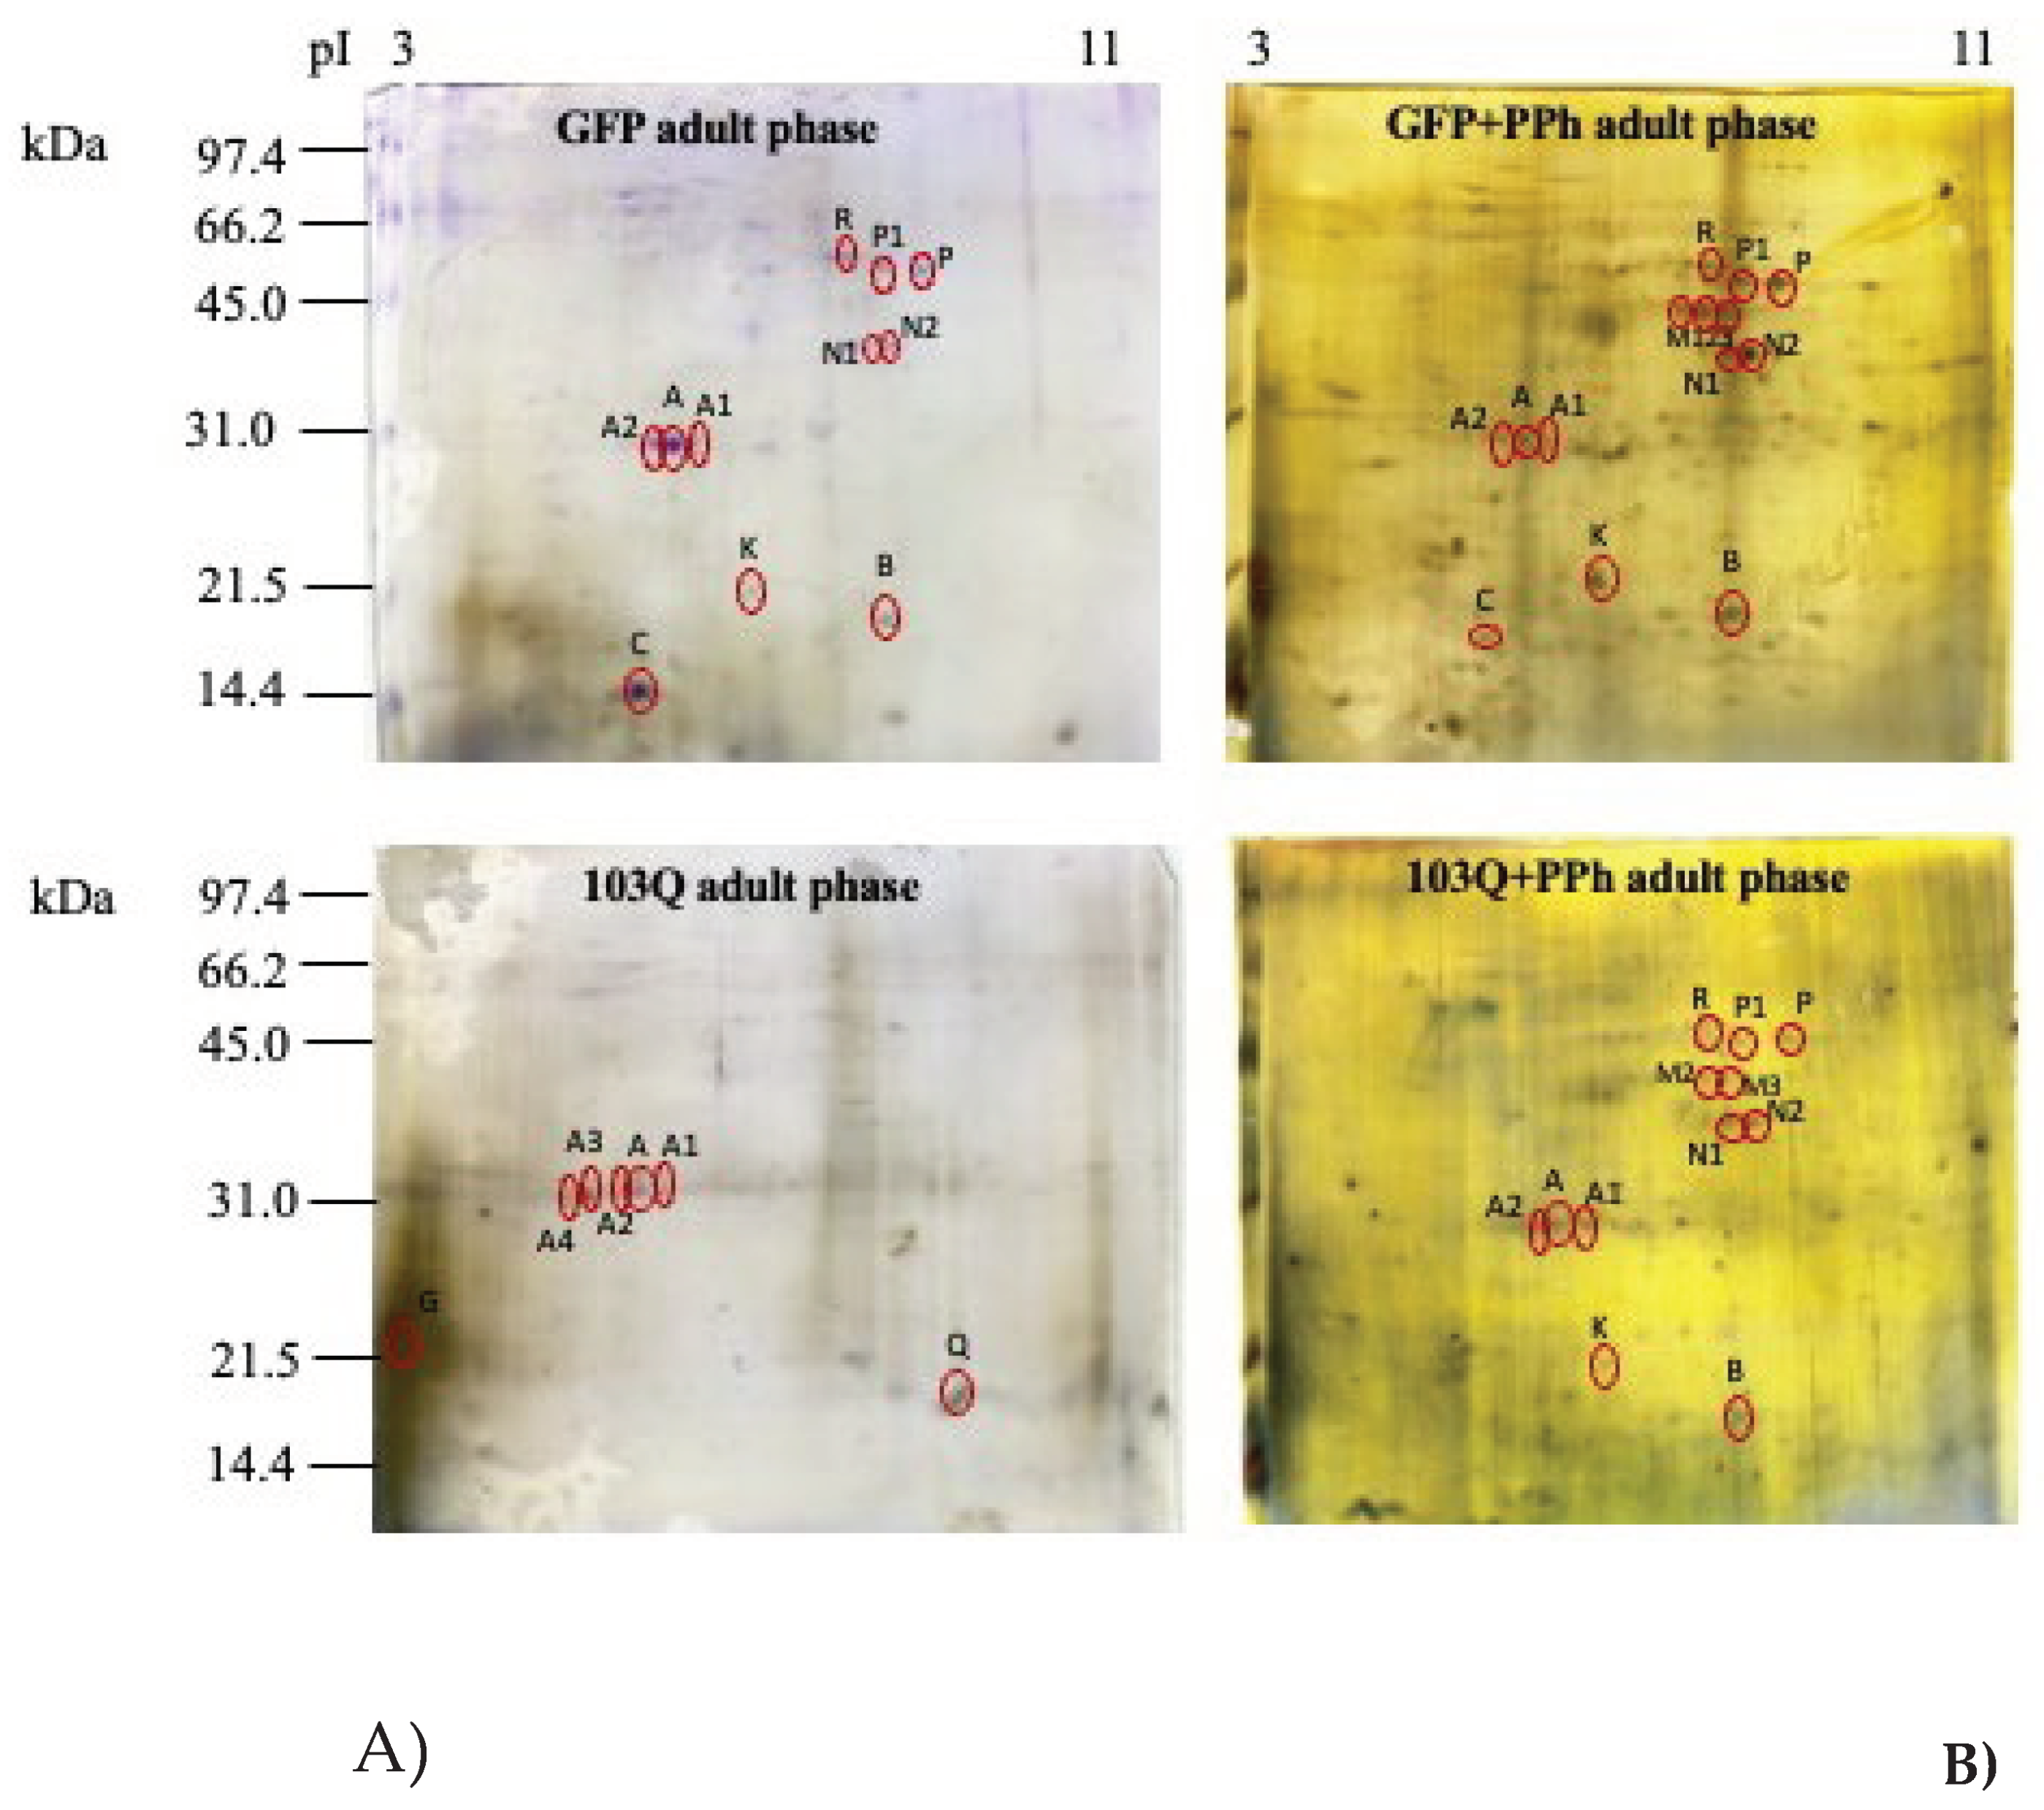
Figure 6.
Heatmap indicating the expression level of each spot calculated by the PDQuest software on the 2DE maps: A) GFP yeast cells at young and adult phase, treated or not with polyphenols extracts (PPh); B) GFP yeast cells at young and adult-late phase treated or not with polyphenols extracts (PPh). Legend: Low Medium High  .
.
.
Figure 6.
Heatmap indicating the expression level of each spot calculated by the PDQuest software on the 2DE maps: A) GFP yeast cells at young and adult phase, treated or not with polyphenols extracts (PPh); B) GFP yeast cells at young and adult-late phase treated or not with polyphenols extracts (PPh). Legend: Low Medium High .
.
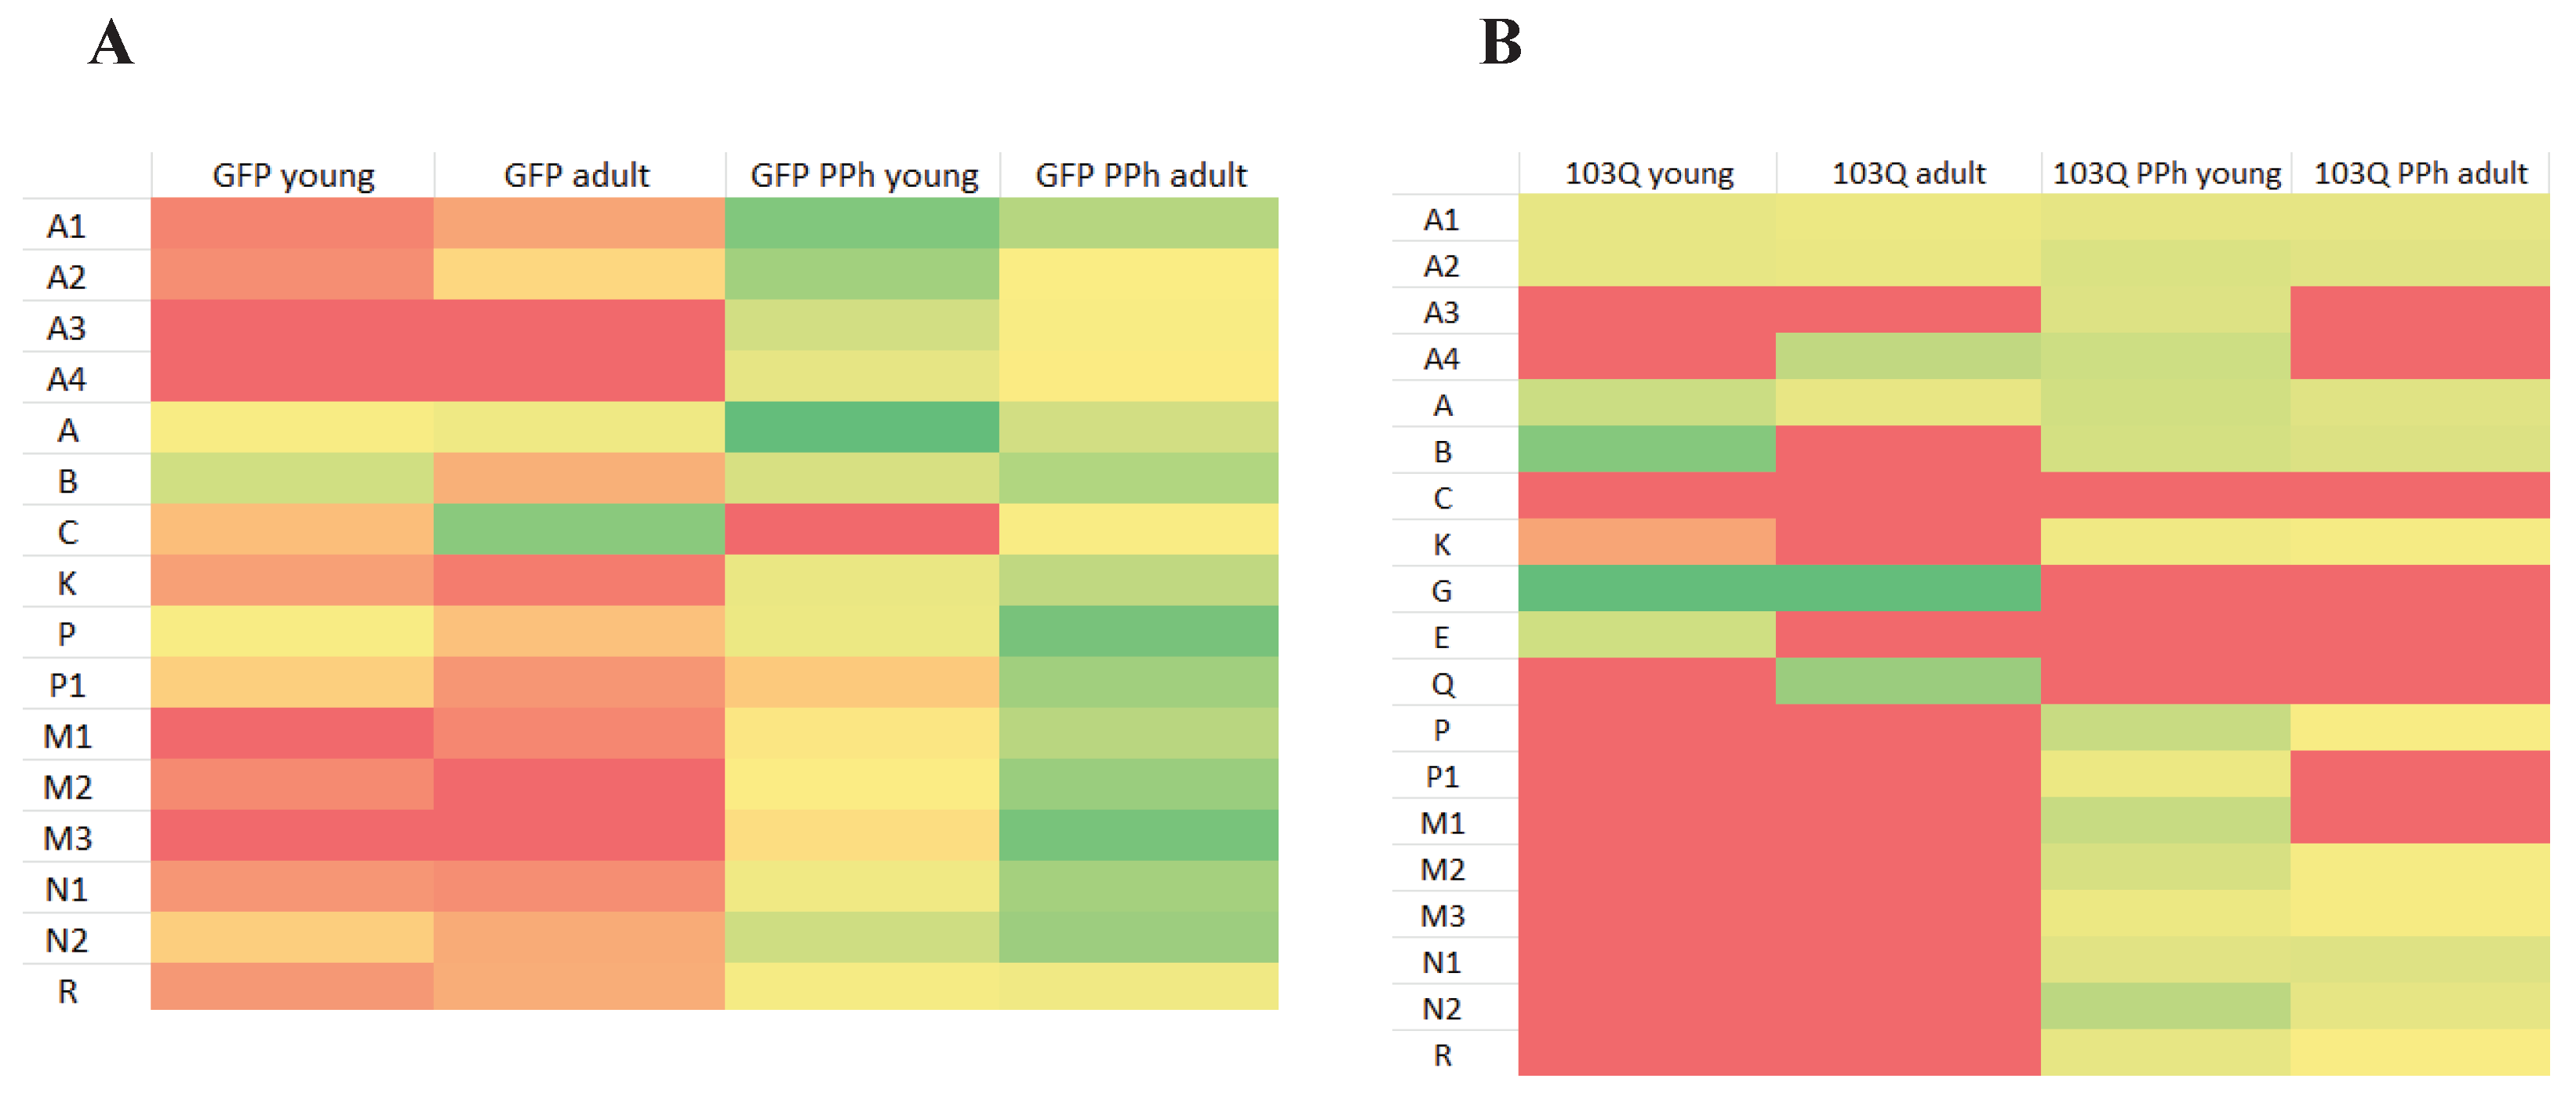

Table 1.
The average content of polar phenolic substances in Raggia cultivar EVOO.
| Phenolic Substances | Polar Phenolic Substances Concentration (mg/Kg of oil) |
|---|---|
| hydroxytyrosol (3,4-DHPEA) | 5.18 |
| tyrosol (p-HPEA) | 5.68 |
| vanillic acid | 0.26 |
| p-coumaric acid | 0.053 |
| ferulic acid | 0.041 |
| luteolin | 4.42 |
| apigenin | 1.36 |
| secoiridoid derivatives* | 593.9 |
| pinoresinol | 2.93 |
| Acetoxypinoresinol Total |
50.0 663.8 |
* Sum of oleacein (dialdehydic form of decarboxymethyl elenolic acid linked to hydroxytyrosol, 3,4-DHPEA-EDA), oleuropein aglycone isomer (3,4-DHPEA-EA), oleocanthal (the dialdehydic form of decarbox-ymethylelenolic acid linked to tyrosol, p-HPEA-EDA), ligstroside aglycon (p-HPEA-EA).
Table 2.
Chronological aging parameters of yeast cells expressing wild-type N-terminal Htt (GFP ctrl), 103Q-Htt (103Q ctrl), and 103Q-Htt added with phenolic extract (103Q + EVOO phenolic extract).
Table 2.
Chronological aging parameters of yeast cells expressing wild-type N-terminal Htt (GFP ctrl), 103Q-Htt (103Q ctrl), and 103Q-Htt added with phenolic extract (103Q + EVOO phenolic extract).
| GFP ctrl | 103Q ctrl | 103Q + EVOO phenolic extract | |
|---|---|---|---|
| ΔCV | 0.474 ± 0.005 | 1.598 ± 0.08 | 1.344 ± 0.036 |
| V50 | 12.65 ± 1.61 | 10.28 ± 1.89 | 11.47 ± 1.39 |
| slope | 1.43 ± 1.04 | 4.90 ± 3.00 | 3.48 ± 1.45 |
Disclaimer/Publisher’s Note: The statements, opinions and data contained in all publications are solely those of the individual author(s) and contributor(s) and not of MDPI and/or the editor(s). MDPI and/or the editor(s) disclaim responsibility for any injury to people or property resulting from any ideas, methods, instructions, or products referred to in the content. |
© 2024 by the authors. Licensee MDPI, Basel, Switzerland. This article is an open access article distributed under the terms and conditions of the Creative Commons Attribution (CC BY) license (http://creativecommons.org/licenses/by/4.0/).
Copyright: This open access article is published under a Creative Commons CC BY 4.0 license, which permit the free download, distribution, and reuse, provided that the author and preprint are cited in any reuse.


