
Submitted:
26 February 2024
Posted:
26 February 2024
You are already at the latest version
Abstract
To assess the impact of a deep learning (DL) denoising reconstruction algorithm applied to identical patient scans acquired with two different voxel dimensions, representing distinct spatial resolutions. This IRB approved prospective study was conducted at a tertiary pediatric center in compliance with the Health Insurance Portability and Accountability Act. We used a General Electric Signa Premier unit (GE Medical Systems, Milwaukee, WI) to acquire two DTI sequences of the left knee on each child at 3T: an in-plane 2.0 x 2.0 mm2 with section thickness of 3.0 mm and a 2 mm3 isovolumetric voxel, neither had an inter-section gap. We used a multi-band DTI acquisi-tion with fat-suppressed single-shot spin-echo echo-planar sequence (20 non-collinear directions; b-values of 0 and 600 sec/mm2). The MR vendor-provided a commercially available DL model applied with 75% noise reduction settings to same subject DTI sequences at different spatial res-olutions. We compared DTI tract metrics from both DL-reconstructed scans and non-denoised scans for femur and tibia, at each spatial resolution. Differences were evaluated using Wilcox-on-signed ranked test and Bland-Altman plots. When comparing DL versus non-denoised diffu-sion metrics in femur and tibia using the 2 mm x 2mm x 3 mm voxel dimension there were no significant differences between tract count (p = 0.1, p =0.14) tract volume (p = 0.14, p = 0.29), or tibial tract length (p=0.16); femur tract length exhibited a significant difference (p
Keywords:
diffusion tensor imaging
; spatial resolution
; denoising
; pediatrics
; growth
; voxel size
1. Introduction
Diffusion tensor imaging (DTI) can characterize tissue microstructure and microarchitecture inside a voxel of interest [1], thus providing new information previously unavailable with conventional magnetic resonance imaging (MRI). DTI techniques have been rigorously studied and well described within the fields of brain, spine and the nerves imaging [2,3,4]. The use of DTI in the physeal-metaphyseal complex for prediction of pediatric growth has been studied for approximately 10 years [5]. Characterization of columns of cartilage and newly formed bone in the physis and adjacent metaphysis through tractography has been proven useful for the determination of height gain and the evaluation of growth failure in pediatric subjects [5,6,7,8,9,10,11]. Tractography is the result of tensor estimation inside each voxel; the tensor depicts the main direction of unrestricted water diffusion inside the columns running perpendicular to the growth plate [4].
Accurate quantitative DTI metrics rely on specific acquisition parameters and the achievement of satisfactory SNRs due to the intrinsic vulnerability of MR-DTI to artifacts caused by diffusion gradients and motion [1]. However, only a few studies have investigated the effects of varying acquisition parameters on DTI metrics, primarily focusing on articular cartilage structures in rat knees [12,13,14]. These studies highlighted the sensitivity of knee connective tissues, specifically ligaments, to changes in spatial resolution [14]. Surprisingly, the rat knee physes demonstrated no significant variations in fractional anisotropy (FA) or mean diffusion across different spatial resolutions. Furthermore, the influence of these variations on physeal-metaphyseal tractographic diffusion metrics such as tract count, volume, and length, remains unassessed [14].
Spatial resolution plays an essential role in ensuring the quality and reliability of DTI by influencing and modulating the occurrence of partial volume effects (PVEs) [15]. Larger voxel dimensions (associated with lower spatial resolution) offer higher SNRs but increase the probability of PVEs. In contrast, smaller voxel dimensions provide better spatial resolution and reduce the likelihood of PVEs, at the cost of lower SNRs.
Our study aims to assess the impact of a deep learning (DL) denoising reconstruction algorithm applied to identical patient scans acquired with two different voxel dimensions, representing distinct spatial resolutions. We hypothesize that the denoising reconstruction algorithm will have a more pronounced effect on the smaller voxel dimensions, given their inherently lower SNR and consequent higher level of noise that can be more effectively eliminated through the algorithm. Through this study, we hope to obtain valuable insights into the potential benefits of employing the denoising reconstruction technique in the context of varying spatial resolutions in DTI of the growth plate.
2. Materials and Methods
Subjects
A prospective study was conducted at our tertiary pediatric center in compliance with the Health Insurance Portability and Accountability Act and approved by the institutional review board, to evaluate growth using DTI of the knee. Healthy girls (8 -15 years old) and boys (10-16 years old) (14 girls, 13 boys) during the pubertal and adolescent expected growth spurt, were recruited between August 2022 and November 2023. Informed consent and assent were provided by every parent/legal guardian and child, respectively.
MRI
We performed two DTI sequences of the left knee on each child at our pediatric center at 3T. We used a multi-band DTI acquisition with fat-suppressed single-shot spin-echo echo-planar sequence (20 non-collinear directions; b-values of 0 and 600 sec/mm2). Slice Selective gradient reversal was used for fat suppression. Two voxel dimensions were acquired on each subject, an in-plane 2.0 x 2.0 mm2 with section thickness of 3.0 mm and a 2 mm3 isovolumetric voxel, both without inter-section gap. We used a General Electric Signa Premier unit (GE HealthCare, Waukesha, WI) with an 18-channel knee coil (Quality Electrodynamics, Mayfield Village, OH). Parameters: repetition time (TR)/ echo time (TE); 3000/51.7 msec; bandwidth 1953.12 Hz/pixel; parallel imaging factor, 2; signal averages, 5 for 600 b-value scans; matrix 128 x 128; field of view, 256 × 256 mm.
Intra-voxel Tensor Visualization at Different Spatial Resolutions
To illustrate how acquisition at different spatial resolution (smaller versus larger 3D voxels) influences diffusion tensor direction, we employed MRtrix3 [16]. This software package is commonly used in diffusion imaging to visualize intravoxel tensors. The diffusion tensor is a mathematical model that characterizes the diffusion properties within a voxel, capturing the directionality and magnitude of water diffusion in three-dimensional space [17]. MRtrix3 uses the acquired MR-DTI data to estimate the diffusion orientation at each voxel [16], making it a useful tool to visualize and examine fiber tractography in the physes.
A diffusion weighted image was selected as input for MRtrix3 — 2 mm x 2mm x 3mm volume. The volume was resampled into 2 mm x 2mm x 2mm image using MRtrix3’s regrid command. We confirmed successful resampling with mrinfo command from MRtrix3 toolbox. Both the original and resampled image were saved into separate folders along with their corresponding .bval and .bvec files. For each corresponding image, we employed the Dhollander algorithm [18]. This method is instrumental in creating basis functions essential for estimating Fiber Orientation Distributions (FODs) derived from the diffusion signal. Consequently, we established a model to project how the diffusion signal changes in different orientations and with varying diffusion gradients applied. The outputs from this algorithm provided the corresponding voxels used to build the basis function. We then used the dwi2fod command from MRtrix3 toolbox to apply this basis function to each voxel in the input volume [19]. Finally, we used the mrcat command to concatenate these into a single volume, enabling the visualization of tensor ellipsoids that are representative of the fiber orientation directions.
AIRTM Recon DL algorithm (GE Healthcare, Waukesha, WI)
The MR vendor-provided a commercially available DL model applied with 75% noise reduction settings (Recon DL strength: High). This model was applied on same subject DTI sequences acquired at two different spatial resolutions (isovolumetric 2 mm3 and 2 mm x 2mm x 3 mm).
Segmentation
Using fiber tract reconstruction software, Diffusion Toolkit v. 0.6.4 (trackvis.org, Martinos Center for Biomedical Imaging, Massachusetts General Hospital, Boston, Ma) and Trackvis (FACT algorithm) the brightest voxel inside the physes was used as the reference point to locate the physes. A region of interest (ROI) was drawn intersecting the distal femoral and proximal tibial growth plates perpendicular to the long axis of the bone on every slice. ROIs were manually drawn in the AIRTM Recon DL reconstructed scans (n=54) over the distal femur and proximal tibia physes. The same ROIs were applied to non-denoised scans (n=54) for consistency. Diffusion metrics (tract count, tract volume, tract length, and fractional anisotropy (FA)) were obtained from the resultant tractography.
Signal-to-Noise Ratio Measurements
The Signal-to-Noise Ratio (SNR) serves as an important metric when assessing the quality of Diffusion Tensor Imaging (DTI) data. Enhanced SNR results in more dependable tensor estimation, consequently boosting the reliability and clarity of DTI-derived metrics, like FA, mean diffusivity, tract length etc. In MRI data, particularly DTI, noise can vary spatially due to elements like multi-channel coil sensitivity profiles, parallel imaging, and susceptibility artifacts. Traditional methodologies might not effectively capture this noise variance. To tackle this, SNR was calculated using the validated single-image set method applied by Wang et al. for the assessment of SNR in muscle diffusion tensor imaging [20]. Imaged volumes were paired with others that had proximally aligned diffusion encoding directions. We performed a subtraction of each DWI to yield initial noise image volumes. Each slice was transformed to k-space using 2D-Fourier transformation, followed by Butterworth filtering and 2-D inverse transformation to image space, resulting in the final noise image volumes. Finally, the average noise variance was calculated from the same local ROI for both b0 and b600 images.
Statistical Analysis
We compared the tract count, volume, length and FA, derived from both reconstructed scans and non-denoised scans for femur and tibia, at each spatial resolution. Differences between spatial resolutions were evaluated using Wilcoxon-signed ranked test and Bland-Altman plots. All statistical analysis was performed on JMP®, Version <17>. SAS Institute Inc., Cary, NC, 1989–2023.
3. Results
This section may be divided by subheadings. It should provide a concise and precise description of the experimental results, their interpretation, as well as the experimental conclusions that can be drawn.
Twenty-seven subjects (14 girls, 13 boys) were included in the study, each subject had 2 DTI sequences to which a DL reconstruction algorithm was applied (n= 27 subjects, n= 54 non-denoised DTI sequences, n= 54 DL reconstructed scans). In all subjects, isovolumetric 2 mm3 DTI scans exhibited a visibly higher quantity of tensor ellipsoids compared to the 2 mm x 2 mm x 3 mm acquisition, a more defined diffusion direction was observed in the smaller voxel size, as shown in Figure 1. Fiber tract count, volume, and length were consistently larger in both the femur and tibia physes when using the isovolumetric 2 mm3 voxel size in both the non-denoised scans and DL reconstructed scans, as shown in Table 1.
Figure 1. Same subject DTI acquisition using voxel sizes of (A) 2 mm3 and (D) 2mm x 2mm x 3mm. The image quality is visibly better when DL reconstruction is applied in the 2 mm3 voxel size (A), with sharper bone contours and an increase in fiber tracts on both the femur and tibia. Conversely, in the 2mm x 2mm x 3mm voxel size, both the non-denoised and DL denoise images (D) appear equally pixelated, and there are minimal changes in tractography. The tensor ellipsoid representation of intravoxel eigen vectors is substantially larger and more numerous in the 2 mm3 voxel size (B-C) compared to the 2mm x 2mm x 3mm voxel size (E-F).
Applying the reconstruction algorithm led to an increase in femorotibial tract count, volume, and length for both DL reconstructed voxel dimensions compared to non-denoised scans (Table 2). DTI metrics showed a greater increase in scans acquired using isovolumetric 2 mm3 compared to the scans acquired with 2 mm x 2 mm x 3 mm voxel dimensions (p=0.04). Diffusion metrics (tract count, volume, and length) derived from the DL reconstructed scans were significantly higher from the non-denoised scan DTI metrics in both the femur and tibial physes using the 2 mm3 voxel dimension (p < 0.001 (Table 2, Figure 2 and Figure 3).
Figure 2. Bland-Altman plots regarding the difference in DTI metrics for same physeal ROIs between DL reconstructed-and non-denoised (Non-DL) image DTIs. The horizontal axis represents the mean of the two methods and the vertical axis, the difference between them. The solid line (red) shows the mean difference (close to zero) and the dashed lines show the 95% limits of agreement.
Figure 3. Bland-Altman plots regarding the difference in DTI metrics for same physeal ROIs between DL reconstructed-and non-denoised (Non-DL) image DTIs. The horizontal axis represents the mean of the two methods and the vertical axis, the difference between them. The solid line (red) shows the mean difference (close to zero) and the dashed lines show the 95% limits of agreement.
When comparing DL versus non-denoised diffusion metrics in femur and tibia using the 2 mm x 2mm x 3 mm voxel dimension there were no significant differences between tract count (p = 0.1, p =0.14) tract volume (p = 0.14, p = 0.29), or tibial tract length (p=0.16); femur tract length exhibited a significant difference (p<0.01) (Table 2, Figure 4 and Figure 5). DL reconstruction resulted in a significant decrease in femorotibial fractional anisotropy (FA) for both voxel dimensions (p < 0.01) (Figure 3, Figure 5). Figure 6A and 6B show DTI tractography changes in non-denoised and denoised 2 mm3 versus non-denoised and denoised 2 mm x 2mm x 3 mm in a 9-year-old female and a 10-year-old male.
Figure 4. Bland-Altman plots regarding the difference in DTI metrics for same physeal ROIs between DL reconstructed and non-denoised (Non-DL) DTIs. The zero value is indicated by the red line. The horizontal axis represents the mean of the two methods and the vertical axis, the difference between them. The solid line (red) shows the mean difference (close to zero) and the dashed lines show the 95% limits of agreement. The mean is very close to zero for most cases, indicating little difference between the methods, and the range of LoA is relatively small indicating a good numerical agreement in the methods among the majority of patients for the 2 mm x 2mm x 3mm voxel size.
Figure 5. Bland-Altman plots regarding the difference in DTI metrics for same physeal ROIs between DL reconstructed and non-denoised (Non-DL) DTIs. The zero value is indicated by the red line. The horizontal axis represents the mean of the two methods and the vertical axis, the difference between them. The solid line (red) shows the mean difference (close to zero) and the dashed lines show the 95% limits of agreement. The mean is very close to zero for most cases, indicating little difference between the methods, and the range of LoA is relatively small indicating a good numerical agreement in the methods among the majority of patients for the 2 mm x 2mm x 3mm voxel size.
Figure 6 (a). 2 mm3 (A) non-denoised (left) and 2 mm3 denoised (right) versus 2 mm x 2mm x 3mm (B) non-denoised (left) and denoised (right) in a 9 year-old female. There is an evident increase in fiber tract on the denoised images acquired with a 2 mm3, while denoised and non-denoised images are very similar using 2 mm x 2mm x 3mm voxel size.
Figure 6 (b). 2 mm3 (C) non-denoised (left) and denoised (right) versus 2 mm x 2mm x 3mm (D) non-denoised (left) and denoised (right) in a10 year-old male. There is an evident increase in fiber tract on the denoised images acquired with a 2 mm3, while denoised and non-denoised images are very similar using 2 mm x 2mm x 3mm voxel size
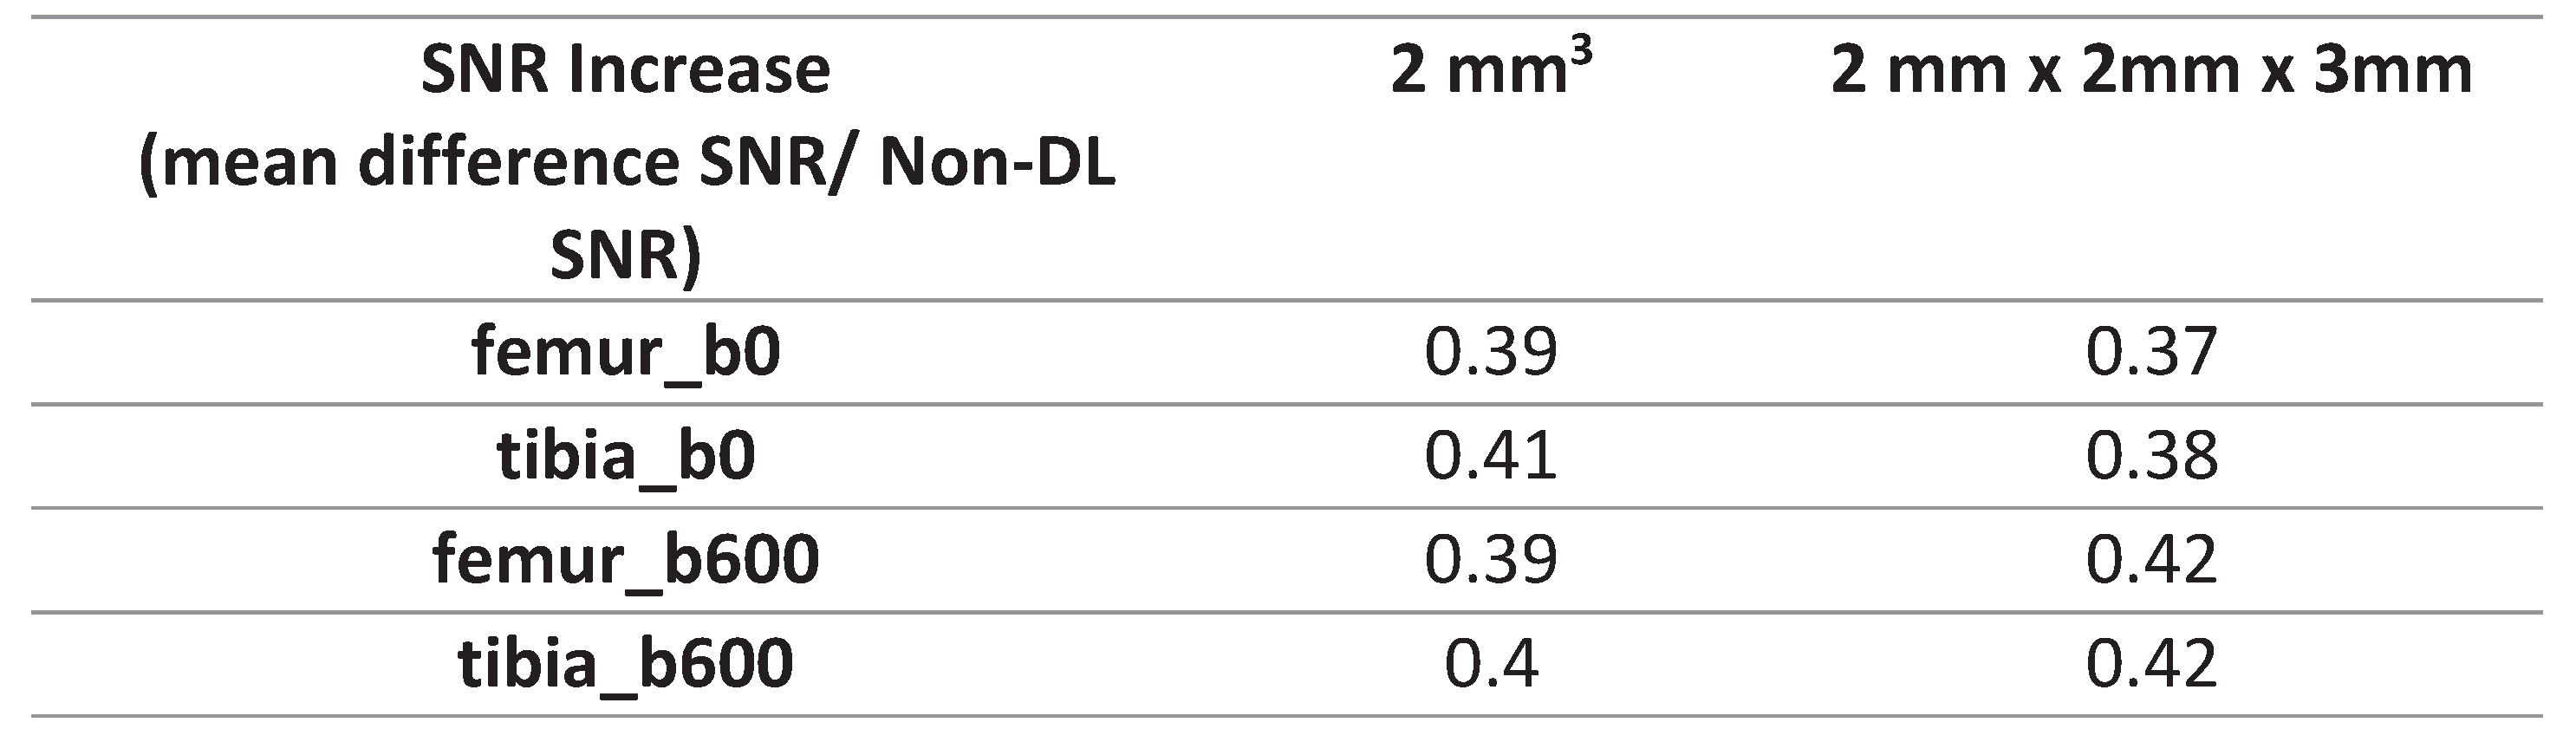
SNR values were significantly higher in the non-denoised femur and tibia ROIs in the 2mm x 2mm x 3mm voxel dimension compared to the 2 mm3 voxel size (p<0.0001), a pattern observed both before and after applying DL-denoising (Table 3). Following the application of DL-denoising, the femur and tibia ROI SNR on b0 exhibited a 39% and 41% increase in the 2 mm3 voxel dimension, respectively, in contrast to the 37% and 38% increase in the 2mm x 2mm x 3mm (Table 4). Moreover, the SNR for the femur and tibia ROI on b600 experienced a 39% and 40% increase in the 2 mm3 voxel size, whereas a more pronounced increment of 40% and 42% was observed in the 2mm x 2mm x 3mm (Table 4).
4. Discussion
Voxel dimension is one of the factors that influences fiber tracking and the degree of PVEs [15]. Larger voxel sizes can contain more than one dominant diffusion orientation, thereby causing possible errors in estimating the primary tensor direction which ultimately impacts fiber tracking and the resultant diffusion metrics [1,15]. This may explain the markedly smaller tensor ellipsoid representations inside a voxel with a less defined direction observed in the larger voxel dimension (which results in lower microscopic resolution) compared to the smaller isotropic voxel size used (2 mm3). The relationship between voxel resolution and image quality is evident in Figure 1, where the knee bones and physes are more sharply defined on the isotropic 2 mm3 voxel size [21].
The use of larger voxels resulted in smaller fiber tract diffusion metrics. Larger 3D voxels can cover the entire field of view (FOV) and thickness with fewer voxels overall at a lower spatial resolution, the opposite is true when using smaller voxel sizes, hence less tensors overall are calculated on bigger voxels (as more area is covered by one 3D voxel and a single dominant tensor is calculated per voxel) accounting for lower tract count, length, and volume when using a larger voxel size.
We hypothesize the significant increase in both femur and tibia fiber tract count, volume, and length after denoising isovolumetric 2 mm3 scans is due to the removal of intrinsically increased noise by the applied reconstruction algorithm. Diffusion metrics on the bigger voxel size in same subject scans, however, had better SNR and lower microscopic resolution which was not improved with the reconstruction algorithm. This may possibly explain the small changes in tract count and volume in both physis after reconstruction algorithm application, which weren’t significant. The change in femoral tract length after denoising the 2 mm x 2 mm x 3 mm voxel size was small yet statistically significant, suggesting tract length is more sensitive to small SNR changes when compared to tract volume and tract count. In previous femur and tibia physeal DTI studies evaluating growth, tract length results have been variable: showing poor interobserver reliability compared to other fiber tract diffusion metrics (count, volume, length and FA) evaluated in the same specimens [6], and it also did not show the expected change with age in animal models [6]; which could suggest tract length is susceptible to small changes.
FA is the measurement of the degree of restricted water diffusion, calculated from the eigen value of the diffusion tensor [22]. In brain white matter, FA has been seen to decrease steadily after 20 years of age. Previous studies on the knee physes, have shown increasing FA with age as the closing physes, now ossified cartilage, show greater water diffusion restriction [5,7]. FA contrasts the principal eigenvalues of diffusivity and is considered to be limited by noise, making it susceptible to voxel size effects [23]. A previous study evaluating FA in brain white matter fiber tracts in different subjects using increasing voxel sizes found voxel size to significantly affect FA with smaller voxels giving higher FA values and reporting the impact was strongest at the highest spatial resolutions [23]. These mirrors our findings where same subject mean femur and the tibia FA values were 0.34 and 0.36 (2 mm3) and 0.26 for both femur and tibia (2 mm x 2 mm x 3mm).
High noise levels can bias DTI measurements which can consequently produce errors in estimation of fiber tract parameters [24]. Low SNR can cause overestimation and underestimation of the largest and smallest eigenvalues, respectively [25]. A previous study evaluating DL noise reduction effects on FA in CNS structures in 20 patients, performed one image acquisition (NAQ1) versus five image acquisitions (NAQ5), and compared FA values after DL denoising was applied in NAQ1 [26]. They found FA to be overestimated when the number of image acquisitions was one (NAQ1), and after denoising NAQ1’s FA decreased and came closer to that of NAQ5 [26]. In our study, a similar decrease in FA values on both spatial resolutions after application of the DL reconstruction occurred likely due to noise elimination and the resultant increased signal, with greater signal achieved in the intrinsically noisier 2 mm3 spatial resolution explaining the greater drop in FA in the smaller voxel size (non-denoised versus denoised FA for the femur, 0.31 and 0.29, and the tibia, 0.36 to 0.34). This finding is also consistent with previous studies that low SNR leads to overestimation of FA on skeletal muscle [27] and the positive bias in FA values on peripheral nerve was removed after denoising [28].
We observed that the ROI SNR values for both the femur and tibia were higher when utilizing the larger voxel size (2mm x 2mm x 3mm), irrespective of denoising. This aligns with the acknowledged trade-off between spatial resolution and SNR. Initially we anticipated a higher increase in SNR after denoising the smaller voxel dimensions (2 mm3). The signal-to-noise ratio (SNR) quantitatively increased slightly more for the b600 images in the 2mm x 2mm x 3mm voxel size than for the 2 mm3. The 2mm x 2mm x 3mm demonstrated higher SNR before denoising, and the subsequent increase in SNR did not impact the metrics as observed in the smaller, noisier voxel dimensions.
This study is limited by the small sample size used. To address this, the methods could be replicated in a bigger subject population to determine if the effects observed are consistent. This study provides information to support the leveraging of denoising algorithms, such as AIRTM Recon DL, on DTI acquisition with smaller voxel volumes. The noise is reduced while preserving the higher spatial resolution, allowing for more accurate quantification of diffusion metrics. This approach could address the drawbacks of lower SNR associated with smaller voxel volumes and capitalizes on their better spatial resolutions. This allows clinicians a clearer view of growth plate tissue microstructures without sacrificing signal. In addition, it may be possible to take advantage of better image resolution without a greater acquisition time which is essential when imaging pediatric subjects. In cases where there will be various same subject acquisitions, FA values are more reliable when they are denoised than when they are not.
5. Conclusions
Leveraging denoising algorithms could address the drawbacks of lower SNR associated with smaller voxel volumes and capitalizes on their better spatial resolutions, allowing for more accurate quantification of diffusion metrics.
Author Contributions
Conceptualization, Laura Santos, Sachin Jambawalikar and Diego Jaramillo; Formal analysis, Sachin Jambawalikar; Investigation, Laura Santos, Hao-Yun Hsu, Ronald Nelson and Diego Jaramillo; Methodology, Laura Santos, Hao-Yun Hsu, Sachin Jambawalikar and Diego Jaramillo; Software, Ronald Nelson, Jaemin Shin, Maggie Fung and Marc Lebel; Supervision, Diego Jaramillo; Validation, Maggie Fung; Visualization, Hao-Yun Hsu and Brendan Sullivan; Writing – original draft, Laura Santos and Brendan Sullivan; Writing – review & editing, Sachin Jambawalikar, Brendan Sullivan and Diego Jaramillo.
Funding
This research was funded by both the Society for Pediatric Radiology Research and Education Foundation and National Institutes of Health R01 grant number HD104720.
Institutional Review Board Statement
The study was conducted in accordance with the Declaration of Helsinki, and approved by the Institutional Review Board (or Ethics Committee) of Columbia University Irving Medical Center (AAS988 approved 3.27.2020).
Informed Consent Statement
Informed consent and assent was obtained from all subjects and legal guardians respectively, involved in the study. Written informed consent has been obtained from the patients to publish this paper.
Data Availability Statement
Data generated and analyzed during this study are not publicly available due to subject imaging containing protected health but are available from the corresponding author on reasonable request.
Conflicts of Interest
Authors Jaemin Shin, Maggie Fung, and Marc Leber report a relationship with General Electric Company that includes employment. For the remaining authors none were declared. The funders had no role in the design of the study; in the collection, analyses, or interpretation of data; in the writing of the manuscript; or in the decision to publish the results.
References
- Soares JM, Marques P, Alves V, Sousa N. A hitchhiker's guide to diffusion tensor imaging. Front Neurosci. 2013, 7, 31. [Google Scholar] [CrossRef] [PubMed]
- Alexander AL, Lee JE, Lazar M, Field AS. Diffusion tensor imaging of the brain. Neurotherapeutics. 2007, 4, 316–329. [Google Scholar] [CrossRef] [PubMed]
- Vedantam A, Jirjis MB, Schmit BD, Wang MC, Ulmer JL, Kurpad SN. Diffusion tensor imaging of the spinal cord: insights from animal and human studies. Neurosurgery. 2014, 74, 1–8. [Google Scholar] [CrossRef] [PubMed]
- Jambawalikar S, Baum J, Button T, Li H, Geronimo V, Gould ES. Diffusion tensor imaging of peripheral nerves. Skeletal Radiol. 2010, 39, 1073–1079. [Google Scholar] [CrossRef]
- Jaimes C, Berman JI, Delgado J, Ho-Fung V, Jaramillo D. Diffusion-tensor imaging of the growing ends of long bones: pilot demonstration of columnar structure in the physes and metaphyses of the knee. Radiology 2014, 273, 491–501. [Google Scholar] [CrossRef]
- Kvist O, Damberg P, Dou Z, Berglund JS, Flodmark CE, Nilsson O, Diaz S. Magnetic resonance and diffusion tensor imaging of the adolescent rabbit growth plate of the knee. Magn Reson Med. 2023, 89, 331–342. [Google Scholar] [CrossRef] [PubMed] [PubMed Central]
- Bedoya MA, Delgado J, Berman JI, et al. Diffusion-Tensor Imaging of the Physes: A Possible Biomarker for Skeletal Growth-Experience with 151 Children. Radiology. 2017, 284, 210–218. [Google Scholar] [CrossRef] [PubMed]
- Delgado J, Jaramillo D, Chauvin NA, et al. Evaluating growth failure with diffusion tensor imaging in pediatric survivors of high-risk neuroblastoma treated with high-dose cis-retinoic acid. Pediatr Radiol. 2019, 49, 1056–1065. [Google Scholar] [CrossRef]
- Duong P, Mostoufi-Moab S, Raya JG, Jaimes C, Delgado J, Jaramillo D. Imaging Biomarkers of the Physis: Cartilage Volume on MRI vs. Tract Volume and Length on Diffusion Tensor Imaging. J Magn Reson Imaging. 2020, 52, 544–551. [Google Scholar] [CrossRef]
- Barrera CA, Bedoya MA, Delgado J, et al. Correlation between diffusion tensor imaging parameters of the distal femoral physis and adjacent metaphysis, and subsequent adolescent growth. Pediatr Radiol. 2019, 49, 1192–1200. [Google Scholar] [CrossRef]
- Jaramillo D, Duong P, Nguyen JC, et al. Diffusion Tensor Imaging of the Knee to Predict Childhood Growth. Radiology. 2022, 303, 655–663. [Google Scholar] [CrossRef]
- Zhao Q, Ridout RP, Shen J, Wang N. Effects of Angular Resolution and b Value on Diffusion Tensor Imaging in Knee Joint. Cartilage. 2021, 13 (2_suppl), 295S–303S. [Google Scholar] [CrossRef]
- Wang N, Mirando AJ, Cofer G, Qi Y, Hilton MJ, Johnson GA. Characterization complex collagen fiber architecture in knee joint using high-resolution diffusion imaging. Magn Reson Med. 2020, 84, 908–919. [Google Scholar] [CrossRef] [PubMed]
- Wang N, Mirando AJ, Cofer G, Qi Y, Hilton MJ, Johnson GA. Diffusion tractography of the rat knee at microscopic resolution. Magn Reson Med. 2019, 81, 3775–3786. [Google Scholar] [CrossRef]
- Mukherjee P, Chung SW, Berman JI, Hess CP, Henry RG. Diffusion tensor MR imaging and fiber tractography: technical considerations. AJNR Am J Neuroradiol. 2008, 29, 843–852. [Google Scholar] [CrossRef] [PubMed]
- Tournier JD, Smith R, Raffelt D, et al. MRtrix3: A fast, flexible and open software framework for medical image processing and visualisation. Neuroimage. 2019, 202, 116137. [Google Scholar] [CrossRef]
- O'Donnell LJ, Westin CF. An introduction to diffusion tensor image analysis. Neurosurg Clin N Am. 2011, 22, 185–viii. [Google Scholar] [CrossRef]
- Dhollander T, Raffelt D, Connelly A. Unsupervised 3-tissue response function estimation from single-shell or multi-shell diffusion MR data without a co-registered T1 image. ISMRM Workshop on Breaking the Barriers of Diffusion MRI 2016, 5. [Google Scholar]
- Tournier JD, Calamante F, Connelly A. Robust determination of the fibre orientation distribution in diffusion MRI: non-negativity constrained super-resolved spherical deconvolution. Neuroimage. 2007, 35, 1459–1472. [Google Scholar] [CrossRef]
- Wang ZJ, Yamamura J, Keller S. Signal-to-noise ratio assessment of muscle diffusion tensor imaging using single image set and validation by the difference image method. Br J Radiol. 2019, 92, 20190133. [Google Scholar] [CrossRef]
- Mulder MJ, Keuken MC, Bazin PL, Alkemade A, Forstmann BU. Size and shape matter: The impact of voxel geometry on the identification of small nuclei. PLoS One. 2019, 14, e0215382. [Google Scholar] [CrossRef] [PubMed]
- Kaplan, P.E. Fractional Anisotropy. In Encyclopedia of Clinical Neuropsychology; Kreutzer, J.S., DeLuca, J., Caplan, B., Eds.; Springer: New York, NY, USA, 2011. [Google Scholar] [CrossRef]
- R. Gattu, Z. Latif, Z. Kou, et al. Effect of Voxel Size on DTI Fractional Anisotropy. Proc. Intl. Soc. Mag. Reson. Med. 2009, 17. Available online: https://archive.ismrm.org/2009/3579.html (accessed on 21 June 2023).
- St-Jean S, Coupé P, Descoteaux M. Non Local Spatial and Angular Matching: Enabling higher spatial resolution diffusion MRI datasets through adaptive denoising. Med Image Anal. 2016, 32, 115–130. [Google Scholar] [CrossRef] [PubMed]
- Seo Y, Rollins NK, Wang ZJ. Reduction of bias in the evaluation of fractional anisotropy and mean diffusivity in magnetic resonance diffusion tensor imaging using region-of-interest methodology. Sci Rep. 2019, 9, 13095. [Google Scholar] [CrossRef] [PubMed]
- Sagawa H, Fushimi Y, Nakajima S, et al. Deep Learning-based Noise Reduction for Fast Volume Diffusion Tensor Imaging: Assessing the Noise Reduction Effect and Reliability of Diffusion Metrics. Magn Reson Med Sci. 2021, 20, 450–456. [Google Scholar] [CrossRef]
- Froeling M, Nederveen AJ, Nicolay K, Strijkers GJ. DTI of human skeletal muscle: the effects of diffusion encoding parameters, signal-to-noise ratio and T2 on tensor indices and fiber tracts. NMR Biomed. 2013, 26, 1339–1352. [Google Scholar] [CrossRef]
- Sneag DB, Zochowski KC, Tan ET, et al. Denoising of diffusion MRI improves peripheral nerve conspicuity and reproducibility. J Magn Reson Imaging. 2020, 51, 1128–1137. [Google Scholar] [CrossRef]
Figure 1.
Same subject DTI acquisition using voxel sizes of 2 mm3 and 2mm x 2mm x 3m.
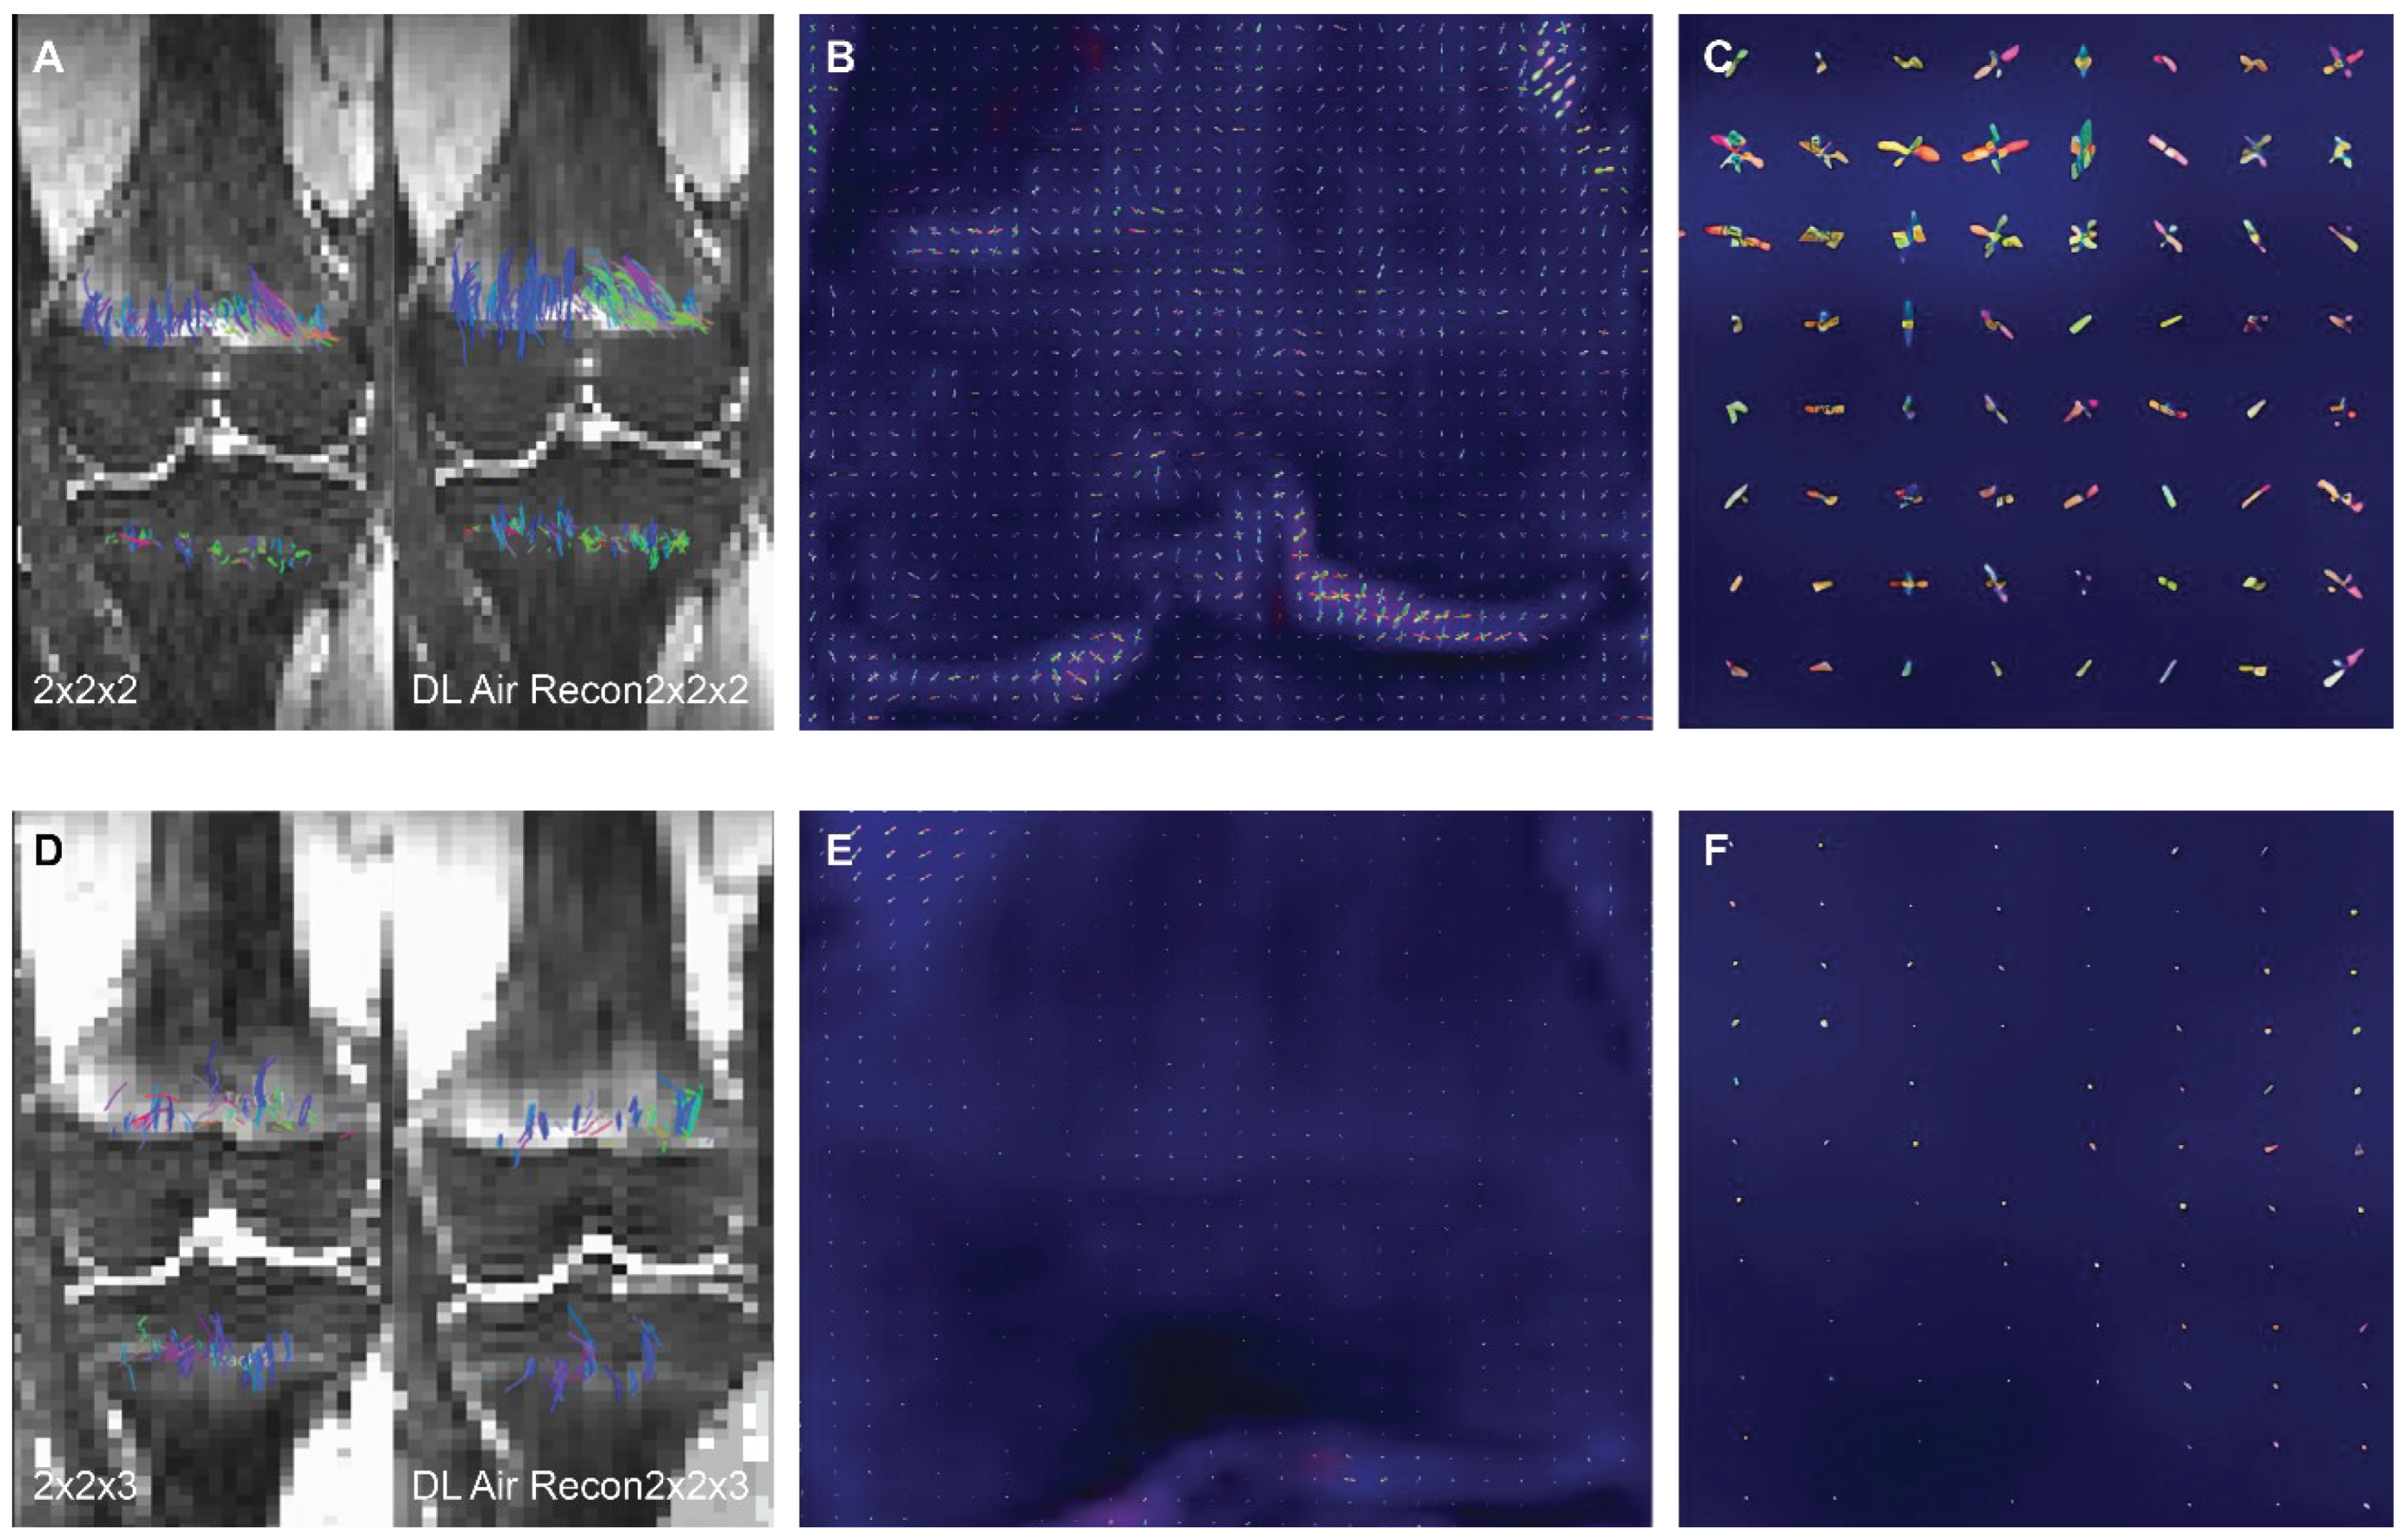
Figure 2.
Bland-Altman plots: difference in DTI metrics for same physeal ROIs between DL reconstructed-and non-denoised (Non-DL) image DTIs.
Figure 2.
Bland-Altman plots: difference in DTI metrics for same physeal ROIs between DL reconstructed-and non-denoised (Non-DL) image DTIs.
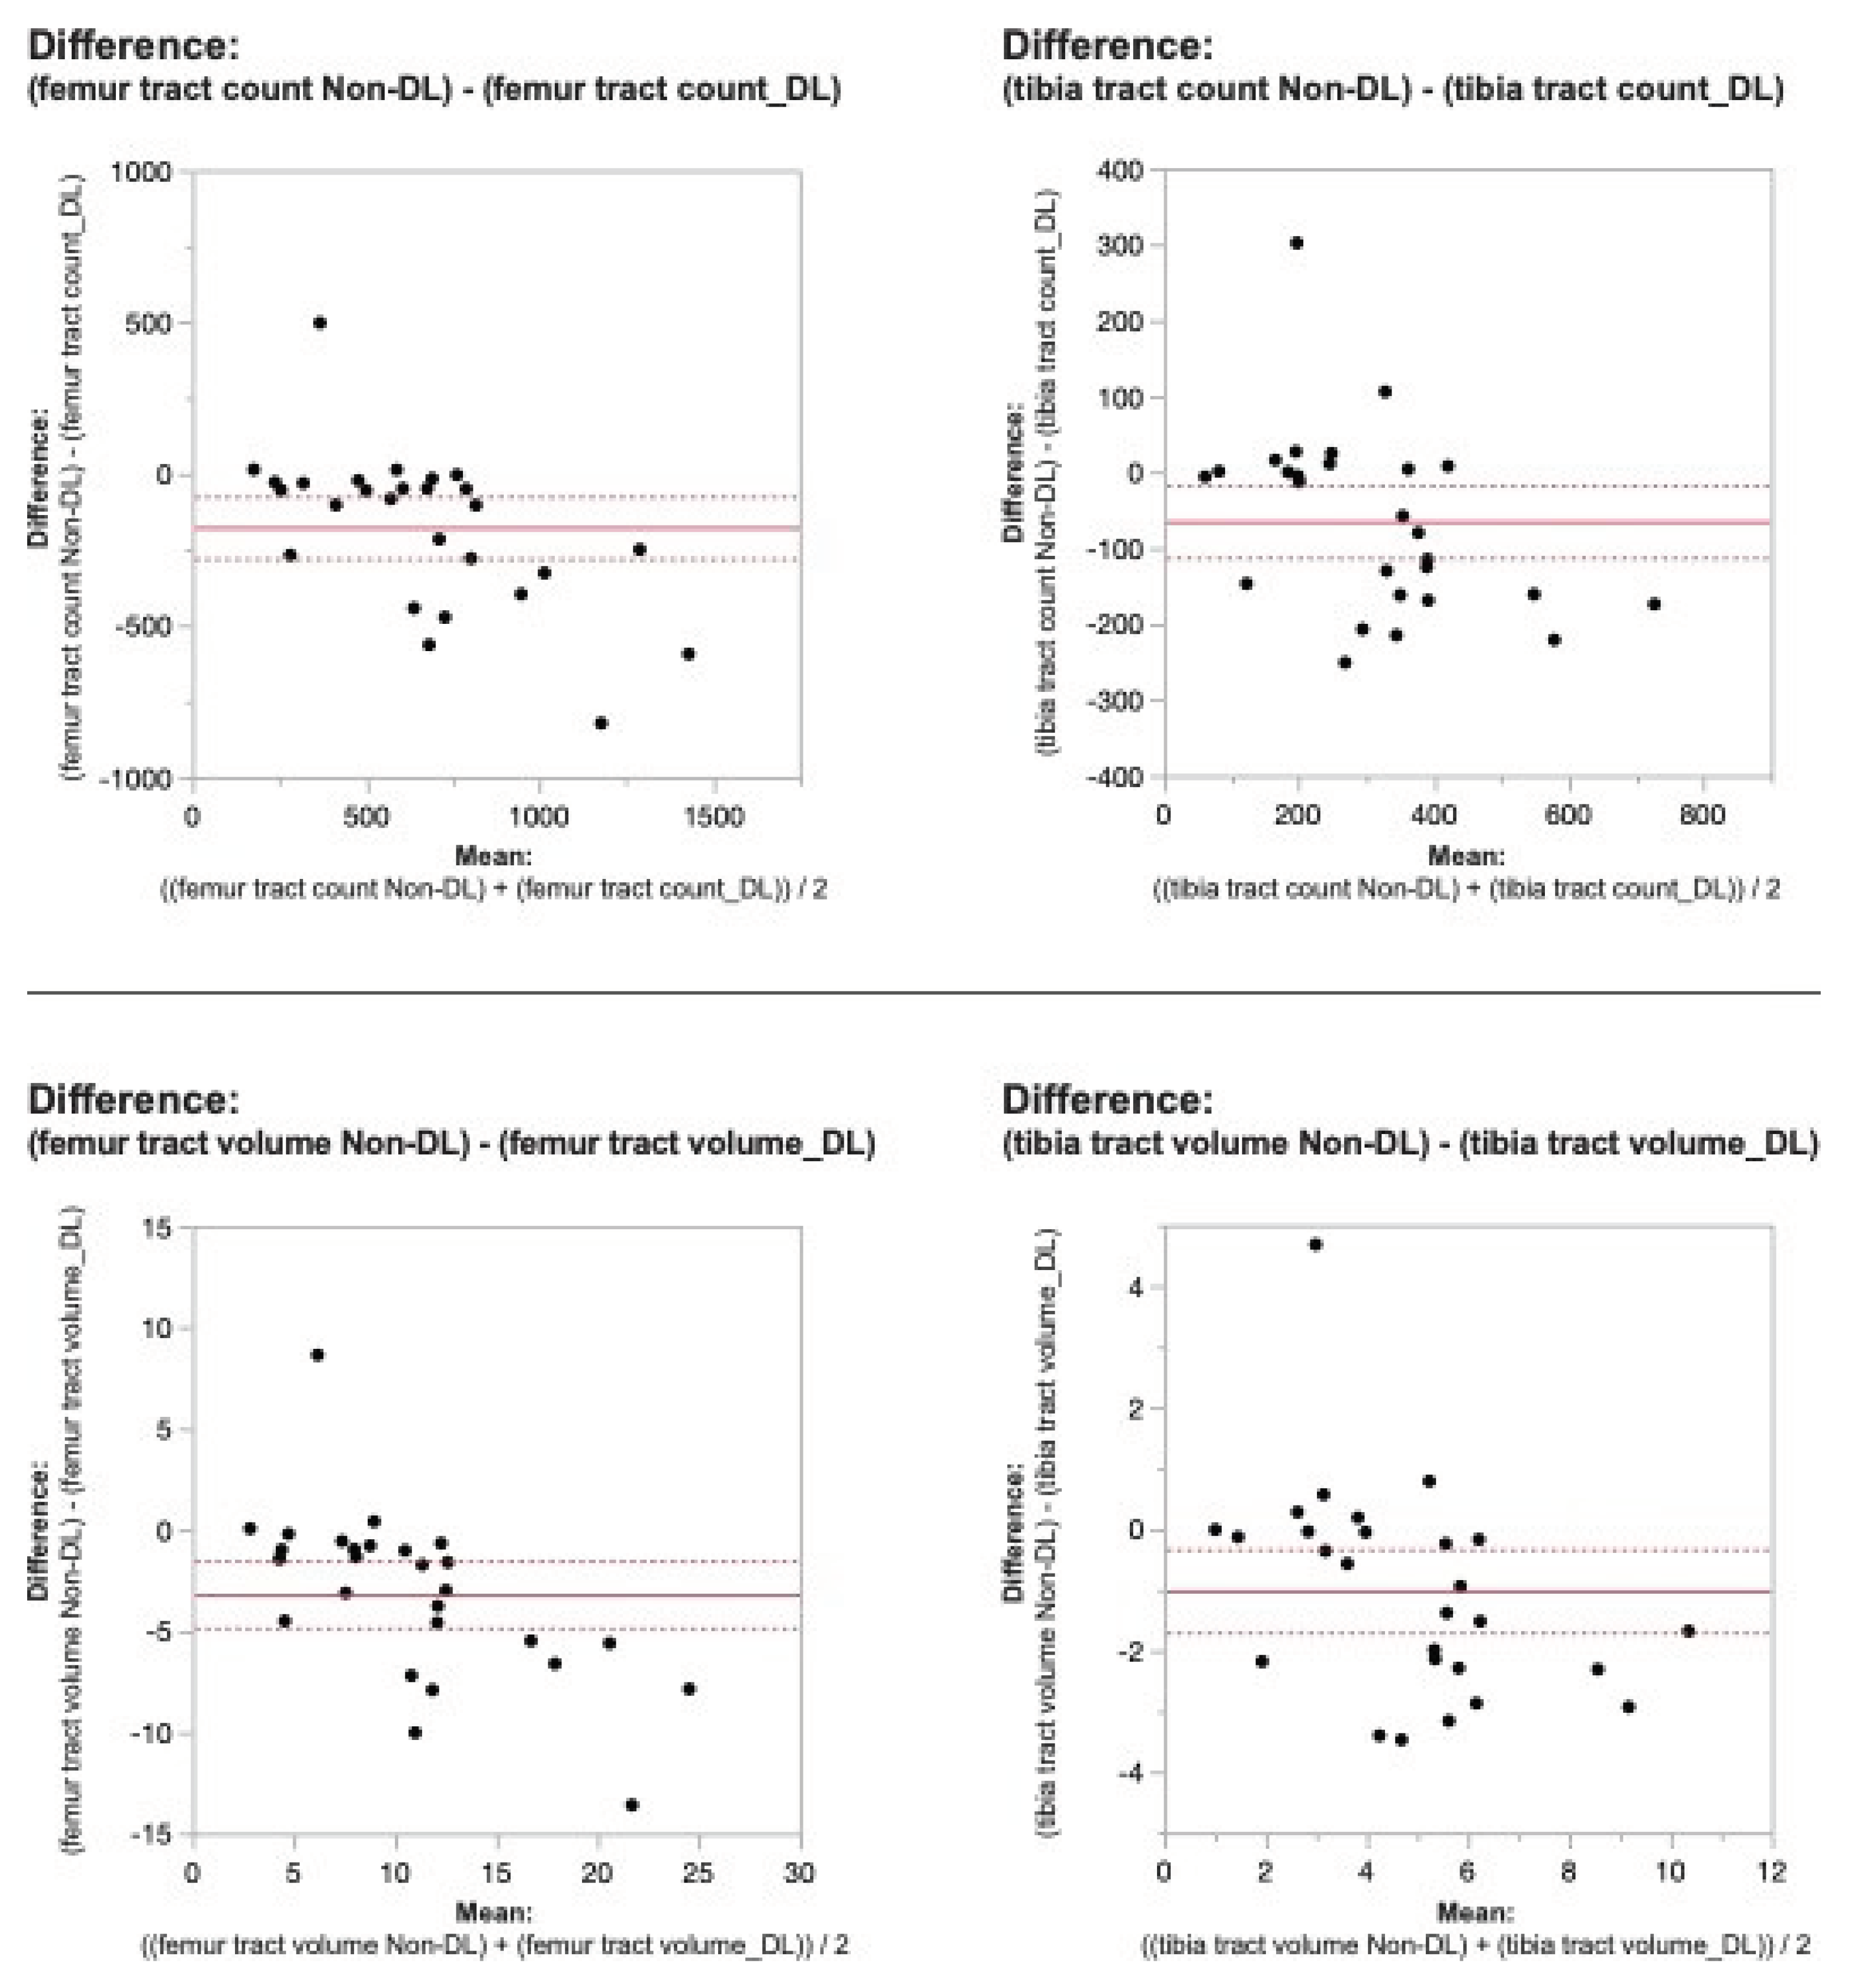
Figure 3.
Bland-Altman plots regarding the difference in DTI metrics for same physeal ROIs between DL reconstructed-and non-denoised (Non-DL) image DTIs.
Figure 3.
Bland-Altman plots regarding the difference in DTI metrics for same physeal ROIs between DL reconstructed-and non-denoised (Non-DL) image DTIs.
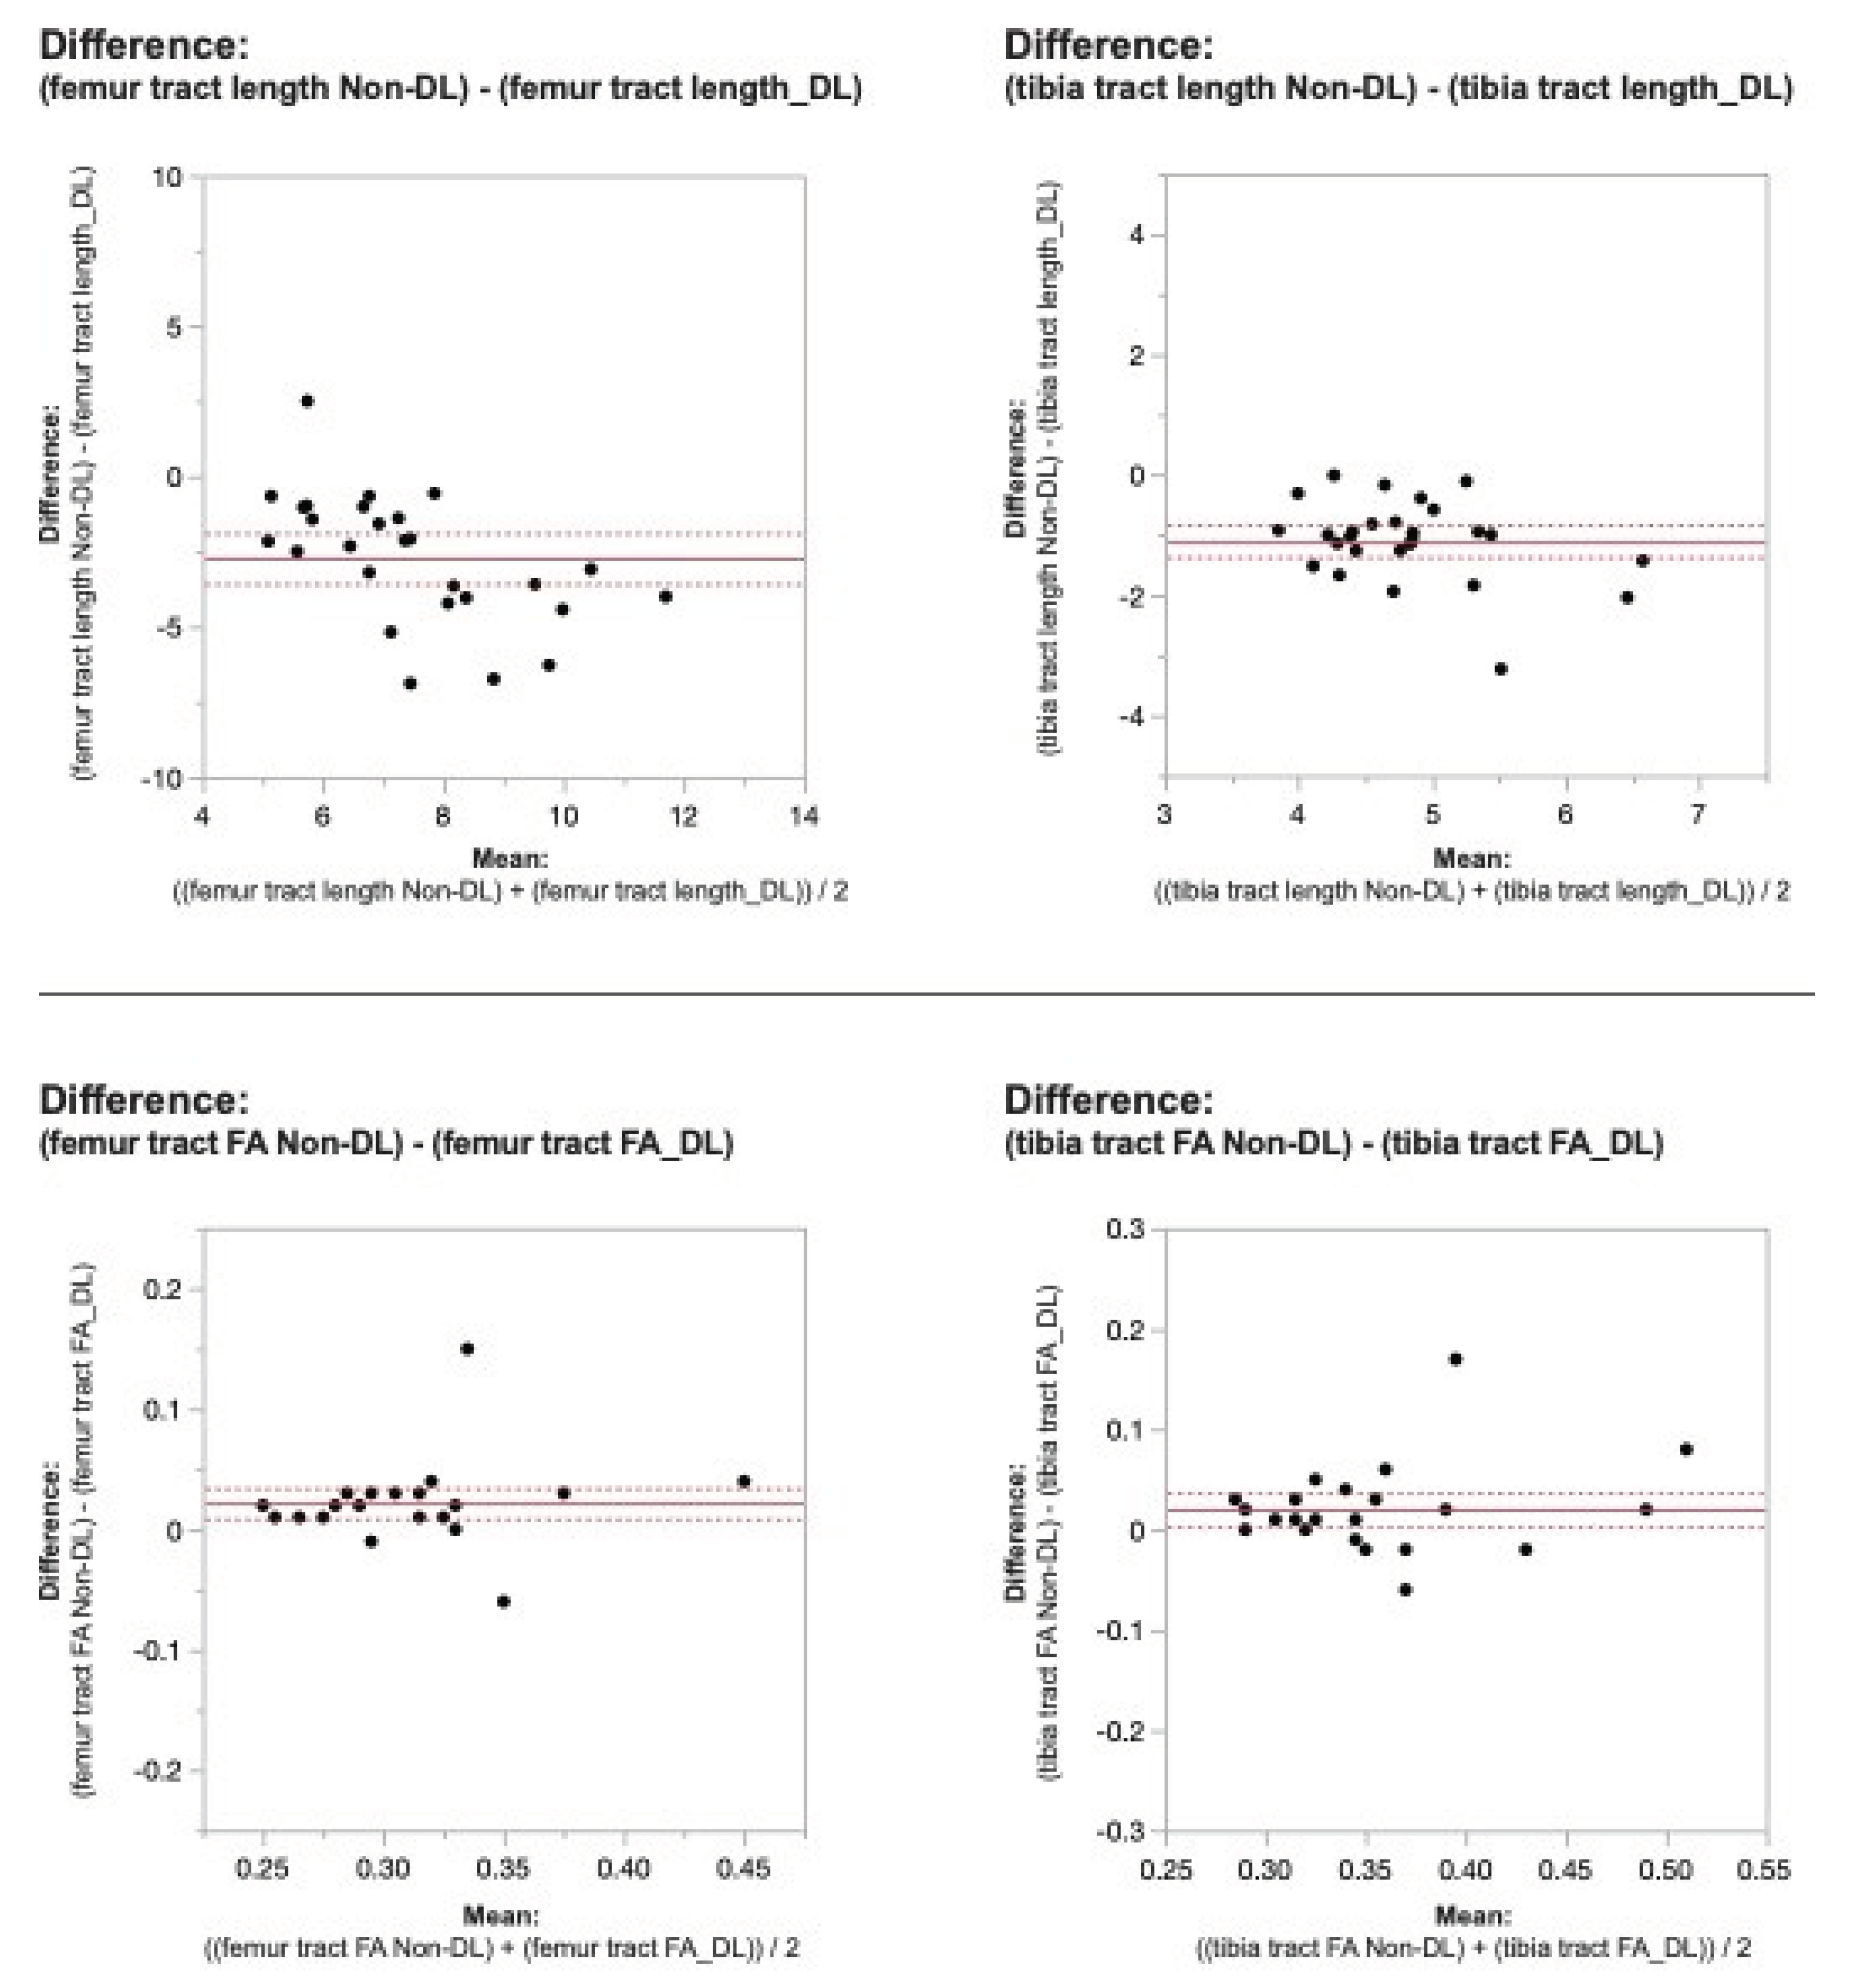
Figure 4.
Bland-Altman plots regarding the difference in DTI metrics for same physeal ROIs between DL reconstructed and non-denoised (Non-DL) DTIs.
Figure 4.
Bland-Altman plots regarding the difference in DTI metrics for same physeal ROIs between DL reconstructed and non-denoised (Non-DL) DTIs.
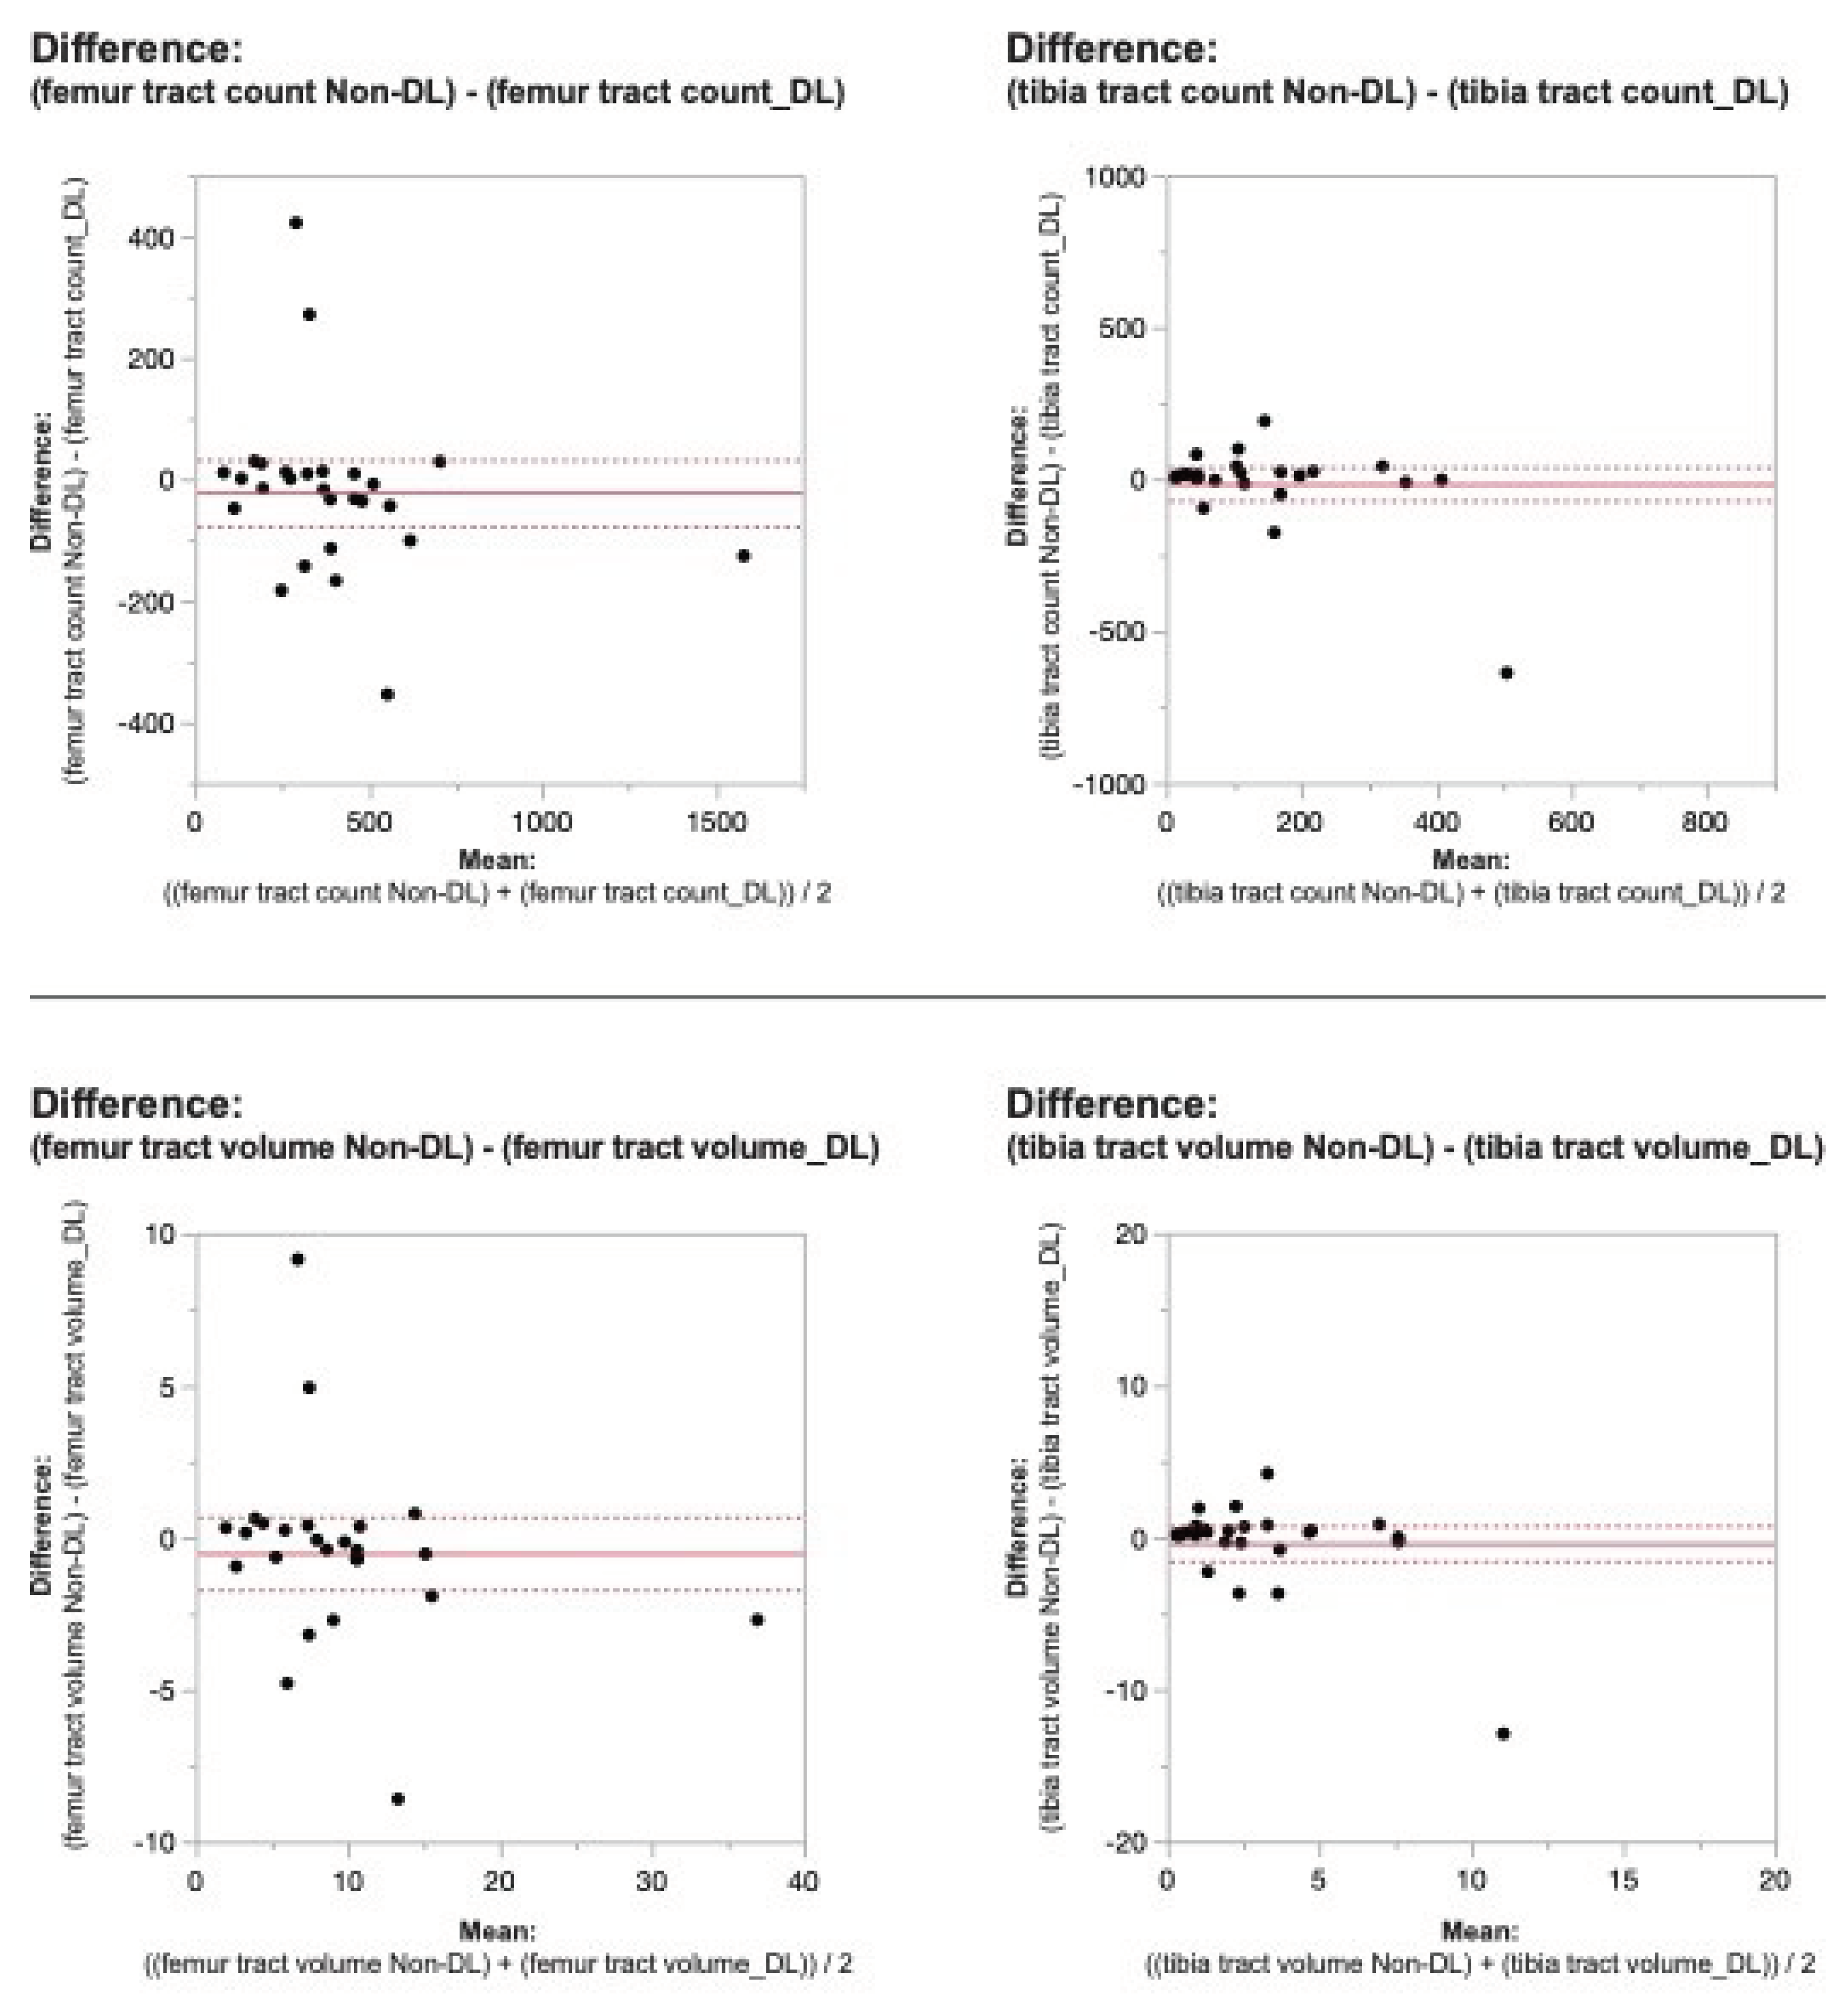
Figure 5.
Bland-Altman plots regarding the difference in DTI metrics for same physeal ROIs between DL reconstructed and non-denoised (Non-DL) DTIs.
Figure 5.
Bland-Altman plots regarding the difference in DTI metrics for same physeal ROIs between DL reconstructed and non-denoised (Non-DL) DTIs.
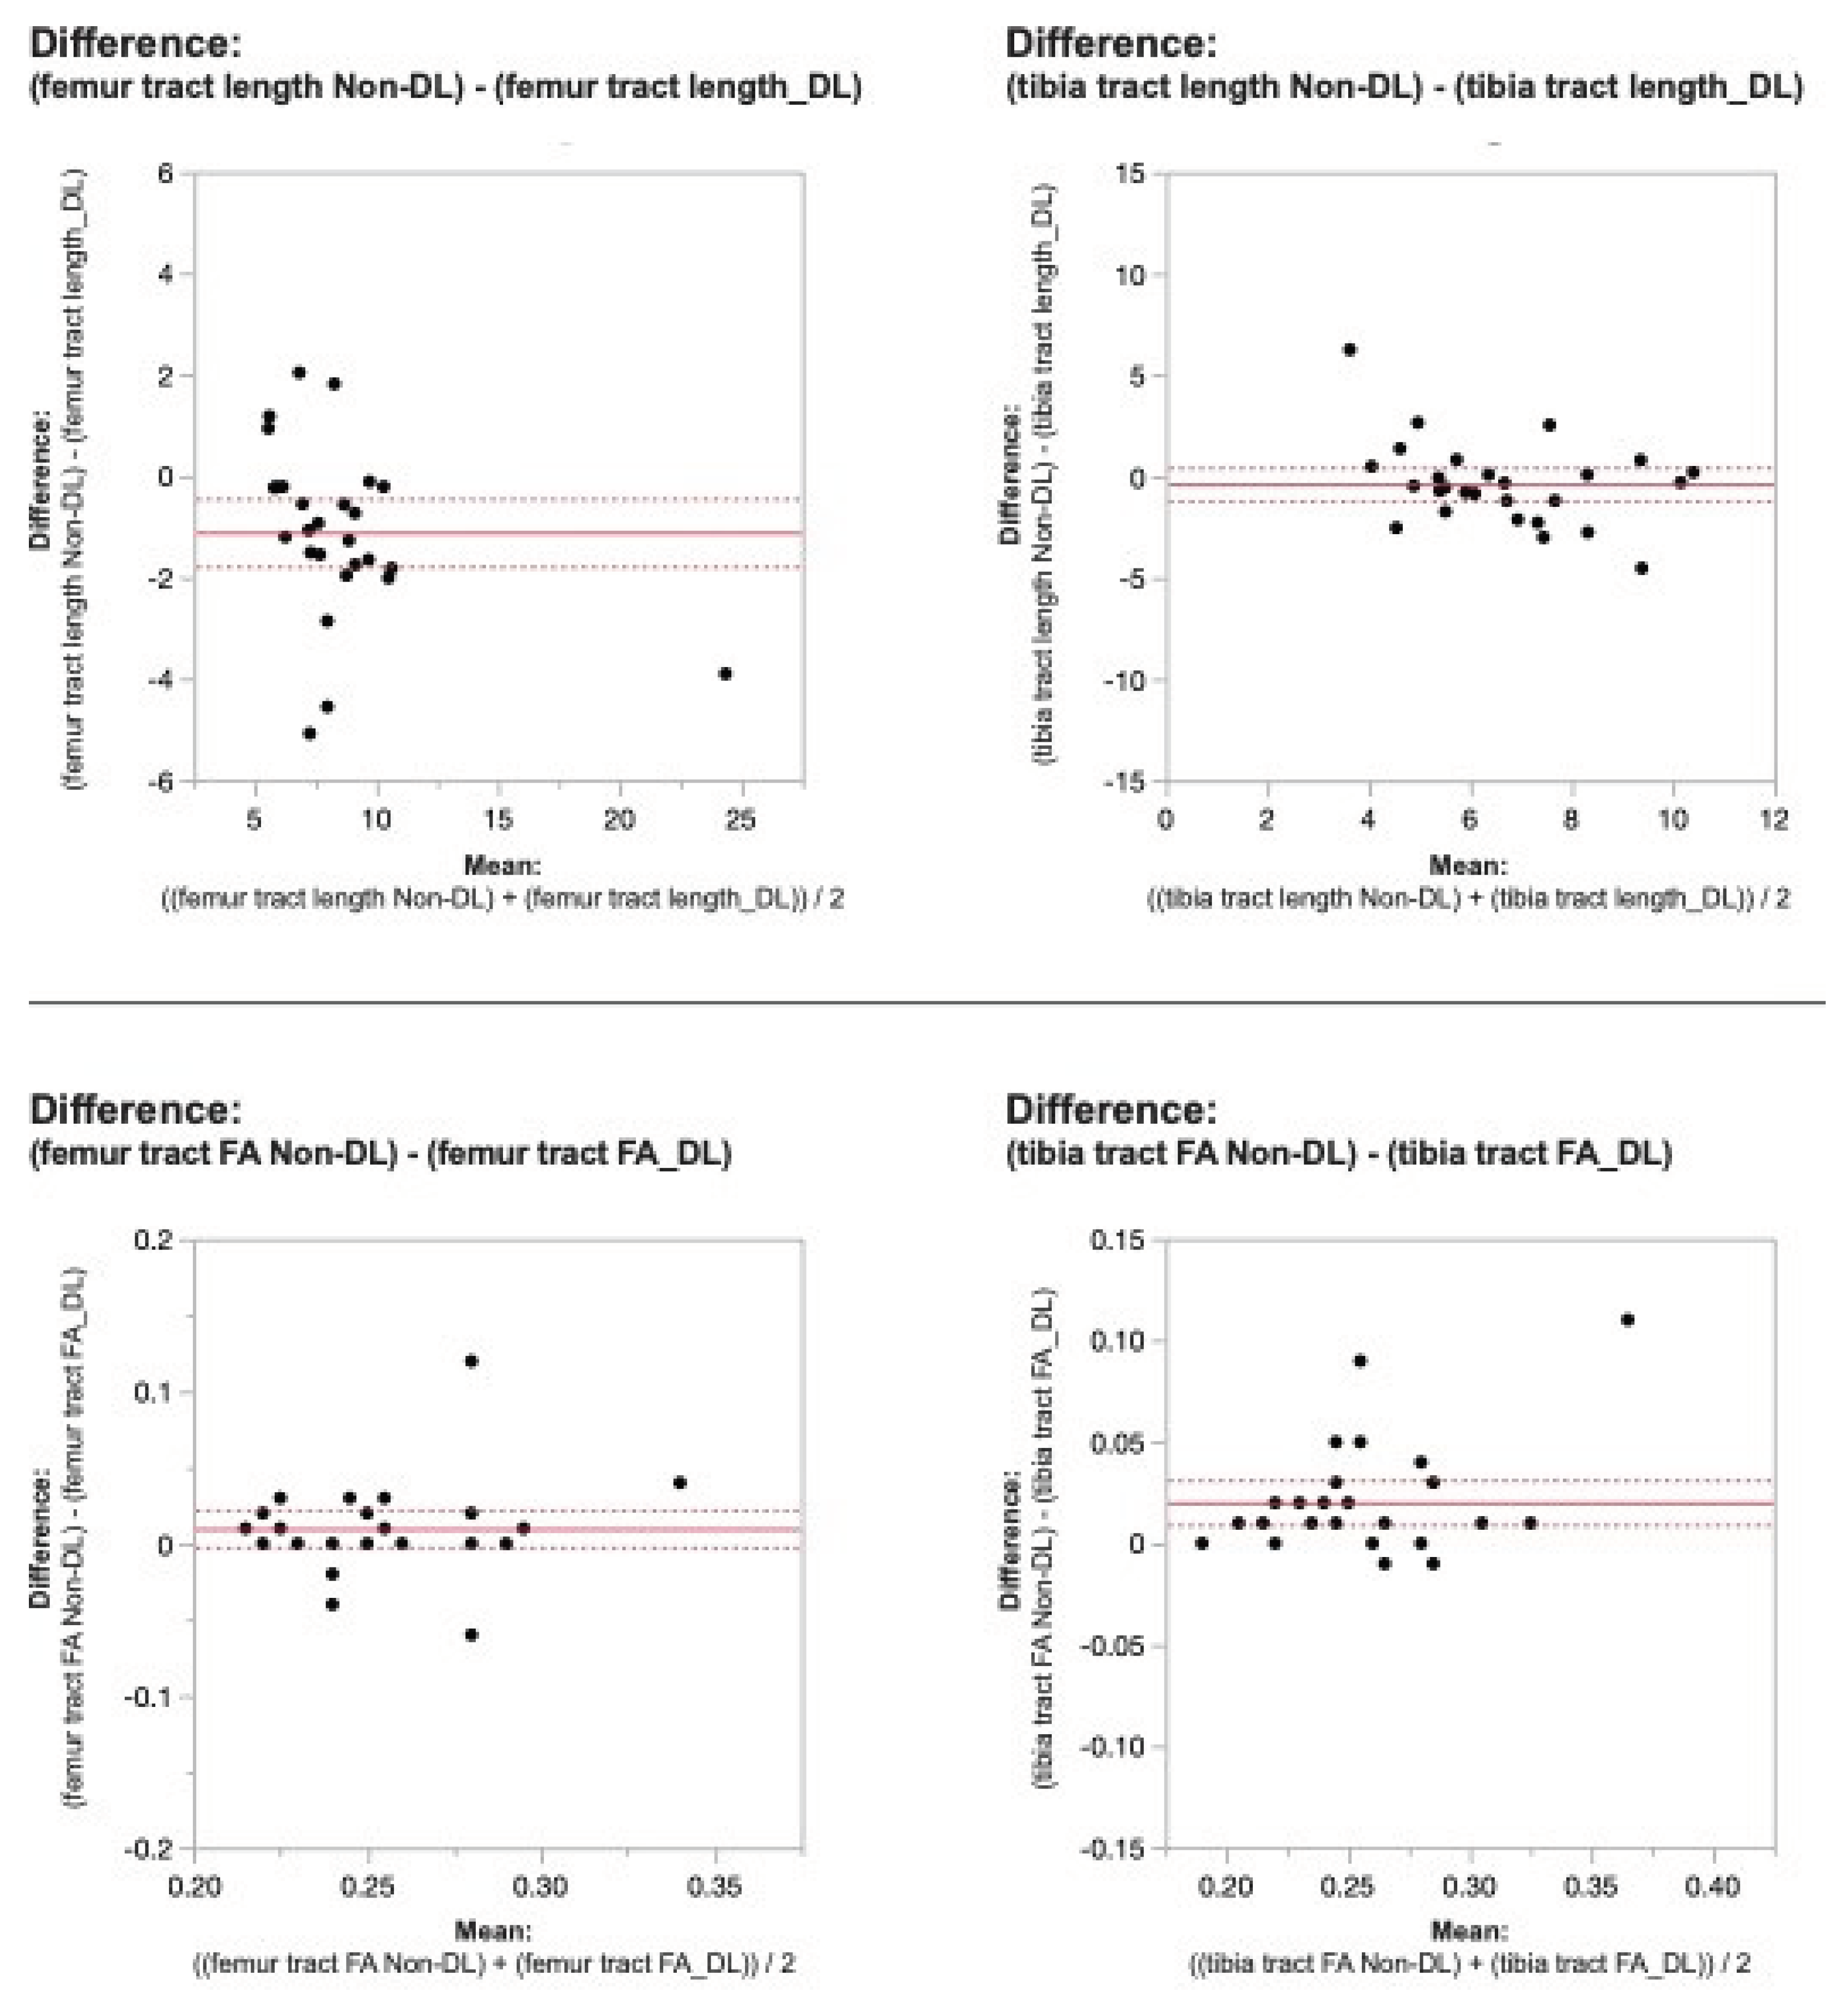
Figure 6.
(a). Tractography changes in non-denoised and denoised 2 mm3 versus non-denoised and denoised 2 mm x 2mm x 3 mm in a 9-year-old female. (b): Tractography changes in non-denoised and denoised 2 mm3 versus non-denoised and denoised 2 mm x 2mm x 3 mm in a 10-year-old male.
Figure 6.
(a). Tractography changes in non-denoised and denoised 2 mm3 versus non-denoised and denoised 2 mm x 2mm x 3 mm in a 9-year-old female. (b): Tractography changes in non-denoised and denoised 2 mm3 versus non-denoised and denoised 2 mm x 2mm x 3 mm in a 10-year-old male.
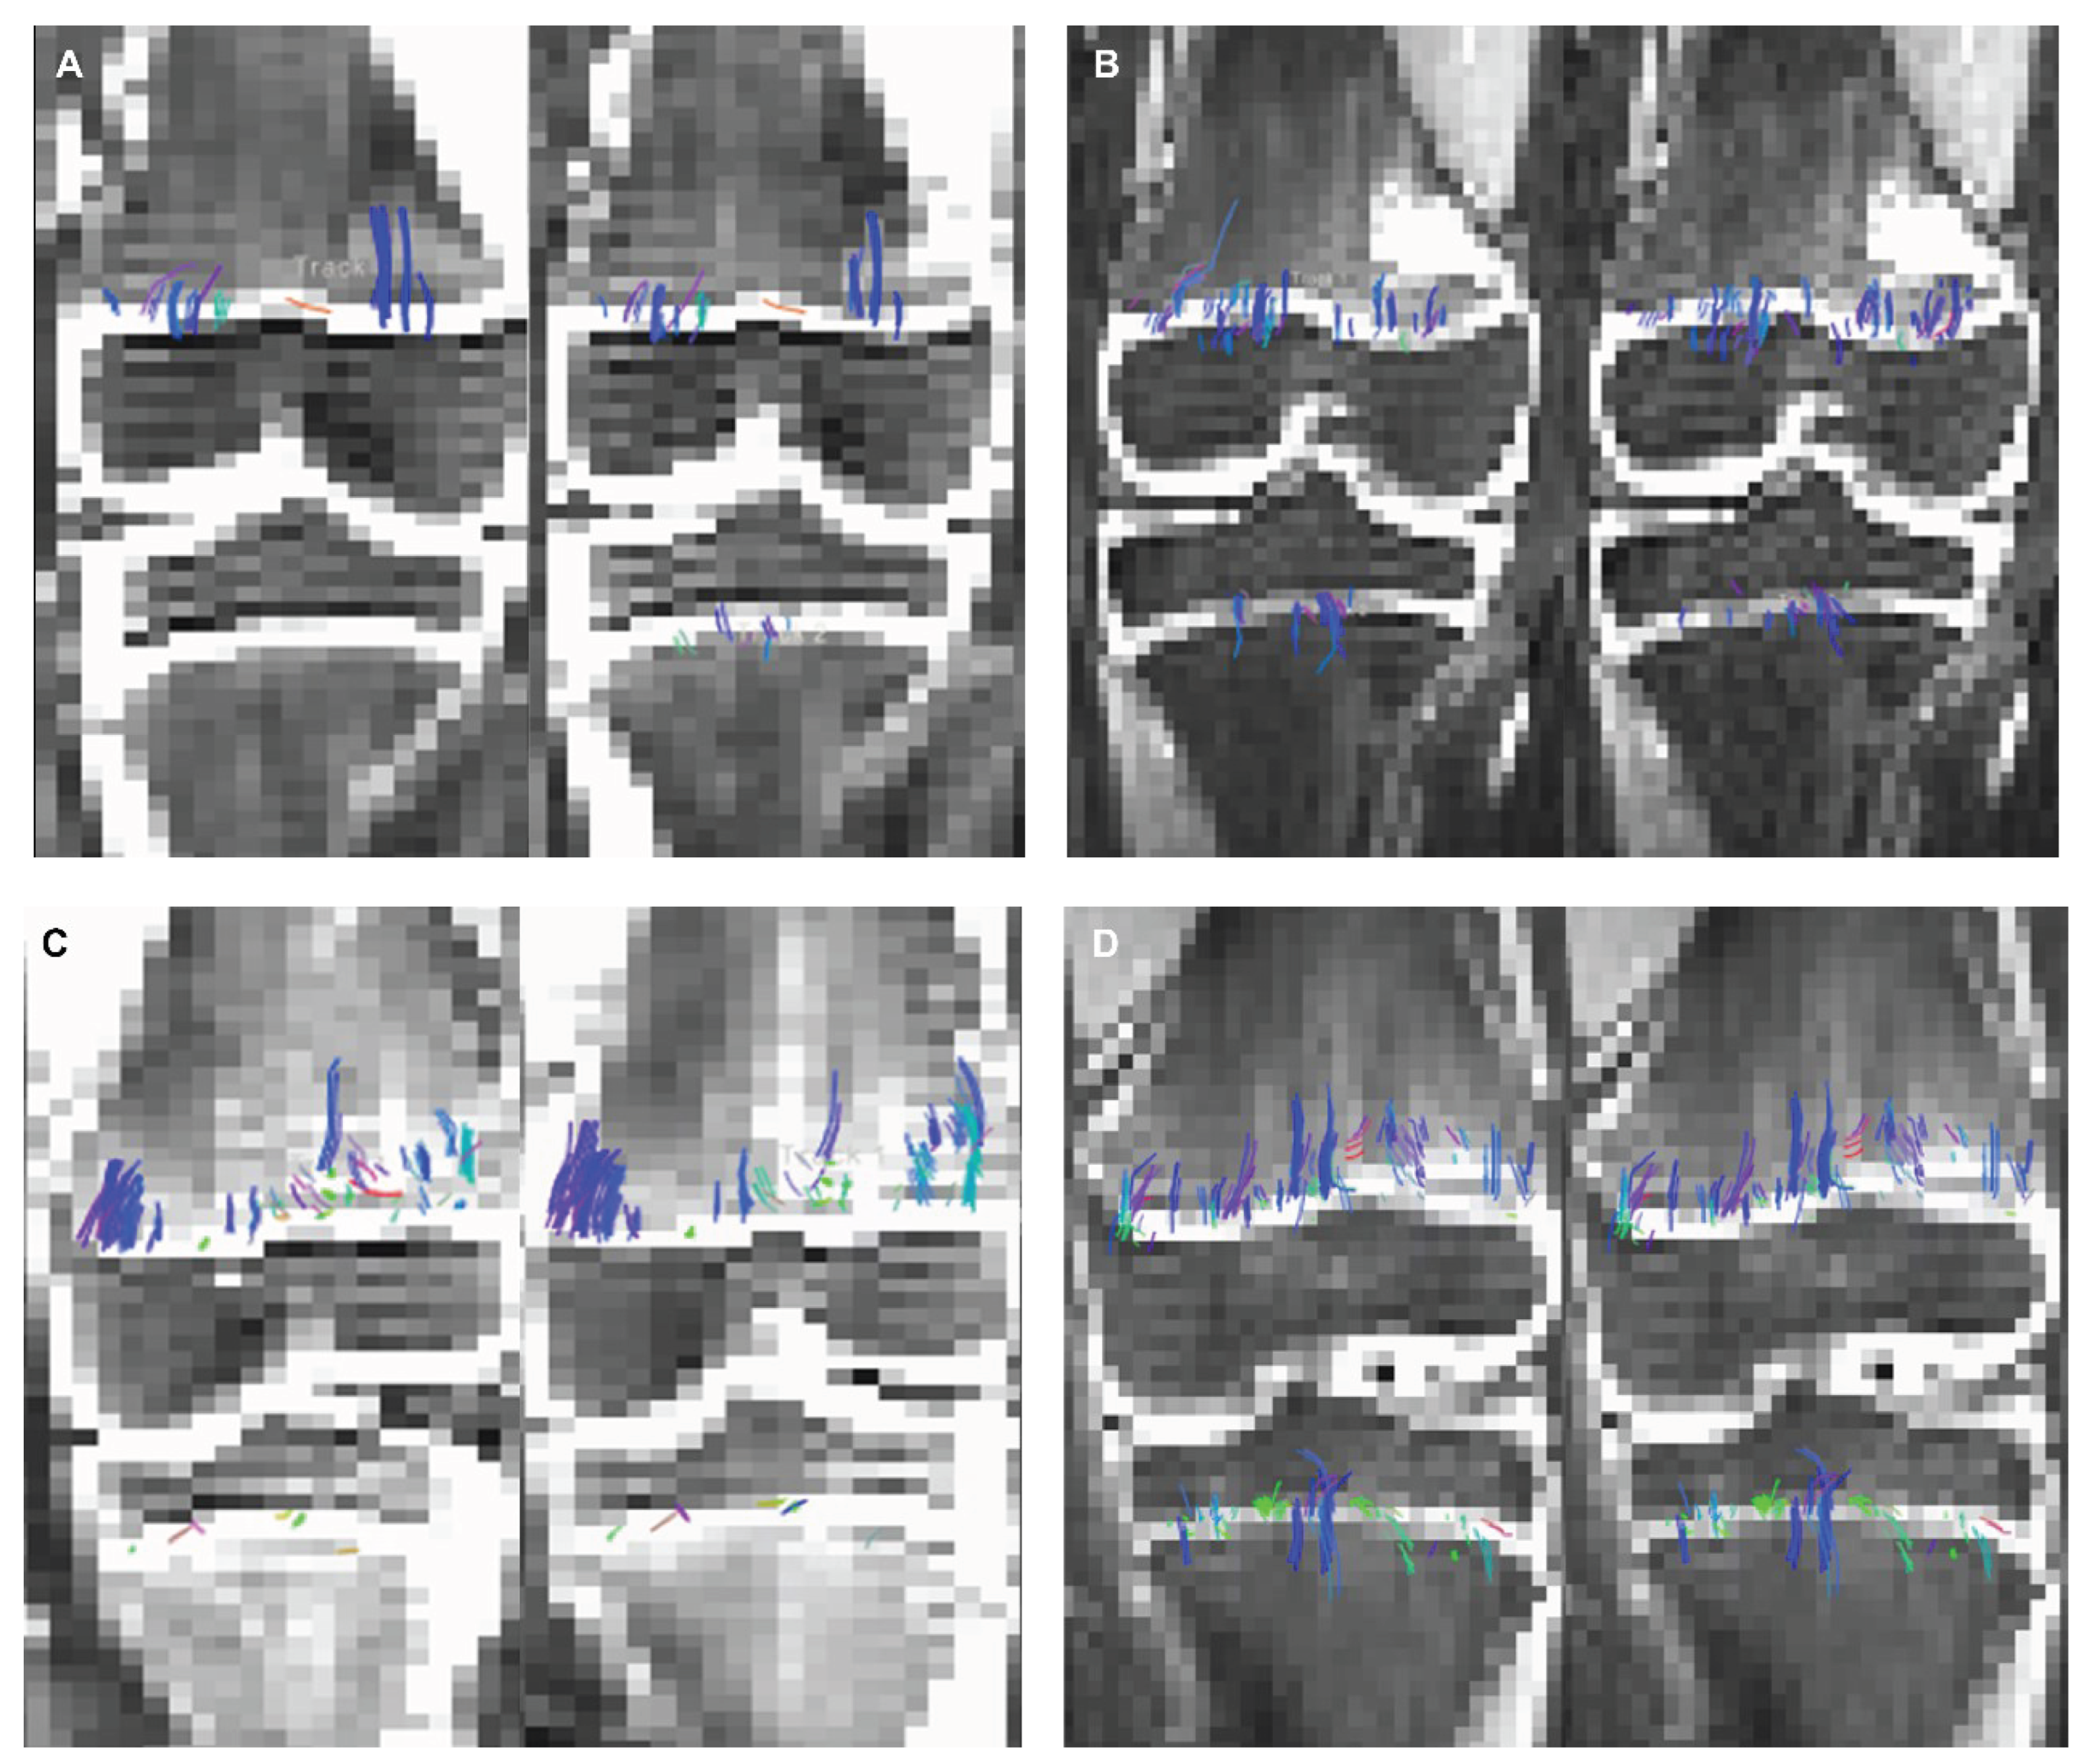

Table 1.
2 mm3 versus 2 mm x 2 mm x 3 mm denoised versus raw data DTI metrics.
| DTI METRIC | AIr Recon DL | AIr Recon DL | p-value |
|---|---|---|---|
| Isovolumetric 2 mm3 | 2 mm x 2 mm x 3 mm | ||
| femur tract count | 753.03 ± 409.17 | 410.37 ± 308.29 | <0.0001* |
| femur tract volume | 12.47 ± 7.05 | 9.52 ± 7.17 | <0.0006* |
| femur tract length | 8.83 ± 2.48 | 9.07 ± 3.93 | 0.9 |
| femur FA | 0.29 ± 0.04 | 0.25 ± 0.02 | <0.0001* |
| tibia tract count | 341.62 ± 187.3 | 137.44 ± 177.31 | <0.0001* |
| tibia tract volume | 5.34 ± 2.7 | 4.50 ± 8.36 | 0.0005* |
| tibia tract length | 5.36 ± 0.84 | 6.81 ± 2.42 | 0.002* |
| tibia FA | 0.34 ± 0.05 | 0.24 ± 0.03 | <0.0001* |
| DTI METRIC | Raw Data | Raw Data | p-value |
| Isovolumetric 2 mm3 | 2 mm x 2mm x 3 mm | ||
| femur tract count | 576.85 ±257.21 | 388.62 ± 274.57 | <0.0001* |
| femur tract volume | 9.3 ± 4.45 | 9.03 ± 6.4 | 0.13 |
| femur tract length | 6.11 ± 1.39 | 7.96 ± 3.25 | 0.001* |
| femur FA | 0.31 ± 0.04 | 0.26 ± 0.03 | 0.0001* |
| tibia tract count | 277.22 ± 133.89 | 123.44 ± 112.03 | 0.0001* |
| tibia tract volume | 4.33 ± 1.99 | 2.74 ± 2.2 | 0.0001* |
| tibia tract length | 4.26 ±0.62 | 6.43 ± 1.75 | 0.0001* |
| tibia FA | 0.36 ± 0.06 | 0.26 ± 0.04 | 0.0001* |
Table 2.
Raw data versus DL denoised DTI metrics.
| DTI METRIC | Raw Data | AIr Recon DL | p-value |
|---|---|---|---|
| Isovolumetric 2 mm3 | isovolumetric 2 mm3 | ||
| femur tract count | 576.85 | 753.03 | < 0.0001* |
| femur tract volume | 9.3 | 12.47 | < 0.0001* |
| femur tract length | 6.11 | 8.83 | < 0.0001* |
| femur FA | 0.31 | 0.29 | < 0.0001* |
| tibia tract count | 277.22 | 341.62 | 0.013* |
| tibia tract volume | 4.33 | 5.34 | 0.001* |
| tibia tract length | 4.26 | 5.36 | <0.0001* |
| tibia FA | 0.36 | 0.34 | 0.005* |
| DTI METRIC | Raw Data | AIr Recon DL | p-value |
| 2 mm x 2mm x 3 mm | 2mm x2mm x 3mm | ||
| femur tract count | 388.62 | 410.37 | 0.1 |
| femur tract volume | 9.03 | 9.52 | 0.14 |
| femur tract length | 7.96 | 9.07 | 0.001* |
| femur FA | 0.26 | 0.25 | 0.017* |
| tibia tract count | 123.44 | 137.44 | 0.14 |
| tibia tract volume | 2.74 | 4.5 | 0.29 |
| tibia tract length | 6.43 | 6.81 | 0.16 |
| tibia FA | 0.26 | 0.24 | < 0.0001* |
Wilcoxon signed rank test, P-value <0.05 was considered significant (*).
Table 3.
SNR values in the non-denoised femur and tibia ROIs: 2mm x 2mm x 3mm voxel dimension compared to 2 mm3 voxel size.
Table 3.
SNR values in the non-denoised femur and tibia ROIs: 2mm x 2mm x 3mm voxel dimension compared to 2 mm3 voxel size.
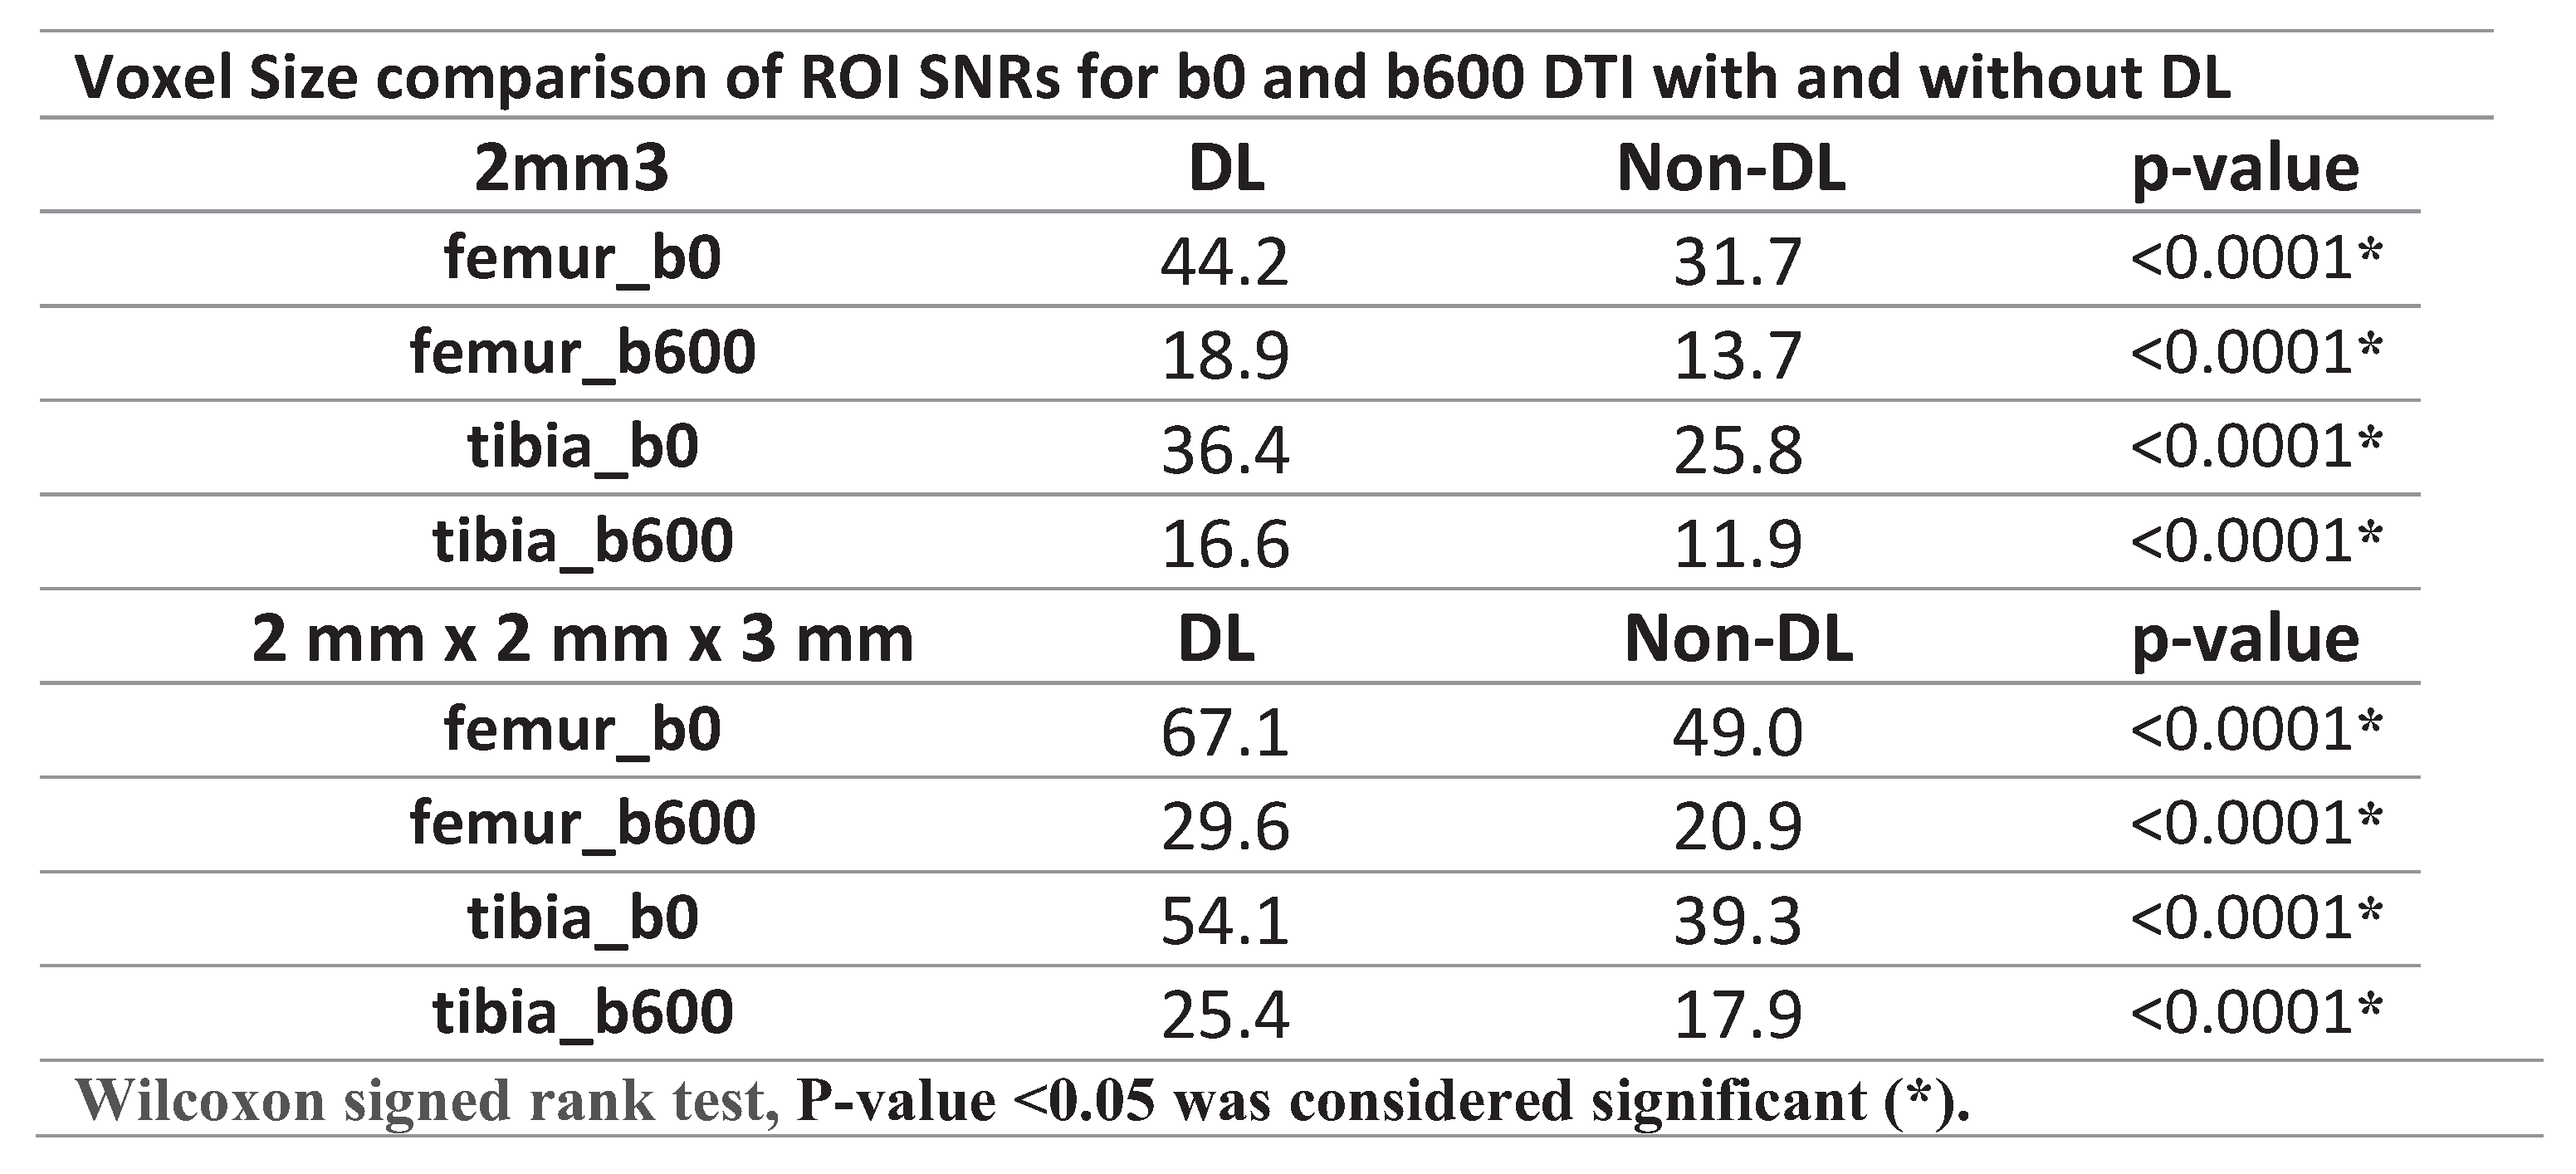 |
Table 4.
SNR Increase.
 |
Disclaimer/Publisher’s Note: The statements, opinions and data contained in all publications are solely those of the individual author(s) and contributor(s) and not of MDPI and/or the editor(s). MDPI and/or the editor(s) disclaim responsibility for any injury to people or property resulting from any ideas, methods, instructions or products referred to in the content. |
© 2024 by the authors. Licensee MDPI, Basel, Switzerland. This article is an open access article distributed under the terms and conditions of the Creative Commons Attribution (CC BY) license (http://creativecommons.org/licenses/by/4.0/).
Copyright: This open access article is published under a Creative Commons CC BY 4.0 license, which permit the free download, distribution, and reuse, provided that the author and preprint are cited in any reuse.


