
Submitted:
23 February 2024
Posted:
26 February 2024
You are already at the latest version
Abstract
The age-related loss of muscle mass and strength is referred to as “sarcopenia”. The combined effect of sarcopenia and osteoporosis is a devastating threat to the old adult, accounting for reduced mobility, risk for falls and subsequent fractures. In previous studies, we observed a high degree of inter-individual variability of paraspinal muscle fatty infiltration, one most relevant index of muscle wasting. This aspect solicited us to develop a computerized method to quantitatively characterize muscle fatty infiltration in aging and diseases.
Magnetic resonance images of paraspinal muscles from 58 women of different age (age range 23-85 years) and physio-pathological status (healthy young, pre-menopause, post-menopause, and os-teoporosis), were used to set up the method. It is based on fractal analysis of lean muscle area (contractile muscle) to estimate muscle fatty infiltration. In particular, lacunarity was computed by parameter β from our hyperbola model function, used to fit the GBA (gliding box algorithm) curvilinear plot. Succolarity was estimated by parameter µ, for the four main directions, through an algorithm implemented on purpose.
Results show that fractal lacunarity, by quantifying muscle fatty infiltration, can discriminate be-tween osteoporosis and healthy aging while succolarity can separate the other three groups showing similar lacunarity. Therefore, fractal features of contractile muscle, by measuring fatty infiltration, can represent good indices of sarcopenia in aging and disease.
Keywords:
aging
; biocomplexity
; biomarkers
; fractal
; fatty infiltration
; lacunarity
; magnetic resonance imaging
; muscle
; sarcopenia
; succolarity.
1. Introduction
Aging is characterized by a progressive structural and functional decline at different levels. Such a decline also affects musculoskeletal apparatus. Quantitative and qualitative changes occurring at skeletal muscles with aging account for increased prevalence of disability, increased risk of morbidity and mortality in the elderly [1,2,3,4]. The term sarcopenia was introduced by Rosenberg in 1989 [5,6] to define the age-related loss of muscle mass. More recently, sarcopenia has been defined as “a syndrome characterized by a progressive and generalized loss of skeletal muscle mass and strength with a risk of adverse outcomes such as physical disability, poor quality of life and death” [7,8]. Past the age of 50 years, the rate of muscle loss ranges within 1-2% a year. It would account for 25% and 40% sarcopenic people after the age of 70 and 80 years, respectively [9,10]. The term myopenia has been proposed to define a clinically relevant degree of muscle wasting characterized by a rapid loss of muscle mass in a short time (i.e. more than 5% in 6-12 months) in association with impaired functional capacity and/or increased risk of morbidity and mortality [11].
Several aspects other than muscle size concur to the loss of physical activity strength in the etiology of disability. A combination of both neurological and muscular factors contributes to the decline of muscle strength [12,13,14,15]: muscle atrophy, reduced contractile quality due to changes in the myofibrillar machinery, and fatty infiltration of contractile muscle also concur to the decrease of muscle strength [3,4,12,16].
Among several techniques proposed for muscle assessment [17], three main medical imaging techniques have been used to estimate muscle mass variation with aging: computer tomography (CT), magnetic resonance imaging (MRI), and dual-energy X-ray absorptiometry (DXA). Although CT and MRI represent the gold standards for muscle mass estimate, their application has been limited to the research field while DXA has been chosen for clinical use [18,19]. In fact, DXA, in spite of providing surrogate estimates of both regional and whole-body skeletal muscle mass, is widely diffused as it can be used at low cost and with minimal radiation exposure. Both CT and MRI represent imaging techniques very precise in differentiate fat from other soft tissues; however, MRI has been recognized as the best tool for fatty infiltration assessment [20]. Numerous and different techniques have been proposed to assess muscle fatty infiltration; nevertheless, there is a lack of methods for its quantitative estimate [21,22,23,24,25].
The aim of this study was to set up a computerized method for quantitative characterization of fatty infiltration of the contractile muscle. Considering that the term ‘fatty infiltration’ has been using with a non-univocal meaning [26], it has to be stressed that the term ‘fatty infiltration’ in this study identifies inter and intra non-contractile tissue (mainly fat and connective tissue) that substitutes myofibrillar tissue portions within the lean muscle area (contractile muscle).
The proposed method is based on fractal features estimate of LeanCSA (lean muscle cross-sectional area) in MR images of paraspinal muscles. In particular, the hyperbola-based method was used for lacunarity texture analysis; it provides three parameters (α, β, γ) for which α correlates with the fractal dimension and β quantifies the lacunarity of the set [27,28,29,30]. The term ‘lacunarity’ (derived from Latin ‘lacuna’ that means gap or hole) was coined by Mandelbrot to characterize fractal objects with the same fractal dimension but differently appearing [31]. Later, lacunarity analysis was also introduced as a more general texture analysis method to describe complex patterns with or without fractal properties [32]. Succolarity, the third fractal feature, was also considered to complete fractal characterization of muscle fatty infiltration. Succolarity was introduced by Mandelbrot [33] to discriminate fractals with the same lacunarity. Succolarity evaluates the degree of the percolation capacity of a hypothetic fluid in a defined direction and thus estimates connectivity and intercommunication [34]. Parameter µ for the four main directions was introduced to quantify succolarity by using a revised version of the method proposed to compute succolarity [35]. While fractal dimension and fractal lacunarity are widely used, succolarity was not considered for long time after its introduction in fractal geometry. More recently, the concept of succolarity has been revisited and a quantification has been also proposed [36].
In this study, fractal analysis was applied to lumbar paraspinal muscle axial images acquired by MRI spin-echo technique from subjects of different age and physio-pathological status to verify the potential of fractal parameters as new indices of muscle wasting in aging (sarcopenia) and age-related pathology (osteoporosis). Classic indices of muscle mass composition were also considered together with a new one, namely Lean/Fat ratio. This new index, derived from classic measurements, puts in relation changes occurring at both lean and fatty muscle mass thus allowing a better comparison between classic and fractal based new methods.
2. Materials and Methods
2.1. Description of dataset
2.1.1. Subjects
Data used in this study were from subjects enrolled in a previous study on vertebral trabecular bone degeneration in aging and osteoporosis [27,28]. In particular, the dataset considered in this study included women within the age-range 23-81 years stratified in groups on the basis of their physio-pathological status (healthy young, pre-menopause, post-menopause, osteoporosis). Table 1 summarizes main demographic and clinical characteristics of the subjects under study. MRI images of lumbar spine were used to quantify paraspinal muscle degeneration with aging and pathology.
The study was carried on according to the Declaration of Helsinki. All subjects included in the study had given their consent to use MRI scans data for research scope.
2.1.2. MRI Image Acquisition
High resolution MRI, 1.5T whole body system (Gyroscan Intera; Philips-Medical System, ACR-Nema 1.0), was used for lumbar spine scans using a phased array dS Spine coil. Spin-echo multislice technique was applied to acquire axial section images of L1-L4 lumbar spine (9 slices/vertebra with a thickness of 3 mm without space gap between slices). The pulse sequence used was: TE of 15 ms, TR of 525 ms; flip angle was of 90°, matrix 512x512 pixel, and pixel size equal to 0.469 mm. The scan time was shorter than 15 min.
2.2. Image Processing and Analysis
MR images of the 4th lumbar vertebra were used in the present study to characterize paraspinal muscles. The MRI data set was transferred to a personal computer for image texture analysis.
2.2.1. Analysis of MR Images
The algorithms developed for the characterization of lumbar paraspinal muscles start with an image area selection by a semi-automatic procedure to define the region of interest (ROI) corresponding to the lumbar paraspinal muscle group considered. This ROI was used to delimit lean muscle area (contractile area) and the surrounding fatty muscle area. A simple count of pixel number belonging to these ROIs was performed for muscle composition estimate by classical indices such as cross-sectional area of the whole muscle mass (TotCSA), lean muscle mass (LeanCSA) and fatty muscle mass (FatCSA). Percentage of lean and fatty mass as well as the ratio between lean and fatty mass (Lean/Fat ratio) were also calculated.
LeanCSA was considered to quantify fatty infiltration by three independent indices:
- ρ: the ratio between lean (contractile) and fatty (non-contractile) portions of muscle tissue belonging to the lean muscle area (LeanCSA);
- β: the fractal lacunarity of lean muscle area, where fatty infiltration is assumed as lacunas.
- µ: the succolarity of lean muscle area, where fatty infiltration is assumed as the empty space within the muscle tissue percolated by a hypothetical fluid crossing the set in four directions (down to up ↑; left to right →; up to down ↓; right to left ←).
The computational procedures to obtain these indices from LeanCSA are described below. These indices were compared with the classical indices of muscle composition described above. Figure 1 (left) shows a sketch of ROIs’ selection for both muscle composition and fatty infiltration estimates.
2.2.2. Computation of Index ρ (Lean/Fat Ratio)
The algorithm to compute ρ is based on a simple count of pixels nL (contractile muscle) and the pixels nF (non-contractile muscle) belonging to the lean mass area (LeanCSA). The ratio between these two numbers gives the value of the index ρ, that is:
At a first glance, the decision whether a given pixel belongs to the lean mass or to the fatty mass seems to be quite simple; in fact, fatty mass is characterized by a lighter gray level than the lean mass. However, the non-uniform illumination in the image can make difficult to obtain a unique threshold to separate the lean mass from the fatty mass. Therefore, a simple adaptive thresholding procedure is used. The bounding box of the ROI is uniformly partitioned in M by N rectangles and a different threshold is computed for the rectangles with not empty intersection with the ROI. Let R be the intersection of the ROI and one of such rectangles, H be the histogram of gray levels in R, so H(i) gives the number of pixels in R having gray level i, where i=0, 1,…, 255. The following algorithm is used to compute the threshold τ in R.
Algorithm 1 (local threshold). Given the sub-image R, the histogram H of gray levels in R, and a tolerance T, compute the threshold τ by the following steps:
- let τ1 be the index of the relative maximum of H that is closest to i=0;
- let τ2 be the index of the relative maximum of H that is closest to i=255;
- let τ=(τ1+τ2)/2;
-
do
- ◦
- τold=τ;
- ◦
- let τ1 be the weighted average of gray levels less than τ with weights H(i), i=0, 1, …, τ-1;
- ◦
- let τ2 be the weighted average of gray levels greater than τ with weights H(i), i=τ+1, τ+2, …, 255;
- ◦
- let τ=(τ1+τ2)/2;
until |τ-τold |<T.
In this way, every rectangle having not empty intersection with the ROI has a different threshold. Let Rj, j=0,1, …, J be the intersection of such rectangles and the ROI, let τj, j=0,1, …, J be the corresponding thresholds. The following algorithm computes the segmentation of the ROI in terms of nF, i.e. the number of pixels in the fat mass, and nL, i.e. the number of pixels in the lean mass.
Algorithm 2 (image segmentation). Let d be the diagonal of the rectangles in the partition of the ROI, and cj be the center of the j-th rectangle. Given the sub-images Rj, j=0,1, …, J, and the corresponding thresholds τj, j=0,1, …, J; compute nF and nL as the total number of pixels in the fat mass and in the lean mass, respectively, by the following steps:
- nF=0;
- nL=0;
-
for every pixel p in the ROI,
- ◦
- let Rj be the sub-image containing p, and dj=|cj-p|;
- ◦
- let Rl, l =1, 2,…, L be all the sub-images such that |cl-p|<|cj-cl| and |cl-p|<d;
- ◦
- let dl=|cl-p|, l=1, 2,…, L and
- ◦
- if GL(p)> τ, increase nF by 1, else increase nL by 1.
We note that in Algorithm 2 GL(p) denotes the gray level of pixel p; moreover, index L may be zero, for example when sub-image Rj is near the boundary of the ROI; in this case the summations appearing in the definition of τ must be considered equal to zero and τ=τj.
Therefore, the computation of parameter ρ is performed by Algorithm 1, Algorithm 2 and finally formula (1).
2.2.3. Computation of index β (lacunarity)
Fractal lacunarity analysis was performed by adopting the method previously developed in our laboratory as described in [27,28] and modified in [29,30].
Our method to estimate fractal lacunarity is based on the gliding box algorithm (GBA). This algorithm computes the lacunarity of a set by analyzing its mass distribution [37]. More precisely, for a box of edge length b>0, all the possible positions on the set (i.e. the ROI) and the mass of the set within each box is considered. In this way, a frequency distribution of the box mass is obtained and the lacunarity index β is computed by considering the moments of this distribution for different values of b>0.
In the particular case, the set is the ROI under analysis (LeanCSA) and the set mass is the pixel gray level. So, an image segmentation is not strictly required for lacunarity analysis, however, a preprocessing step with a sigmoid function can improve the quality of the results. In particular, for each pixel p in the ROI this step computes the new gray level GP’(p) of p from the original value GP(p) by using the following formula:
where k, σ > 0 are two given parameters. It is worth noting that the procedure goes toward a complete binarization by increasing parameter k, related to sigmoid regularization.
For the sake of simplicity we assume that, for each b, only a finite number of masses Mj, j=1,2,…,μ(b) are encountered in the various gliding boxes of size b; therefore, a discrete frequency distribution n(Mj,b), j=1,2,…, μ(b) has to be considered. Note that such an assumption holds for binary images, where the mass of a generic box on the image is given by the number of white pixels in the box, i.e. the pixels associated to the value one. From standard arguments on probability the moments of order q of M, are given by:
where the division by N(b), i.e. the total number of boxes, needs to convert n(Mj,b), j=1,2,…,μ(b) into a probability distribution. The definition of lacunarity function Λ uses only the first and the second moments of M, that is
The GBA was implemented in software using MATLAB software package (the MatWorks, Inc.). The program begins to elaborate the ROI. Then, for each integer value of b between bmin and bmax, where bmin, bmax are given integer multiples of the pixel size in the image under consideration, the program computes the lacunarity function Λ(b), b=bmin, bmin+1,…, bmax and shows the results on a graph.
As expected, for all the images analyzed, the behavior of lacunarity function was a curvilinear plot resembling the hyperbola curve; therefore, the following model:
was chosen to approximate the lacunarity function Λ(b), where α, β, γ are suitable parameters.
This observation is consistent with the theoretical behavior of lacunarity function Λ for self-similar fractals and for other different random sets. Moreover, for such fractals, parameter α is related to the fractal dimension of the set and parameter β characterizes the lacunarity of the set [27,28].
In each particular example considered in this study, the best fit of lacunarity Λ(b), b=bmin, bmin+1,…, bmax, by the model function L(b), b∈ [bmin, bmax], was computed as the solution of a least squares problem, where parameters α, β, γ are the independent variables. In particular, the minimizer of this problem is a triplet of parameters (α*, β*, γ*) of the model function that better represents the variation of mass density of pixels in that image. The parameter β* gives the lacunarity of the considered ROI.
Figure1 (right) shows a schematic representation of our lacunarity analysis method.
2.2.4. Computation of index µ (succolarity)
Succolarity [36] refers to the capacity to allow the flow of a fluid. So, it gives a further information with respect to fractal dimension and lacunarity since depends on the spatial organization of lacunas, for example, into filaments through the set. We note that this fractal property is particularly relevant for the present analysis due to the geometrical organization of fat infiltration into muscle tissue. Fractal succolarity analysis was performed by refining the method presented in [35]. The proposed refinement is mainly based on the management of the different box sizes used to compute the flow of an ideal fluid through the ROI. Four main directions are considered, i.e., down to up, ↑; left to right, →; up to down, ↓; and right to left, ←; however, here we describe only the computation in the up to down case since the other ones can be obtained by proper rotations of the image. The capacity C(p) of a pixel p in the image to be occupied by the fluid is given by GL(p), i.e., the gray level of pixel p. The succolarity algorithm starts by flowing the pixels p of the ROI perimeter above the diagonals of the bounding box of the ROI. A pressure π(p)=0 is assigned to these pixels. For each b between bmin and bmax, the following iterative procedure is performed: let π be the pressure of the pixels flooded in the previous step, from these pixels the fluid flows to the pixels at (chessboard) distance less than or equal to b; the pressure of these new flooded pixels is π+1. When all the pixels are flooded, the succolarity function S↓ is computed as follows:
Proper rotations of the ROI can be used to compute the other succolarity functions S←, S↑, S→ by the same procedure. From functions Sd, d∈{↓, ←, ↑, →} the succolarity indices μ↓, μ←, μ↑, μ→ are computed as follows:
3. Results
3.1. Mass composition of paraspinal muscles
Results on paraspinal muscle composition confirm an age-related decreasing trend for lean mass and an increasing trend for fatty mass. These results are consistent with those reported in literature for different muscles [16,17,18,19,20]. Lean/Fat ratio results of TotCSA show an age-related decreasing trend. In osteoporosis, the lean/fat ratio lower than age-matched control group reflects the higher fatty mass in disease than in aging as both show similar amounts of lean mass. Table 2 summarizes classical measurement results on paraspinal muscle composition (area in pixel, percentage, and ratio) expressed as mean ± SD of the average of right and left paraspinal muscle groups.
Figure 2 shows that osteoporotic subjects, when compared with age-matched controls, have an opposite trend of Lean/Fat ratio that is in contradiction with muscle composition expressed as mean ± SD (Table 2). In fact, in spite of similar lean mass values, osteoporotic subjects show a higher amount of fatty mass when compared with age-matched controls (Figure 3). It would have to account for a more marked decreasing trend of Lean/Fat ratio.
3.2. Fractal features of paraspinal muscle
To overcome this discrepancy, another index, lacunarity parameter β, was introduced to analyze fatty infiltration of lean mass. Lacunarity analysis, in fact, provides a holistic estimate of muscle composition comprehensive of changes occurring at both lean and fatty muscle mass. In addition, to better characterize fatty infiltration of the muscle, succolarity was also considered.
As comparable results of muscle composition were obtained for both right and left paraspinal muscles (Figure 3), additional analyses were performed only on the right paraspinal muscle group. In particular, parameter ρ (Lean/Fat ratio) and fractal features, parameter β (Lacunarity) and parameters µ (Succolarity), were used to quantify fatty infiltration of lean muscle area as indices of muscle contractile function.
Table 3 summarizes results related to the three new indices. Results from fractal analysis of right paraspinal muscles show that parameter β, related to fatty infiltration, increases with age and physio-pathological status. In particular, osteoporosis and age-matched control groups are statistically significantly different (p=0.012) with β values higher in osteoporosis than in ‘healthy’ aging. These results are consistent with fatty mass levels found higher in osteoporosis than in age-matched controls, in spite of comparable lean mass levels. Figure 4 shows the age-related distribution of fatty infiltration expressed as lacunarity (parameter β) in the whole sample and in osteoporosis compared to the age-matched control group.
Figure 5 compares fractal features (lacunarity parameter β and succolarity parameter µ for the four directions considered) in the groups of different age and physio-pathological status. Lacunarity can discriminate between osteoporosis and age-matched control groups (p=0.012) while succolarity does not statistically change between aging and disease. It is worth noting that the groups showing similar lacunarity values (young, pre-menopause and menopause) can be further discriminate by succolarity that shows increasing values of parameters µ from young to pre-menopause to menopause. In particular, the young group statistically significantly differs from both pre-menopause and menopause groups when succolarity µ↑, µ→, and µ← values are considered (respectively, p values equal to 0.045, 0.035, and 0.049 in young vs. pre-menopause; p values equal to 0.043, 0.014, and 0.049 in young vs. menopause groups).
4. Discussion
In this study we show that fractal analysis can characterize muscle wasting better than classical methods. In particular, we found that fractal lacunarity, as a tool to estimate fatty infiltration of paraspinal muscles, is able to discriminate between aging and age-related disease (osteoporosis). In fact, fatty infiltration, as estimated by lacunarity parameter β, from our method based on hyperbola model function [28,30], increases with aging and is statistically higher in osteoporotic patients when compared with age-matched controls.
It is worth noting that, in spite of the age-related increasing trend of lacunarity parameter β, lacunarity analysis fails in separate the other age/physio-pathological groups: young, pre-menopause, and menopause. However, succolarity analysis is able to discriminate among these three groups showing a similar lacunarity; parameter µ, used to quantify succolarity of paraspinal muscle in the four directions, is statistically significantly different among the three groups considered. These results are consistent with the meaning of using succolarity to better characterize fractals showing the same lacunarity [33].
The need to consider new approaches to characterize muscle wasting with aging and pathology stems from the lack of consistency of results on muscle composition based on classical measurements [38,39]. Our results on paraspinal muscle composition by classical measurements confirm an age-related decreasing trend for lean mass and an increasing trend for fatty mass. These results are consistent with those reported in literature for different muscles [16,17,18,19,20,40]. The high degree of inter-individual variability observed, however, suggests introducing an alternative index able to put in relation changes, positive and/or negative, occurring at level of both lean and fatty muscle mass. In fact, both inter- and intra-lean muscle infiltration of fatty tissue contribute to the reduction of contractile muscle responsible for altered muscle strength. In this study we propose parameter ρ, an index representative of the ratio between lean and fatty mass in the whole muscle area (TotCSA) and in the muscle contractile area (LeanCSA), this last to obtain an index to provide an estimate of fatty infiltration of contractile muscle from classical measurements and, therefore, better comparable with the new proposed fractal measurements. Lean/fat ratio results from TotCSA show that parameter ρ is lower in osteoporosis group than in age-matched control one. This is consistent with a higher fatty mass in osteoporotic patients than in age-matched controls in the presence of similar lean muscle mass in the two groups. Results on parameter ρ from LeanCSA, as an estimate of fatty infiltration of contractile muscle, confirm higher amounts of fatty tissue in LeanCSA of osteoporotic patients when compared with age-matched controls in the presence of similar amounts of lean tissue. This aspect accounts for lean/fat ratio of LeanCSA lower in osteoporosis group than in age-matched control one. These results suggest that muscle contractile function is more compromised with osteoporosis than in ‘healthy’ aging. However, in spite of such a difference between these two groups, parameter ρ is not able to separate osteoporotic patients from age-matched controls in a statistically significant manner. Once more, we confirm that classical methods for muscle composition assessment lack of a clear-cut conclusion by stressing the need of alternative more effective approaches to characterize skeletal muscle wasting in sarcopenia.
It is known that several factors contribute to the physiopathology of sarcopenia; nevertheless, its etiology has not been defined yet. From literature, it emerges that a combination of mechanisms affects the normal physiology of skeletal muscle and contributes to the onset and progression of sarcopenia. Loss of regenerative capacity, denervation of muscle fibers, and increased of inter- and intra-muscular infiltration of fat together with endocrine changes, mitochondrial dysfunction, oxidative stress, and inflammation are among the mechanisms that participate to the etiopathogenesis of sarcopenia [41,42]. Interestingly, as per other tissues or organs, most mechanisms involved in muscle wasting are strictly related to the aging processes.
Aging is characterized by functional and structural impairments at different levels and represents a major risk factor for most chronic diseases. Different rates of aging processes that drive the biological aging of any individuals are responsible for the high degree of inter- and intra-individual variability even in the presence of a homogeneous endogen and hexogen environments. Good biomarkers of aging [43,44] are, therefore, necessary to recognize physiological aging and discriminate between normal and pathological aging, two main targets of aging studies dealing with aging in good health. It is worth nothing that there is no gold standard tool to monitor physiological aging, nor single measurements have been qualified yet as good biomarkers of aging, sensitive and specific enough to discriminate between normal aging and pathological aging [45].
To give insight into the search of good biomarkers of aging, contradictions and/or phenomena that appear incomprehensible can be explained in the light of paradigms such as complexity, chaos, and fractality. As a matter of fact, the marked inter- and intra-individual heterogeneity that characterizes the senescent phenotype can be justified by assuming the concept that longevity is a ‘secondary product of evolution of a nonlinear dynamic system [46,47].
Taking in mind that complex systems are strictly dependent upon initial conditions, in a cohort of living beings, as complex systems [48], even very small differences occurring at certain times are responsible for larger differences in most characteristics of the individual senescent phenotype later in the life. In fact, life trajectories of individuals in a population, although close they may be at birth, will evolve by fluctuating with time and progressively increasing the variance of their phenotype characteristics, among which is aging (for more details see [47,49]. The interindividual variability observed in an aging population is always present independently of how large environmental changes are and even in the case of genetically homogeneous backgrounds. Genetic-environmental interactions induce unpredictable behavior at the bifurcations, critical points at which life trajectory can change. Bifurcations, therefore, can represent the source of variability responsible for the heterogeneity that characterize the senescent phenotype.
According to this new perspective, aging represents the temporal evolution of a complex system whose nonlinear dynamic behavior is governed by the laws of chaos. Aging systems are affected by both internal and external environments and evolve with time by losing complexity [50]. Human biocomplex systems, characterized by a chaotic behavior, generate the so-called ‘strange attractors’ [51]. They can be observed at critical points and can be described by fractals; therefore, fractal analysis can be used to describe biocomplexity and measure changes with aging and pathology [52,53]. The senescent phenotype, following different trajectories with different kinetics rates, evolves as pathological aging (fast rate), physiological aging (intermediate rate), or successful aging (low rate) depending upon specific individual genetic-environmental interactions [30,49,54].
In this study we demonstrate once more that fractal analysis represents a powerful tool to give insight into the search of good biomarkers of aging as it is sensitive enough to discriminate between physiological and pathological aging. It could also have potential for discriminating even between age-dependent and age-associated diseases, another major task dealing with aging well.
As far as in our knowledge, this is one among rare studies aimed to quantify muscle fatty infiltration [55] and the first study approaching fractal featuring of muscle tissue. In fact, only muscle contractile function was previously described by fractal analysis of myographic waveforms [56]. Our results are from the middle axial section of the fourth lumbar vertebra based on our previous studies on vertebral trabecular bone performed in this section [28,30,57,58]. The goodness of our choice is also supported by literature in the field from which it emerges that muscle fatty infiltration generally increases from cranial to caudal, with the highest values observed at L4 and L5 [55,59,60]. Therefore, in the case of small variations of fatty infiltration, they could be detected in this site better than in other sites where fatty tissue is less represented.
Further studies are in progress on muscle fractal features in osteosarcopenia and bone fragility fracture risk. Improvements of succolarity analysis method are also under consideration.
5. Conclusions
In this study we demonstrate that fractal analysis represents a powerful tool to characterize muscle better than classical methods. In fact, lacunarity, by quantifying muscle fatty infiltration, is able to characterize age-related muscle wasting (sarcopenia) and to discriminate between normal aging and pathological aging (osteoporosis). Succolarity, the other fractal measure introduced to characterize fractal objects with same lacunarity, is able to discriminate among the three groups of age and physiological status (young, pre-menopause, and menopause) showing similar lacunarity values.
The original and innovative method proposed to quantify muscle fatty infiltration in MR images by fractal indices such as lacunarity and succolarity can find application in clinical setting as a sensitive tool to diagnose sarcopenia and monitor changes of muscle fatty infiltration as an index of muscle contractile function.
Last but not least, with this study we further stress the relevance to introduce paradigms such as complexity, chaos, and fractality in the field of gerontology as they represent sources to obtain effective tools in the search of good biomarkers of aging and diseases.
Author Contributions
Conceptualization, A.Z.; methodology, A.Z. and P.M.; software, P.M. and M.Z.; validation, A.Z. and L.L.; formal analysis, A.Z. and P.M.; investigation, A.Z.; data curation, A.Z.; writing—original draft preparation, A.Z.; writing—review and editing, A.Z. and P.M. All authors have read and agreed to the published version of the manuscript.
Funding
This research received no external funding.
Data Availability Statement
The data presented in this study are available on request from the corresponding author.
Acknowledgments
This study was partially supported by internal non-competing fund ‘Ricerca Corrente’ from Italian Ministry of Health to IRCCS INRCA. The funder had no role in study design, data collection, data analysis, data interpretation, or writing the manuscript.
Conflicts of Interest
The authors declare no conflict of interest.
References
- Evans, W.J. Skeletal muscle loss: cachexia, sarcopenia, and inactivity. Am. J. Clin. Nutr. 2010, 91, 1123S–1127S. [Google Scholar] [CrossRef]
- Evans, W.J.; Paolisso, G.; Abbatecola, A.M.; Corsonello, A.; Bustacchini, S.; Strollo, F.; Lattanzio, F. Frailty and muscle metabolism dysregulation in the elderly. Biogerontol. 2010, 11, 527–536. [Google Scholar] [CrossRef]
- Russ, D.W.; Grandy, J.S.; Toma, K.; Ward, C.W. Ageing, but not yet senescent, rats exhibit reduced muscle quality and sarcoplasmic reticulum function. Acta Physiol. 2011, 201, 391–403. [Google Scholar] [CrossRef]
- Seene, T.; Kaasik, P.; Riso, E.M. Review on aging, unloading and reloading: changes in skeletal muscle quantity and quality. Arch. Gerontol. Geriatr. 2012, 54, 374–380. [Google Scholar] [CrossRef]
- Rosenberg, I.H. Summary comments: epidemiological and methodological problems in determining nutritional status of older persons. Am. J. Clin. Nutr. 1989, 50, 1231–1233. [Google Scholar] [CrossRef]
- Rosenberg, I.H. Sarcopenia: origins and clinical relevance. J. Nutr. 1997, 127, 990S–991S. [Google Scholar] [CrossRef]
- Delmonico, M.J.; Harris, T.B.; Lee, J.S.; Visser, M.; Nevitt, M.; Kritchevsky, S.B.; et al. Alternative definitions of sarcopenia, lower extremity performance, and functional impairment with aging in older men and women. J. Am. Geriatr. Soc. 2007, 55, 769–774. [Google Scholar] [CrossRef]
- Goodpaster, B.H.; Park, S.W.; Harris, T.B.; Kritchevsky, S.B.; Nevitt, M.; Schwartz, A.V.; et al. The loss of skeletal muscle strength, mass, and quality in older adults: The health, aging and body composition study. J. Gerontol. A Biol. Sci. Med. Sci. 2006, 61, 1059–1064. [Google Scholar] [CrossRef] [PubMed]
- Hiona, A.; Leeuwenburgh, C. The role of mitochondrial DNA mutations in aging and sarcopenia: implications for the mitochondrial vicious cycle theory of aging. Exp. Gerontol. 2008, 43, 24–33. [Google Scholar] [CrossRef] [PubMed]
- Marzetti, E.; Leeuwenburgh, C. Skeletal muscle apoptosis, sarcopenia and frailty at old age. Exp. Gerontol. 2006, 41, 1234–1238. [Google Scholar] [CrossRef]
- Fearon, K.; Evans, W.J.; Anker, S.D. Myopenia—a new universal term for muscle wasting. J. Cachexia Sarcopenia Muscle. 2011, 2, 1–3. [Google Scholar] [CrossRef]
- Clark, B.C.; Manini, T.M. Functional consequences of sarcopenia and dynapenia in the elderly. Curr. Opin. Clin. Nutr. Metab. Care. 2010, 13, 271–276. [Google Scholar] [CrossRef]
- Gonzales, E.; Messi, M.L.; Delbono, O. The specific force of single intact extensor digitorum longus and soleus mouse muscle fibers declines with aging. J. Membr. Biol. 2000, 178, 175–183. [Google Scholar] [CrossRef]
- Stackhouse, S.K.; Stevens, J.E.; Lee, S.C.; Pearce, K.M.; Snyder-Mackler, L.; Binder-Macleod, S.A. Maximum voluntary activation in nonfatigued and fatigued muscle of young and elderly individuals. Phys. Ther. 2001, 81, 1102–1109. [Google Scholar] [CrossRef]
- Weisleder, N.; Brotto, M.; Komazaki, S.; Pan, Z.; Zhao, X.; Nosek, T.; et al. Muscle aging is associated with compromised Ca2+ spark signaling and segregated intracellular Ca2+ release. J. Cell. Biol. 2006, 174, 639–645. [Google Scholar] [CrossRef]
- Delmonico, M.J.; Harris, T.B.; Visser, M. , Park, S.W.; Conroy, M.B.; Valasquez-Mieyer, P.; et al. Longitudinal study of muscle strength, quality, and adipose tissue infiltration. Am. J. Clin. Nutr. 2009, 90, 1579–1585. [Google Scholar] [CrossRef]
- Heymsfield, S.B.; Adamek, M.; Gonzalez, M.C.; Gia, G.; Thomas, D.M. Assessing skeletal muscle mass: historical overview and state of the art. J. Cachexia Sarcopenia Muscle. 2014, 5, 9–18. [Google Scholar] [CrossRef]
- Cruz-Jentoft, A.J.; Baeyens, J.P.; Bauer, J.M.; Boirie, Y.; Cederholm, T.; Landi, F.; et al. Sarcopenia: European consensus on definition and diagnosis: Report of the European Working Group on Sarcopenia in Older People. Age Ageing. 2010, 39, 412–423. [Google Scholar] [CrossRef]
- Cruz-Jentoft, A.J.; Bahat, G.; Bauer, J.; Boirie, Y.; Bruyère, O.; Cederholm, T.; et al. Sarcopenia: revised European consensus on definition and diagnosis. Age Ageing. 2019, 48, 16–31. [Google Scholar] [CrossRef]
- Heskamp, L.; Okkersen, K.; van Nimwegen, M.; Ploegmakers, M.J.; Bassez, G.; Deux, J-F. ; et al. Quantitative Muscle MRI Depicts Increased Muscle Mass after a Behavioral Change in Myotonic Dystrophy Type 1. Radiol. 2020, 297, 132–142. [Google Scholar] [CrossRef]
- Goutallier, D.; Postel, J.M.; Bernageau, J.; Lavau, L.; Voisin, M.C. Fatty muscle degeneration in cuff ruptures. Pre- and postoperative evaluation by CT scan. Clin. Orthop. Relat. Res. 1994, 304, 78–83. [Google Scholar] [CrossRef]
- Fortin, M.; Lazáry, À.; Varga, P.P.; Battié, M.C. Association between paraspinal muscle morphology, clinical symptoms and functional status in patients with lumbar spinal stenosis. Eur. Spine J. 2017, 26, 2543–2551. [Google Scholar] [CrossRef]
- Battaglia, P.J.; Maeda, Y.; Welk, A.; Hough, B. , Kettner, N. Reliability of the Goutallier classification in quantifying muscle fatty degeneration in the lumbar multifidus using magnetic resonance imaging. J. Manipulative Physiol. Ther. 2014, 37, 190–197. [Google Scholar] [CrossRef]
- Tamai, K.; Chen, J.; Stone, M.; Arakelyan, A.; Paholpak, P.; Nakamura, H.; et al. The evaluation of lumbar paraspinal muscle quantity and quality using the Goutallier classification and lumbar indentation value. Eur. Spine J. 2018, 27, 1005–1012. [Google Scholar] [CrossRef]
- Fortin, M.; Battie, M.C. Quantitative paraspinal muscle measurements: intersoftware reliability and agreement using OsiriX and ImageJ. Phys. Ther. 2012, 92, 853–864. [Google Scholar] [CrossRef]
- Addison, O.; Marcus, R.L.; LaStayo, P.C.; Ryan, A.S. Intermuscular Fat: A Review of the Consequences and Causes. Int. J. Endocrinol. 2014, 2014, 309570. [Google Scholar] [CrossRef]
- Zaia, A.; Eleonori, R.; Maponi, P.; Rossi, R.; Murri, R. Medical imaging and osteoporosis: Fractal’s lacunarity analysis of trabecular bone in MR images. In Proceedings of the Eighteenth IEEE Symposium on Computer-Based Medical Systems (CBMS 2005), Dublin, Ireland, 23–24 June 2005; IEEE, 2005; pp. 3–8. [Google Scholar] [CrossRef]
- Zaia, A.; Eleonori, R.; Maponi, P.; Rossi, R.; Murri, R. MR imaging and osteoporosis: Fractal lacunarity analysis of trabecular bone. IEEE Trans. Inf. Technol. Biomed. 2006, 10, 484–489. [Google Scholar] [CrossRef]
- Zaia, A.; Rossi, R.; Egidi, N.; Maponi, P. Fractal’s lacunarity analysis of trabecular bone in MR images. In Computational Vision and Medical Image Processing; Tavares, J., Jorge, N., Eds.; CRC Press: Boca Raton, FL, USA, 2010; pp. 421–426. [Google Scholar]
- Zaia, A. Fractal lacunarity of trabecular bone and magnetic resonance imaging: New perspectives for osteoporotic fracture risk assessment. World. J. Orthop. 2015, 6, 221–235. [Google Scholar] [CrossRef]
- Mandelbrot, B.B. A Fractal’s Lacunarity, and how it can be Tuned and Measured. In: Nonnenmacher TF, Losa GA, Weibel ER, editors. Fractals in Biology and Medicine. Birkhauser Press: Basel, Switzerland, 1993; pp. 8-21.
- Plotnick, R.E.; Gardner, R.H.; Hargrove, W.W. , Prestegaard, K.; Perlmutter, M. Lacunarity analysis: A general technique for the analysis of spatial patterns. Phys. Rev. E. 1996, 53, 5461–5468. [Google Scholar] [CrossRef]
- Mandelbrot, B.B. The Fractal Geometry of Nature. In: Trees and the Diameter Exponent. WH Freeman: New York, USA, 1977; pp 156-165.
- Metze, K.; Adam, R.; Florindo, J.B. The fractal dimension of chromatin - a potential molecular marker for carcinogenesis, tumor progression and prognosis. Expert Rev. Mol. Diagn. 2019, 19, 299–312. [Google Scholar] [CrossRef]
- de Melo, R.H.C.; Conci, A. How Succolarity could be used as another fractal measure in image analysis. Telecommun. Syst. 2013, 52, 1643–1655. [Google Scholar] [CrossRef]
- de Melo, R.H.C.; Conci, A. Succolarity: Defining a method to calculate this fractal measure. 2008 In Proceedings of the 15th International Conference on Systems, Signals and Image Processing, Bratislava, Slovakia, 25-28 June 2008, pp. 291–294. [CrossRef]
- Allain, C.; Cloitre, M. Characterizing the lacunarity of random and deterministic fractal sets. Phys. Rev. A. 1991, 44, 3552–3558. [Google Scholar] [CrossRef]
- Shur, N.F.; Creedon, L.; Skirrow, S.; Atherton, P.J.; MacDonald, I.A.; Lund, J.; Greenhaff, P.L. Age-related changes in muscle architecture and metabolism in humans: The likely contribution of physical inactivity to age-related functional decline. Ageing Res. Rev. 2021, 68, 101344. [Google Scholar] [CrossRef]
- Volpi, E.; Nazemi, R.; Fujita, S. Muscle tissue changes with aging. Curr. Opin. Clin. Nutr. Metab. Care. 2004, 7, 405–410. [Google Scholar] [CrossRef]
- Pang, J.; Tu, F.; Han, Y.; Zhang, E.; Zhang, Y.; Zhang, T. Age-related change in muscle strength, muscle mass, and fat mass between the dominant and non-dominant upper limbs. Front. Public. Health. 2023, 11, 1284959. [Google Scholar] [CrossRef]
- Budui, S.L.; Rossi, A.P.; Zamboni, M. The pathogenetic bases of sarcopenia. Clin. Cases Miner. Bone Metab. 2015, 12, 22–26. [Google Scholar] [CrossRef]
- Scicchitano, B.M.; Pelosi, L.; Sica, G.; Musarò, A. The physiopathologic role of oxidative stress in skeletal muscle. Mech. Aging Dev. 2017, 170, 37–44. [Google Scholar] [CrossRef]
- Johnson, T.E. Recent results: Biomarkers of aging. Exp. Gerontol. 2006, 41, 1243–1246. [Google Scholar] [CrossRef]
- Wagner, K-H. ; Cameron-Smith, D.; Wessner, B.; Franzke, B. Biomarkers of Aging: From Function to Molecular Biology. Nutrients. 2016, 8, 338. [Google Scholar] [CrossRef]
- Burkle, A.; Moreno-Villanueva, M.; Bernhard, J.; Blasco, M.; Zondag, G.; Hoeijmakers, J.H.; et al. Mark-age biomarkers of ageing. Mech. Ageing Dev. 2015, 151, 2–12. [Google Scholar] [CrossRef]
- Piantanelli, L.; Rossolini, G.; Basso, A.; Piantanelli, A.; Malavolta, M.; Zaia, A. Use of mathematical models of survivorship in the study of biomarkers of aging: The role of heterogeneity. Mech. Ageing Dev. 2001, 122, 1461–1475. [Google Scholar] [CrossRef]
- Zaia, A. Osteoporosis and fracture risk: New perspectives for early diagnosis and treatment assessment. In Osteoporosis: Etiology, Diagnosis and Treatment; Mattingly, B.E., Pillare, A.C., Eds.; Nova Science Publishers: Hauppauge, NY, USA, 2009; pp. 267–290. [Google Scholar]
- Pettersson, M. Complexity and Evolution; Cambridge University Press: Cambridge, UK, 1996. [Google Scholar]
- Zaia, A.; Maponi, P. Mitochondrial DNA Profiling by Fractal Lacunarity to Characterize the Senescent Phenotype as Normal Aging or Pathological Aging. Fractal Fract. 2022, 6, 219. [Google Scholar] [CrossRef]
- Lipsitz, L.A.; Goldberger, A.L. Loss of ‘complexity’ and aging: Potential applications of fractals and chaos theory to senescence. JAMA 1992, 267, 1806–1809. [Google Scholar] [CrossRef]
- Grassberger, A.; Procaccia, I. Measuring the strangeness of strange attractors. Phys. D 1983, 9, 189–208. [Google Scholar] [CrossRef]
- Goldberger, A.L.; Rigney, D.R.; West, B.J. Chaos and fractals in human physiology. Sci. Am. 1990, 262, 42–49. [Google Scholar] [CrossRef]
- Goldberger, A.L. Non-linear dynamics for clinicians: Chaos theory, fractals, and complexity at the bedside. Lancet 1996, 347, 1312–1314. [Google Scholar] [CrossRef]
- Franceschi, C.; Garagnani, P.; Morsiani, C.; Conte, M.; Santoro, A.; Grignolio, A.; Monti, D.; Capri, M.; Salvioli, S. The Continuum of Aging and Age-Related Diseases: Common Mechanisms but Different Rates. Front. Med. 2018, 5, 61. [Google Scholar] [CrossRef]
- Mandelli, F.; Nüesch, C.; Zhang, Y.; Halbeisen, F.; Schären, S.; Mündermann, A.; Netzer, C. Assessing Fatty Infiltration of Paraspinal Muscles in Patients With Lumbar Spinal Stenosis: Goutallier Classification and Quantitative MRI Measurements. Front. Neurol. 2021, 12, 656487. [Google Scholar] [CrossRef]
- Coelho, A.L.V.; Lima, C.A.M. Assessing fractal dimension methods as feature extractors for EMG signal classification. Eng. Appl. Artif. Intell. 2014, 36, 81–98. [Google Scholar] [CrossRef]
- Zaia, A.; Rossi, R.; Galeazzi, R.; Sallei, M.; Maponi, P.; Scendoni, P. Fractal lacunarity of trabecular bone in vertebral MRI to predict osteoporotic fracture risk in over-fifties women. The LOTO study. BMC Musculoskelet. Disord. 2021, 22, 108. [Google Scholar] [CrossRef]
- Zaia, A.; Maponi, P.; Sallei, M.; Galeazzi, R.; Scendoni, P. Measuring Drug Therapy Effect on Osteoporotic Fracture Risk by Trabecular Bone Lacunarity: The LOTO Study. Biomedicines 2023, 11, 781. [Google Scholar] [CrossRef] [PubMed]
- Kjaer, P.; Bendix, T.; Sorensen, J.S.; Korsholm, L.; Leboeuf-Yde, C. Are MRI-defined fat infiltrations in the multifidus muscles associated with low back pain? BMC Med. 2007, 5, 2. [Google Scholar] [CrossRef] [PubMed]
- Lee, J.C.; Cha, J.G.; Kim, Y.; Kim, Y.I.; Shin, B.J. Quantitative analysis of back muscle degeneration in the patients with the degenerative lumbar flat back using a digital image analysis: comparison with the normal controls. Spine. 2008, 33, 318–325. [Google Scholar] [CrossRef] [PubMed]
Figure 1.
Schematic representation of lacunarity method. (left) Paraspinal muscle MRI-spin echo to visualize muscle CSA al level of the 4th lumbar vertebra with ROIs selection to delimit TotCSA (solid line) and separate LeanCSA and FatCSA (dotted line); (right) GBA curvilinear plot (dotted line) as fitted by our hyperbola model function L(b) (solid line) to compute the triplet of parameters α*, β*, γ*; parameter α correlates with fractal dimension and parameter β describes the concavity of the curve and gives a quantitative estimate of lacunarity. MRI: magnetic resonance imaging, CSA: cross-sectional area, GBA: gliding box algorithm.
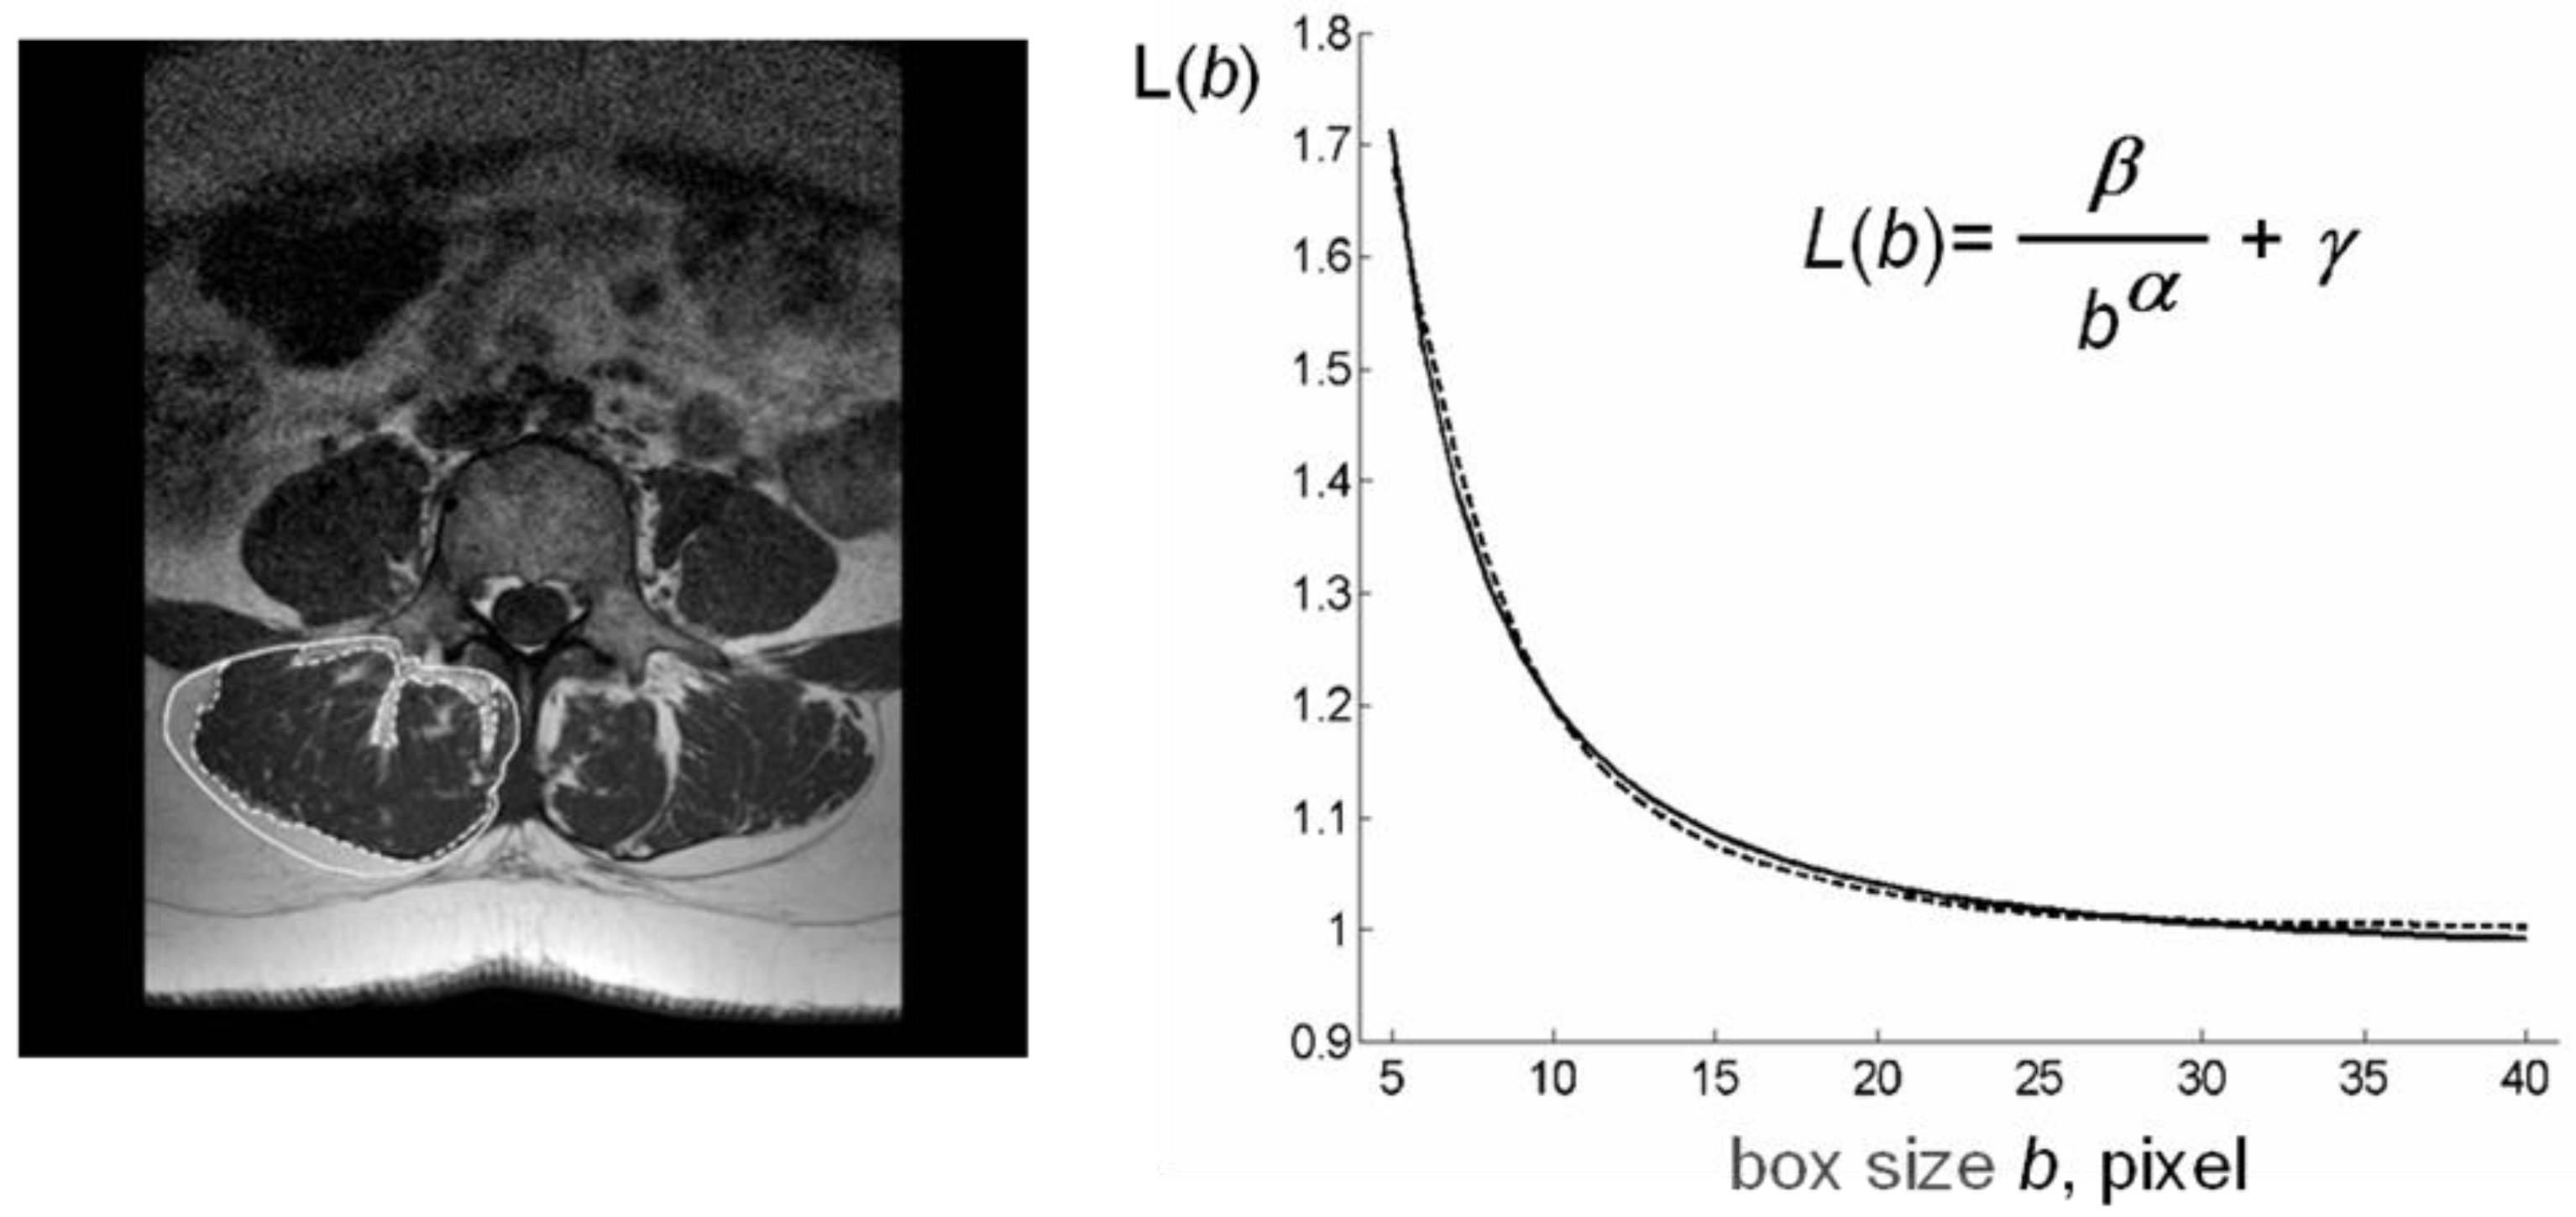
Figure 2.
Lean/Fat ratio of the whole muscle mass area in aging and disease. (a) Age-related decreasing trend of Lean/Fat ratio in the whole sample analyzed; (b) Comparison of Lean/Fat ratio between osteoporotic patients (black) and age-matched control group (gray) showing an increasing trend (dashed line) for osteoporotic group vs. a decreasing trend (dotted line) for age-matched controls.
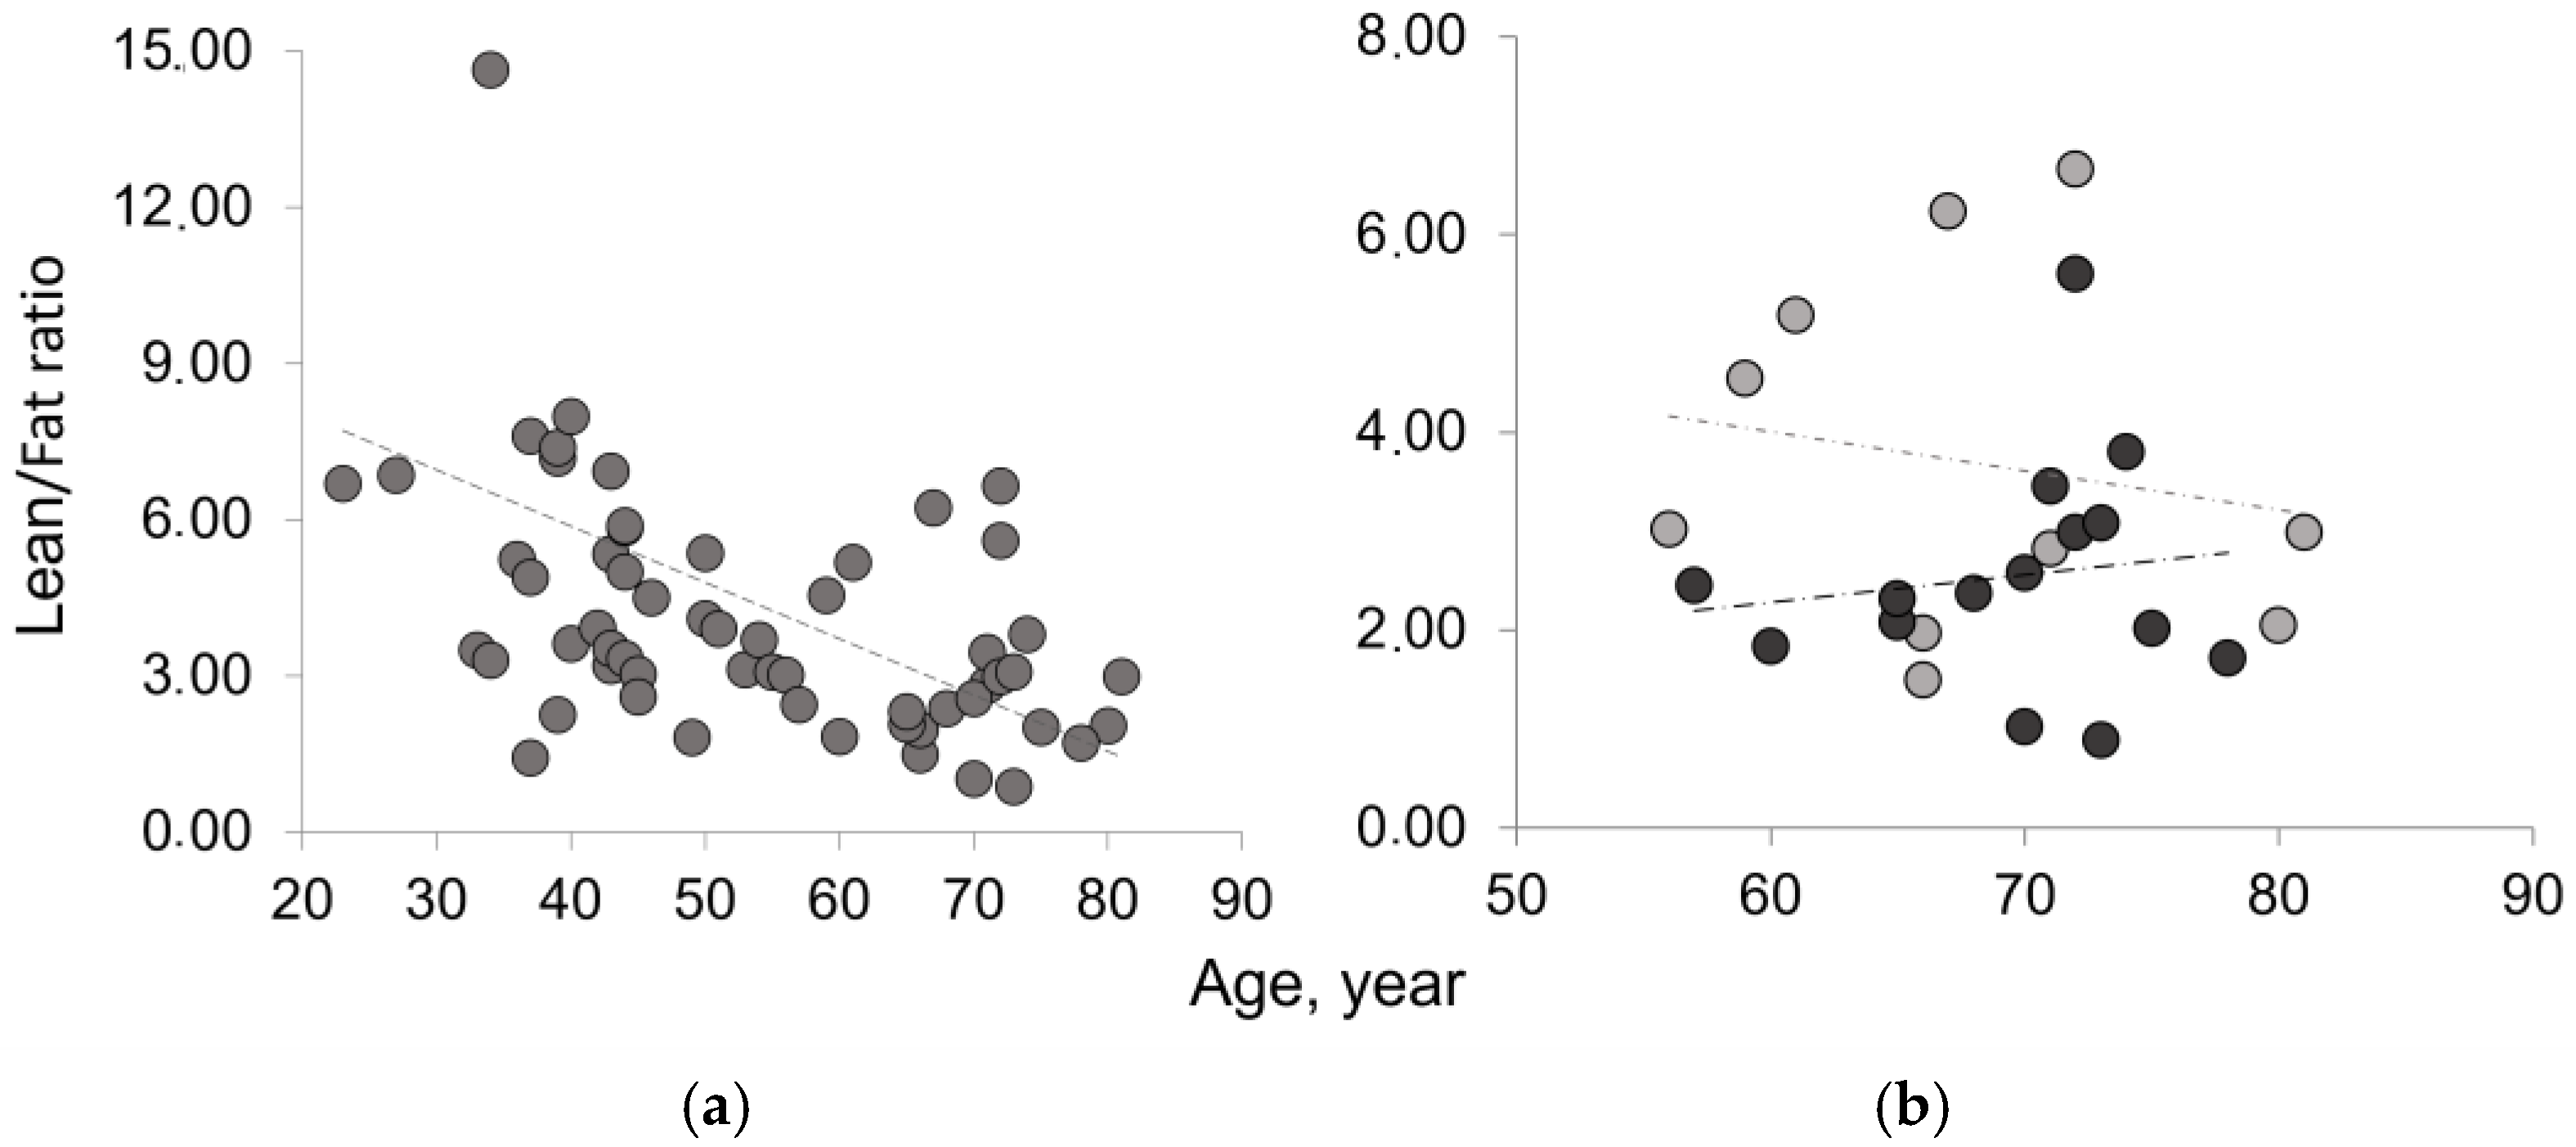
Figure 3.
Composition of paraspinal muscles in aging and osteoporosis. (a) Lean mass (black) and fatty mass (gray) of paraspinal muscles, represented as mean values of right (R), left (L), and both (R+L) muscle groups, show comparable values between R and L groups; (b) Lean/Fat ratio of paraspinal muscles represented as mean value of right (R), left (L), and whole (R+L) muscle area.
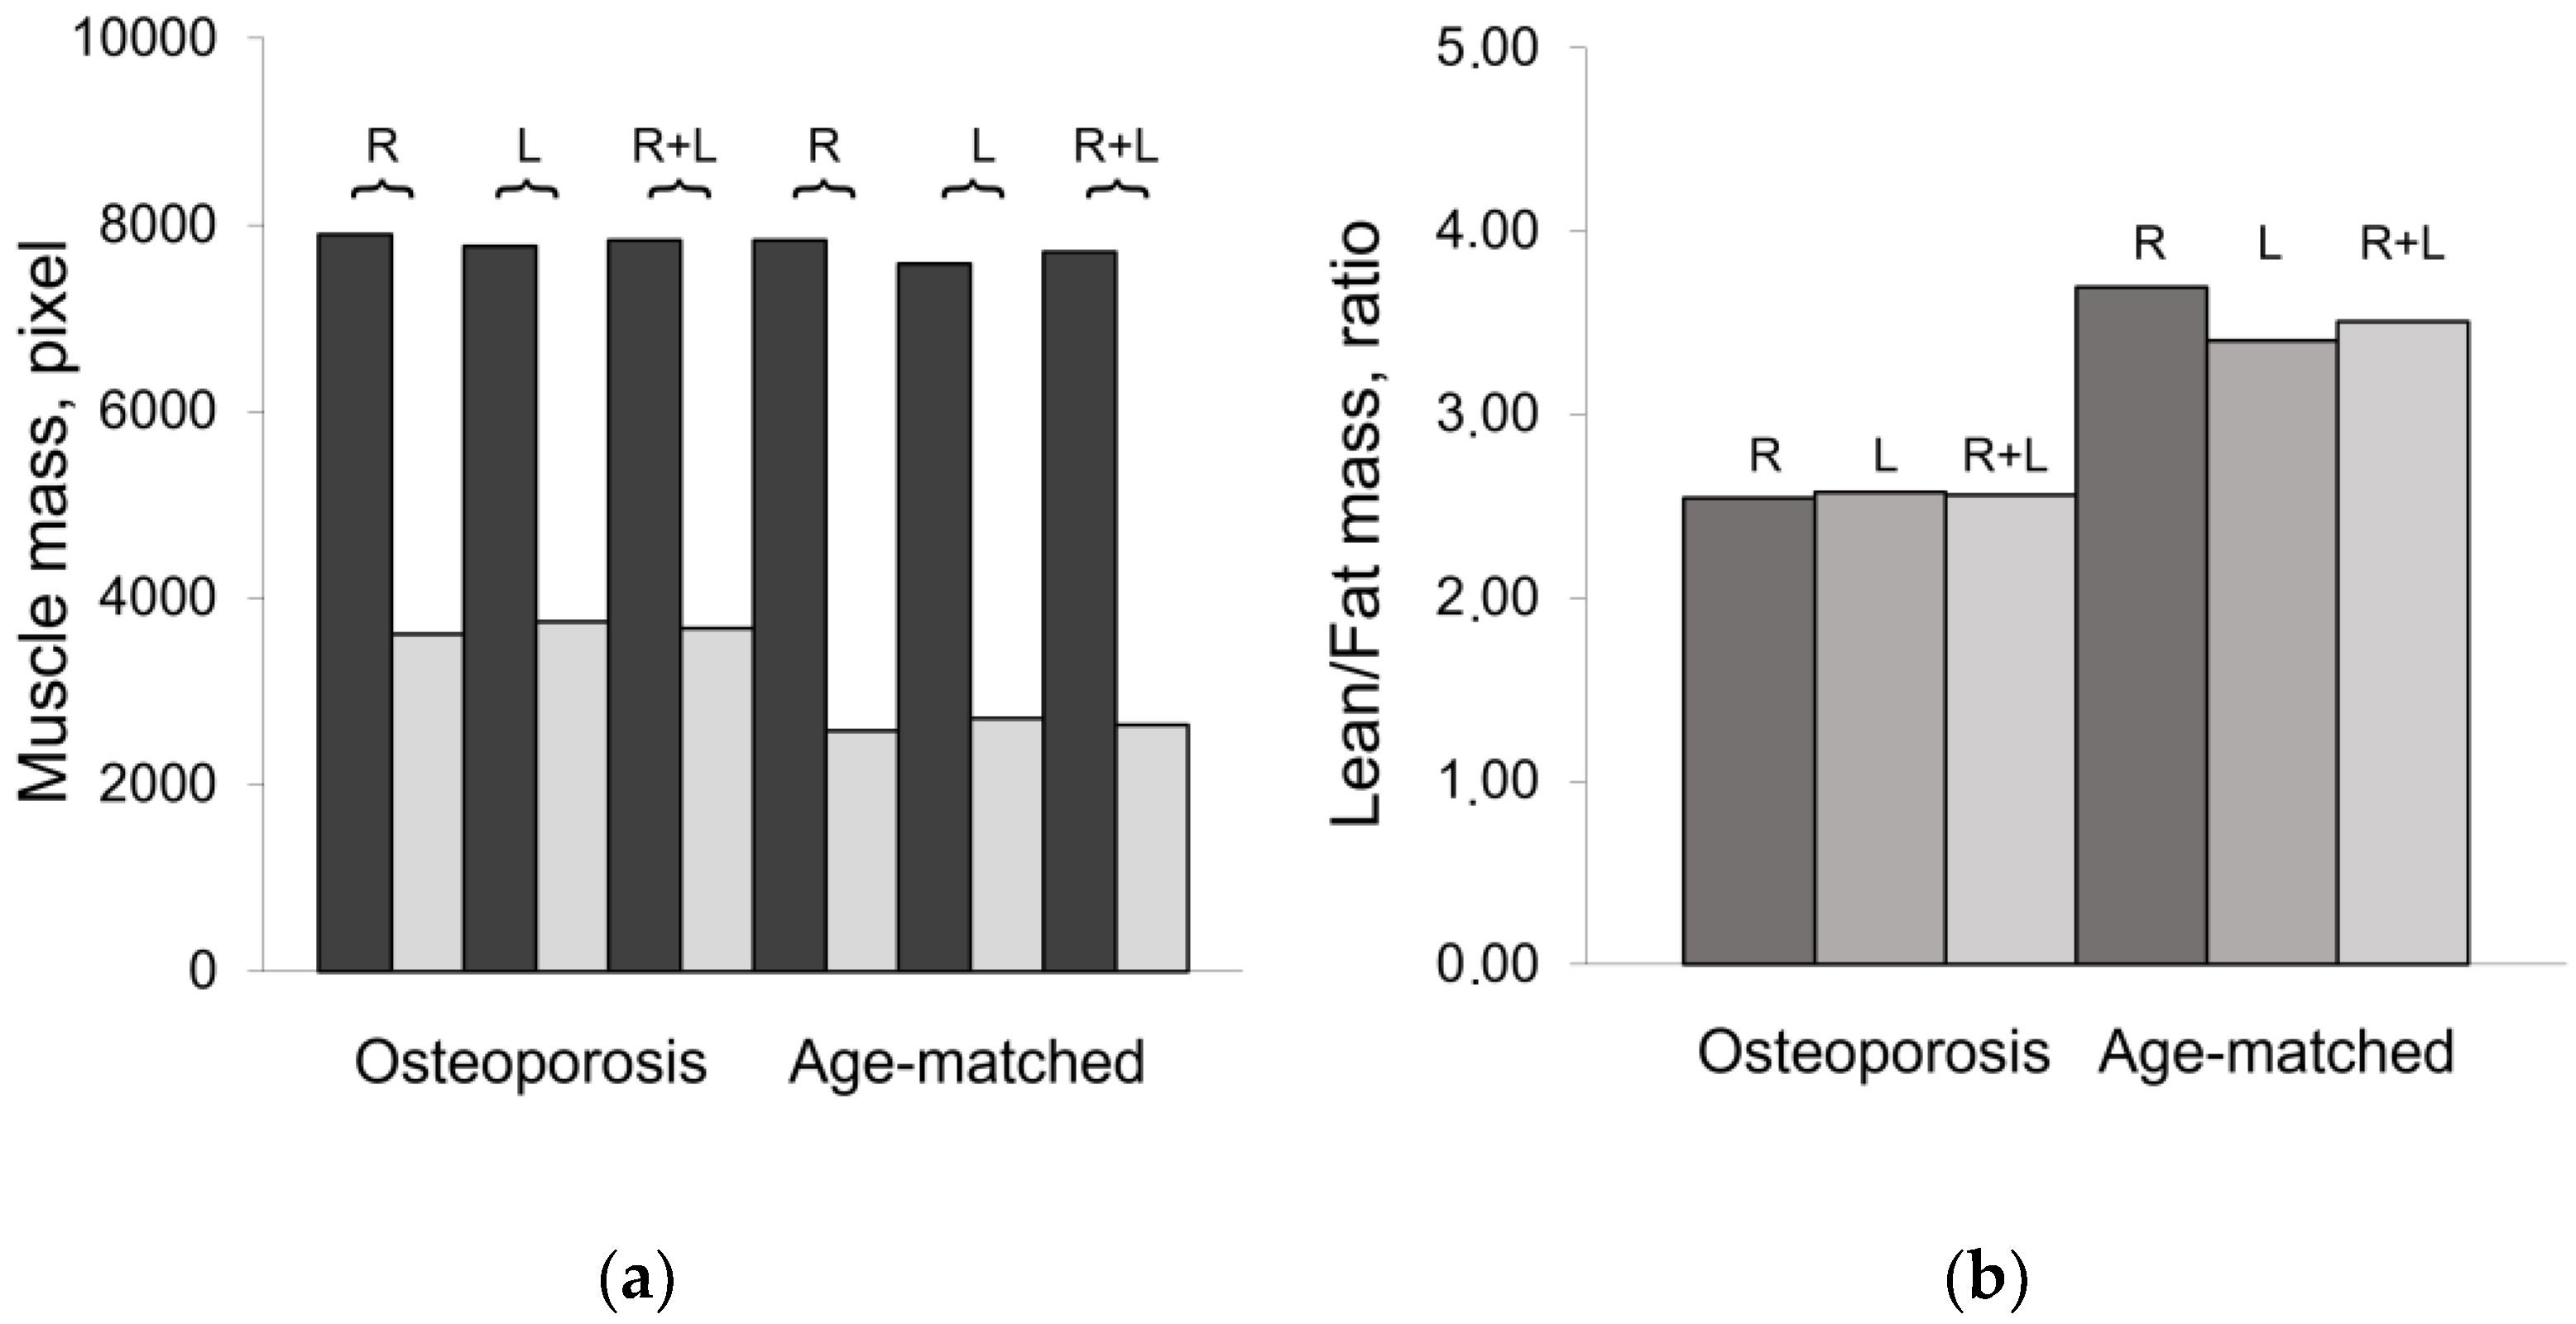
Figure 4.
Lacunarity of lean muscle area to estimate muscle fatty infiltration. (a) Age-related increasing trend of lacunarity parameter β in the whole sample; (b) Age related distribution of lacunarity parameter β in osteoporotic patient (black circle) vs. age-matched controls (gray circle) shows similar increasing trend but with values higher in osteoporotic patients than in age-matched controls.
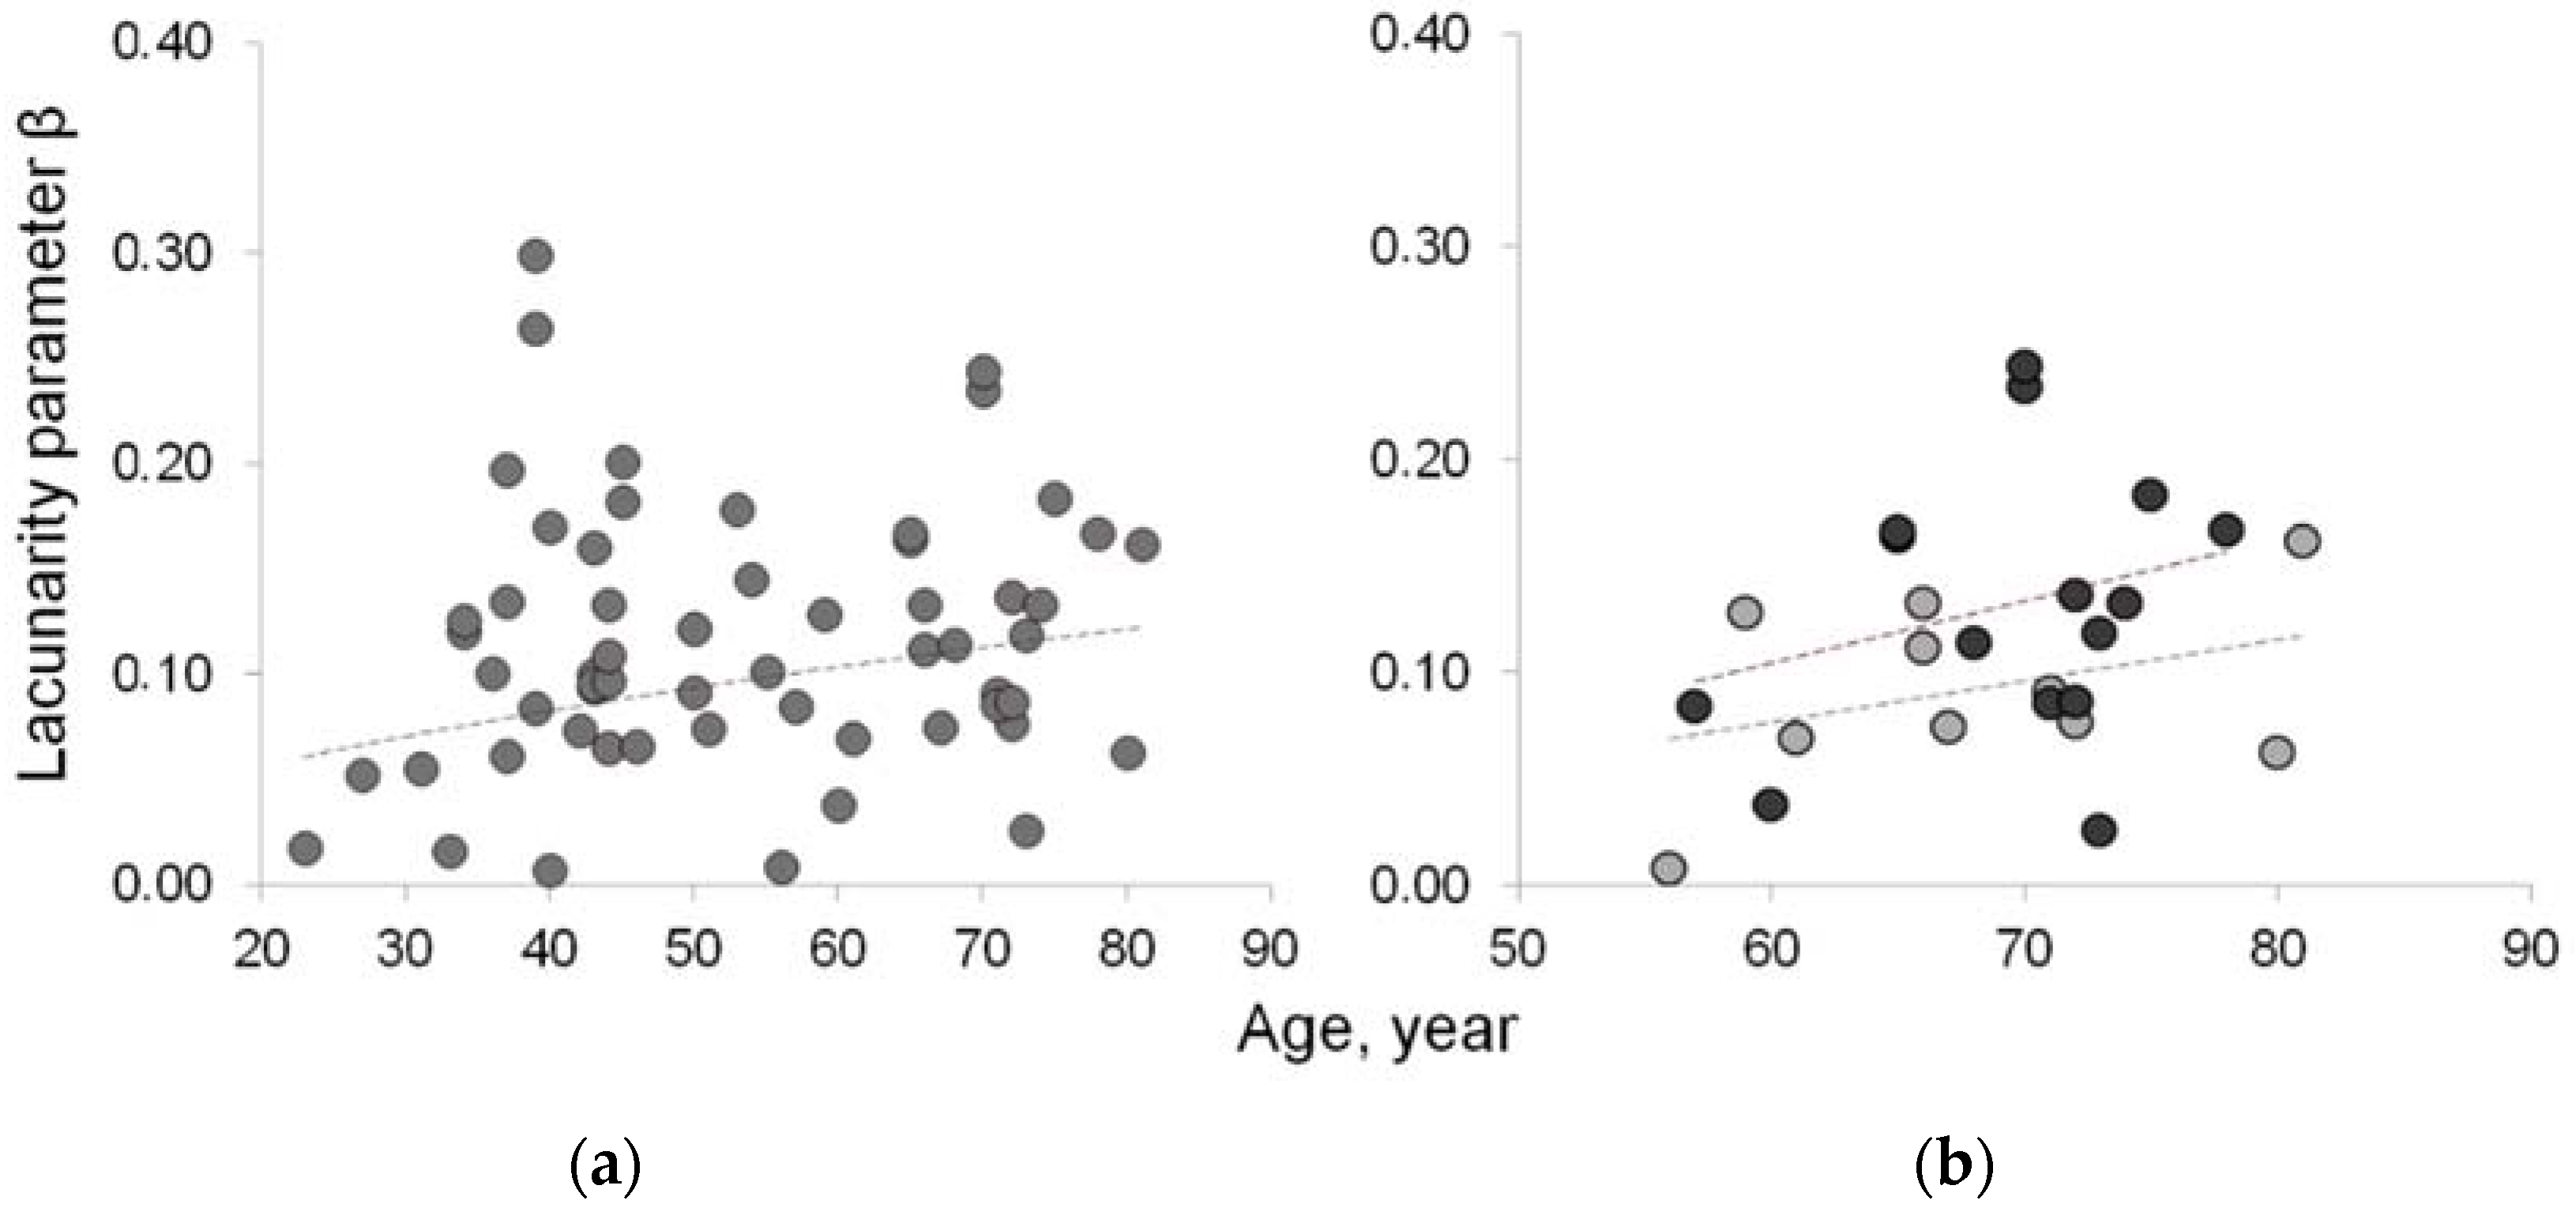
Figure 5.
Fractal features of lean muscle area. Lacunarity and succolarity as indices of muscle fatty infiltration: lacunarity (black) discriminates between osteoporotic patients and age-matched controls but not among the other age and physio-pathologic groups; succolarity (gray scale from dark to light gray for the four directions, ↑, →, ↓, ←, respectively) shows increasing values from Young to pre-Menopause to Menopause, the three age/physiopathologial groups showing similar lacunarity values.
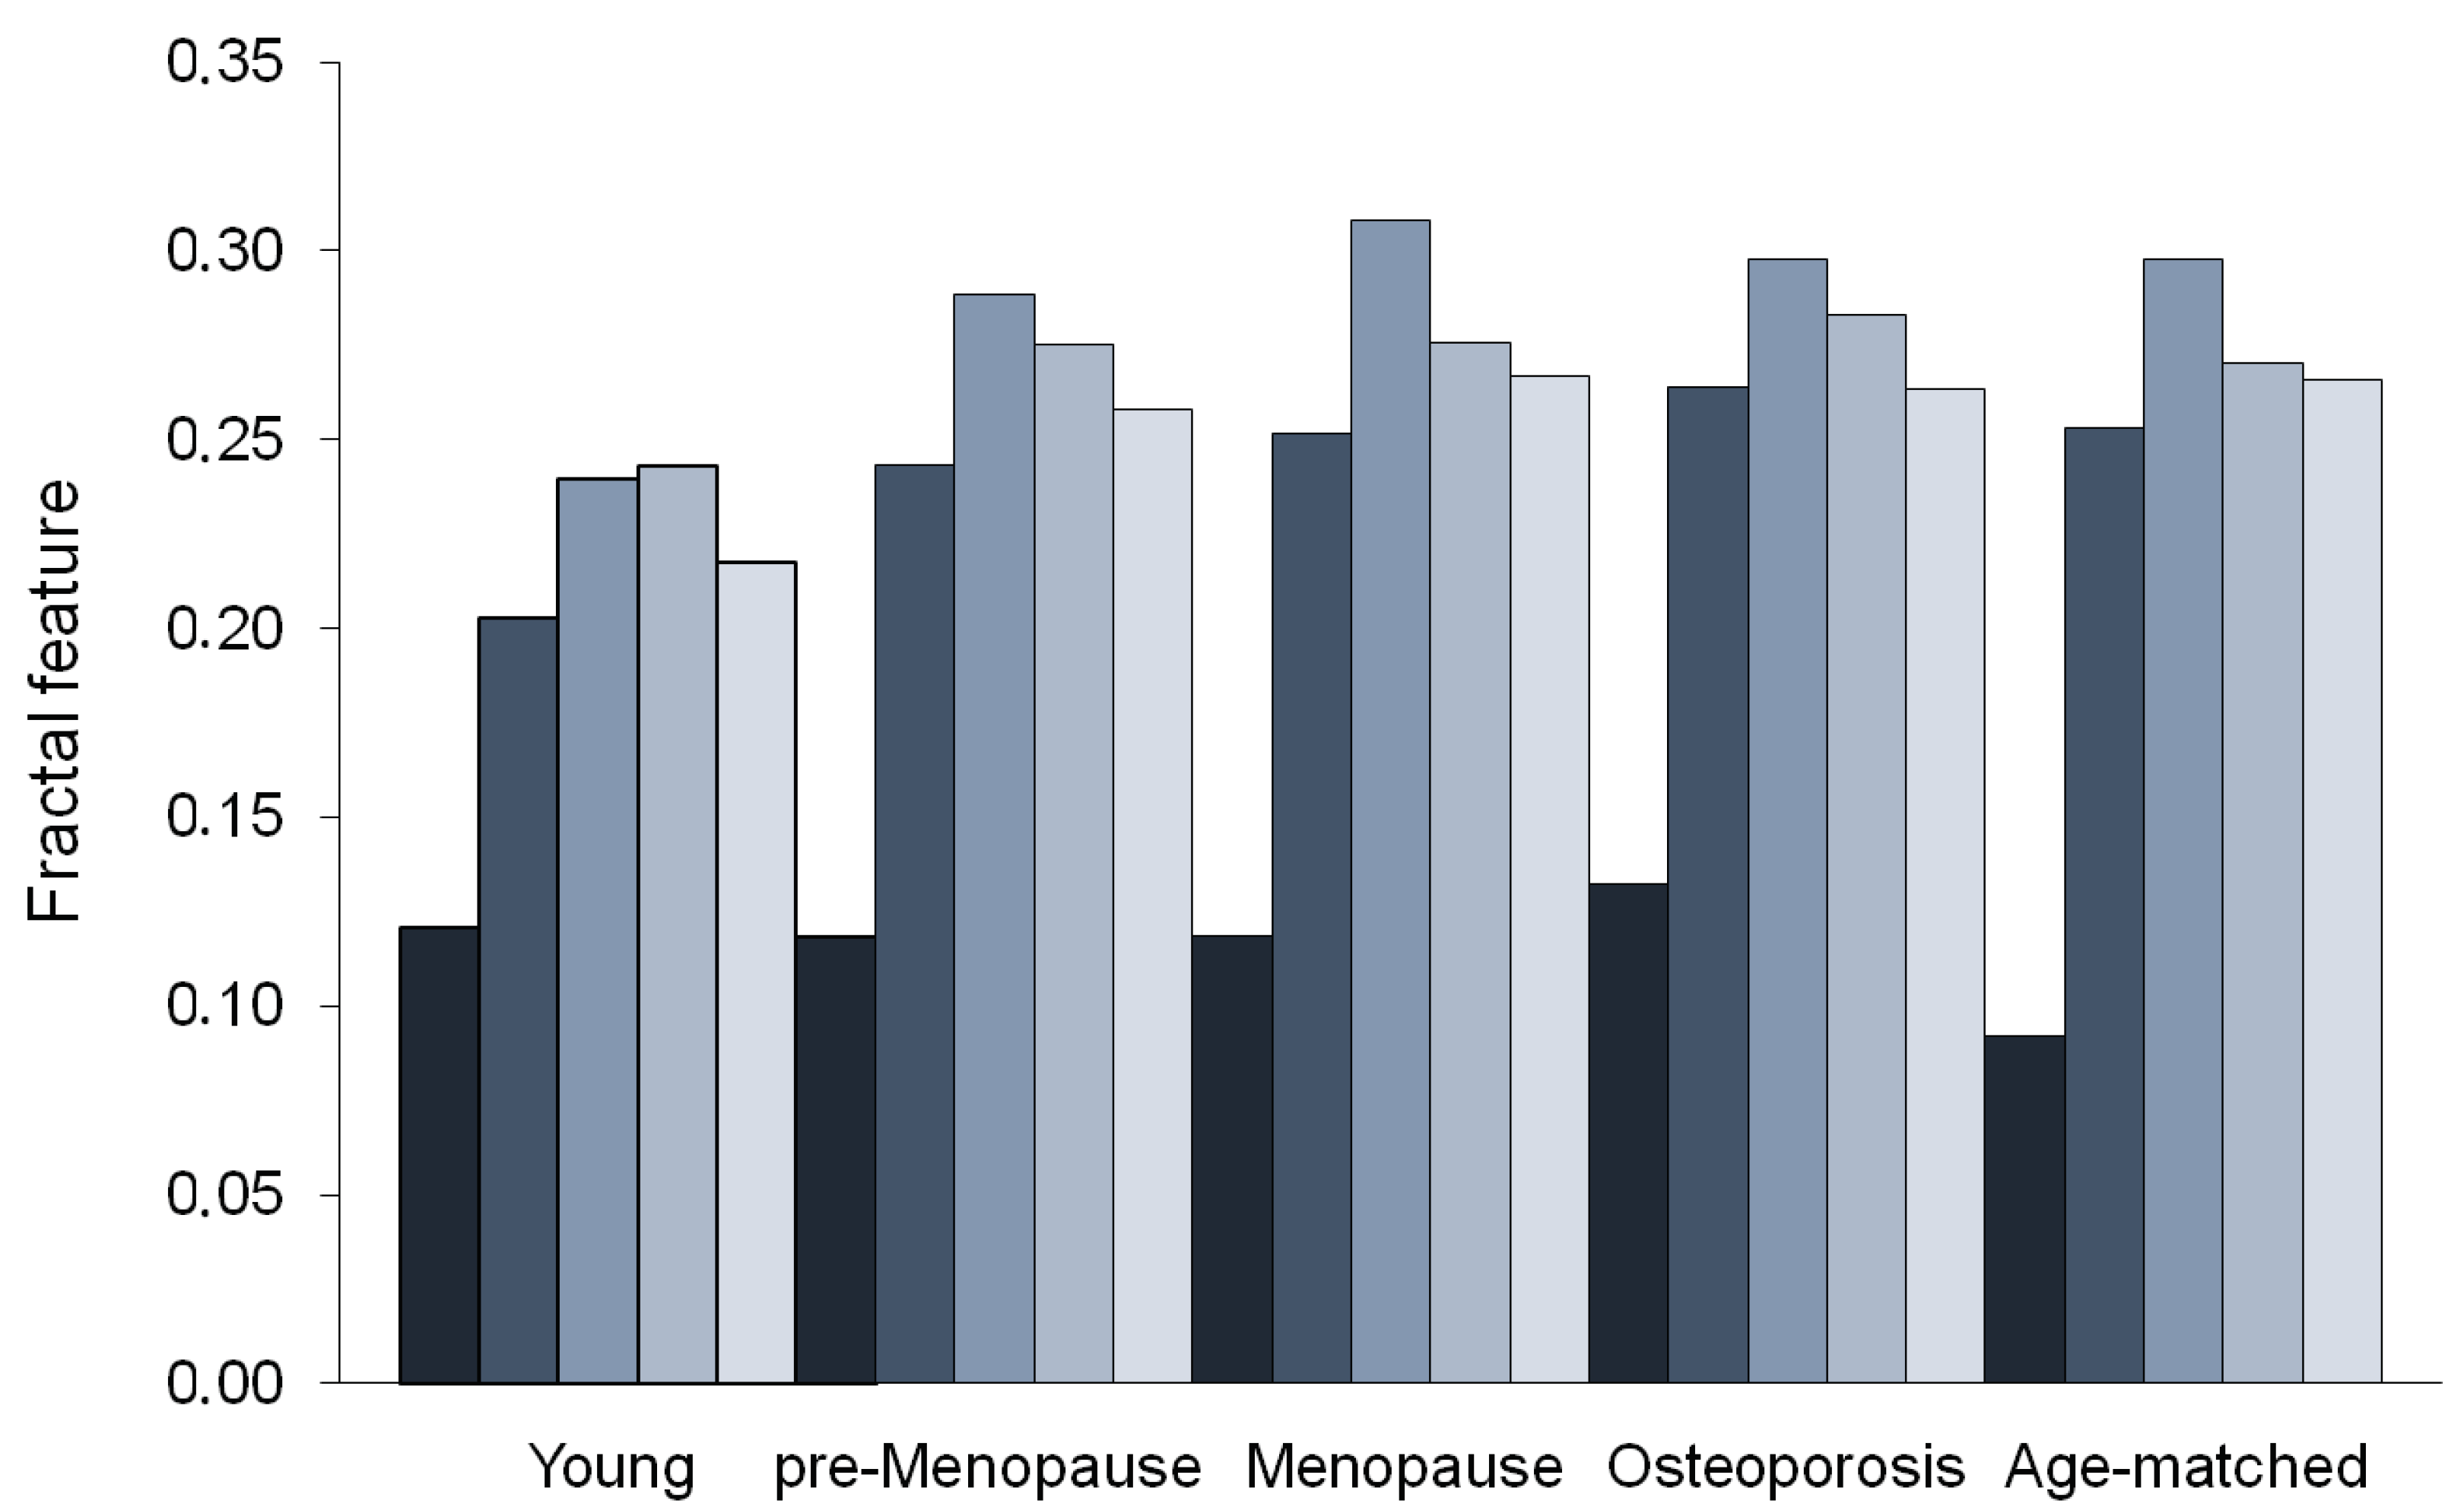

Table 1.
Demographic and clinical characteristics of subjects’ sample.
| Subjects | Number | Age Range | Mean Age 1 | Median Age |
|---|---|---|---|---|
| All | 59 | 23 - 81 | 53 ± 15 | 50 |
| Young | 15 | 23 - 40 | 35 ± 5 | 37 |
| Pre-menopause | 15 | 42 - 50 | 45 ± 3 | 44 |
| Post-menopause | 14 | 51 - 81 | 64 ± 10 | 64 |
| Osteoporosis 2 | 15 | 57 - 78 | 70 ± 6 | 71 |
| Age-matched 3 | 10 | 56 - 81 | 68 ± 8 | 67 |
1 Mean Age expressed as mean ± SD (standard deviation); 2 T-score ≤ -2.5 as defined by World Health Organization; 3 Age-matched control group for comparison with Osteoporosis group.
Table 2.
Paraspinal muscle composition by classical estimates.
| Subjects | TotCSA | LeanCSA* | FatCSA† | Lean/Fat Ratio |
|---|---|---|---|---|
| All | 11114 ± 1858 | 8507 ± 2608 (77%)* | 1925 ± 1153 (23%) | 4.40 ± 3.53 |
| Young | 11222 ± 1939 | 9364 ± 1929 (84%) | 1858 ± 1015 (16%) | 7.17 ± 5.73 |
| Pre-menopause | 10652 ± 1686 | 8481 ± 1105 (80%) | 2171 ± 838 (20%) | 4.34 ± 1.35 |
| Menopause | 11062 ± 2043 | 8332 ± 1609 (75%) | 2730 ± 1226 (25%) | 3.50 ± 1.54 |
| Age-matched 1 | 10356 ± 1215 | 7714 ± 1364 (75%) | 2642 ± 1018 (25%) | 3.51 ± 1.87 |
| Osteoporosis 2 | 11517 ± 1865 | 7837 ± 1449 (68%) | 3680 ± 1315 (32%) | 2.52 ± 1.34 |
Values are mean ± standard deviation expressed in pixel; * Percentage values within round brackets are % of LeanCSA referred to TotCSA; † Percentage values within round brackets are % of FatCSA referred to TotCSA; CSA: cross-sectional area; 1 Age-matched control group for comparison with Osteoporosis group; 2 Osteoporosis: bone mineral density T-score ≤ -2.5 as defined by World Health Organization.
Table 3.
Fatty infiltration of paraspinal lean muscle mass.
| Subjects | Young | pre-Menopause | Menopause | Age-matched | Osteoporosis | P value1 |
|---|---|---|---|---|---|---|
| Lean mass2 | 8586 ± 1778 | 7889 ± 1002 | 7277 ± 1638 | 6581 ± 1024 | 6890 ± 1402 | 0.286 |
| Fatty mass2 | 2234 ± 756 | 2444 ± 732 | 2894 ± 936 | 2813 ± 1041 | 3627 ± 1114 | 0.046 |
| Lean/Fat ratio ρ | 4.21 ± 1.33 | 3.57 ± 0.68 | 2.70 ± 0.76 | 2.61 ± 0.89 | 2.08 ± 0.67 | 0.057 |
| Lacunarity α | 0.900 ± 0.403 | 0.572 ± 0.350 | 0.639 ± 0.303 | 0.672 ± 0.316 | 0.639 ± 0.420 | 0.420 |
| Lacunarity β | 0.062 ± 0.039 | 0.113 ± 0.040 | 0.101 ± 0.044 | 0.092 ± 0.041 | 0.148 ± 0.062 | 0.012 |
| Succolarity µ↑ | 0.203 ± 0.075 | 0.243 ± 0.047 | 0.252 ± 0.070 | 0.253 ± 0.084 | 0.264 ± 0.077 | 0.371 |
| Succolarity µ → | 0.240 ± 0.085 | 0.288 ± 0.050 | 0.308 ± 0.070 | 0.298 ± 0.077 | 0.298 ± 0.080 | 0.499 |
| Succolarity µ ↓ | 0.243 ± 0.096 | 0.275 ± 0.042 | 0.276 ± 0.072 | 0.270 ± 0.086 | 0.283 ± 0.086 | 0.361 |
| Succolarity µ ← | 0.218 ± 0.080 | 0.258 ± 0.042 | 0.267 ± 0.071 | 0.266 ± 0.084 | 0.263 ± 0.079 | 0.470 |
Results are mean ± standard deviation; 1 p Values calculated by one-tail t-test for p≤0.05 to compare differences between osteoporosis and age-matched control groups; 2 lean and fatty mass related to lean muscle area (LeanCSA); α and β: fractal parameters from our hyperbola model method where α correlates with fractal dimension and β measures fractal lacunarity; μ↓, μ←, μ↑, μ→ are the succolarity indices for the directions considered.
Disclaimer/Publisher’s Note: The statements, opinions and data contained in all publications are solely those of the individual author(s) and contributor(s) and not of MDPI and/or the editor(s). MDPI and/or the editor(s) disclaim responsibility for any injury to people or property resulting from any ideas, methods, instructions or products referred to in the content. |
© 2024 by the authors. Licensee MDPI, Basel, Switzerland. This article is an open access article distributed under the terms and conditions of the Creative Commons Attribution (CC BY) license (http://creativecommons.org/licenses/by/4.0/).
Copyright: This open access article is published under a Creative Commons CC BY 4.0 license, which permit the free download, distribution, and reuse, provided that the author and preprint are cited in any reuse.


