Submitted:
21 February 2024
Posted:
22 February 2024
You are already at the latest version
Abstract
The Sanaga River Valley is a deep-seated structure of about 220 km in width, bounded on its northern and southern sides by 025-0550 fault zones. Its internal structure has been very little described before this study. It is characterized by the presence of surface features where a thick stratum of shale and argillaceous sandstones have been documented. The use of electrical resistivity tomography for near-surface imaging and hydrogeological prospecting within shale succession is widespread. However, several methods of spatial modeling of resistivity contours are generally proposed for the interpretation of inverse resistivity model sections. To determine the most appropriate method for interpreting resistivity tomographies in the context of subsoil marked by significant heterogeneity, logarithmic contour intervals, and linear contour interval processing were implemented on data collected over five areas. The data consists of outcrops data, cuttings samples from groundwater boreholes, and resistivity sections ranging in length from 240 to 1000 m. Well-control of the inverse resistivity model sections derived from both processes shows that the linear contour intervals modeling gives a more realistic picture of the reservoir size of the wa-ter-bearing sand in both shale and argillaceous sandstone succession. The sedimentary architecture over Sanaga fault breccia is marked by vertical intrusion anomalies up to 80 m high. The shape of these anomalies, as well as the very low resistivity values that characterize them, suggests that they could be related to mud intrusion.
Keywords:
Electrical resistivity tomography
; Precambrian fault belt
; Sanaga River Valley
; low-grade metamorphic rocks
; fault breccia aquifers
1. Introduction
The Sanaga (Figure 1) is the longest and largest river system in Cameroon. It flows through a contorted drainage pattern characterized by the association of three main structural trends, including NW-SE, N-S, and NE-SW fault traces. The regional study carried out by [1] indicated that these fault lines are commonly associated with linear depressions of up to 550sqkm and igneous intrusions of Paleozoic age [57]. According to [2,3], these depressions hosted continental and shallow marine sediments of 100 m to more than 400 m thick. Also, during the 1970 and 1980 hydrogeological research missions, these features were targeted as clastic aquifer systems [4,5,6,7,8,9,10]. To date, several of these surface structures have been drilled (Figure 1), but a clear definition of their hydrogeological conditions and reservoir parameters prediction is still not documented or published. Collaborative projects carried out through funding from the public administrations, groundwater companies, and international cooperation, have enabled new data to be collected. The study involves analysis of wells and geophysics data derived from these projects. The produced cross-sections show prominent features that can help aquifers risk assessment of the Sanaga water-bearing complexes and fault breccia.
2. Geological Setting
The Sanaga Valley Fault System (Figure 1) trends east-north-east, west-south-west for approximately 510km long and 85km wide across the Pan-African belt of the north Congo Craton. It’s one of the geotectonic elements of the Central African shear zone [11,12,13,14,15]. The westernmost segment (Figure 2) of this structure corresponds closely with the Paleozoic rift trend of the South Atlantic Ocean [16]. Its eastern segment runs from Puma to Lom basin (Figure 2) passing through the Kikot-Ndockoa plain and is most famous for alluvial gold production in the Betare Oya district. Studies carried out by several authors [17,18,19,20] indicated that the gold-bearing rock formations in the Lom basin consist of argillaceous sandstones with intercalations of volcanic sequences. The regional geology (Figure 2) of the study is characterized by a predominance of Meso- and Neoproterozoic bedrocks [21,22,23]. Field observations conducted by many authors [24,25,26,27] show that these bedrocks are subdivided into two series. Namely, a high-degree suite [23,24,25,26,27,28,29] represented by granitic to migmatitic gneisses belt of Bafia, Lom, and Mbalmayo-Bengbis domains; and a low-grade series represented by schists, phyllite, and slate formations [30,31]. According to some previous studies [2,9,10,32] Paleozoïc to early Mesozoic sedimentary rocks covered part of basement formations. Also, many areas with fault rocks and areas in which the basement sequences are covered with a thick stratum of alteration or alluvium have been documented [9]. The data presented in this article provide more arguments about the deposition architecture of these sequences.
3. Data and Methods
The data used for this study consists of outcrop photographs, electrical resistivity images, and cuttings samples acquired over buttes and season river spreading topo-graphic areas. These data were collected through five rural hydraulic projects, financed by local administrations, individuals, and international cooperation. The main work carried out during these projects includes geological and hydrogeological site recognition, geophysical measurements, drilling operations, and water flow rate evaluation. In addition to these recordings, the free-air satellite gravity data version (V21.1, Figure 1) derived from the global gravity database [33] was used in this study for the spatial reconstruction of basement deformation around the Sanaga and adjacent areas. According to [34], this gravity database contains a shorter wavelength (< 14 km) and spatial resolution (~7 km) adequate for the study of subsurface deformation.
3.1. Site Recognition
The site survey consists of a 1 km radius walk around the perimeter of the project area to identify the nature of the rock outcrops encountered, calculate the valley floor elevation, and make a catalog of the previous groundwater engineering projects. This step also provided the constraints of the geophysics survey design.
3.2. Data Acquisition and Processing
Electrical prospecting, and in particular the resistivity tomography imagery, is widely known for its applications in the delineation of hydrogeological features within the basement and sedimentary formations [35,36,37,38,39,40,41]. In this study, measurements of the resistivity were performed to reach hydrogeological targets that could be located at a depth of 120 m. The choice of this depth range was guided by the results of previous research [9] and the valley floor elevation of 80-100 m measured during the site recognition. Also, to fully describe the lithological succession over this depth interval, several lengths of devices and inter-electrode spacing were used. The most important exploration system used, consisted of a 1000 m long streamer, composed of 50 traces spaced 20 m apart (Table 1).
Table 1 provides a summary of the experiments. The equipment system used to collect these data was a Syscal R1 equipment. Each profile was recorded at eleven levels and with a listening time of four seconds. Also, to ensure the proper working of the system and the accuracy of the recording data, a quality assurance procedure was implemented before, during, and after each acquisition (Figure 3). This procedure includes:
- The identification of potential parasitic sources along the survey line;
- The pushing of the electrodes steel 3/4 in the ground;
- The resistance checking of the connections;
- The visual inspection of the dispersion coefficient (Dev, Figure 3a) during the machine running process. Indeed, during this stage, the machine calculates a Dev and displays it on the screen for each data point or stack. This provides information on the quality of the measuring sequence. The number of stacks (minimum and maximum) and the minimum value of the Dev parameter are defined when the sequence is created. The measurement is repeated as many times as necessary until the Dev value reaches the setting value (Dev ≤ 20 %, Figure 3). If this value is not reached, the system performs additional stacks, up to the defined maximum number;
- The quality control of the measured apparent resistivity pseudosection (Figure 3b) at the end of the process to detect any problems that may have occurred during the survey.
The analysis of the data grid recorded (Figure 3b) revealed that from 449 resistivity data points measured in the ER-03 profile (Table 1), 445 recorded have a Dev value of less than 20%. The processing of these measurements consists of converting the measured apparent resistivity pseudosection (Figure 4) into an interpretable geological model using the inversion program proposed by [36]. Therefore, in addition to the definition of inversion parameters, the processing sketch implemented includes, the examination of the modelled sections (Figure 4). This procedure allows us to select the inversion result that best correlates with the drilling data.
As the overall dip of the geological structure of the study areas was unknown, the method adopted to optimize the geophysical measurement was to collect data along lines arranged at 90°. Therefore, the preliminary phase of this campaign consisted of carrying out electrical profiling to locate anomalies of lateral variations of geological formations [42]. The device used for all these measurements was the Wenner-Shlumberger four poles array [43]. According to [43], this configuration is a combination of two measurement systems and combines sensitivity and signal amplitude. Another advantage is that the operator can use it in noisy terrain and without prior knowledge of the geometry of the geological body to be studied.
4. Results
Resistivity sections presented in Figure 5 describe the profile of the subsoil comprised between the ground surface and a maximum depth of 90 m. Also, using the electric character of each line, we have distinguished five main resistivity facies on the mapping deposystem. These facies are described below in terms of geoelectric units (Table 2) from depth to the topographic surface.his section may be divided by subheadings. It should provide a concise and precise description of the experimental results, their interpretation, as well as the experimental conclusions that can be drawn.
- Unit U1
Its electrical attribute is most developed in sections ER-01, ER-02, and ER-03 (Figure 5). It corresponds to a very conductive body with a constant resistivity character ranging between 10-300 Ω.m. The base of this unit is not specially imaged because of the lengths of the survey array used. Its top appears at very variable depth due to its configuration marked by anomalies of plume corps which cross vertically the whole sequence in the form of a diapir or dyke. The results obtained on profile ER-03 show that the height of these anomalies can reach 80 m locally.
- Unit U2
This unit corresponds to a very resistant unit compared to its overlying U1 sequence. Its thickness in profile ER-01 (ER-01, Figure 5) varies between 23 and 45 m, while its resistivity over the ER-01 and ER-04 sections varies between 409 and 5020 Ω.m. Its external configuration with the form of a progradation wedge is locally restructured by deep deformation.
- Unit U3
This consists of a conductive terrain with resistivities varying between 60 and 700 Ω.m and corresponds to the most widespread facies of the study area. Its base follows the morphology of U2 on almost all the profiles, whereas it seems to be only slightly eroded on profile ER-04 (Figure 5). Regionally, its external structure corresponds to a bed-ding sequence whose thickness varies between 25-40 m. Its internal structure near the floodplain (ER-04, Figure 5) is characterized by a most continuous sequence of conductive character.
- Unit U4
This unit is semi-resistant and is more developed in the areas where the valley floor elevation is higher (30 to 80 m). Its electric character (ER-03, Figure 5) is almost uniform and reflects a resistivity range between 669 and 6031 Ω.m. On profile ER-04 its base shows signatures that could correspond to erosion marks. The limit of its top locally coincides with the topographic surface, especially in areas of low valley floor elevation (10-15 m). Also, its thickness varies laterally from 20 m in the transition zone to 70 m in the source zone of the Sanaga River channel. Regionally, its internal structure is characterized by a vertical alternation and includes resistive and conductive sequences. The resistive sequences appear locally in the form of small lens structures (ER-03, Figure 5).
- Unit U5
U5 (ER-03, ER-05, Figure 5) is a semi-conductive unit with resistivity values comprised between 594 and 874 Ω.m, located directly in contact with the topographic surface. The electric pattern observed on profile ER-05 (Figure 5), shows that U5 is more developed at the hilltop and along the slope of topographic depressions. Its thickness reaches locally 15 m.
5. Discussion
5.1. Data Accuracy and Deep Attributes of the Sanaga Buttes and Season River Spreading Topographic Features
Several authors have presented inversion software and algorithms for processing electrical resistivity tomography data [36,38,44,45,46]. The objective of these processing approaches is to produce a model of the subsurface attributes that is close to the geological subsoil crossed by the electric current. This study uses the algorithms developed by [36] to process the data.
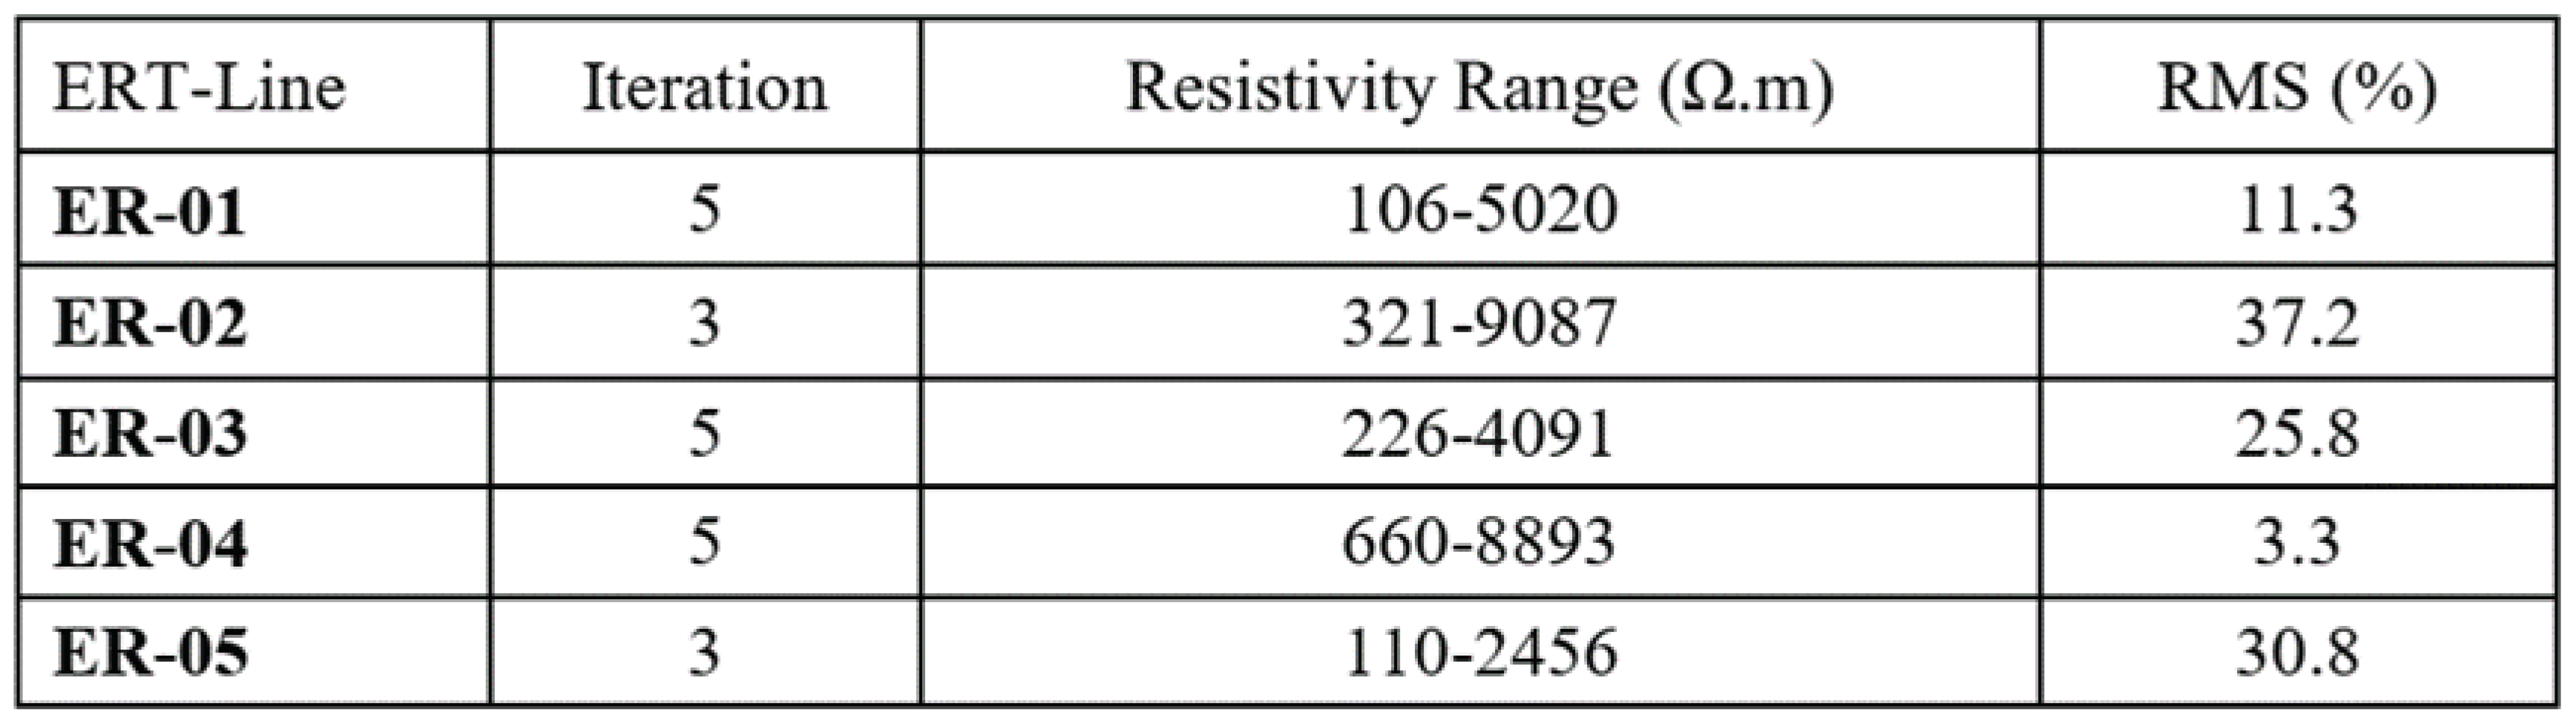
The wide use of this algorithm by many academics and private companies is a credit to its performance [40]. Table 2 shows the RMS values obtained at the end of the inversion process of each line and testify to the quality of the measurements made. Also, from a detailed analysis of all inversion results it appears that the resistivity values of 159-22011 Ω.m recorded in the ER-01 profile are affected by an error of a factor of 10% which is propagated over the entire section. This error is because the ground where the electrodes were placed at the time of the measurements was too dry and consisted of an indurated horizon. Therefore, for the interpretation of the highlighted formations, two types of inverse model sections display have been implemented. These included the logarithmic and the linear contour intervals display. The control of the accuracy of sections obtained from both methods allows us to discover that the modeling using linear contour intervals produced element size of geologic features that better correlated with the drilling results (Figure 6). This method is well known for the interpretation of induced polarisation tomography [40]. The results obtained in this study show that this method can be also applied to resistivity data for the recognition of a thin sand layer in weathering or massive clay succession. Thus, in addition to the fundamental aspect based on the determination of the geological model from the resistivity measurements, the results obtained provide new elements that contribute to the discussion on the lithology and deformation of the study area. From the spatial analysis of the data collected including electrical resistivity measurements (Figure 5), boreholes (Figure 6), and field observations (Figure 7), we find that the subsurface geology of buttes and season river spreading zones of the Sanaga Basin consists of sedimentary deposits. The diversity of facies observed on the ER sections (Figure 5) and their low level of compaction marked by drill-ing tool advancement speeds of less than one minute per meter suggests that they may be Paleozoic to Early Mesozoic sedimentary sequences described by previous studies [2,9,10,47]. The most remarkable facies are that of Unit 3 (Figure 7) which shows an almost rhythmic alternation of red, pink, gray, brown, and black shale facies. In contrast, the resistivity facies of unit U4 appear much more uniform. The overall sequence shows vertical intrusion anomaly marks. The shape of these anomalies recorded in ER-03 (Figure 8) as well as the very low resistivity values measured at the contact of these bodies suggest that they could be related to mud intrusion. Also, the identification of brackish saline water in some traditional boreholes of the study area suggests that this mud section may be salt-rich.

Table 3.
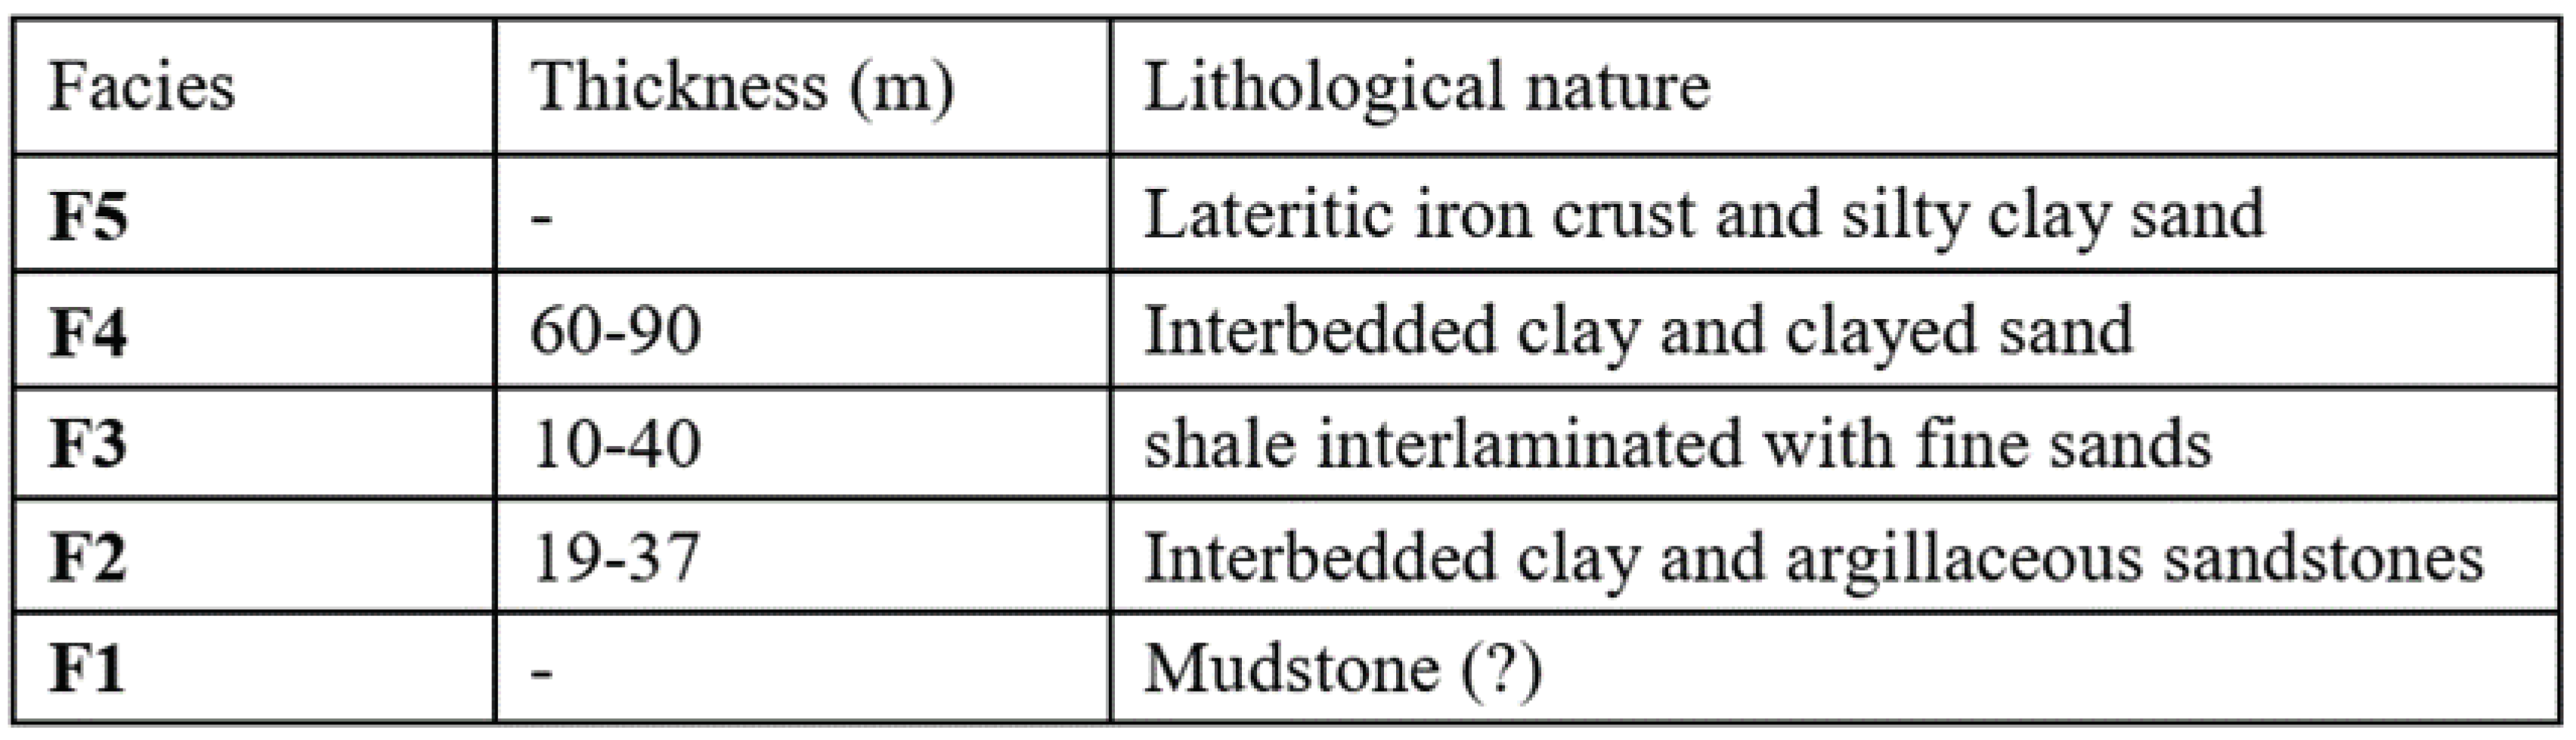
Lithological interpretation of identified electrical units.
5.2. Hydrogeological System and Sub-Outcrop Aquifers of the Buttes and Season River Spreading Zones of the Sanaga Basin
Two approaches are generally used to interpret electrical units in terms of the hydrogeological situation. These approaches include the auxiliary method and the well-constrained method [48,49]. The auxiliary method requires a pre-calculated catalog of the field model prospected. By using this method, the hydrogeological context composed of a gneiss-weathering sequence is generally described by a C-R-type electrical model [49]. While shale and sandstone succession tie with the C-R-C type electrical model [48]. By considering these assumptions, it can be argued that the facies model of C-R-C-R-C (U1, U2, U3, U4, and U5) obtained from the records of this study describes sedimentary covers. This model seems to be in good agreement with borehole information (Figure 7) and reveals a relatively deep sub-outcrop hydrogeology composed of clastic and covered-fault aquifer systems. None of the wells drilled during the project underline the lithological nature of facies U1 (Table 3). However, the presence of a large proportion of mud in the sandstone level drilled in the borehole W-01 (ER-01, Figure 6) suggests that these facies possibly describe a mudstone sequence. Further, comparing ER results and well data allows us to discover that sedimentary buttes of the Sanaga Basin contain two potential hydrogeological systems. The first is represented by discrete levels of shallow (30-40m, 60-80m) and deep buried (>110m) water-bearing sand giving a yield of 3-5 m3/hr. The second system is found in areas where the deep sedimentary section (sandstone complex) is fractured and faulted. Detailed reconstruction of topographic anomalies (Figure 1a) of the study area shows that the ground pattern of this system ties with 030-0900 fault trends and describes a basement fabric having a wide range of tensional faults parallel to the Cameroon Volcanic Line (Figure1c). Within the littoral and marine regions, these features are not continuous but consist of 125-1650 fault segments parallel to the Equatorial Atlantic rift axis [50,51,52,53,54]. Also, when considering the age of igneous and volcanic provinces reported along the Central African regions [55,56,57], our observation is that this segmentation (Figure 1) developed in response to the Pan-African collision between the Brazilian and Oubangui-Chari craton.
6. Conclusions
Alluviums and unconsolidated sediments regularly cause problems of slumping and drilling failure when their presence in the crystalline bedrock is unknown in advance. Geophysical models of the C-R-C-R-C type recorded over 150 m depth and on five surface features of more than 50 km apart show that sedimentary deposits with a mud bedrock are scattered within the Sanaga Valley fault system. These deposits have a deep hydrogeological potential associated with sand channels which can be useful for the water supply of local populations and industries of the study area.
Author Contributions
Data acquisition, processing, and interpretation, M.Y., N.N.M.M., and A.R.; writing, review and editing, M.Y., A.R., and N.N.M.M.; supervision, A.R., J.Q.Y.A., T.L., and P.D.N.; funding data acquisition, A.R. All authors have read and agreed to the published version of the manuscript.
Funding
This research was partially funded by LABOGENIE and the IRD (Institute of Research for Development, France) in the context of the South-North Research Program (University of Youndé I, LABOGENIE and Geoazur-IRD (France)).
Institutional Review Board Statement
Not applicable.
Informed Consent Statement
Not applicable.
Data Availability Statement
The data of this study are available from the corresponding author upon reasonable request.
Acknowledgments
The authors acknowledge Mr. Philippe Nouanga, the former General Manager of LABOGENIE, for his positive attitude regarding the program.
Conflicts of Interest
The authors declare no conflicts of interest.
References
- Collignon. 1968. Gravimtttrie de rconnaissance, Cameroun. ORSTOM, Paris, 35pp.
- BRGM, 1979. Carte de planification des ressources en eau du Cameroun.
- Gazel and Gerard. 1954. Carte géologique de reconnaissance du Cameroun à l’échelle du 1/500 000, feuille Abong-Mbang-Ouest avec notice explicative. Direction des Mines et de la Géologie, Yaoundé-Cameroun, 34p.
- Biscaldi.1970. Hydrogeologie de la nappe phreatique du Logone-ChariTchad, rapport de fin de mission 1969 1970, BRGM report YAO 003.
- Peaudecerf, P. , 1970. Etudes hydrogéologiques de la nappe phréatique du Logone-Chari Tchad, compléments hydrodynamiques, BRGM report 70 YAO 005.
- Le Fur, Y. , 1971. Les indices de cuivre du groupe volcano-sédimentaire de Poli (Cameroun). Bulletin Bureau Géologiques Minières, 2ème série, section II 6, 79-91.
- UN : United Nations, 1975. Recherche et exploitation pilote des eaux souterraines dans le Nord-Cameroun. Final Report.
- Dubreuil, P. , Guiscafre J., Nouvelot J. F., Ollvry. J.C. 1975. Le bassin de la rivière Sanaga. ORSTOM-Paris, 431p.
- ONAREST, 1976. Carte pédologique et d’aptitude pour la canne à sucre du site sucrier de Camsuco à Mbandjock – Nkoteng.
- Martin, D. , 1966. Études pédologiques dans le Centre Cameroun (Nanga-Eboko à Bertoua). O.R.S.T.O.M, Paris (1966). 159pp.
- Bourgeois, M. , 1980. Notice explicative des cartes de planification des ressources en eau du Cameroun. Bureau de recherches géologiques et minières (BRGM), agence d'études de géologie appliquée à l'étranger.72p.
- UN: United Nations, 1988. Groundwater in North and West Africa: Cameroon. United Nations Department of Technical Cooperation for Development and Economic Commission for Africa, Natural Resources/Water Series No. 18, ST/TCD/5.
- Dumont, J.C. Identification par télédétection de l'accident de la Sanaga (Cameroun). Sa position dans le contexte des grands accidents d'Afrique centrale et de la limite nord du craton congolais. Géodynamique 1986, 1, 13–19. [Google Scholar]
- Fairhead, J.D. Geophysical controls on sedimentation within the African Rift Systems. In Sedimentation in the African Rifts; Frostick, L.E., Renaut, R.W., Reid, I., Tiercelin, J.-J., Eds.; Geol. Soc. Spec. Publ., 1986; Volume 25, pp. 19–27. [Google Scholar] [CrossRef]
- Moreau, C.; Regnoult, J.M.; Deruelle, B.; Robineau, M. A new tectonic model for the Cameroon Line. Centr. Afr. Tect 1987, 141, 317–334. [Google Scholar] [CrossRef]
- Vicat, J.P. 1998. Esquisse géologique du Cameroun. Presses universitaire.
- Déreelle, B.; Ngounouno, I.; Demaiffe, D. The ‘Cameroon Hot Line’ (CHL): A unique example of active alkaline intraplate structure in both oceanic and continental lithospheres. C.R. Geoscience 2007, 339, 589–600. [Google Scholar] [CrossRef]
- Castaing, C.; Feybesse, J.L.; Thieblemont, D.; Triboulet, C.; Chevremont, P. Palaeogeographical reconstructions of the Pan-African/Brasiliano orogen: closure of an oceanic domain or intracontinental convergence between major blocks? Precambrian Research 1994, 67, 327–344. [Google Scholar] [CrossRef]
- Soba, D. , Michard, A., Toteu, S.F., Norman, D.I., Penaye, J., Ngako, V., Nzenti, J.P., Dautel, D., 1991. Données géochronologiques nouvelles (Rb–Sr, U–Pb, Sm–Nd) sur la zone mobile panafricaine de l’Est Cameroun : âge Protérozoïque supérieur de la série de Lom. Comptes Rendu de l’Académie des Sciences, Paris, 315, 1453–1458.
- Ntep Gweth, P. 2001. Ressources Minérales du Cameroun. Note explicative de la carte thématique des ressources minérales du Cameroun sur un fond Géologique. Ed SOPECAM Yaoundé, MINMEE, 375p.
- Nzenti, J.P. (1998). L’Adamaoua panafricain (region de Banyo) : une zone clé pour un modèle de la chaine panafricaine nord-équatoriale au Cameroun. Thèse de Doct d’état, 176p. univ. Cheick Anta Diop-Univ de Nancy I.
- Mvondo Ondoa, J. (2009). Caractérisation des évènements tectoniques dans le domaine sud de la chaine panafricaine au Cameroun: styles tectoniques et géochronologies des séries de Yaoundé et Bafia Th. Doc. Univ. Ydé I, 209p.
- Nkoumbou, C.; Barbey, P.; Yonta-Ngoune, C.; Paquette, J.L.; Villiéras, D.F. Pre-collisional geodynamic context of the southern margin of the Pan-African fold belt of Cameroon. J. Afr. Earth Sci. 2014, 99, 245–260. [Google Scholar] [CrossRef]
- Toteu, S.F. , Michard, A., Macaudière, J., Bertrand, J.M., et Penaye, J. 1986. Données géochronologiques nouvelles (U–Pb et Rb/Sr) sur la zone mobile panafricaine du nord Cameroun. Comptes Rendue de l’Académie des Sciences, Paris, 303: 375–378.
- Toteu, S.; Van Schmus, W.; Penaye, J.; Michard, A. New U-Pb and SmNd Data from North-Central Cameroon and Its Bearing on the Pre-Pan African History of Central Africa. Precambrian Research 2001, 108, 45–73. [Google Scholar] [CrossRef]
- Toteu, S.F.; Penaye, J.; Poudjom Djomani, Y.H. Geodynamic evolution of the Pan-African belt in central Africa with special reference to Cameroon. Canadian J. Earth Sci. 2004, 41, 73–85. [Google Scholar] [CrossRef]
- Toteu, S.F. , Penaye, J., Deschamps, J., Maldan, F., Nyama Atibagoua, B., Bouyo Houketchang, M., Sep Nlomgan, J.P., Mbola Dzana, S.P., 2008. Géologie et resources minérales du Cameroun, 33rd International Geological Congress, Olso Norway, 6 – 14 August 2008.
- Tchakounte, N.J.; Toteu, F.S.; Van Schmus, R.W.; Penaye j Deloule, E.; Ondoua, M.J.; Houketchang, B.M.; Ganwa, A.A.; White, M.W. Evidence of ca 1.6-Ga detrital zircon in the Bafia Group (Cameroon): Implication for the chronostratigraphy of the Pan-African Belt north of the Congo craton. Comptes Rendus Geosciences 2007, 339, 132–142. [Google Scholar] [CrossRef]
- Nzenti, J.P.; Abaga, B.; Suh, C.E.; Nzolang, C. Petrogenesis of peraluminous magmas from the Akum-Bamenda Massif, Pan-African Fold Belt, Cameroon. International Geol. Rev. 2011, 1, 1–29. [Google Scholar] [CrossRef]
- Maurizot, P. , Feybesse, J.K., Johan, Lecomte P., 1986. Etude et prospection minière du Sud- Ouest Cameroun, synthèse des travaux de 1978 à 1985. Rapport du Bureau de Recherche géologique et minière, 85, CMR066, 274pp.
- Pouclet, A. , Tchameni, R., Mezge, K., Vidal, M., Nsifa, E., Shang, C., Penaye, J., 2007. Archaean crustal accretion at the northern border of the Congo Craton (South Cameroon). The charnockite-TTG link. Société Géologique de France, 178, 331-342.
- Gazel, J. 1955. Notice explicative sur la feuille de reconnaince géologique et minière au 1/500 000e de Batouri-Ouest. Archives SMG/MINMEE. Yaounde-Cameroun. 44p.
- Sandwell, D.T.; Müller, R.D.; Smith, W.H.F.; Garcia, E.; Francis, R. New global marine gravity model from CryoSat-2 and Jason-1 reveals buried tectonic structure. Science, 2014; 346, 65–67. [Google Scholar] [CrossRef]
- Ji, H.; Liu, X.; Zhu, C.; Yuan, J.; Ji, B.; Guo, J. On performance of CryoSat-2 altimeter data in deriving marine gravity over Bay of Bengal. Mar. Geophy. Res. 2021, 42, 39. [Google Scholar] [CrossRef]
- Dahlin, T. 1993. On the Automation of 2D Resistivity Surveying for Engineering and Environmental Applications. Thesis Dept. Of Engineering Geology, Lund University.
- Loke, M.H. , Barker, R.D. Rapid least-squares inversion of apparent resistivity pseudosections using a quasi-Newton method. J. Geophys. Prosp. 1996, 44, 131–152. [Google Scholar] [CrossRef]
- Marescot, L.; Loke, M.H.; Chapellier, D.; Delaloye, R.; Lambiel, C.; Reynard, E. Assessing reliability of 2D resistivity imaging in mountain permafrost studies using the Depth of Investigation index method. Near Surf. Geophys. 2003, 1, 57–67. [Google Scholar] [CrossRef]
- Marescot, L. , 2003. Un algorithme d’inversion par moindres carrés pondérés: application aux données géophysiques par méthodes Électromagnétiques en domaine fréquence. Bulletin vaudois des Sciences Naturelles, 88, 277-300.
- Marescot, L.; Liaci, S.; Chapellier, D. Etude géoélectrique des cours d’eau interglaciaires à l’Ouest de la ville de Fribourg (Suisse). Eclogae geol. Helv. 2003, 96, 261–273. [Google Scholar]
- Marescot, L. , 2008. Imagerie électrique pour géologues : acquisition, traitement, interprétation. Presses Universitaires 73p.
- Mbida Yem, Yene Atangana, J. Q., Koah Na Lebogo, S.P., Mienlam Essi, M.F. Electrical resistivity tomography of the Douala-Massoumbou Paleocene Eocene aquifer (Cameroon Atlantic Margin). J. Cam. Acad. of Sci. 2019, 14, 3. [Google Scholar]
- Chapellier, D. , 1981. De l’importance des cartes de résistivités. Eclogae Geologicae.
- Ritz, M.; Robain, H.; Pervago, E.; Albouy, Y.; Camerlynck, C.; Descloitres, M.; Mariko, A. Improvement to resistivity pseudosection modelling by removal of near-surface inhomogeneity effects: application to a soil system in south Cameroon. Geophy., Prosp. 1999, 47, 85–101. [Google Scholar] [CrossRef]
- Shima, H. Two-dimensional automatic resistivity inversion technique using alpha centers. Geophysics 1990, 55, 682–694. [Google Scholar] [CrossRef]
- Noël, M.; Xu, B. Archaeological investigation by electrical resistivity tomography: a preliminary study. Geoph. J. Int. 1991, 107, 95–102. [Google Scholar] [CrossRef]
- Olayinka, A.I.; Weller, A. The inversion of geoelectrical data for hydrogeological applications in crystalline basement areas of Nigeria. J. Appl. Geophys. 1997, 37, 103–115. [Google Scholar] [CrossRef]
- Béa, A.; Cochemé, J.J.; Trompette, R.; Affaton, P.; Soba, D.; Sougy, J. Grabens d’âge Paléozoïque inférieur et volcanisme tholéiitique associé dans la région de Garoua, Nord Cameroun. J. Afr. Earth Sci. 1990, 10, 657–667. [Google Scholar] [CrossRef]
- Beauvais, A.; Ritz, M.; Parisot, J.C.; Dukhan, M.; Bantsimba, C. Analysis of poorly stratified lateritic terrains overlying a granitic bedrock in Dahlin, T. and Loke, M.H., 1998, Resolution of 2D Wenner resistivity imaging as assessed by numerical modelling. J. Appl. Geophys. 1999, 38, 237–249. [Google Scholar]
- Chapellier, D. , 2000. Cours de géophysique-Résistivités électriques. Cours online de géophysique, Université de Lausanne- Institut Français du Pétrole. 102pp.
- Cornacchia, M.; Dars, R. Un trait structural majeur du continent africain. Les lineaments centr-africains du Cameroun au Golfe d’Aden. Bull. Soc. Geol. Fr. 1983, 25, 101–109. [Google Scholar] [CrossRef]
- Fairhead, J.D.; Okereke, C.S. Depths to major density contrasts beneath the West African Rift System in Nigeria and Cameroon based on the spectral analysis of gravity data. J. Afr. Earth Sci. 1988, 7, 769–777. [Google Scholar] [CrossRef]
- Popoff, M. Du Gondwana à l'Atlantique sud: les connexions du fossé de la Bénoué avec les bassins du Nord-Est brésilien jusqu'à l'ouverture du golfe de Guinée au Crétacé inferieur. J. Afric. Earth Sc. Oxford. 1988, 7, 409–431. [Google Scholar] [CrossRef]
- Binks, R.M.; Fairhead, J.D. A plate tectonic setting for Mesozoic rifts of West and Central Africa. In: P.A. Ziegler (Editor), Geodynamics of Rifting, Volume It. Case History Studies on Rifts: North and South America and Africa. Tectonophysics 1992, 213, 141–151. [Google Scholar] [CrossRef]
- Brownfield, M.E. , Charpentier, R., 2006. Geology and Total petroleum systems of the West -central Coastal Province (7203), West Africa, U.S. Geological Survey Bulletin, 2207-B, 52.
- Ngako, V.; Affaton, P.; Nnange, J.M.; Njanko, T. Pan-African tectonic evolution in central and southern Cameroon: transpression and transtension during sinistral shear movements. J. Afr. Earth Sci. 2003, 36, 207–214. [Google Scholar] [CrossRef]
- V. Ngako, V.; Affaton, P.; Njonfang, E. Pan-African tectonics in northwestern Cameroon: Implication for the history of western Gondwana. Gondwana Res. 2008, 14, 509–522. [Google Scholar] [CrossRef]
- Tchouankoue, J.P.; Simeni Wambo, N.A.; Kagou Dongmo, A.; Li, X.-H. 40Ar/39Ar dating of basaltic dykes swarm in Western Cameroon: Evidence of Late Paleozoic and Mesozoic magmatism in the corridor of the Cameroon Line. J. Afr. Earth Sci. 2014, 93, 14–22. [Google Scholar] [CrossRef]
Figure 1.
(a) Free-air gravity map of Cameroon after Sandwell et al. (2014), (b) regional S-N topographic profile (A-B) and structural framework of the Sanaga Valley Fault System and adjacent areas. Arrows indicate direction of shortening.
Figure 1.
(a) Free-air gravity map of Cameroon after Sandwell et al. (2014), (b) regional S-N topographic profile (A-B) and structural framework of the Sanaga Valley Fault System and adjacent areas. Arrows indicate direction of shortening.
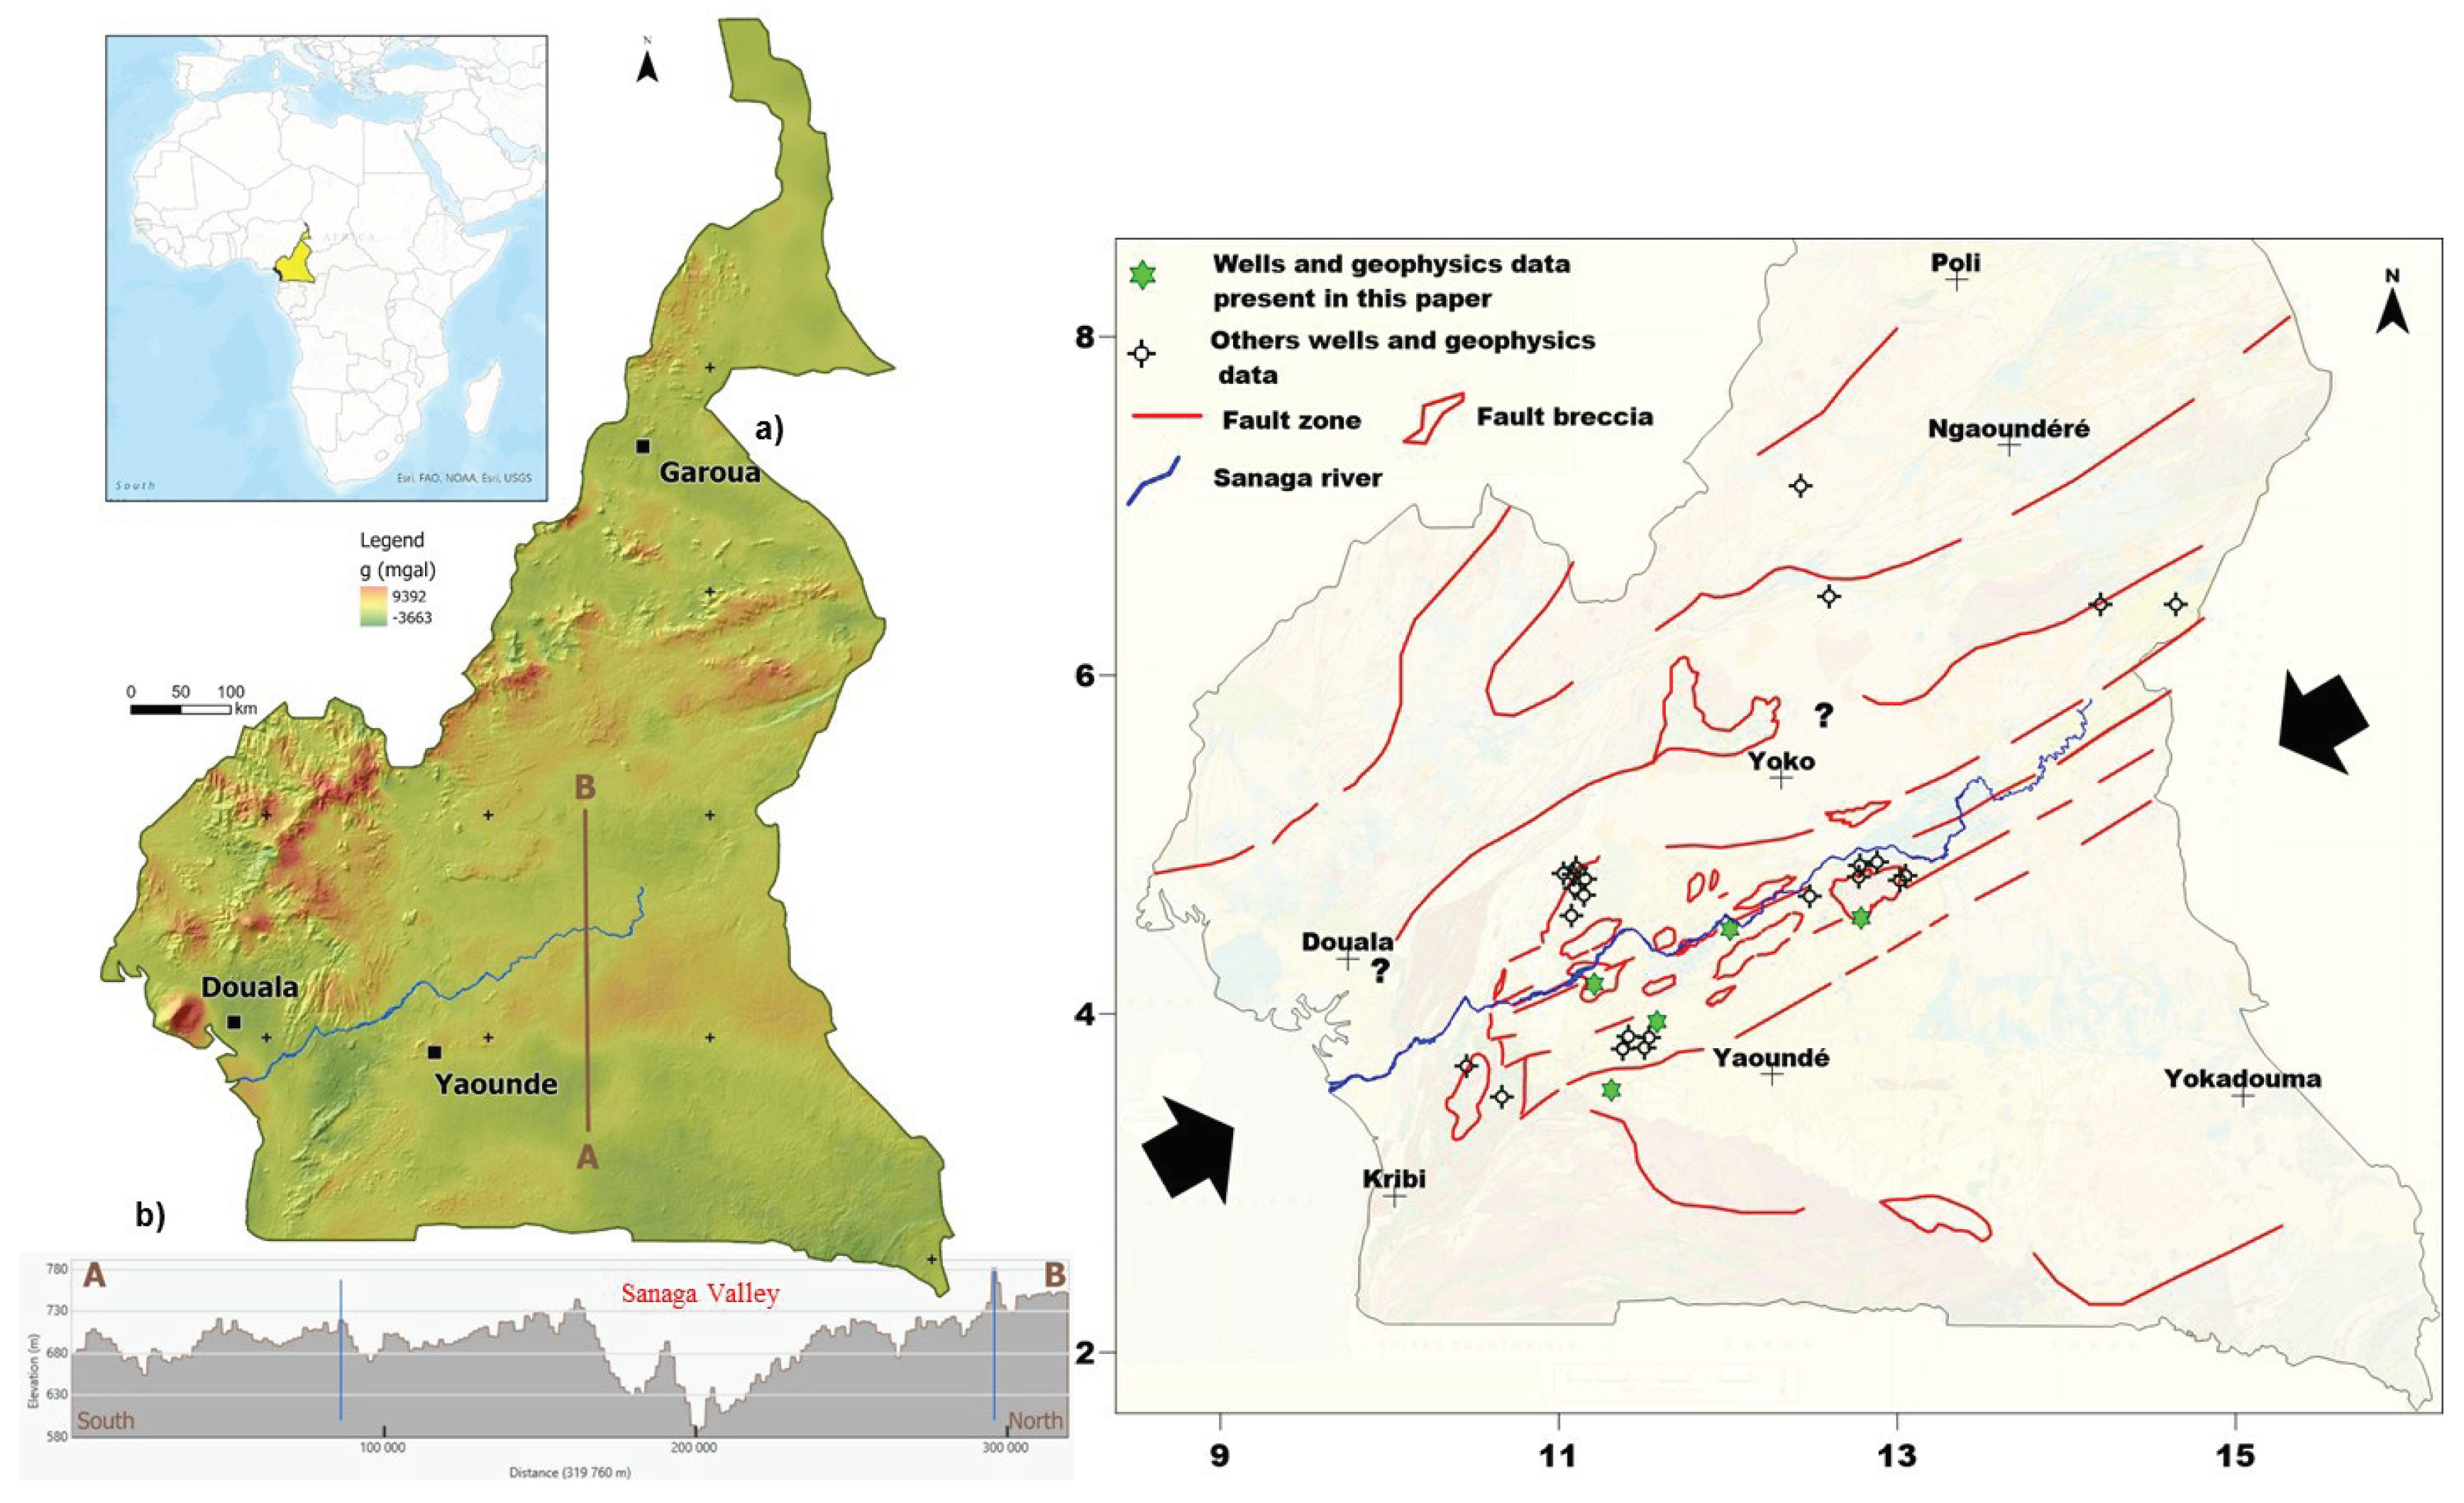
Figure 2.
Geological sketch map of Cameroon [25] (Toteu et al. 2001). 1: Fault, 2: Thrust fault, 3: Strike-slip fault, 4: Cretaceous-Tertiary volcanics, 5: Paleozoic-early Mesozoic sediments, 6: Oubangui-Chari complex, 7: Neoproterozoic belt of the Bamenda-Tignère region, 8: Yaoundé gneiss belt, 9: Neoproterozoic igneous suites of the Nyong-Baymen complex, 10: Ntem complex, LB: Lom basin, thick red lines: Sanaga fault segments.
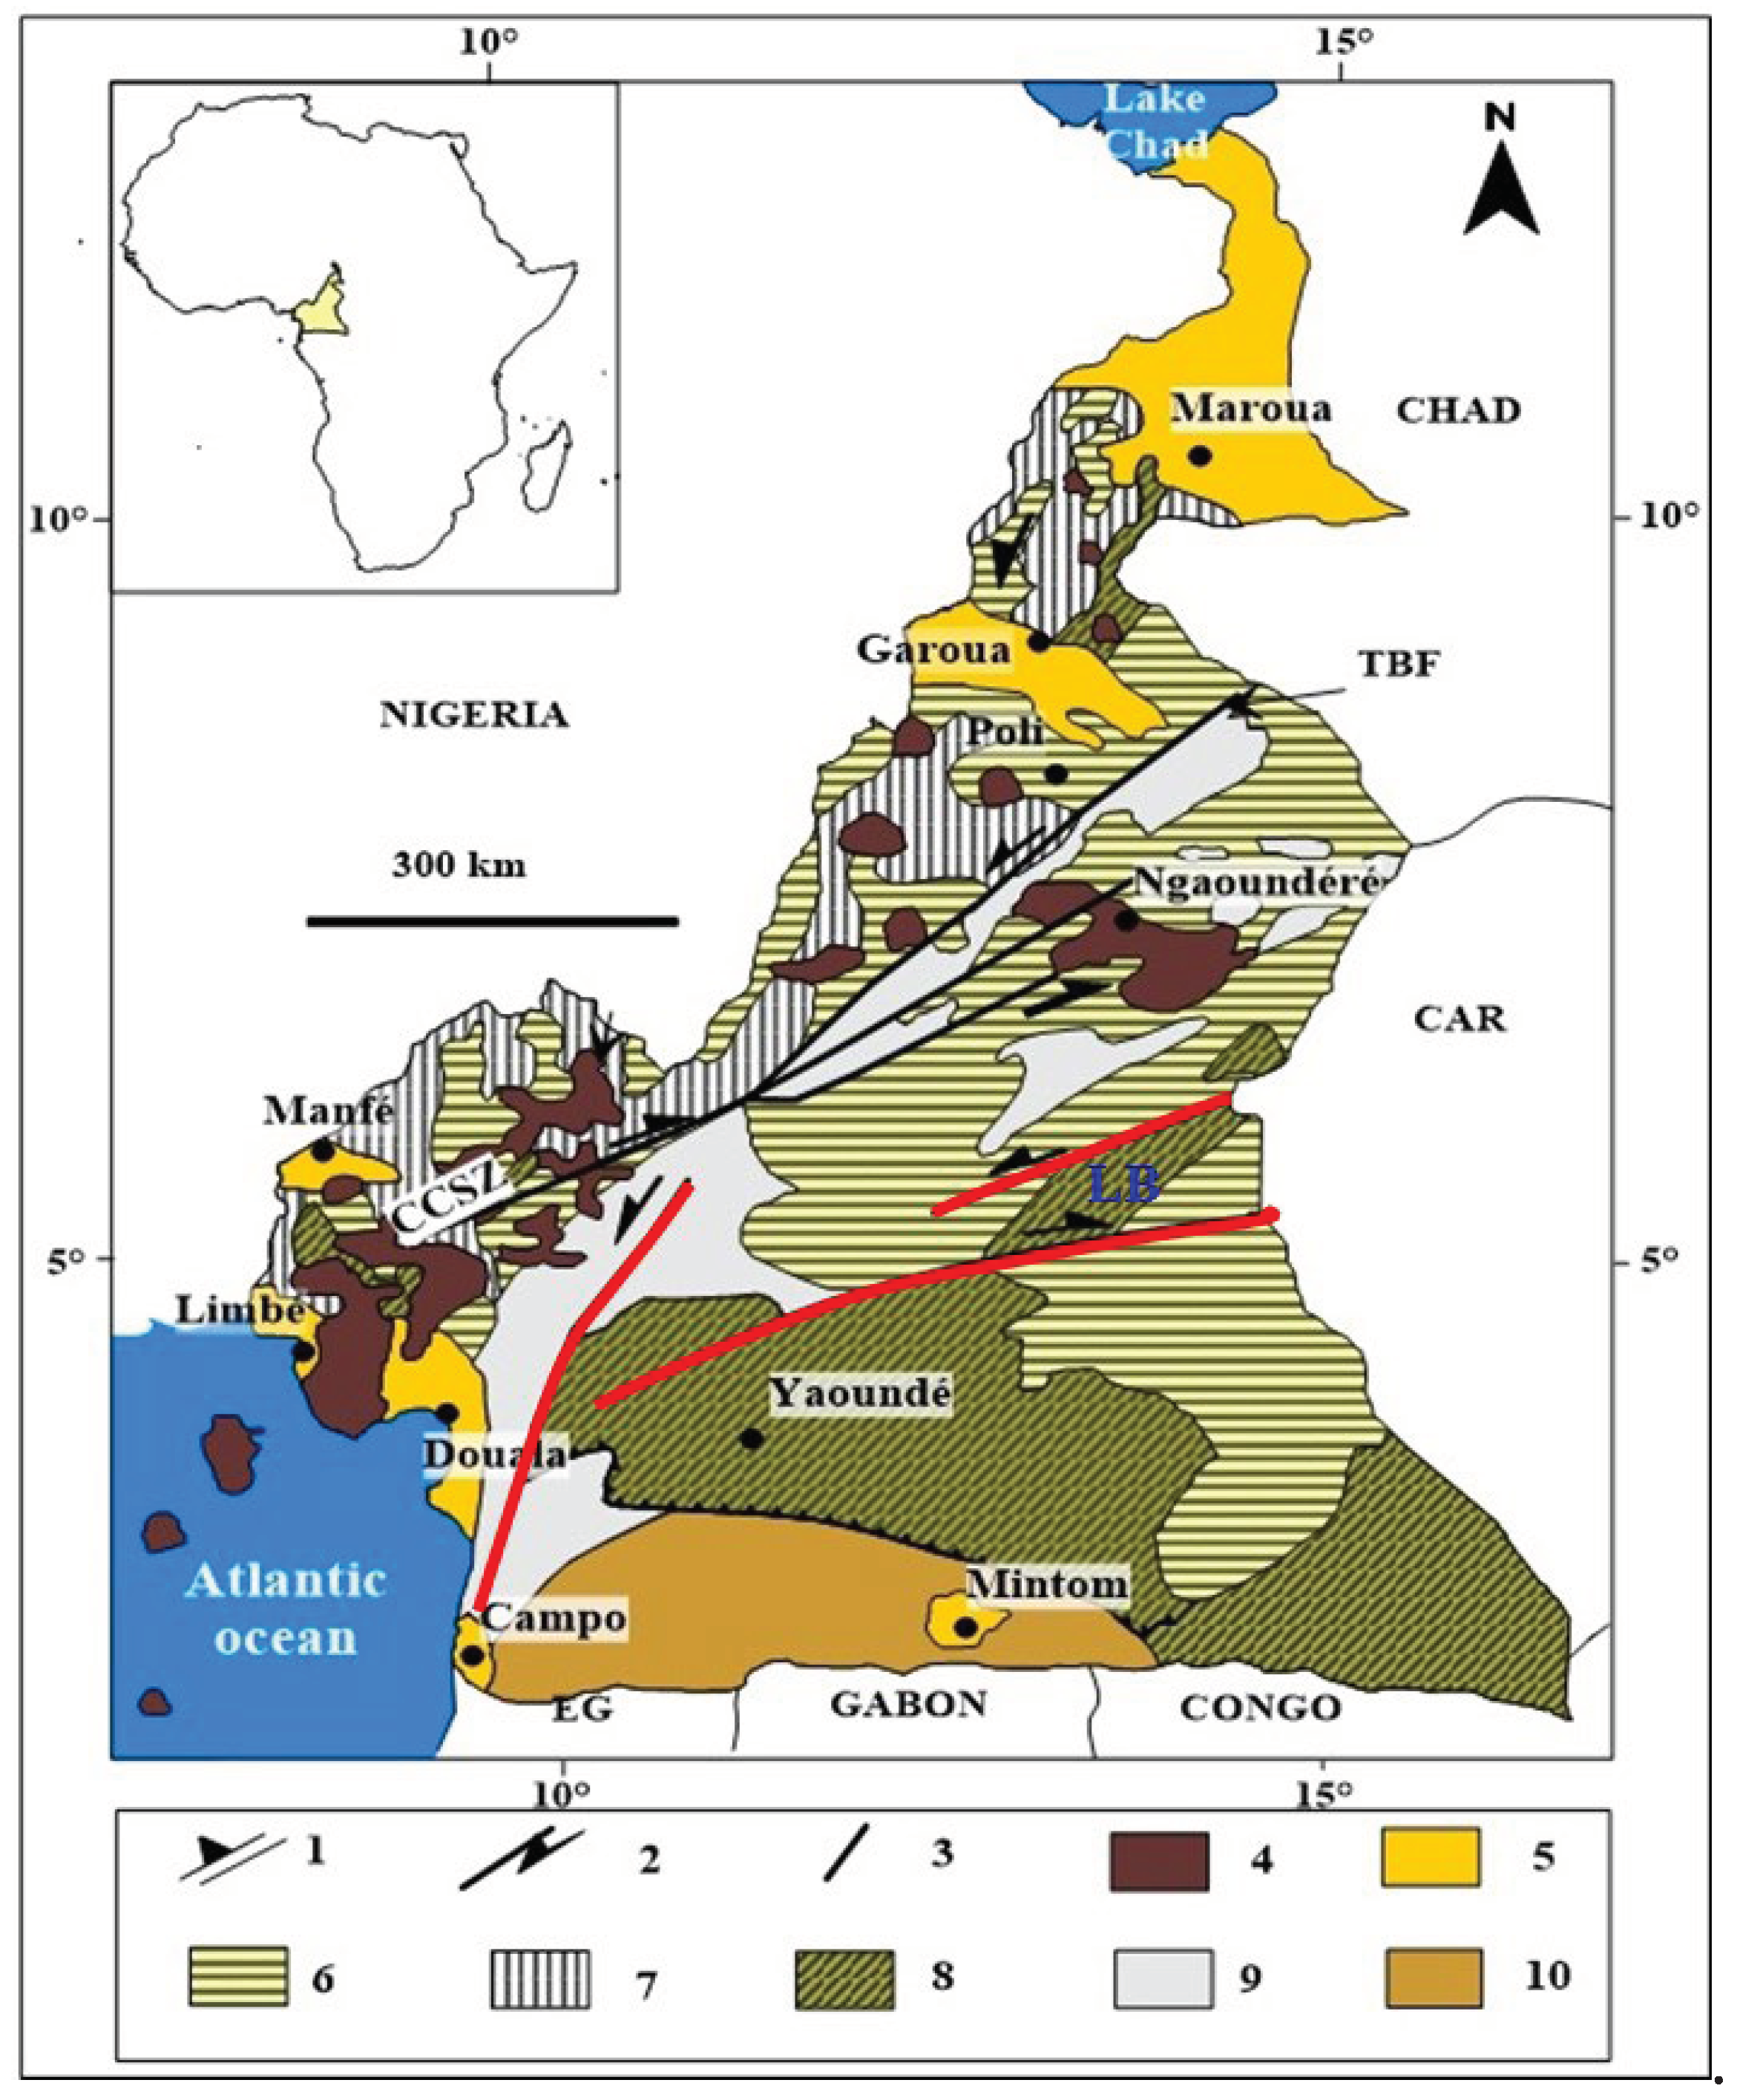
Figure 3.
Quality (a) and accuracy control (b) of output resistivity measurements.
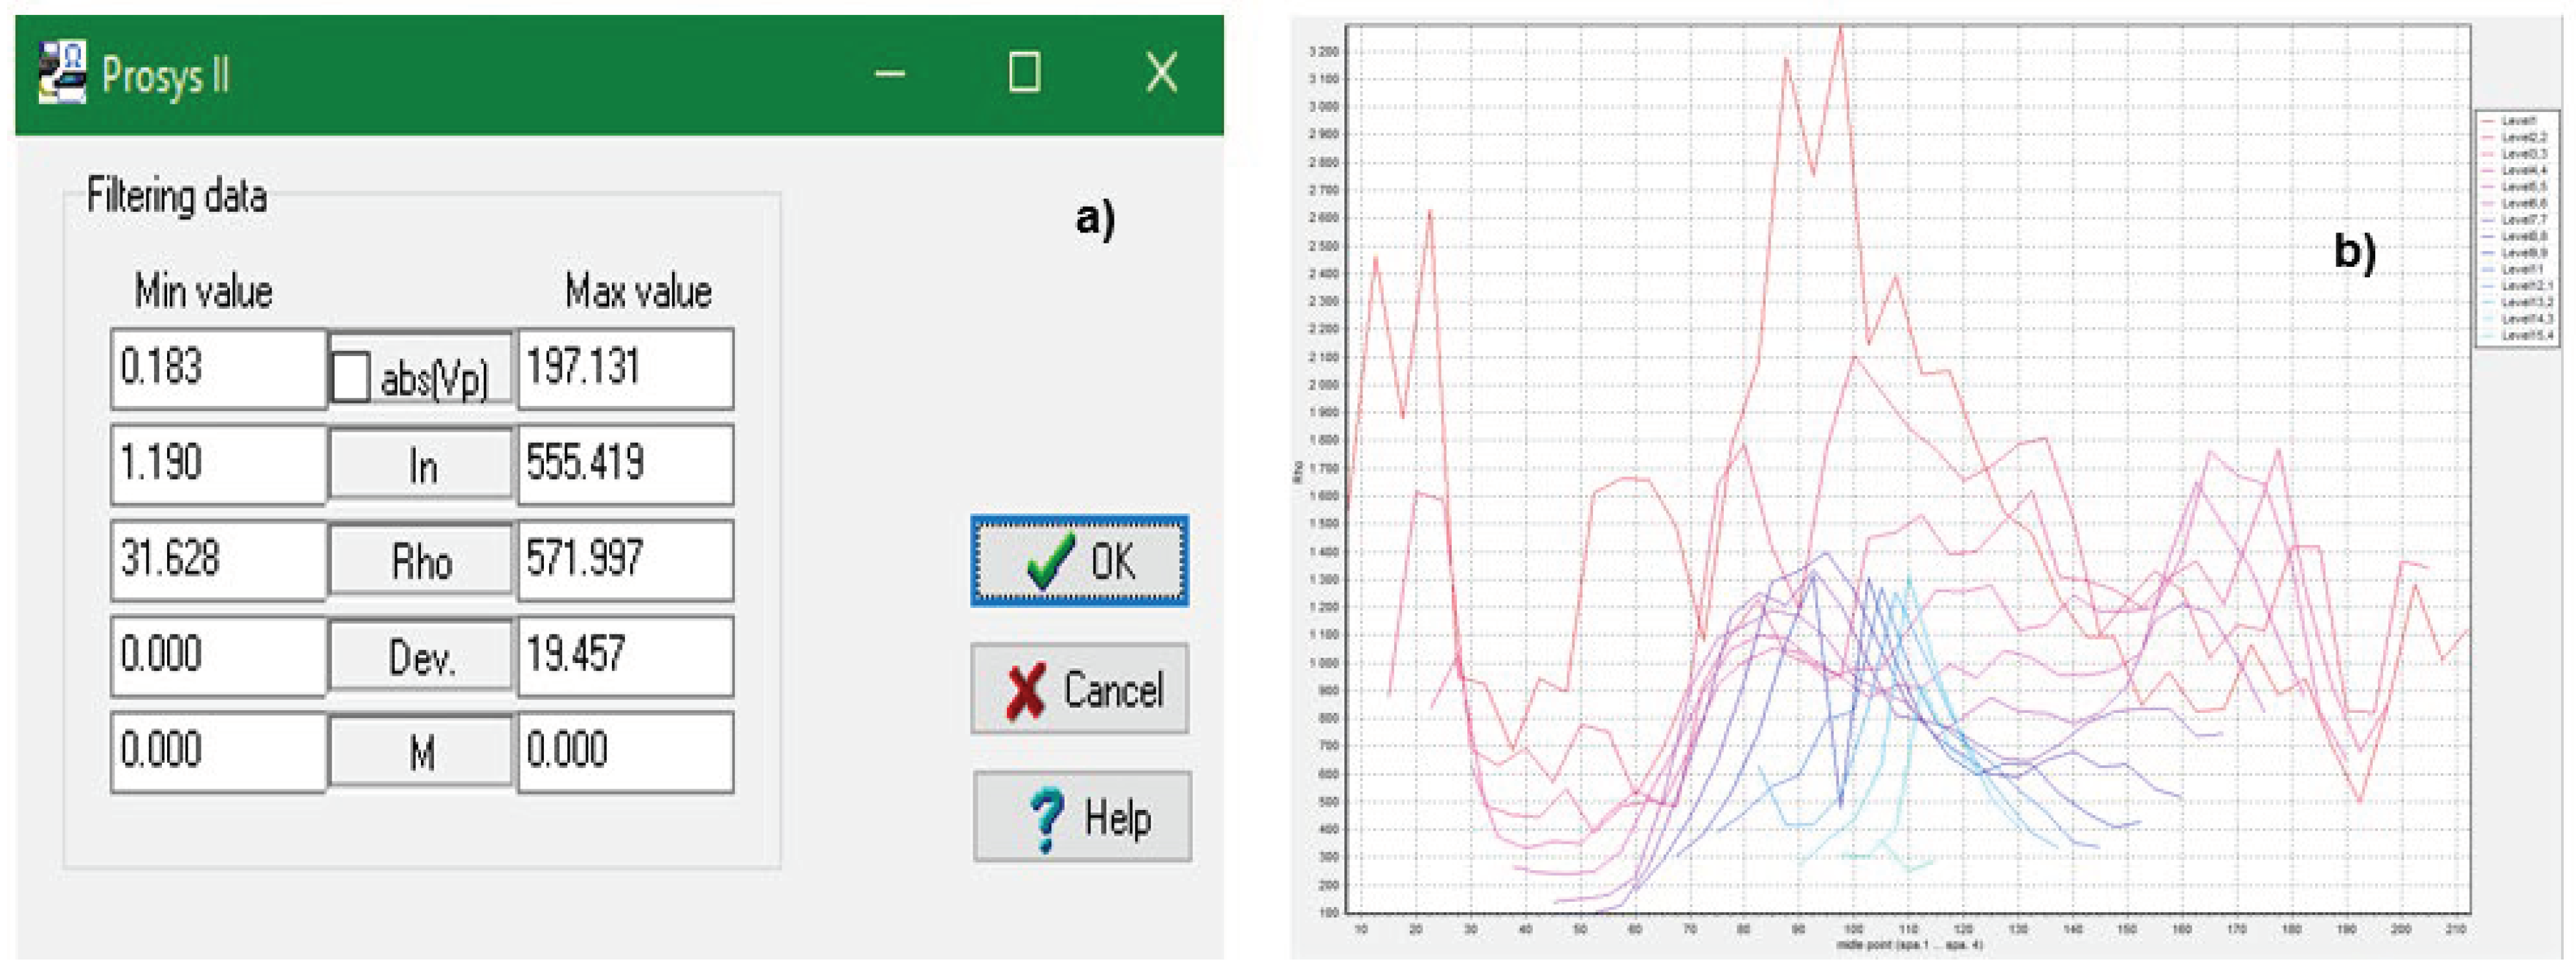
Figure 4.
Measured apparent resistivity pseudosections (a) and inverse model resistivity sections (b) of ER-01 to ER-05.
Figure 4.
Measured apparent resistivity pseudosections (a) and inverse model resistivity sections (b) of ER-01 to ER-05.
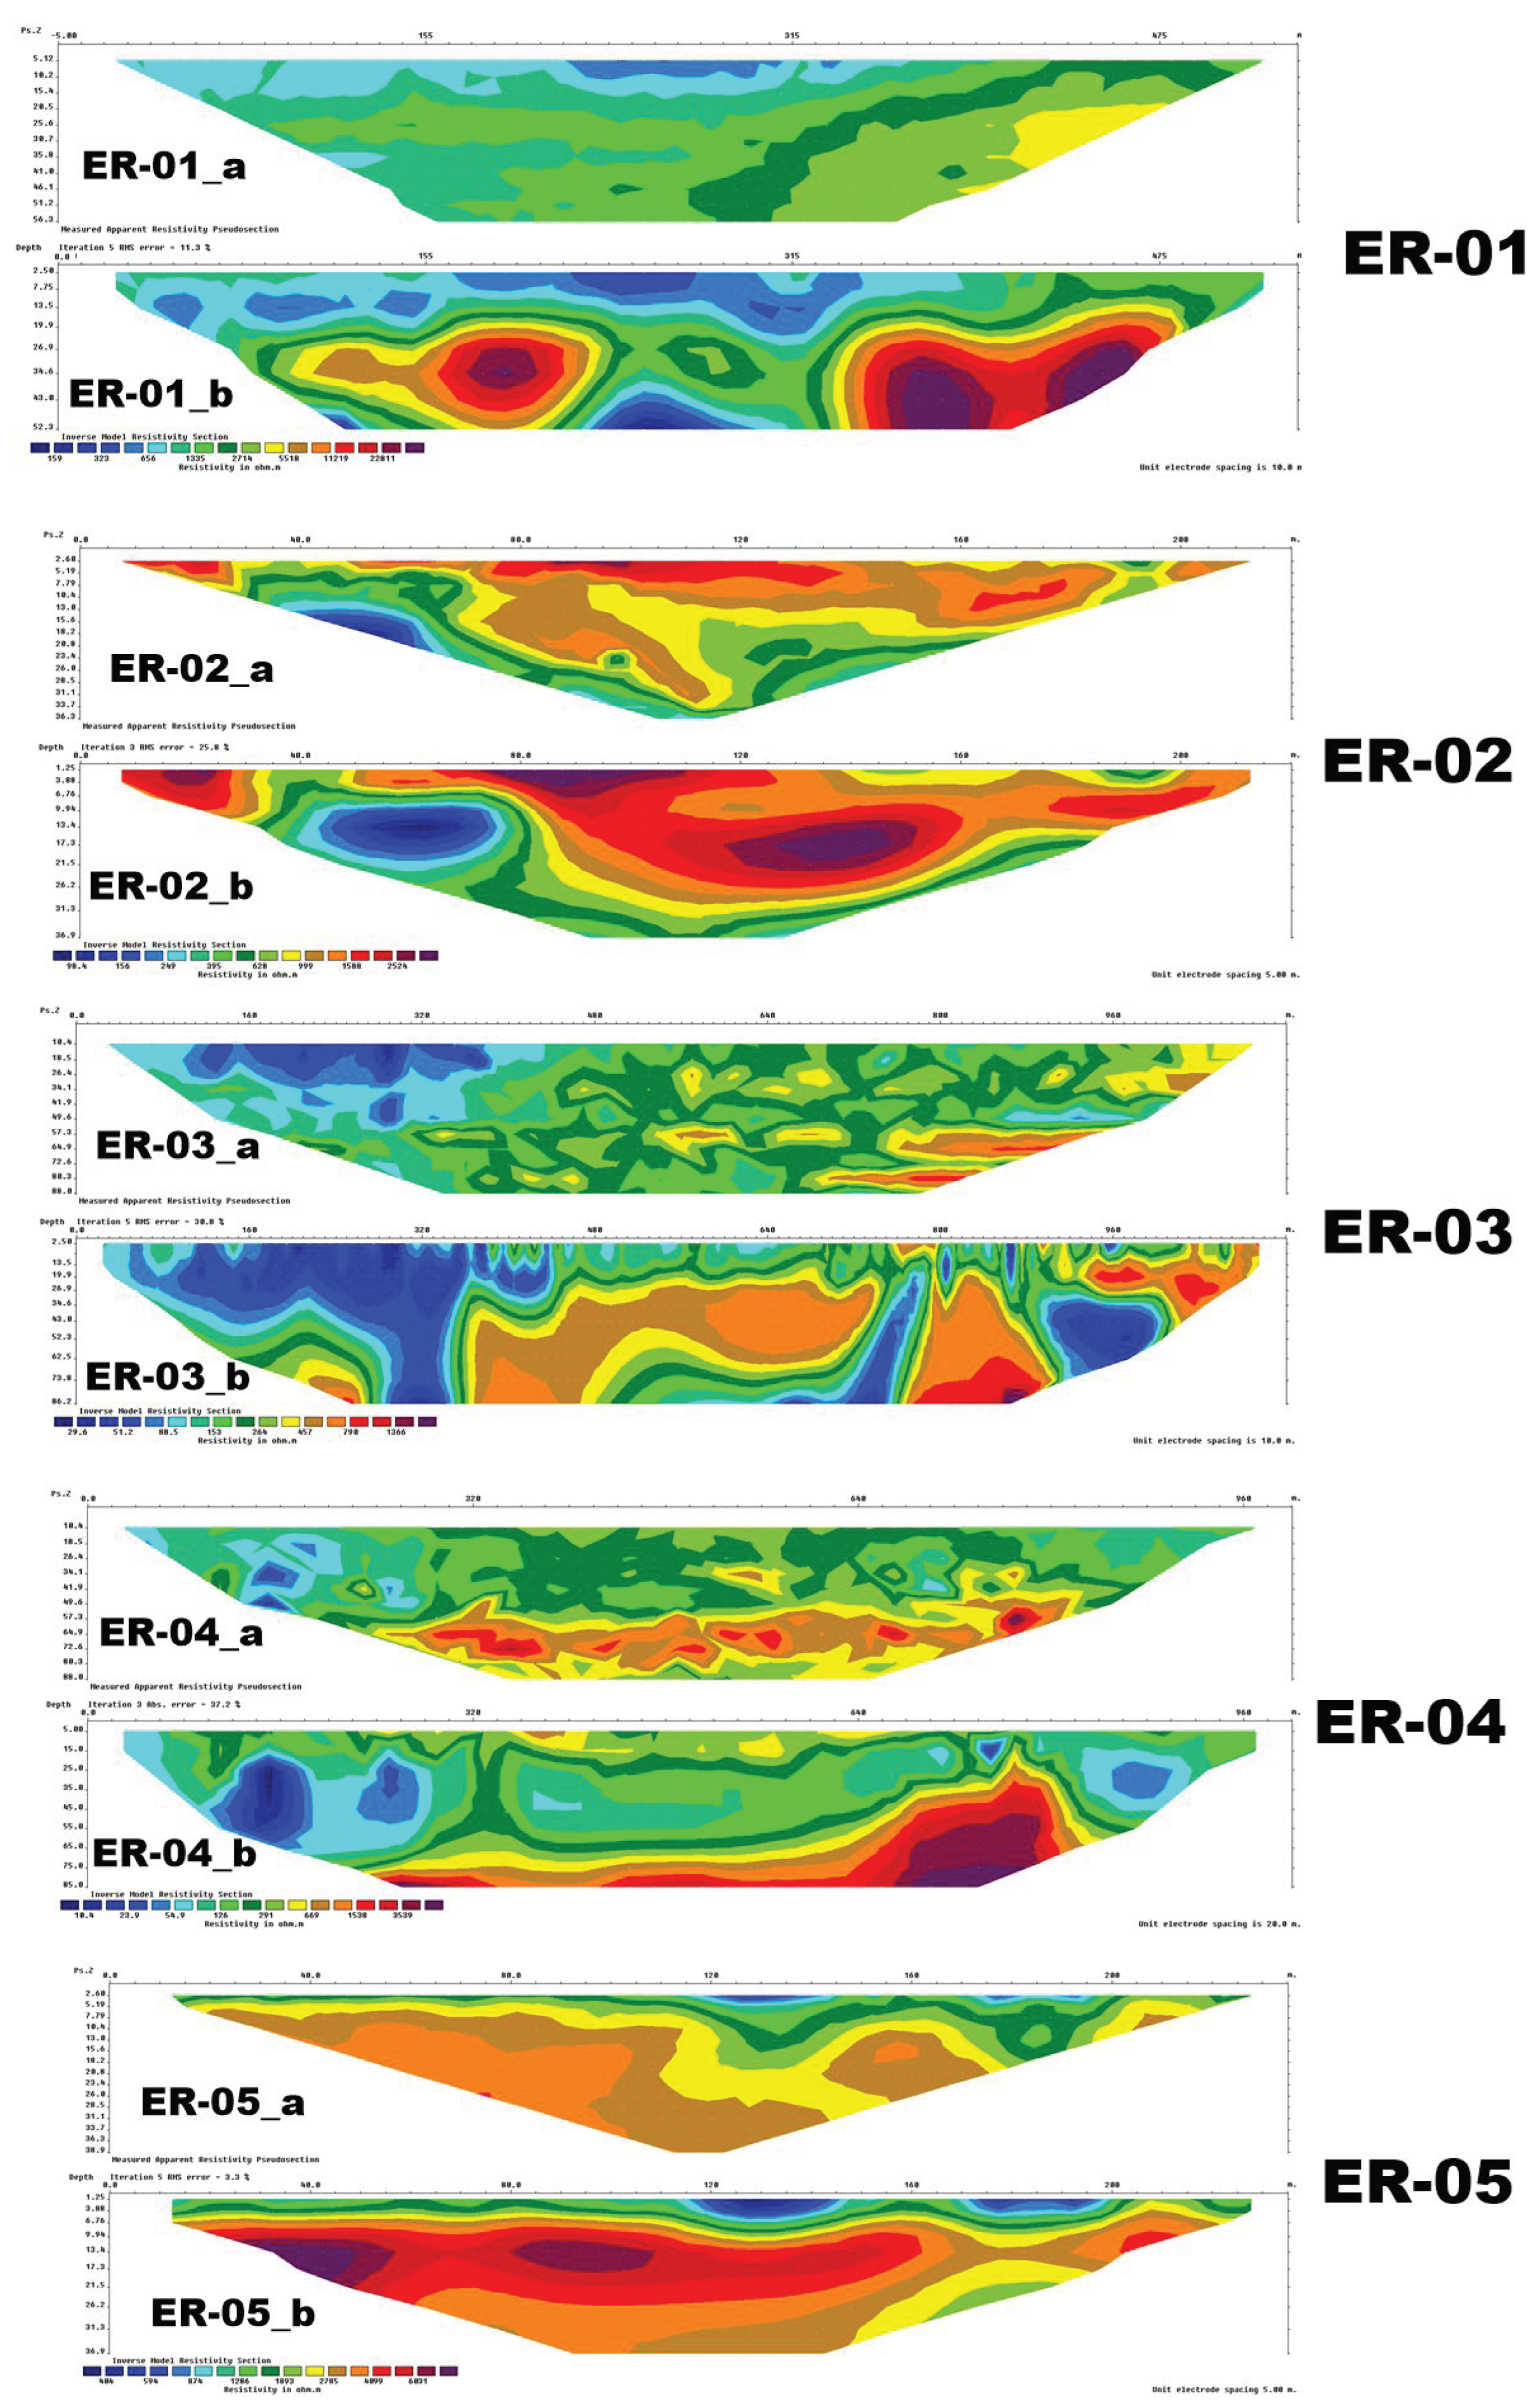
Figure 5.
Inverse model resistivity sections showing the identified (U1 to U5) electrical units. U2 and U4 are characterized by lateral facies variations described as resistive lenses (rl), while the discontinuous character of U3 seems to be associated with conductive lenses (cl).
Figure 5.
Inverse model resistivity sections showing the identified (U1 to U5) electrical units. U2 and U4 are characterized by lateral facies variations described as resistive lenses (rl), while the discontinuous character of U3 seems to be associated with conductive lenses (cl).
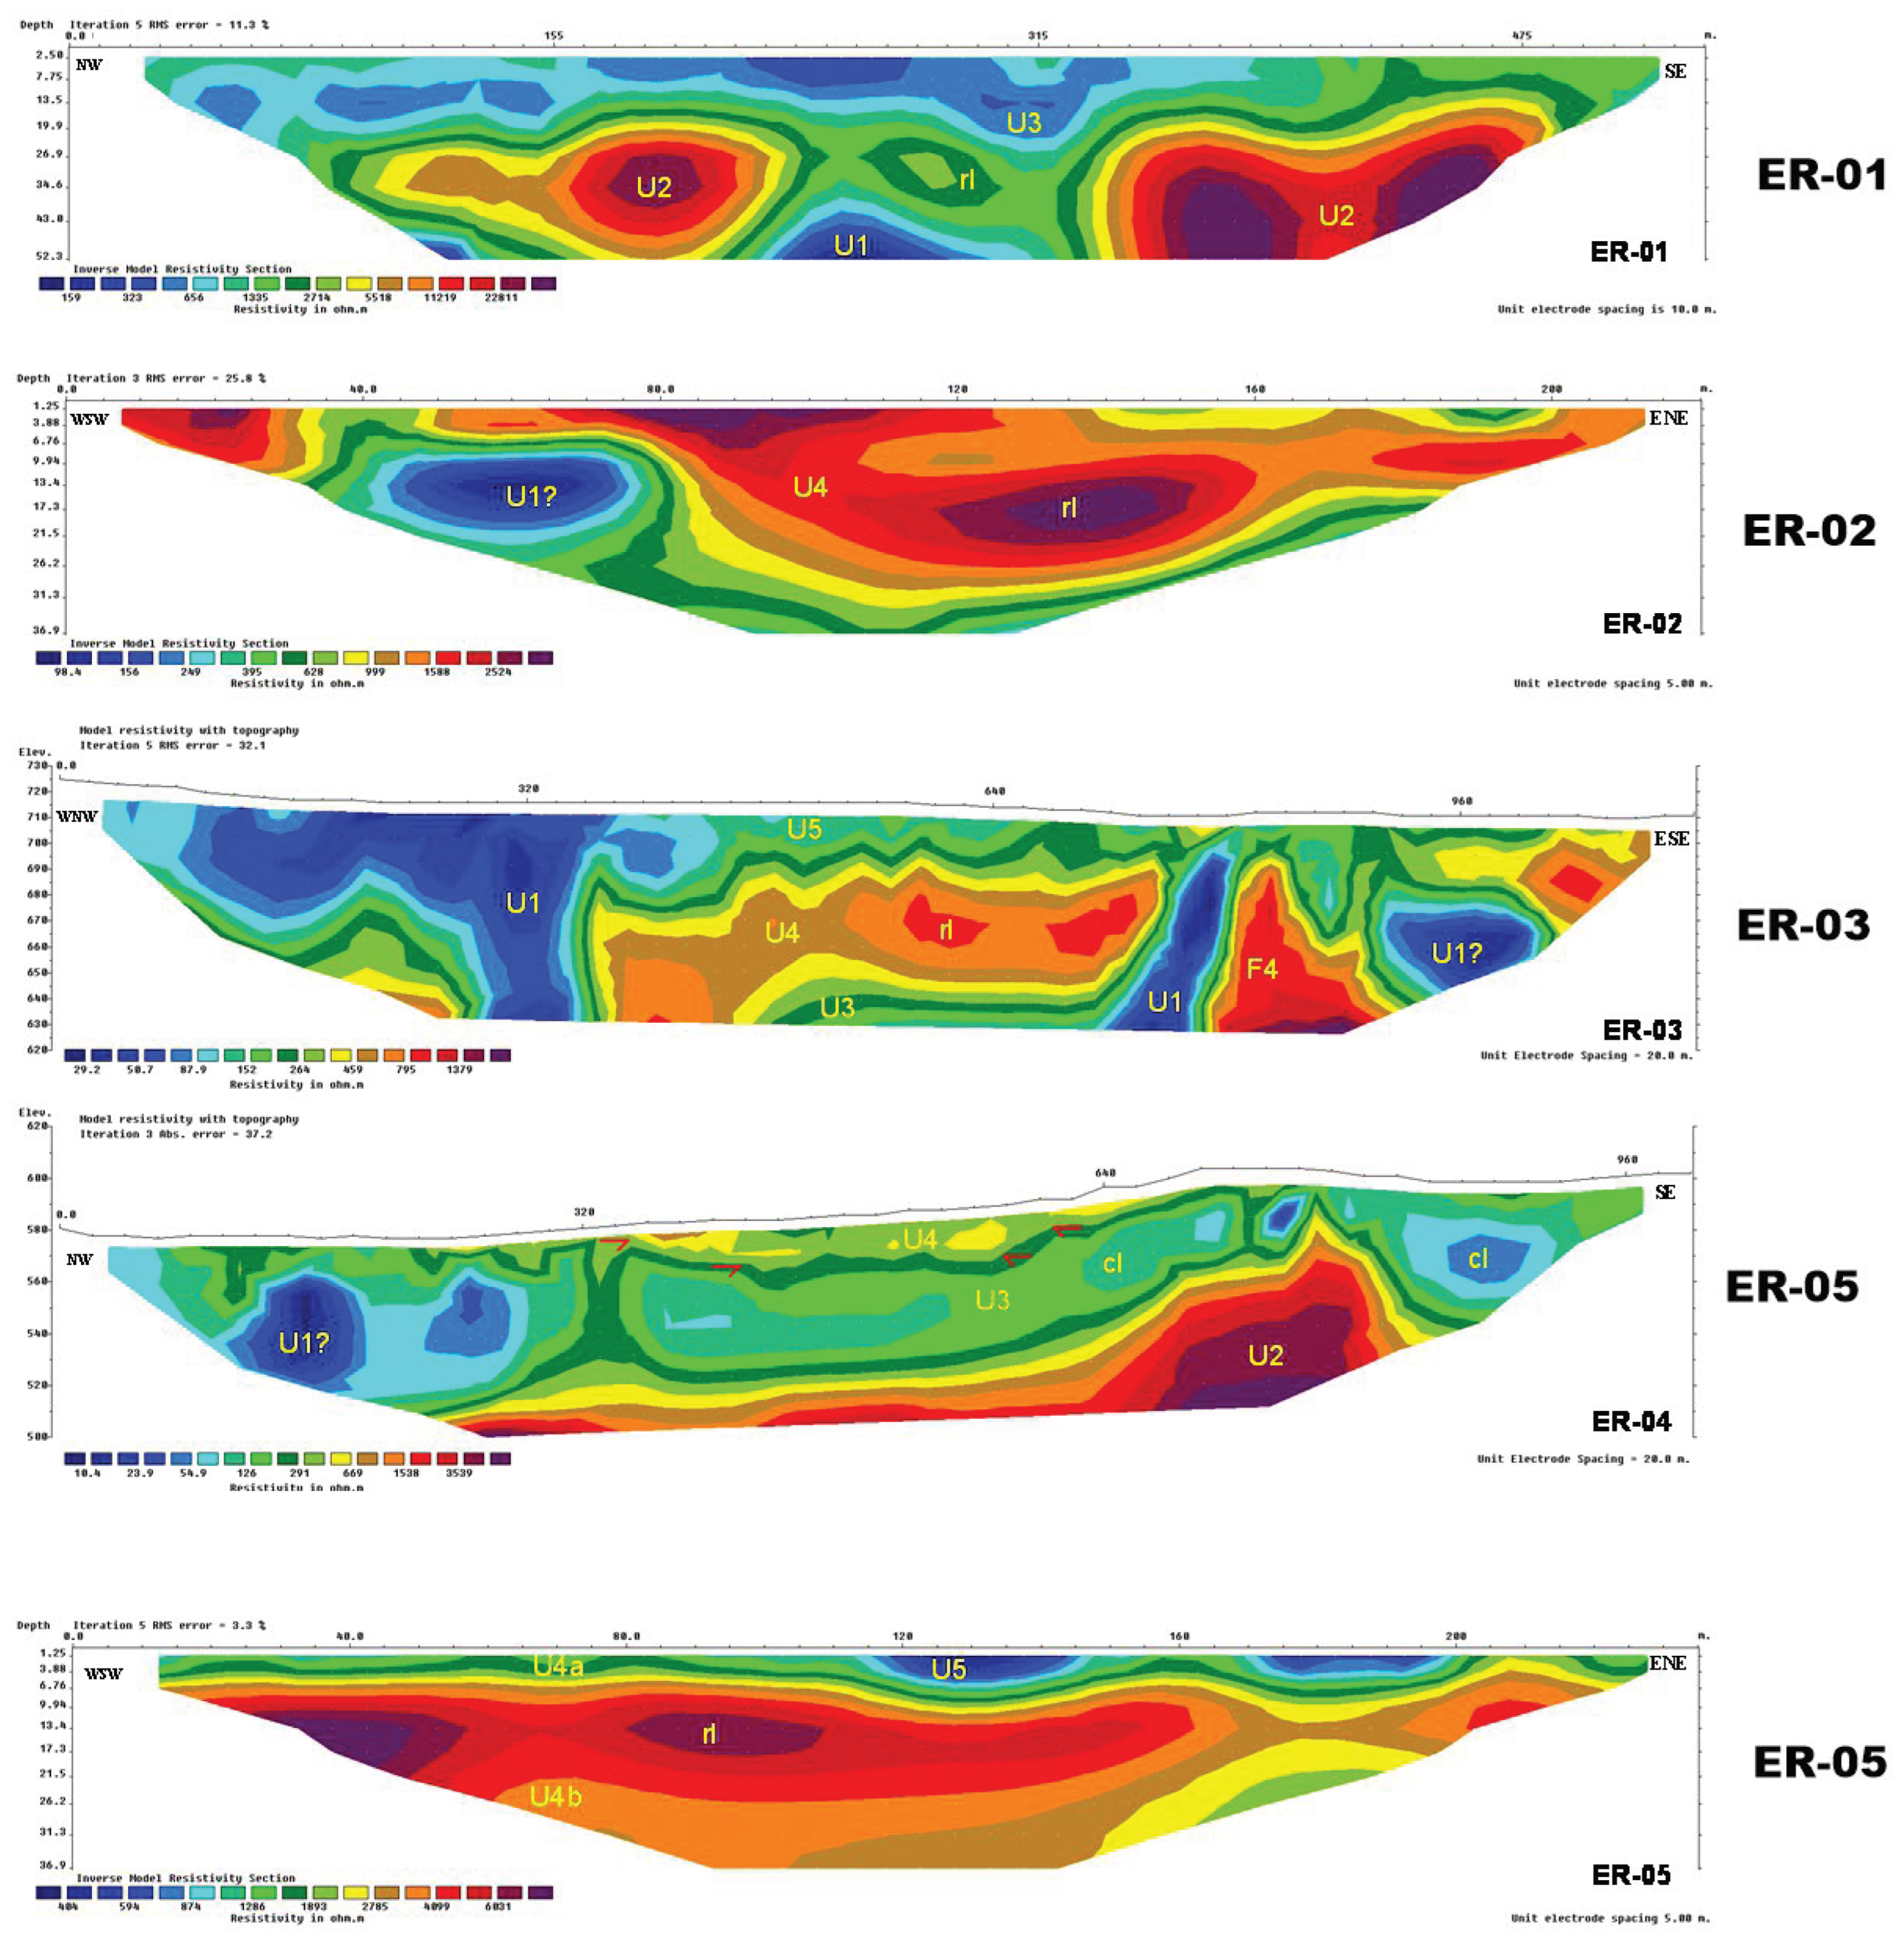
Figure 6.
SE-NW lithofacies correlation of groundwater boreholes (W-01 to W-05) drilled over the interpreted ER (01-05) sections. The geographic location of each borehole is given in Figure 2. GRE: ground elevation.
Figure 6.
SE-NW lithofacies correlation of groundwater boreholes (W-01 to W-05) drilled over the interpreted ER (01-05) sections. The geographic location of each borehole is given in Figure 2. GRE: ground elevation.
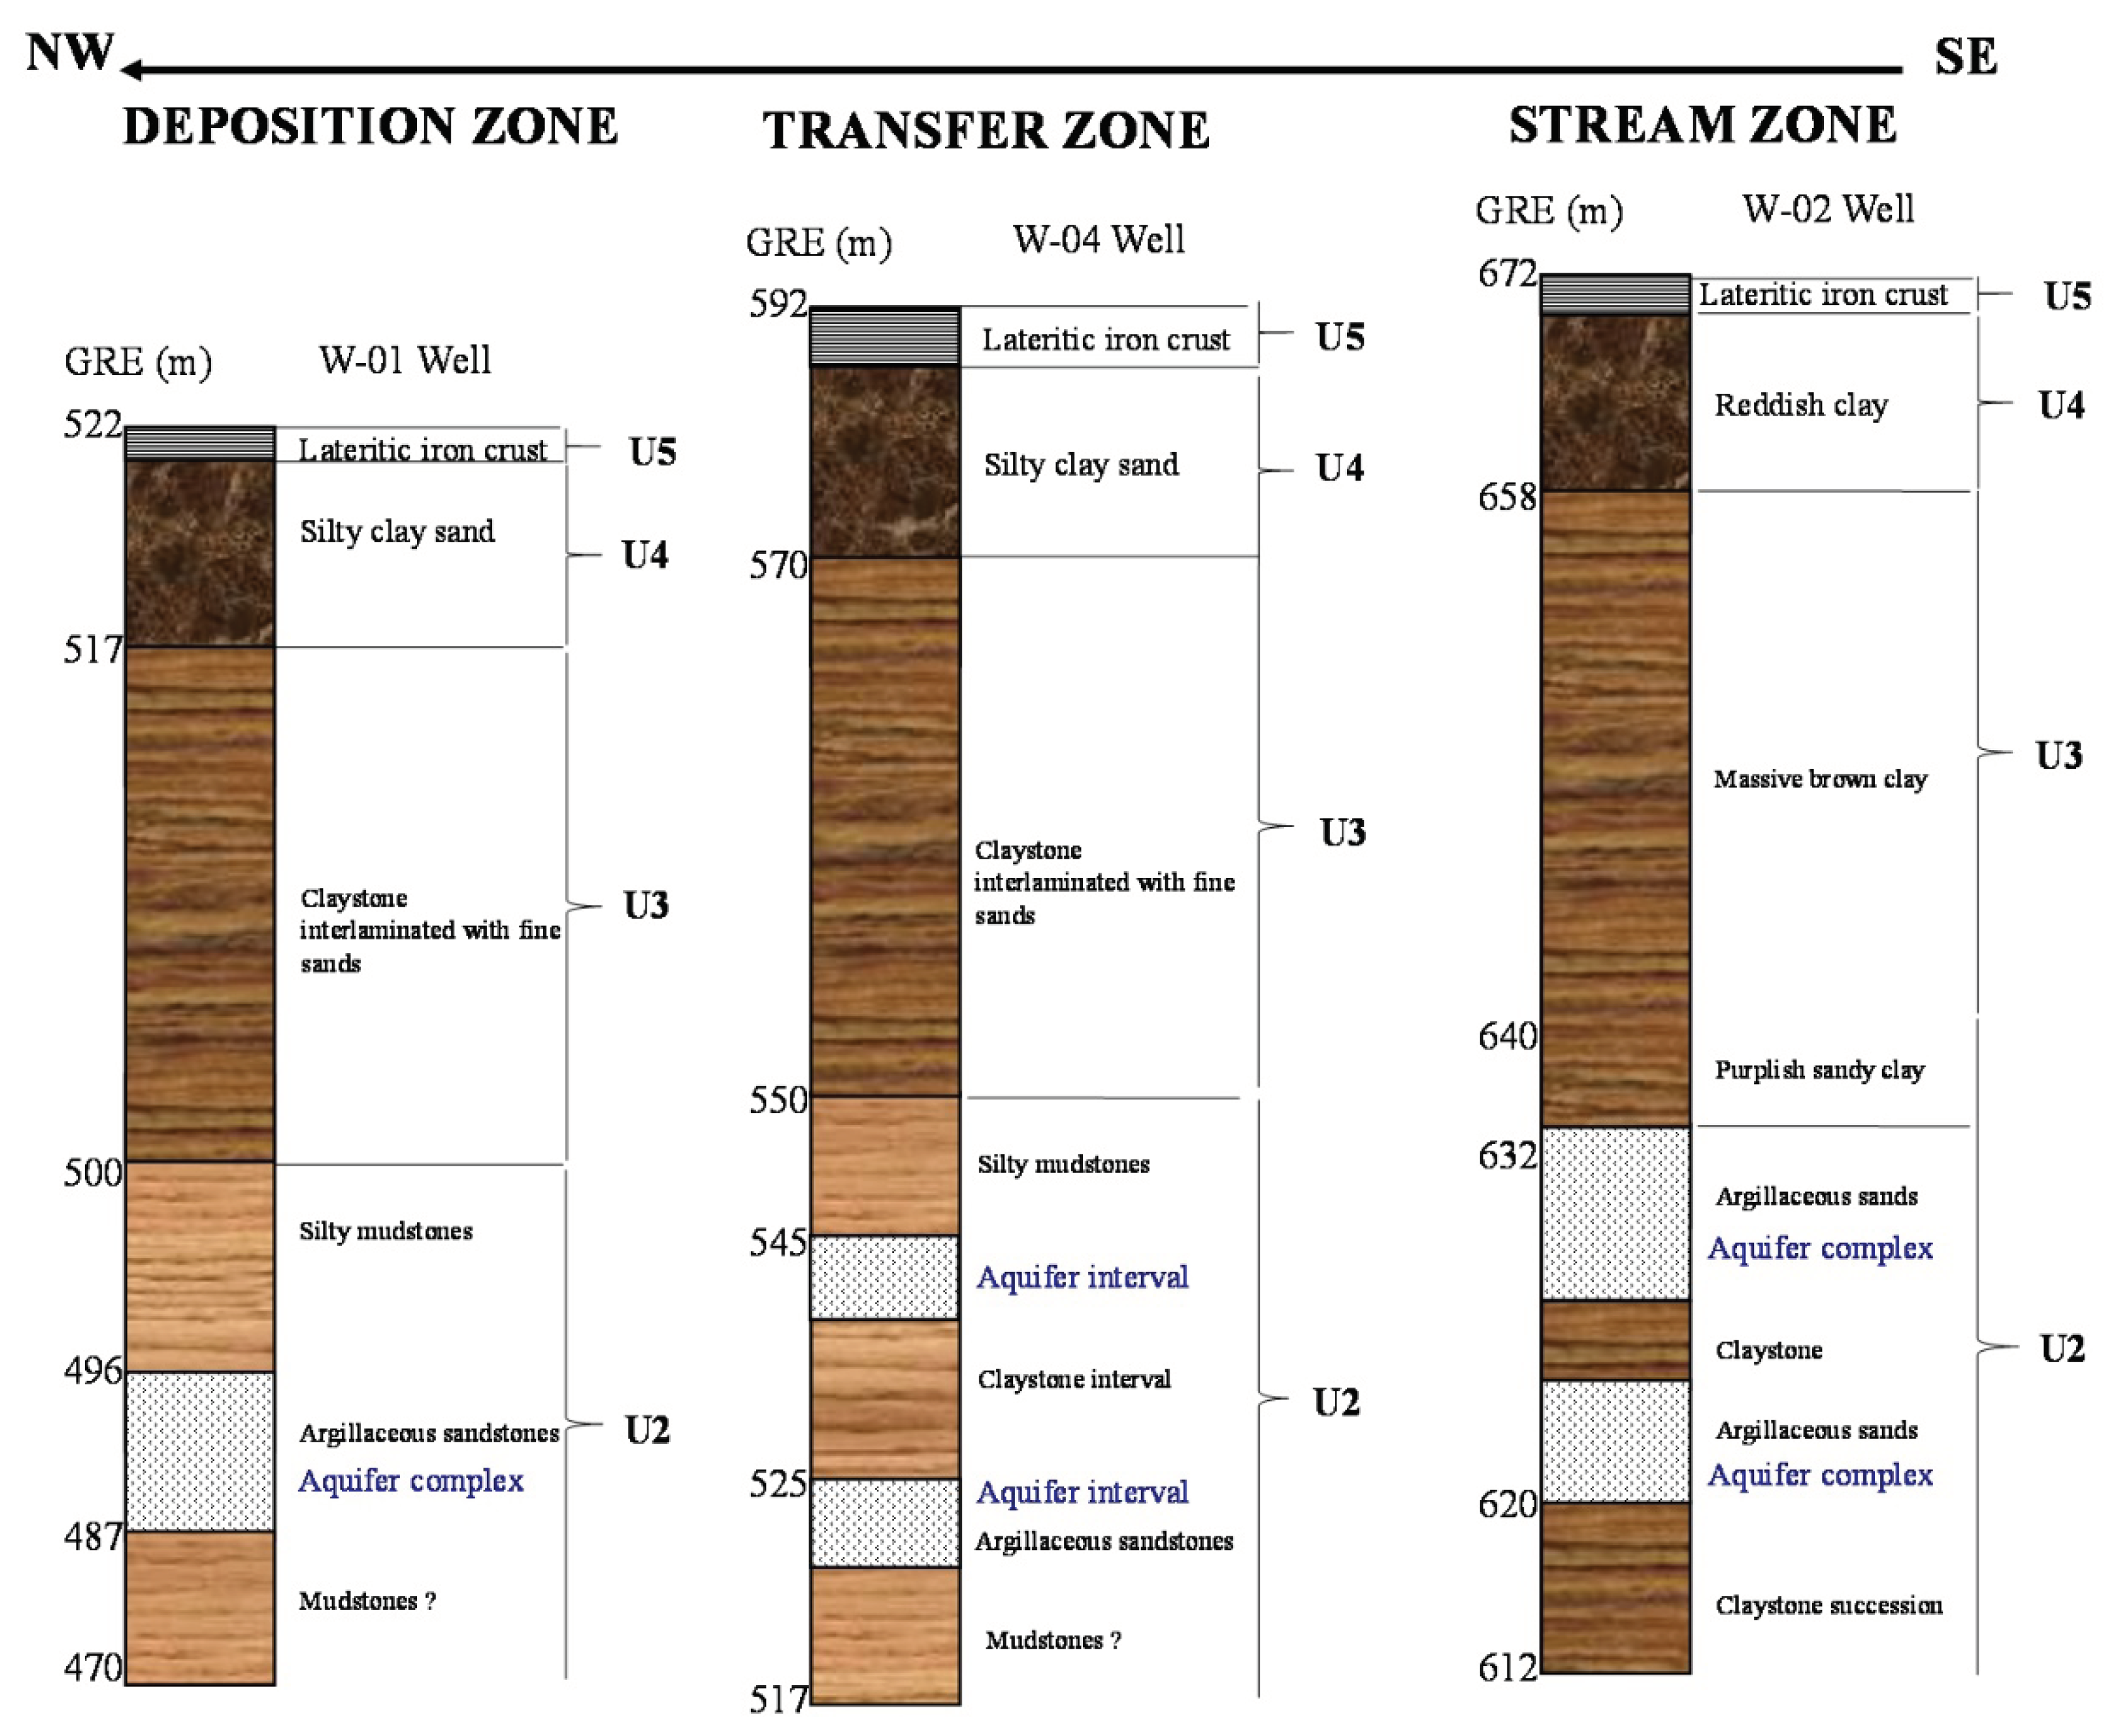
Figure 7.
Field aspects and cutting samples of interpreted electrical resistivity facies. U2: sandstones facies, U2a: arenite, U2b: white sand reservoir, U2c: clayey sand. U3: shale facies, U3a-U3d: brown, pink, red and black shale facies; U4: ferruginous sandstones, U5: Lateritic iron crust (U5b) and silty clay (U5a).
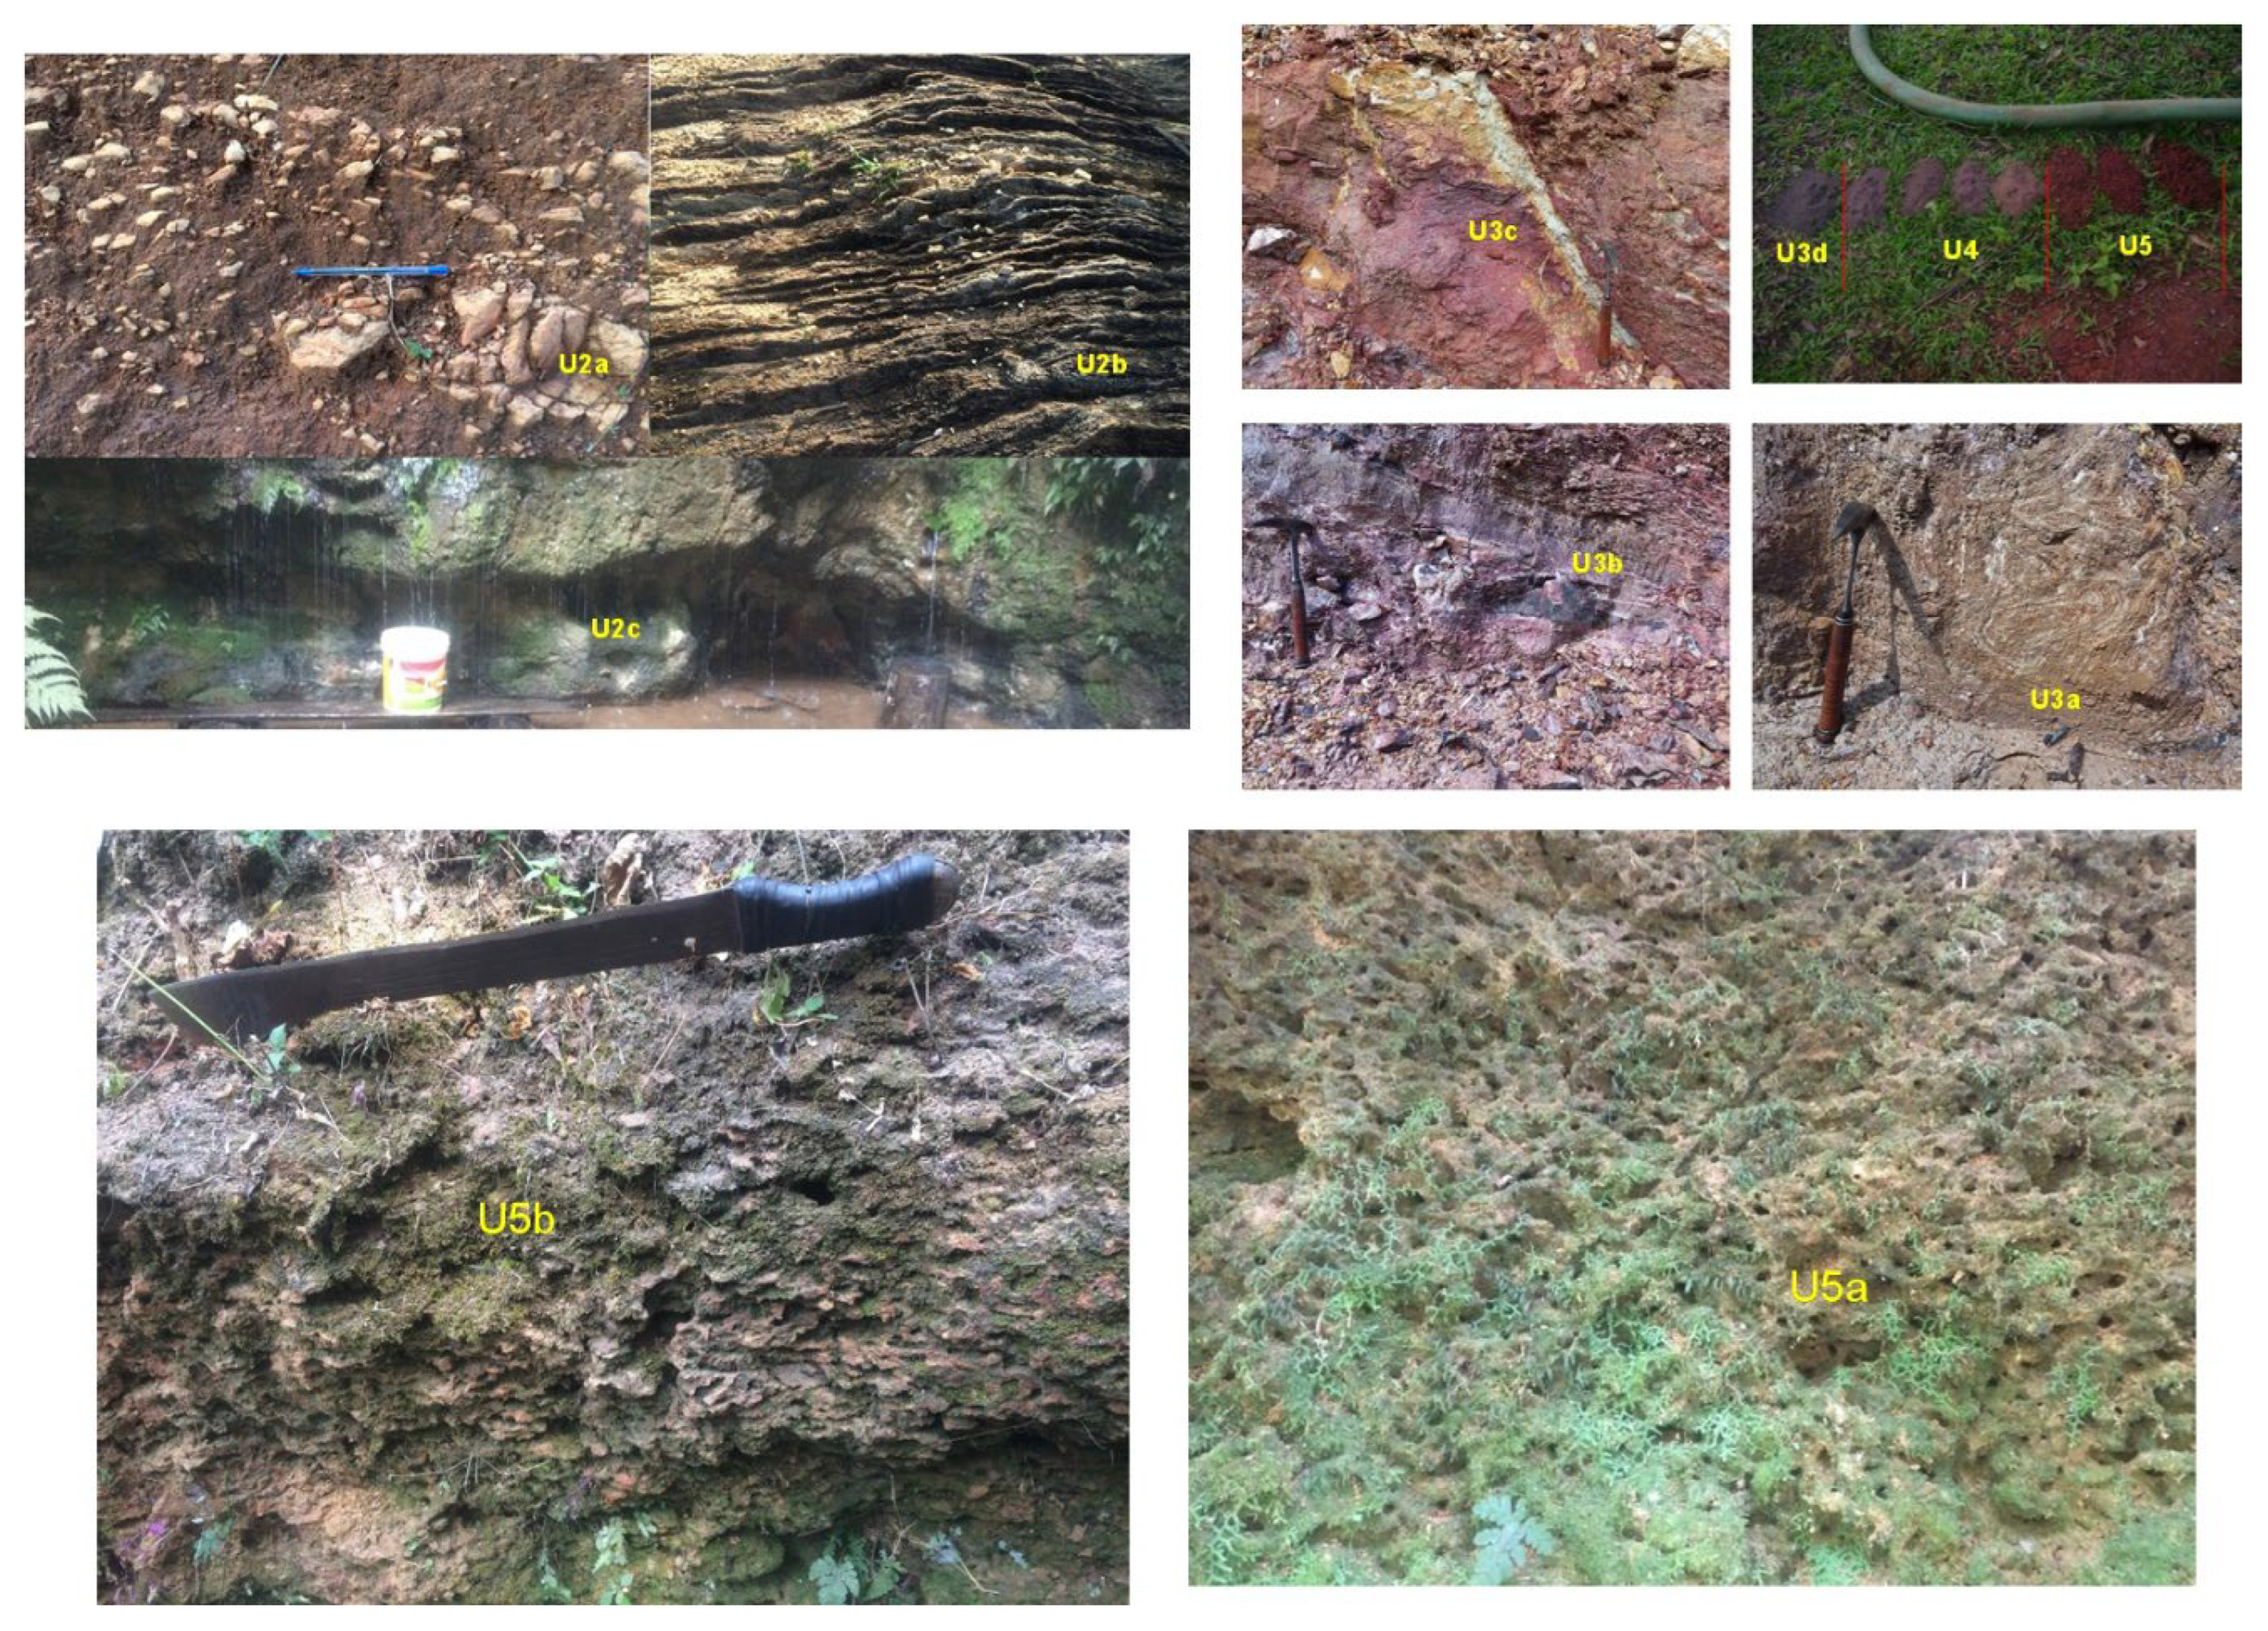
Figure 8.
Correlation between groundwater well formations top (a and c) and modelled resistivity contours (b and d). (a and c) logarithmic contour intervals and (b and d) : linear contour intervals of ER-01 and ER-03 inverse model resistivity sections. Note the prospect area of gravel clay sand channel appears wider on logarithmic contour intervals than on linear contour intervals inverse model resistivity section.
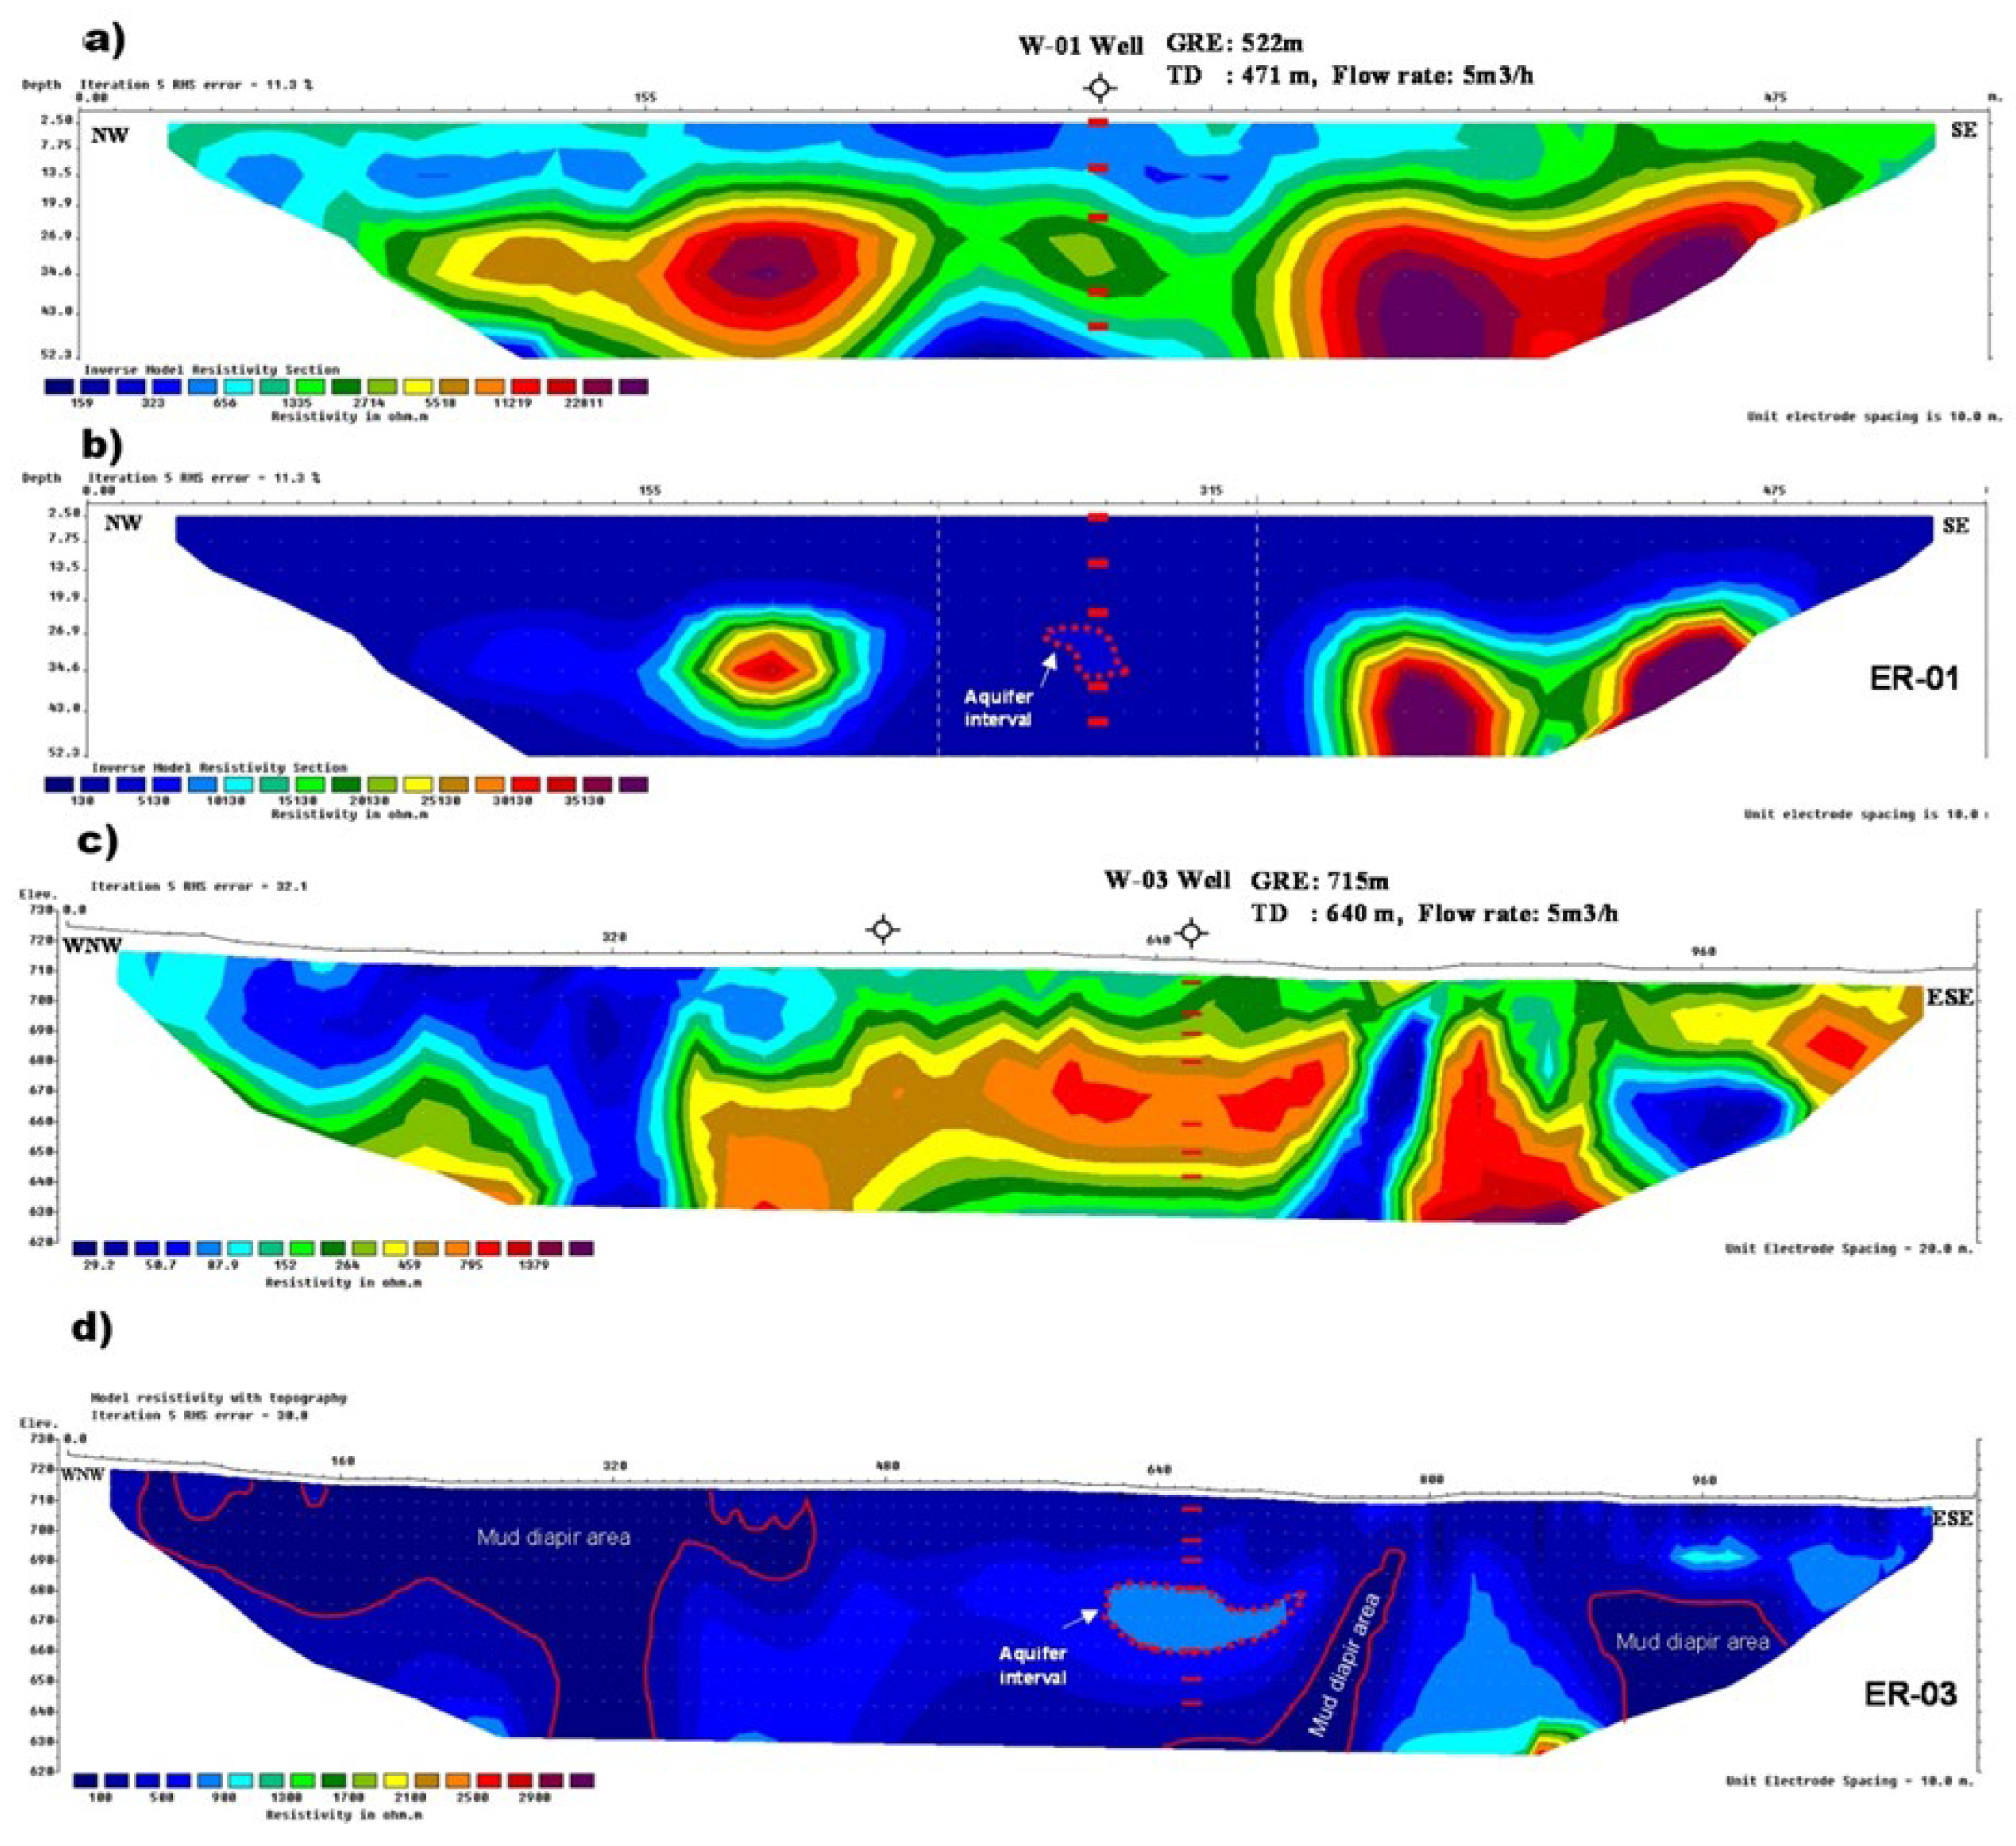
Table 1.
Summary of the data acquisition parameters.
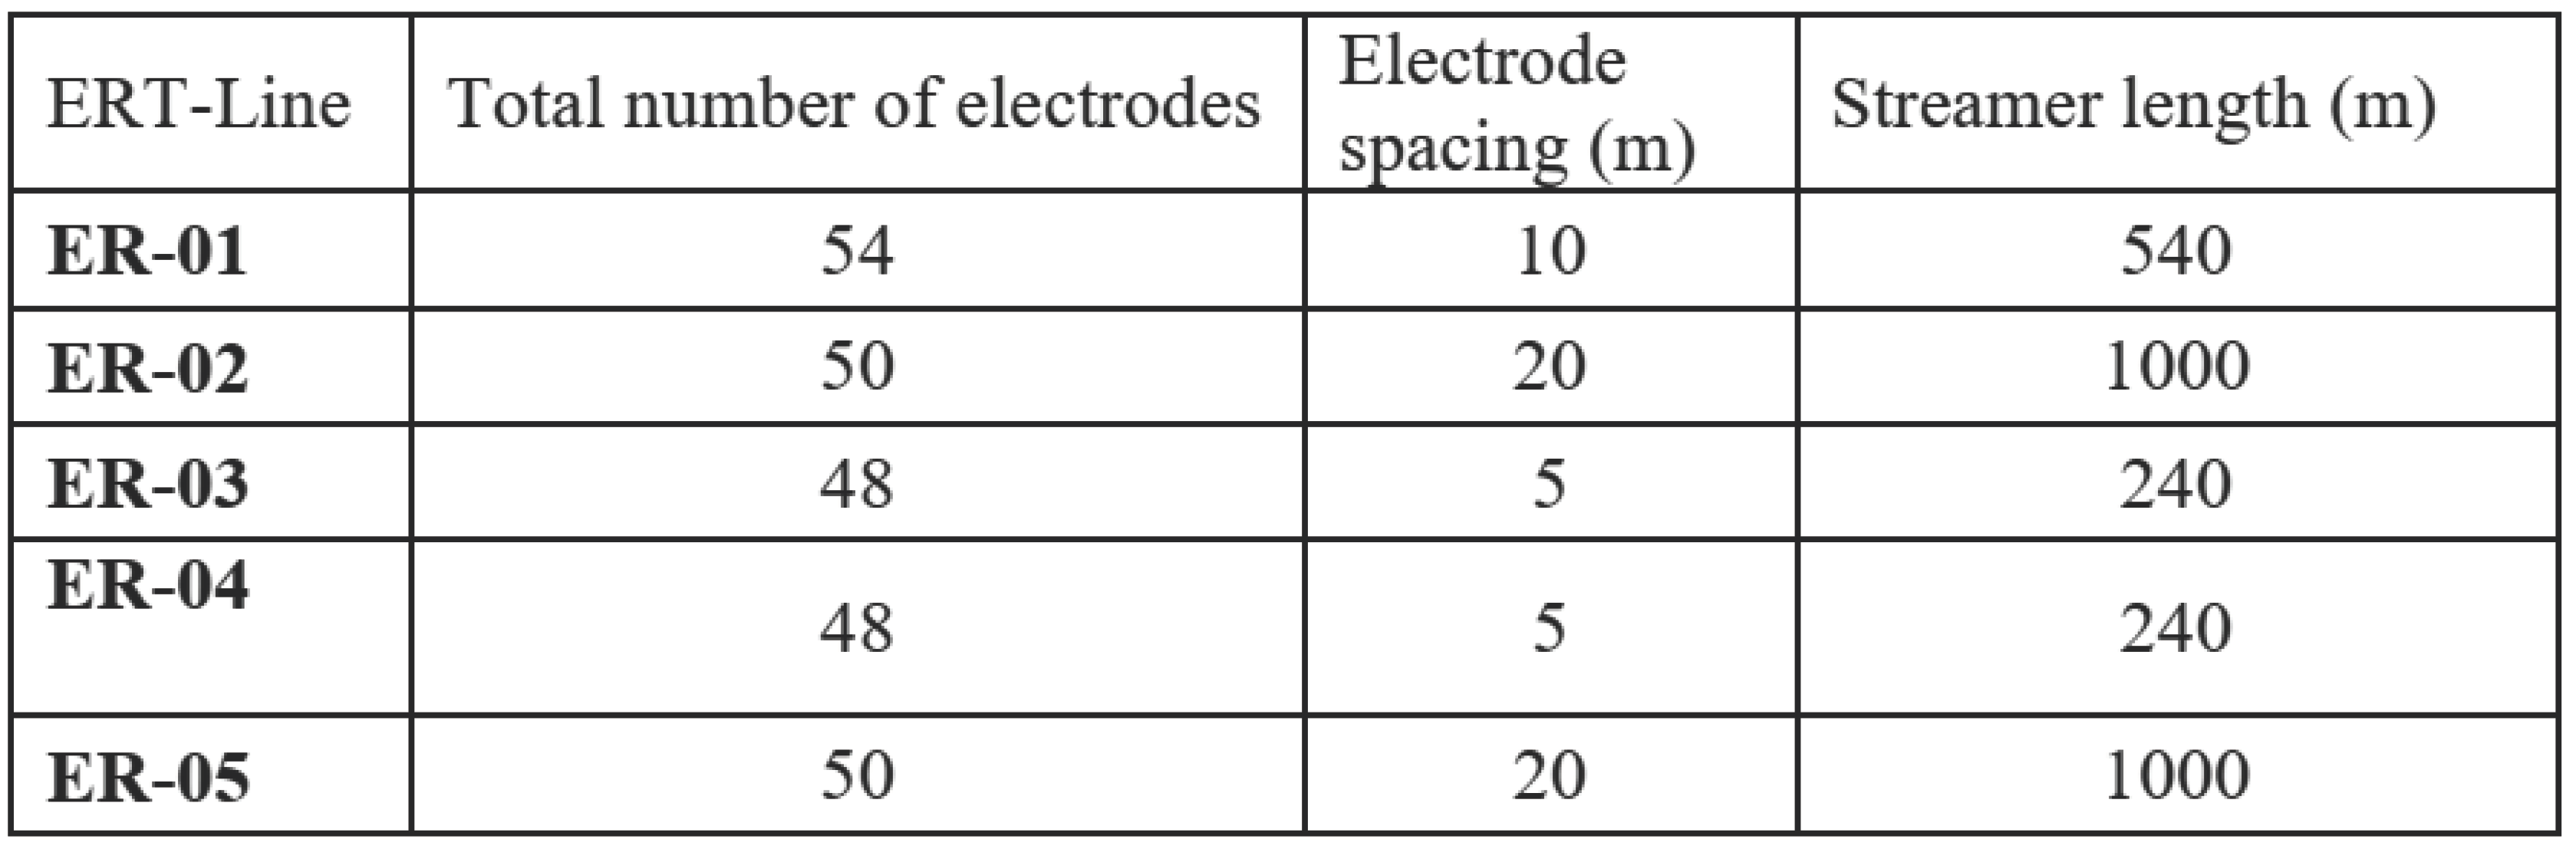
Table 2.
Summary of the inversions results.
Disclaimer/Publisher’s Note: The statements, opinions and data contained in all publications are solely those of the individual author(s) and contributor(s) and not of MDPI and/or the editor(s). MDPI and/or the editor(s) disclaim responsibility for any injury to people or property resulting from any ideas, methods, instructions or products referred to in the content. |
© 2024 by the authors. Licensee MDPI, Basel, Switzerland. This article is an open access article distributed under the terms and conditions of the Creative Commons Attribution (CC BY) license (http://creativecommons.org/licenses/by/4.0/).
Copyright: This open access article is published under a Creative Commons CC BY 4.0 license, which permit the free download, distribution, and reuse, provided that the author and preprint are cited in any reuse.


