Submitted:
20 February 2024
Posted:
21 February 2024
Read the latest preprint version here
Abstract
Soil moisture can be an important indicator of climate change in humid and semi-arid areas. This indicator can more efficiently propose different public policies related to climate change than just using precipitation and temperature data. Given the above, the objective of this study is to evaluate changes in soil moisture in the state of Pernambuco during the period 1961-2021, using the System of Hydrological Response Units for Pernambuco. In this study, five river basins in the state of Pernambuco that represent the different climatic conditions of the state will be chosen. The results show that in the coastal region, there is a tendency towards more saturated soils, and in the semi-arid region, there is a tendency towards drier soils. With these results, it is possible to conclude that public policy decisions for the economy, environment, and society must consider this vital water balance variable.
Keywords:
Monitoring
; modeling
; natural disaster
; water balance
; SWAT model
1. Introduction
A natural disaster is any calamitous occurrence generated by the effects of nature, in general, and then human-driven phenomena that produce great loss of human life or destruction of the natural environment, private property, or public infrastructure. A natural disaster may be caused by weather, climate events, landslides, and other occurrences originating at Earth’s surface [15]. Some types of disasters are often limited to or occur more frequently in specific geographic regions. For example, in Pernambuco, two specific geographic regions have landslides, flooding, or drought (semiarid). The rains generate river floods and flash floods, compromising the quality of life of the local population and causing significant damage to the economy in Pernambuco state [20].
From 2001 to 2018, more than 5000 water-related disasters occurred globally, accounting for 73.9% of all natural disasters. These disasters (i.e., floods, storms, landslides, and droughts) caused over 300,000 deaths and ~1.7 trillion dollars in economic damage worldwide. Floods and droughts have especially significant financial repercussions in recent history. In the 20th century, an estimated $365 billion was lost worldwide due to approximately 2100 floods and 430 droughts. The 21st century has experienced an increased frequency of water-related disasters and their associated consequences: from 2001 to 2018, around 600 billion dollars were lost globally due to more than 2900 floods or 290 drought events [21].
Unfortunately, the frequency and intensity of natural hazards and extreme events has increased over the last century, with reliable data showing a clear increase over the last four decades. The increase has been attributed to numerous factors, including climate change, world population growth, human activities, and ecosystem degradation [4,14]. Climate change has led to increased the frequency and intensity of hazardous events, partly related to the trend towards an increase in temperature and the frequency and intensity of precipitation events [21]. Human settlements are increasingly occupying areas of the landscape that are naturally prone to hazards, including floodplains, low-lying coastal areas, and alluvial fans [21]. In addition, changes associated with the landscape's physical, chemical, and biological characteristics, largely due to human activities (including urbanization and deforestation), have resulted in widespread degradation of ecosystems. This degradation leads to a decrease in the ability of nature and society to recover from a natural hazard [18], thus creating a positive feedback loop that drives an increase in the more significant number of devastating disaster events. Associated ecosystem functions essential for human well-being, including the ability to grow food and supply fresh water, are also degraded [21].
Throughout history, Pernambuco has recorded different problems related to rains and droughts. On the coast, there are many problems with flooding, and in the semi-arid, there are many problems related to severe droughts. In 1975, Recife, the capital of the Pernambuco state, had 80% of the inhabited territory flooded. There were five days of damage - with hospitals operating by candlelight and transportation through the neighborhoods being improvised in boats. In 2022, after almost 50 years, a new major disaster occurred in Recife, Landslides. Recife, the capital of Pernambuco, is a low-elevation city susceptible to flooding. Pernambuco was the worst tragedy in the last 50 years due to natural disasters. The event resulted in 130 deaths, more than 119,000 homeless, and 44 cities with an emergency decree. In Pernambuco, there is frequent flooding in the coastal region. On the other hand, in a semiarid region, in 2021, twelve cities of Pernambuco were in an emergency because of natural disasters and drought. Soil moisture is important for monitoring natural disasters related to droughts and floods.
Fire has been used for many years in Brazil, serving various purposes. However, if mishandled, it can cause fires with immense environmental damage. The Sertão and São Francisco Pernambucano mesoregions are susceptible to fires since the predominant biome is the Caatinga, with a semi-arid climate and low rainfall [8].
Hydrology, as a science, refers to studying the hydrological cycle. This comprises hydrological processes that can be analyzed over time, space, or both together, which, in turn, are quantitatively described by hydrological variables and represented by historical series. Therefore, it is essential to screen historical series to properly assess hydrological processes and their variability to public action policy [9].
The hydrological model Soil Water Assessment Tools- SWAT is very widespread in Brazil and due to the need for adjustments in the results obtained through modeling and observed data, it is necessary to carry out a calibration. Different studies have been developed to calibrate the swat model to Brazil, [2,13,23,27] northeast of Brazil, [11], and for the Pernambuco basins [1,5,11,24–26]. The intention was and is to provide a system that can facilitate the monitoring and planning of watersheds. This system is called Super- System of Hydrological Response Units for Pernambuco [6,7,12,26,28,29].
Soil moisture plays a crucial role in mitigating the impacts of natural disasters, particularly in water-related hazards such as floods and droughts. Understanding and effectively managing soil moisture levels can contribute significantly to disaster risk reduction in the following ways: flood management, drought resilience, landslide prevention, water supply management, and ecosystem health. Therefore, studying and monitoring soil moisture is crucial for better natural resource management, water resources, and mitigating the impacts of climate change. This study aims to relate dry and rainy years with soil moisture in the basins of Pernambuco and to show the impacts of natural disasters that cause droughts and floods in Pernambuco.
2. Materials and Methods
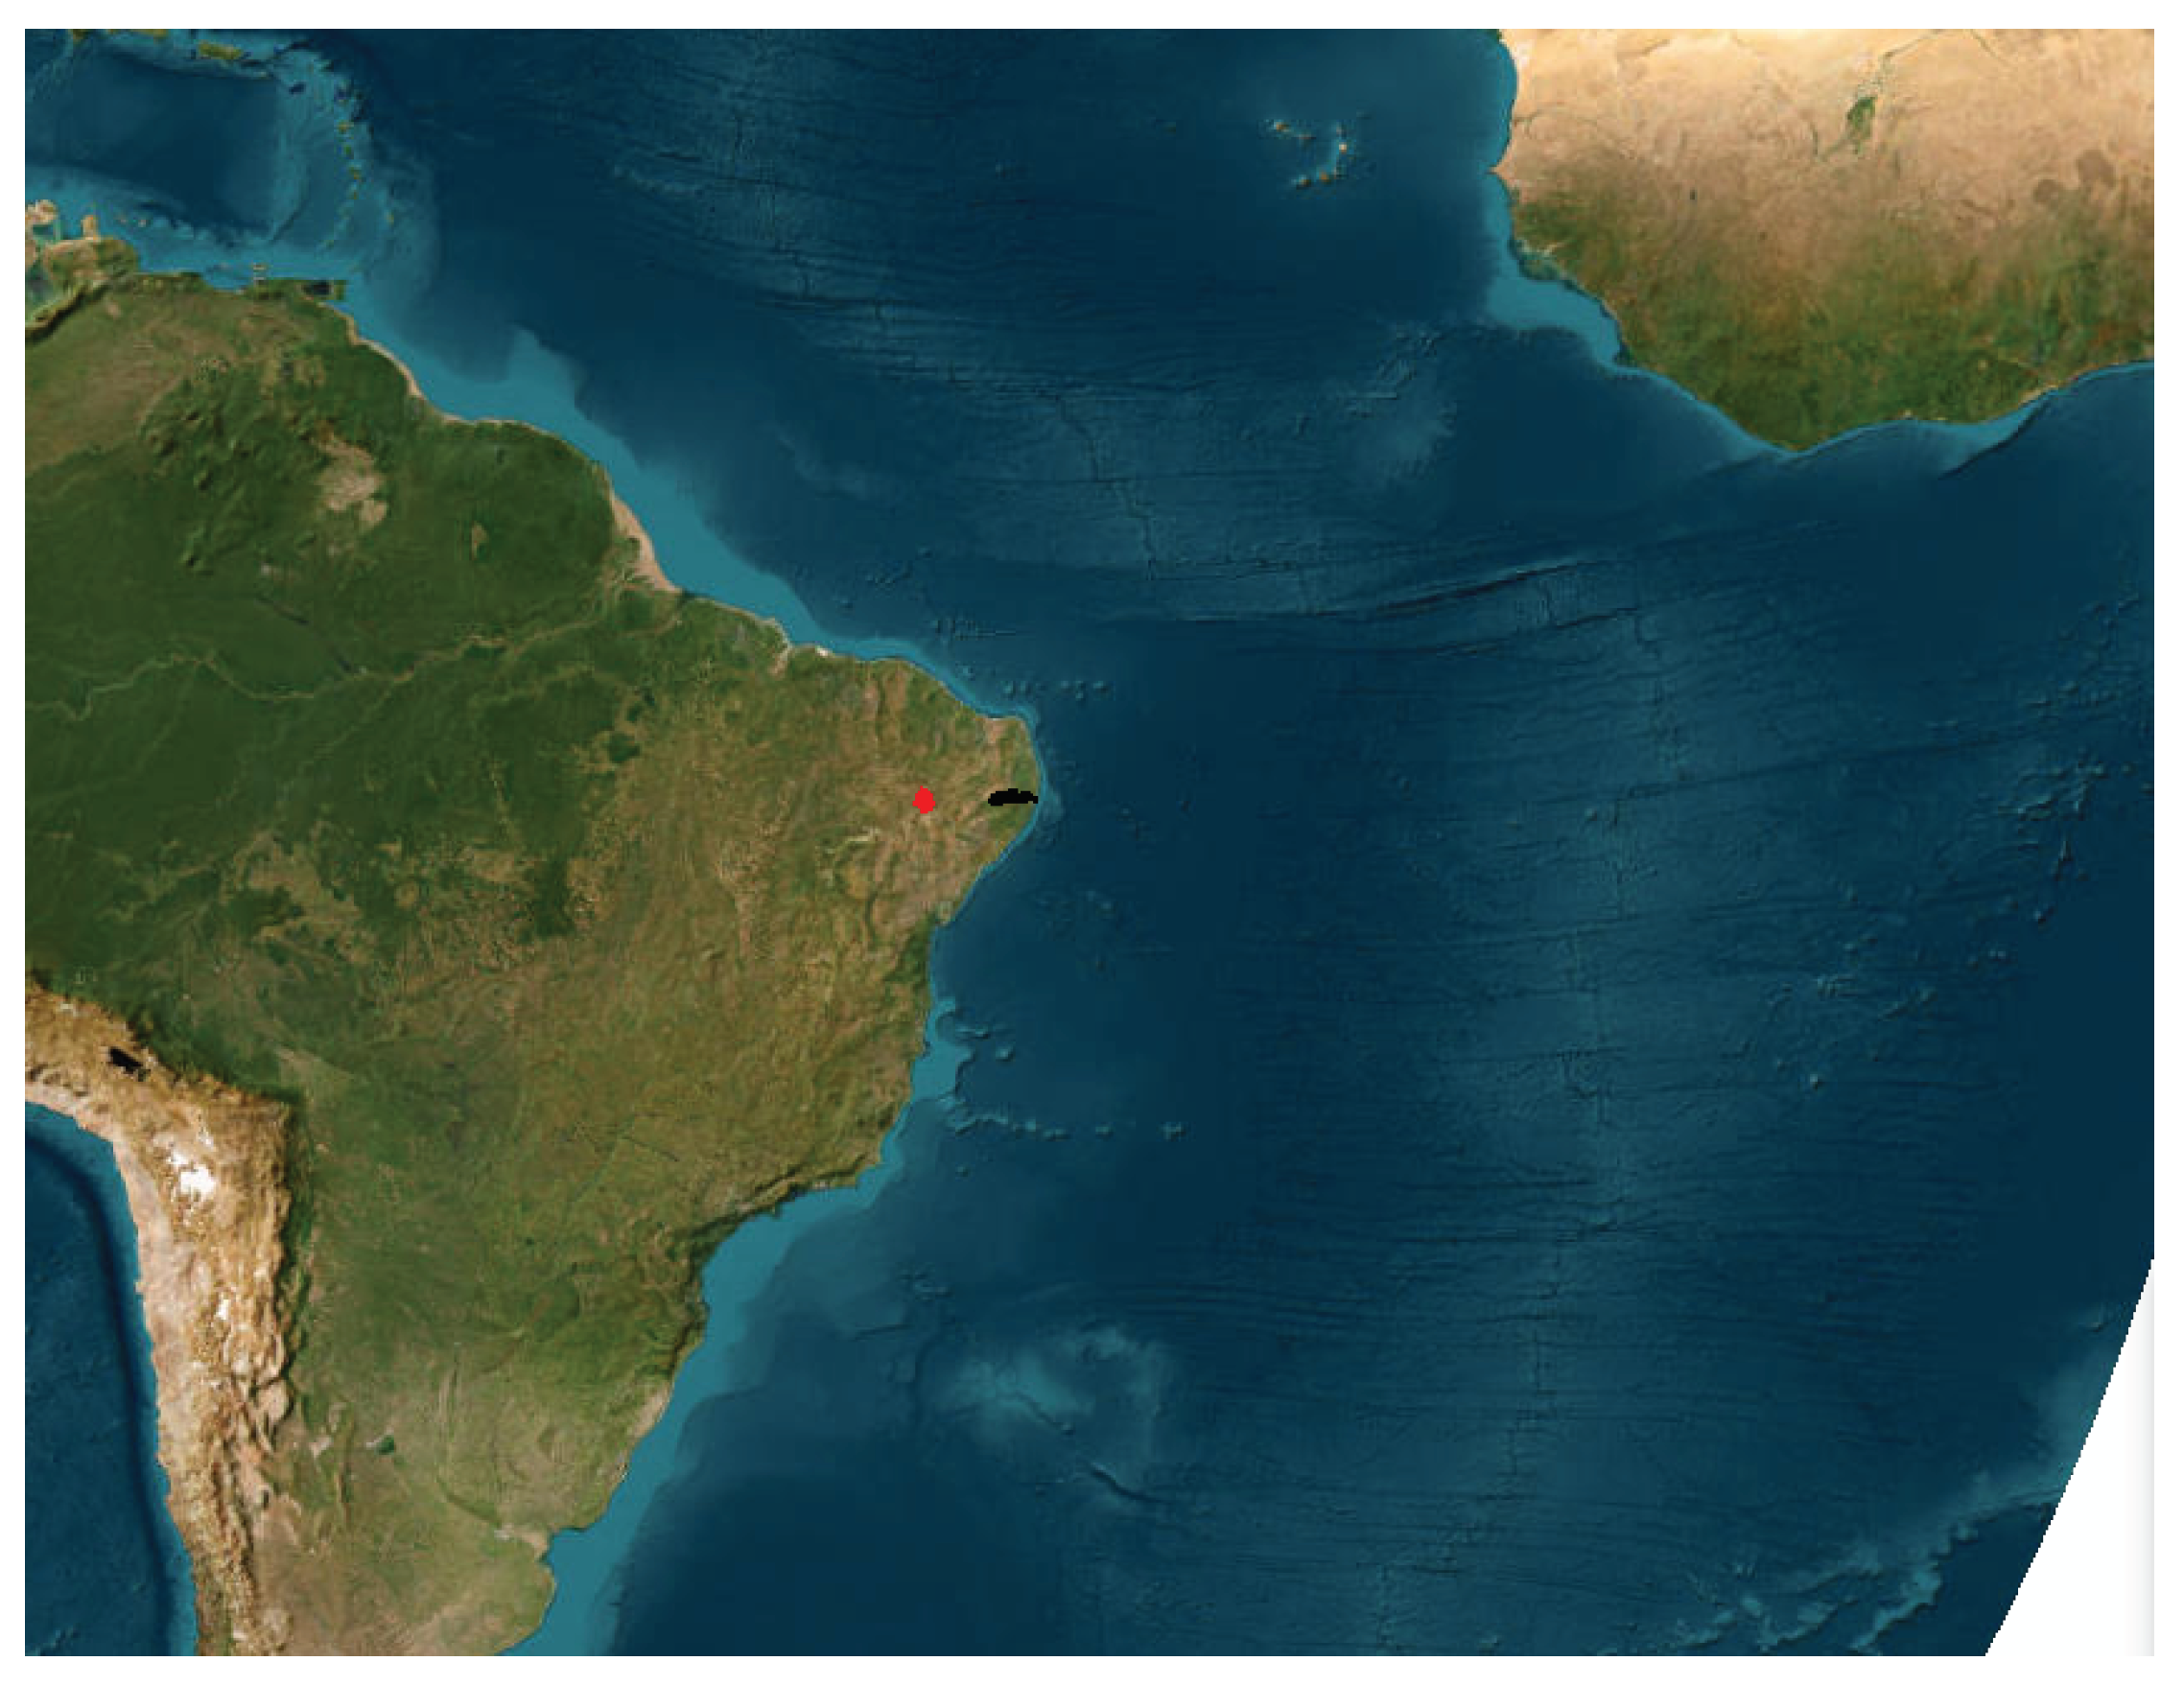
In this study, we selected two basins for analysis. The first, Capibaribe, is a wetland basin that covers part of the capital, Recife. The Capibaribe basin has an area of 7,536.65 km2. The second, Terra Nova, has 4,909.09 km2, is a semi-arid basin that receives water from the São Francisco River through the PISF-São Francisco Integration Project. Hence, these two basins were chosen to be present here.
Figure 1.
Localization of the basins Capibaribe (black) and Terra Nova (red), Pernambuco, Brazil.
This study used the SUPer system (System of Hydrological Response Units for Pernambuco), https://super.hawqs.tamu.edu/. SUPer is a simulation model for the quantification and quality of water in the basin. More detail for SUPER can see in [5,12,26,29].
The methodological basis of SUPer is the Soil and Water Assessment Tool (SWAT). SUPer has been used to simulate numerous basins in the state of Pernambuco for soil and water resource assessments. SUPer is an efficient model that simulates various watershed processes for a defined recording period. SUPer allows you to estimate soil moisture in spatial and temporal detail. Thus, the SUPer is believed to be very useful in indicating disasters that have a good relationship with the water balance and soil moisture.
In the super there are several variables of the hydrological and environmental cycle. This study shows the calibration of the SWAT model for the Capibaribe and Terra Nova basins that were included in the SUPer. In the SUPer the model was run in daily scale, the set-up/warm-up was 2 years and SWAT model version was SWAT2012. The project in SUPer to Capibaribe basin has subbasins 53, HRU-Hydrology Response Unit has 253 and Terra Nova basin has subbasins 32 and HRU has 174.
The data used in this study are SW- Soil Water, PRECIP-Precipitation of the period 1961-2021, where the years 1975, 2000 and 2005 were highlighted.
Scenery
- Actual
- Semiárid decrease 15% rainfall and increase 2celius in temperature (climate change)
- Umid region Increase 17% rainfall and increase 2celsius in temperature.
This study used aerial photography images obtained with a UAV to visualize changes in vegetation and surface temperature in areas with changing conditions in the São Francisco River water diversion project. That is an area with water entering the hydrological system.
3. Results
Capibaribe basin
It is possible to observe important changes in the average annual water balance, Figure 2 and Figure 3. But, is very important to see return flow because increase 27%. It’s possible see increase percolation, increase surface runoff, Increase return flow. Consequences, for example, reservoirs often with high volume. Attention! dam safety.
Soil moisture Capibaribe-low-SUPer basin
Climate change is already happening, in local scale. Climate change increase soil water, actual even more in the future, Figure 4. Soil moisture will be further impacted in the future. Consequences: Increased likelihood of landslide. The humidity data it is possible to make a prediction of landslide alert due to the high humidity content. Like for example in 1975, Figure 5. The capital of Pernambuco has faced two major floods in the last half century, the first in 1966 and the second, and more significant, in July 1975. Between July 17 and 18, 1975, streams and the Capibaribe River rose rapidly and overflowed, flooding entire neighborhoods. About 80% of the city of Recife was underwater. Very attention in this period. is more security for saving lives than only weather forecasts.
Between July 30 and August 1, heavy rains punished the state, including the Metropolitan Region of Recife, leaving a total of 22 dead, 100 injured, and more than 60,000 people homeless. Cities were partially destroyed, and the waters that overflowed from the rivers washed away bridges and houses. Almost all year round the soil was saturated, Figure 6.
Between May 30 and June 2, heavy rains caused flooding in 25 ages of the Agreste, Zona da Mata and Littoral of Pernambuco, leaving 36 dead and more than 30,000 people homeless. About seven thousand houses were partially or destroyed; 40 bridges were damaged; 11 state highways were hit, seven of which were closed. The water flooded several cities' central streets, hospitals, schools, and commercial houses, causing enormous material damage. In this period, the SW is shown in Figure 7. Yet, soil moisture (SW) and precipitation can separate flooding risks and landslides.
Terra Nova basin
In the semi-arid region of Pernambuco, water availability is small, Figure 8 and may worsen with climate change, Figure 9. The evaporation and transportation will decrease, potential evapotranspiration-PET will increase, surface runoff will decrease, lateral flow will decrease, and return flux will decrease with climate change. It is very important to know these results to adopt public policies to mitigate the impacts of climate change and natural disasters related to droughts. This basin is undergoing significant transformations in land use and occupation related to development due to water entry into the system through the project to transfer water from the São Francisco River. This development can change the climatic and environmental conditions of the place and needs continuous monitoring. Figure 10 shows an aerial photograph obtained with UAVs and unmanned aerial vehicles of a small area of the Terra Nova watershed where it is possible to perceive spatial transformations related to the water supply that has transformed the vegetation cover and surface temperature conditions. In this area is the perennialization of natural rivers and increased riparian forests and irrigated areas. Change in vegetation, water conditions, and climate on a local scale.
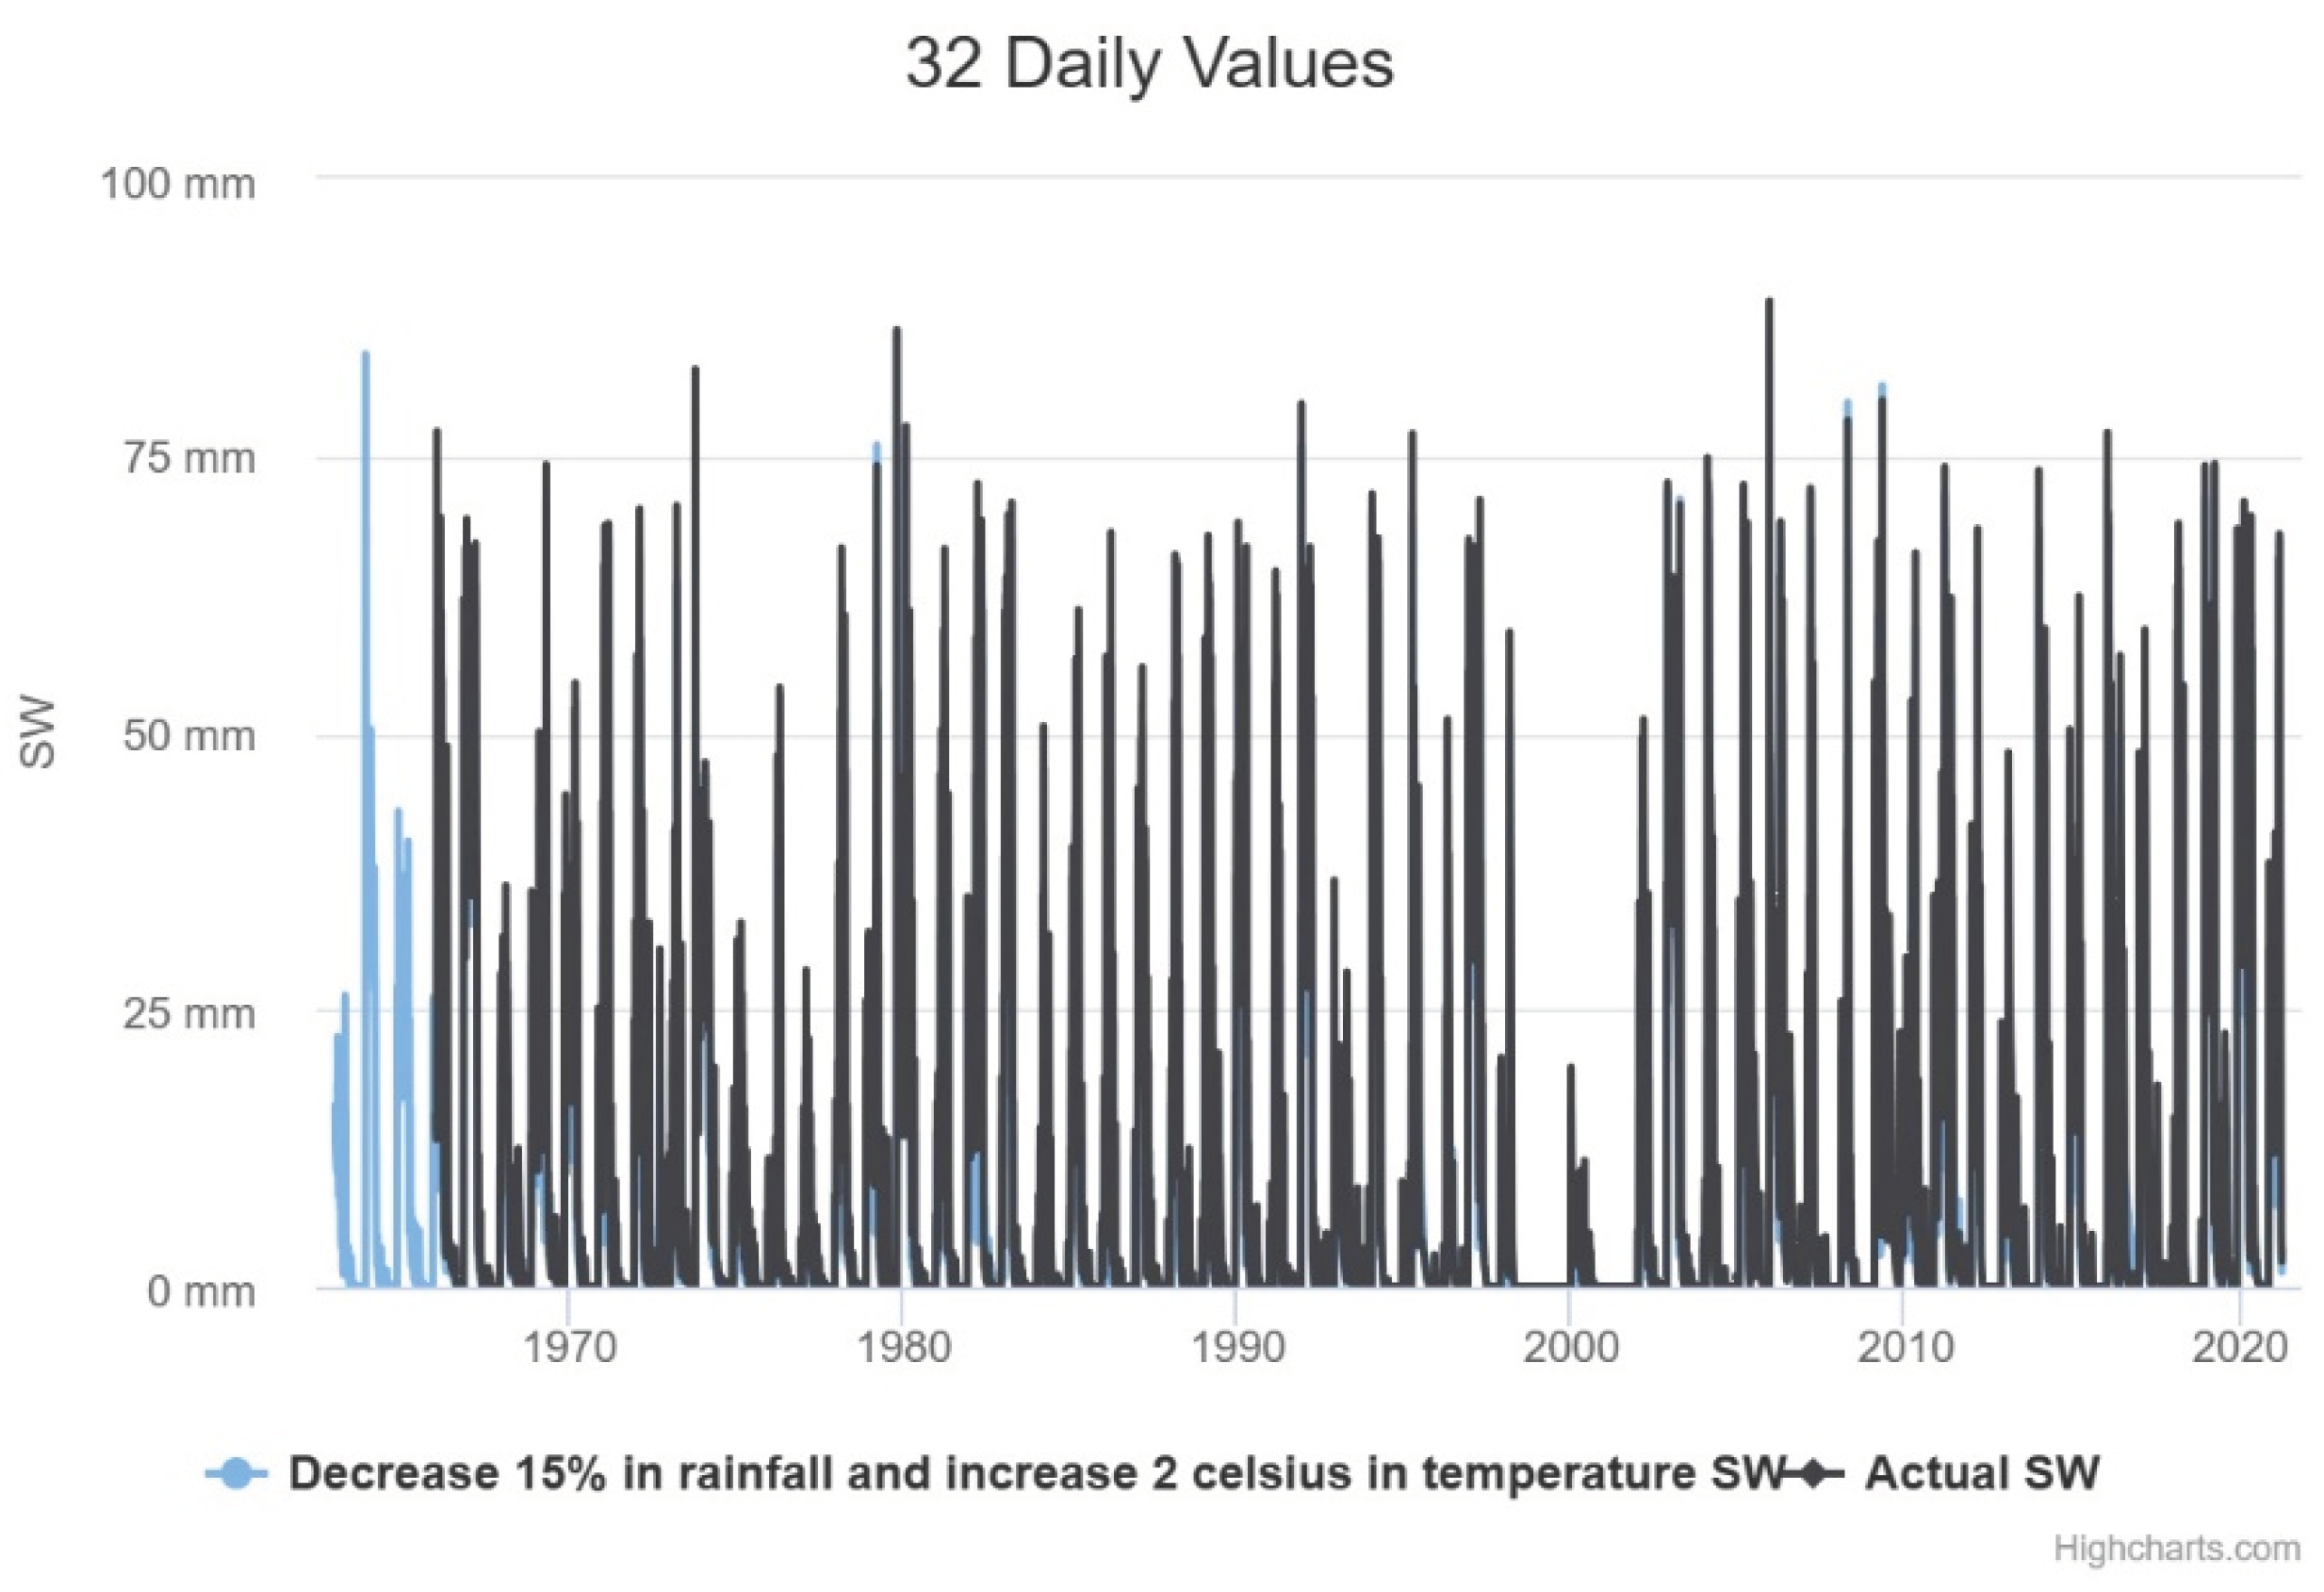
It is possible to perceive longer periods of low soil moisture, Figure 11. This is very worrying for the survival of the natural ecosystem of the area that is the Caatinga. Vegetation that has high vulnerability and resilience to extreme weather conditions. The Caatinga is the largest continuous SDTF in the Americas, with an open and primarily semi-arid landscape, as seen in many inter-plateau depressions. The Caatinga covers an area of approximately 900,000 km2 and exhibits at least 13 physiognomies ranging from woodlands to sparsely distributed thorny shrubs. Its climate is characterized by high temperatures and low rainfall rates with high intra- and inter-annual variability both in space and time. The rainfall is usually concentrated over 2–4 months of the year, with the possibility of over 25% of the annual precipitation occurring in a single rainfall event [16,17]. A critical result to highlight in this study is the El Nino of 1998, where in that period until 2020, soil moisture was close to zero.
There is a greater need to replenish water in the soil for agriculture and ecosystem survival. Reservoirs take a longer time with low volume. PISF (integration project for the waters of the São Francisco River) project can be a climate change mitigation action (water entering the system). In this region, we have a water supply from the PISF. This is very good. In the semi-arid region, the results of this study showed a decrease in soil moisture and a prolonged increase in days with low soil moisture, Figure 11. The results showed an increase in days with high soil moisture for the humid region.
Discussion
According to [30], information on soil moisture is essential for monitoring the intensity of droughts, the beginning of the rainy season, planting dates, and early warnings of productivity losses. In his study, he evaluated drought's spatial and temporal trends in the Brazilian semi-arid region, combining soil moisture observations from 360 stations, soil moisture in the root zone from a leading land surface model, and a remotely sensed vegetation health index. The soil moisture data set was obtained from the network of stations maintained by the National Center for Monitoring and Alerting of Natural Disasters (Cemaden) in Brazil. Modeled soil moisture was correlated with measurements in the standard period 2015-2018, resulting in an average correlation coefficient of 0.48 across the domain. The standardized soil moisture anomaly (SMA) was calculated for long-term modeled soil moisture. It revealed strong negative values during well-known dry periods in the region, especially during the El-Niño years. Public drought assessment policies should consider the combination of several drought indices, including the soil moisture anomaly. The study presented here reinforces the one already studied for the semi-arid region of Brazil by [30], where we indicate the great importance of assessing soil moisture for alerts to natural disasters. In this study, the great advantage when compared to Zeri is the spatial and temporal detailing. As well as the response to the hydrological cycle and the environmental conditions of the place.
According to [31], soil water is vital to sustain semi-arid ecosystems. However, data on soil moisture collected over a long period (eg,> 50 years) is scarce. The Super system has provided soil moisture data for 61 years (1961-2021) for Pernambuco. Super is based on the SWAT-Soil Water Assessment Tools hydrological model calibrated using observed flow data. The calibration of the SWAT model for the Terra Nova basin is presented in [10], which performed well with a validation coefficient of determination of 0.67.
[3] state that landslide-active regions are more likely to experience severe threats to residents under worsening climate change. They claim that to predict the occurrence of landslides, the shallow soil moisture situated at the interface of hydrological processes was found to be one of the critical factors. However, shallow soil moisture data are often scarce in active landslide regions. To overcome serious measurement shortcomings and provide predictions of soil moisture dynamics, the SUPer can be a handy system for such an indication. In the model, the soil's meteorological conditions and physical properties are considered. With limited field measurements, the model can provide reasonably accurate soil moisture predictions. Hydrological processes interact with precipitation and air temperature variations depending on interconnected soil and water boundary conditions. This demonstrates a strong need for decent forecasting of complex shallow soil moisture dynamics and associated hydrological processes in mountainous regions to deal with climate change for landslide preparedness. This study presents the SUPER as an option to alert this natural disaster to landslides. Thus, like other studies, soil moisture has already been presented as an option for monitoring landslides.
Conclusions
This study concludes that the change in soil moisture in the semi-arid region is possible for the dam with a long time of low volume and the wet region than the dam with a long time of high volume. The results indicate essential projections for managing water resources in the state of Pernambuco, a semiarid region of Brazil.
Using soil moisture and precipitation can separate flooding risks and landslides in humid regions.
In humid and semi-arid areas, the soil water can improve the alerts for preventing lives and social and economic impacts.
Acknowledgments
The authors would like to thank CNPq- Conselho Nacional de Desenvolvimento Científico e Tecnológico through the 405853/2022-0, INCT-Observatório Nacional de Segurança Hídrica e Gestão Adaptativa (Proc, 406919/2022-4. BRICS Project (Proc. 442335;2017.2) projects and for the research productivity grants of the first and third authors, Fundação de Amparo à Ciência e Tecnologia do Estado de Pernambuco-FACEPE through the APQ-0392-3.07/22 (FACEPE-FAPESP) projects, CAPES for the fourth author's master's scholarship.
References
- Brito, P.; Miranda, R.; Morais, Y. C. B..; Costa, V.; Moura, M.; Silva, A. S. Alves Da ; Galvincio, J. Avaliação da evapotranspiração estimada pelo MODIS e do balanço hídrico para a bacia do Pontal-Pernambuco. Revista Brasileira De Geografia Física, 2021, 14, 2866-2877. [CrossRef]
- Castro, R., Machado, E. Análise De Sensibilidade De Parâmetros Hidrológicos Na Bacia Do Rio Das Pedras - Guarapuava-Pr. Revista Brasileira de Geografia Física, 2019, 12(5), 1746-1756. [CrossRef]
- Dai, J. Y., Cheng, S. T. Modeling shallow soil moisture dynamics in mountainous landslide active regions. Front. Environ. Sci., 17 October 2022. Sec. Environmental Informatics and Remote Sensing, 2022, vol.10. [CrossRef]
- De Guenni LB, Cardoso M, Goldammer J, Hurtt G, Mata LJ, Ebi K, House J, Valdes J. Regulation of natural hazards: floods and fires. In Ecosystems and human well-being: current state and trends (ed. Norgaard R), 2005, pp. 441-454. Washington, DC: Island Press.
- Farias, C., Viana, J., Miranda, R., Silva, S., Vasco, G., Montenegro, S., Galvíncio, J. Técnica de calibração para modelagem da bacia hidrográfica do Rio São Francisco, Brasil, utilizando o SWAT. Revista Brasileira de Geografia Física, 2023, 16(3), 1621-1628. [CrossRef]
- Galvincio, J. D. Impacto do aumento de CO2 nas Precipitações do estado de Pernambuco. Revista Brasileira de Geografia Física 2021, vol.14, 1828-1839. [CrossRef]
- Galvíncio, J. D.; Luz, G. G. Desenvolvimento de Modelo que Estima o Impacto do CO2 Atmosférico nas Precipitações do Estado de Pernambuco, utilizando ARIMA. Revista Brasileira de Geografia Física, 2021, 14, 1840-1851. [CrossRef]
- Gouveia, J., Nascimento, C. Identificação Operacional de Áreas com Potencial de Regeneração e/ou Recuperação Vegetal nas Mesorregiões do Sertão e São Francisco Pernambucano. Revista Brasileira de Geografia Física, 2023, 16(3), 1231-1246. [CrossRef]
- Kunst Valentini, M., Beskow, S., Silva da Silva, M., Sell, B., de Mello, C., Caldeira Beskow, T., & de Morais da Silveira, J. Overview on the historical series of annual maximum streamflows in Brazil: analysis based on temporal and statistical criteria. Revista Brasileira de Geografia Física, 2023, 16(2), 837-846. [CrossRef]
- Luz, G.G.d.; Miranda, R.d.Q.; Galvíncio, J.D. Assessment of Water Availability and Environmental Influence on People’s Lives in a Small Basin in the Hinterland of Pernambuco, Using the SUPer and UAV. Appl. Sci. 2023, 13, 11255. [CrossRef]
- Lins, Frederico Abraão Costa.; Montenegro, Abelardo Antônio De Assunção.; Farias, Carolyne Wanessa Lins De Andrade.; Chagas, Aline Maria Soares Das ; Miranda, Rodrigo De Queiroga ; Galvíncio, J. D. Análise Da Dinâmica Temporal Da Evapotranspiração Real Em Uma Bacia Hidrográfica Do Semiárido Através De Modelagem Hidrológica E Sensoriamento Remoto. Irriga, 2021, 26, 543-564. [CrossRef]
- Luz, G., Galvíncio, J. Balanço hídrico superficial da bacia hidrográfica do riacho Milagres-PE, utilizando o SUPer. Revista Brasileira de Geografia Física, 2022, 15(2), 1094-1107. [CrossRef]
- Martins, L., Martins, W., de Moraes, J., Júnior, M., De Maria, I. Calibração hidrológica do modelo SWAT em bacia hidrográfica caracterizada pela expansão do cultivo da cana-de-açúcar. Revista Brasileira de Geografia Física, 2020, 13(2), 576-594. [CrossRef]
- McPhillips LE et al. Defining extreme events: a cross-disciplinary review. Earth's Future, 2018, 6, 441-455. [CrossRef]
- Metych, Michele. "natural disaster". Encyclopedia Britannica, 27 Mar. 2023, https://www.britannica.com/science/natural-disaster. Accessed 31 July 2023.
- Miranda, R. Q.; Nóbrega, R. L. B.; Moura, M. S. B.; Raghavan, S.; Galvíncio, J. D. Realistic and simplified models of plant and leaf area indices for a seasonally dry tropical forest. International Journal of Applied Earth Observation and Geoinformation, 2020, v. 85, p. 101992. [CrossRef]
- Miranda, R.D.Q. Galvíncio, J.D. Morais, Y.C.B., Moura, M.S.B., Jones, C.A., Srinivasan, R. Dry Forest deforestation dynamics in Brazil’s Pontal basin. Rev. Caatinga, 2018, 31pp. 385-395. [CrossRef]
- Munang R, Thiaw I, Alverson K, Liu J, Han Z. The role of ecosystem services in climate change adaptation and disaster risk reduction. Curr. Opin. Environ. Sustain 2013, 5, 47-52. [CrossRef]
- Nascimento, J., Frade, T., Silva, R. Modelagem da resposta do escoamento em uma bacia do semiárido da Paraíba utilizando o modelo SWAT (Modelling of runoff response in semi-arid catchment of Paraíba State using SWAT). Revista Brasileira de Geografia Física, 2018, 11(3), 1137-1150. [CrossRef]
- Portela, B., Alves, G., da Silva, S., Lafayette, K. Análise da Vulnerabilidade à Inundação na Bacia Hidrográfica do Rio Sirinhaém, utilizando o Método de Análise Hierárquica. Revista Brasileira de Geografia Física, 2023, 16(3), 1247-1262. [CrossRef]
- Saco, P. M, McDonough K. R, Rodriguez, J., Rivera-Zayas, J, Sandi S.G. The role of soils in the regulation of hazardsand extreme events.Phil. Trans. R. Soc. 2021, B376:20200178. [CrossRef]
- Paz, Y., Galvíncio, J., de Holanda, R., Srinivasan, R., Jones, C. Análise de sensibilidade e calibração espacial do modelo SWAT aplicado em uma bacia do litoral pernambucano através de dados climáticos observados e de reanálise (Analysis of sensitivity and calibration of the SWAT model applied in a basin in northeast of Brazil using observed and reanalysis climatic data). Revista Brasileira de Geografia Física, 2018, 11(1), 371-388. [CrossRef]
- Paz, Y. M ; Silva, J.F ; Holanda, R. M ; Galvíncio, J. D. Avaliação espacial da produção de sedimentos e estratégias para redução dos processos erosivos em bacia hidrográfica no Nordeste do brasil. Derbyana, 2022, v. 43, p. 1-30. [CrossRef]
- Paz, Y. M. ; Silva, J.F ; Holanda, R. M. ; Galvíncio, J. D. Planejamento e gestão ambiental de bacias hidrográficas a partir da modelagem hidrossedimentológica e estudo de cenários alternativos de uso e cobertura do solo. Geociências (São Paulo. Online), 2022, v. 41, p. 675-687. [CrossRef]
- Rodrigues, J., Junqueira, R., Amorim, J., Alves, B., & Viola, M. Hydrological modeling in the Sono river basin, environmental protection region of the Jalapão, Brazilian savanna. Revista Brasileira de Geografia Física, 2021, 14(2), 1131-1142. [CrossRef]
- Tiburcio, I., Silveira, N., dos Santos, T., Miranda, R., Galvíncio, J. Balanço Hídrico e Mudanças Climáticas no Semiárido Pernambucano: aplicabilidade do Sistema de Unidades de Respostas Hidrológicas para Pernambuco (SUPer). Revista Brasileira de Geografia Física, 2023, 16(3), 1657-1670. [CrossRef]
- Trentin, R., Laurent, F., Robaina, L. Vazão e Balanço Hídrico Relacionado a Mudanças no Uso da Terra em uma Bacia Hidrográfica de Médio Porte no Bioma Pampa do Brasil. Revista Brasileira de Geografia Física, 2023. 16(2), 873-893. [CrossRef]
- Torres, N. S.; Silveira, H. T., Tiburcio, I. M. ; Galvíncio, J. D. Qualidade da Água e Modelagem Hidrológica: aplicabilidade do Sistema de Unidades de Respostas Hidrológicas para Pernambuco (SUPer). Revista Brasileira de Sensoriamento Remoto, 2022, 3, 30-40. [CrossRef]
- Torres, S., N.; Tibúrcio, I.; Soares, G.; Galvíncio, J.; Santos, D.; Montenegro, S. Temporal Analysis of Water Quality for the Nilo Coelho Reservoir, Terra Nova, Pernambuco, Brazil. Water, 2023, v. 15, p. 2899. [CrossRef]
- Zeri, M., Williams, K., Cunha, A.P.M.A., Cunha-Zeri, G., Vianna, M.S., Blyth, E.M., et al. Importance of including soil moisture in drought monitoring over the Brazilian semiarid region: An evaluation using the JULES model, in situ observations, and remote sensing. Climate Resilience and Sustainability, 2022, 1, e7. [CrossRef]
- Wang, F., Yang, S., Wei, Y., Shi, Q., Ding, J. Characterizing soil salinity at multiple depth using electromagnetic induction and remote sensing data with random forests: A case study in Tarim River Basin of southern Xinjiang, China, Science of The Total Environment, 2021, Volume 754, 142030, ISSN 0048-9697, (https://www.sciencedirect.com/science/article/pii/S0048969720355595). [CrossRef]
Figure 2.
Average annual water balance, actual situation.

Figure 3.
Average annual water balance, climate change situation.

Figure 4.
Soil Water-SW in Capibaribe basin.
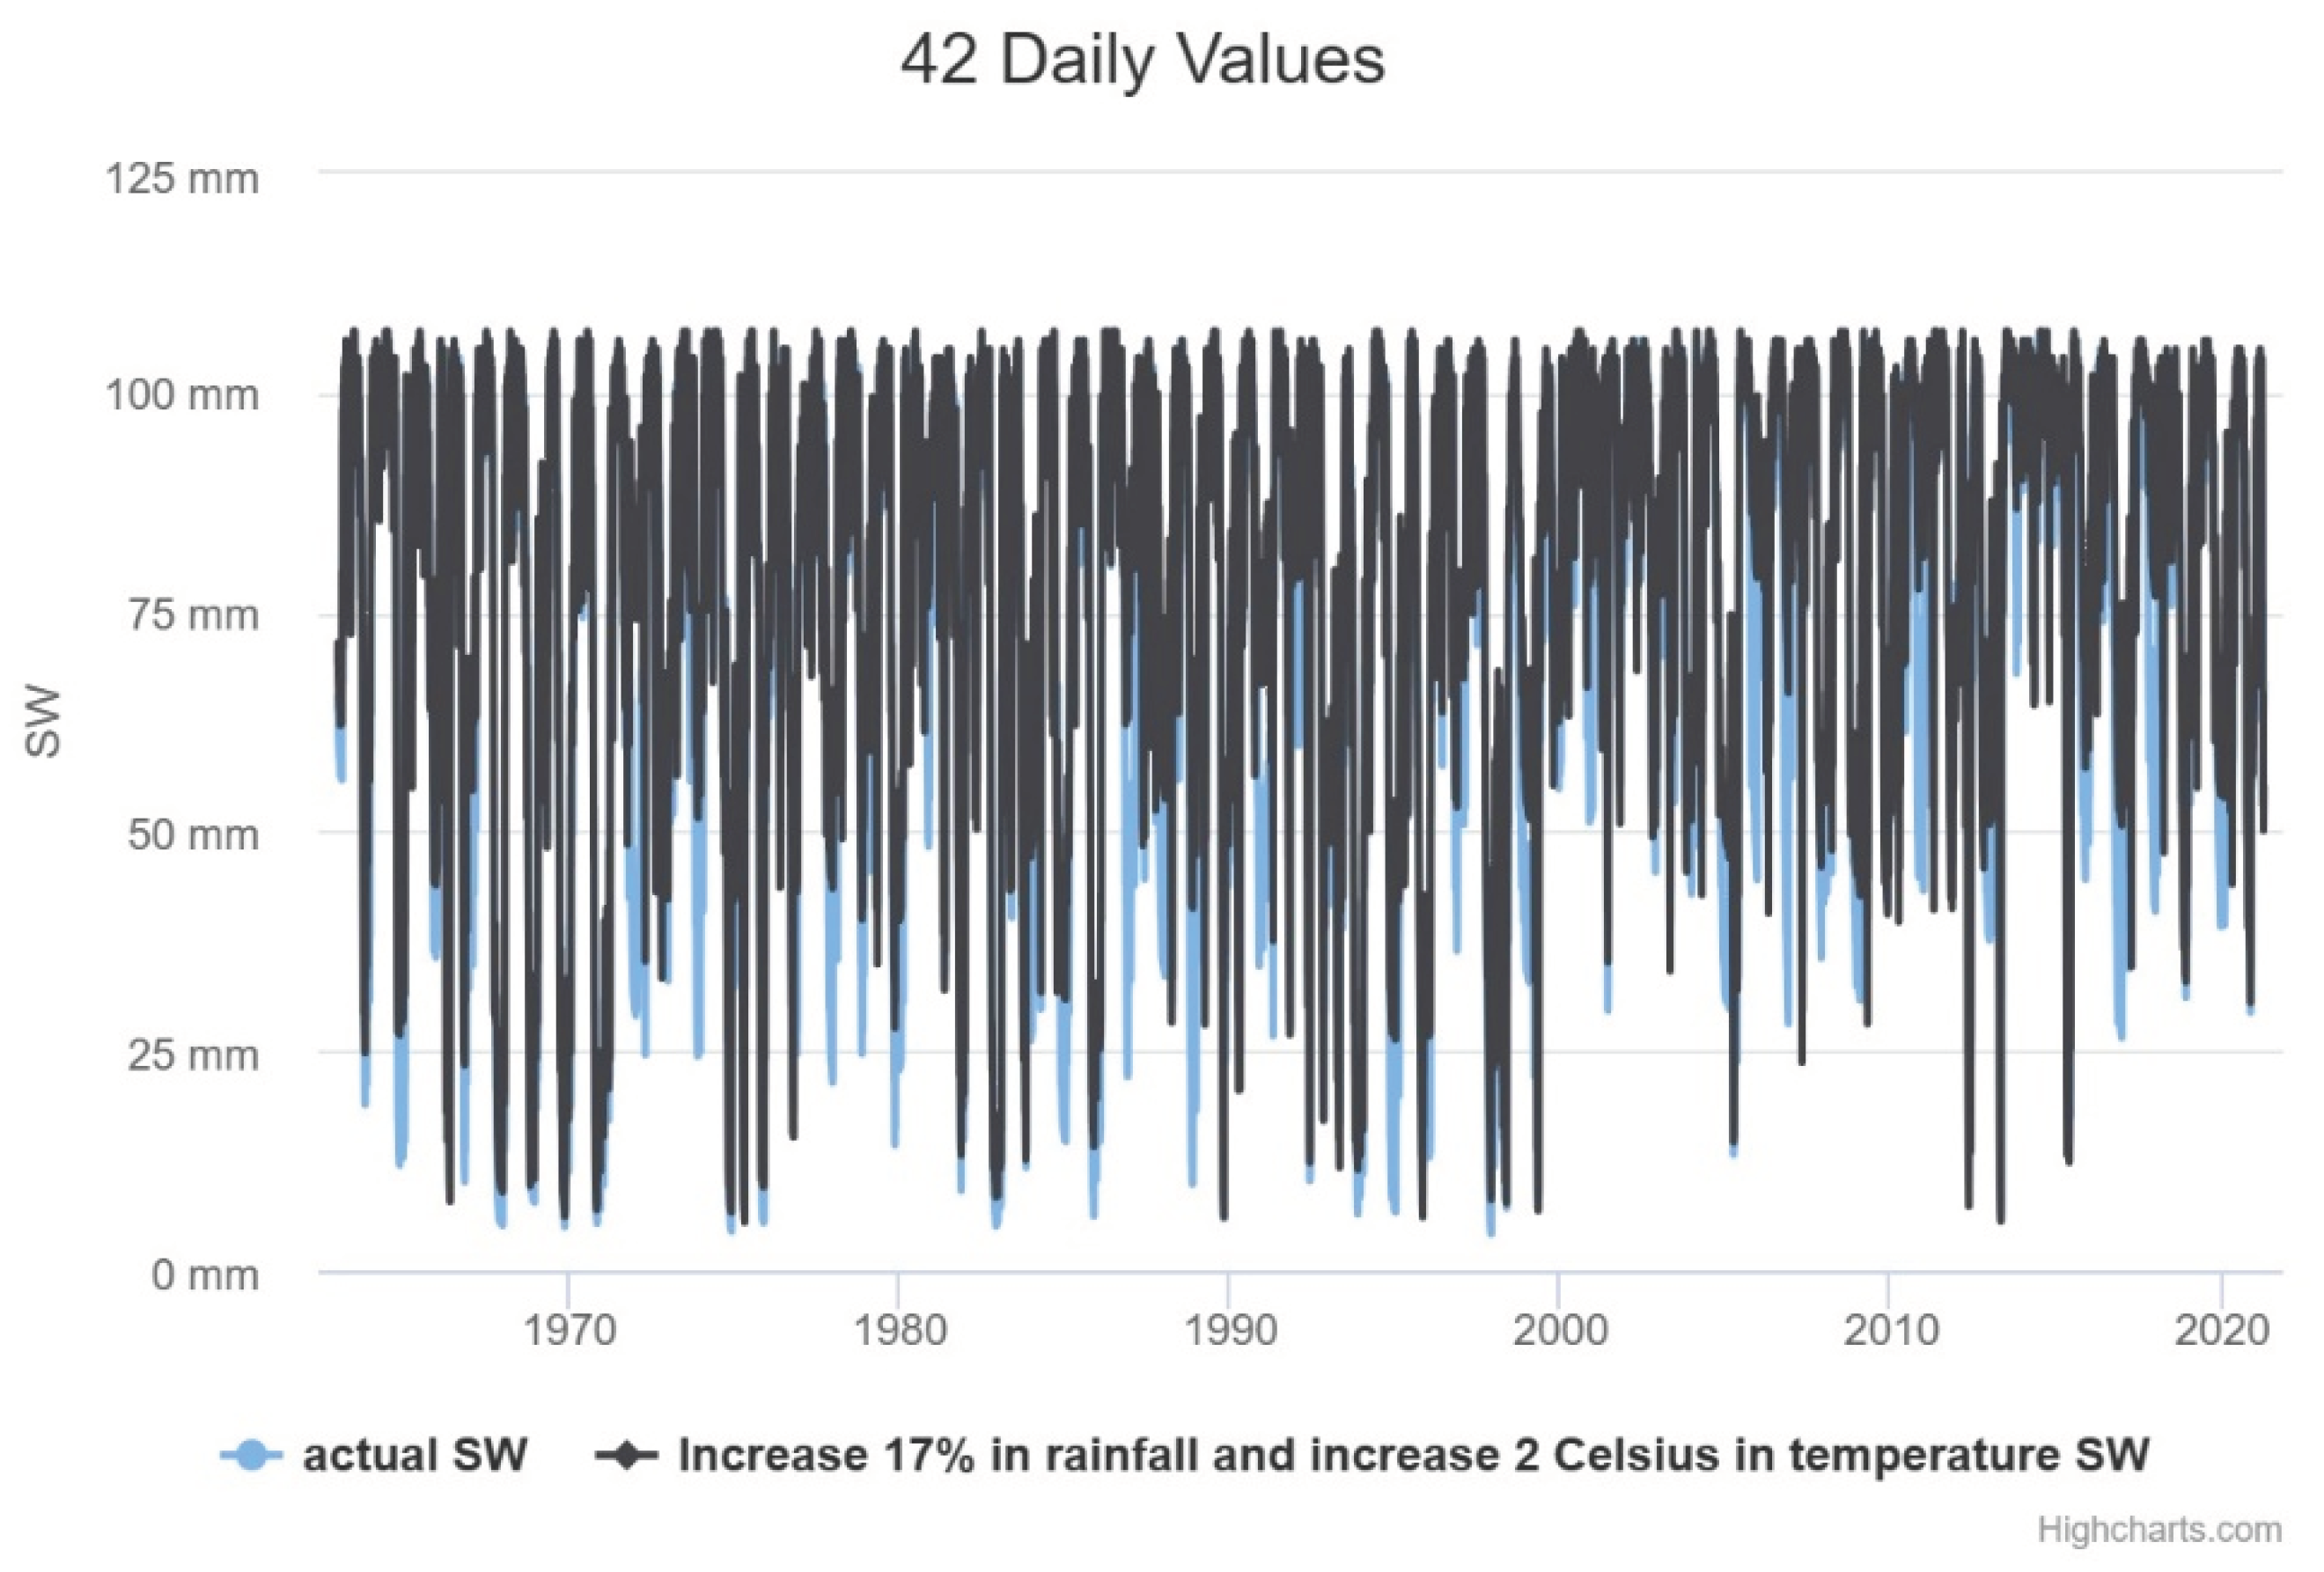
Figure 5.
SW-Soil water in Capibaribe basin, 1975.
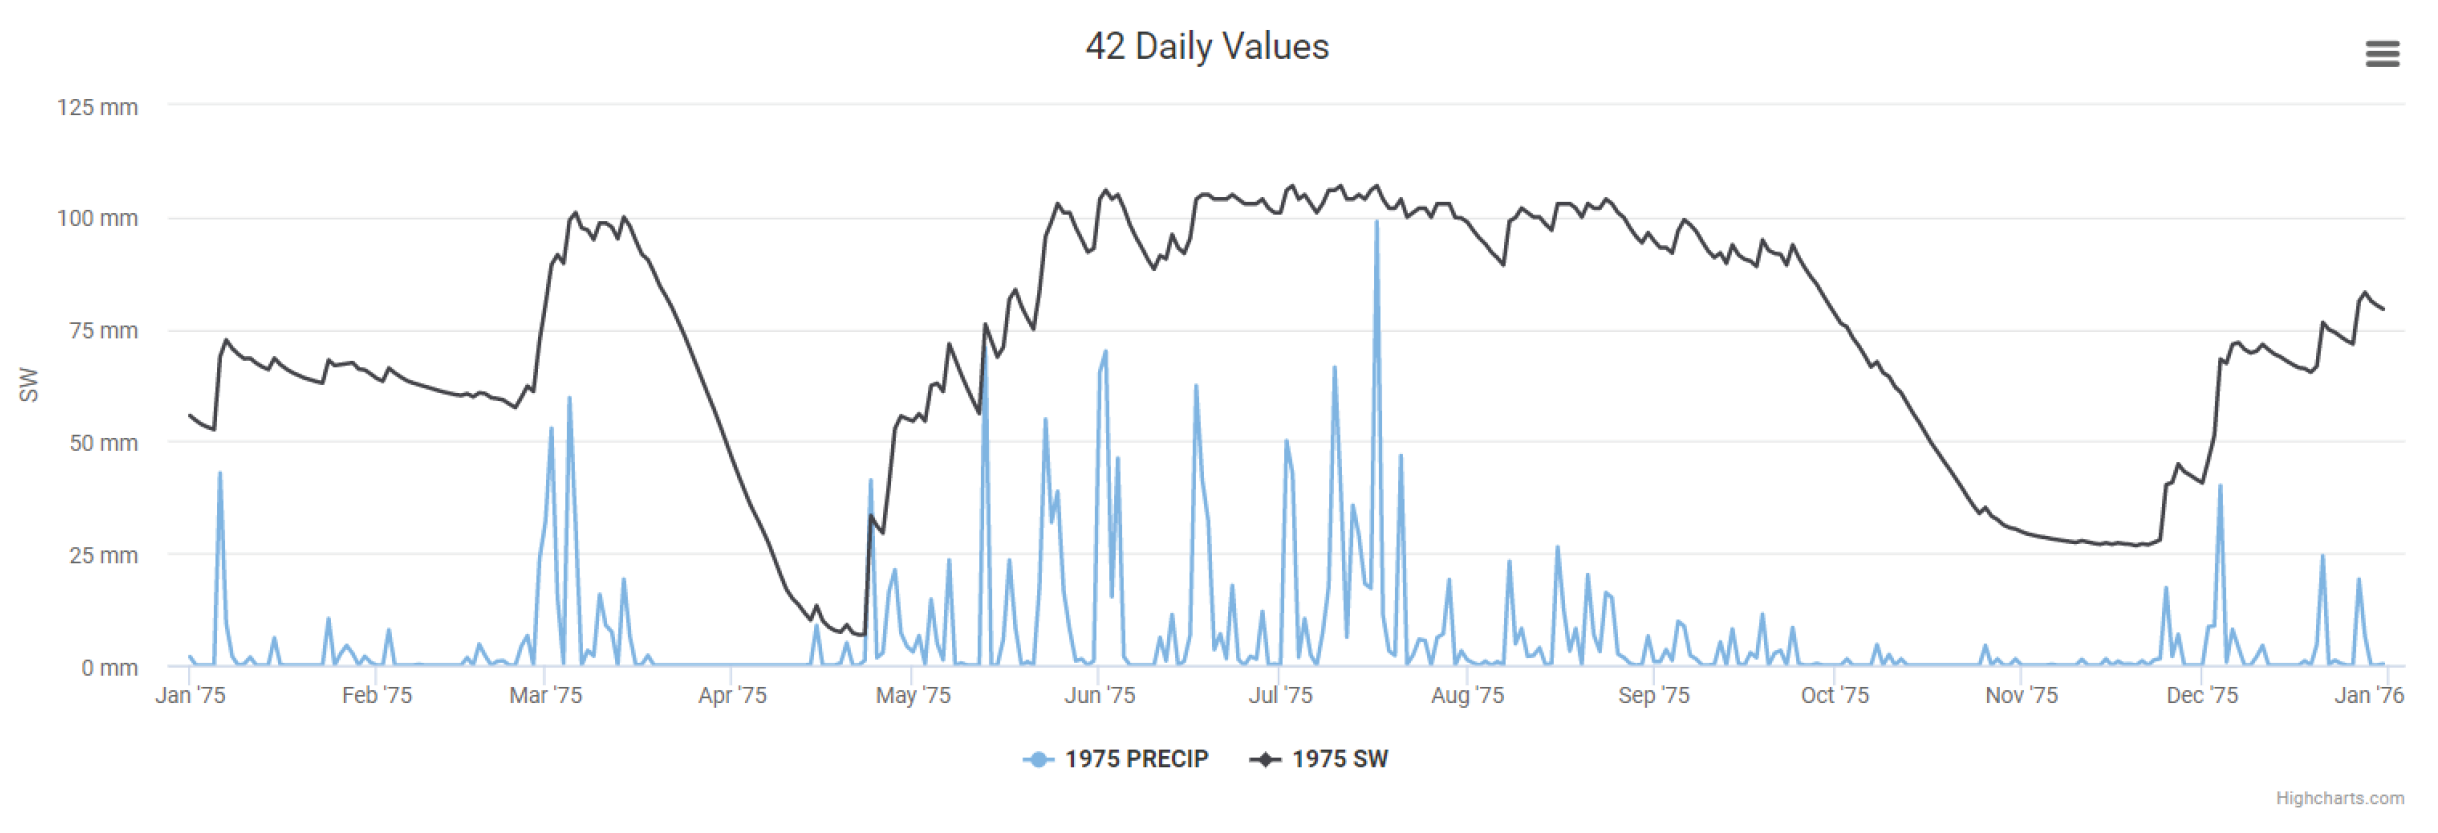
Figure 6.
SW-Soil water and Precipitation-PRECIP in Capibaribe basin, 2000.
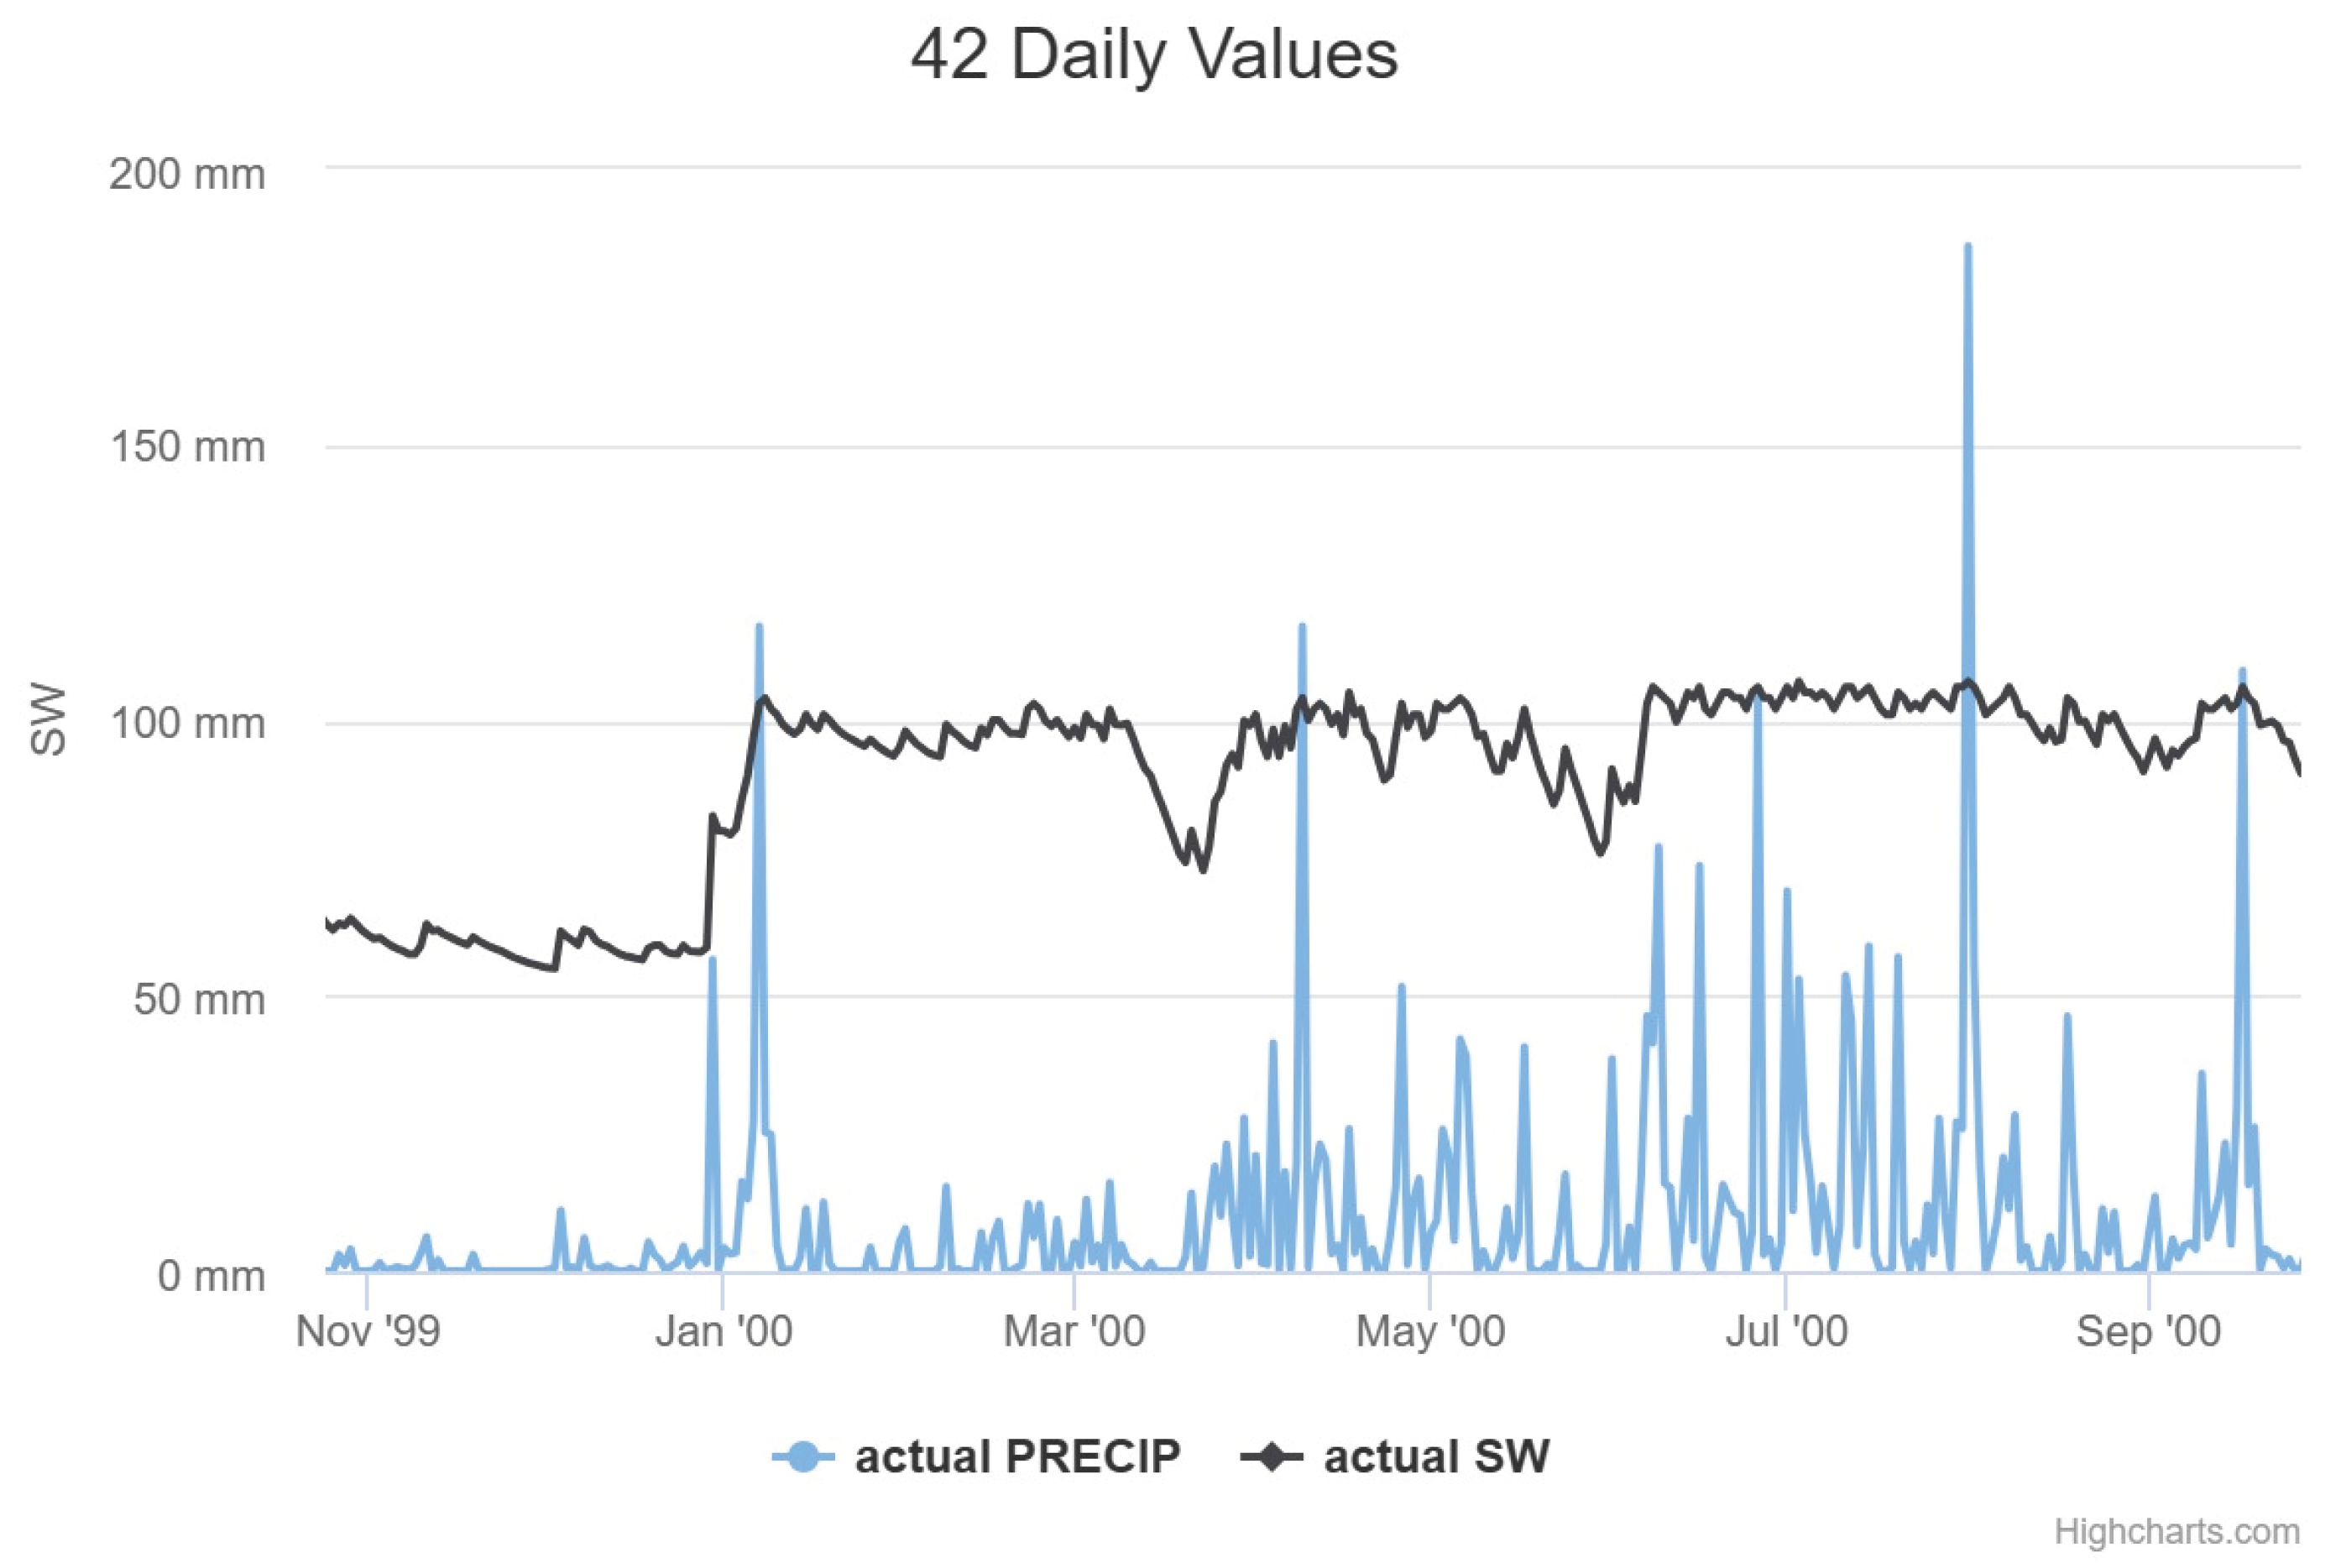
Figure 7.
SW-Soil water and Precipitation-PRECIP in Capibaribe basin, 2005.
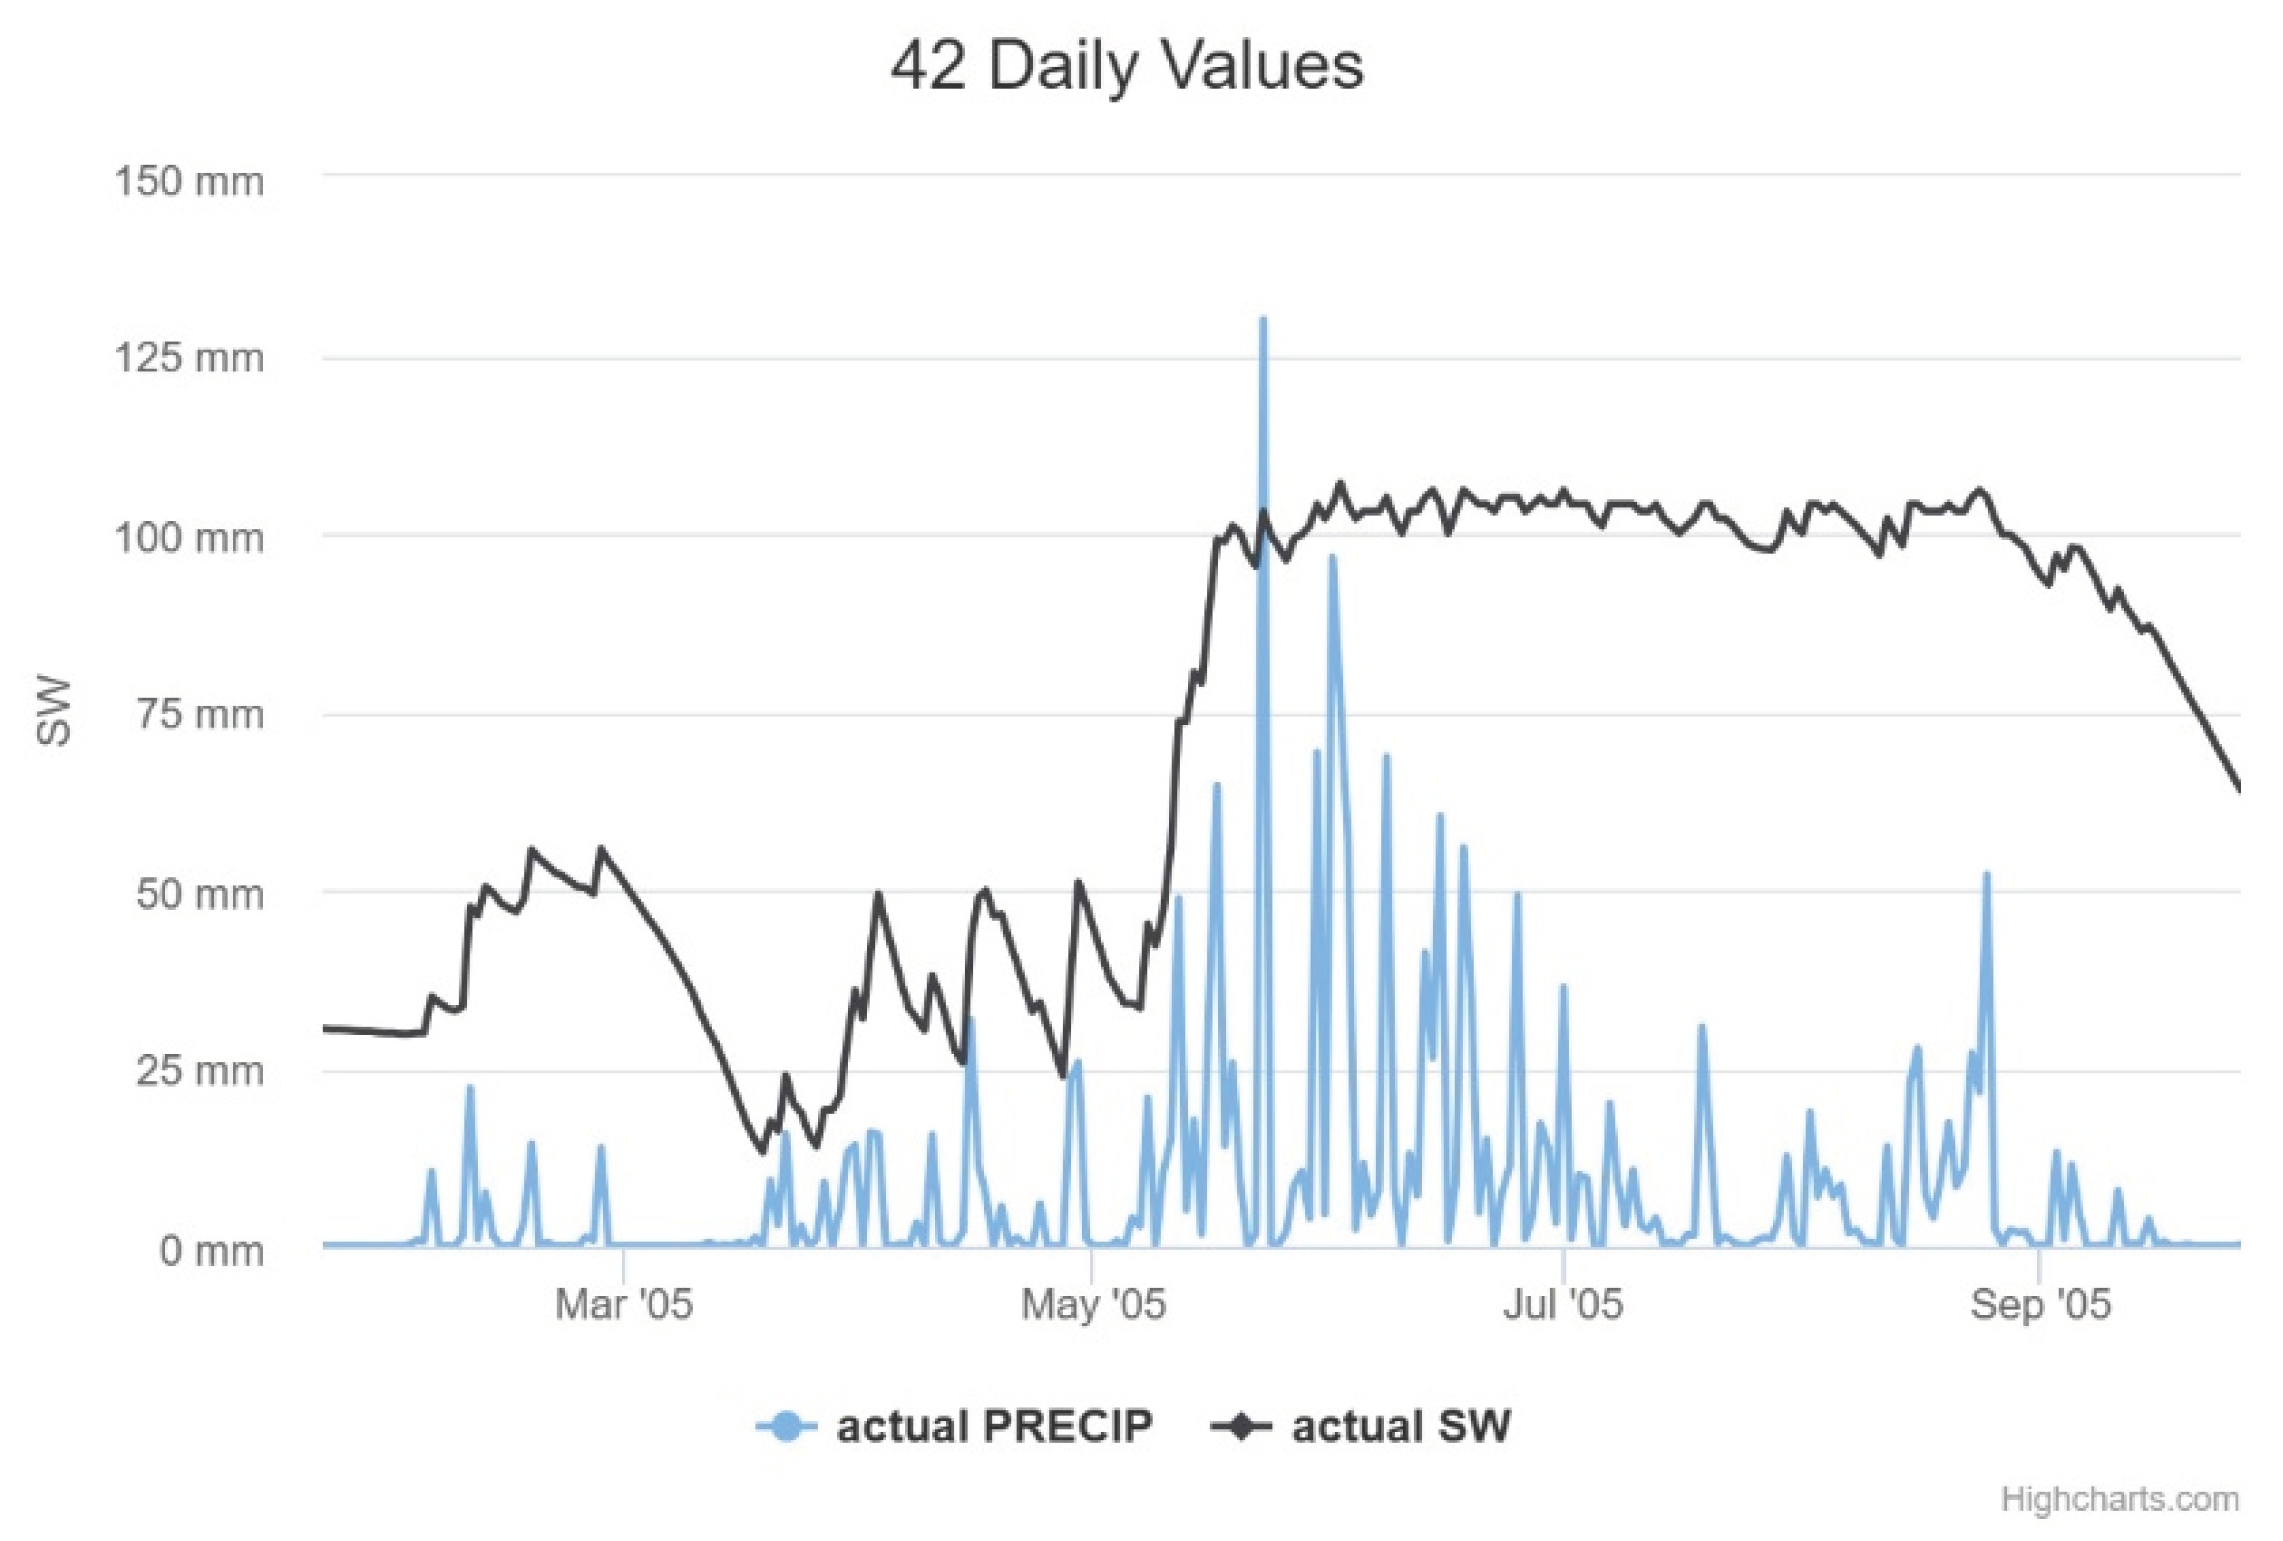
Figure 8.
Average annual water balance, actual situation.
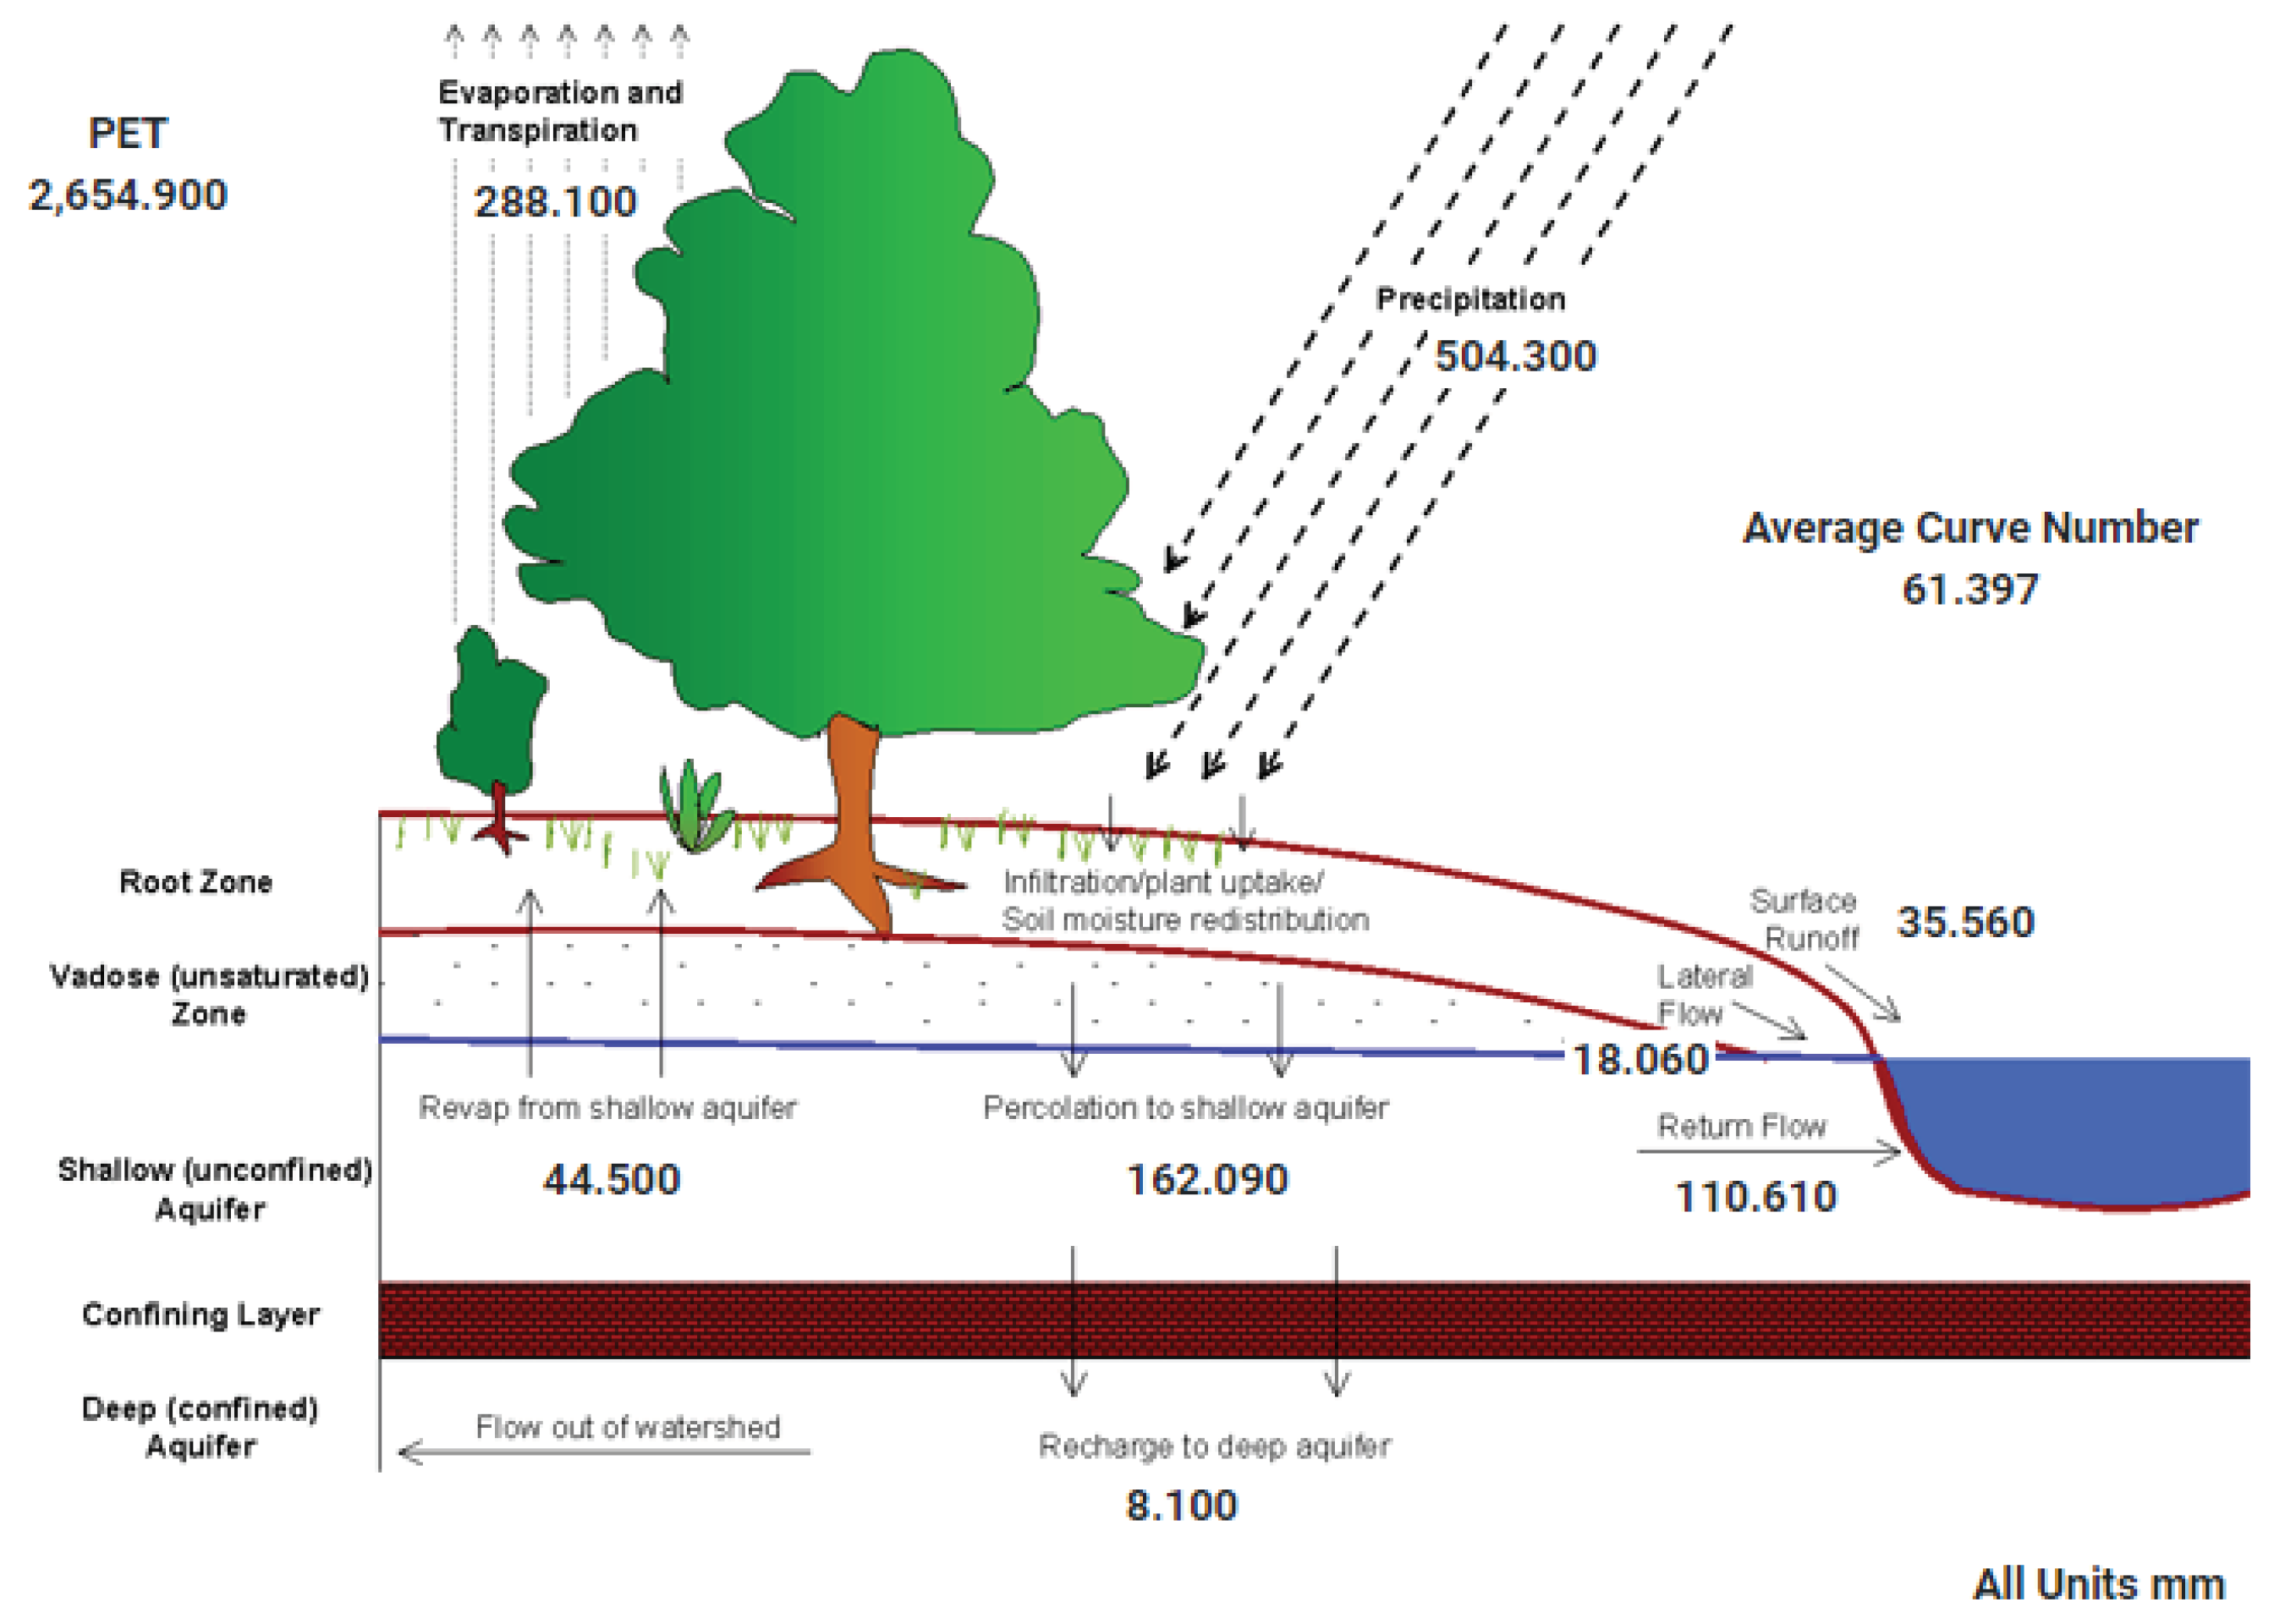
Figure 9.
Average annual water balance, climate change situation.

Figure 10.
Aerial photograph, obtained with UAV- Unmanned Aerial Vehicles of a small area of the Terra Nova watershed.
Figure 10.
Aerial photograph, obtained with UAV- Unmanned Aerial Vehicles of a small area of the Terra Nova watershed.
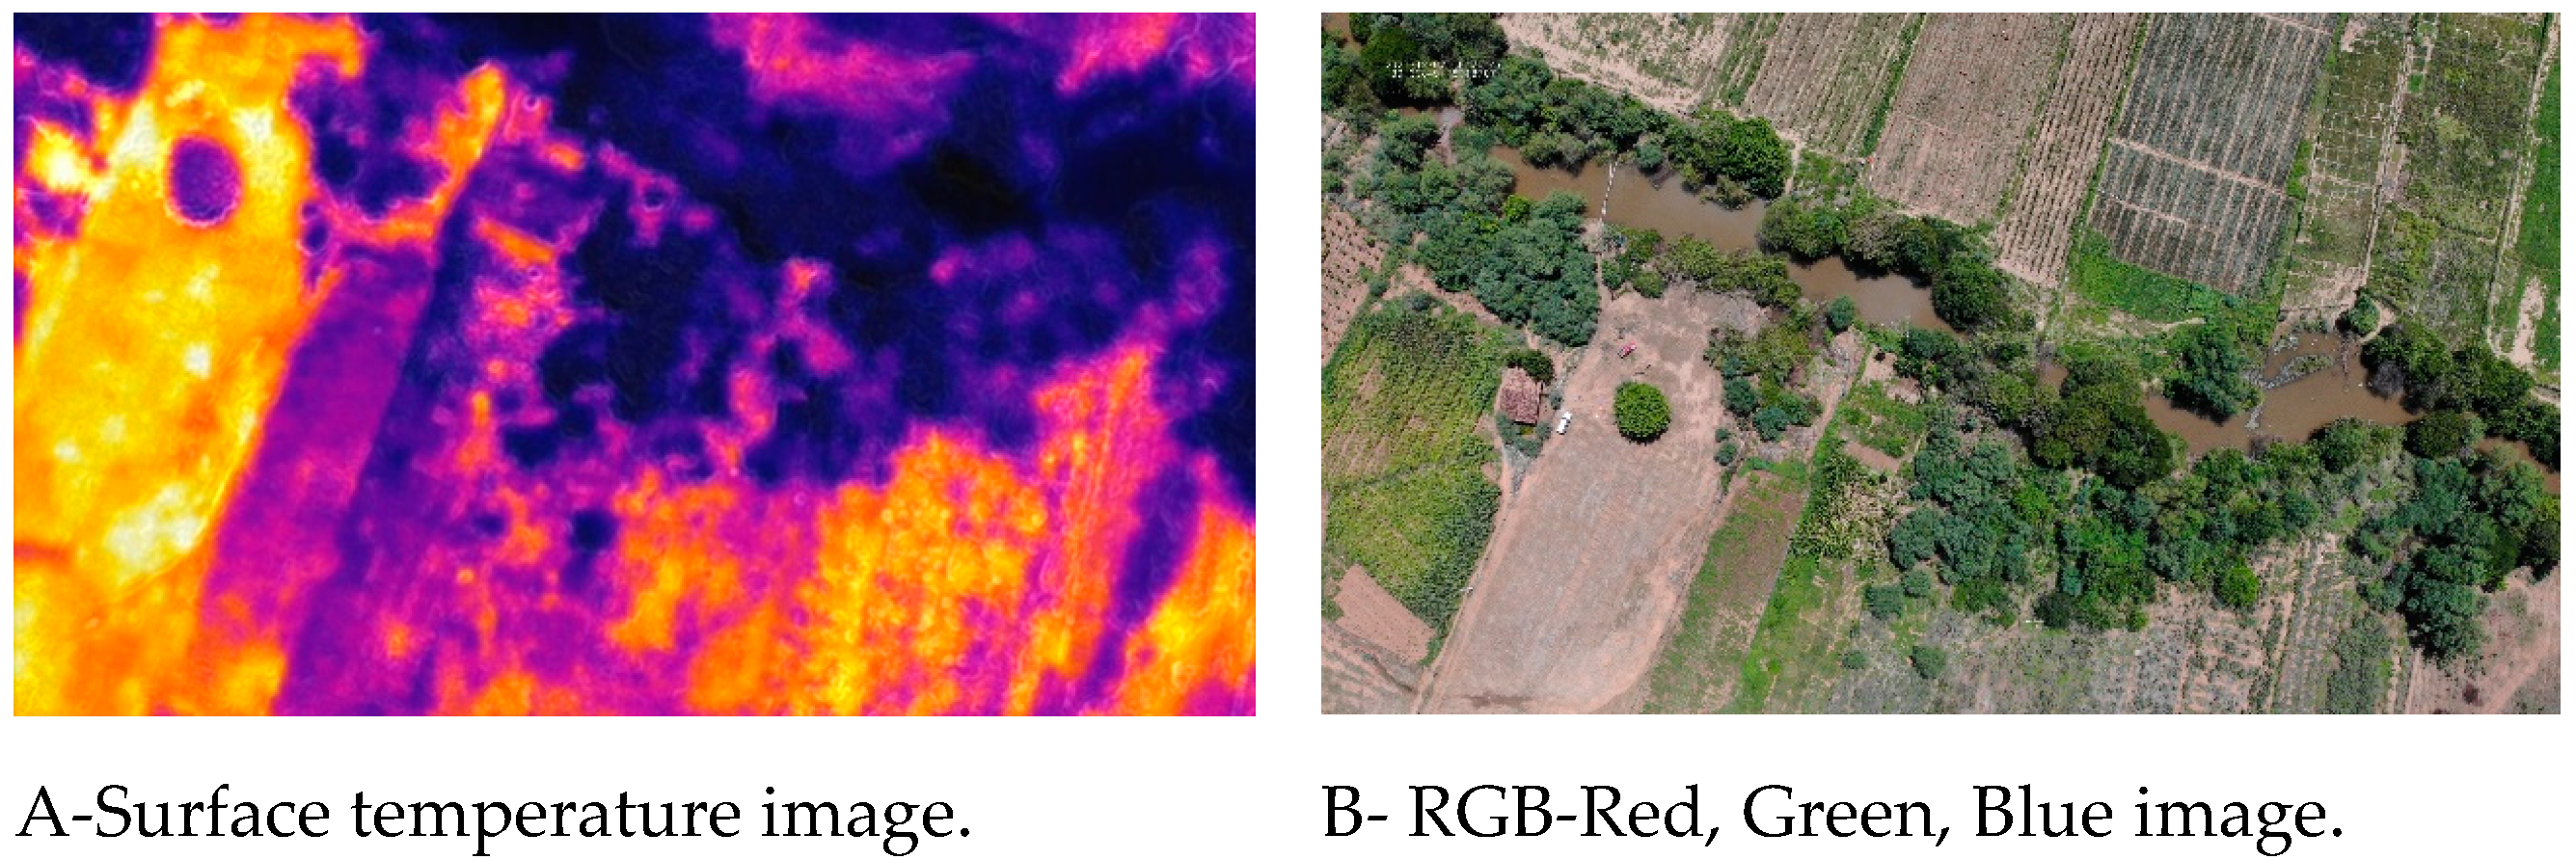
Figure 11.
SW- Soil Water to Terra Nova basin.
Disclaimer/Publisher’s Note: The statements, opinions and data contained in all publications are solely those of the individual author(s) and contributor(s) and not of MDPI and/or the editor(s). MDPI and/or the editor(s) disclaim responsibility for any injury to people or property resulting from any ideas, methods, instructions or products referred to in the content. |
© 2024 by the authors. Licensee MDPI, Basel, Switzerland. This article is an open access article distributed under the terms and conditions of the Creative Commons Attribution (CC BY) license (http://creativecommons.org/licenses/by/4.0/).
Copyright: This open access article is published under a Creative Commons CC BY 4.0 license, which permit the free download, distribution, and reuse, provided that the author and preprint are cited in any reuse.


