
Submitted:
03 February 2024
Posted:
20 February 2024
You are already at the latest version
Abstract
The main purpose of this article is to identify brain diseases such as Alzheimer's and Parkinson's in an intelligent way using Python software and processing the function of neurons in the neural network areas of the brain, which are classified into different components, and the data is based on the information obtained from FMRI images using algorithms artificial intelligence can intelligently diagnose the type of disease. Therefore, by using spatial clustering based on the deep learning method with noise algorithm (DBSCAN), fMRI brain image and fMRI brain surface complexity are classified, and then image preprocessing will be applied to fMRI images by using artificial intelligence neural networks (ANN) algorithm. became. Then, by using the ANN algorithm and Deep CNN topology of the brain neural network, the type of disease in the brain can be diagnosed by simulating the performance of an artificial neural network (ANN) in Python software. Deep machine learning-based methods, especially algorithms based on neural networks, have shown great success in medical image analysis for various tasks including brain tumor detection, segmentation, and classification, and Alzheimer's and epilepsy. In this research, we propose an integrated model based on a convolutional neural network for simultaneous recognition and classification of brain diseases for intelligent diagnosis of tumors and epilepsy. The average accuracy obtained from our proposed model is 97.89 percent accuracy and 91.66 percent specificity.
Keywords:
artificial intelligence
; functional neural connectivity
; functional magnetic resonance imaging (fMRI)
; deep learning
; neural network
; epilepsy
; parkinson
; seizures
1. Introduction
Due to the progress of brain diseases and brain fMRI images, which are very important to diagnose the type of disease such as epilepsy, autism and Parkinson’s in an intelligent way, which is very important for quick treatment of the disease. Therefore, we have presented a model that can be used to classify the damaged areas in the brain using applied magnetic resonance imaging based on deep learning methods. Therefore, the presented model will be used to classify the damaged areas in fMRI brain images using applied magnetic resonance imaging based on deep learning methods. The values obtained from the output images of the Python software, as well as the accuracy and accuracy of 98.30% and 97.53% in the intelligent diagnosis of the disease in different people, were measured and show the superiority of the ANN algorithm method over other methods and algorithms used it is in the fMRI images of the brain.
The structure of the human brain is very complex so inside the skull of the human brain, detecting the function of the neurons in the neural networks prevents early diagnosis and early treatment of diseases. Tumors can be of two types, malignant and benign. Benign tumors, while malignant tumors are formed as a cancerous mass that can lead to death if left untreated. X-ray, CTS, ultrasound and MRI, fMRI methods are used to collect information about brain tumors so that doctors can better understand the tissue characteristics of tumors and choose the best treatment method.
fMRI, MRI provides a better imaging mechanism and access to neural network function helps us to generate MRI sequences that display effective information of neuronal function. By using the diverse characteristics of brain tumors, MRI provides reliable information about different tumor tissues. With advances in medical imaging technologies, tumor segmentation methods ensure an automatic, repeatable, and accurate tumor segmentation algorithm that captures both intra- and intra-brain variability. There are several techniques to improve the accuracy and reliability of brain tumor segmentation in the SVM algorithm, which can be image processed with Python, software.
To extract the fMRI scanner images, image processing techniques, and meta-heuristic algorithms were first applied to the fMRI images with CT 120 PCA in the brain, which is considered a time series or series of images obtained using principal component analysis. which were processed using ANN. The data obtained from the fMRI images were analyzed with the help of simulation with Python software and using the ANN algorithm, and then with our proposed approach, using the algorithms used in artificial intelligence, according to the output of the images taken from Python, it is possible to accurately predict and diagnose the damaged area in the neural networks in the brain.
Functional connection refers to the temporal correlation between the interactions of neuronal units in the neural network. Methods for calculating the functional connection of the brain are generally divided into models based on data mining.
Historically, analysis of the human connectome using functional magnetic resonance imaging (fMRI) began in the mid-1990 and gained more attention to explore the neural fields of human cognition and neurological disorders. The brain connection patterns from fMRI data are classified as statistical dependencies (functional connectivity) or causal interactions (effective connection) among different neural units. Computational methods, especially those based on graph theory, have recently played an important role in understanding the architecture of brain connections (Finn, E. S., et al., 2015). The application of graph theory to human brain diagnosis behavior and the role of different neural networks in the human brain in different situations has been proposed.
So far, to detect structural connectivity based on the neural network, the following methods have been used; y vector publishing techniques, Magnetic Resonance Imaging (MRI), Convolutional neural network (CNN), and Functional magnetic resonance imaging (fMRI), see (Zuo, X.N, Xing, X.X. 2014). ANN and fMRI images have millisecond resolution, allowing researchers to track neural activity at average brain speeds. Another advantage of fMRI and ANN is their sensitivity to neurochemical electrochemical signals, allowing experiments on regional brain activity’s electrophysiological mechanisms.
In the present work using graph theory in the connectomes concept of the human brain, we introduce an algorithm run in Python software. The algorithm uses imaging data sets that contain information about the function of neurons in the neural networks of the brain that help diagnose the type of brain disease in epilepsy, Parkinson’s, and seizures (Douglas, P. K., et al., 2013). We first mention some significant related results in the literature, especially those on the modeling of the human brain (Díez-Girardi, M., et al., 2018). For the diagnosis of mild cognitive impairment due to Alzheimer’s disease, see the recommendations from National Institute on Aging Alzheimer’s Association workgroups on diagnostic guidelines for Alzheimer’s disease. Alzheimer’s Dement. (Algunaid, R. F., et al. 2018).
We study the human brain in terms of binding patterns, which provide essential information about the functionality and causal structure of the brain. In this model, the complex brain system as one of the functional features of some neural networks is that most neurons are not adjacent to each other. This fact reduces the function of neurons in the nervous system in the human brain. However, we can use a small number of neurons to reduce the complexity of the model.
This paper is organized as follows. Section 2 describes the application of graph-theoretical methods using fMRI data mining. For details on Data and code availability in Python see Appendix II. Section 3 and Section 4 contain the research methods and model for developing brain connectivity patterns using Python, software. Later in sections 5 and 6, we present a complex brain neuroscience network model. In Section 5, Section 6, and Section 7, we study graph theory related to the functional structure of network neuroscience. In Section 8, a theoretical approach to mathematical modeling of pairwise relationships between elements of a brain network is presented using Python software. In human neuroscience, graph theory is used to model brain functionality. However, most studies have focused on functional connectivity. Section 9, Section 10, and Section 11, present a discussion of the results. One of the characteristics of the human brain is that neural networks in the brain are not adjacent to each other. This fact decreases the efficiency of the model. However, we can use a small number of nodes and graphs, which decreases the complexity of the model. Finally, Section 12, is devoted to the conclusions and recommendations.
2. Materials and Methods
According to the goals and topics in this study, we have used the descriptive research method. Among these techniques, we focus on computational methods. To analyze the actual connectivity of the brain, we use methods such as Granger causality, causal modeling, and Bayesian networks, see (Y Zhang et al., 2015).
Indeed, advances in graph theory and network neuroscience allow us to study the structure or functionality of the nervous system and offer the opportunity to understand the details of this complex phenomenon better.
Use of a data mining database, the algorithm will analyze the brain in two steps:
A) The CNN algorithm in Python software is used to study the brain connectivity network and the state of the neural network variables (Section 7 and Section 9).
B) We process and analyze the simulated brain algorithm.
For identifying patterns of brain connections, we use the above two steps. Related scientific articles are extracted from a selection process that includes predetermined inclusion and exclusion criteria; see, for instance, (Moher. et al., 2010).
The required information is collected by field method (through software) and data mining. It will be tried to exploit the materials with an accurate assessment process through the software, using fMRI that focuses on graph-based methods.
Significant Steps of the Functional Connectivity Analysis
We explain the main steps in the following figures.
In part (A) of Figure 1, we illustrate the percolation of the brain into zones based on the anatomical atlas and the extraction of the Brain image from the disentangled time series of each zone. See Appendix II.
Part (B) shows the construction of correlation matrices.
Part (C) concerns thresholding and binarization of correlation matrices; the generation of binary adjacency matrices is visualized in (D).
Part (E) shows the efficient analysis of topology and microcircuit patterns (Effective Brain Connection Analysis).
3. The main Research Questions
In the present work, we answer the following main questions.
- How fMRI is used to model brain connectivity patterns?
- How can we classify the mapping of the human connectome using fMRI or MRI?
- Are fMRI-based approaches suitable for increasing resolution?
4. Hypothesis Research Methodology
Analysis of brain network connections using functional magnetic resonance imaging (fMRI) is beginning to receive increased attention for treating brain diseases and neurological disorders, leading to rapid advances in diagnosis, see [4].
The following methodology on hypothesis is developed in the present work;
In section (a) of Figure 2, the fMRI image examines the effect of data mining on the right hemisphere of the brain.
Part (B) of Figure 2 shows the impact of artificial intelligence on the early detection of brain damage in an MRI picture. The; blue and red colors in the figure indicate the healthy and injured parts of the hypothesis, respectively.
In section (C) of Figure 2, in the fMRI image, neural networks in the brain can be defined based on structural connectivity. Neurons are classified by neural networks of cells and dendrites and the connections between the gaps.
In section (D), in the fMRI image, there is a set of neural areas to identify neurons in the brain interconnected in an extensive neural network (showing neural networks in blue and green).
5. Search Strategy
Computational methods, particularly graph theory, have played a key role in understanding the type of network and connections between brains (Stringer, C., Pachitariu, M., 2019).
In general, the connection patterns of fMRI data are classified as functional connections or causal interactions (effective connections) between different neuronal units (Finn, E. S., et al., 2015).
Using; data mining, we can categorize the fMRI data. Using; Python software, the obtained data can be simulated, and then, based on that, the disease can be diagnosed.
6. Method-Based Modeling of the Human Brain Using MATLAB
The human brain is a complex system whose topological organization can be represented using connectomes (Algunaid, R. F., et al., 2018).
Recent studies have shown that human connectomes are constructed and characterized in a model using various neuroimaging technologies by employing sophisticated analytical strategies such as graph theory (Bassett, D. S., et al., 2006).
In the present work, using Python software, neural network connection patterns are simulated to observe the activities of the brain neurons. This model will be used to analyze neuroimaging data, using data mining.
In addition, the display properties, such as the color and the size of the neural network elements or the layout of the figure, can be adjusted in a comprehensive and easy-to-use settings panel.
Moreover, Brain Net Viewer in MRI and fMRI draws the brain surface, nodes, and edges in a sequence and displays the brain networks in multiple views, depending on the user’s needs (Fleischer, V., et al., 2017).
Artificial neural networks (ANN)/ Convolutional neural network (CNN) instruments capture electrical activity from the entire brain volume at a typical rate of 1,000 times per second, resulting in approximately 100 MB of data per minute for more details, see Appendix I or Procedure 1 in GitHub, reference [4] and Figure 3.
7. Human Connectome fMRI Analysis Algorithms
In algorithm 1, the associated fMRI analyses will help us identify and characterize functionally distinct nodes in the human brain artificial neural network (ANN) algorithm applied on fMRI.
Using the ANN algorithm, we call the data obtained in fMRI and observe the function between neurons in neural networks using CNN.
Moreover, consider the distance function between the neurons in fMRI denoted here by |V | using the ANN algorithm, we obtain the minimum distance in the neural network. Recall that we consider only one neighbor of each node. Also, we get only one edge distance between the nodes. Now we can analyze the fMRI images by ANN algorithm. In turn, this fMRI analysis will guide us to validate and interpret the results of connectivity analyses obtained by fMRI diffusion imaging.
We show here, there are several ways to identify the different subunits of neural networks of the brain, using Python software. More intuitively, we analyze the simulated fMRI data (i.e., MOP method) and identify the necessary information between the neurons in the brain.
We will see in the third algorithm that the usage of Python software permits to classification and process of images and data with higher accuracy than the one obtained by the graph theory.
| Algorithm 1: EEG data mining optimization |
|
Input: A minimum imaging data CNN. Output: Optimization of the distance between neuro-images using graph theory. 1: compute = min data (applying a toolbox of Python for optimization of CNN data to compute) 2: M, do 2: Compute 3: end for 4: for all vertex vi 2 M, do 5: Compute the radius 6: end for 7: for all edge: 2 M, do 8: Compute the inverse 9: end for a |
2. Artificial Neural Network (ANN) algorithms with PYTHON
In Algorithm 2, we compute the minimum distance between neurons on the neural network using a Python function (distance per neuron). Moreover, estimate the distances of the neural network on ANN.
Therefore, the distance of each neuron in the neural network on the brain surface can be calculated using the ANN algorithm (Algorithm 2), and then, using Python software, the resulting data can simulate and analyze the fMRI data (Fleischer, V et al., 2017).
In Algorithm 2, we calculate the distance of neurons from each other in the fMRI of the brain surface. For a better approximation, we assume that.
In addition, it is necessary to consider each neuron in the right and left hypothesis the optimal distance between each neuron in the brain neural network is denoted by. Recall that in a normal brain, neurons are connected.
| Algorithm 2: Box Approximation for (ANN) |
|
Input: Tolerances distance per neuron; D>0.5 Output: Lists L, and B of lower and upper bounds 1. procedure ANN (ε, τ, z, Z) 2. Initialize L = {z}, U = {Z}, done = false 3. done = true 4. Loop= L, 5. for l ∈ Loop, do 6. for 7. Solve (ANN (l, u)) with the optimal solution 8. and set 9. if d > 0.5 and then 10. Define step length, else 11. L = loop 12. U = loop 13. end |
Algorithm 2, is used for computing the distance between neurons. See Figure 4 and Appendix I or Procedure 2 on GitHub for more details.
| Algorithm 3: Support Vector Machine (SVM) |
| In machine learning, support vector machines (SVMs, also support-vector networks) are supervised learning models with associated learning algorithms that analyze data for classification and regression analysis. Input: c = fitcsvm (data3, the class, kernel Function),‘rbf’ Output: d =0.02; [x1Grid, x2Grid] = mesh grid(min(data3(:1)): d:max(data3(:1)), ... min(data3(,2)): d:max(data3(:2))); xGrid = [x1Grid (:), x2Grid (:)]; [~, scores] = predict (cl, xGrid); end |
8. Brain Imaging Neural Network fMRI Analysis
The fMRI data is a set of information about the activities of neural networks that are processed in the membrane of the brain surface. In general, fMRI data are used to study the functional connectivity of neural imaging between brain regions (Dixit, S., and Mosier, K. 2004).
Based on neural network analysis, when neurons transmit information to neural networks in the brain, it is possible to identify the timing of neuron movement in the brain surface membrane (Vanwalleghem, C. et al., 2020).
Different time modes of neural networks can be analyzed using time series analysis and Python software.
Then, using the obtained time series analysis and the model simulated by Python software, neurological disorders in the brain can be identified. See Figure 6.
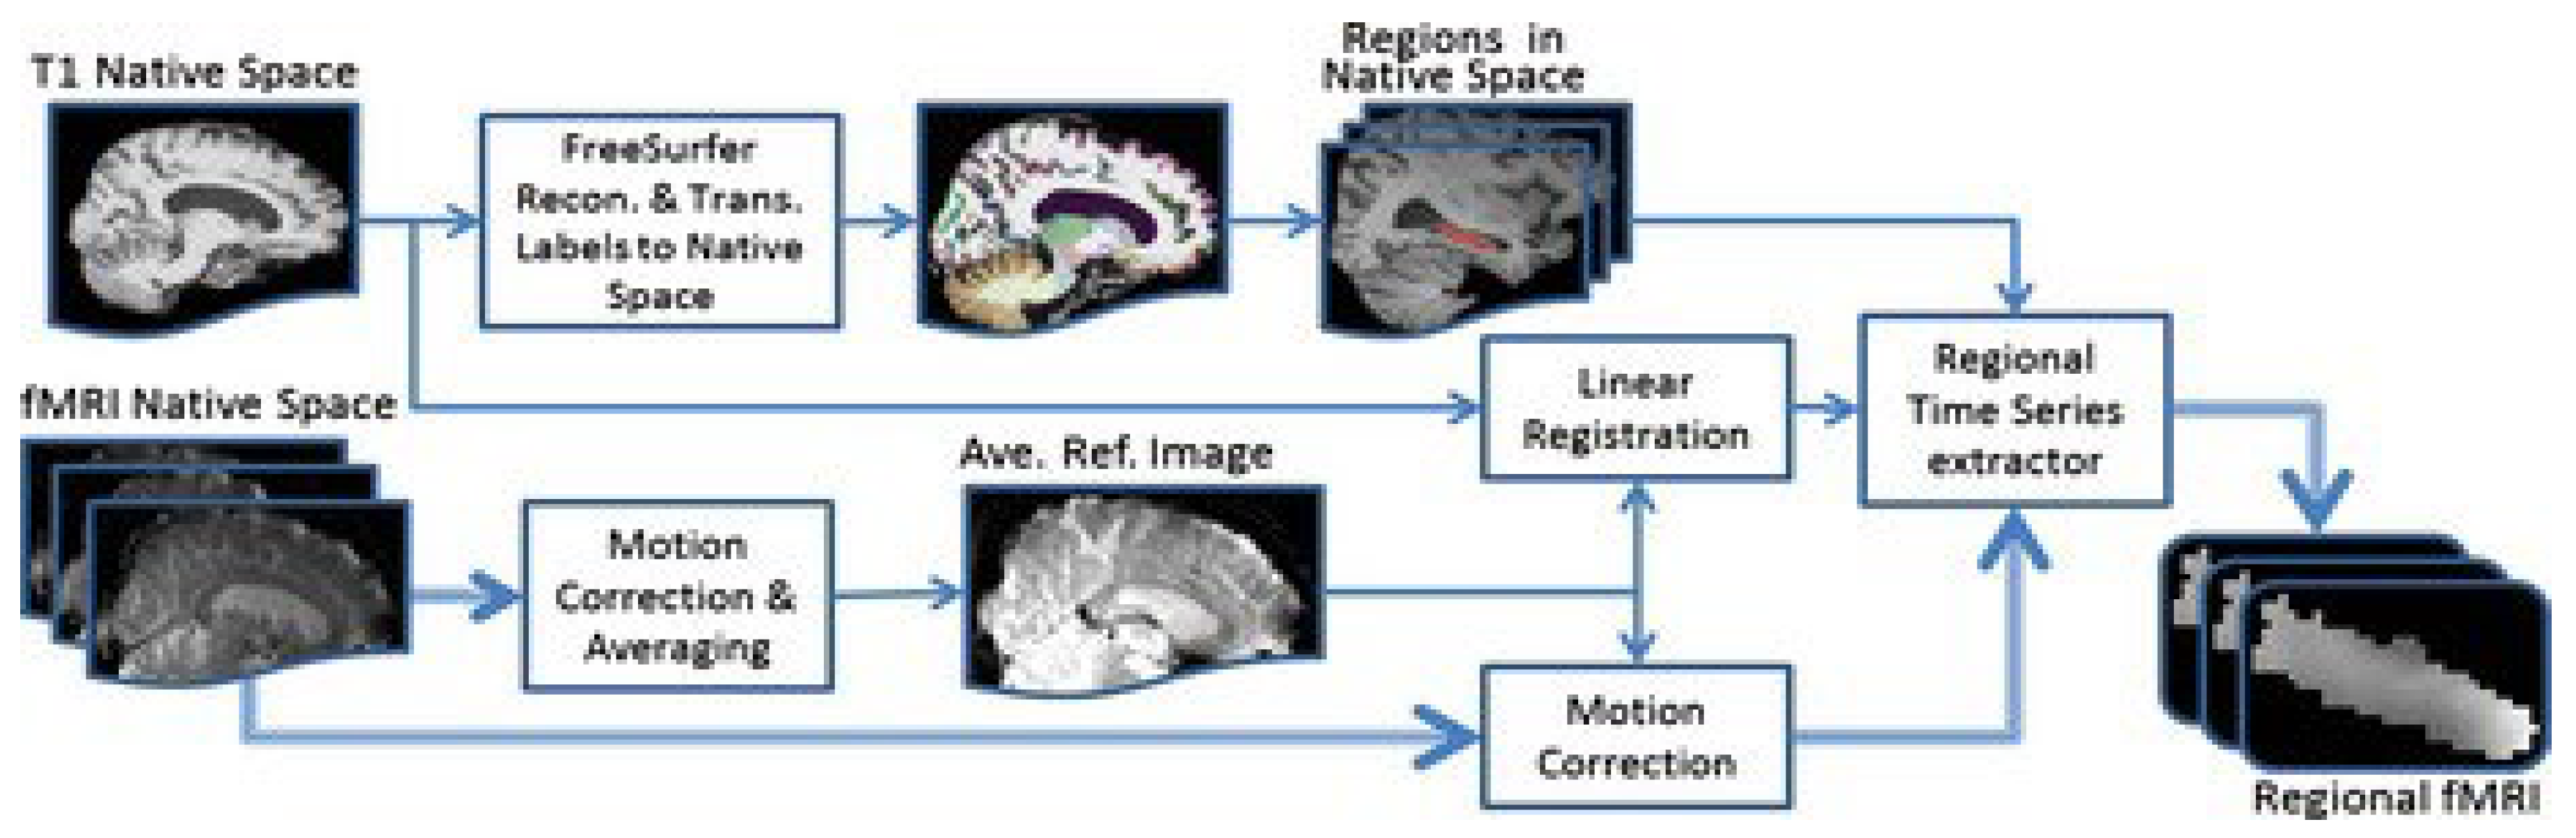
9. Computing the fMRI data using Python
Figure 8 shows the flow diagram of the processes in the spatial method of image processing fMRI image segmentation and packaging are analyzed by PYTHON. Then results of image segmentation are analyzed using artificial intelligence and deep learning-based techniques. We will use two intelligent diagnosis and disease classification algorithms, CNN, ANN, and linear image registration tool. The analysis of fMRI images shows that the results of the algorithms used to process the performance of neurons in artificial intelligence-based neural networks are much different from other algorithms used in this field.
Finally, the images obtained by the brain surface scanner show that the nerve fibers in the brain regularly process the information received from the brain neurons, which appear in red on the image. See Appendix I, or Procedure 3 in GitHub and Figure 7 and Figure 8. The figure shows an activated image of the function of neurons in brain neural networks in brain fMRI.
Figure 7.
Here, we can see the effectiveness of the MATLAB and PYTHON.
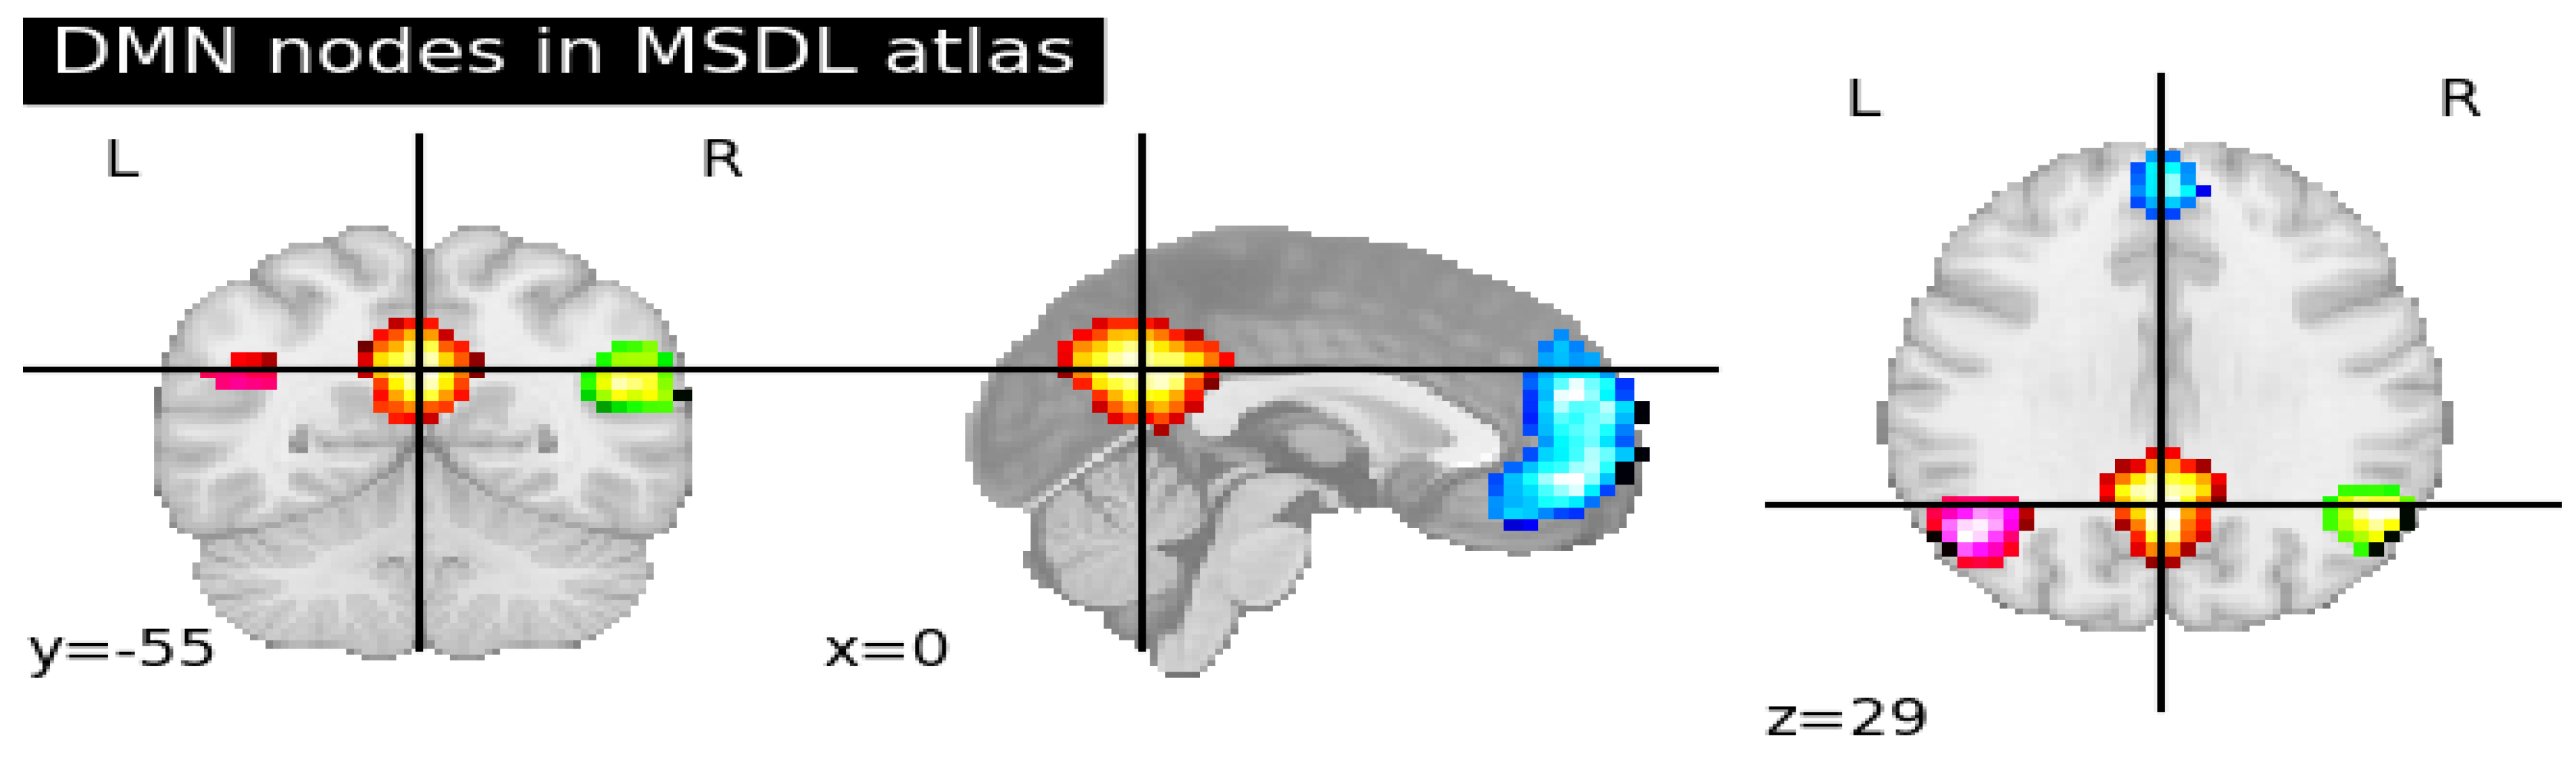
Figure 8.
Flowchart of fMRI data analysis in image processing space using Python software.
10. Experiment
It has been tested with this proposed model
Different models of image processing such as CNN, ANN, RNN and accuracy for this model is 90.30%, 96.66%, 94.12%, ANN was the best model among all Table 1.
| TL Model | Test Accuracy | Test Loss | F1 Score |
|---|---|---|---|
| CNN | 94.12% | 0.23% | 93 |
| ANN | 96.66% | 0.18% | 96 |
| RNN | 90.30% | 0.27% | 89 |
All the articles reviewed in this research have used binary classification Table 2.
| Paper | Classifier |
FC Modelling |
Method | number of samples | % Accuracy |
|---|---|---|---|---|---|
| (Basti Bloom et al. 2006) | SVM | Static FC | normal distribution | 70 | 70.9 |
| (Farsten 2009) | K-MEANS | Dynamic FC | Covariance matrix | 105 | 76.4 |
| (Douglas, P. K., et al., 2013). | HCA | Dynamic FC | Linear regression | 173 | 80.1 |
| (Sporence Craddock et al., 2013). | SVM | Static FC | Hierarchical Cluster Analysis (HCA) | 249 | 86.9 |
| Zheng et al. (2015) | SVM | Static FC | The correlation matrix | 560 | 85.4 |
| (Algunaid, R. F., et al., 2018). | Kernel PCA | Static FC | Kernel PCA | 897 | 83.4 |
| (Baste Blooms et al., 2019) | CNN | Dynamic FC | Wavelet Coherence | 1003 | 88.1 |
| (Jung and Haier 2022) | CNN | Static FC | Locally-Linear Embedding (LLE) | 1000 | 86.12 |
| (Baltimore and Sporance Craddock et al., 2023) | CNN | Dynamic FC | Convolutional neural network (CNN) | 890 | 89.66 |
| (Suggested method) | ANN | Dynamic FC | DBSCANArtificial neural network (ANN) | 1500 | 91.8 |
11. Results
In this paper functional connection patterns in the human brain are used with Python software for more lucid functional magnetic resonance imaging (fMRI). More intuitively, the fMRI of different regions of the brain surface reconstructed by the Python program is more clearly presented. See Figure 9. In addition, Python software is applied to obtain the topography of brain activity.
Furthermore, using graph theory in the simulated CNN algorithm in Python, the computational methods are applied to discover the functional relationship of neurons in the brain network. These results may better lead to the discovery of brain diseases.
12. Discussion
Brain regions that show relevant information for distinguishing patients in neurotic and parkinsonian states from healthy individuals. The performance of these areas is classified by the artificial intelligence algorithm and evaluated and identified by the ANN algorithm and CNN algorithm. See Figure 10.
13. Conclusions
The main objective of this paper is to classify tumor levels using fMRI images of the brain, which is initially used through a DBSCAN to segment the brain tumor image. Then, the ANN algorithm based on the proposed deep learning method is used for feature extraction. Then it can be used to classify brain tumors and identify damaged areas in the brain in an intelligent way using Python software for image processing.
First of all, we review the computational methods in brain neural network diseases in the literature. Then we use fMRI simulation in Python to obtain clearer images. In general, for early diagnosis of brain diseases and detailed analysis of neural networks and active neurons in the cerebral cortex, the images obtained from brain neural network topology based on artificial neural network (ANN) can be used by using soft Python software.
This process leads to an intelligent diagnosis of cognitive function diseases, behavioral variability, and neurological disorders such as epilepsy, Alzheimer’s disease, and autism.
Finally, in this research, the proposed model is a new method of artificial neural networks (ANN) to classify images extracted from fMRI in an intelligent way to identify brain tumors and Alzheimer’s disease. In this new method, we have succeeded in intelligently classifying brain tumors based on a highly accurate deep-learning method using artificial intelligence.
All details and codes of the algorithms are given in an attached file. It can also be seen in the GitHub appendix with the reference file;
Data Sets for Machine Learning
All MRI features were obtained from the baseline visit of the patients. For each subject, the measures extracted from DTI (i.e., mean FA and MD values from 10 selected brain areas) and rs-fMRI (graph metrics from 116 AAL areas) were combined in a vector of parameters (i.e., a record). The records of all subjects were then collected to create the following data sets (see also Table 1):
- DTI data set (unimodal data set): This contained only the DTI-derived metrics (20 features per subject). Therefore, it was considered a unimodal data set.
- GT data set (unimodal data set): This contains the 698 graph theoretical metrics per subject, derived from rs-fMRI images. This was also considered a unimodal data set.
- DTI + GT data set (multimodal data set): This was obtained by unifying (1) and (2) into a single data set, which resulted in 718 features per subject.
Each data set was screened to remove outliers by deleting those records that contained more than 30% of features laying three standard deviations (SD) away from the sample’s mean. The threshold of 3 SD was chosen as a good value to remove the spurious feature values, which definitively fell outside the 99.7% of their distributions, from the database (Rousseeuw and Hubert, 2011). Different thresholding percentages on the subjects’ features were tested, varying between 10 and 80%, and the 30% threshold resulted in the best compromise between data cleaning and data preservation. Moreover, for each data set, data that survived the outlier-removal procedure were standardized (i.e., z-score normalized) before beginning the following steps of the analysis. To check whether multimodal features were superior to unimodal ones in separating the two patients’ groups, each ML algorithm was run separately on three distinct data sets: DTI data set (unimodal), GT fMRI data set (unimodal), and DTI + fMRI GT data set (multimodal).
References
- Abós, A., Baggio, H. C., Segura, B., García-Díaz, A. I., Compta, Y., Marti, M. J., et al. (2017). Discriminating cognitive status in Parkinson’s disease through functional connectomes and machine learning. Sic; Rep. 7:45347. [CrossRef]
- 3 - Algunaid, R. F., Alumnae, A. H., Rushdie, M. A., and Yassin, I. A. (2018).
- The diagnosis of mild cognitive impairment due to Alzheimer’s disease: Recommendations from the National Institute on Aging Alzheimer’s Association workgroups on diagnostic guidelines for Alzheimer’s disease. Alzheimer’s Dement. 7, 270–279. [CrossRef]
- Bassett, D. S., and Bullmore. E. D. The neuroscientist, (2006). [CrossRef]
- Díez-cirarda, M., Strafella, A. P., Kim, J., Peña, J., and Ojeda, N. (2018). Dynamic functional connectivity in Parkinson’s, disease patients with mild cognitive impairment and normal cognition. Neuroimaging Clin. 17, 847–855. [CrossRef]
- Dixit, S., and Mosier, K. (2004). Analysis of cortical connectivity using Hopfield neural network. Neurocomputing 58, 1163–1170. [CrossRef]
- Dong, L., Wang, P., Peng, R., Jiang, S., Klugah-Brown, B., Luo, C., et al. (2016). Altered basal ganglia-cortical functional connections in frontal lobe epilepsy: a resting-state fMRI study. Epilepsy; Res. 128, 12–20. [CrossRef]
- Douglas, P. K., Lau, E., Anderson, A., Head, A., Kerr, W., Wollner, M., et al. (2013). Single-trial decoding of belief decision-making from EEG and fMRI data using independent components features. Front. Hum. Neurosis. 7:392. [CrossRef]
- Ecker, C., Spooren, W., and Murphy, D. G. M. (2013). Translational approaches to the biology of Autism: false dawn or a new era. Mol. Psychiatry 18, 435–442. [CrossRef]
- Fleischer, V., Radetz, A., Ciolac, D., Muthuraman, M., Gonzalez-Escamilla, G., Zip, F., et al. (2017). Graph theoretical framework of brain networks in multiple sclerosis: a review of concepts. Neuroscience; 403, 35–53. [CrossRef]
- Finn, E. S., Shen, X., Scheinost, D., Rosenberg, M. D., Huang, J., Chun, M. M., et al. (2015). Functional connectome fingerprinting: identifying individuals using patterns of brain connectivity. Nat. Neurosis; 18, 1664–1671. [CrossRef]
- Gautama, T. and Van Hulle, M.M. (2004), Optimal Spatial Regularization of Autocorrelation Estimates in fMRI Analysis, Neuroimage, 23(3):1203-16. [CrossRef]
- Jung, R. E, Haier, R. J, Behavioral and Brain Sciences, Volume 30, Issue 2, April 2007, pp. 135 - 154. [CrossRef]
- Hanif, Md Abu, et al. “Role of CBIR In a Different fields-An Empirical Review.” 2022 4th International Conférences on Artificiel Intelligence and Speech Technologie (AIST). IEEE, 2022. [CrossRef]
- Philippi, M., van den Heuvel, M. P., Fornito, A., He, Y., Hulshof Pol, H. E., Agosto, F., et al. (2013). Assessment of system dysfunction in the brain through MRI-based. Connectomes. Lancet Neurol. 12, 1189–1199. [CrossRef]
- Stringer, C., Pachitariu, M., 2019. Computational processing of neural recordings from calcium imaging data. Cur. Open. Neurobiology; 55, 22–31. [CrossRef]
- Vanwalleghem, C.; Constantin, L.; Scott, E.K. BMC biology, (2020). Calcium; imaging and the curse of negativity, bioRxiv. [CrossRef]
- Zuo, X. N., and Xing, X. X. (2014). Test-retest reliabilities of resting-state FMRI measurements in human brain functional connectomes: a systems neuroscience perspective. Neurosis. Biobehav. Rev. 45C, 100–118. [CrossRef]
- Liu, Zihao, et al. “Commodity Image Retrieval Method Based on CNN and Score Fusion.” 2021 International Conference on Culture-oriented Science & Technology (ICCST). IEEE, 2021. [CrossRef]
- Selvi RT, Muthulakshmi I (2020) Modelling the map reduce based optimal gradient boosted tree classification algorithm for diabetes mellitus diagnosis system. [CrossRef]
- Likhitha, Tata Lakshmi Durga, et al. “A Detailed Review on CBIR and Its Importance in Current Era.” 2021 International conférence on Data Science and Its Applications (ICoDSA). IEEE, 2021. [CrossRef]
- Kannai, A., and Ravikumar Lanke. “Image Retrieval based on Deep Learning-Convolutional Neural Networks.” 2022 International Interdisciplinaire Humanitarian conférence for Sustainability (IIHC). IEEE, 2022. [CrossRef]
- Kannagi, A., and Ravi Kumar Lanke. “Image Retrieval based on Deep Learning-Convolutional Neural Networks.” 2022 International Interdisciplinary Humanitarisa conférence for Sustainability (IIHC). IEEE, 2022. [CrossRef]
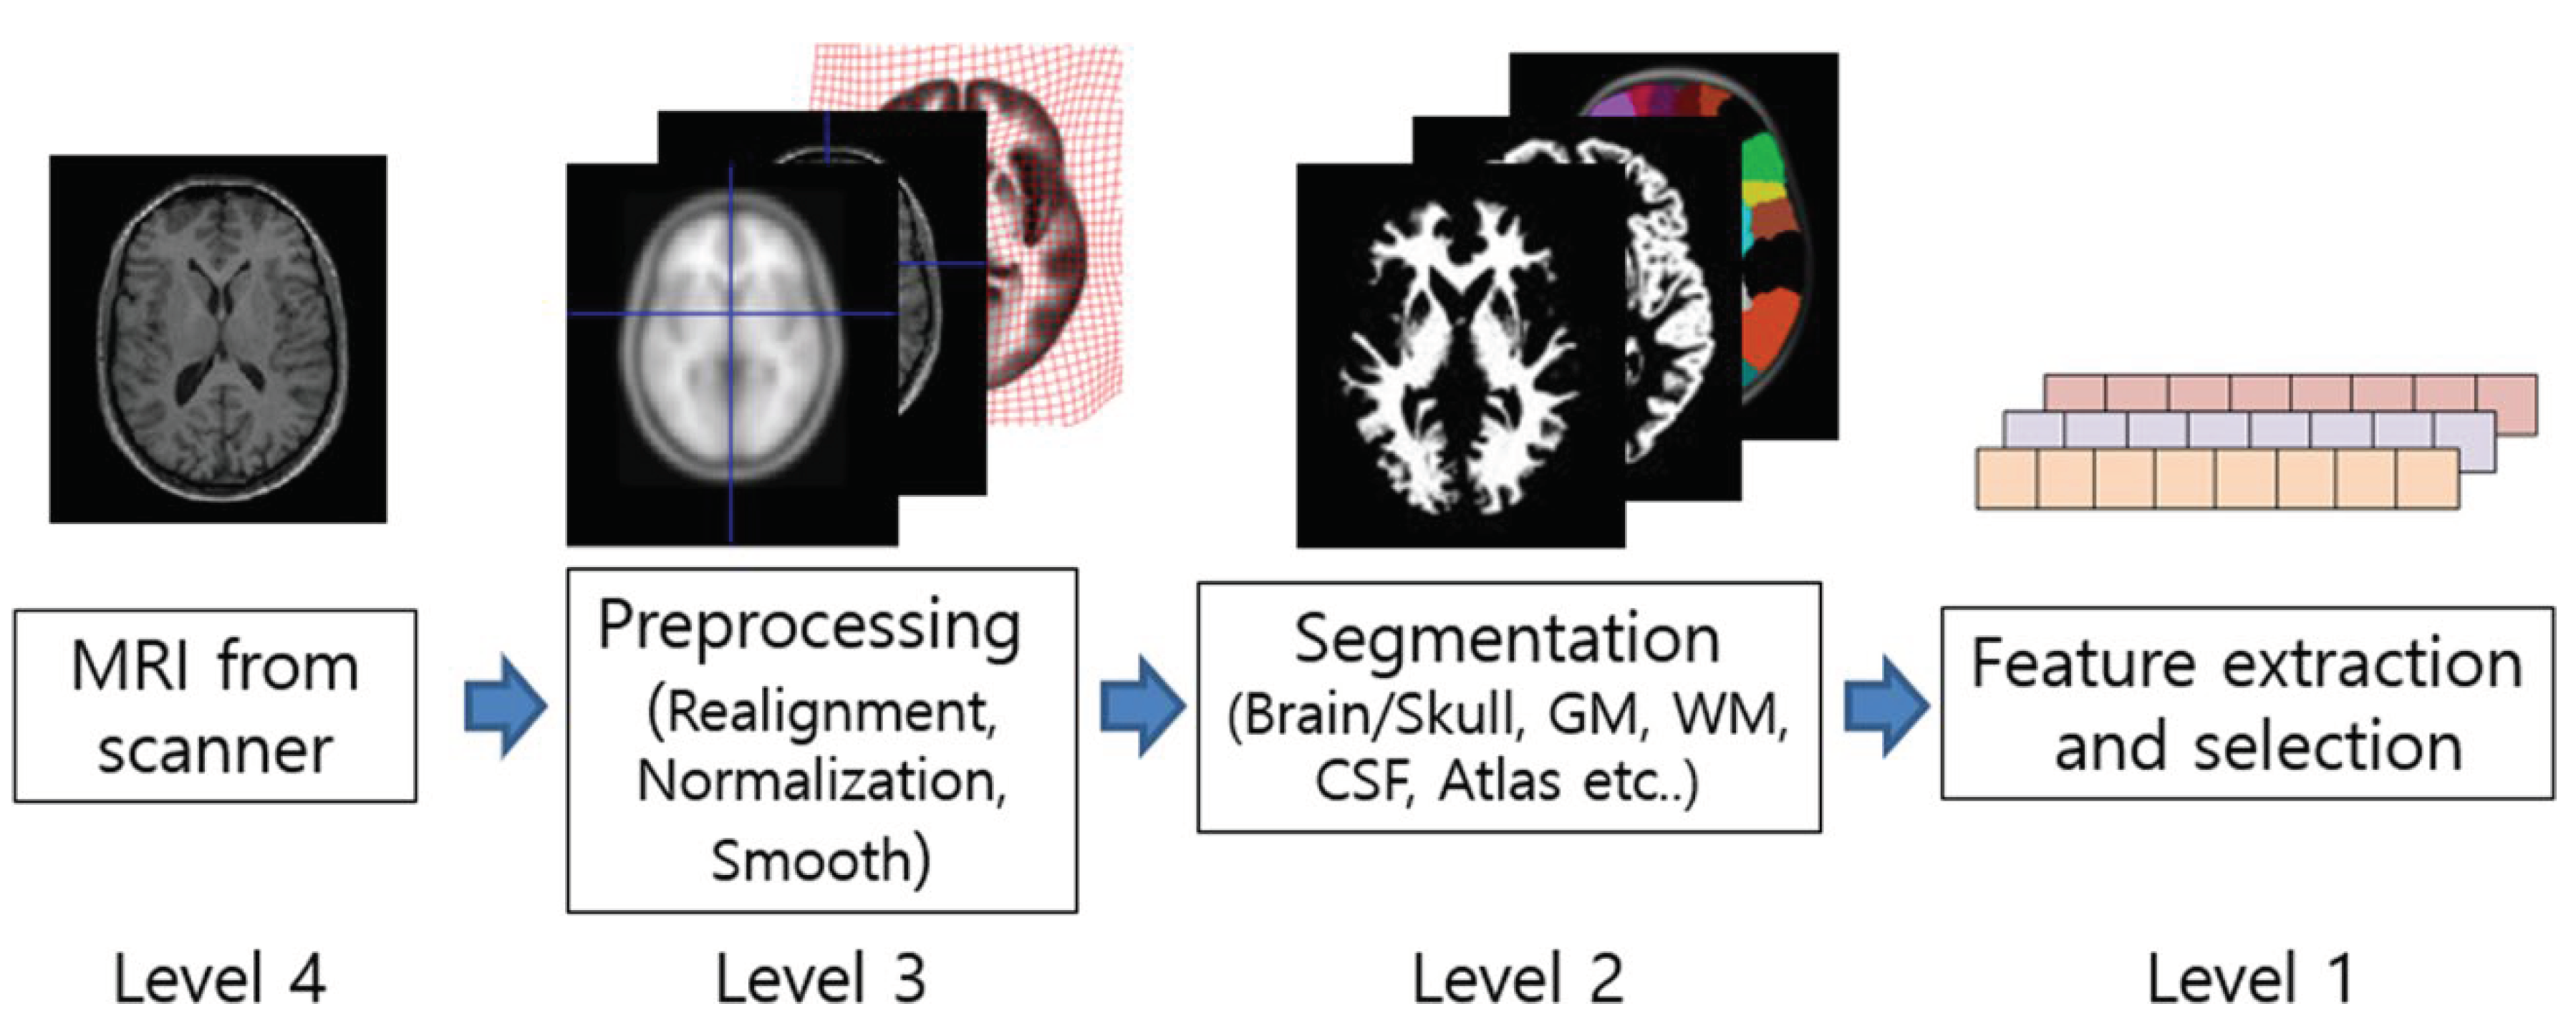
Figure 1.
Diagnosis of Alzheimer’s disease using an algorithm based on artificial intelligence.
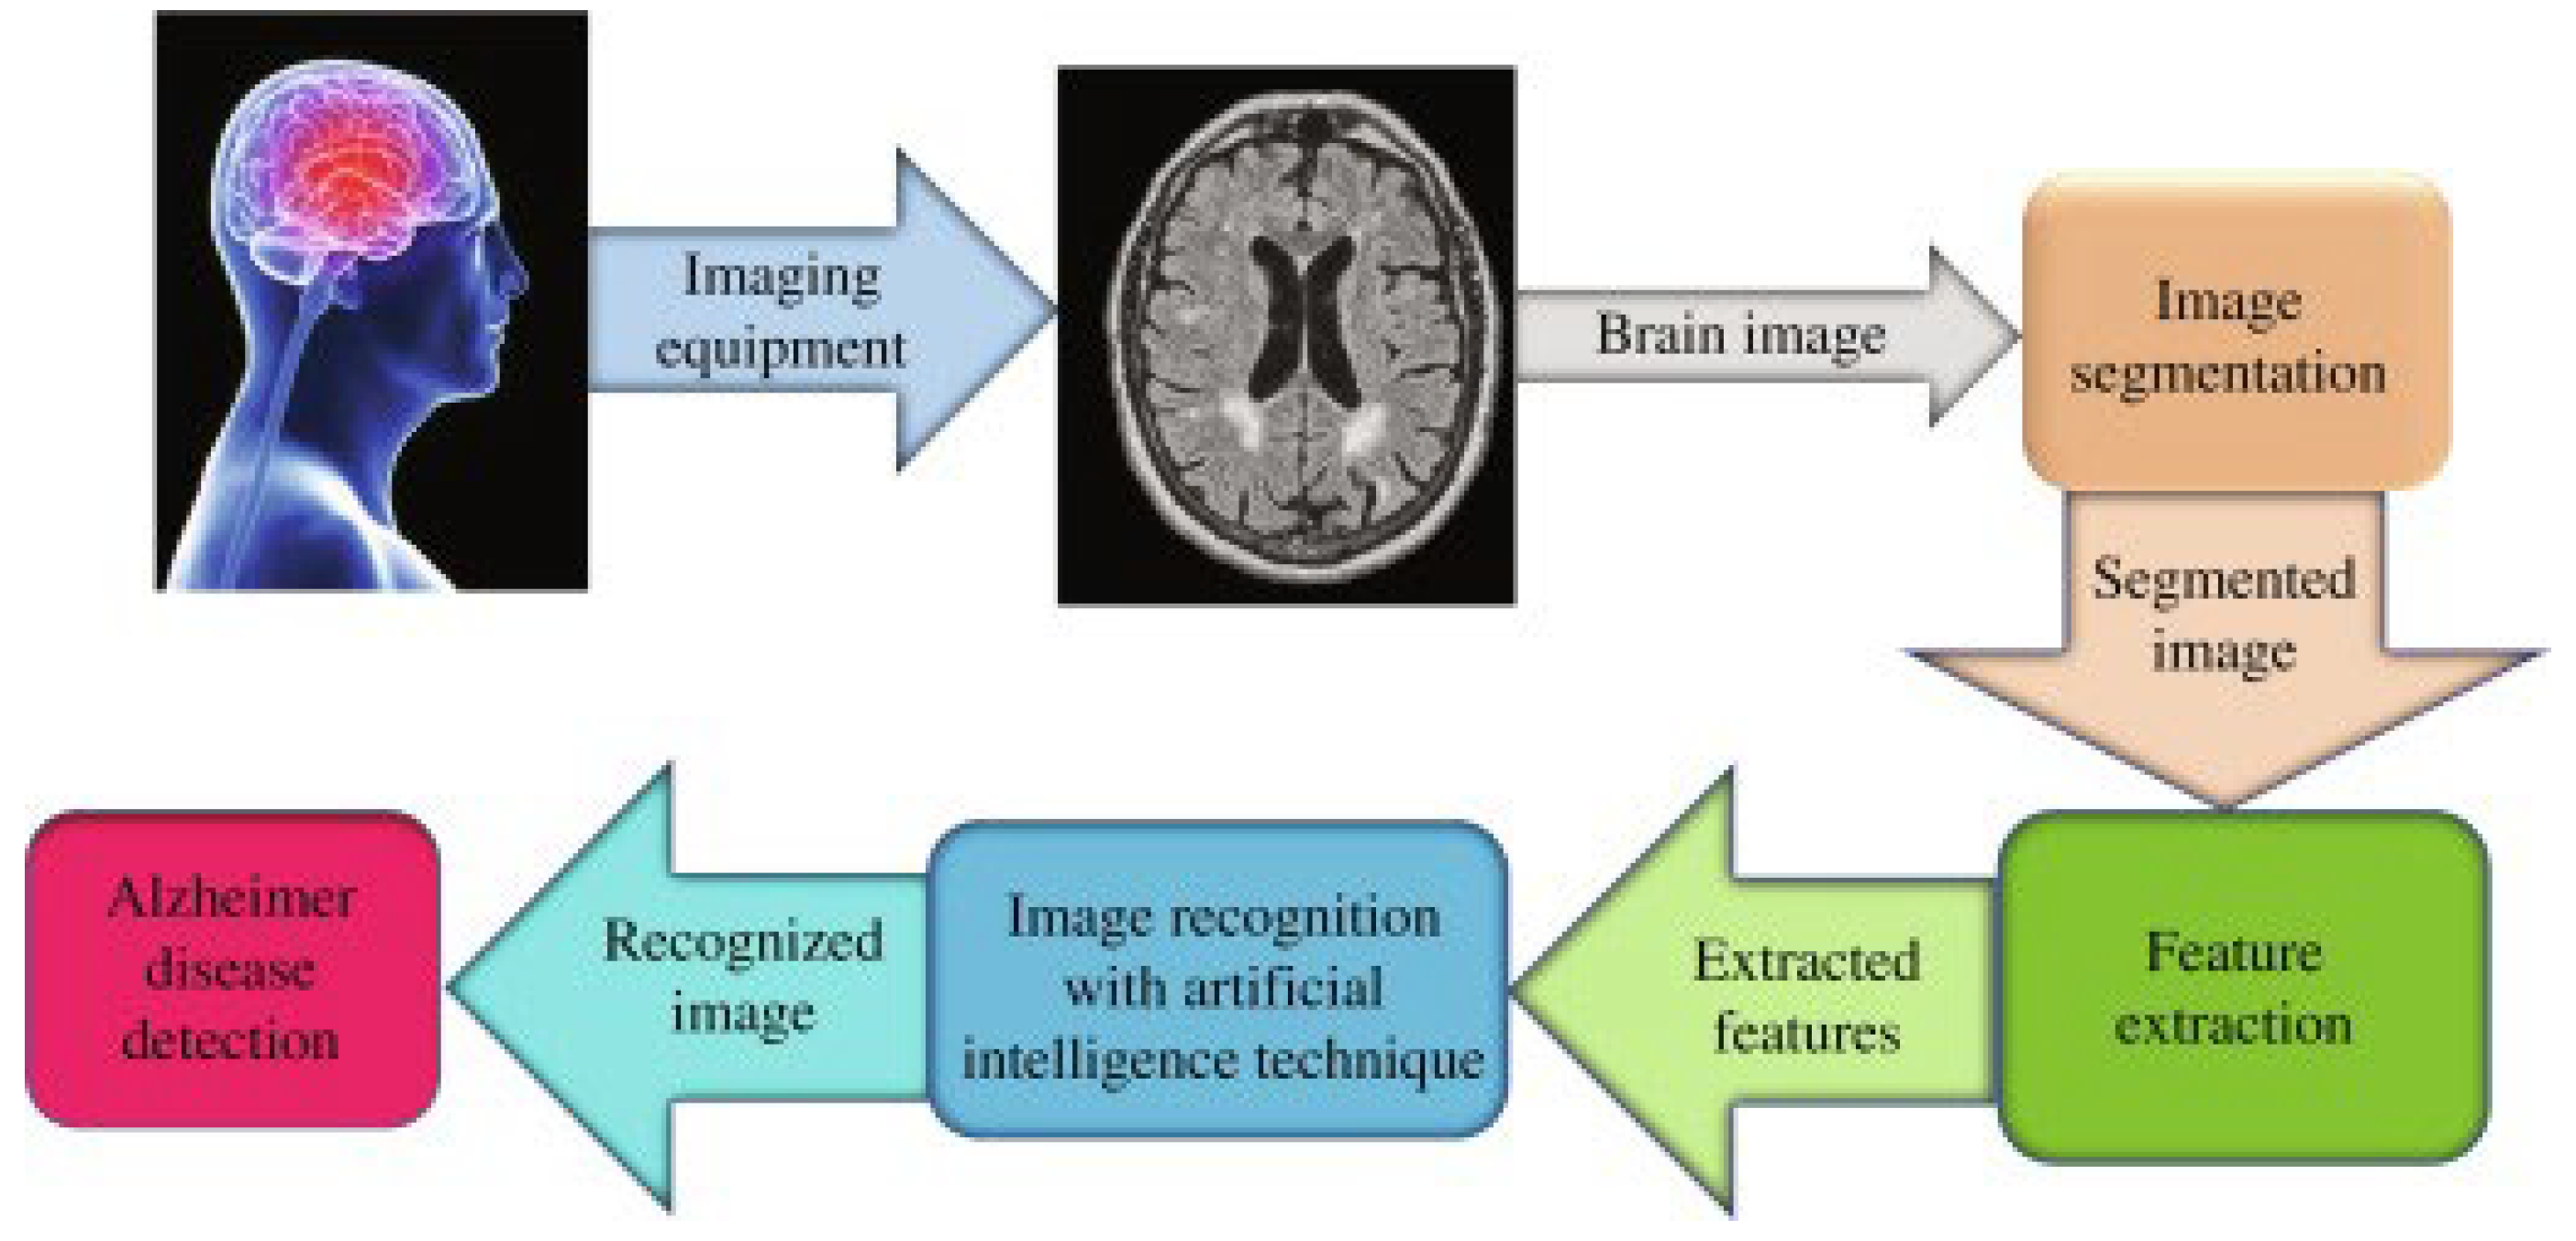
Figure 2.
In the above MRI pictures (A and B) and fMRI pictures (C and D), the brain’s four neural network processing hypotheses are predominant.
Figure 2.
In the above MRI pictures (A and B) and fMRI pictures (C and D), the brain’s four neural network processing hypotheses are predominant.
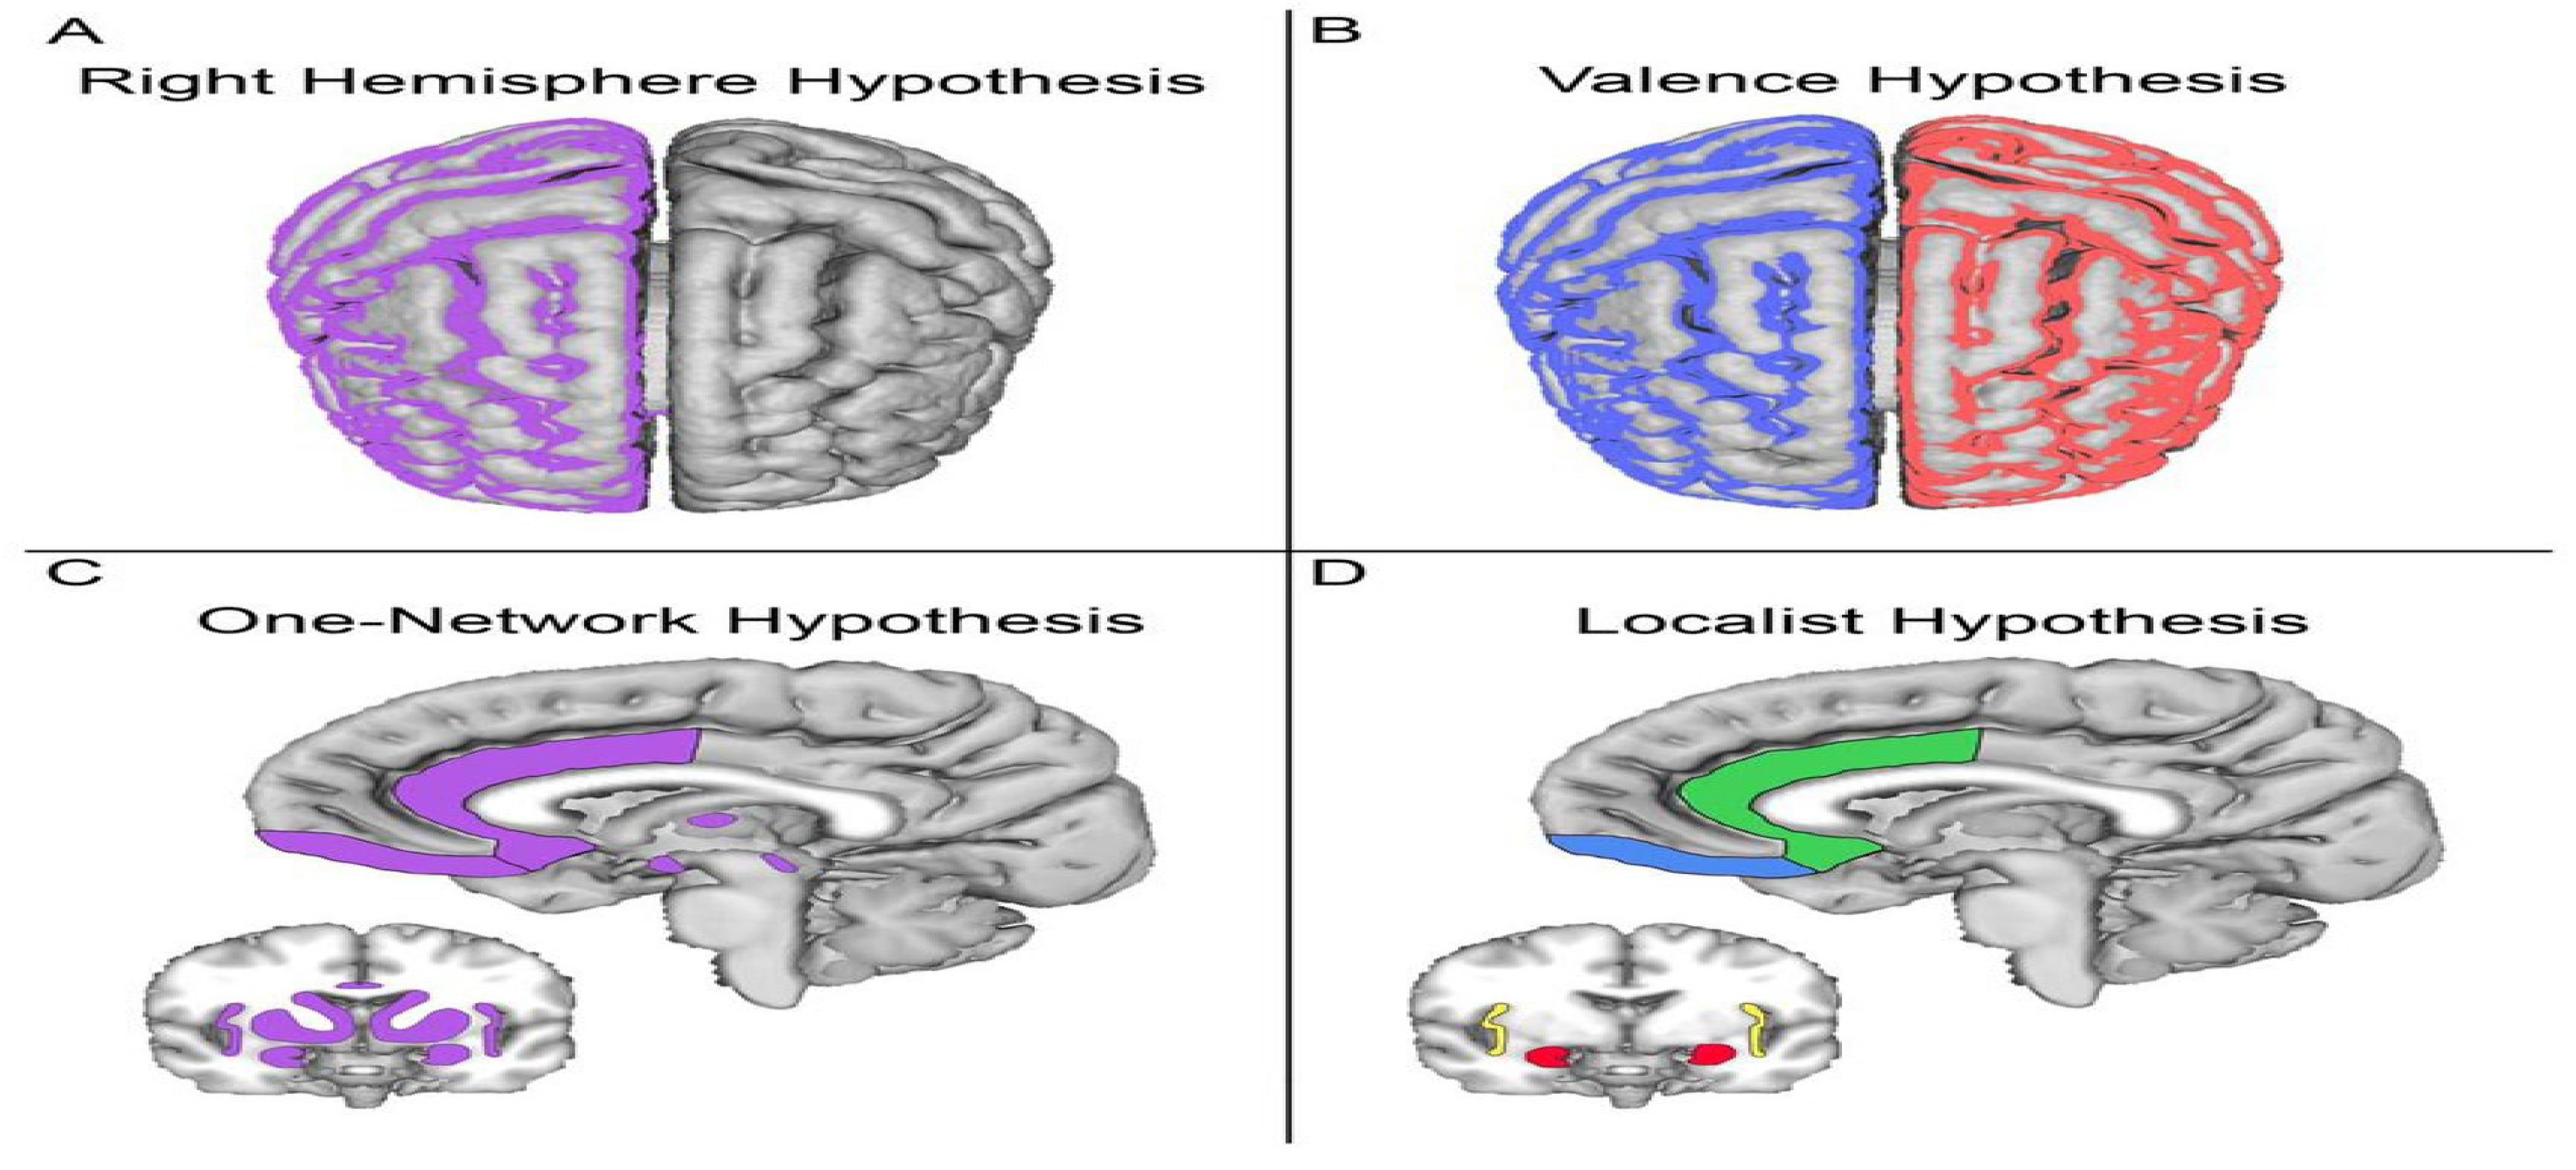
Figure 3.
Figure 3 Classification of fMRI images based on deep machine learning methods, which can be divided into three main categories: Supervised learning, unsupervised learning and deep learning, Image data is extracted by Python software for image processing.
Figure 3.
Figure 3 Classification of fMRI images based on deep machine learning methods, which can be divided into three main categories: Supervised learning, unsupervised learning and deep learning, Image data is extracted by Python software for image processing.
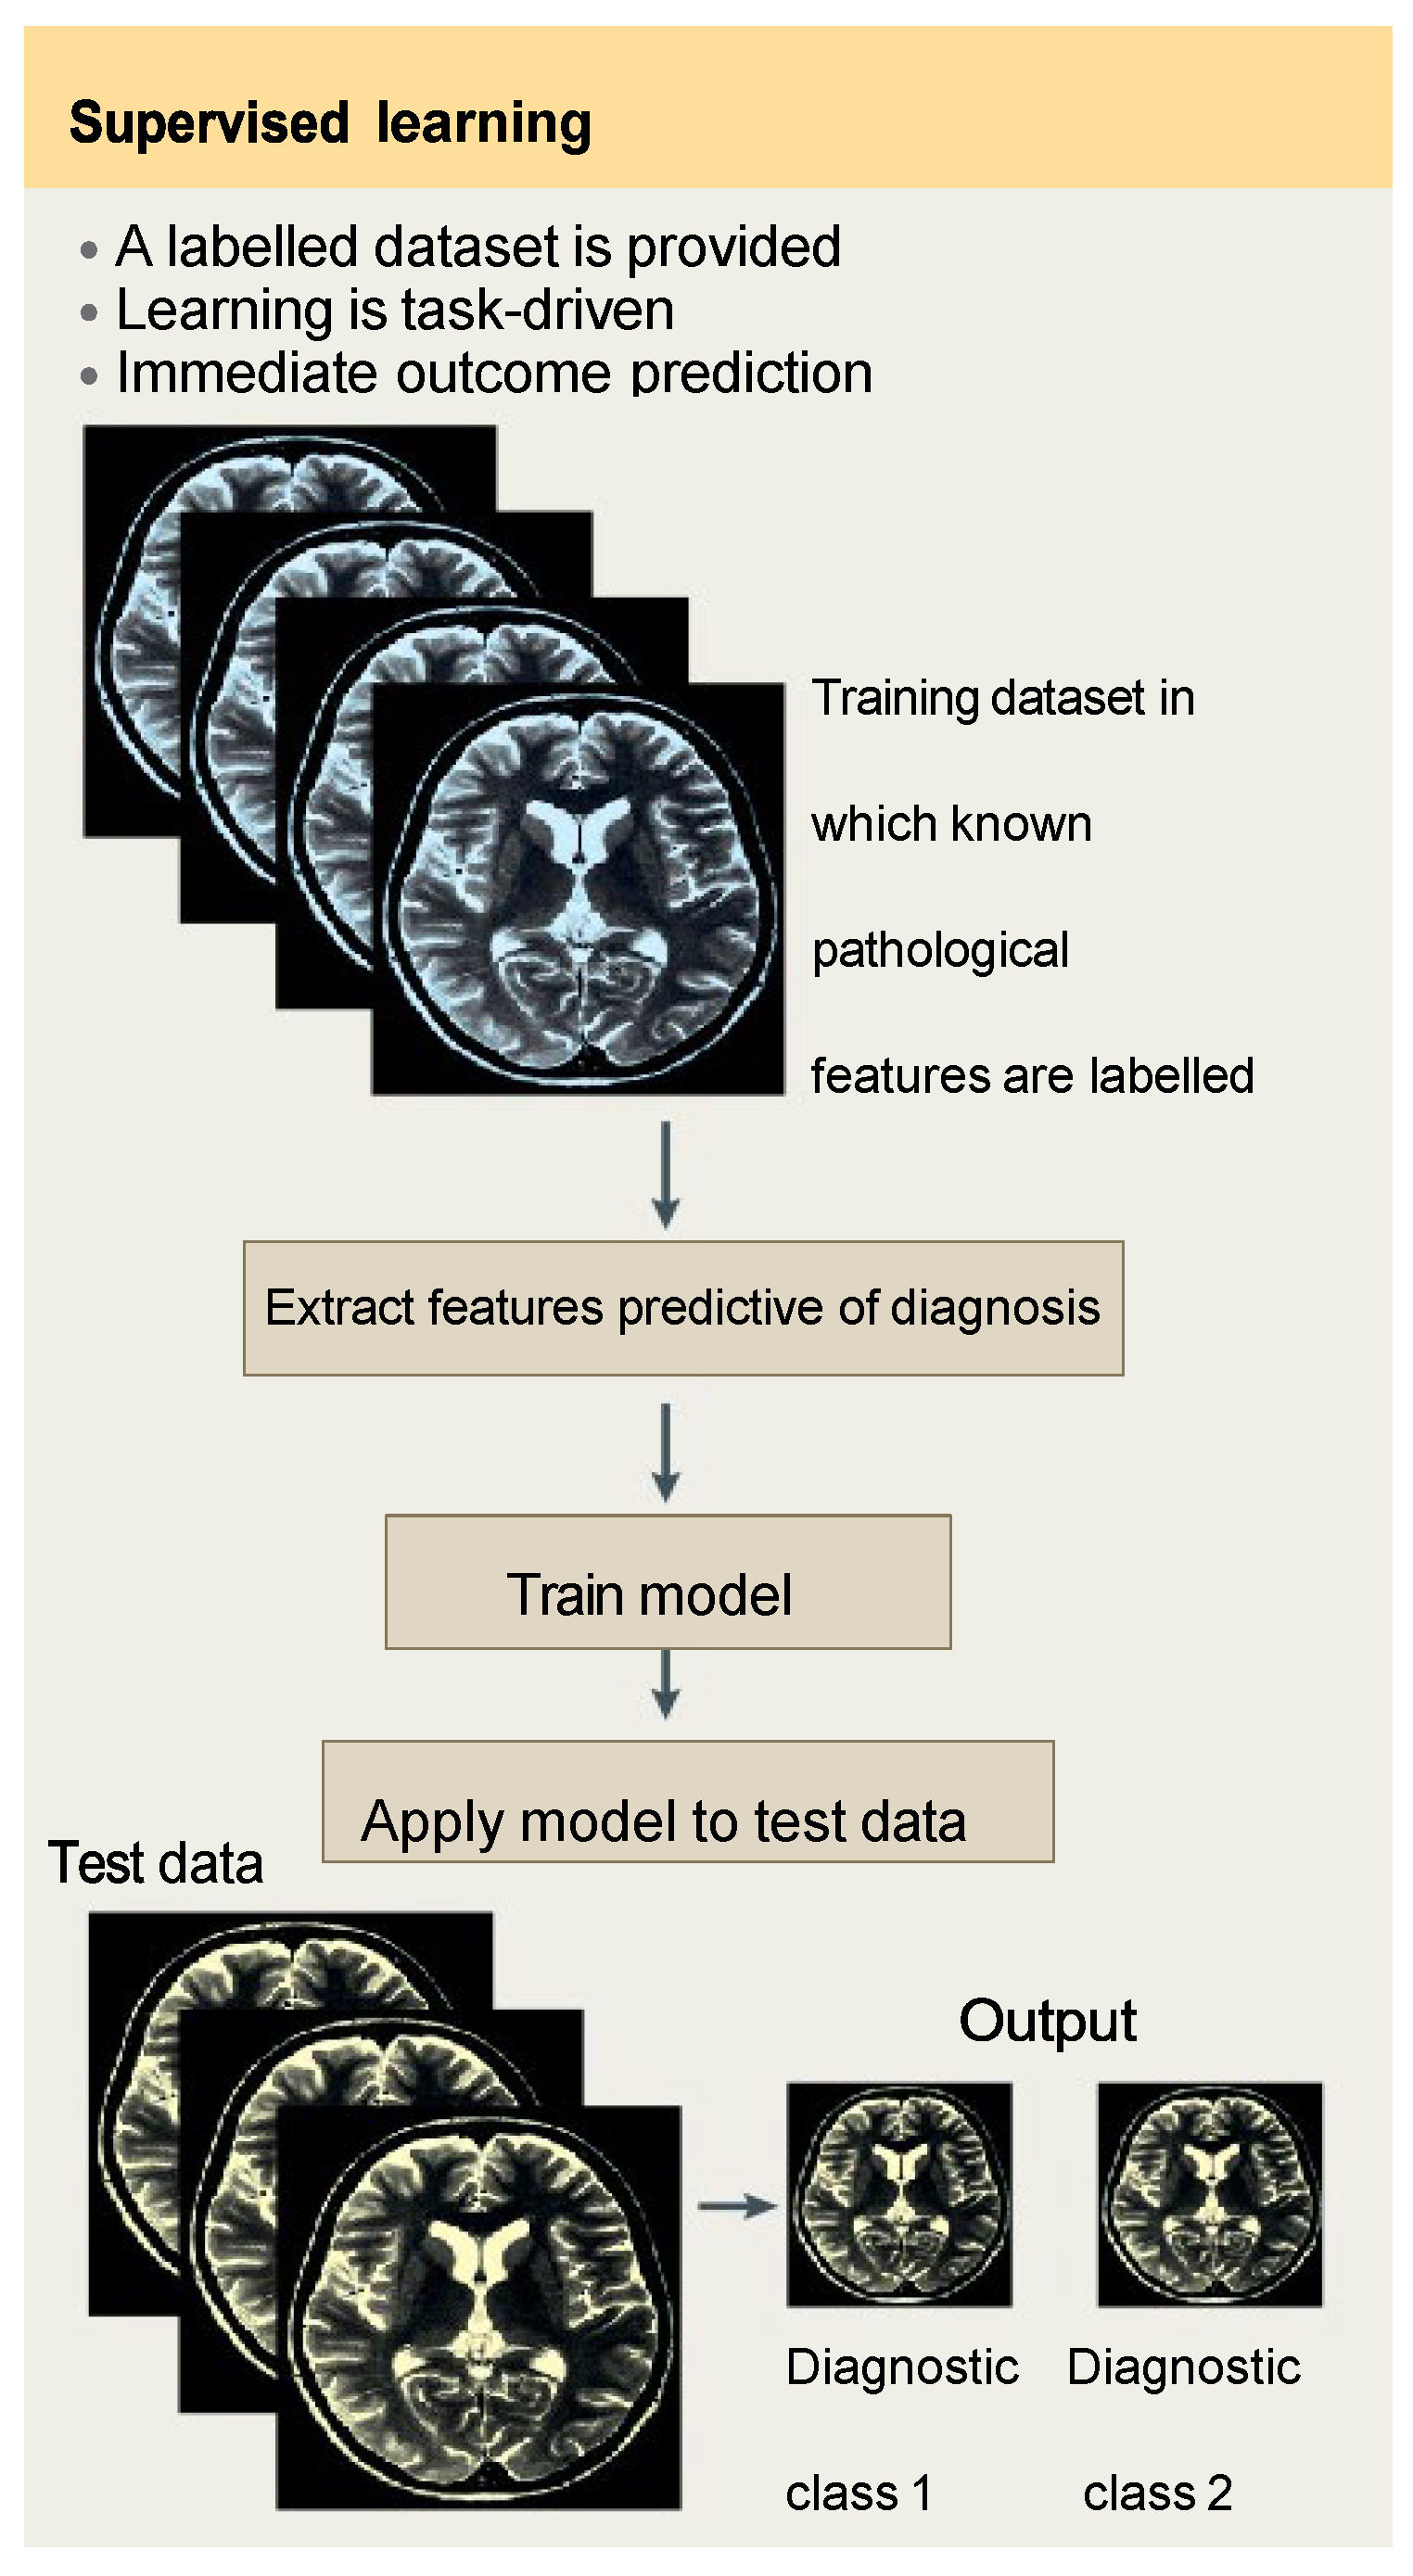
Figure 4.
To obtain 3D imaging data from input fMRI data and simulated with convolutional neural networks (CNN) and artificial neural networks (ANN) with an optimal distance between neurons in the neural network of the brain with damaged areas of the brain and finally In the images obtained, the type of disease is determined.
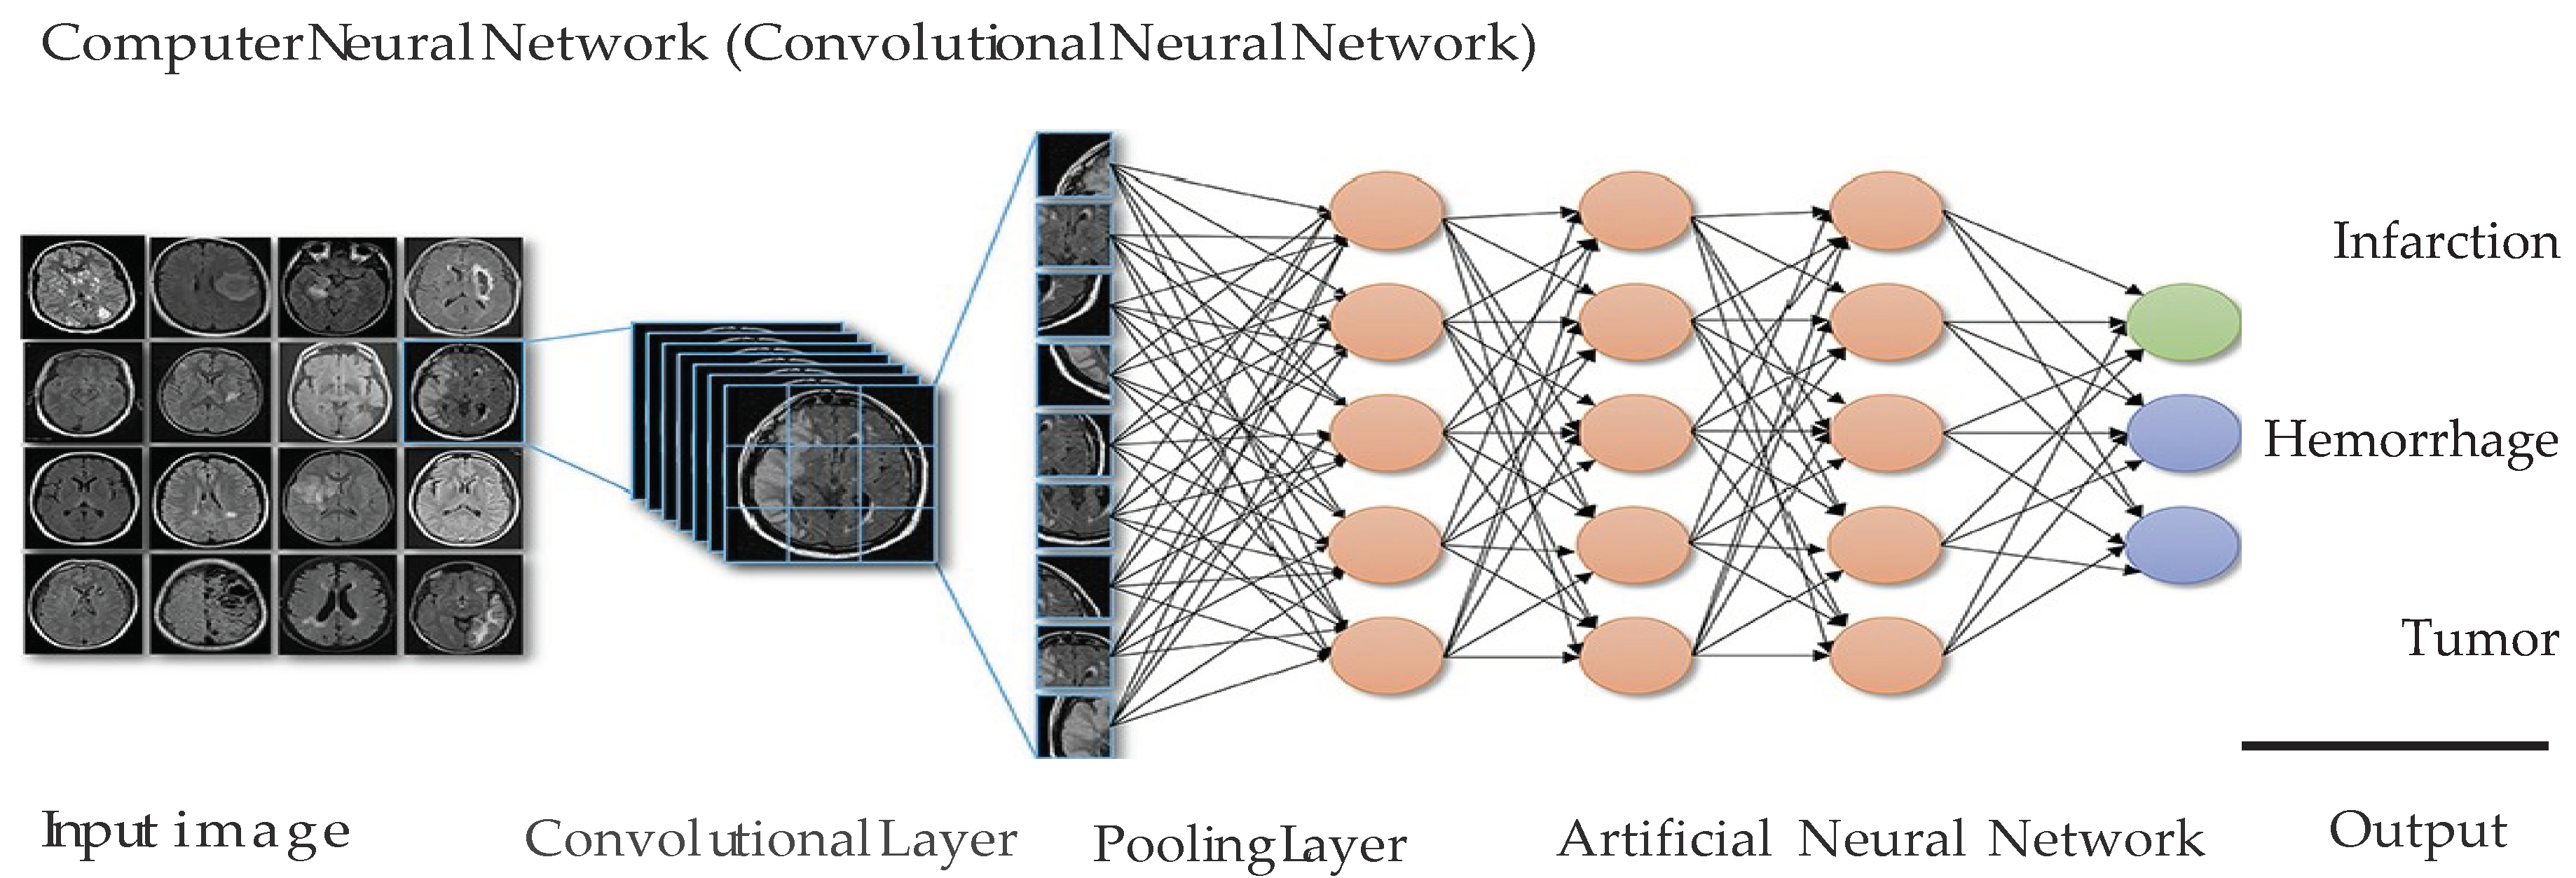
Figure 6.
Functional magnetic resonance imaging (fMRI) image processing (a) The processing steps applied to each area. (b) Spatial probability map of convolutional neural network for the performance of neural networks. (c) Connections based on ANN algorithm calculated using deep learning-based method. The model is analyzed using fMRI and MATLAB software.
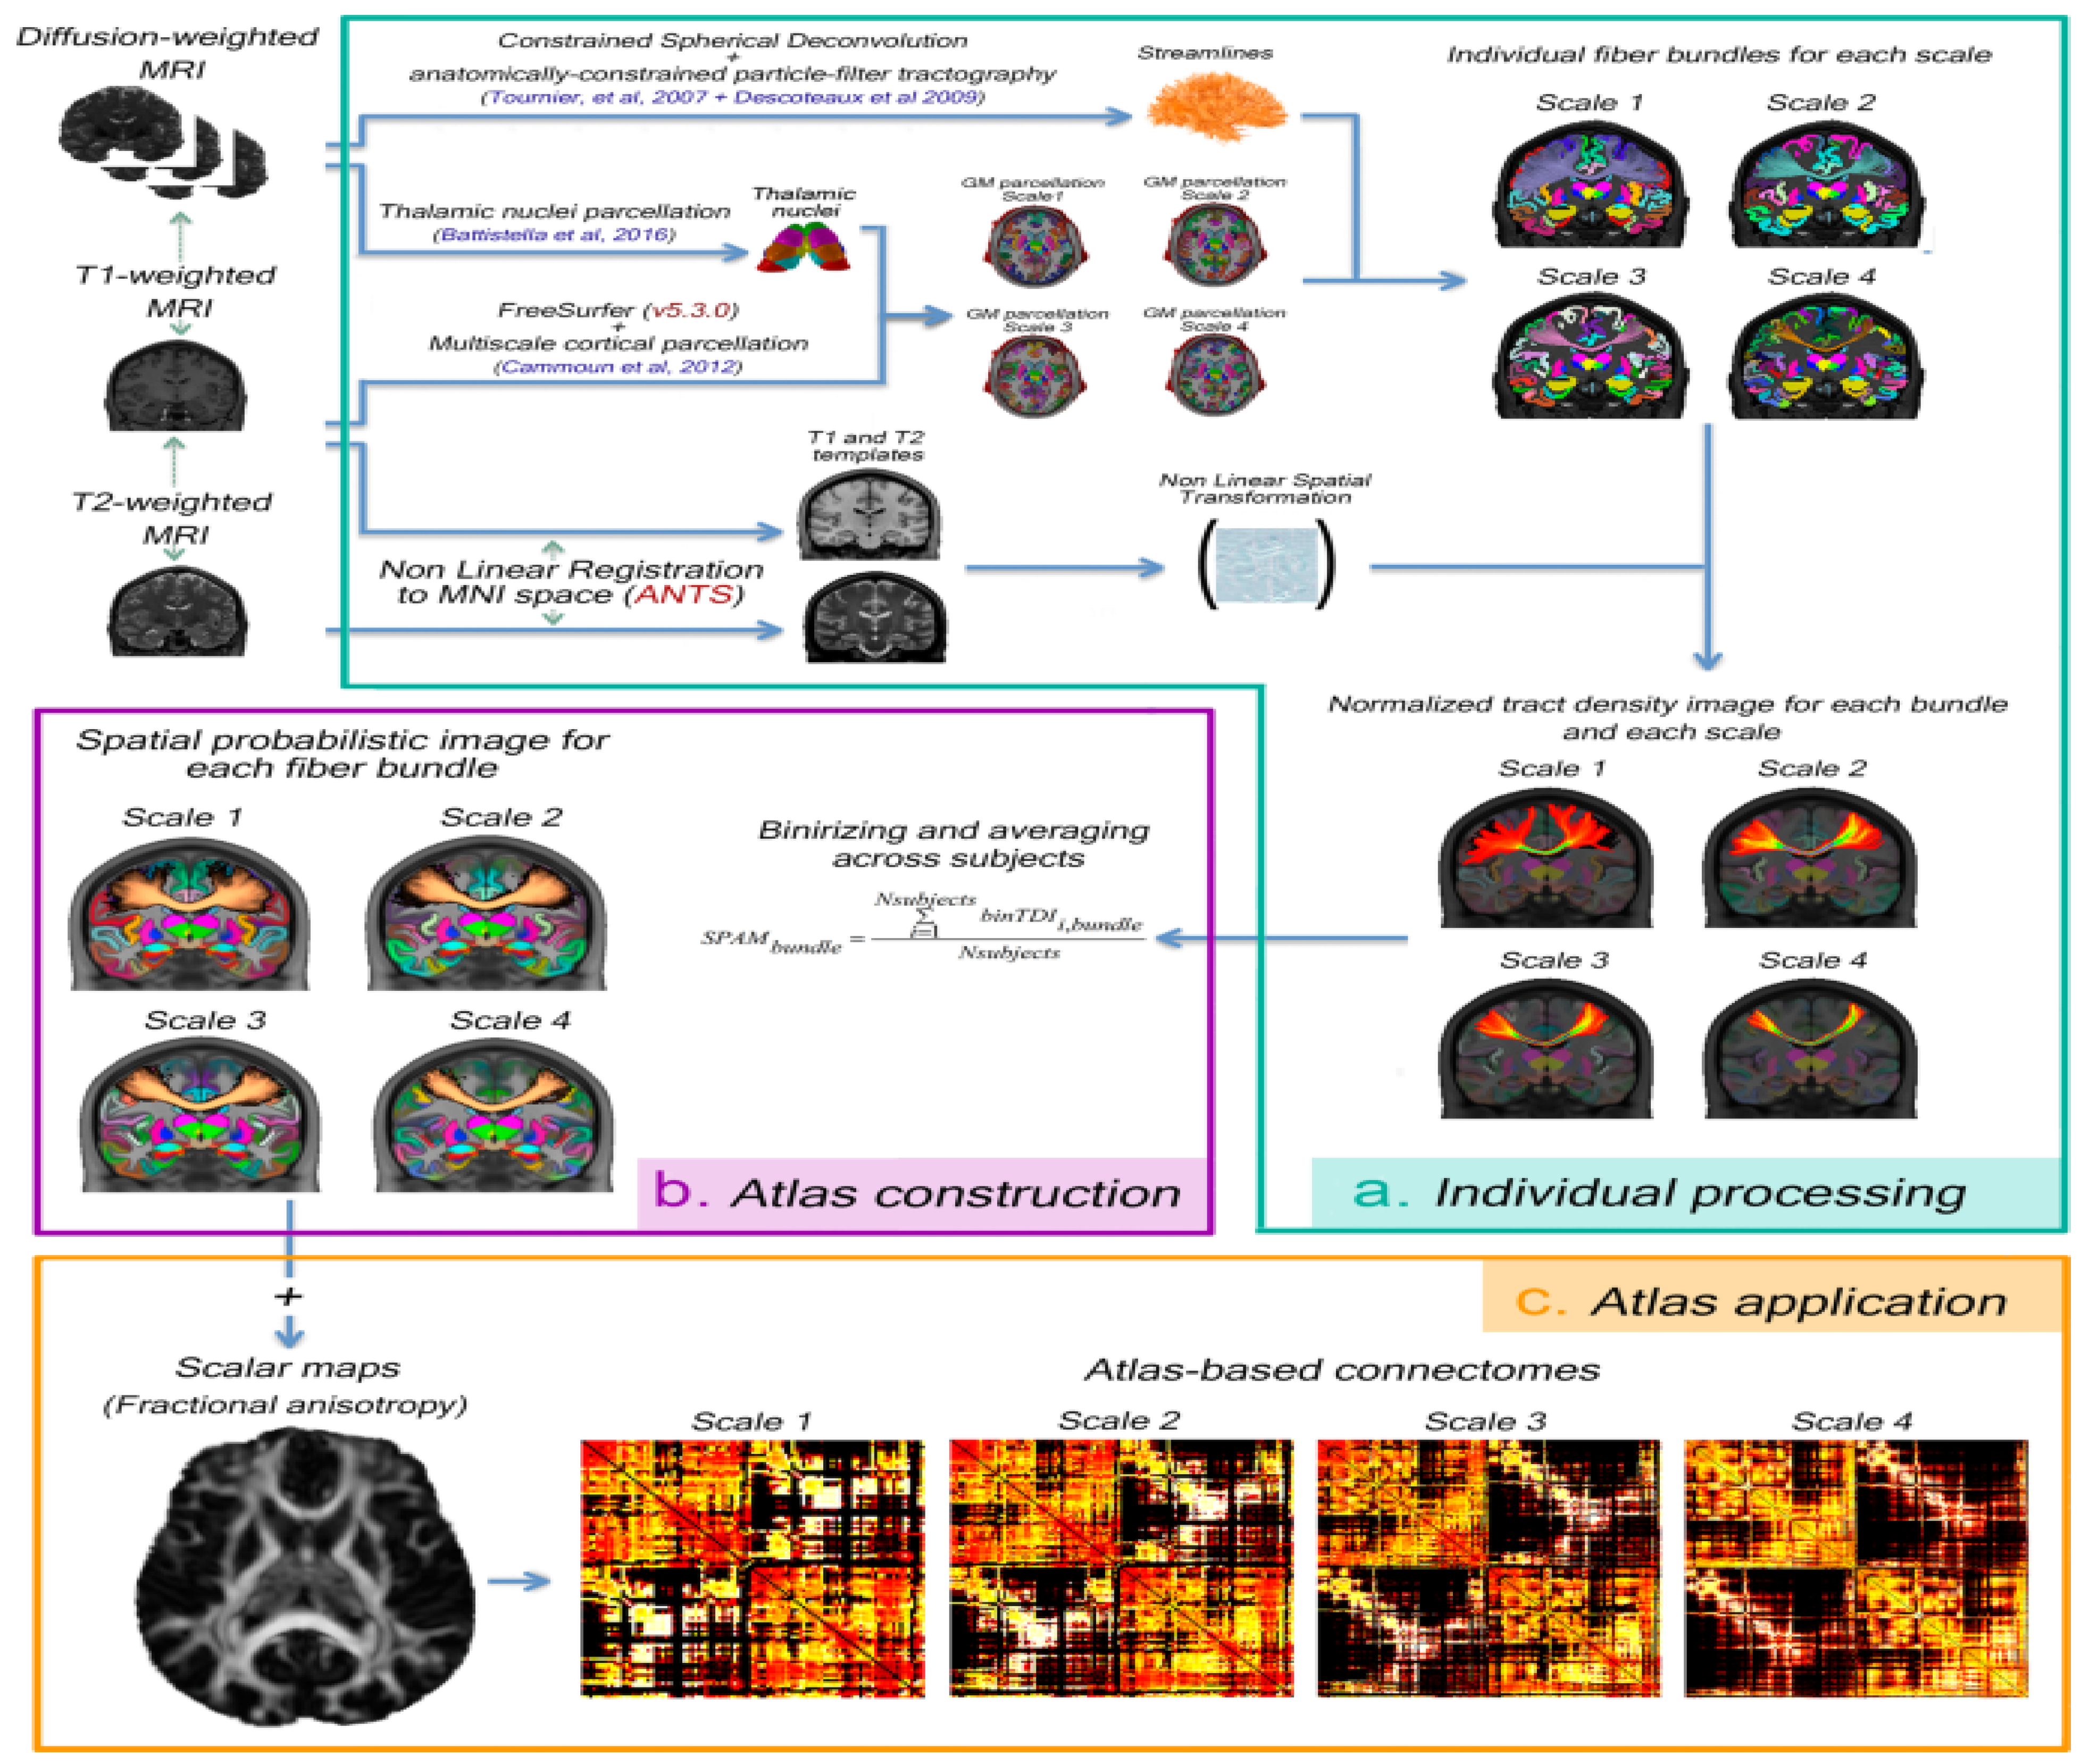
Figure 9.
In the left column Brain areas from which DTI features (FA, MD) show the affected areas of the brain surface with fMRI, simulated by the Python program, where the images are more accurate than the right column of the same 116 brain segmentation regions images used with fMRI-Rs (GT). We can still get better images if we use a more powerful computer with a higher resolution.
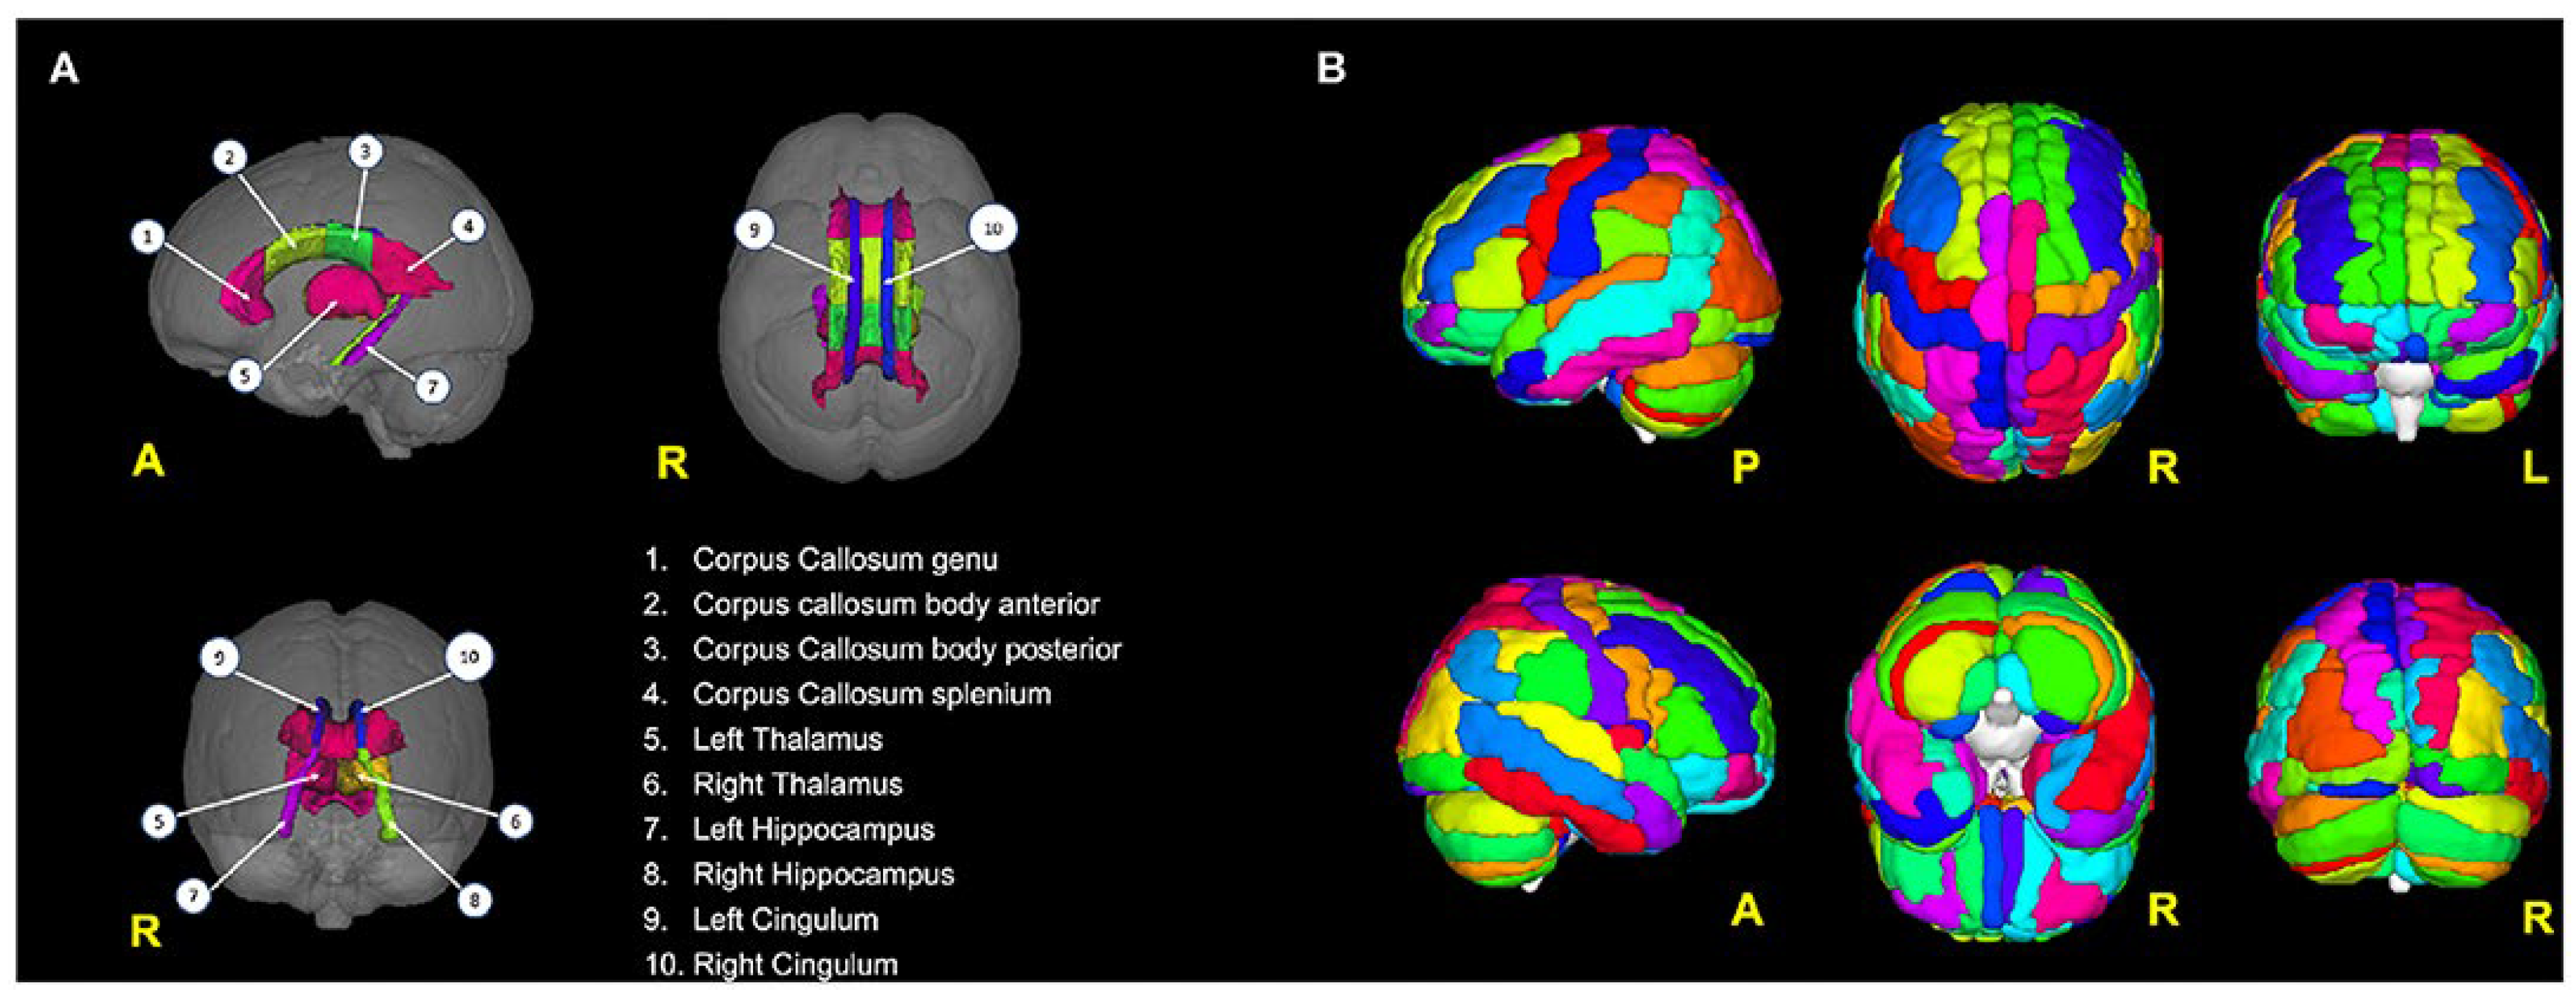
Figure 10.
Deep learning-based approaches intelligently process fMRI images using artificial intelligence and extract the input of the ML neural network from the software and begin to analyze it.
Figure 10.
Deep learning-based approaches intelligently process fMRI images using artificial intelligence and extract the input of the ML neural network from the software and begin to analyze it.
Disclaimer/Publisher’s Note: The statements, opinions and data contained in all publications are solely those of the individual author(s) and contributor(s) and not of MDPI and/or the editor(s). MDPI and/or the editor(s) disclaim responsibility for any injury to people or property resulting from any ideas, methods, instructions or products referred to in the content. |
© 2024 by the authors. Licensee MDPI, Basel, Switzerland. This article is an open access article distributed under the terms and conditions of the Creative Commons Attribution (CC BY) license (http://creativecommons.org/licenses/by/4.0/).
Copyright: This open access article is published under a Creative Commons CC BY 4.0 license, which permit the free download, distribution, and reuse, provided that the author and preprint are cited in any reuse.


